Embed Size (px)
Citation preview

Strengthening Innovation and Productivity in Brazil – What Policies for Innovation?
WORKSHOP ON PRODUCTIVITY AND INNOVATION IN BRAZIL1-2 July 2015, Brasilia
Dirk Pilat, Deputy DirectorDirectorate for Science, Technology and [email protected]

Outline
1. Innovation, productivity and growth2. Investing in innovation3. Innovation policies, including business-science
relationships4. Business dynamics, jobs and the role of
experimentation5. Skills, skills, skills6. Conclusions and policy implications

1. Innovation is one of the main drivers of growth and productivity …
Innovation key driver of growth, through:
1. Technology embodied in fixed capital, e.g. ICT
2. Investment in knowledge-based capital (later slides)
3. Productivity growth due to innovation (MFP)
4. Creative destruction and business dynamism (later slides)
Figure 1. Contributions to GDP growthTotal economy, annual percentage point
contribution, 1995-2013
Source: OECD Productivity Database, January 2015, and OECD (2015a), OECD Compendium of Productivity Indicators, 2015.
… but progress in Brazil has been limited over the past decades
Source: Conference Board Total Economy Database
Per cent gap in GDP per hour worked with the United States
Productivity growth in Brazil has disappointed, given the large scope for catch-up …

5
Learning from the global frontier is linked to several factors
Source: Saia, Andrews and Albrizio (2015) % difference in frontier spillover effect between maximum and minimum value of each structural variable, assuming 2% MFP growth at the frontier

Business investment in KBC and tangible assets in the United States (% GDP, 1972-2011)
6
2. A growing share of business investment is related to innovation …
4%
6%
8%
10%
12%
14%
16%
18%
1972 1975 1978 1981 1984 1987 1990 1993 1996 1999 2002 2005 2008 2011
Inv
est
me
nt
(% o
f a
dju
ste
d G
DP
)
Investment in KBC
Investment in tangibles
Source: Corrado et al. (2012).

7© General Motors, Chevy Volt
… which is increasingly central to value creation and product differentiation in global markets
SPORT SHOES: 100 EURO (final retail price)
A SUIT… MADE IN CHINA, SOLD IN UNITED STATES
Source: Fung Global Institute
Source: Trudo Dejonghe (Lessius)
Source: IMD (2000) Innovation and Renovation: The Nespresso Story, IMD046, 03/2003. © Nespresso

Sound framework policies are associated with investment in
innovation …

… but resources in some countries don’t flow to the most innovative firms …
Change in capital stock associated with a 10% change in patent stock (2003-2010)
Source: Andrews, Criscuolo, and Menon (2014).

… including in Brazil, where the most productive firms in manufacturing don’t have a very large
market share
Note: The graphs measure the extent to which firms with greater efficiency have a greater market share. If there were no systematic relationship between productivity and the size of firms, the covariance term would be zero; the higher it is, the larger the market share held by more productive firmsSource: OECD calculations based on Arnold, Nicoletti and Scarpetta (2008), Gomes and Ribeiro (2015).
Allocative efficiency in manufacturing, Brazil in international comparison and Brazil’s evolution over time

Opening up for competition could help - product market regulations in Brazil are still tight
Source: OECD (2015), Economic Policy Reforms: Going for Growth

Investment in innovation: key policy issues
• Business investment in innovation is not just technology and R&D – complementarities and policies affecting other assets are important, e.g. data, design, management, organisational capital, skills, …
• As these new areas of investment grow in importance, so do the policies affecting them – e.g. is Brazil’s IPR system fit for 21st century innovation?
• In an innovative economy, resources need to flow to more innovative and productive firms – framework conditions, such as competition, are key for this to happen.

3. The specific mix of policies to support business innovation matters, …
Direct funding of business R&D and R&D tax incentives, as a percentage of GDP, 2012
Source: OECD R&D Tax Incentive Indicators, www.oecd.org/sti/rd-tax-stats.htm
0.00
0.05
0.10
0.15
0.20
0.25
0.30
0.35
0.40
0.45
% Direct funding (grants, loans, procurement)… Indirect funding (R&D tax incentives) Indirect funding (no cost estimate) Total financial support, 2007…

… including how they are designed and who benefits
Source: OECD R&D Tax Incentives Indicators; based on the 2013 OECD-NESTI data collection on tax incentives support for R&D expenditures http://www.oecd.org/sti/rd-tax-stats.htm).
14
-0.1
0.0
0.1
0.2
0.3
0.4
0.5
0.6
0.7
Large, profitable firm SME, profitable firm Large, loss-making firm SME, loss-making firm1-B index
Implied tax subsidy on R&D, by firm size and profit scenario, 2013

Though policy needs to recognise that many innovative firms do not undertake
R&D
Source: OECD, Science, Technology and Industry Scoreboard 2013, http://dx.doi.org/10.1787/888932892480
15
Product Innovation, by R&D Status, 2008-10
0
10
20
30
40
50
60
70
80
90
100
% Non R&D-active product innovators R&D-active product innovatorsProduct innovators (as % of all R&D-active firms) Product innovators (as % of all non R&D-active firms)
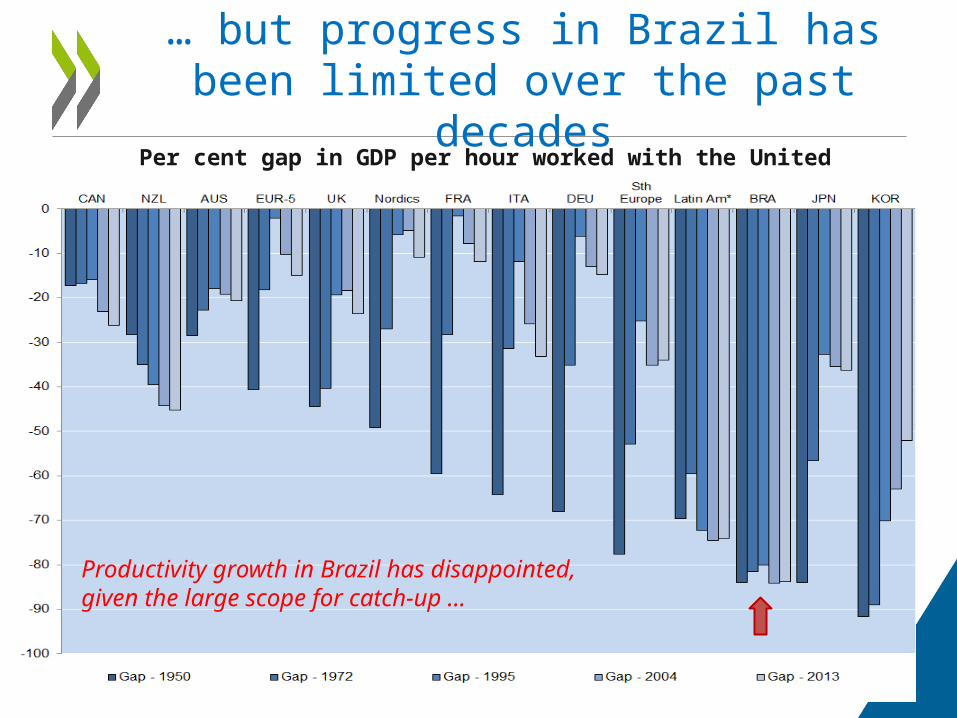
• Remove barriers before providing support - i.e. “don’t roll a ball up a hill”
• Clarity in objective(s) – such that success and failure can be assessed in a non-discretionary manner
• Evaluate (preferably ex ante and ex post) – and incorporate evaluation in policy cycle
• Learn from experimentation – learn and fail fast
• Ensure public bears risk which is “proportionate” (enough to matter, not too much to lead to moral hazard)
• Plan for exit – and make plan known in advance
• Competition - keep the outsiders and the unborn in mind – resist political economy pressures
Well-designed direct support for innovation can work, but some lessons have been
learned
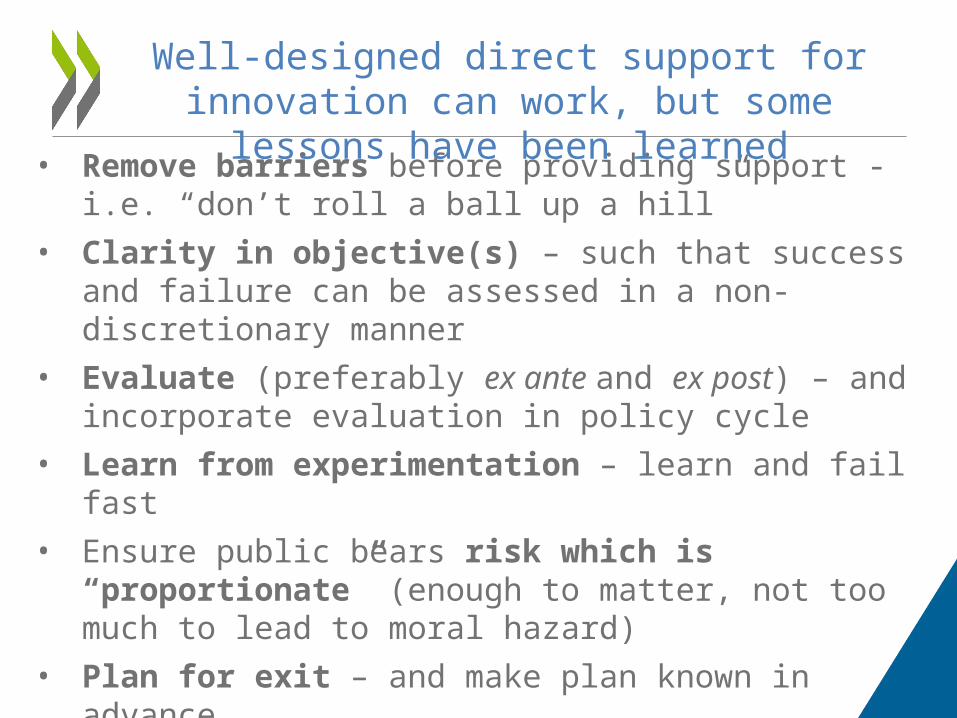
Innovation and research: key policy issues
• Many countries emphasize (R&D) tax incentives to support business innovation, but these have several drawbacks in strengthening innovation – better design can help reduce some of these drawbacks
• Well-designed and competitive direct support for innovation, e.g. Fraunhofer-type Institutes, accelerators, support for university-industry relationships, etc., may be better suited to building innovation capabilities, including for firms that do not undertake R&D.
• A good balance between direct and indirect support is needed.

18
4. Young firms can create new opportunities …
Contributions of young firms to employment, job creation and job destruction, 2001-2011
Source: Criscuolo, Gal and Menon (2014), www.oecd.org/sti/dynemp.htm

… but scaling of young innovative firms is a challenge in many countries , including
BrazilAverage size of start-ups and old firms, in persons employed, services sector
Source: Updated from Criscuolo, Gal and Menon (2014), www.oecd.org/sti/dynemp.htm
0
10
20
30
40
50
60
70
80
US
A
CR
I
GB
R
BE
L
CA
N
LU
X
FR
A
NO
R
DN
K
BR
A
AU
T
HU
N
PR
T
SW
E
NL
D
NZ
L
FIN
ES
P
TU
R
ITA
JP
N
Em
plo
ye
es
Startups (0-2) Old (>10)

Reducing barriers to scaling increases the impact of firms at the national frontier on
productivity
Source: Andrews, Criscuolo and Gal (2015), “Frontier firms, technology diffusion and public policy: micro evidence from OECD countries ” forthcoming OECD Working Paper.
How much higher would overall manufacturing sector labour productivity be if NF firms were as productive and large as GF firms?
NF firms in Italy have productivity levels close to the GF but they are relatively small

Entrepreneurship and business dynamism – key policy issues
• Enable experimentation and firm growth: Reduce barriers to entry (e.g. red tape), growth (e.g. size-specific regulations), and exit/failure of firms (e.g. penalising bankruptcy legislation, overly strict employment protection legislation).
• Keep the unborn in mind: Policies in many countries often favour incumbents and MNEs (e.g. R&D tax credits, some environmental regulations, incumbent subsidies that delay exit).
• Strengthen the innovation system for innovative firms, e.g. through enhanced access to (risk) capital, network development, mentoring of entrepreneurs, skills development, etc.
• Reduce trade barriers and integrate in GVCs, so firms can scale more easily across borders.
21

5. Raising human capital is key for innovation in Brazil
Percentage of population aged 25-34 and 45-54, 2012
Source: OECD (2015), Economic Policy Reforms: Going for Growth

Some conclusions
• Brazil would benefit from a comprehensive approach to policies for innovation, including:
– Improved policy frameworks for investment in innovation, notably policies that enable resource allocation to innovative firms – e.g. through stronger competition in product markets
– A balanced set of innovation policies, based on best practice
– Policies that enable entrepreneurship and strengthen business dynamism – allow new firms to fail or scale and unproductive firms to exit
– Greater integration in global networks and value chains, to draw greater benefits from the global productivity frontier
– A comprehensive strategy to increase education and skills
– A strong focus on evaluation – to learn from experience
– A more strategic approach to innovation – across the government – not just focused on innovation policies. 23

Thank you
24
Follow us 0n Twitter: @OECDinnovation
Website: www.oecd.org/sti
Newsletter: www.oecd.org/sti/news.htm
Contact: [email protected]
Read more about our work:

SPARES
25

The global productivity frontier is still going strong, but diffusion to other
firms is laggingSolid growth at the global productivity frontier but spillovers disappoint
Labour productivity; index 2001=0
Source: Andrews, Criscuolo and Gal (2015), “Frontier firms, technology diffusion and public policy: micro evidence from OECD countries ” forthcoming OECD Working Paper.
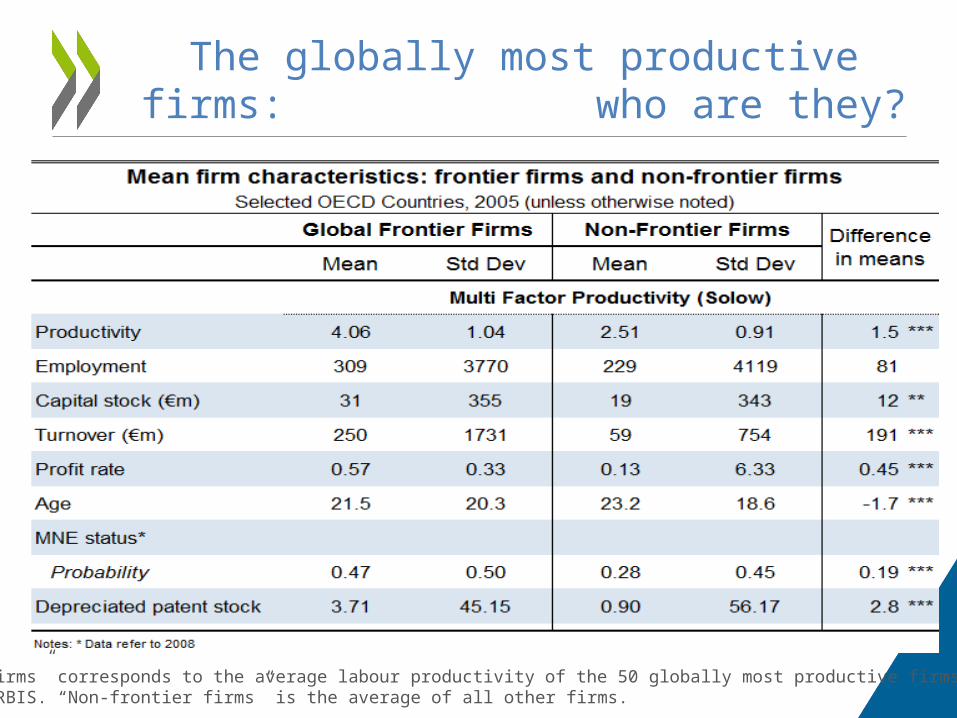
The globally most productive firms: who are they?
Note: “Frontier firms” corresponds to the average labour productivity of the 50 globally most productive firms in each 2 digit sector in ORBIS. “Non-frontier firms” is the average of all other firms.

Innovation involves not only invention, but also adoption and diffusion
Laggards
Global frontier
National Frontier
Penetration
Adoption
convergence
divergence
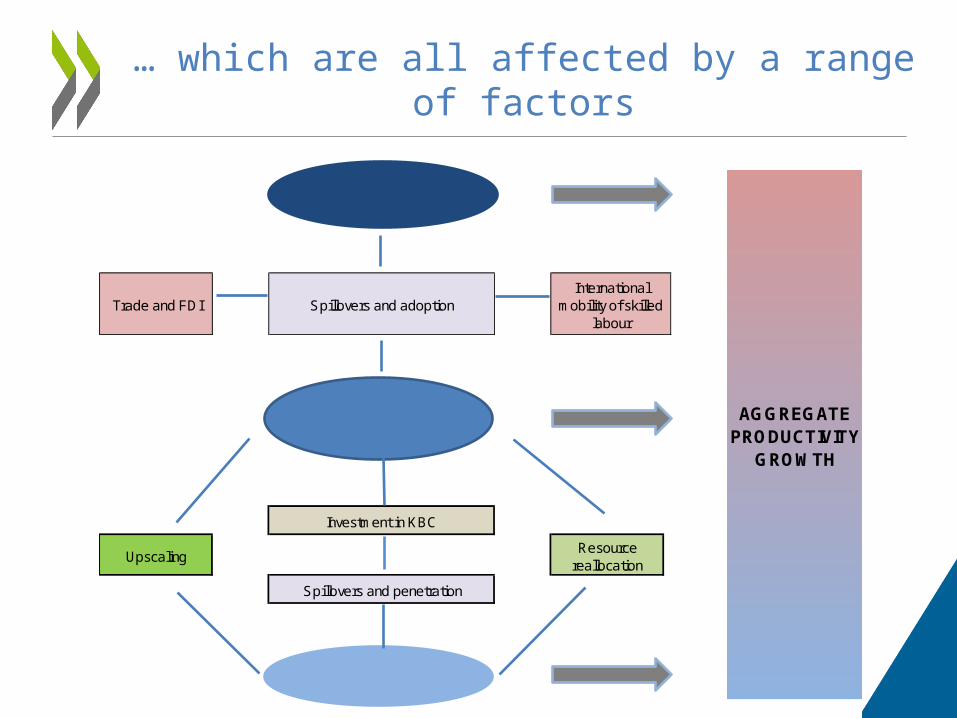
… which are all affected by a range of factors
Growth at the national frontier
Resource reallocation
Spillovers and penetration
Growth of laggards
Growth at the global frontier
AGGREGATE PRODUCTIVITY
GROWTH
Trade and FDI Spillovers and adoptionInternational
mobility of skilled labour
Investment in KBC
Upscaling

Business investment in KBC and tangible assets(as % of business sector value added, 2010)
Source: OECD calculations based on INTAN-Invest, Eurostat and multiple national sources. 30
2. A growing share of investment is related to innovation …
0
5
10
15
20
25
30
35
%Brand equity, firm-specific human capital, organisational capital R&D and other intellectual property products
Software and databases Non-residential physical assets

University – industry collaboration can facilitate catch-up of laggards to the national
frontierImpact of policy reforms on the MFP growth of laggard firms, 2005
Increasing Collaboration from low level in France to the OECD average % difference between industries with high and low knowledge intensity
Source: Andrews, Criscuolo and Gal (2015), “Frontier firms, technology diffusion and public policy: micro evidence from OECD countries ” forthcoming OECD Working Paper.
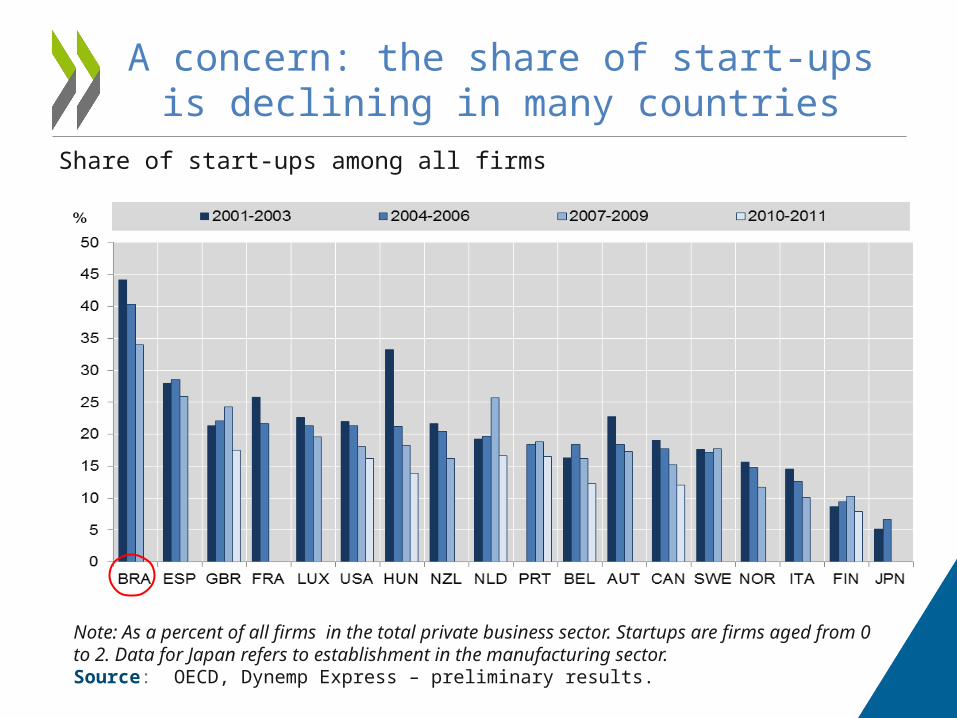
A concern: the share of start-ups is declining in many countries
Share of start-ups among all firms
Note: As a percent of all firms in the total private business sector. Startups are firms aged from 0 to 2. Data for Japan refers to establishment in the manufacturing sector.Source: OECD, Dynemp Express – preliminary results.

Business Dynamism and The Life Cycle of the Firm:
Brazil Relative to OthersPreliminary Results for Brazil:
High Avg Size at Entry but Low Start-Up Rate
Note: the graph illustrates the four components of the growth decomposition normalized over the maximum value across all countries included in the sample. Source: OECD DynEmp v.2 database. Data for some countries are still preliminary. Data for Brazil developed in co-operation with IPEA.
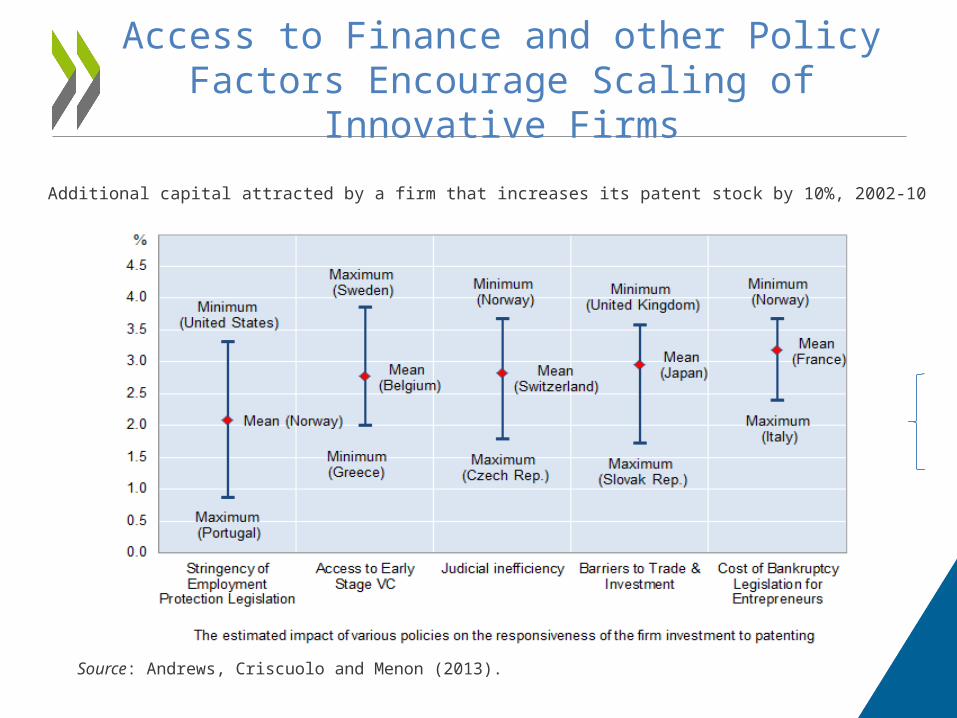
Access to Finance and other Policy Factors Encourage Scaling of Innovative Firms
Source: Andrews, Criscuolo and Menon (2013).
Additional capital attracted by a firm that increases its patent stock by 10%, 2002-10

Brazil is not heavily involved in global value chains
Foreign value added content of gross exports by countrypercent, 2008, 2009, and 2011 (right insert = time series
for Brazil)
Source: OECD-WTO TiVA database, July 2015
0%
5%
10%
15%
1995
2000
2005
2008
2009
2010
2011

Intra- and extra-regional foreign value added in GVCs – Average of TiVA reporters
OECD estimates based on Trade in Value Added Database 36
1995
2000
2005
2008
2009
1995
2000
2005
2008
2009
1995
2000
2005
2008
2009
1995
2000
2005
2008
2009
1995
2000
2005
2008
2009
Asia Europe North America Oceania South America
0%
2%
4%
6%
8%
10%
12%
14%
Intra-regional Extra-regional
5. South America is less integrated in global value chains
than other regions …

Source: OECD-WTO Trade in Value Added database, July 2015
Brazil's exports to and imports from main partner countriespercent of total gross and value added exports and imports, 2011
… and Brazil’s main trading partners are outside the region

Services value added embodied in manufacturing exports, by country
percent of total gross exports, 1995 and 2011
Services matter for trade, even in manufacturing …
Source: OECD-WTO Trade in Value Added database, July 2015

… although some barriers to services trade affect Brazil’s engagement
39
Services trade restrictiveness index (0- 1), Brazil
Source: OECD Services Trade Restrictiveness Index http://www.oecd.org/tad/services-trade/services-trade-restrictiveness-index.htm
0
0.1
0.2
0.3
0.4
0.5
0.6
0.7
0.8
0.9
1