Embed Size (px)
Citation preview
This publication was produced for review by the United States Agency for International Development (USAID). It was prepared by Chemonics International Inc. The views expressed in this publication do not necessarily reflect the views of USAID or the United States government.
STRENGTHENING EDUCATIONAL PERFORMANCE - UP (STEP-UP ZAMBIA)
PERFORMANCE MONITORING AND EVALUATION PLAN Contract No. AID-611-C-12-00001 December 5, 2012
STEP-UP ZAMBIA PROJECT: PMEP ii
CONTENTS Acronyms iii
Section I. Introduction 1
A. The STEP-Up Zambia Approach 1
B. Project Organizational Structure 4
C. STEP-Up’s Approach to Monitoring, Evaluation, Analysis, and Communication 6
D. Critical Assumptions 7
Section II. Performance Management Plan 8
A. Overview of Indicators, Baselines, and Targets 8
B. Data Sources and Data Collection Methods 9
C. Data Quality Control 9
D. Reporting 10 E. Staff Responsibilities 10
Annexes
Annex A. Consolidated List of Indicators and Targets 11
Annex B. Tracking Amendments to the PMEP 19
Annex C. Indicator Reference Sheets 20
STEP-UP ZAMBIA PROJECT: PMEP iii
ACRONYMS
DEBS District Education Board Secretary
DQA Data Quality Assessment
FY Fiscal Year
ICT Information and Communication Technology
M&E Monitoring and Evaluation
MESVTEE Ministry of Education, Science, and Vocational Training, and
Early Education
MMU MESVTEE Management UNIT
OVC Orphans and Vulnerable Children
PEO Provincial Education Office
PEPFAR U.S. President’s Emergency Plan for AIDS Relief
PMEP Performance Monitoring and Evaluation Plan
PPP Public-Private Partnership
RDQA Routine Data Quality Assessment
SIR Sub-intermediate Results
STEP-Up Zambia Strengthening Educational Performance – Up
T&C Testing and Counseling
STEP-UP ZAMBIA PROJECT: PMEP 1
SECTION I. INTRODUCTION
The Strengthening Educational Performance – Up (STEP-Up) Zambia project’s
performance monitoring and evaluation plan (PMEP) guides the project team and
project stakeholders in collecting high-quality data pertaining to performance of the
education system and using it to manage project activities, monitor progress, and
communicate verifiable, evidence-based results. The PMEP reflects quantitative and
qualitative data, and is designed to capture the dynamic process of education
management reform in Zambia with particular focus on relating project support to
improved reading achievement. STEP-Up carries out monitoring and evaluation
(M&E) in collaboration with project counterparts, a practice that will strengthen local
institutions’ ability to collect and use data to inform decision-making in support of
continued improvements in the Zambian education system.
Setting targets, monitoring progress, and evaluating results are vital management and
accountability functions that support appropriate decision-making, such as when there
is a need to adjust implementation approaches and timing to meet targets. The
indicators in the PMEP define the metrics by which progress — ultimately, project
success — is defined. However, monitoring is a dynamic process that will incorporate
additional metrics as activities reveal new development paradigms. Through
continuous and high-quality data collection, the PMEP framework will enable STEP-
Up’s staff and stakeholders to track the transformation of education management in
Zambia and the impact of project-supported reforms on the reading abilities of early
grade pupils.
A. The STEP-Up Zambia Approach
The Government of the Republic of
Zambia, through the Ministry of
Education, Science, Vocational Training,
and Early Education (MESVTEE), is
committed to strengthening oversight and
accountability that will ensure the
delivery of effective educational services.
To support this objective, STEP-Up
Zambia is providing senior managers at
MESVTEE with information and
supporting the development of tools for
oversight and management (such as
policies, guidelines, and strategies) to
stimulate practices that increase
accountability for results. The project
seeks to transform management norms
toward a focus on learning, strengthen evidence-based decision-making through
systematic collection of early grade reading assessment data, improve policies in
reading instruction, and enhance leadership and management at all levels of the
education system. Improved leadership and oversight resulting from these actions will
contribute to an increase of at least 15 percent in reading achievement on standardized
exams in five years.
STEP-Up Zambia’s Five Tasks
1. Integrate and strengthen systems for improved decision-making.
2. Promote equity as a central theme in policy development and education management reform.
3. Institutionalize MESVTEE’s management of HIV/AIDS workplace programs.
4. Strengthen decentralization for improved learner performance.
5. Engage Zambian institutions of higher education in MESVTEE policy research and analysis.
STEP-UP ZAMBIA PROJECT: PMEP 2
STEP-Up Zambia’s mission aligns with MESVTEE’s national goals and USAID’s
global education priorities. The project team is providing MESVTEE with responsive,
demand-driven support to inspire, catalyze, and decentralize better use of systems and
resources to research and implement policies that place learners and reading
achievement at the center of public discussions about education quality, and to guide
informed policy development and implementation that supports equitable access to
education. These objectives correspond with the first goal of USAID’s education
strategy: “Improved reading skills for 100 million children in primary grades by
2015,” and intermediate results 1.2 (“Reading delivery systems improved”) and 1.3
(“Greater engagement, accountability, and transparency by communities and the
public”). STEP-Up also has funding from the U.S. President’s Emergency Plan for
AIDS Relief (PEPFAR) to help MESVTEE strengthen its HIV/AIDS policy so that
teachers and families have increased access to services and are encouraged to make
healthy lifestyle choices. These holistic efforts have a direct impact on increasing
educational resources for teaching and learning and improving pupil performance.
The approaches, indicators, and targets in this PMEP reflect a nuanced understanding
of the challenges and opportunities in the Zambian education system, informed by
extensive ground-truthing by STEP-Up during its first year. During the ground-
truthing phase, MESVTEE staff accompanied project staff on field visits to districts in
every province, engaging education administrators, head teachers, classroom teachers,
and community members in discussions about learner performance, reading
achievement, and education management. These field visits had three results: helping
MESVTEE counterparts understand STEP-Up’s role and cementing the partnership
between the project team and its key counterparts; confirming the assumptions under
which the project had been conceived; and identifying models of successful education
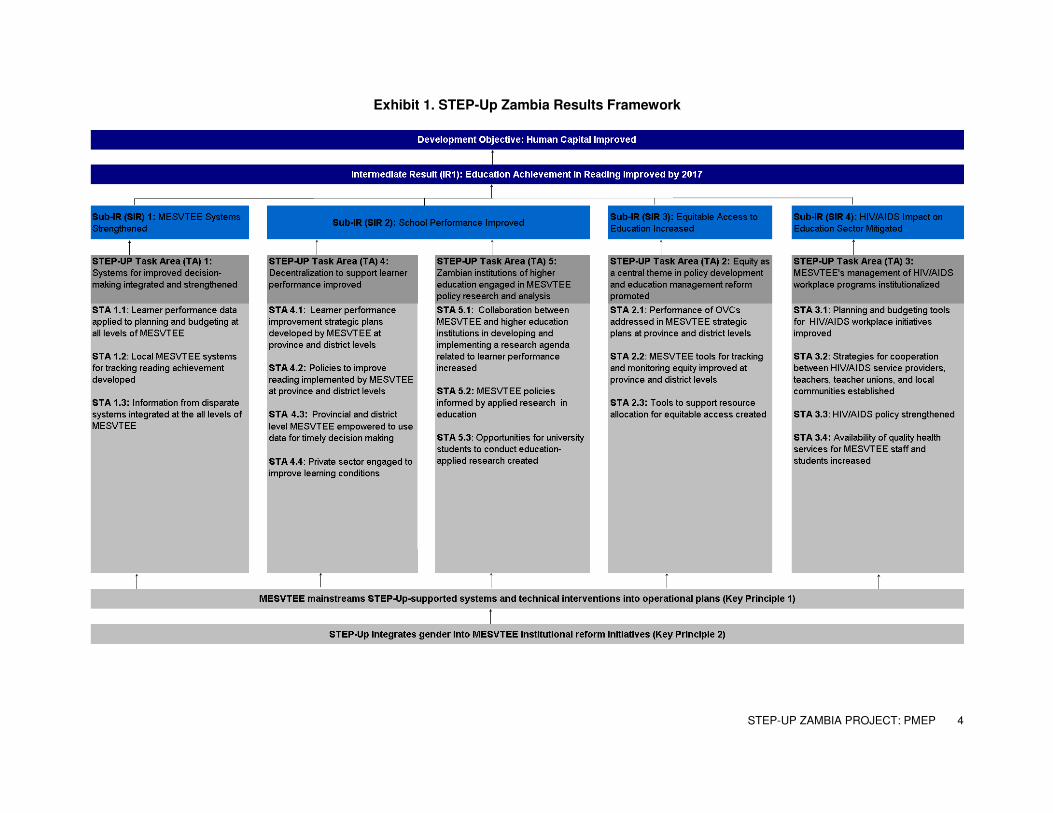
management and oversight that have led to improved learning outcomes. The results
of ground-truthing, coupled with the direct input of STEP-Up’s task area leaders, led
to the development of an updated project results framework (see Exhibit 1, on the
next page) and corresponding indicators and targets.
The initial field visits revealed that “lack of resources” (as expressed repeatedly by
head teachers) was not the cause of low reading levels in most classrooms. The
project team visited schools with plentiful resources that were not performing well,
and poor government and community schools in remote areas that were producing
impressive results in the reading levels of their pupils. The conclusion from the
ground-truthing experience was that a “whole system reform” approach should be
adopted to support and catalyze change in Zambia’s education system.
This approach is grounded in the belief that change cannot be instructed — it must
first be experienced. Changing knowledge, attitudes, and practices within MESVTEE
requires collaborative learning opportunities designed to model practical, results-
driven management norms. STEP-Up’s methodology entails the following change
areas: a more strategic strengthening and use of available financial, human resource,
and education information systems; development of management oversight tools such
as guidelines, policies, and long-term strategies that clarify expectations and set
targets regarding reading performance; enhancing the execution of decentralized
authority and leadership with a focus on improving reading achievement; strategic
communication from the ministry as a tool to institutionalize reforms and encourage
STEP-UP ZAMBIA PROJECT: PMEP 3
community participation in the delivery of education; and establishing partnerships
between the public and private sectors to increase the availability of local resources.
Taken together, these improvements will enhance reading performance at all levels by
creating an ethos in which data on reading achievement is systematically collected
and translated into policy and practice. STEP-Up’s work will create a sustainable
structure of ownership and better allocation of MESVTEE resources to equitably
improve reading achievement in primary grades. Exhibit 1 illustrates how STEP-Up
will achieve these results.
STEP-UP ZAMBIA PROJECT: PMEP 4
Exhibit 1. STEP-Up Zambia Results Framework
STEP-UP ZAMBIA PROJECT: PMEP 5
B. Project Organizational Structure
To achieve the outputs of the project, including integration of tasks, STEP-Up
Zambia’s organizational structure (Exhibit 2, next page) includes a chief of party who
oversees the work of a long-term technical team focused on systems, policy,
decentralization, HIV/AIDS, development communications, and public-private
partnerships. Supporting this team’s work are 10 advisors embedded in each
provincial education office, and a variety of short-term specialists. The chief of
party’s role includes ensuring that planned activities proceed in a coordinated and
effective manner. Project activities are organized under five technical areas, with task
leaders overseeing each one:
• Task 1: Strengthening systems for improved evidence-based decision-making.
This task enhances information systems to capture and link data, particularly on
reading achievement, to more effective decision-making and related policy issues.
• Task 2: Promoting equity in policy development and management reform. Under
this crosscutting task, which includes gender-related issues, STEP-Up Zambia
works with MESVTEE to promote systems, policies, and practices that mitigate
discrimination of disadvantaged students, impoverished and rural students,
orphans and vulnerable children, and other vulnerable groups.
• Task 3: Institutionalizing MESVTEE management of HIV/AIDS workplace
programs. STEP-Up Zambia is assisting MESVTEE to raise awareness and
improve health in the education community. Improved prevention, detection, and
treatment of HIV/AIDS-affected populations will decrease teacher absenteeism
and contribute to improved learner performance. (STEP-Up’s PMEP includes
PEPFAR indicators.)
• Task 4: Strengthening decentralization for improved learner performance. This
task addresses critical decentralization and local empowerment issues to generate
stronger “push-pull” dynamics from districts and provinces to the central ministry.
The emphasis is on increasing authority and decision-making at the provincial,
district, and school levels.
• Task 5: Engaging higher education institutions in MESVTEE education research.
Under this task, STEP-Up is elevating the level of collaboration between
MESVTEE and higher education institutions in undertaking applied research in
areas that will support improved policy and strategic planning for improved
learner performance.
Crosscutting Task Area: Communications, information and communication
technology (ICT), and public-private partnerships (PPPs). This multidisciplinary task
area is promoting the development and implementation of a MESVTEE
communications strategy to institutionalize reforms generated through the five
technical task areas and generate community participation in education delivery. This
task also involves the piloting and scale-up of innovative technologies to enhance
education management and forge closer links between the public and private sector to
increase the availability of local resources for education in Zambia.
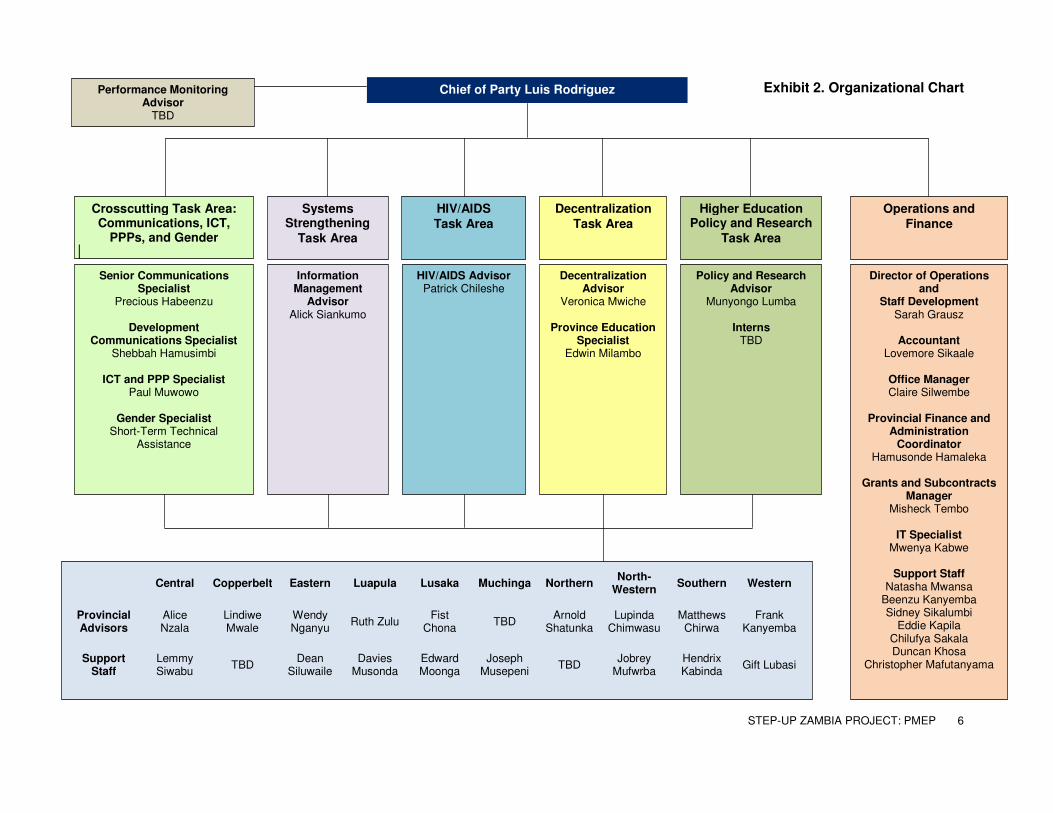
Exhibit 2. Organizational Chart
STEP-UP ZAMBIA PROJECT: PMEP 6
Chief of Party Luis Rodriguez
Operations and
Finance
Director of Operations and
Staff Development Sarah Grausz
Accountant
Lovemore Sikaale
Office Manager Claire Silwembe
Provincial Finance and
Administration Coordinator
Hamusonde Hamaleka
Grants and Subcontracts Manager
Misheck Tembo
IT Specialist Mwenya Kabwe
Support Staff
Natasha Mwansa Beenzu Kanyemba Sidney Sikalumbi
Eddie Kapila Chilufya Sakala Duncan Khosa
Christopher Mafutanyama
Senior Communications Specialist
Precious Habeenzu
Development Communications Specialist
Shebbah Hamusimbi
ICT and PPP Specialist Paul Muwowo
Gender Specialist
Short-Term Technical Assistance
HIV/AIDS Advisor Patrick Chileshe
Decentralization Advisor
Veronica Mwiche
Province Education Specialist
Edwin Milambo
Central Copperbelt Eastern Luapula Lusaka Muchinga Northern
North-Western
Southern Western
Provincial Advisors
Alice Nzala
Lindiwe Mwale
Wendy Nganyu
Ruth Zulu Fist
Chona TBD
Arnold Shatunka
Lupinda Chimwasu
Matthews Chirwa
Frank Kanyemba
Support Staff
Lemmy Siwabu
TBD Dean
Siluwaile Davies
Musonda Edward Moonga
Joseph Musepeni
TBD Jobrey
Mufwrba Hendrix Kabinda
Gift Lubasi
Crosscutting Task Area: Communications, ICT,
PPPs, and Gender
Systems Strengthening
Task Area
HIV/AIDS
Task Area
Decentralization
Task Area
Higher Education Policy and Research
Task Area
Information Management
Advisor Alick Siankumo
Policy and Research Advisor
Munyongo Lumba
Interns TBD
Performance Monitoring Advisor
TBD
STEP-UP ZAMBIA PROJECT: PMEP 7
C. Approach to Monitoring, Evaluation, Analysis, and Communication
M&E plays a critical role in understanding, demonstrating, and communicating
STEP-Up Zambia’s results and in guiding contract management. The STEP-Up team
understand the need for visible improvements in the education system. To ensure
successful outcomes, the STEP-Up team will use its M&E system as a management
tool to monitor the progress of project activities, capture the impact of project
interventions on the development of the Zambian education system, and serve as an
early-warning system to alert the team of activities that are not progressing as planned
or that are not having the intended result. STEP-Up’s analysis of M&E data will guide
project decision-making and resource allocation and document progress.
STEP-Up’s approach to implementing the PMEP is guided by the following
principles:
• Useful for decision-making and learning. The primary purpose of performance
monitoring is to measure progress against results and provide information to
decision-makers to guide ongoing project implementation. Throughout the project,
our PMEP will provide STEP-Up Zambia and MESVTEE staff with the data they
need to plan the next phase of project interventions.
• Results-oriented. The results framework (see page 3) depicts STEP-Up’s theory of
change and is the foundation for the PMEP. Each project output and input links to
a specific result area in the results framework.
• Collaborative. The most important measures in the PMEP — those related to
learner performance — are designed to integrate with MESVTEE systems as part
of the STEP-Up Zambia project design. Part of the project’s core approach is to
work collaboratively with MESVTEE staff to develop instruments and tools to
measure those indicators and strategies to address whatever data analysis reveals.
• Efficient and effective. STEP-Up has streamlined its systems of measurement so
that the team is collecting and reporting on the information that is most useful for
performance management and meets USAID’s reporting needs. Through the
posting of provincial advisors, who will collect timely district-level and provincial
data, STEP-Up is minimizing the management burden and cost M&E, while
meeting information needs.
Communication plays a vital role in performance management. In communicating
STEP-Up Zambia’s results, the project team will share information in a transparent
manner that will advance learning and accurately demonstrate the project’s results.
Communications will make it clear that project results have been jointly achieved by
USAID and MESVTEE. When communicating about achievements, the STEP-Up
team will be careful to communicate any limitations in data quality and attribute
results honestly.
STEP-UP ZAMBIA PROJECT: PMEP 8
D. Critical Assumptions
In developing the PMEP, STEP-Up focused on indicators that would allow tracking
and measurement of results attributable to the project. The project’s ability to
demonstrate improvement in these measures relies on the following assumptions:
• Partnerships will remain strong. To achieve project objectives, STEP-Up assumes
that the partnership with MESVTEE will remain in place and continue to deepen,
even if individual leaders change, and that each partner will contribute the
necessary technical resources.
• MESVTEE is ready and has the capacity to expand the decentralization process to
all levels. Without this level of readiness, project objectives could be delayed or
compromised.
• MESVTEE is willing to lead and sustain organizational learning. Embedding the
concept of change at the ministry’s central and provincial levels will be essential
to ensuring the necessary changes and social dynamics required to improve
learner performance in reading. The concept is to help the system focus its
operations on service to its final beneficiaries — the learners.
• MESVTEE is successful in strengthening its financial systems. Gaps and
shortcomings in financial management have been a handicap for the ministry, and
have affected donors’ contributions to the education sector. Strengthening the
financial system will provide the required guarantees and safeguards to secure
future contributions from donors.
Annex A, “Consolidated List of Indicators and Targets,” provides a more detailed
listing of specific assumptions.
STEP-UP ZAMBIA PROJECT: PMEP 9
SECTION II. PERFORMANCE MANAGEMENT PLAN
A. Overview of Indicators, Baselines, and Targets
The STEP-Up Zambia project is supporting MESVTEE to strengthen its management
systems and improve education oversight norms, with a view to improving reading
achievement by as much as 15 percent over the life of the project. To track progress
toward this overall goal, the project team has identified life-of-project indicators for
impact, outcomes, and outputs in the results framework; these indicators are included
in Annex A. The indicators are designed to track implementation of activities against
targets, capture project outcomes for learning and communication, and contribute to
USAID’s performance management and reporting needs. STEP-Up’s performance
management plan also includes selected indicators that measure project-level results.
To enable comprehensive review of progress, troubleshooting, and management, the
M&E system will track two main types of performance indicators:
• Quantitative measures, represented principally by USAID’s standard education
and PEPFAR indicators, will track output results and provide feedback to
managers on project performance so they can identify areas where implementation
strategies may need to be adjusted. The quantitative data will also allow for trend
analyses over time.
• To complement the quantitative results, STEP-Up will systematically collect and
analyze qualitative data on educators’ knowledge, attitudes, and practices to
ascertain the evolving “status quo” within the education system. Qualitative data
collection and analysis will include the project baseline assessment,
documentation of field visits and meetings with ministry staff, the project’s
midterm review, and research carried out by higher education institutions under
Task 5. Qualitative measures will demonstrate the value of implementing project
activities by documenting compelling personal stories of education managers and
their attitudes toward new management approaches, pedagogical methods,
curriculum content, and performance assessment. These measures will also reveal
the depth of decentralization practices in the ministry, such as information
sharing, policy development and implementation, and resource allocation.
Disaggregation. Where appropriate, indicator data is disaggregated by sex, OVC
status, disadvantaged schools, location, level of administration, and other appropriate
criteria. Doing so allows us to analyze project results within these various criteria.
Baselines and targets. STEP-Up Zambia’s Year 1, December 2011 to December
2012, is the baseline year, and targets for many indicators are valued at 0. During the
project’s first 18 months, the M&E team is working with other project staff and
partners to set baselines, where needed, and develop or adapt existing data collection
tools. STEP-Up will submit a separate baseline proposal for USAID approval prior to
its implementation.
STEP-UP ZAMBIA PROJECT: PMEP 10
B. Data Sources and Data Collection Methods
STEP-Up collects data quarterly, semiannually, annually, or at the end of the project,
depending on the indicator. We will obtain indicator data from a variety of sources,
including host-country counterparts, internal project records, and public records. The
detailed table in Annex A provides specific data sources and frequency of collection
and reporting for each indicator. Generally, data sources are grouped in the following
categories:
• Primary data collected through assessment tools, surveys, and interviews. STEP-
Up will track learning outcomes in reading, using credible sources to measure
improvements (for example, the MESVTEE national assessment, the reading
assessments conducted by USAID’s Read to Succeed and Time to Learn projects,
mock exam scores provided by provincial and district officials, and the education
management information system).
• Primary data from project records. A number of proposed indicators directly
measure project activities, so data for these can be obtained from STEP-Up’s staff
and subcontractors.
• Secondary data from project partners. Collecting data for the remaining indicators
will require collaboration with partners, particularly the MESVTEE’s reports.
STEP-Up’s provincial advisors will facilitate this process; they will avoid placing
undue burden on ministry staff beyond reasonable expectations of data collection.
C. Data Quality Control
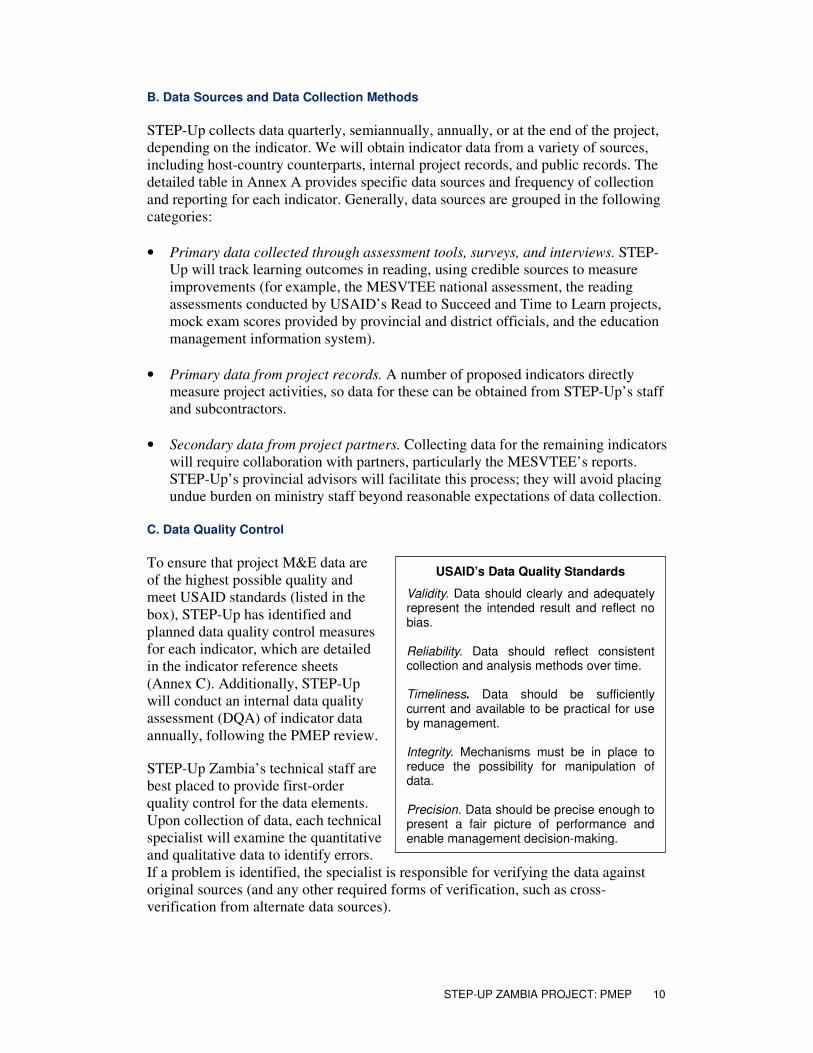
To ensure that project M&E data are
of the highest possible quality and
meet USAID standards (listed in the
box), STEP-Up has identified and
planned data quality control measures
for each indicator, which are detailed
in the indicator reference sheets
(Annex C). Additionally, STEP-Up
will conduct an internal data quality
assessment (DQA) of indicator data
annually, following the PMEP review.
STEP-Up Zambia’s technical staff are
best placed to provide first-order
quality control for the data elements.
Upon collection of data, each technical
specialist will examine the quantitative
and qualitative data to identify errors.
If a problem is identified, the specialist is responsible for verifying the data against
original sources (and any other required forms of verification, such as cross-
verification from alternate data sources).
USAID’s Data Quality Standards
Validity. Data should clearly and adequately represent the intended result and reflect no bias. Reliability. Data should reflect consistent collection and analysis methods over time. Timeliness. Data should be sufficiently current and available to be practical for use by management. Integrity. Mechanisms must be in place to reduce the possibility for manipulation of data. Precision. Data should be precise enough to present a fair picture of performance and enable management decision-making.
STEP-UP ZAMBIA PROJECT: PMEP 11
The project M&E team is responsible for secondary data quality control (after data
entry). This team will tabulate data to identify potential errors and design a spot-check
system to verify data at the source (e.g., through visits to the MESVTEE or other
partners). When errors are identified early, the M&E specialists can make corrections
by consulting the data source.
The M&E team will map data collection and decision-making processes to identify
roadblocks and areas for streamlining. During project Year 1, the information
management advisor and development communications specialist led a mapping
exercise with MESVTEE colleagues to review information flows. The aim of this
exercise was to reveal gaps between policy and practice, overlapping roles and
authorities, and other information related to decision-making. Focus groups with the
district education board secretaries, district and province resource center coordinators,
head teachers, classroom teachers, and local media outlets provided an important
perspective on local realities for proposed solutions.
To prepare for USAID’s periodic DQAs on operational plan indicator data, STEP-Up
will conduct an internal data quality review each year, following the PMEP review,
using a form adapted from USAID’s DQA form.
D. Reporting
STEP-Up Zambia includes M&E data in quarterly and annual progress reports and in
PEPFAR reports. In these reports, the project team presents indicator data for the
reporting period and aggregate data by fiscal year. Along with quantitative data,
STEP-Up reports will include narrative descriptions and present qualitative data and
success stories collected through interviews and focus groups, and images (including
video and photography, as appropriate) that USAID can share with stakeholders. The
final report will contain life-of-project indicator values, along with conclusions drawn
from evaluation activities, such as an analysis of targets compared to achievements,
an analysis of any shortfalls, a discussion of best practices, lessons learned, and
presentation of success stories.
E. Staff Responsibilities
M&E team members are responsible for regularly analyzing and reporting on data in a
timely, consistent, and complete manner to allow for appropriate monitoring,
reporting, and delivery of performance information to project decision-makers. At the
end of each fiscal year, the M&E team will review the appropriateness of the PMEP
and make necessary additions or adjustments. Short-term M&E specialists will
provide quality assurance of data and as-needed capacity building for the M&E team.
Each STEP-Up Zambia task leader manages the process of primary data collection for
his or her task area. After the M&E team performs data analysis and quality control,
the technical staff and the chief of party use the information to make management
decisions on implementation and communicate progress to stakeholders. The chief of
party supervises the overall M&E system, guides the long-term M&E team in
deciding which indicator data are critical for management and communication, and
uses M&E information for strategic decision-making to address project needs.
STEP-UP ZAMBIA PROJECT: PMEP 12
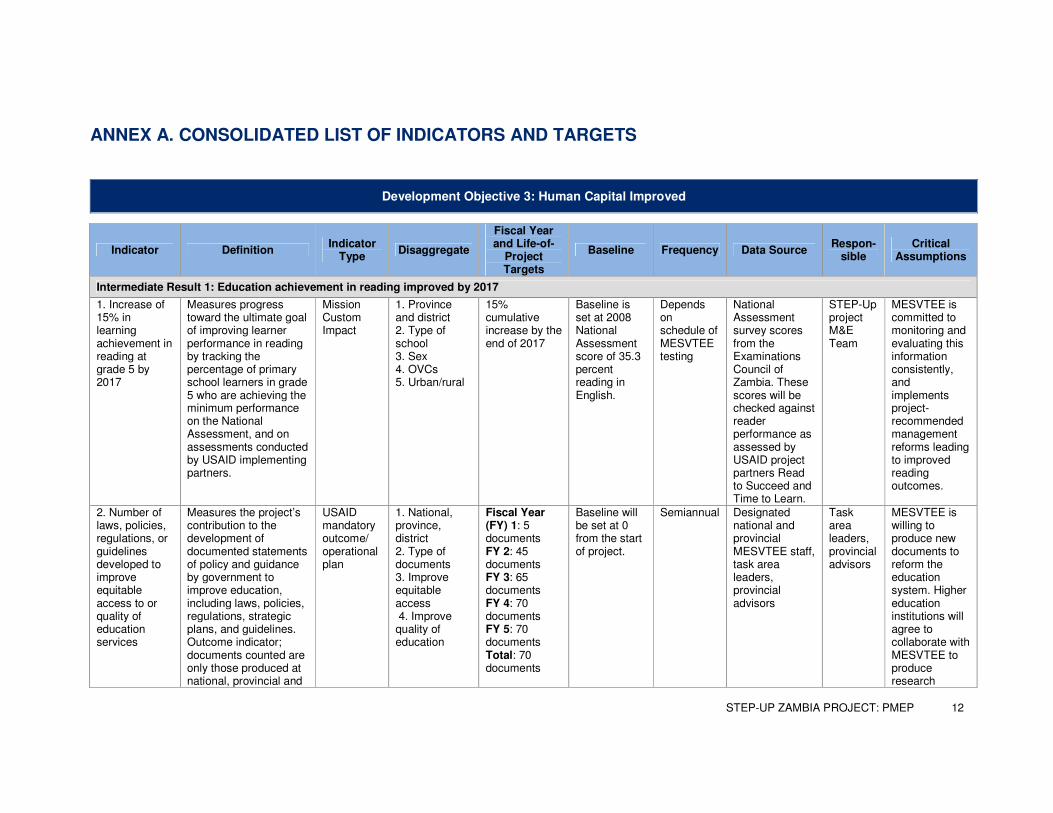
ANNEX A. CONSOLIDATED LIST OF INDICATORS AND TARGETS
Development Objective 3: Human Capital Improved
Indicator Definition Indicator
Type Disaggregate
Fiscal Year and Life-of-
Project Targets
Baseline Frequency Data Source Respon-
sible Critical
Assumptions
Intermediate Result 1: Education achievement in reading improved by 2017
1. Increase of 15% in learning achievement in reading at grade 5 by 2017
Measures progress toward the ultimate goal of improving learner performance in reading by tracking the percentage of primary school learners in grade 5 who are achieving the minimum performance on the National Assessment, and on assessments conducted by USAID implementing partners.
Mission Custom Impact
1. Province and district 2. Type of school 3. Sex 4. OVCs 5. Urban/rural
15% cumulative increase by the end of 2017
Baseline is set at 2008 National Assessment score of 35.3 percent reading in English.
Depends on schedule of MESVTEE testing
National Assessment survey scores from the Examinations Council of Zambia. These scores will be checked against reader performance as assessed by USAID project partners Read to Succeed and Time to Learn.
STEP-Up project M&E Team
MESVTEE is committed to monitoring and evaluating this information consistently, and implements project-recommended management reforms leading to improved reading outcomes.
2. Number of laws, policies, regulations, or guidelines developed to improve equitable access to or quality of education services
Measures the project’s contribution to the development of documented statements of policy and guidance by government to improve education, including laws, policies, regulations, strategic plans, and guidelines. Outcome indicator; documents counted are only those produced at national, provincial and
USAID mandatory outcome/ operational plan
1. National, province, district 2. Type of documents 3. Improve equitable access 4. Improve quality of education
Fiscal Year (FY) 1: 5 documents FY 2: 45 documents FY 3: 65 documents FY 4: 70 documents FY 5: 70 documents Total: 70 documents
Baseline will be set at 0 from the start of project.
Semiannual Designated national and provincial MESVTEE staff, task area leaders, provincial advisors
Task area leaders, provincial advisors
MESVTEE is willing to produce new documents to reform the education system. Higher education institutions will agree to collaborate with MESVTEE to produce research
STEP-UP ZAMBIA PROJECT: PMEP 13
Indicator Definition Indicator
Type Disaggregate
Fiscal Year and Life-of-
Project Targets
Baseline Frequency Data Source Respon-
sible Critical
Assumptions
district levels. Documents may be new or modified to improve equitable access to education services, or to improve the quality of such services.
informing new policies.
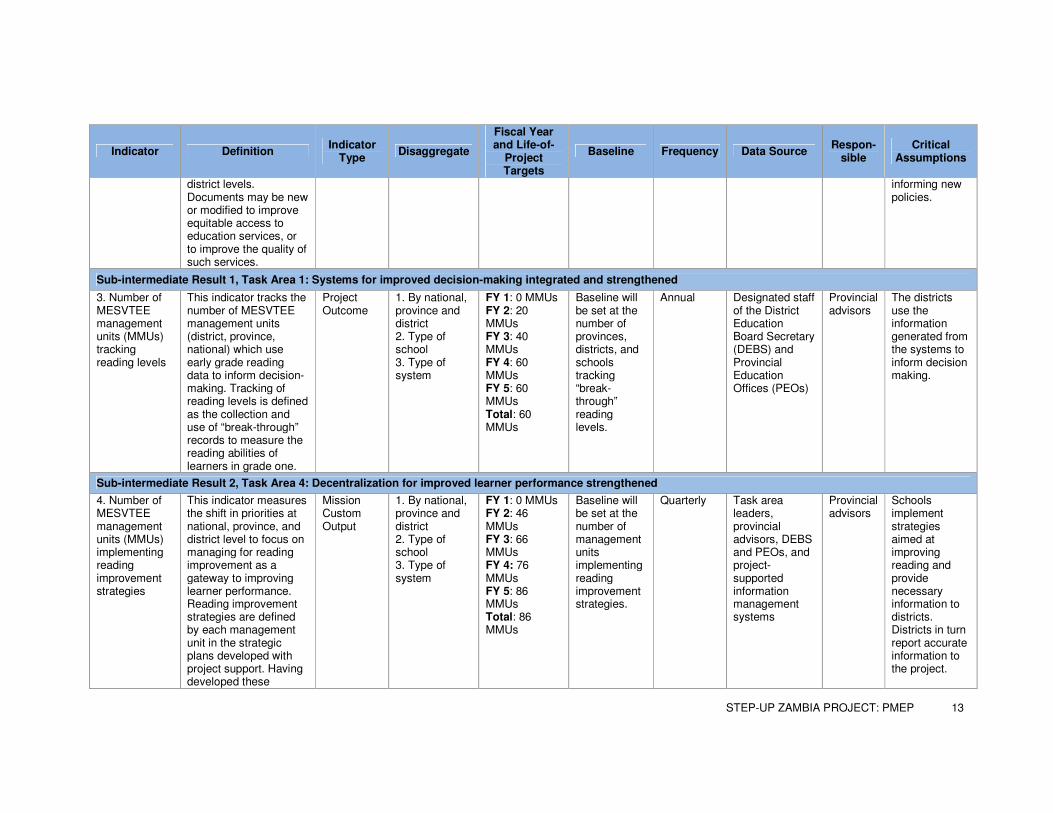
Sub-intermediate Result 1, Task Area 1: Systems for improved decision-making integrated and strengthened
3. Number of MESVTEE management units (MMUs) tracking reading levels
This indicator tracks the number of MESVTEE management units (district, province, national) which use early grade reading data to inform decision-making. Tracking of reading levels is defined as the collection and use of “break-through” records to measure the reading abilities of learners in grade one.
Project Outcome
1. By national, province and district 2. Type of school 3. Type of system
FY 1: 0 MMUs FY 2: 20 MMUs FY 3: 40 MMUs FY 4: 60 MMUs FY 5: 60 MMUs Total: 60 MMUs
Baseline will be set at the number of provinces, districts, and schools tracking “break-through” reading levels.
Annual Designated staff of the District Education Board Secretary (DEBS) and Provincial Education Offices (PEOs)
Provincial advisors
The districts use the information generated from the systems to inform decision making.
Sub-intermediate Result 2, Task Area 4: Decentralization for improved learner performance strengthened
4. Number of MESVTEE management units (MMUs) implementing reading improvement strategies
This indicator measures the shift in priorities at national, province, and district level to focus on managing for reading improvement as a gateway to improving learner performance. Reading improvement strategies are defined by each management unit in the strategic plans developed with project support. Having developed these
Mission Custom Output
1. By national, province and district 2. Type of school 3. Type of system
FY 1: 0 MMUs FY 2: 46 MMUs FY 3: 66 MMUs FY 4: 76 MMUs FY 5: 86 MMUs Total: 86 MMUs
Baseline will be set at the number of management units implementing reading improvement strategies.
Quarterly Task area leaders, provincial advisors, DEBS and PEOs, and project-supported information management systems
Provincial advisors
Schools implement strategies aimed at improving reading and provide necessary information to districts. Districts in turn report accurate information to the project.
STEP-UP ZAMBIA PROJECT: PMEP 14
Indicator Definition Indicator
Type Disaggregate
Fiscal Year and Life-of-
Project Targets
Baseline Frequency Data Source Respon-
sible Critical
Assumptions
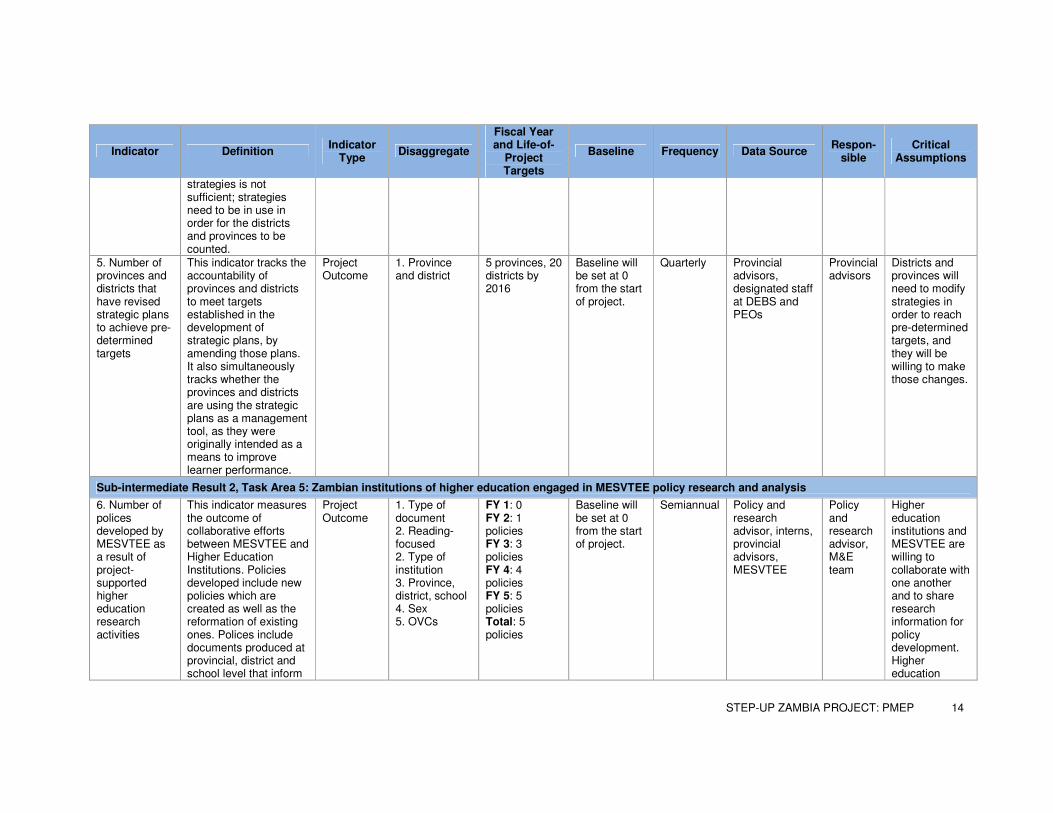
strategies is not sufficient; strategies need to be in use in order for the districts and provinces to be counted.
5. Number of provinces and districts that have revised strategic plans to achieve pre-determined targets
This indicator tracks the accountability of provinces and districts to meet targets established in the development of strategic plans, by amending those plans. It also simultaneously tracks whether the provinces and districts are using the strategic plans as a management tool, as they were originally intended as a means to improve learner performance.
Project Outcome
1. Province and district
5 provinces, 20 districts by 2016
Baseline will be set at 0 from the start of project.
Quarterly Provincial advisors, designated staff at DEBS and PEOs
Provincial advisors
Districts and provinces will need to modify strategies in order to reach pre-determined targets, and they will be willing to make those changes.
Sub-intermediate Result 2, Task Area 5: Zambian institutions of higher education engaged in MESVTEE policy research and analysis
6. Number of polices developed by MESVTEE as a result of project-supported higher education research activities
This indicator measures the outcome of collaborative efforts between MESVTEE and Higher Education Institutions. Policies developed include new policies which are created as well as the reformation of existing ones. Polices include documents produced at provincial, district and school level that inform
Project Outcome
1. Type of document 2. Reading-focused 2. Type of institution 3. Province, district, school 4. Sex 5. OVCs
FY 1: 0 FY 2: 1 policies FY 3: 3 policies FY 4: 4 policies FY 5: 5 policies Total: 5 policies
Baseline will be set at 0 from the start of project.
Semiannual Policy and research advisor, interns, provincial advisors, MESVTEE
Policy and research advisor, M&E team
Higher education institutions and MESVTEE are willing to collaborate with one another and to share research information for policy development. Higher education
STEP-UP ZAMBIA PROJECT: PMEP 15
Indicator Definition Indicator
Type Disaggregate
Fiscal Year and Life-of-
Project Targets
Baseline Frequency Data Source Respon-
sible Critical
Assumptions
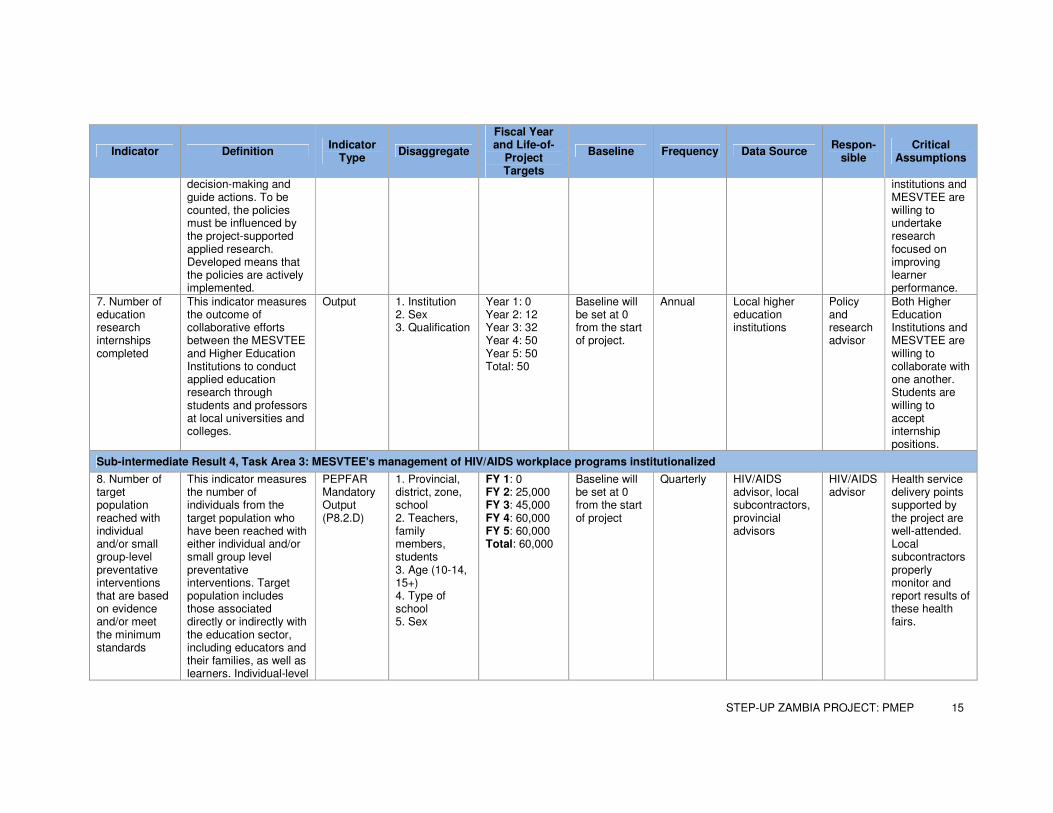
decision-making and guide actions. To be counted, the policies must be influenced by the project-supported applied research. Developed means that the policies are actively implemented.
institutions and MESVTEE are willing to undertake research focused on improving learner performance.
7. Number of education research internships completed
This indicator measures the outcome of collaborative efforts between the MESVTEE and Higher Education Institutions to conduct applied education research through students and professors at local universities and colleges.
Output 1. Institution 2. Sex 3. Qualification
Year 1: 0 Year 2: 12 Year 3: 32 Year 4: 50 Year 5: 50 Total: 50
Baseline will be set at 0 from the start of project.
Annual Local higher education institutions
Policy and research advisor
Both Higher Education Institutions and MESVTEE are willing to collaborate with one another. Students are willing to accept internship positions.
Sub-intermediate Result 4, Task Area 3: MESVTEE's management of HIV/AIDS workplace programs institutionalized
8. Number of target population reached with individual and/or small group-level preventative interventions that are based on evidence and/or meet the minimum standards
This indicator measures the number of individuals from the target population who have been reached with either individual and/or small group level preventative interventions. Target population includes those associated directly or indirectly with the education sector, including educators and their families, as well as learners. Individual-level
PEPFAR Mandatory Output (P8.2.D)
1. Provincial, district, zone, school 2. Teachers, family members, students 3. Age (10-14, 15+) 4. Type of school 5. Sex
FY 1: 0 FY 2: 25,000 FY 3: 45,000 FY 4: 60,000 FY 5: 60,000 Total: 60,000
Baseline will be set at 0 from the start of project
Quarterly HIV/AIDS advisor, local subcontractors, provincial advisors
HIV/AIDS advisor
Health service delivery points supported by the project are well-attended. Local subcontractors properly monitor and report results of these health fairs.
STEP-UP ZAMBIA PROJECT: PMEP 16
Indicator Definition Indicator
Type Disaggregate
Fiscal Year and Life-of-
Project Targets
Baseline Frequency Data Source Respon-
sible Critical
Assumptions
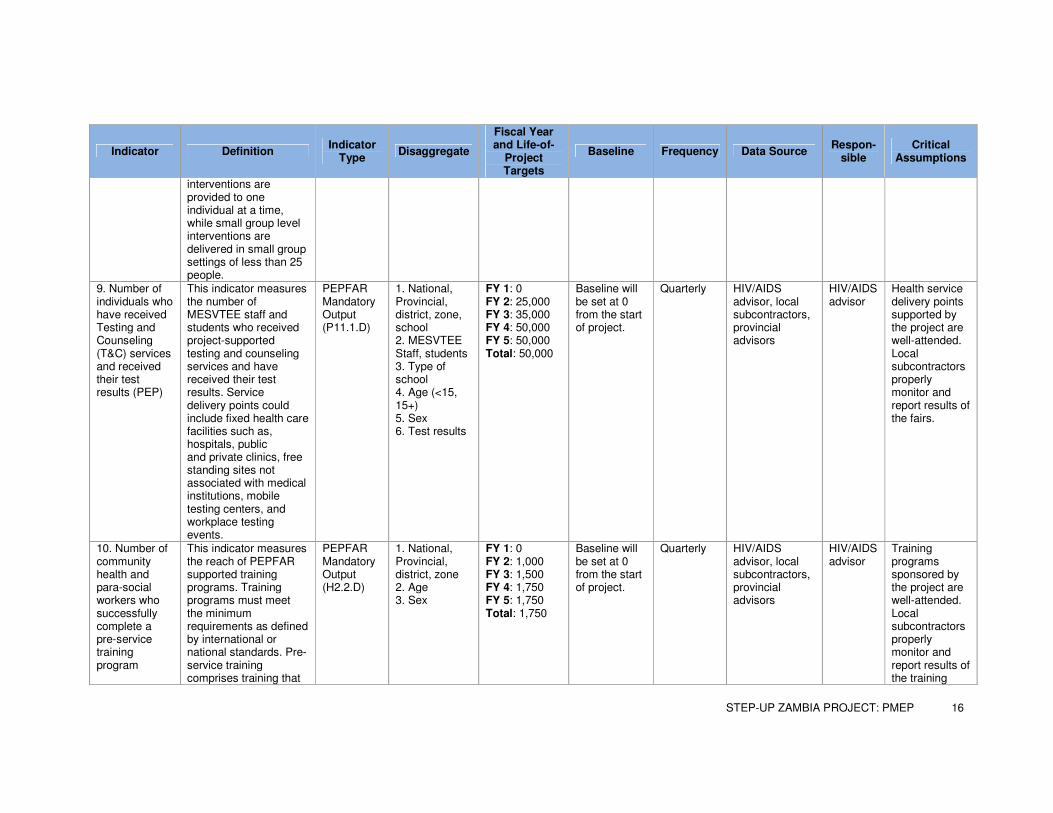
interventions are provided to one individual at a time, while small group level interventions are delivered in small group settings of less than 25 people.
9. Number of individuals who have received Testing and Counseling (T&C) services and received their test results (PEP)
This indicator measures the number of MESVTEE staff and students who received project-supported testing and counseling services and have received their test results. Service delivery points could include fixed health care facilities such as, hospitals, public and private clinics, free standing sites not associated with medical institutions, mobile testing centers, and workplace testing events.
PEPFAR Mandatory Output (P11.1.D)
1. National, Provincial, district, zone, school 2. MESVTEE Staff, students 3. Type of school 4. Age (<15, 15+) 5. Sex 6. Test results
FY 1: 0 FY 2: 25,000 FY 3: 35,000 FY 4: 50,000 FY 5: 50,000 Total: 50,000
Baseline will be set at 0 from the start of project.
Quarterly HIV/AIDS advisor, local subcontractors, provincial advisors
HIV/AIDS advisor
Health service delivery points supported by the project are well-attended. Local subcontractors properly monitor and report results of the fairs.
10. Number of community health and para-social workers who successfully complete a pre-service training program
This indicator measures the reach of PEPFAR supported training programs. Training programs must meet the minimum requirements as defined by international or national standards. Pre-service training comprises training that
PEPFAR Mandatory Output (H2.2.D)
1. National, Provincial, district, zone 2. Age 3. Sex
FY 1: 0 FY 2: 1,000 FY 3: 1,500 FY 4: 1,750 FY 5: 1,750 Total: 1,750
Baseline will be set at 0 from the start of project.
Quarterly HIV/AIDS advisor, local subcontractors, provincial advisors
HIV/AIDS advisor
Training programs sponsored by the project are well-attended. Local subcontractors properly monitor and report results of the training
STEP-UP ZAMBIA PROJECT: PMEP 17
Indicator Definition Indicator
Type Disaggregate
Fiscal Year and Life-of-
Project Targets
Baseline Frequency Data Source Respon-
sible Critical
Assumptions
equips community health social workers to provide services for the first time. Social workers for the purposes of this indicator receive anything from a few days of training up to 6 months of training. There is no exclusion for unpaid workers.
programs.
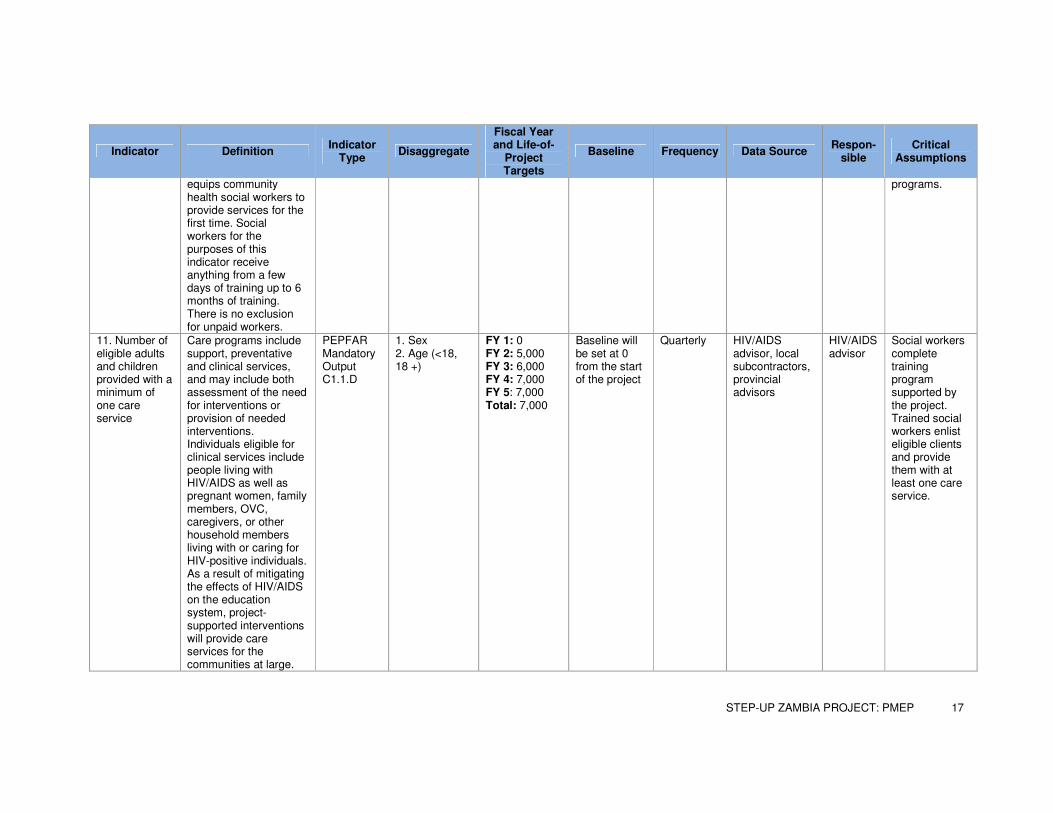
11. Number of eligible adults and children provided with a minimum of one care service
Care programs include support, preventative and clinical services, and may include both assessment of the need for interventions or provision of needed interventions. Individuals eligible for clinical services include people living with HIV/AIDS as well as pregnant women, family members, OVC, caregivers, or other household members living with or caring for HIV-positive individuals. As a result of mitigating the effects of HIV/AIDS on the education system, project-supported interventions will provide care services for the communities at large.
PEPFAR Mandatory Output C1.1.D
1. Sex 2. Age (<18, 18 +)
FY 1: 0 FY 2: 5,000 FY 3: 6,000 FY 4: 7,000 FY 5: 7,000 Total: 7,000
Baseline will be set at 0 from the start of the project
Quarterly HIV/AIDS advisor, local subcontractors, provincial advisors
HIV/AIDS advisor
Social workers complete training program supported by the project. Trained social workers enlist eligible clients and provide them with at least one care service.
STEP-UP ZAMBIA PROJECT: PMEP 18
Indicator Definition Indicator
Type Disaggregate
Fiscal Year and Life-of-
Project Targets
Baseline Frequency Data Source Respon-
sible Critical
Assumptions
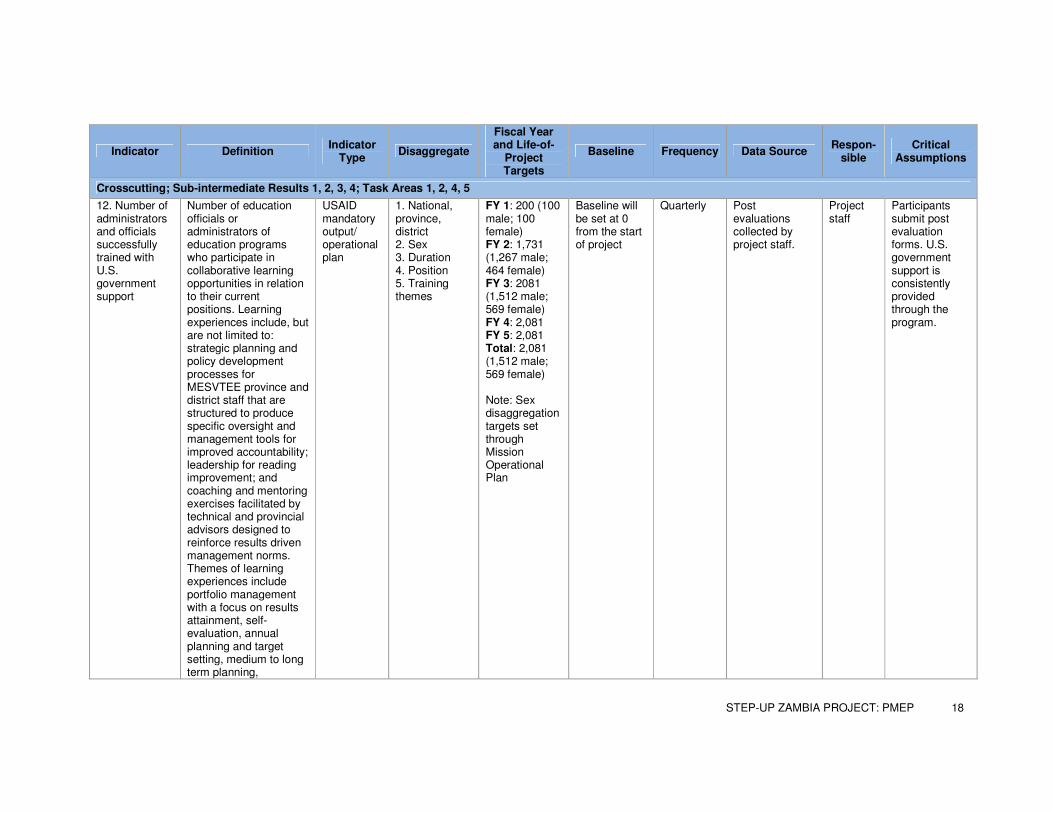
Crosscutting; Sub-intermediate Results 1, 2, 3, 4; Task Areas 1, 2, 4, 5
12. Number of administrators and officials successfully trained with U.S. government support
Number of education officials or administrators of education programs who participate in collaborative learning opportunities in relation to their current positions. Learning experiences include, but are not limited to: strategic planning and policy development processes for MESVTEE province and district staff that are structured to produce specific oversight and management tools for improved accountability; leadership for reading improvement; and coaching and mentoring exercises facilitated by technical and provincial advisors designed to reinforce results driven management norms. Themes of learning experiences include portfolio management with a focus on results attainment, self-evaluation, annual planning and target setting, medium to long term planning,
USAID mandatory output/ operational plan
1. National, province, district 2. Sex 3. Duration 4. Position 5. Training themes
FY 1: 200 (100 male; 100 female) FY 2: 1,731 (1,267 male; 464 female) FY 3: 2081 (1,512 male; 569 female) FY 4: 2,081 FY 5: 2,081 Total: 2,081 (1,512 male; 569 female) Note: Sex disaggregation targets set through Mission Operational Plan
Baseline will be set at 0 from the start of project
Quarterly Post evaluations collected by project staff.
Project staff
Participants submit post evaluation forms. U.S. government support is consistently provided through the program.
STEP-UP ZAMBIA PROJECT: PMEP 19
Indicator Definition Indicator
Type Disaggregate
Fiscal Year and Life-of-
Project Targets
Baseline Frequency Data Source Respon-
sible Critical
Assumptions
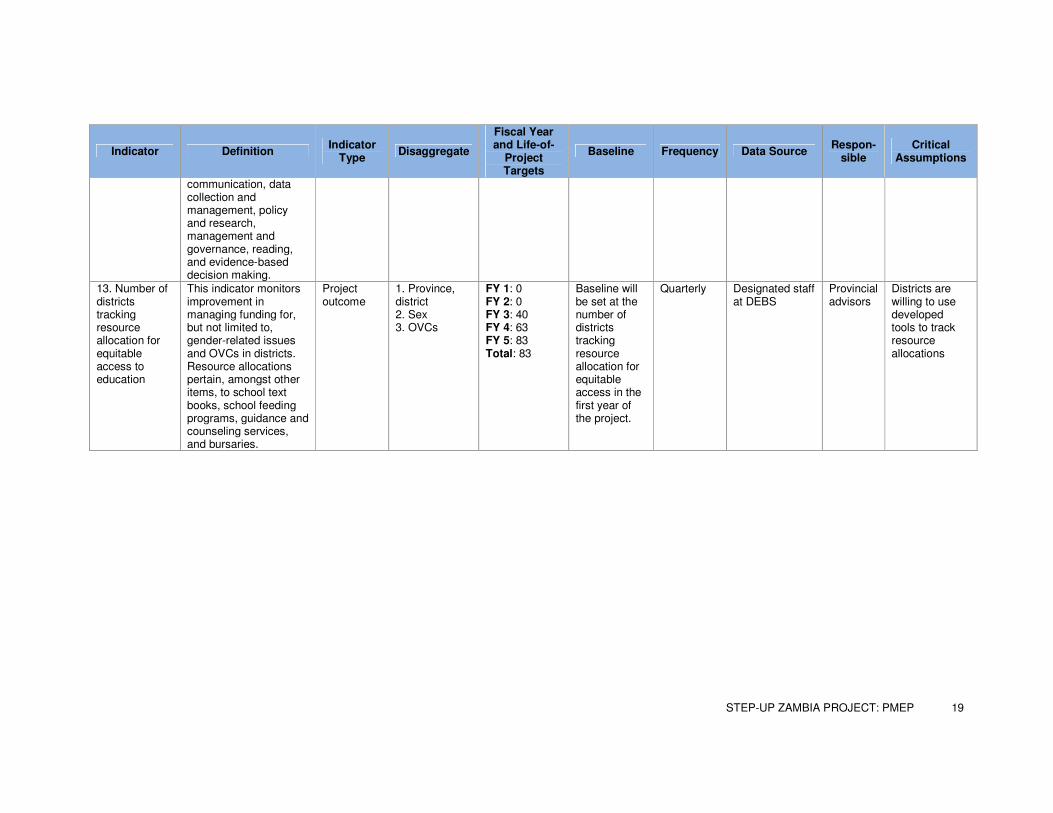
communication, data collection and management, policy and research, management and governance, reading, and evidence-based decision making.
13. Number of districts tracking resource allocation for equitable access to education
This indicator monitors improvement in managing funding for, but not limited to, gender-related issues and OVCs in districts. Resource allocations pertain, amongst other items, to school text books, school feeding programs, guidance and counseling services, and bursaries.
Project outcome
1. Province, district 2. Sex 3. OVCs
FY 1: 0 FY 2: 0 FY 3: 40 FY 4: 63 FY 5: 83 Total: 83
Baseline will be set at the number of districts tracking resource allocation for equitable access in the first year of the project.
Quarterly Designated staff at DEBS
Provincial advisors
Districts are willing to use developed tools to track resource allocations
STRENGTHENING EDUCATIONAL PERFORMANCE - UP PMEP 20
ANNEX B. TRACKING AMENDMENTS TO THE PMEP
DATE DETAILS
STRENGTHENING EDUCATIONAL PERFORMANCE - UP PMEP 21
ANNEX C. INDICATOR REFERENCE SHEETS
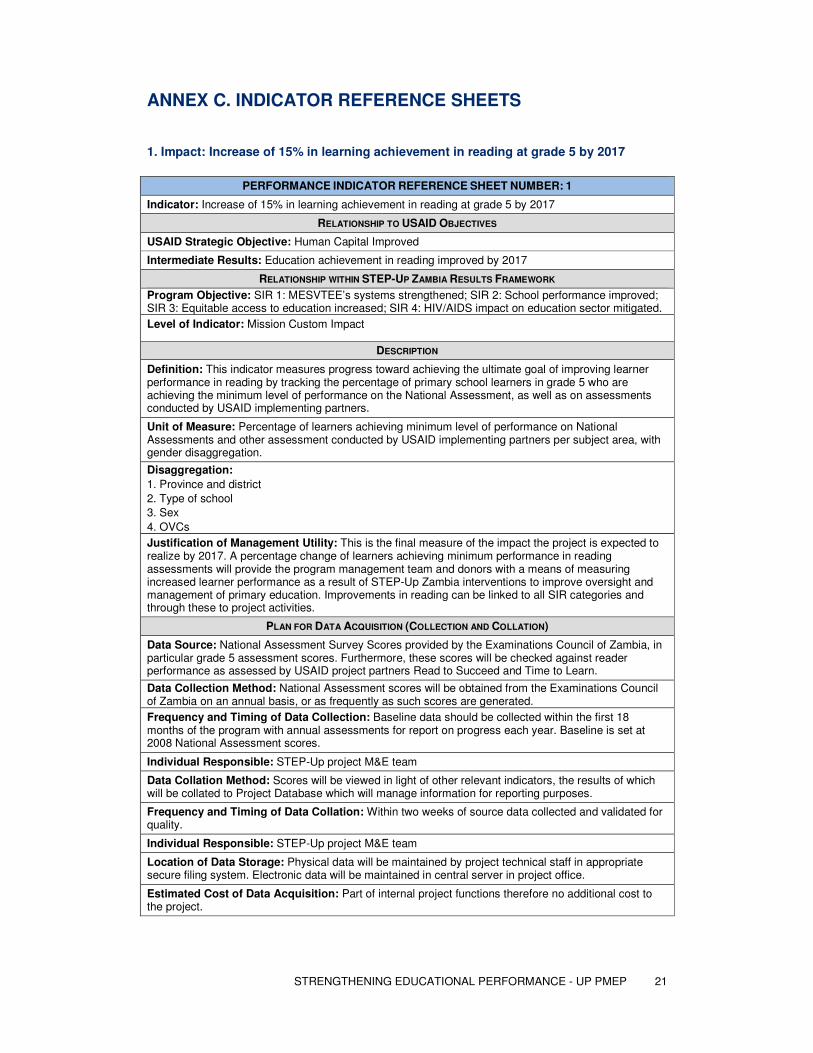
1. Impact: Increase of 15% in learning achievement in reading at grade 5 by 2017
PERFORMANCE INDICATOR REFERENCE SHEET NUMBER: 1
Indicator: Increase of 15% in learning achievement in reading at grade 5 by 2017
RELATIONSHIP TO USAID OBJECTIVES
USAID Strategic Objective: Human Capital Improved
Intermediate Results: Education achievement in reading improved by 2017
RELATIONSHIP WITHIN STEP-UP ZAMBIA RESULTS FRAMEWORK
Program Objective: SIR 1: MESVTEE’s systems strengthened; SIR 2: School performance improved; SIR 3: Equitable access to education increased; SIR 4: HIV/AIDS impact on education sector mitigated.
Level of Indicator: Mission Custom Impact
DESCRIPTION
Definition: This indicator measures progress toward achieving the ultimate goal of improving learner performance in reading by tracking the percentage of primary school learners in grade 5 who are achieving the minimum level of performance on the National Assessment, as well as on assessments conducted by USAID implementing partners.
Unit of Measure: Percentage of learners achieving minimum level of performance on National Assessments and other assessment conducted by USAID implementing partners per subject area, with gender disaggregation.
Disaggregation:
1. Province and district
2. Type of school
3. Sex
4. OVCs
Justification of Management Utility: This is the final measure of the impact the project is expected to realize by 2017. A percentage change of learners achieving minimum performance in reading assessments will provide the program management team and donors with a means of measuring increased learner performance as a result of STEP-Up Zambia interventions to improve oversight and management of primary education. Improvements in reading can be linked to all SIR categories and through these to project activities.
PLAN FOR DATA ACQUISITION (COLLECTION AND COLLATION)
Data Source: National Assessment Survey Scores provided by the Examinations Council of Zambia, in particular grade 5 assessment scores. Furthermore, these scores will be checked against reader performance as assessed by USAID project partners Read to Succeed and Time to Learn.
Data Collection Method: National Assessment scores will be obtained from the Examinations Council of Zambia on an annual basis, or as frequently as such scores are generated.
Frequency and Timing of Data Collection: Baseline data should be collected within the first 18 months of the program with annual assessments for report on progress each year. Baseline is set at 2008 National Assessment scores.
Individual Responsible: STEP-Up project M&E team
Data Collation Method: Scores will be viewed in light of other relevant indicators, the results of which will be collated to Project Database which will manage information for reporting purposes.
Frequency and Timing of Data Collation: Within two weeks of source data collected and validated for quality.
Individual Responsible: STEP-Up project M&E team
Location of Data Storage: Physical data will be maintained by project technical staff in appropriate secure filing system. Electronic data will be maintained in central server in project office.
Estimated Cost of Data Acquisition: Part of internal project functions therefore no additional cost to the project.
STRENGTHENING EDUCATIONAL PERFORMANCE - UP PMEP 22
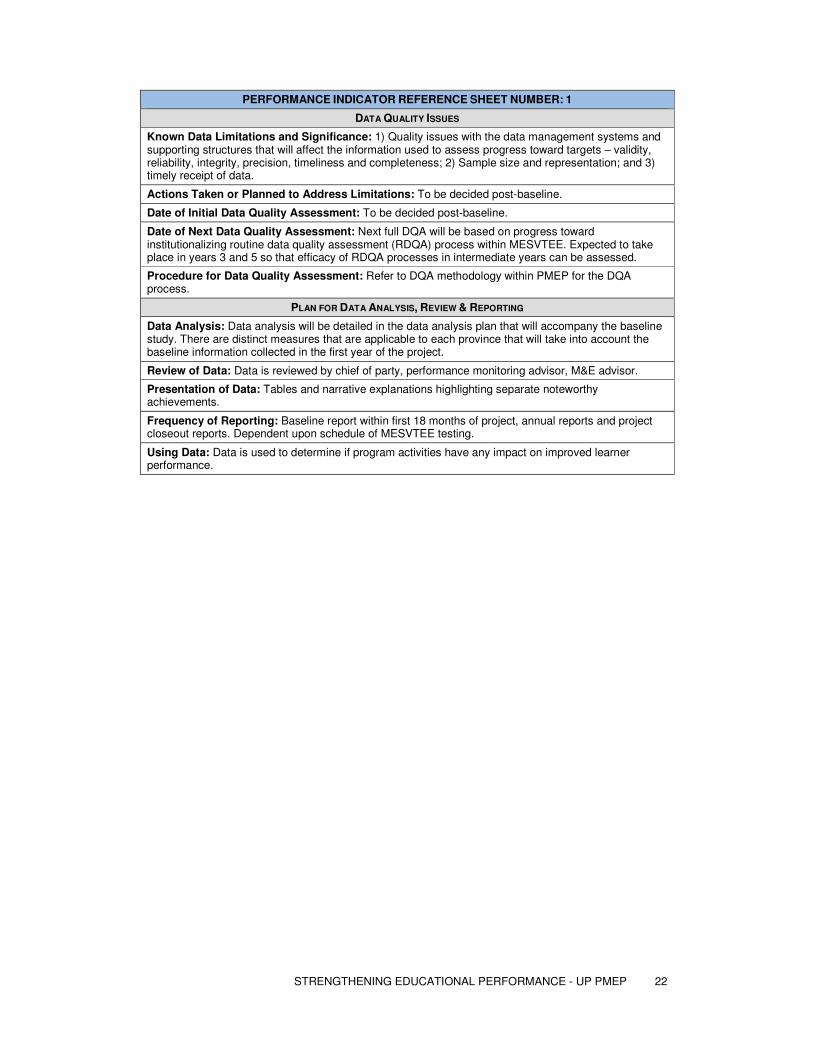
PERFORMANCE INDICATOR REFERENCE SHEET NUMBER: 1
DATA QUALITY ISSUES
Known Data Limitations and Significance: 1) Quality issues with the data management systems and supporting structures that will affect the information used to assess progress toward targets – validity, reliability, integrity, precision, timeliness and completeness; 2) Sample size and representation; and 3) timely receipt of data.
Actions Taken or Planned to Address Limitations: To be decided post-baseline.
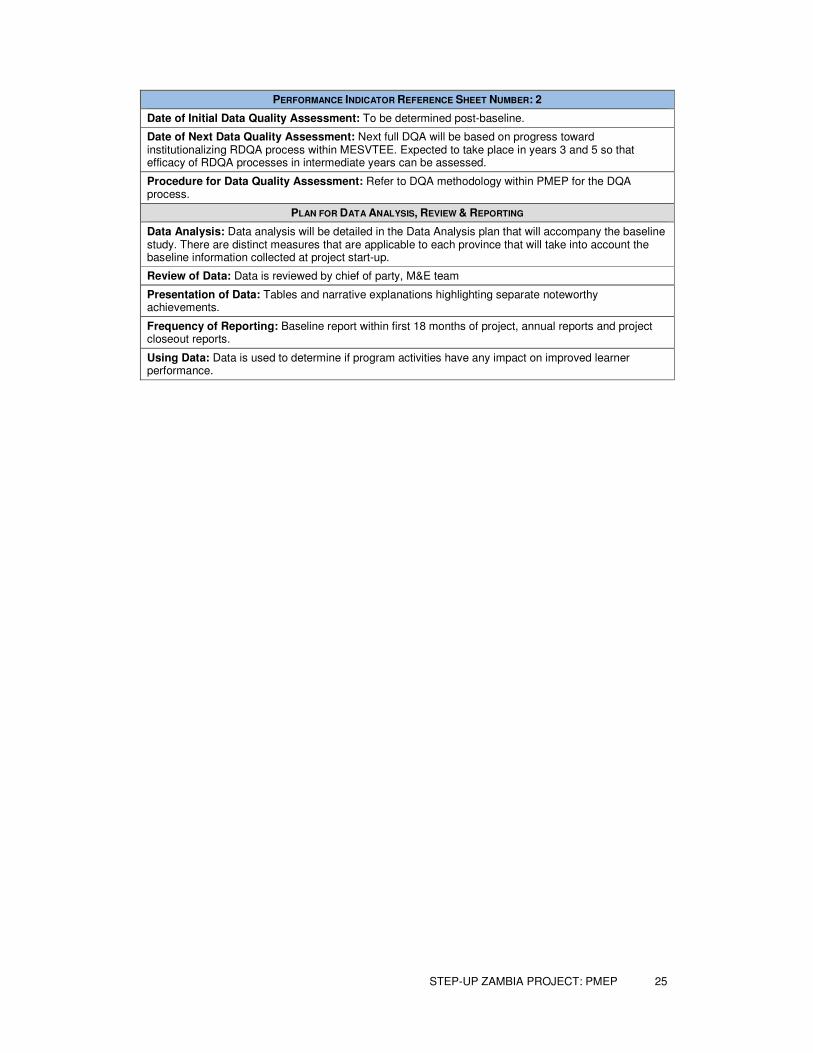
Date of Initial Data Quality Assessment: To be decided post-baseline.
Date of Next Data Quality Assessment: Next full DQA will be based on progress toward institutionalizing routine data quality assessment (RDQA) process within MESVTEE. Expected to take place in years 3 and 5 so that efficacy of RDQA processes in intermediate years can be assessed.
Procedure for Data Quality Assessment: Refer to DQA methodology within PMEP for the DQA process.
PLAN FOR DATA ANALYSIS, REVIEW & REPORTING
Data Analysis: Data analysis will be detailed in the data analysis plan that will accompany the baseline study. There are distinct measures that are applicable to each province that will take into account the baseline information collected in the first year of the project.
Review of Data: Data is reviewed by chief of party, performance monitoring advisor, M&E advisor.
Presentation of Data: Tables and narrative explanations highlighting separate noteworthy achievements.
Frequency of Reporting: Baseline report within first 18 months of project, annual reports and project closeout reports. Dependent upon schedule of MESVTEE testing.
Using Data: Data is used to determine if program activities have any impact on improved learner performance.
STEP-UP ZAMBIA PROJECT: PMEP 23
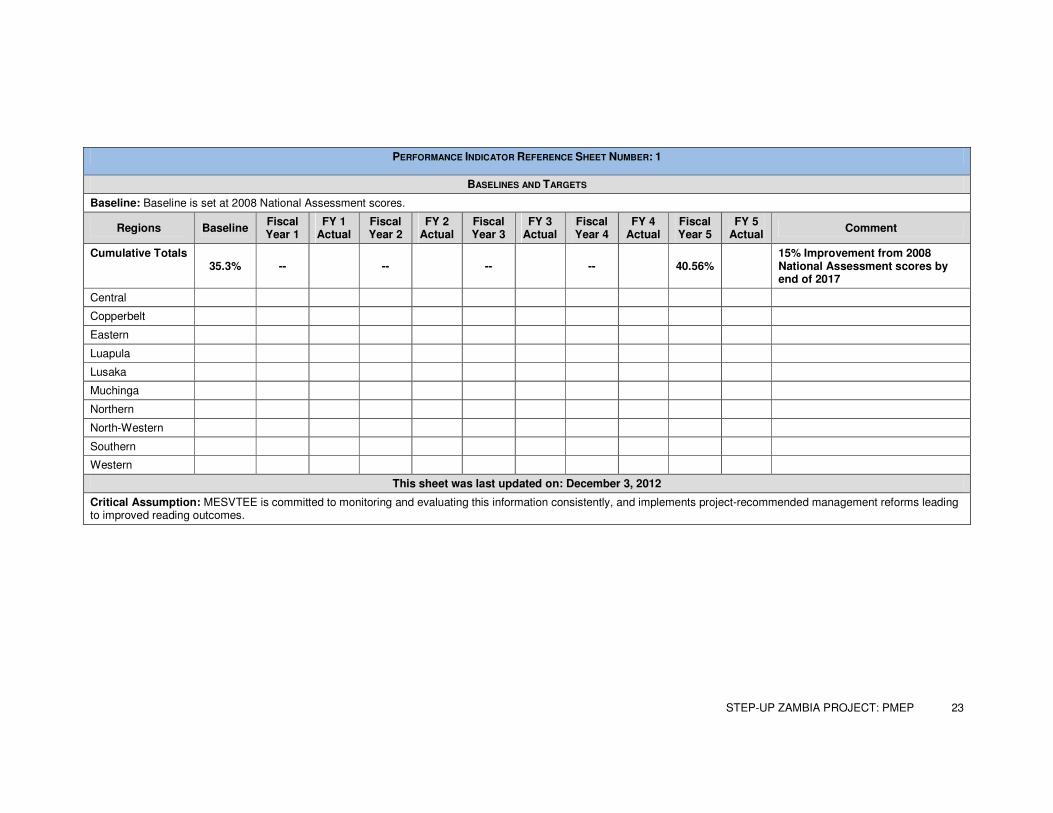
PERFORMANCE INDICATOR REFERENCE SHEET NUMBER: 1
BASELINES AND TARGETS
Baseline: Baseline is set at 2008 National Assessment scores.
Regions Baseline Fiscal Year 1
FY 1 Actual
Fiscal Year 2
FY 2 Actual
Fiscal Year 3
FY 3 Actual
Fiscal Year 4
FY 4 Actual
Fiscal Year 5
FY 5 Actual
Comment
Cumulative Totals 35.3% -- -- -- -- 40.56%
15% Improvement from 2008 National Assessment scores by end of 2017
Central
Copperbelt
Eastern
Luapula
Lusaka
Muchinga
Northern
North-Western
Southern
Western
This sheet was last updated on: December 3, 2012
Critical Assumption: MESVTEE is committed to monitoring and evaluating this information consistently, and implements project-recommended management reforms leading to improved reading outcomes.
STEP-UP ZAMBIA PROJECT: PMEP 24
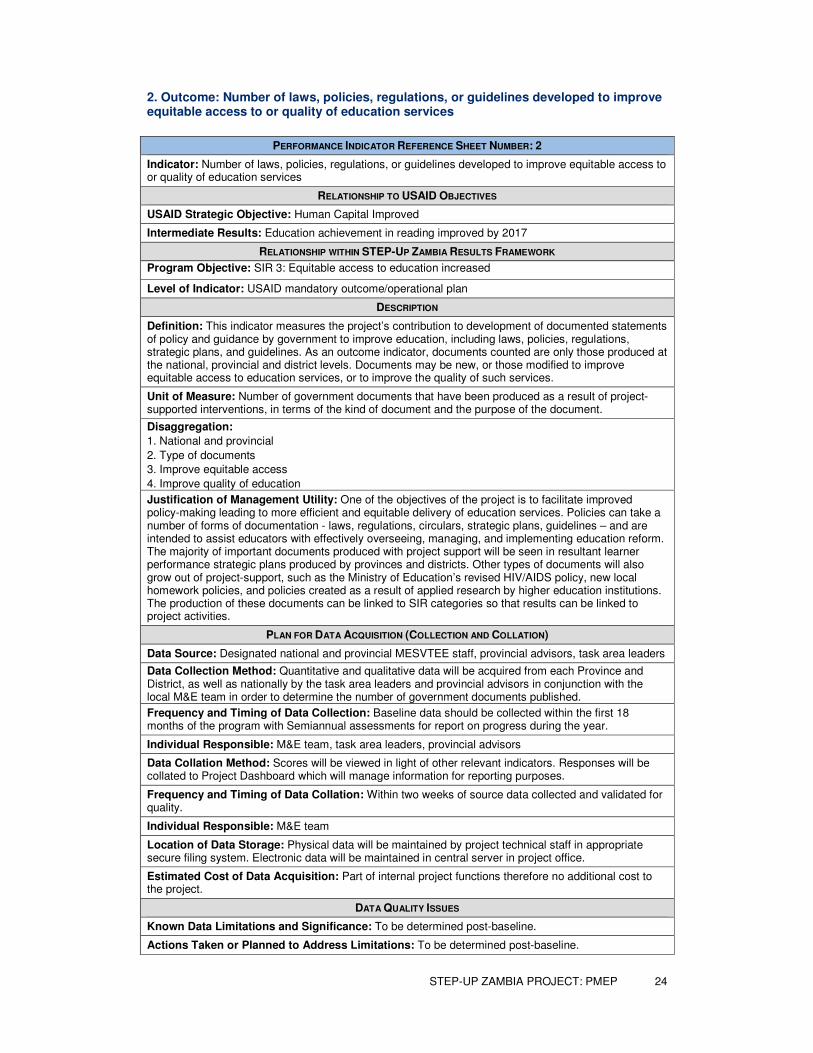
2. Outcome: Number of laws, policies, regulations, or guidelines developed to improve equitable access to or quality of education services
PERFORMANCE INDICATOR REFERENCE SHEET NUMBER: 2
Indicator: Number of laws, policies, regulations, or guidelines developed to improve equitable access to or quality of education services
RELATIONSHIP TO USAID OBJECTIVES
USAID Strategic Objective: Human Capital Improved
Intermediate Results: Education achievement in reading improved by 2017
RELATIONSHIP WITHIN STEP-UP ZAMBIA RESULTS FRAMEWORK
Program Objective: SIR 3: Equitable access to education increased
Level of Indicator: USAID mandatory outcome/operational plan
DESCRIPTION
Definition: This indicator measures the project’s contribution to development of documented statements of policy and guidance by government to improve education, including laws, policies, regulations, strategic plans, and guidelines. As an outcome indicator, documents counted are only those produced at the national, provincial and district levels. Documents may be new, or those modified to improve equitable access to education services, or to improve the quality of such services.
Unit of Measure: Number of government documents that have been produced as a result of project-supported interventions, in terms of the kind of document and the purpose of the document.
Disaggregation:
1. National and provincial
2. Type of documents
3. Improve equitable access
4. Improve quality of education
Justification of Management Utility: One of the objectives of the project is to facilitate improved policy-making leading to more efficient and equitable delivery of education services. Policies can take a number of forms of documentation - laws, regulations, circulars, strategic plans, guidelines – and are intended to assist educators with effectively overseeing, managing, and implementing education reform. The majority of important documents produced with project support will be seen in resultant learner performance strategic plans produced by provinces and districts. Other types of documents will also grow out of project-support, such as the Ministry of Education’s revised HIV/AIDS policy, new local homework policies, and policies created as a result of applied research by higher education institutions. The production of these documents can be linked to SIR categories so that results can be linked to project activities.
PLAN FOR DATA ACQUISITION (COLLECTION AND COLLATION)
Data Source: Designated national and provincial MESVTEE staff, provincial advisors, task area leaders
Data Collection Method: Quantitative and qualitative data will be acquired from each Province and District, as well as nationally by the task area leaders and provincial advisors in conjunction with the local M&E team in order to determine the number of government documents published.
Frequency and Timing of Data Collection: Baseline data should be collected within the first 18 months of the program with Semiannual assessments for report on progress during the year.
Individual Responsible: M&E team, task area leaders, provincial advisors
Data Collation Method: Scores will be viewed in light of other relevant indicators. Responses will be collated to Project Dashboard which will manage information for reporting purposes.
Frequency and Timing of Data Collation: Within two weeks of source data collected and validated for quality.
Individual Responsible: M&E team
Location of Data Storage: Physical data will be maintained by project technical staff in appropriate secure filing system. Electronic data will be maintained in central server in project office.
Estimated Cost of Data Acquisition: Part of internal project functions therefore no additional cost to the project.
DATA QUALITY ISSUES
Known Data Limitations and Significance: To be determined post-baseline.
Actions Taken or Planned to Address Limitations: To be determined post-baseline.
STEP-UP ZAMBIA PROJECT: PMEP 25
PERFORMANCE INDICATOR REFERENCE SHEET NUMBER: 2
Date of Initial Data Quality Assessment: To be determined post-baseline.
Date of Next Data Quality Assessment: Next full DQA will be based on progress toward institutionalizing RDQA process within MESVTEE. Expected to take place in years 3 and 5 so that efficacy of RDQA processes in intermediate years can be assessed.
Procedure for Data Quality Assessment: Refer to DQA methodology within PMEP for the DQA process.
PLAN FOR DATA ANALYSIS, REVIEW & REPORTING
Data Analysis: Data analysis will be detailed in the Data Analysis plan that will accompany the baseline study. There are distinct measures that are applicable to each province that will take into account the baseline information collected at project start-up.
Review of Data: Data is reviewed by chief of party, M&E team
Presentation of Data: Tables and narrative explanations highlighting separate noteworthy achievements.
Frequency of Reporting: Baseline report within first 18 months of project, annual reports and project closeout reports.
Using Data: Data is used to determine if program activities have any impact on improved learner performance.
STEP-UP ZAMBIA PROJECT: PMEP 26
PERFORMANCE INDICATOR REFERENCE SHEET NUMBER: 2
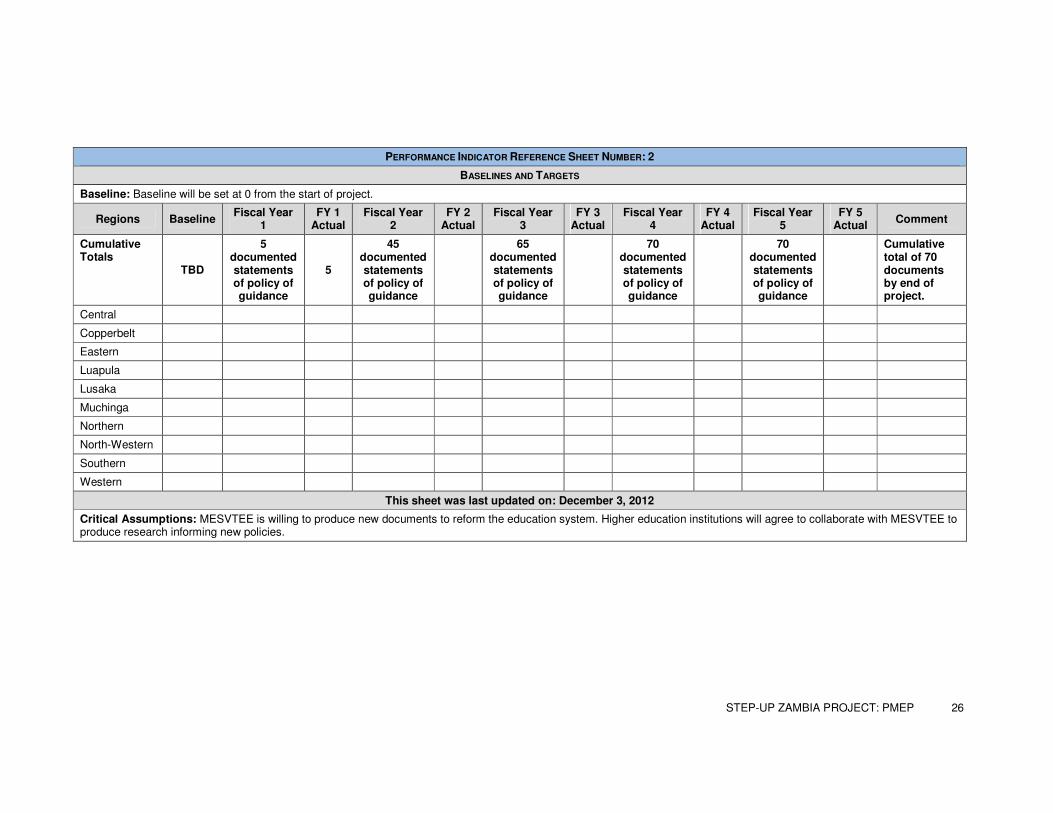
BASELINES AND TARGETS
Baseline: Baseline will be set at 0 from the start of project.
Regions Baseline Fiscal Year
1 FY 1
Actual Fiscal Year
2 FY 2
Actual Fiscal Year
3 FY 3
Actual Fiscal Year
4 FY 4
Actual Fiscal Year
5 FY 5
Actual Comment
Cumulative Totals
TBD
5 documented statements of policy of guidance
5
45 documented statements of policy of guidance
65 documented statements of policy of guidance
70 documented statements of policy of guidance
70 documented statements of policy of guidance
Cumulative total of 70 documents by end of project.
Central
Copperbelt
Eastern
Luapula
Lusaka
Muchinga
Northern
North-Western
Southern
Western
This sheet was last updated on: December 3, 2012
Critical Assumptions: MESVTEE is willing to produce new documents to reform the education system. Higher education institutions will agree to collaborate with MESVTEE to produce research informing new policies.
STEP-UP ZAMBIA PROJECT: PMEP 27
3. Outcome: Number of Management Units tracking reading levels
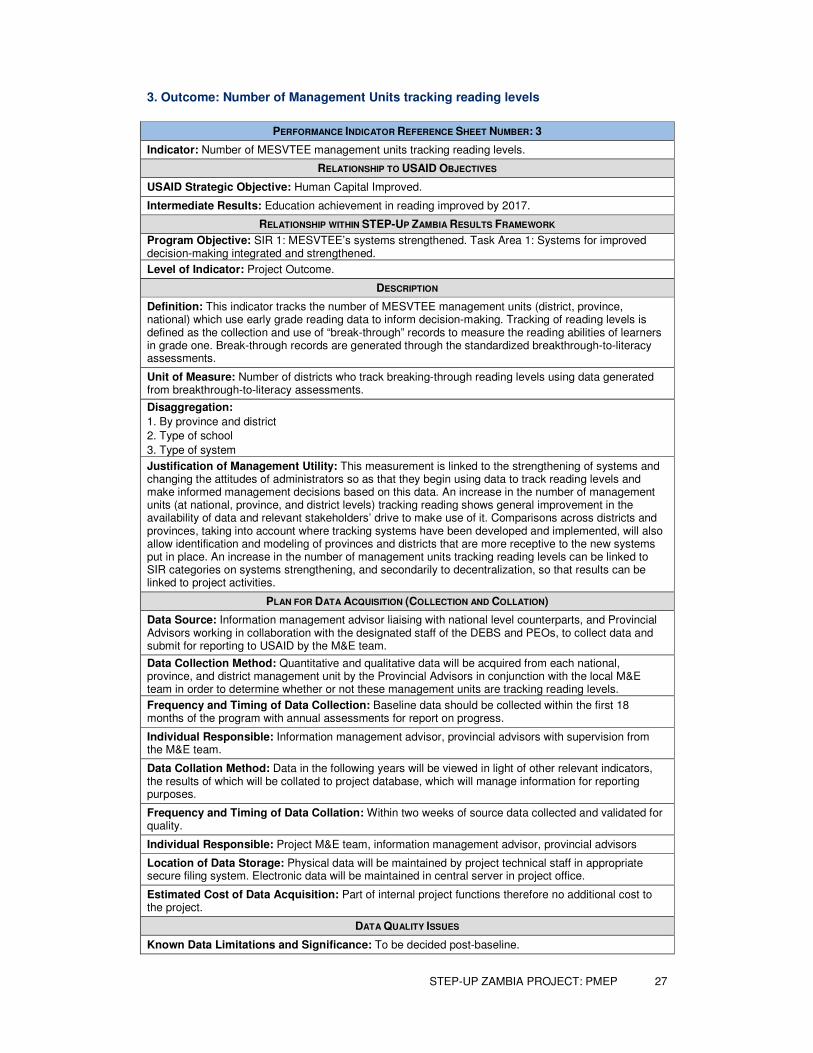
PERFORMANCE INDICATOR REFERENCE SHEET NUMBER: 3
Indicator: Number of MESVTEE management units tracking reading levels.
RELATIONSHIP TO USAID OBJECTIVES
USAID Strategic Objective: Human Capital Improved.
Intermediate Results: Education achievement in reading improved by 2017.
RELATIONSHIP WITHIN STEP-UP ZAMBIA RESULTS FRAMEWORK
Program Objective: SIR 1: MESVTEE’s systems strengthened. Task Area 1: Systems for improved decision-making integrated and strengthened.
Level of Indicator: Project Outcome.
DESCRIPTION
Definition: This indicator tracks the number of MESVTEE management units (district, province, national) which use early grade reading data to inform decision-making. Tracking of reading levels is defined as the collection and use of “break-through” records to measure the reading abilities of learners in grade one. Break-through records are generated through the standardized breakthrough-to-literacy assessments.
Unit of Measure: Number of districts who track breaking-through reading levels using data generated from breakthrough-to-literacy assessments.
Disaggregation:
1. By province and district
2. Type of school
3. Type of system
Justification of Management Utility: This measurement is linked to the strengthening of systems and changing the attitudes of administrators so as that they begin using data to track reading levels and make informed management decisions based on this data. An increase in the number of management units (at national, province, and district levels) tracking reading shows general improvement in the availability of data and relevant stakeholders’ drive to make use of it. Comparisons across districts and provinces, taking into account where tracking systems have been developed and implemented, will also allow identification and modeling of provinces and districts that are more receptive to the new systems put in place. An increase in the number of management units tracking reading levels can be linked to SIR categories on systems strengthening, and secondarily to decentralization, so that results can be linked to project activities.
PLAN FOR DATA ACQUISITION (COLLECTION AND COLLATION)
Data Source: Information management advisor liaising with national level counterparts, and Provincial Advisors working in collaboration with the designated staff of the DEBS and PEOs, to collect data and submit for reporting to USAID by the M&E team.
Data Collection Method: Quantitative and qualitative data will be acquired from each national, province, and district management unit by the Provincial Advisors in conjunction with the local M&E team in order to determine whether or not these management units are tracking reading levels.
Frequency and Timing of Data Collection: Baseline data should be collected within the first 18 months of the program with annual assessments for report on progress.
Individual Responsible: Information management advisor, provincial advisors with supervision from the M&E team.
Data Collation Method: Data in the following years will be viewed in light of other relevant indicators, the results of which will be collated to project database, which will manage information for reporting purposes.
Frequency and Timing of Data Collation: Within two weeks of source data collected and validated for quality.
Individual Responsible: Project M&E team, information management advisor, provincial advisors
Location of Data Storage: Physical data will be maintained by project technical staff in appropriate secure filing system. Electronic data will be maintained in central server in project office.
Estimated Cost of Data Acquisition: Part of internal project functions therefore no additional cost to the project.
DATA QUALITY ISSUES
Known Data Limitations and Significance: To be decided post-baseline.

STEP-UP ZAMBIA PROJECT: PMEP 28
PERFORMANCE INDICATOR REFERENCE SHEET NUMBER: 3
Actions Taken or Planned to Address Limitations: To be decided post-baseline.
Date of Initial Data Quality Assessment: To be decided post-baseline.
Date of Next Data Quality Assessment: Next full DQA will be based on progress toward institutionalizing RDQA process within MESVTEE. Expected to take place in years 3 and 5 so that efficacy of RDQA processes in intermediate years can be assessed.
Procedure for Data Quality Assessment: Refer to DQA methodology within PMEP for the DQA process.
PLAN FOR DATA ANALYSIS, REVIEW & REPORTING
Data Analysis: Data analysis will be detailed in the data analysis plan that will accompany the baseline study. There are distinct measures that are applicable to each province that will take into account the baseline information collected at project start-up.
Review of Data: Data is reviewed by chief of party, M&E team
Presentation of Data: Tables and narrative explanations highlighting separate noteworthy achievements.
Frequency of Reporting: Baseline report within first 18 months of project, fiscal reports and project closeout reports.
Using Data: Data is used to determine if program activities have any impact on improved learner performance.
STEP-UP ZAMBIA PROJECT: PMEP 29
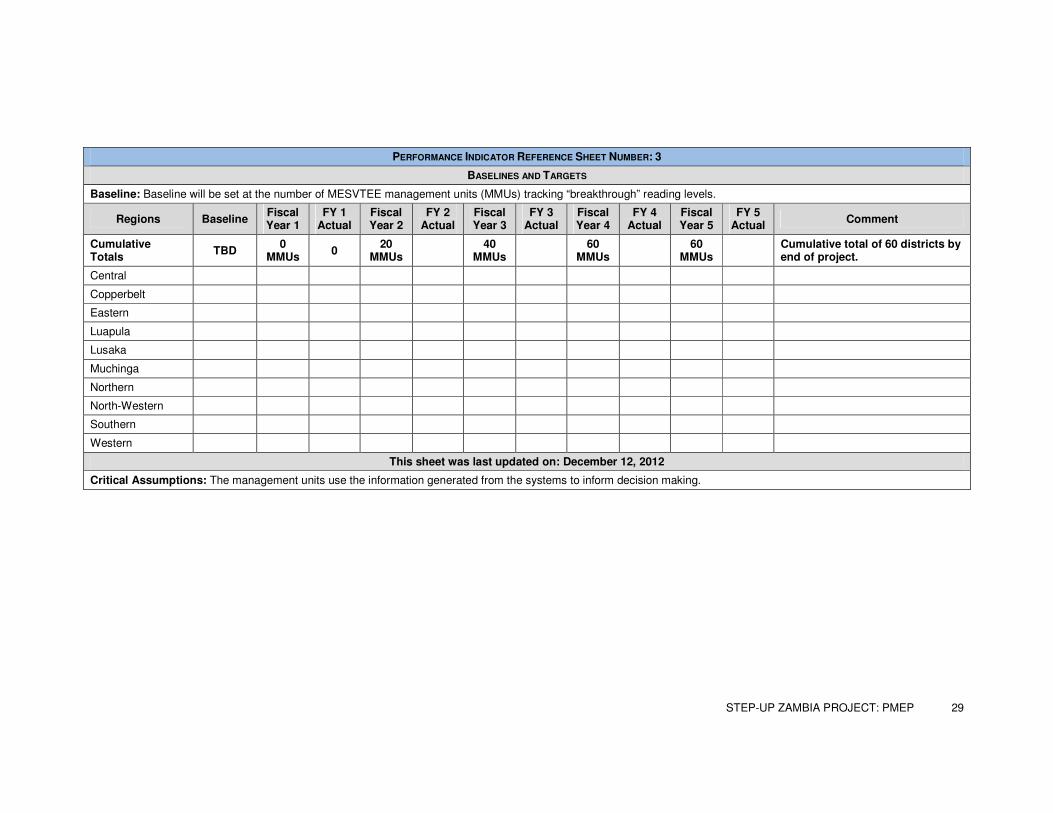
PERFORMANCE INDICATOR REFERENCE SHEET NUMBER: 3
BASELINES AND TARGETS
Baseline: Baseline will be set at the number of MESVTEE management units (MMUs) tracking “breakthrough” reading levels.
Regions Baseline Fiscal Year 1
FY 1 Actual
Fiscal Year 2
FY 2 Actual
Fiscal Year 3
FY 3 Actual
Fiscal Year 4
FY 4 Actual
Fiscal Year 5
FY 5 Actual
Comment
Cumulative Totals
TBD 0
MMUs 0
20 MMUs
40
MMUs
60 MMUs
60
MMUs
Cumulative total of 60 districts by end of project.
Central
Copperbelt
Eastern
Luapula
Lusaka
Muchinga
Northern
North-Western
Southern
Western
This sheet was last updated on: December 12, 2012
Critical Assumptions: The management units use the information generated from the systems to inform decision making.
STEP-UP ZAMBIA PROJECT: PMEP 30
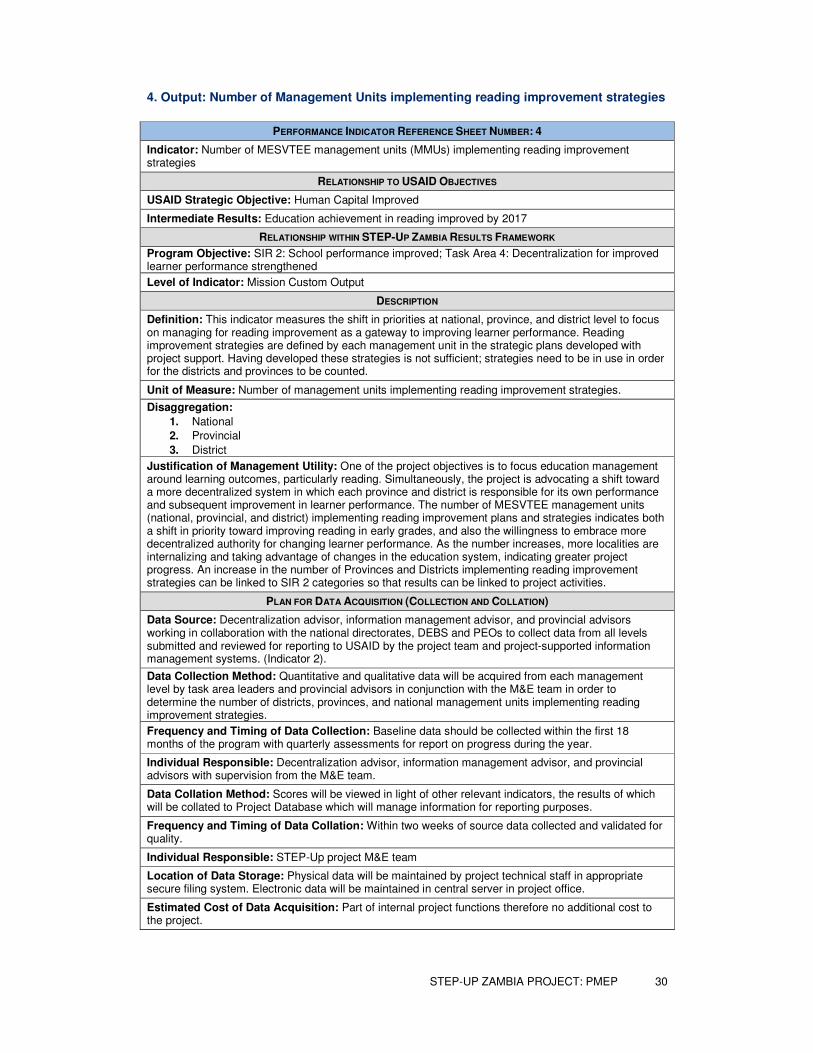
4. Output: Number of Management Units implementing reading improvement strategies
PERFORMANCE INDICATOR REFERENCE SHEET NUMBER: 4
Indicator: Number of MESVTEE management units (MMUs) implementing reading improvement strategies
RELATIONSHIP TO USAID OBJECTIVES
USAID Strategic Objective: Human Capital Improved
Intermediate Results: Education achievement in reading improved by 2017
RELATIONSHIP WITHIN STEP-UP ZAMBIA RESULTS FRAMEWORK
Program Objective: SIR 2: School performance improved; Task Area 4: Decentralization for improved learner performance strengthened
Level of Indicator: Mission Custom Output
DESCRIPTION
Definition: This indicator measures the shift in priorities at national, province, and district level to focus on managing for reading improvement as a gateway to improving learner performance. Reading improvement strategies are defined by each management unit in the strategic plans developed with project support. Having developed these strategies is not sufficient; strategies need to be in use in order for the districts and provinces to be counted.
Unit of Measure: Number of management units implementing reading improvement strategies.
Disaggregation:
1. National
2. Provincial
3. District
Justification of Management Utility: One of the project objectives is to focus education management around learning outcomes, particularly reading. Simultaneously, the project is advocating a shift toward a more decentralized system in which each province and district is responsible for its own performance and subsequent improvement in learner performance. The number of MESVTEE management units (national, provincial, and district) implementing reading improvement plans and strategies indicates both a shift in priority toward improving reading in early grades, and also the willingness to embrace more decentralized authority for changing learner performance. As the number increases, more localities are internalizing and taking advantage of changes in the education system, indicating greater project progress. An increase in the number of Provinces and Districts implementing reading improvement strategies can be linked to SIR 2 categories so that results can be linked to project activities.
PLAN FOR DATA ACQUISITION (COLLECTION AND COLLATION)
Data Source: Decentralization advisor, information management advisor, and provincial advisors working in collaboration with the national directorates, DEBS and PEOs to collect data from all levels submitted and reviewed for reporting to USAID by the project team and project-supported information management systems. (Indicator 2).
Data Collection Method: Quantitative and qualitative data will be acquired from each management level by task area leaders and provincial advisors in conjunction with the M&E team in order to determine the number of districts, provinces, and national management units implementing reading improvement strategies.
Frequency and Timing of Data Collection: Baseline data should be collected within the first 18 months of the program with quarterly assessments for report on progress during the year.
Individual Responsible: Decentralization advisor, information management advisor, and provincial advisors with supervision from the M&E team.
Data Collation Method: Scores will be viewed in light of other relevant indicators, the results of which will be collated to Project Database which will manage information for reporting purposes.
Frequency and Timing of Data Collation: Within two weeks of source data collected and validated for quality.
Individual Responsible: STEP-Up project M&E team
Location of Data Storage: Physical data will be maintained by project technical staff in appropriate secure filing system. Electronic data will be maintained in central server in project office.
Estimated Cost of Data Acquisition: Part of internal project functions therefore no additional cost to the project.
STEP-UP ZAMBIA PROJECT: PMEP 31
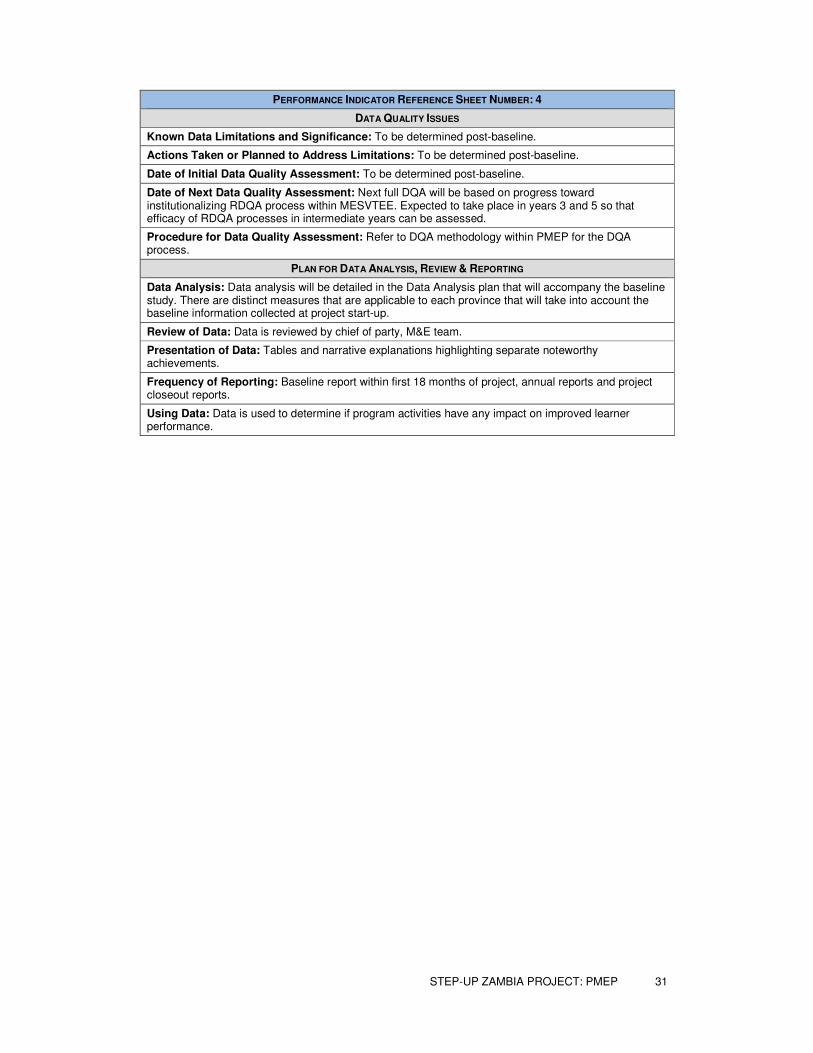
PERFORMANCE INDICATOR REFERENCE SHEET NUMBER: 4
DATA QUALITY ISSUES
Known Data Limitations and Significance: To be determined post-baseline.
Actions Taken or Planned to Address Limitations: To be determined post-baseline.
Date of Initial Data Quality Assessment: To be determined post-baseline.
Date of Next Data Quality Assessment: Next full DQA will be based on progress toward institutionalizing RDQA process within MESVTEE. Expected to take place in years 3 and 5 so that efficacy of RDQA processes in intermediate years can be assessed.
Procedure for Data Quality Assessment: Refer to DQA methodology within PMEP for the DQA process.
PLAN FOR DATA ANALYSIS, REVIEW & REPORTING
Data Analysis: Data analysis will be detailed in the Data Analysis plan that will accompany the baseline study. There are distinct measures that are applicable to each province that will take into account the baseline information collected at project start-up.
Review of Data: Data is reviewed by chief of party, M&E team.
Presentation of Data: Tables and narrative explanations highlighting separate noteworthy achievements.
Frequency of Reporting: Baseline report within first 18 months of project, annual reports and project closeout reports.
Using Data: Data is used to determine if program activities have any impact on improved learner performance.
STEP-UP ZAMBIA PROJECT: PMEP 32
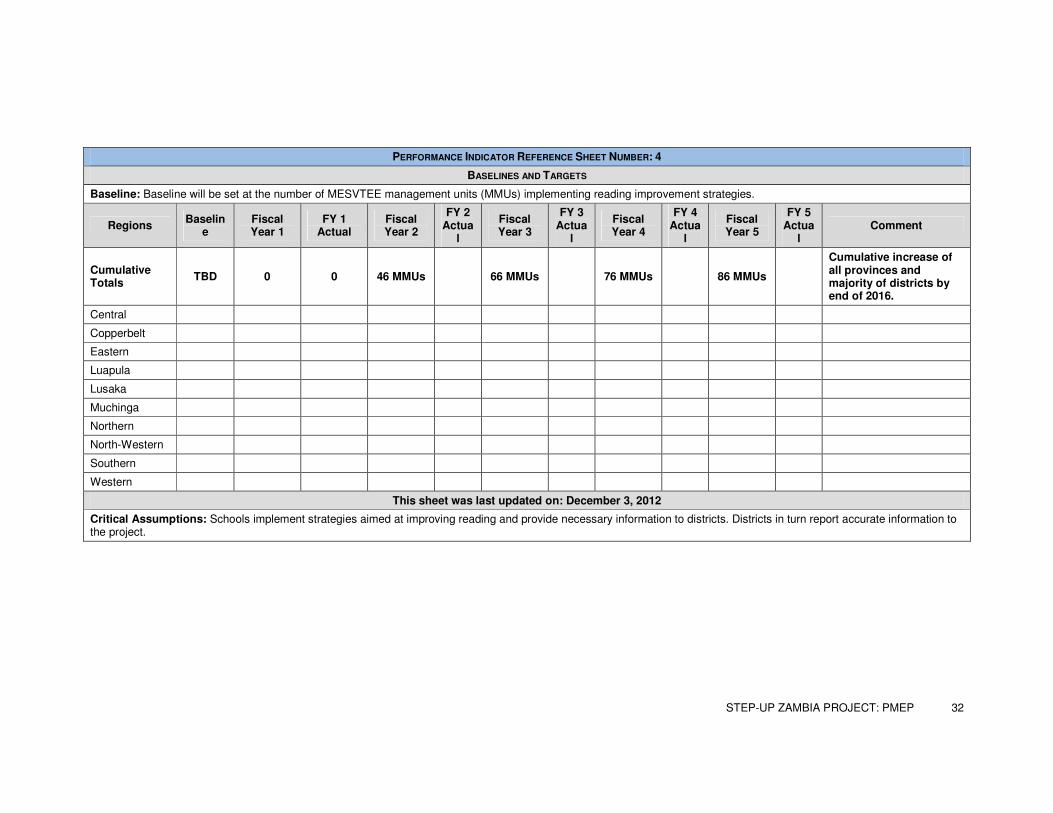
PERFORMANCE INDICATOR REFERENCE SHEET NUMBER: 4
BASELINES AND TARGETS
Baseline: Baseline will be set at the number of MESVTEE management units (MMUs) implementing reading improvement strategies.
Regions Baselin
e Fiscal Year 1
FY 1 Actual
Fiscal Year 2
FY 2 Actua
l
Fiscal Year 3
FY 3 Actua
l
Fiscal Year 4
FY 4 Actua
l
Fiscal Year 5
FY 5 Actua
l Comment
Cumulative Totals
TBD 0 0 46 MMUs 66 MMUs 76 MMUs 86 MMUs
Cumulative increase of all provinces and majority of districts by end of 2016.
Central
Copperbelt
Eastern
Luapula
Lusaka
Muchinga
Northern
North-Western
Southern
Western
This sheet was last updated on: December 3, 2012
Critical Assumptions: Schools implement strategies aimed at improving reading and provide necessary information to districts. Districts in turn report accurate information to the project.
STEP-UP ZAMBIA PROJECT: PMEP 33
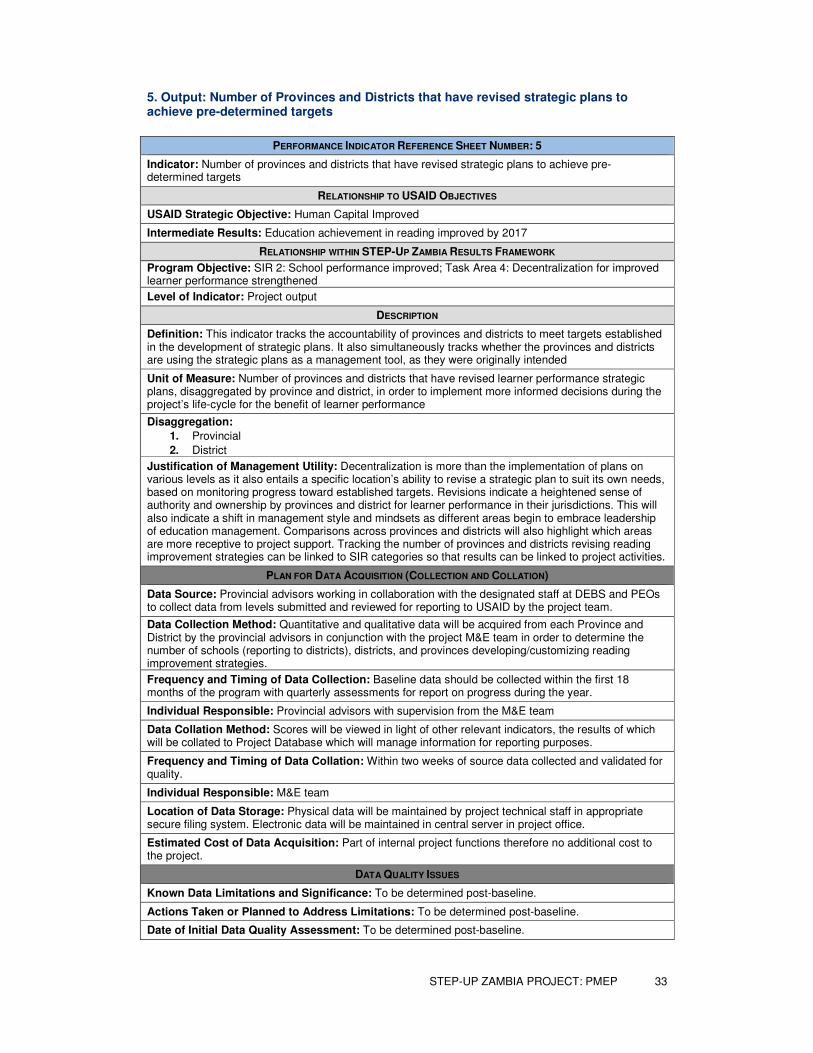
5. Output: Number of Provinces and Districts that have revised strategic plans to achieve pre-determined targets
PERFORMANCE INDICATOR REFERENCE SHEET NUMBER: 5
Indicator: Number of provinces and districts that have revised strategic plans to achieve pre-determined targets
RELATIONSHIP TO USAID OBJECTIVES
USAID Strategic Objective: Human Capital Improved
Intermediate Results: Education achievement in reading improved by 2017
RELATIONSHIP WITHIN STEP-UP ZAMBIA RESULTS FRAMEWORK
Program Objective: SIR 2: School performance improved; Task Area 4: Decentralization for improved learner performance strengthened
Level of Indicator: Project output
DESCRIPTION
Definition: This indicator tracks the accountability of provinces and districts to meet targets established in the development of strategic plans. It also simultaneously tracks whether the provinces and districts are using the strategic plans as a management tool, as they were originally intended
Unit of Measure: Number of provinces and districts that have revised learner performance strategic plans, disaggregated by province and district, in order to implement more informed decisions during the project’s life-cycle for the benefit of learner performance
Disaggregation:
1. Provincial
2. District
Justification of Management Utility: Decentralization is more than the implementation of plans on various levels as it also entails a specific location’s ability to revise a strategic plan to suit its own needs, based on monitoring progress toward established targets. Revisions indicate a heightened sense of authority and ownership by provinces and district for learner performance in their jurisdictions. This will also indicate a shift in management style and mindsets as different areas begin to embrace leadership of education management. Comparisons across provinces and districts will also highlight which areas are more receptive to project support. Tracking the number of provinces and districts revising reading improvement strategies can be linked to SIR categories so that results can be linked to project activities.
PLAN FOR DATA ACQUISITION (COLLECTION AND COLLATION)
Data Source: Provincial advisors working in collaboration with the designated staff at DEBS and PEOs to collect data from levels submitted and reviewed for reporting to USAID by the project team.
Data Collection Method: Quantitative and qualitative data will be acquired from each Province and District by the provincial advisors in conjunction with the project M&E team in order to determine the number of schools (reporting to districts), districts, and provinces developing/customizing reading improvement strategies.
Frequency and Timing of Data Collection: Baseline data should be collected within the first 18 months of the program with quarterly assessments for report on progress during the year.
Individual Responsible: Provincial advisors with supervision from the M&E team
Data Collation Method: Scores will be viewed in light of other relevant indicators, the results of which will be collated to Project Database which will manage information for reporting purposes.
Frequency and Timing of Data Collation: Within two weeks of source data collected and validated for quality.
Individual Responsible: M&E team
Location of Data Storage: Physical data will be maintained by project technical staff in appropriate secure filing system. Electronic data will be maintained in central server in project office.
Estimated Cost of Data Acquisition: Part of internal project functions therefore no additional cost to the project.
DATA QUALITY ISSUES
Known Data Limitations and Significance: To be determined post-baseline.
Actions Taken or Planned to Address Limitations: To be determined post-baseline.
Date of Initial Data Quality Assessment: To be determined post-baseline.
STEP-UP ZAMBIA PROJECT: PMEP 34
PERFORMANCE INDICATOR REFERENCE SHEET NUMBER: 5
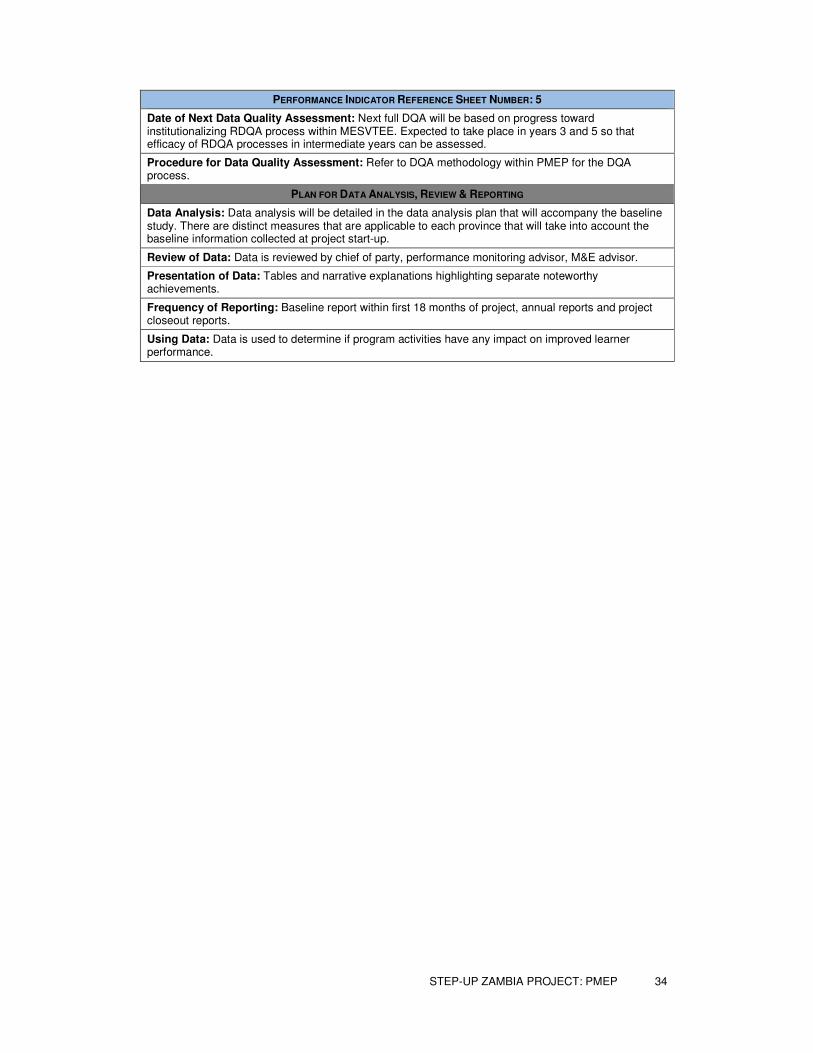
Date of Next Data Quality Assessment: Next full DQA will be based on progress toward institutionalizing RDQA process within MESVTEE. Expected to take place in years 3 and 5 so that efficacy of RDQA processes in intermediate years can be assessed.
Procedure for Data Quality Assessment: Refer to DQA methodology within PMEP for the DQA process.
PLAN FOR DATA ANALYSIS, REVIEW & REPORTING
Data Analysis: Data analysis will be detailed in the data analysis plan that will accompany the baseline study. There are distinct measures that are applicable to each province that will take into account the baseline information collected at project start-up.
Review of Data: Data is reviewed by chief of party, performance monitoring advisor, M&E advisor.
Presentation of Data: Tables and narrative explanations highlighting separate noteworthy achievements.
Frequency of Reporting: Baseline report within first 18 months of project, annual reports and project closeout reports.
Using Data: Data is used to determine if program activities have any impact on improved learner performance.
STEP-UP ZAMBIA PROJECT: PMEP 35
PERFORMANCE INDICATOR REFERENCE SHEET NUMBER: 5
BASELINES AND TARGETS
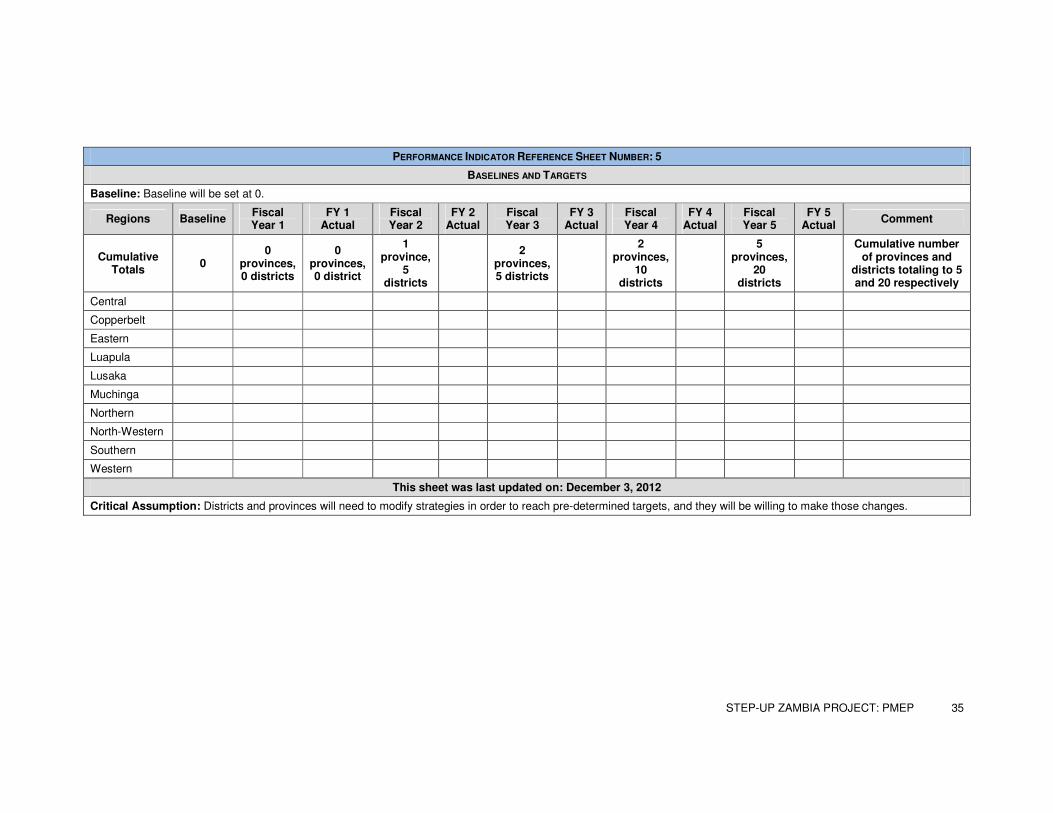
Baseline: Baseline will be set at 0.
Regions Baseline Fiscal Year 1
FY 1 Actual
Fiscal Year 2
FY 2 Actual
Fiscal Year 3
FY 3 Actual
Fiscal Year 4
FY 4 Actual
Fiscal Year 5
FY 5 Actual
Comment
Cumulative Totals
0 0
provinces, 0 districts
0 provinces, 0 district
1 province,
5 districts
2
provinces, 5 districts
2 provinces,
10 districts
5 provinces,
20 districts
Cumulative number of provinces and
districts totaling to 5 and 20 respectively
Central
Copperbelt
Eastern
Luapula
Lusaka
Muchinga
Northern
North-Western
Southern
Western
This sheet was last updated on: December 3, 2012
Critical Assumption: Districts and provinces will need to modify strategies in order to reach pre-determined targets, and they will be willing to make those changes.
STEP-UP ZAMBIA PROJECT: PMEP 36
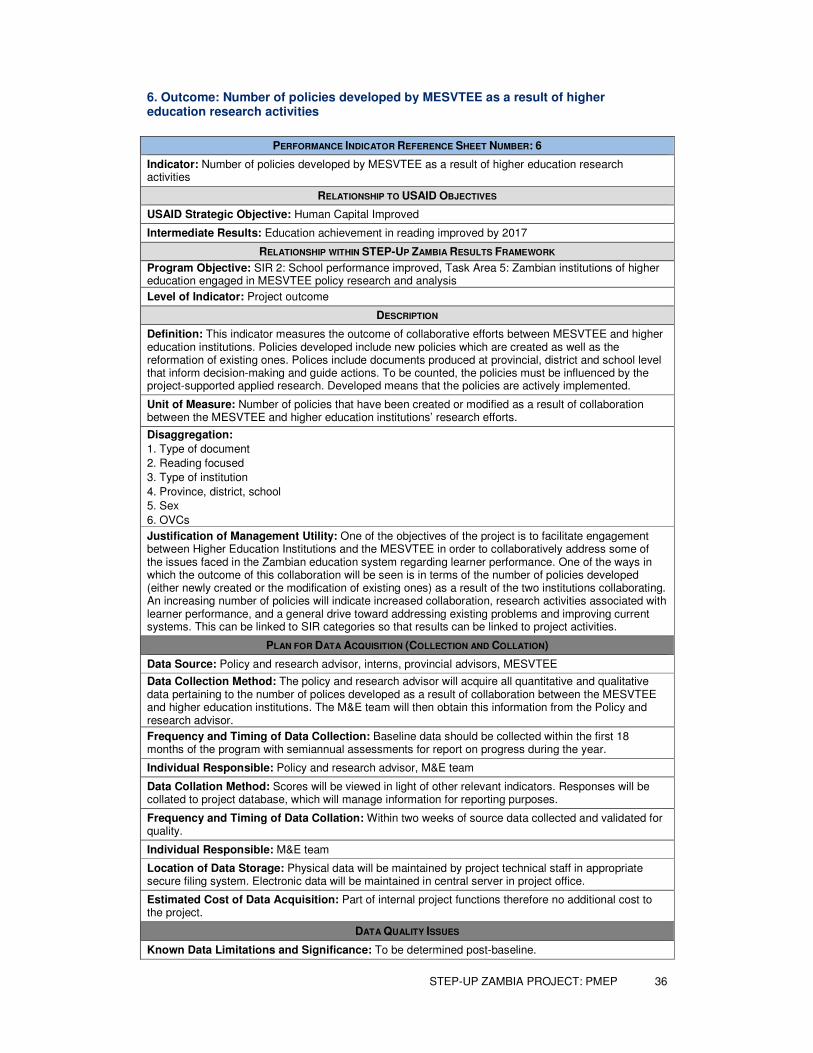
6. Outcome: Number of policies developed by MESVTEE as a result of higher education research activities
PERFORMANCE INDICATOR REFERENCE SHEET NUMBER: 6
Indicator: Number of policies developed by MESVTEE as a result of higher education research activities
RELATIONSHIP TO USAID OBJECTIVES
USAID Strategic Objective: Human Capital Improved
Intermediate Results: Education achievement in reading improved by 2017
RELATIONSHIP WITHIN STEP-UP ZAMBIA RESULTS FRAMEWORK
Program Objective: SIR 2: School performance improved, Task Area 5: Zambian institutions of higher education engaged in MESVTEE policy research and analysis
Level of Indicator: Project outcome
DESCRIPTION
Definition: This indicator measures the outcome of collaborative efforts between MESVTEE and higher education institutions. Policies developed include new policies which are created as well as the reformation of existing ones. Polices include documents produced at provincial, district and school level that inform decision-making and guide actions. To be counted, the policies must be influenced by the project-supported applied research. Developed means that the policies are actively implemented.
Unit of Measure: Number of policies that have been created or modified as a result of collaboration between the MESVTEE and higher education institutions’ research efforts.
Disaggregation:
1. Type of document
2. Reading focused
3. Type of institution
4. Province, district, school
5. Sex
6. OVCs
Justification of Management Utility: One of the objectives of the project is to facilitate engagement between Higher Education Institutions and the MESVTEE in order to collaboratively address some of the issues faced in the Zambian education system regarding learner performance. One of the ways in which the outcome of this collaboration will be seen is in terms of the number of policies developed (either newly created or the modification of existing ones) as a result of the two institutions collaborating. An increasing number of policies will indicate increased collaboration, research activities associated with learner performance, and a general drive toward addressing existing problems and improving current systems. This can be linked to SIR categories so that results can be linked to project activities.
PLAN FOR DATA ACQUISITION (COLLECTION AND COLLATION)
Data Source: Policy and research advisor, interns, provincial advisors, MESVTEE
Data Collection Method: The policy and research advisor will acquire all quantitative and qualitative data pertaining to the number of polices developed as a result of collaboration between the MESVTEE and higher education institutions. The M&E team will then obtain this information from the Policy and research advisor.
Frequency and Timing of Data Collection: Baseline data should be collected within the first 18 months of the program with semiannual assessments for report on progress during the year.
Individual Responsible: Policy and research advisor, M&E team
Data Collation Method: Scores will be viewed in light of other relevant indicators. Responses will be collated to project database, which will manage information for reporting purposes.
Frequency and Timing of Data Collation: Within two weeks of source data collected and validated for quality.
Individual Responsible: M&E team
Location of Data Storage: Physical data will be maintained by project technical staff in appropriate secure filing system. Electronic data will be maintained in central server in project office.
Estimated Cost of Data Acquisition: Part of internal project functions therefore no additional cost to the project.
DATA QUALITY ISSUES
Known Data Limitations and Significance: To be determined post-baseline.
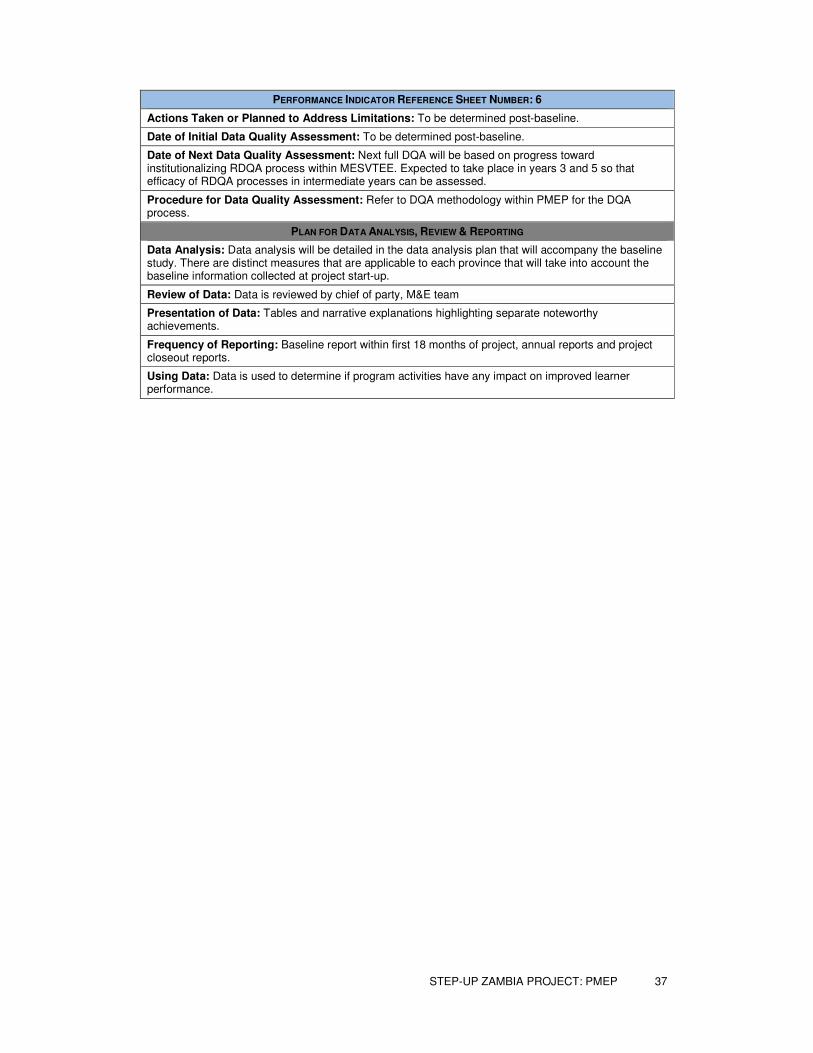
STEP-UP ZAMBIA PROJECT: PMEP 37
PERFORMANCE INDICATOR REFERENCE SHEET NUMBER: 6
Actions Taken or Planned to Address Limitations: To be determined post-baseline.
Date of Initial Data Quality Assessment: To be determined post-baseline.
Date of Next Data Quality Assessment: Next full DQA will be based on progress toward institutionalizing RDQA process within MESVTEE. Expected to take place in years 3 and 5 so that efficacy of RDQA processes in intermediate years can be assessed.
Procedure for Data Quality Assessment: Refer to DQA methodology within PMEP for the DQA process.
PLAN FOR DATA ANALYSIS, REVIEW & REPORTING
Data Analysis: Data analysis will be detailed in the data analysis plan that will accompany the baseline study. There are distinct measures that are applicable to each province that will take into account the baseline information collected at project start-up.
Review of Data: Data is reviewed by chief of party, M&E team
Presentation of Data: Tables and narrative explanations highlighting separate noteworthy achievements.
Frequency of Reporting: Baseline report within first 18 months of project, annual reports and project closeout reports.
Using Data: Data is used to determine if program activities have any impact on improved learner performance.
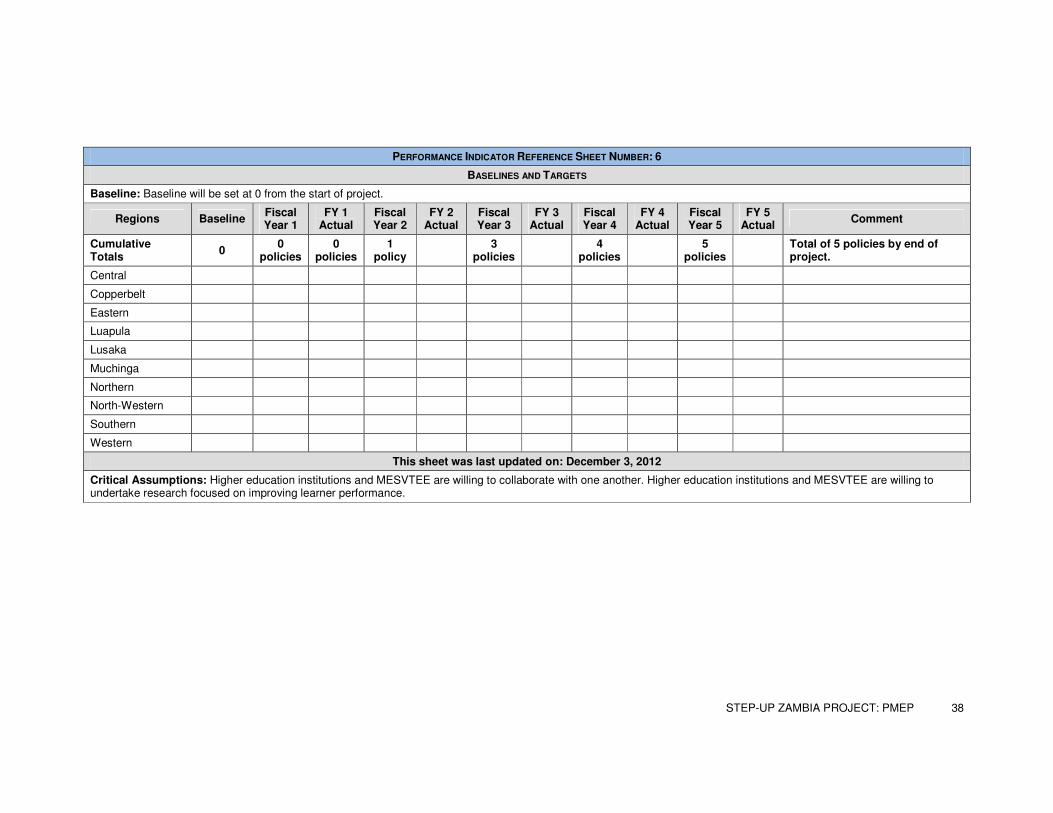
STEP-UP ZAMBIA PROJECT: PMEP 38
PERFORMANCE INDICATOR REFERENCE SHEET NUMBER: 6
BASELINES AND TARGETS
Baseline: Baseline will be set at 0 from the start of project.
Regions Baseline Fiscal Year 1
FY 1 Actual
Fiscal Year 2
FY 2 Actual
Fiscal Year 3
FY 3 Actual
Fiscal Year 4
FY 4 Actual
Fiscal Year 5
FY 5 Actual
Comment
Cumulative Totals
0 0
policies 0
policies 1
policy
3 policies
4
policies
5 policies
Total of 5 policies by end of project.
Central
Copperbelt
Eastern
Luapula
Lusaka
Muchinga
Northern
North-Western
Southern
Western
This sheet was last updated on: December 3, 2012
Critical Assumptions: Higher education institutions and MESVTEE are willing to collaborate with one another. Higher education institutions and MESVTEE are willing to undertake research focused on improving learner performance.
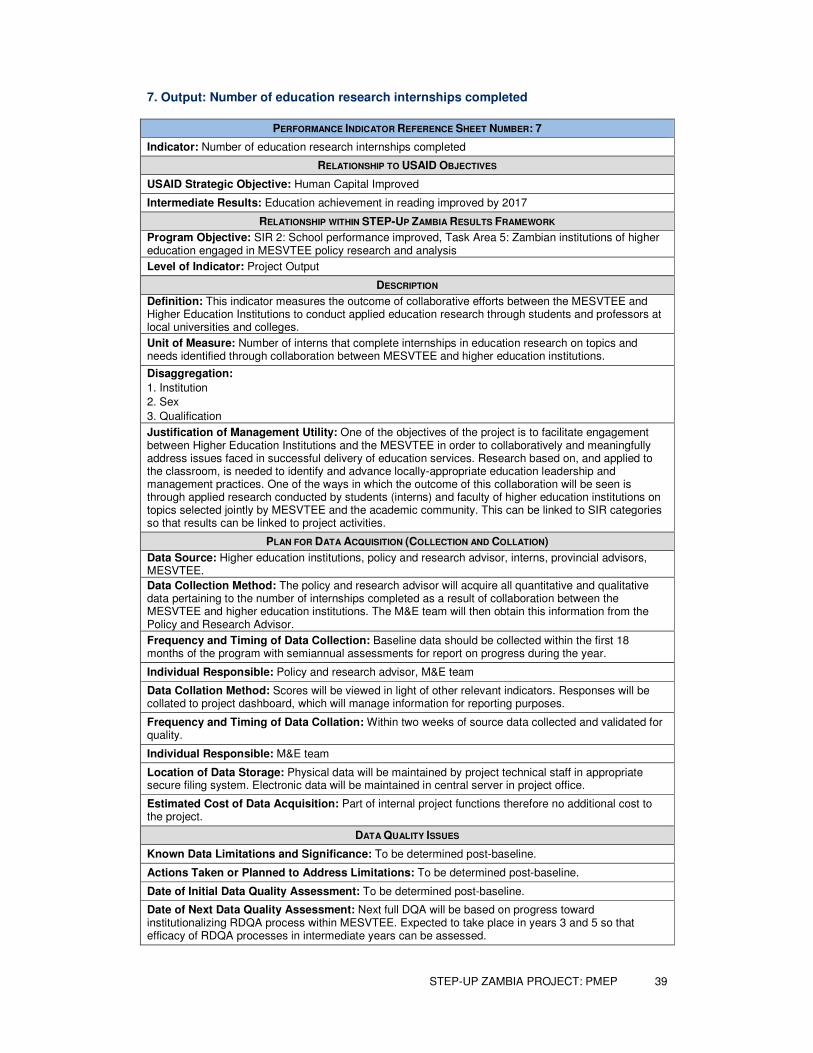
STEP-UP ZAMBIA PROJECT: PMEP 39
7. Output: Number of education research internships completed
PERFORMANCE INDICATOR REFERENCE SHEET NUMBER: 7
Indicator: Number of education research internships completed
RELATIONSHIP TO USAID OBJECTIVES
USAID Strategic Objective: Human Capital Improved
Intermediate Results: Education achievement in reading improved by 2017
RELATIONSHIP WITHIN STEP-UP ZAMBIA RESULTS FRAMEWORK
Program Objective: SIR 2: School performance improved, Task Area 5: Zambian institutions of higher education engaged in MESVTEE policy research and analysis
Level of Indicator: Project Output
DESCRIPTION
Definition: This indicator measures the outcome of collaborative efforts between the MESVTEE and Higher Education Institutions to conduct applied education research through students and professors at local universities and colleges.
Unit of Measure: Number of interns that complete internships in education research on topics and needs identified through collaboration between MESVTEE and higher education institutions.
Disaggregation:
1. Institution
2. Sex
3. Qualification
Justification of Management Utility: One of the objectives of the project is to facilitate engagement between Higher Education Institutions and the MESVTEE in order to collaboratively and meaningfully address issues faced in successful delivery of education services. Research based on, and applied to the classroom, is needed to identify and advance locally-appropriate education leadership and management practices. One of the ways in which the outcome of this collaboration will be seen is through applied research conducted by students (interns) and faculty of higher education institutions on topics selected jointly by MESVTEE and the academic community. This can be linked to SIR categories so that results can be linked to project activities.
PLAN FOR DATA ACQUISITION (COLLECTION AND COLLATION)
Data Source: Higher education institutions, policy and research advisor, interns, provincial advisors, MESVTEE.
Data Collection Method: The policy and research advisor will acquire all quantitative and qualitative data pertaining to the number of internships completed as a result of collaboration between the MESVTEE and higher education institutions. The M&E team will then obtain this information from the Policy and Research Advisor.
Frequency and Timing of Data Collection: Baseline data should be collected within the first 18 months of the program with semiannual assessments for report on progress during the year.
Individual Responsible: Policy and research advisor, M&E team
Data Collation Method: Scores will be viewed in light of other relevant indicators. Responses will be collated to project dashboard, which will manage information for reporting purposes.
Frequency and Timing of Data Collation: Within two weeks of source data collected and validated for quality.
Individual Responsible: M&E team
Location of Data Storage: Physical data will be maintained by project technical staff in appropriate secure filing system. Electronic data will be maintained in central server in project office.
Estimated Cost of Data Acquisition: Part of internal project functions therefore no additional cost to the project.
DATA QUALITY ISSUES
Known Data Limitations and Significance: To be determined post-baseline.
Actions Taken or Planned to Address Limitations: To be determined post-baseline.
Date of Initial Data Quality Assessment: To be determined post-baseline.
Date of Next Data Quality Assessment: Next full DQA will be based on progress toward institutionalizing RDQA process within MESVTEE. Expected to take place in years 3 and 5 so that efficacy of RDQA processes in intermediate years can be assessed.

STEP-UP ZAMBIA PROJECT: PMEP 40
PERFORMANCE INDICATOR REFERENCE SHEET NUMBER: 7
Procedure for Data Quality Assessment: Refer to DQA methodology within PMEP for the DQA process.
PLAN FOR DATA ANALYSIS, REVIEW & REPORTING
Data Analysis: Data analysis will be detailed in the data analysis plan that will accompany the baseline study. There are distinct measures that are applicable to each province that will take into account the baseline information collected at project start-up.
Review of Data: Data is reviewed by chief of party, M&E team
Presentation of Data: Tables and narrative explanations highlighting separate noteworthy achievements.
Frequency of Reporting: Baseline report within first 18 months of project, annual reports and project closeout reports.
Using Data: Data is used to determine if program activities have any impact on improved learner performance.
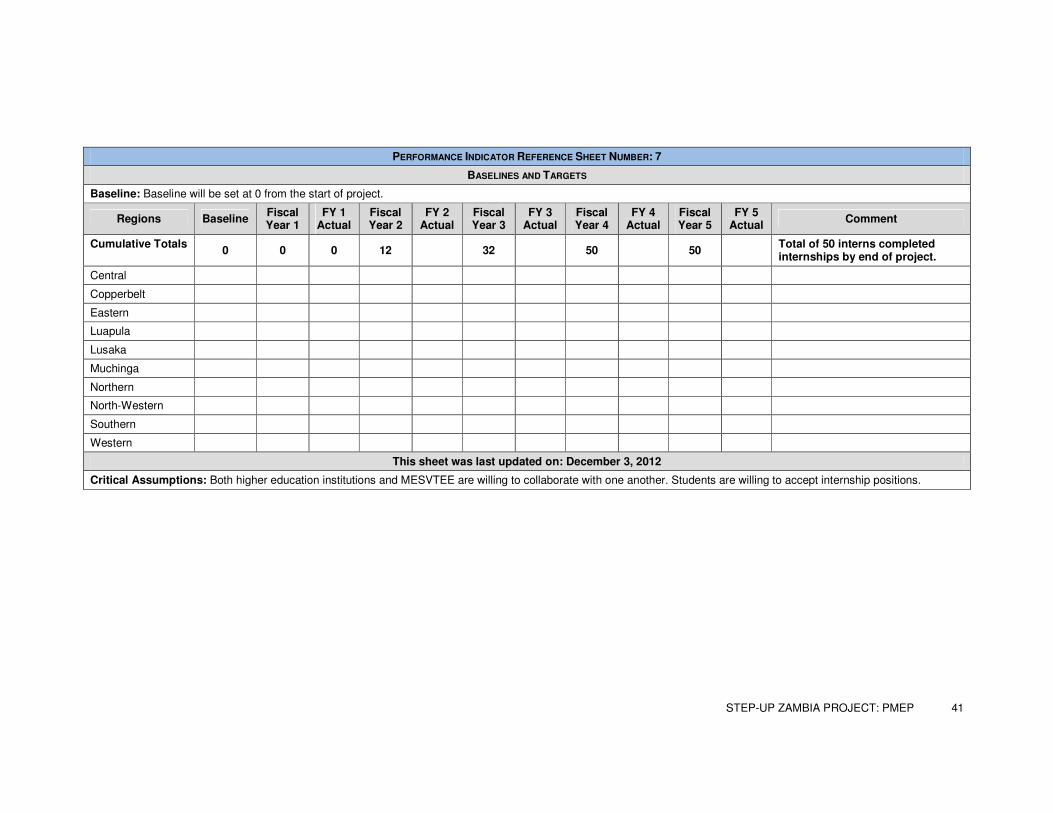
STEP-UP ZAMBIA PROJECT: PMEP 41
PERFORMANCE INDICATOR REFERENCE SHEET NUMBER: 7
BASELINES AND TARGETS
Baseline: Baseline will be set at 0 from the start of project.
Regions Baseline Fiscal Year 1
FY 1 Actual
Fiscal Year 2
FY 2 Actual
Fiscal Year 3
FY 3 Actual
Fiscal Year 4
FY 4 Actual
Fiscal Year 5
FY 5 Actual
Comment
Cumulative Totals 0 0 0 12 32 50 50
Total of 50 interns completed internships by end of project.
Central
Copperbelt
Eastern
Luapula
Lusaka
Muchinga
Northern
North-Western
Southern
Western
This sheet was last updated on: December 3, 2012
Critical Assumptions: Both higher education institutions and MESVTEE are willing to collaborate with one another. Students are willing to accept internship positions.
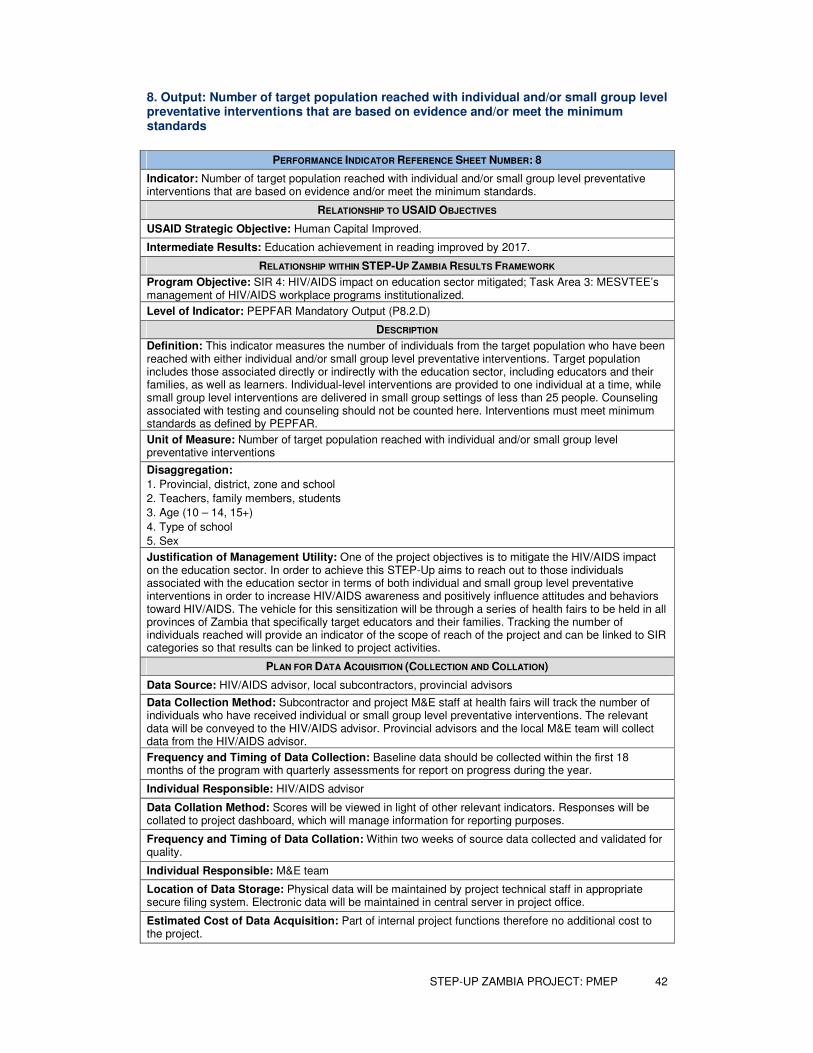
STEP-UP ZAMBIA PROJECT: PMEP 42
8. Output: Number of target population reached with individual and/or small group level preventative interventions that are based on evidence and/or meet the minimum standards
PERFORMANCE INDICATOR REFERENCE SHEET NUMBER: 8
Indicator: Number of target population reached with individual and/or small group level preventative interventions that are based on evidence and/or meet the minimum standards.
RELATIONSHIP TO USAID OBJECTIVES
USAID Strategic Objective: Human Capital Improved.
Intermediate Results: Education achievement in reading improved by 2017.
RELATIONSHIP WITHIN STEP-UP ZAMBIA RESULTS FRAMEWORK
Program Objective: SIR 4: HIV/AIDS impact on education sector mitigated; Task Area 3: MESVTEE’s management of HIV/AIDS workplace programs institutionalized.
Level of Indicator: PEPFAR Mandatory Output (P8.2.D)
DESCRIPTION
Definition: This indicator measures the number of individuals from the target population who have been reached with either individual and/or small group level preventative interventions. Target population includes those associated directly or indirectly with the education sector, including educators and their families, as well as learners. Individual-level interventions are provided to one individual at a time, while small group level interventions are delivered in small group settings of less than 25 people. Counseling associated with testing and counseling should not be counted here. Interventions must meet minimum standards as defined by PEPFAR.
Unit of Measure: Number of target population reached with individual and/or small group level preventative interventions
Disaggregation:
1. Provincial, district, zone and school
2. Teachers, family members, students
3. Age (10 – 14, 15+)
4. Type of school
5. Sex
Justification of Management Utility: One of the project objectives is to mitigate the HIV/AIDS impact on the education sector. In order to achieve this STEP-Up aims to reach out to those individuals associated with the education sector in terms of both individual and small group level preventative interventions in order to increase HIV/AIDS awareness and positively influence attitudes and behaviors toward HIV/AIDS. The vehicle for this sensitization will be through a series of health fairs to be held in all provinces of Zambia that specifically target educators and their families. Tracking the number of individuals reached will provide an indicator of the scope of reach of the project and can be linked to SIR categories so that results can be linked to project activities.
PLAN FOR DATA ACQUISITION (COLLECTION AND COLLATION)
Data Source: HIV/AIDS advisor, local subcontractors, provincial advisors
Data Collection Method: Subcontractor and project M&E staff at health fairs will track the number of individuals who have received individual or small group level preventative interventions. The relevant data will be conveyed to the HIV/AIDS advisor. Provincial advisors and the local M&E team will collect data from the HIV/AIDS advisor.
Frequency and Timing of Data Collection: Baseline data should be collected within the first 18 months of the program with quarterly assessments for report on progress during the year.
Individual Responsible: HIV/AIDS advisor
Data Collation Method: Scores will be viewed in light of other relevant indicators. Responses will be collated to project dashboard, which will manage information for reporting purposes.
Frequency and Timing of Data Collation: Within two weeks of source data collected and validated for quality.
Individual Responsible: M&E team
Location of Data Storage: Physical data will be maintained by project technical staff in appropriate secure filing system. Electronic data will be maintained in central server in project office.
Estimated Cost of Data Acquisition: Part of internal project functions therefore no additional cost to the project.
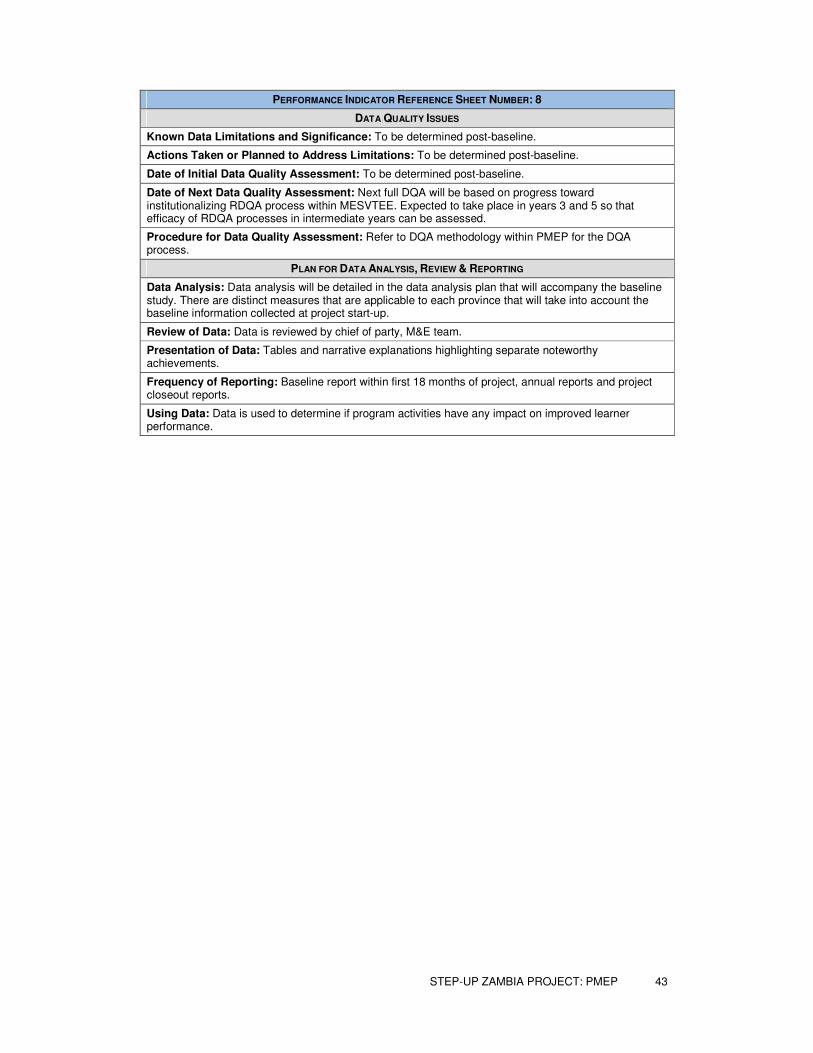
STEP-UP ZAMBIA PROJECT: PMEP 43
PERFORMANCE INDICATOR REFERENCE SHEET NUMBER: 8
DATA QUALITY ISSUES
Known Data Limitations and Significance: To be determined post-baseline.
Actions Taken or Planned to Address Limitations: To be determined post-baseline.
Date of Initial Data Quality Assessment: To be determined post-baseline.
Date of Next Data Quality Assessment: Next full DQA will be based on progress toward institutionalizing RDQA process within MESVTEE. Expected to take place in years 3 and 5 so that efficacy of RDQA processes in intermediate years can be assessed.
Procedure for Data Quality Assessment: Refer to DQA methodology within PMEP for the DQA process.
PLAN FOR DATA ANALYSIS, REVIEW & REPORTING
Data Analysis: Data analysis will be detailed in the data analysis plan that will accompany the baseline study. There are distinct measures that are applicable to each province that will take into account the baseline information collected at project start-up.
Review of Data: Data is reviewed by chief of party, M&E team.
Presentation of Data: Tables and narrative explanations highlighting separate noteworthy achievements.
Frequency of Reporting: Baseline report within first 18 months of project, annual reports and project closeout reports.
Using Data: Data is used to determine if program activities have any impact on improved learner performance.
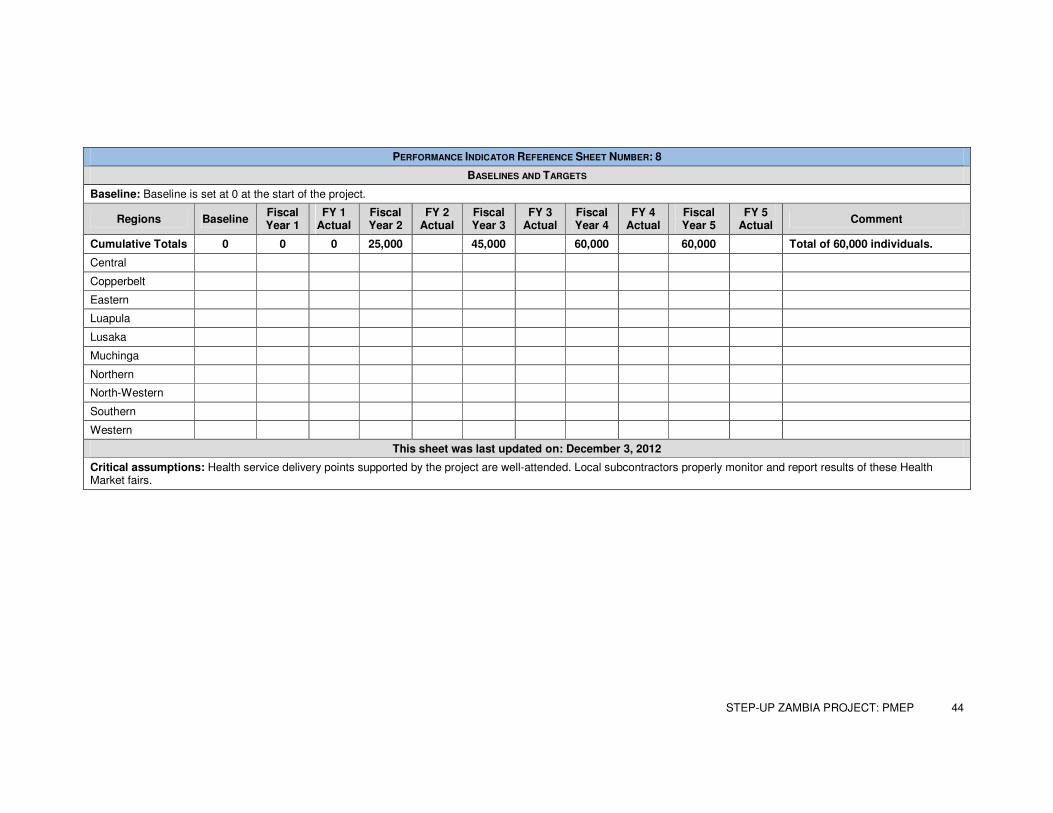
STEP-UP ZAMBIA PROJECT: PMEP 44
PERFORMANCE INDICATOR REFERENCE SHEET NUMBER: 8
BASELINES AND TARGETS
Baseline: Baseline is set at 0 at the start of the project.
Regions Baseline Fiscal Year 1
FY 1 Actual
Fiscal Year 2
FY 2 Actual
Fiscal Year 3
FY 3 Actual
Fiscal Year 4
FY 4 Actual
Fiscal Year 5
FY 5 Actual
Comment
Cumulative Totals 0 0 0 25,000 45,000 60,000 60,000 Total of 60,000 individuals.
Central
Copperbelt
Eastern
Luapula
Lusaka
Muchinga
Northern
North-Western
Southern
Western
This sheet was last updated on: December 3, 2012
Critical assumptions: Health service delivery points supported by the project are well-attended. Local subcontractors properly monitor and report results of these Health Market fairs.
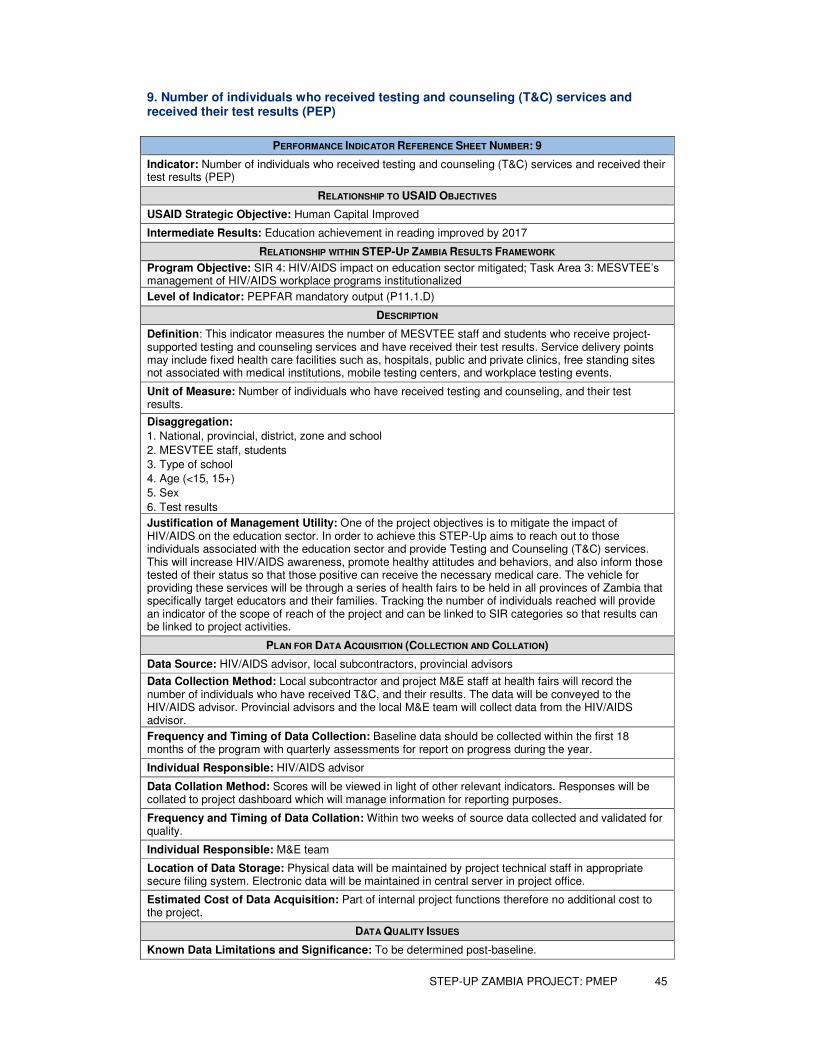
STEP-UP ZAMBIA PROJECT: PMEP 45
9. Number of individuals who received testing and counseling (T&C) services and received their test results (PEP)
PERFORMANCE INDICATOR REFERENCE SHEET NUMBER: 9
Indicator: Number of individuals who received testing and counseling (T&C) services and received their test results (PEP)
RELATIONSHIP TO USAID OBJECTIVES
USAID Strategic Objective: Human Capital Improved
Intermediate Results: Education achievement in reading improved by 2017
RELATIONSHIP WITHIN STEP-UP ZAMBIA RESULTS FRAMEWORK
Program Objective: SIR 4: HIV/AIDS impact on education sector mitigated; Task Area 3: MESVTEE’s management of HIV/AIDS workplace programs institutionalized
Level of Indicator: PEPFAR mandatory output (P11.1.D)
DESCRIPTION
Definition: This indicator measures the number of MESVTEE staff and students who receive project-supported testing and counseling services and have received their test results. Service delivery points may include fixed health care facilities such as, hospitals, public and private clinics, free standing sites not associated with medical institutions, mobile testing centers, and workplace testing events.
Unit of Measure: Number of individuals who have received testing and counseling, and their test results.
Disaggregation:
1. National, provincial, district, zone and school
2. MESVTEE staff, students
3. Type of school
4. Age (<15, 15+)
5. Sex
6. Test results
Justification of Management Utility: One of the project objectives is to mitigate the impact of HIV/AIDS on the education sector. In order to achieve this STEP-Up aims to reach out to those individuals associated with the education sector and provide Testing and Counseling (T&C) services. This will increase HIV/AIDS awareness, promote healthy attitudes and behaviors, and also inform those tested of their status so that those positive can receive the necessary medical care. The vehicle for providing these services will be through a series of health fairs to be held in all provinces of Zambia that specifically target educators and their families. Tracking the number of individuals reached will provide an indicator of the scope of reach of the project and can be linked to SIR categories so that results can be linked to project activities.
PLAN FOR DATA ACQUISITION (COLLECTION AND COLLATION)
Data Source: HIV/AIDS advisor, local subcontractors, provincial advisors
Data Collection Method: Local subcontractor and project M&E staff at health fairs will record the number of individuals who have received T&C, and their results. The data will be conveyed to the HIV/AIDS advisor. Provincial advisors and the local M&E team will collect data from the HIV/AIDS advisor.
Frequency and Timing of Data Collection: Baseline data should be collected within the first 18 months of the program with quarterly assessments for report on progress during the year.
Individual Responsible: HIV/AIDS advisor
Data Collation Method: Scores will be viewed in light of other relevant indicators. Responses will be collated to project dashboard which will manage information for reporting purposes.
Frequency and Timing of Data Collation: Within two weeks of source data collected and validated for quality.
Individual Responsible: M&E team
Location of Data Storage: Physical data will be maintained by project technical staff in appropriate secure filing system. Electronic data will be maintained in central server in project office.
Estimated Cost of Data Acquisition: Part of internal project functions therefore no additional cost to the project.
DATA QUALITY ISSUES
Known Data Limitations and Significance: To be determined post-baseline.
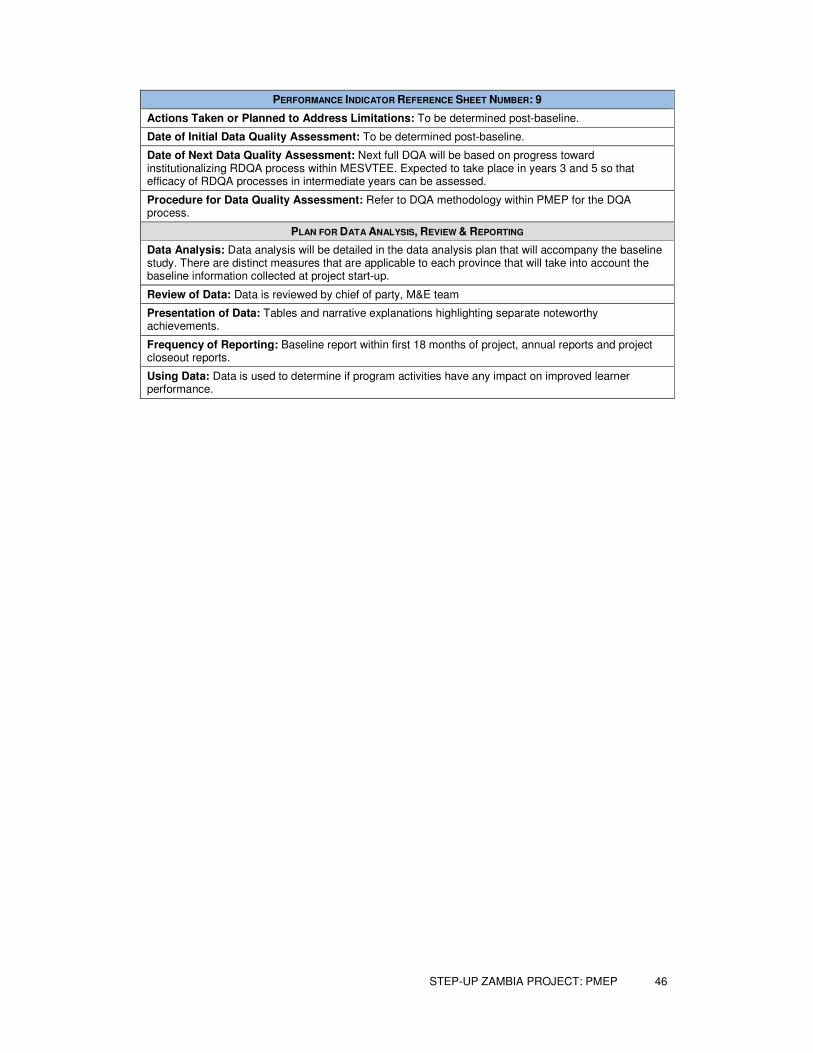
STEP-UP ZAMBIA PROJECT: PMEP 46
PERFORMANCE INDICATOR REFERENCE SHEET NUMBER: 9
Actions Taken or Planned to Address Limitations: To be determined post-baseline.
Date of Initial Data Quality Assessment: To be determined post-baseline.
Date of Next Data Quality Assessment: Next full DQA will be based on progress toward institutionalizing RDQA process within MESVTEE. Expected to take place in years 3 and 5 so that efficacy of RDQA processes in intermediate years can be assessed.
Procedure for Data Quality Assessment: Refer to DQA methodology within PMEP for the DQA process.
PLAN FOR DATA ANALYSIS, REVIEW & REPORTING
Data Analysis: Data analysis will be detailed in the data analysis plan that will accompany the baseline study. There are distinct measures that are applicable to each province that will take into account the baseline information collected at project start-up.
Review of Data: Data is reviewed by chief of party, M&E team
Presentation of Data: Tables and narrative explanations highlighting separate noteworthy achievements.
Frequency of Reporting: Baseline report within first 18 months of project, annual reports and project closeout reports.
Using Data: Data is used to determine if program activities have any impact on improved learner performance.
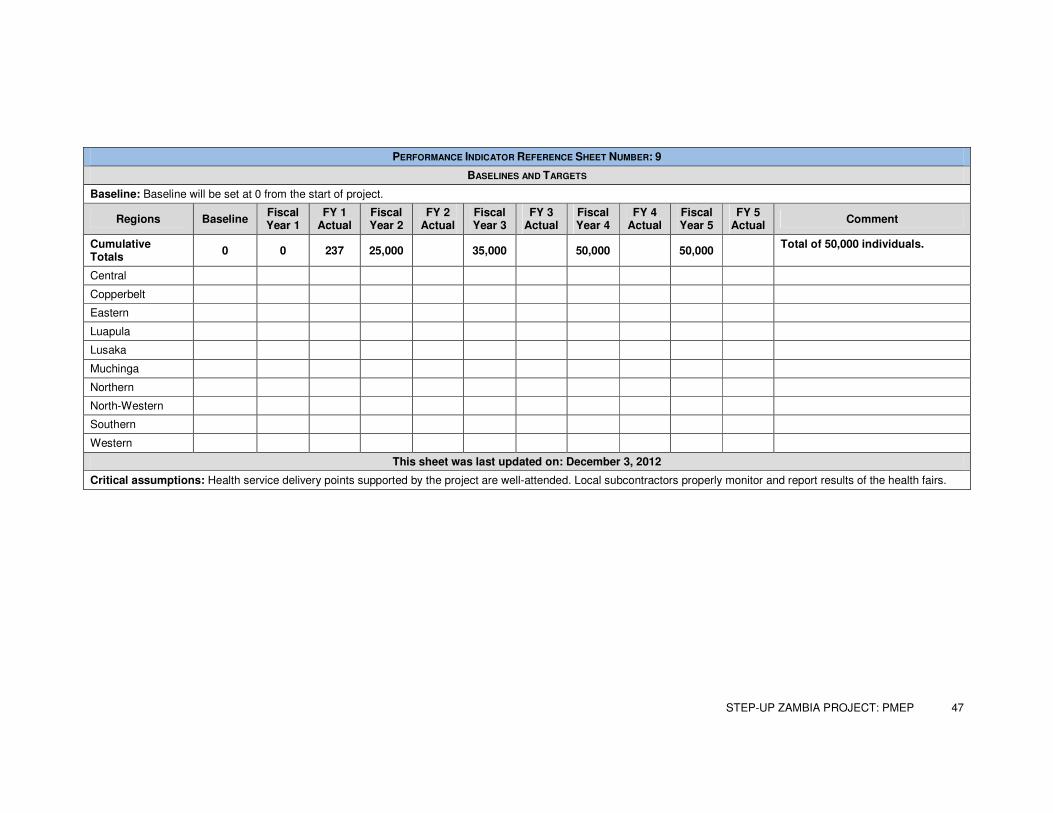
STEP-UP ZAMBIA PROJECT: PMEP 47
PERFORMANCE INDICATOR REFERENCE SHEET NUMBER: 9
BASELINES AND TARGETS
Baseline: Baseline will be set at 0 from the start of project.
Regions Baseline Fiscal Year 1
FY 1 Actual
Fiscal Year 2
FY 2 Actual
Fiscal Year 3
FY 3 Actual
Fiscal Year 4
FY 4 Actual
Fiscal Year 5
FY 5 Actual
Comment
Cumulative Totals
0 0 237 25,000 35,000 50,000 50,000 Total of 50,000 individuals.
Central
Copperbelt
Eastern
Luapula
Lusaka
Muchinga
Northern
North-Western
Southern
Western
This sheet was last updated on: December 3, 2012
Critical assumptions: Health service delivery points supported by the project are well-attended. Local subcontractors properly monitor and report results of the health fairs.
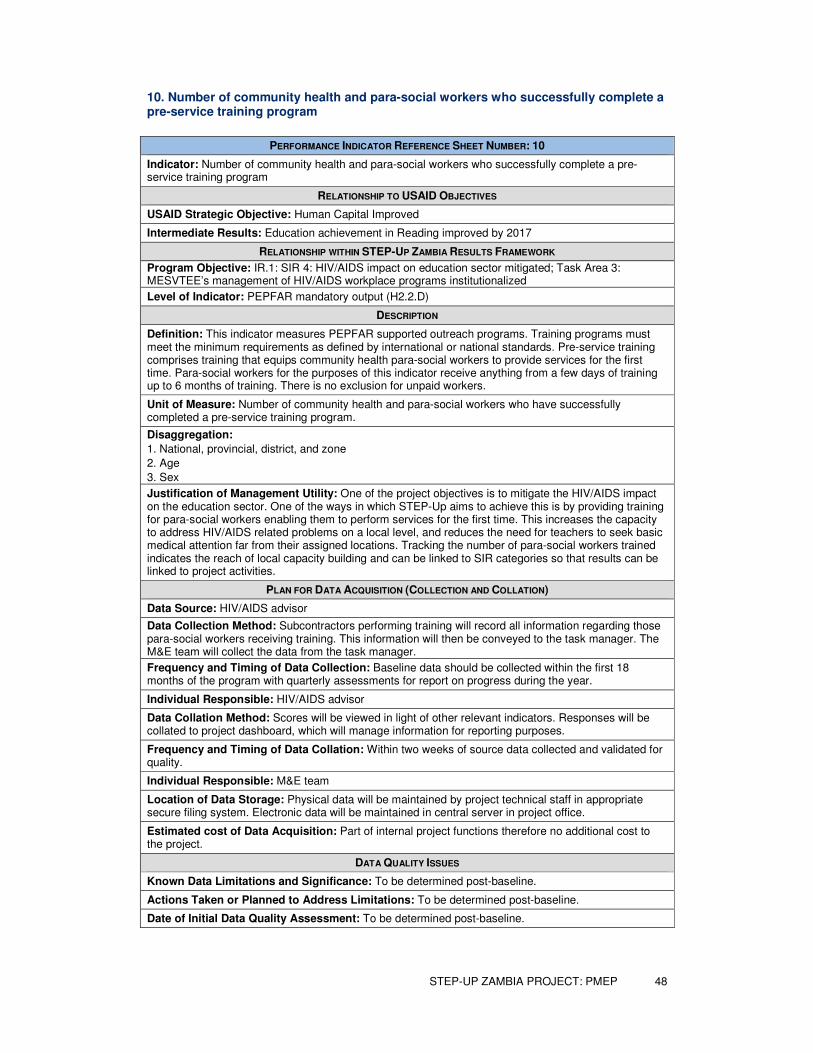
STEP-UP ZAMBIA PROJECT: PMEP 48
10. Number of community health and para-social workers who successfully complete a pre-service training program
PERFORMANCE INDICATOR REFERENCE SHEET NUMBER: 10
Indicator: Number of community health and para-social workers who successfully complete a pre-service training program
RELATIONSHIP TO USAID OBJECTIVES
USAID Strategic Objective: Human Capital Improved
Intermediate Results: Education achievement in Reading improved by 2017
RELATIONSHIP WITHIN STEP-UP ZAMBIA RESULTS FRAMEWORK
Program Objective: IR.1: SIR 4: HIV/AIDS impact on education sector mitigated; Task Area 3: MESVTEE’s management of HIV/AIDS workplace programs institutionalized
Level of Indicator: PEPFAR mandatory output (H2.2.D)
DESCRIPTION
Definition: This indicator measures PEPFAR supported outreach programs. Training programs must meet the minimum requirements as defined by international or national standards. Pre-service training comprises training that equips community health para-social workers to provide services for the first time. Para-social workers for the purposes of this indicator receive anything from a few days of training up to 6 months of training. There is no exclusion for unpaid workers.
Unit of Measure: Number of community health and para-social workers who have successfully completed a pre-service training program.
Disaggregation:
1. National, provincial, district, and zone
2. Age
3. Sex
Justification of Management Utility: One of the project objectives is to mitigate the HIV/AIDS impact on the education sector. One of the ways in which STEP-Up aims to achieve this is by providing training for para-social workers enabling them to perform services for the first time. This increases the capacity to address HIV/AIDS related problems on a local level, and reduces the need for teachers to seek basic medical attention far from their assigned locations. Tracking the number of para-social workers trained indicates the reach of local capacity building and can be linked to SIR categories so that results can be linked to project activities.
PLAN FOR DATA ACQUISITION (COLLECTION AND COLLATION)
Data Source: HIV/AIDS advisor
Data Collection Method: Subcontractors performing training will record all information regarding those para-social workers receiving training. This information will then be conveyed to the task manager. The M&E team will collect the data from the task manager.
Frequency and Timing of Data Collection: Baseline data should be collected within the first 18 months of the program with quarterly assessments for report on progress during the year.
Individual Responsible: HIV/AIDS advisor
Data Collation Method: Scores will be viewed in light of other relevant indicators. Responses will be collated to project dashboard, which will manage information for reporting purposes.
Frequency and Timing of Data Collation: Within two weeks of source data collected and validated for quality.
Individual Responsible: M&E team
Location of Data Storage: Physical data will be maintained by project technical staff in appropriate secure filing system. Electronic data will be maintained in central server in project office.
Estimated cost of Data Acquisition: Part of internal project functions therefore no additional cost to the project.
DATA QUALITY ISSUES
Known Data Limitations and Significance: To be determined post-baseline.
Actions Taken or Planned to Address Limitations: To be determined post-baseline.
Date of Initial Data Quality Assessment: To be determined post-baseline.
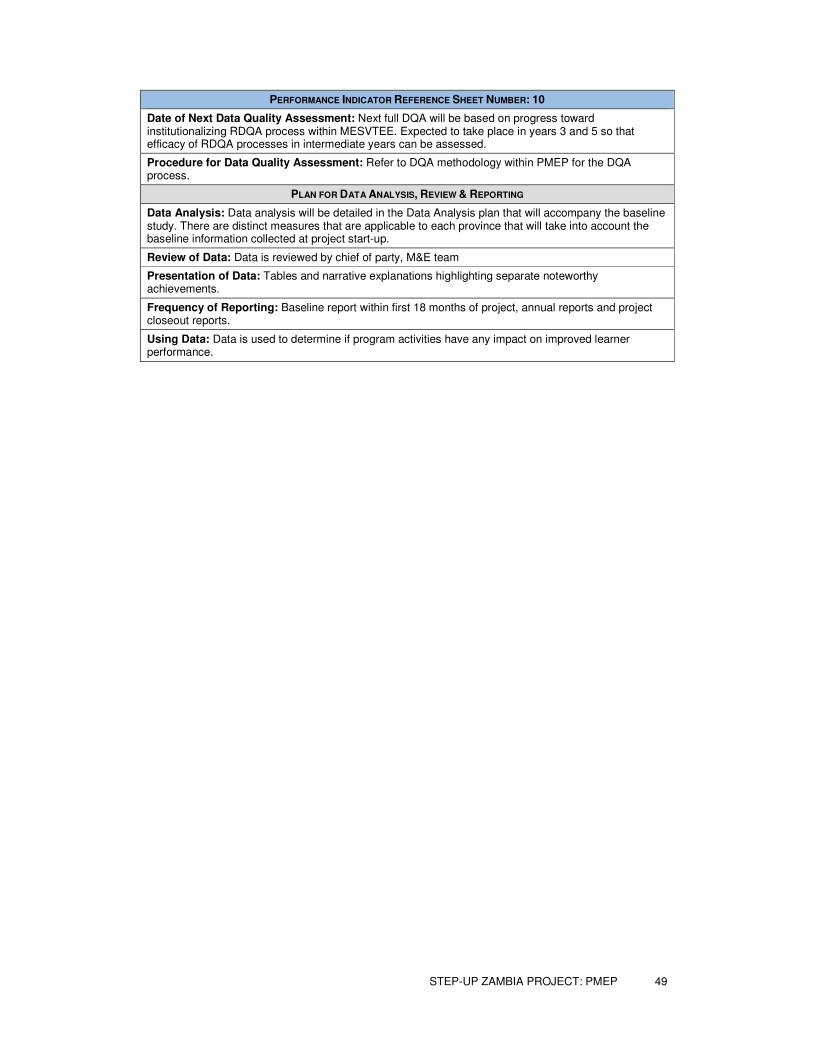
STEP-UP ZAMBIA PROJECT: PMEP 49
PERFORMANCE INDICATOR REFERENCE SHEET NUMBER: 10
Date of Next Data Quality Assessment: Next full DQA will be based on progress toward institutionalizing RDQA process within MESVTEE. Expected to take place in years 3 and 5 so that efficacy of RDQA processes in intermediate years can be assessed.
Procedure for Data Quality Assessment: Refer to DQA methodology within PMEP for the DQA process.
PLAN FOR DATA ANALYSIS, REVIEW & REPORTING
Data Analysis: Data analysis will be detailed in the Data Analysis plan that will accompany the baseline study. There are distinct measures that are applicable to each province that will take into account the baseline information collected at project start-up.
Review of Data: Data is reviewed by chief of party, M&E team
Presentation of Data: Tables and narrative explanations highlighting separate noteworthy achievements.
Frequency of Reporting: Baseline report within first 18 months of project, annual reports and project closeout reports.
Using Data: Data is used to determine if program activities have any impact on improved learner performance.

STEP-UP ZAMBIA PROJECT: PMEP 50
PERFORMANCE INDICATOR REFERENCE SHEET NUMBER: 10
BASELINES AND TARGETS
Baseline: Baseline will be set at 0 from the start of project.
Regions Baseline Fiscal Year 1
FY 1 Actual
Fiscal Year 2
FY 2 Actual
Fiscal Year 3
FY 3 Actual
Fiscal Year 4
FY 4 Actual
Fiscal Year 5
FY 5 Actual
Comment
Cumulative Totals 0 0 0 1,000 1,500 1,750 1,750 Total of 1,750 individuals.
Central
Copperbelt
Eastern
Luapula
Lusaka
Muchinga
Northern
North-Western
Southern
Western
This sheet was last updated on: December 3, 2012
Critical assumptions: Training programs sponsored by the project are well-attended. Local subcontractors properly monitor and report results of the training programs.
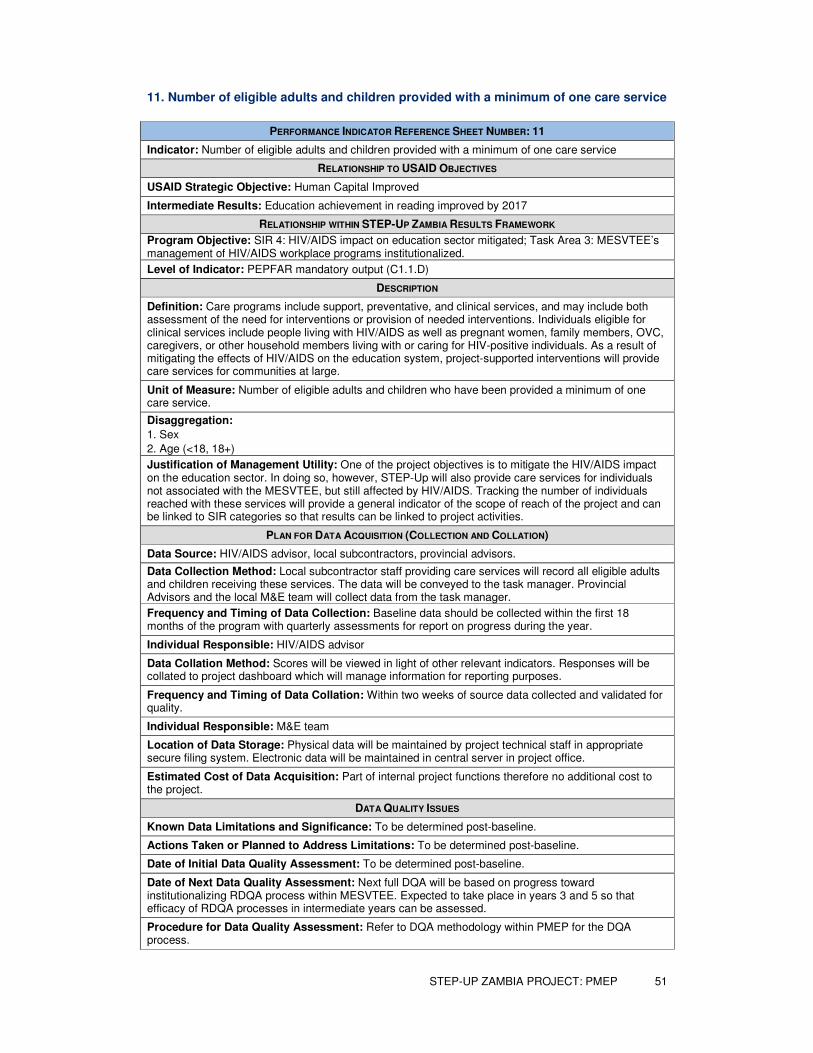
STEP-UP ZAMBIA PROJECT: PMEP 51
11. Number of eligible adults and children provided with a minimum of one care service
PERFORMANCE INDICATOR REFERENCE SHEET NUMBER: 11
Indicator: Number of eligible adults and children provided with a minimum of one care service
RELATIONSHIP TO USAID OBJECTIVES
USAID Strategic Objective: Human Capital Improved
Intermediate Results: Education achievement in reading improved by 2017
RELATIONSHIP WITHIN STEP-UP ZAMBIA RESULTS FRAMEWORK
Program Objective: SIR 4: HIV/AIDS impact on education sector mitigated; Task Area 3: MESVTEE’s management of HIV/AIDS workplace programs institutionalized.
Level of Indicator: PEPFAR mandatory output (C1.1.D)
DESCRIPTION
Definition: Care programs include support, preventative, and clinical services, and may include both assessment of the need for interventions or provision of needed interventions. Individuals eligible for clinical services include people living with HIV/AIDS as well as pregnant women, family members, OVC, caregivers, or other household members living with or caring for HIV-positive individuals. As a result of mitigating the effects of HIV/AIDS on the education system, project-supported interventions will provide care services for communities at large.
Unit of Measure: Number of eligible adults and children who have been provided a minimum of one care service.
Disaggregation:
1. Sex
2. Age (<18, 18+)
Justification of Management Utility: One of the project objectives is to mitigate the HIV/AIDS impact on the education sector. In doing so, however, STEP-Up will also provide care services for individuals not associated with the MESVTEE, but still affected by HIV/AIDS. Tracking the number of individuals reached with these services will provide a general indicator of the scope of reach of the project and can be linked to SIR categories so that results can be linked to project activities.
PLAN FOR DATA ACQUISITION (COLLECTION AND COLLATION)
Data Source: HIV/AIDS advisor, local subcontractors, provincial advisors.
Data Collection Method: Local subcontractor staff providing care services will record all eligible adults and children receiving these services. The data will be conveyed to the task manager. Provincial Advisors and the local M&E team will collect data from the task manager.
Frequency and Timing of Data Collection: Baseline data should be collected within the first 18 months of the program with quarterly assessments for report on progress during the year.
Individual Responsible: HIV/AIDS advisor
Data Collation Method: Scores will be viewed in light of other relevant indicators. Responses will be collated to project dashboard which will manage information for reporting purposes.
Frequency and Timing of Data Collation: Within two weeks of source data collected and validated for quality.
Individual Responsible: M&E team
Location of Data Storage: Physical data will be maintained by project technical staff in appropriate secure filing system. Electronic data will be maintained in central server in project office.
Estimated Cost of Data Acquisition: Part of internal project functions therefore no additional cost to the project.
DATA QUALITY ISSUES
Known Data Limitations and Significance: To be determined post-baseline.
Actions Taken or Planned to Address Limitations: To be determined post-baseline.
Date of Initial Data Quality Assessment: To be determined post-baseline.
Date of Next Data Quality Assessment: Next full DQA will be based on progress toward institutionalizing RDQA process within MESVTEE. Expected to take place in years 3 and 5 so that efficacy of RDQA processes in intermediate years can be assessed.
Procedure for Data Quality Assessment: Refer to DQA methodology within PMEP for the DQA process.
STEP-UP ZAMBIA PROJECT: PMEP 52
PERFORMANCE INDICATOR REFERENCE SHEET NUMBER: 11
PLAN FOR DATA ANALYSIS, REVIEW & REPORTING
Data Analysis: Data analysis will be detailed in the data analysis plan that will accompany the baseline study. There are distinct measures that are applicable to each province that will take into account the baseline information collected at project start-up.
Review of Data: Data is reviewed by chief of party, M&E team
Presentation of Data: Tables and narrative explanations highlighting separate noteworthy achievements.
Frequency of Reporting: Baseline report within first 18 months of project, annual reports and project closeout reports.
Using Data: Data is used to determine if program activities have any impact on improved learner performance.
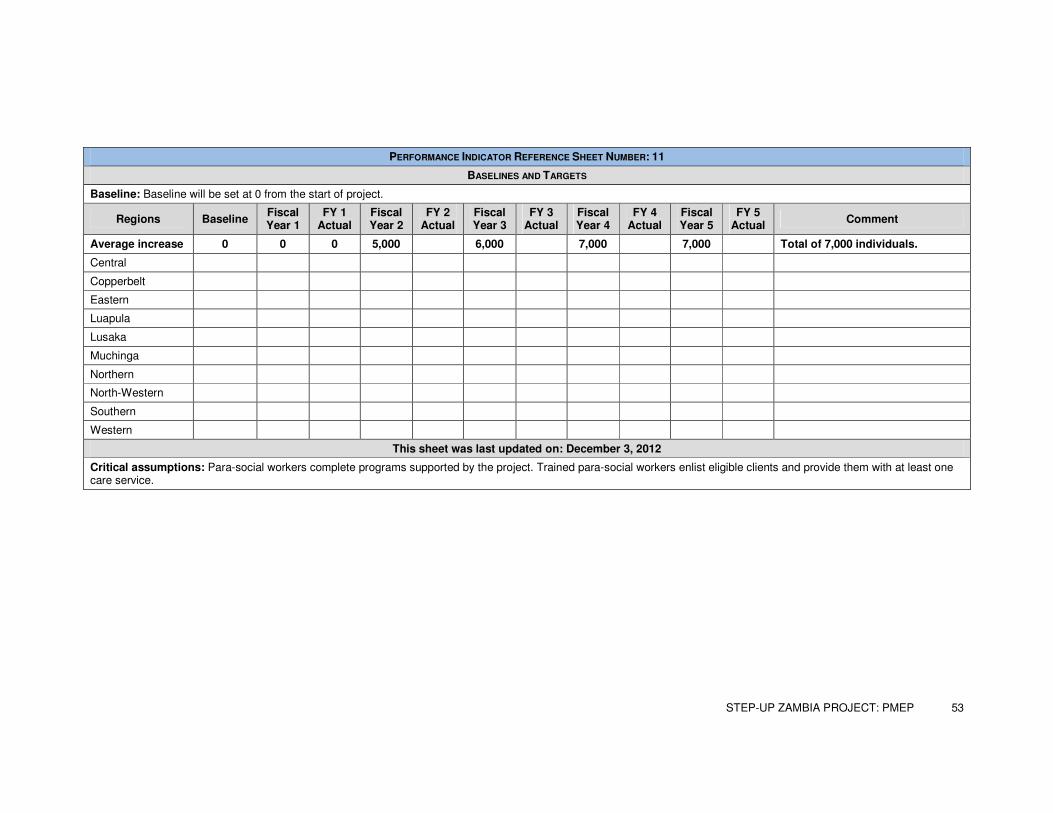
STEP-UP ZAMBIA PROJECT: PMEP 53
PERFORMANCE INDICATOR REFERENCE SHEET NUMBER: 11
BASELINES AND TARGETS
Baseline: Baseline will be set at 0 from the start of project.
Regions Baseline Fiscal Year 1
FY 1 Actual
Fiscal Year 2
FY 2 Actual
Fiscal Year 3
FY 3 Actual
Fiscal Year 4
FY 4 Actual
Fiscal Year 5
FY 5 Actual
Comment
Average increase 0 0 0 5,000 6,000 7,000 7,000 Total of 7,000 individuals.
Central
Copperbelt
Eastern
Luapula
Lusaka
Muchinga
Northern
North-Western
Southern
Western
This sheet was last updated on: December 3, 2012
Critical assumptions: Para-social workers complete programs supported by the project. Trained para-social workers enlist eligible clients and provide them with at least one care service.
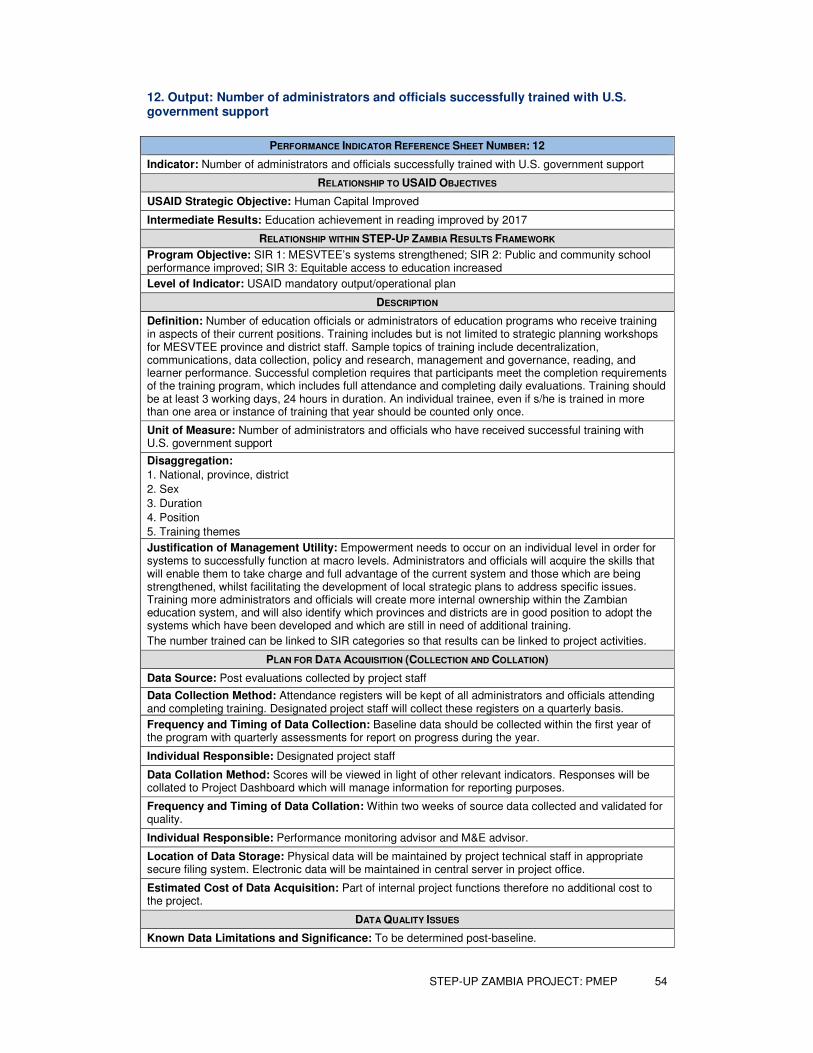
STEP-UP ZAMBIA PROJECT: PMEP 54
12. Output: Number of administrators and officials successfully trained with U.S. government support
PERFORMANCE INDICATOR REFERENCE SHEET NUMBER: 12
Indicator: Number of administrators and officials successfully trained with U.S. government support
RELATIONSHIP TO USAID OBJECTIVES
USAID Strategic Objective: Human Capital Improved
Intermediate Results: Education achievement in reading improved by 2017
RELATIONSHIP WITHIN STEP-UP ZAMBIA RESULTS FRAMEWORK
Program Objective: SIR 1: MESVTEE’s systems strengthened; SIR 2: Public and community school performance improved; SIR 3: Equitable access to education increased
Level of Indicator: USAID mandatory output/operational plan
DESCRIPTION
Definition: Number of education officials or administrators of education programs who receive training in aspects of their current positions. Training includes but is not limited to strategic planning workshops for MESVTEE province and district staff. Sample topics of training include decentralization, communications, data collection, policy and research, management and governance, reading, and learner performance. Successful completion requires that participants meet the completion requirements of the training program, which includes full attendance and completing daily evaluations. Training should be at least 3 working days, 24 hours in duration. An individual trainee, even if s/he is trained in more than one area or instance of training that year should be counted only once.
Unit of Measure: Number of administrators and officials who have received successful training with U.S. government support
Disaggregation:
1. National, province, district
2. Sex
3. Duration
4. Position
5. Training themes
Justification of Management Utility: Empowerment needs to occur on an individual level in order for systems to successfully function at macro levels. Administrators and officials will acquire the skills that will enable them to take charge and full advantage of the current system and those which are being strengthened, whilst facilitating the development of local strategic plans to address specific issues. Training more administrators and officials will create more internal ownership within the Zambian education system, and will also identify which provinces and districts are in good position to adopt the systems which have been developed and which are still in need of additional training.
The number trained can be linked to SIR categories so that results can be linked to project activities.
PLAN FOR DATA ACQUISITION (COLLECTION AND COLLATION)
Data Source: Post evaluations collected by project staff
Data Collection Method: Attendance registers will be kept of all administrators and officials attending and completing training. Designated project staff will collect these registers on a quarterly basis.
Frequency and Timing of Data Collection: Baseline data should be collected within the first year of the program with quarterly assessments for report on progress during the year.
Individual Responsible: Designated project staff
Data Collation Method: Scores will be viewed in light of other relevant indicators. Responses will be collated to Project Dashboard which will manage information for reporting purposes.
Frequency and Timing of Data Collation: Within two weeks of source data collected and validated for quality.
Individual Responsible: Performance monitoring advisor and M&E advisor.
Location of Data Storage: Physical data will be maintained by project technical staff in appropriate secure filing system. Electronic data will be maintained in central server in project office.
Estimated Cost of Data Acquisition: Part of internal project functions therefore no additional cost to the project.
DATA QUALITY ISSUES
Known Data Limitations and Significance: To be determined post-baseline.
STEP-UP ZAMBIA PROJECT: PMEP 55
PERFORMANCE INDICATOR REFERENCE SHEET NUMBER: 12
Actions Taken or Planned to Address Limitations: To be determined post-baseline.
Date of Initial Data Quality Assessment: To be determined post-baseline.
Date of Next Data Quality Assessment: Next full DQA will be based on progress toward institutionalizing RDQA process within MESVTEE. Expected to take place in years 3 and 5 so that efficacy of RDQA processes in intermediate years can be assessed.
Procedure for Data Quality Assessment: Refer to DQA methodology within PMEP for the DQA process.
PLAN FOR DATA ANALYSIS, REVIEW & REPORTING
Data Analysis: Data analysis will be detailed in the Data Analysis plan that will accompany the baseline study. There are distinct measures that are applicable to each province that will take into account the baseline information collected at project start-up.
Review of Data: Data is reviewed by chief of party, performance monitoring advisor, M&E advisor.
Presentation of Data: Tables and narrative explanations highlighting separate noteworthy achievements.
Frequency of Reporting: Baseline report within first 18 months of project, annual reports and project closeout reports.
Using Data: Data is used to determine if program activities have any impact on improved learner performance.
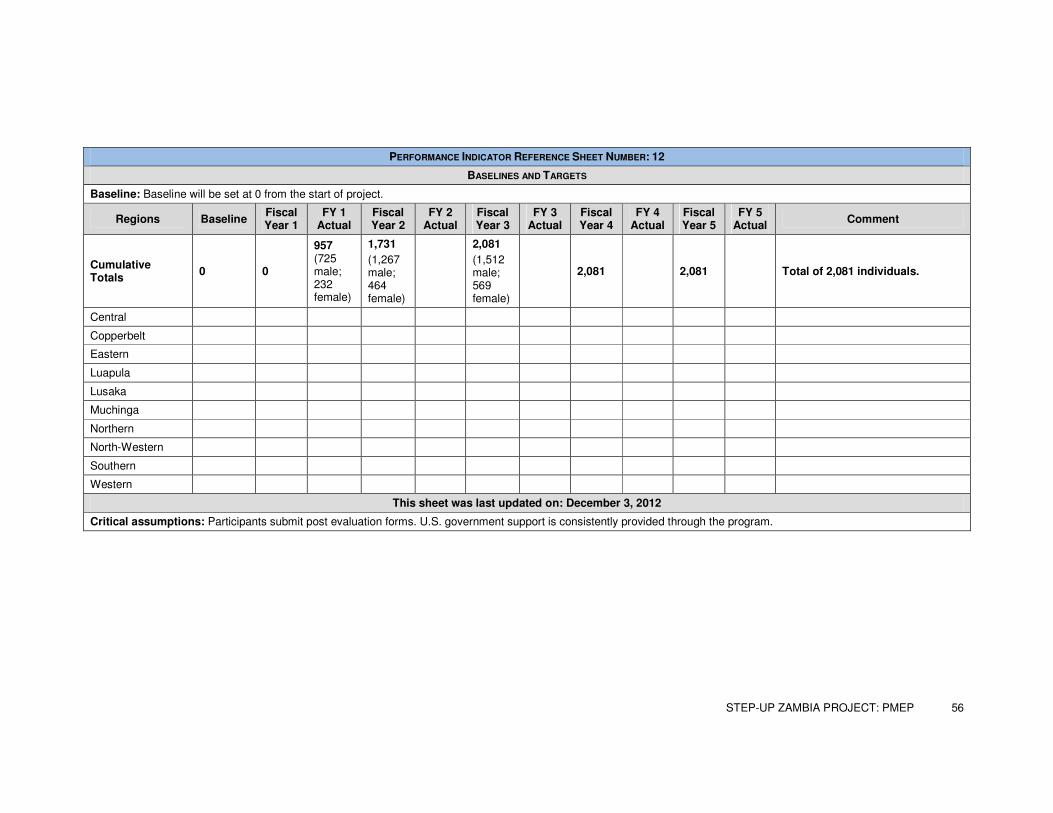
STEP-UP ZAMBIA PROJECT: PMEP 56
PERFORMANCE INDICATOR REFERENCE SHEET NUMBER: 12
BASELINES AND TARGETS
Baseline: Baseline will be set at 0 from the start of project.
Regions Baseline Fiscal Year 1
FY 1 Actual
Fiscal Year 2
FY 2 Actual
Fiscal Year 3
FY 3 Actual
Fiscal Year 4
FY 4 Actual
Fiscal Year 5
FY 5 Actual
Comment
Cumulative Totals
0 0
957 (725 male; 232 female)
1,731
(1,267 male; 464 female)
2,081
(1,512 male; 569 female)
2,081 2,081 Total of 2,081 individuals.
Central
Copperbelt
Eastern
Luapula
Lusaka
Muchinga
Northern
North-Western
Southern
Western
This sheet was last updated on: December 3, 2012
Critical assumptions: Participants submit post evaluation forms. U.S. government support is consistently provided through the program.
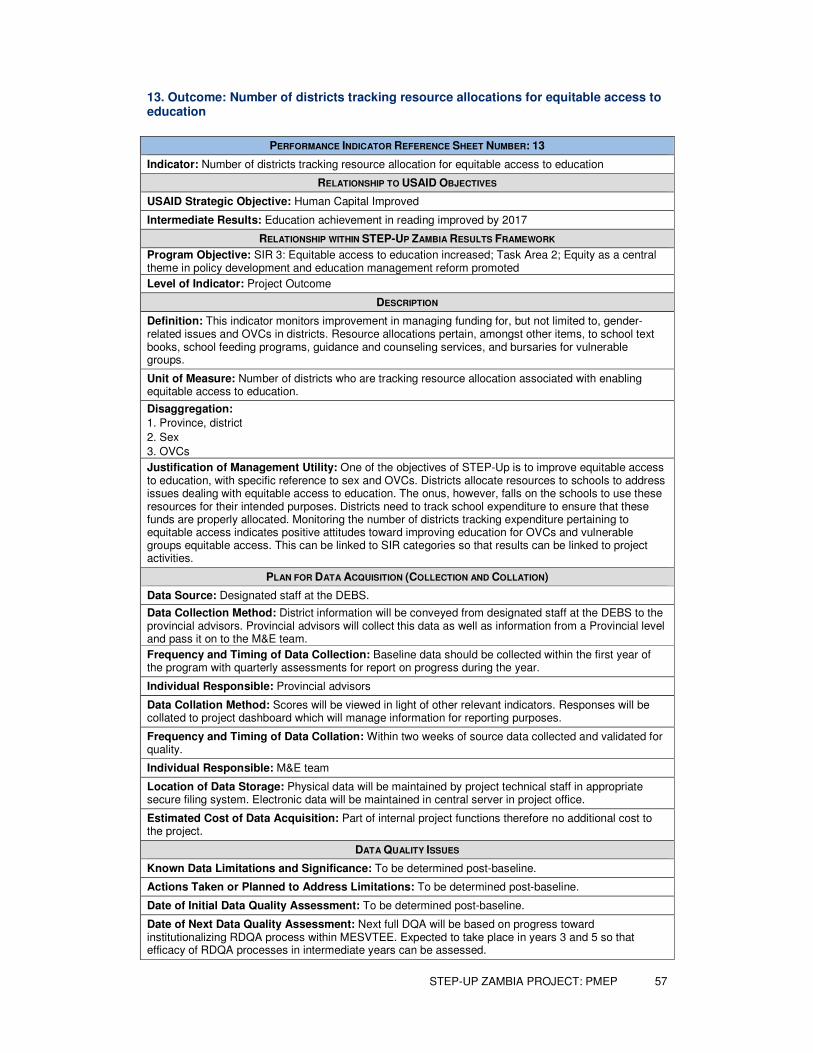
STEP-UP ZAMBIA PROJECT: PMEP 57
13. Outcome: Number of districts tracking resource allocations for equitable access to education
PERFORMANCE INDICATOR REFERENCE SHEET NUMBER: 13
Indicator: Number of districts tracking resource allocation for equitable access to education
RELATIONSHIP TO USAID OBJECTIVES
USAID Strategic Objective: Human Capital Improved
Intermediate Results: Education achievement in reading improved by 2017
RELATIONSHIP WITHIN STEP-UP ZAMBIA RESULTS FRAMEWORK
Program Objective: SIR 3: Equitable access to education increased; Task Area 2; Equity as a central theme in policy development and education management reform promoted
Level of Indicator: Project Outcome
DESCRIPTION
Definition: This indicator monitors improvement in managing funding for, but not limited to, gender-related issues and OVCs in districts. Resource allocations pertain, amongst other items, to school text books, school feeding programs, guidance and counseling services, and bursaries for vulnerable groups.
Unit of Measure: Number of districts who are tracking resource allocation associated with enabling equitable access to education.
Disaggregation:
1. Province, district
2. Sex
3. OVCs
Justification of Management Utility: One of the objectives of STEP-Up is to improve equitable access to education, with specific reference to sex and OVCs. Districts allocate resources to schools to address issues dealing with equitable access to education. The onus, however, falls on the schools to use these resources for their intended purposes. Districts need to track school expenditure to ensure that these funds are properly allocated. Monitoring the number of districts tracking expenditure pertaining to equitable access indicates positive attitudes toward improving education for OVCs and vulnerable groups equitable access. This can be linked to SIR categories so that results can be linked to project activities.
PLAN FOR DATA ACQUISITION (COLLECTION AND COLLATION)
Data Source: Designated staff at the DEBS.
Data Collection Method: District information will be conveyed from designated staff at the DEBS to the provincial advisors. Provincial advisors will collect this data as well as information from a Provincial level and pass it on to the M&E team.
Frequency and Timing of Data Collection: Baseline data should be collected within the first year of the program with quarterly assessments for report on progress during the year.
Individual Responsible: Provincial advisors
Data Collation Method: Scores will be viewed in light of other relevant indicators. Responses will be collated to project dashboard which will manage information for reporting purposes.
Frequency and Timing of Data Collation: Within two weeks of source data collected and validated for quality.
Individual Responsible: M&E team
Location of Data Storage: Physical data will be maintained by project technical staff in appropriate secure filing system. Electronic data will be maintained in central server in project office.
Estimated Cost of Data Acquisition: Part of internal project functions therefore no additional cost to the project.
DATA QUALITY ISSUES
Known Data Limitations and Significance: To be determined post-baseline.
Actions Taken or Planned to Address Limitations: To be determined post-baseline.
Date of Initial Data Quality Assessment: To be determined post-baseline.
Date of Next Data Quality Assessment: Next full DQA will be based on progress toward institutionalizing RDQA process within MESVTEE. Expected to take place in years 3 and 5 so that efficacy of RDQA processes in intermediate years can be assessed.
STEP-UP ZAMBIA PROJECT: PMEP 58
PERFORMANCE INDICATOR REFERENCE SHEET NUMBER: 13
Procedure for Data Quality Assessment: Refer to DQA methodology within PMEP for the DQA process.
PLAN FOR DATA ANALYSIS, REVIEW & REPORTING
Data Analysis: Data analysis will be detailed in the data analysis plan that will accompany the baseline study. There are distinct measures that are applicable to each province that will take into account the baseline information collected at project start-up.
Review of Data: Data is reviewed by chief of party, M&E team
Presentation of Data: Tables and narrative explanations highlighting separate noteworthy achievements.
Frequency of Reporting: Baseline report within first 18 months of project, annual reports and project closeout reports.
Using Data: Data is used to determine if program activities have any impact on improved learner performance.
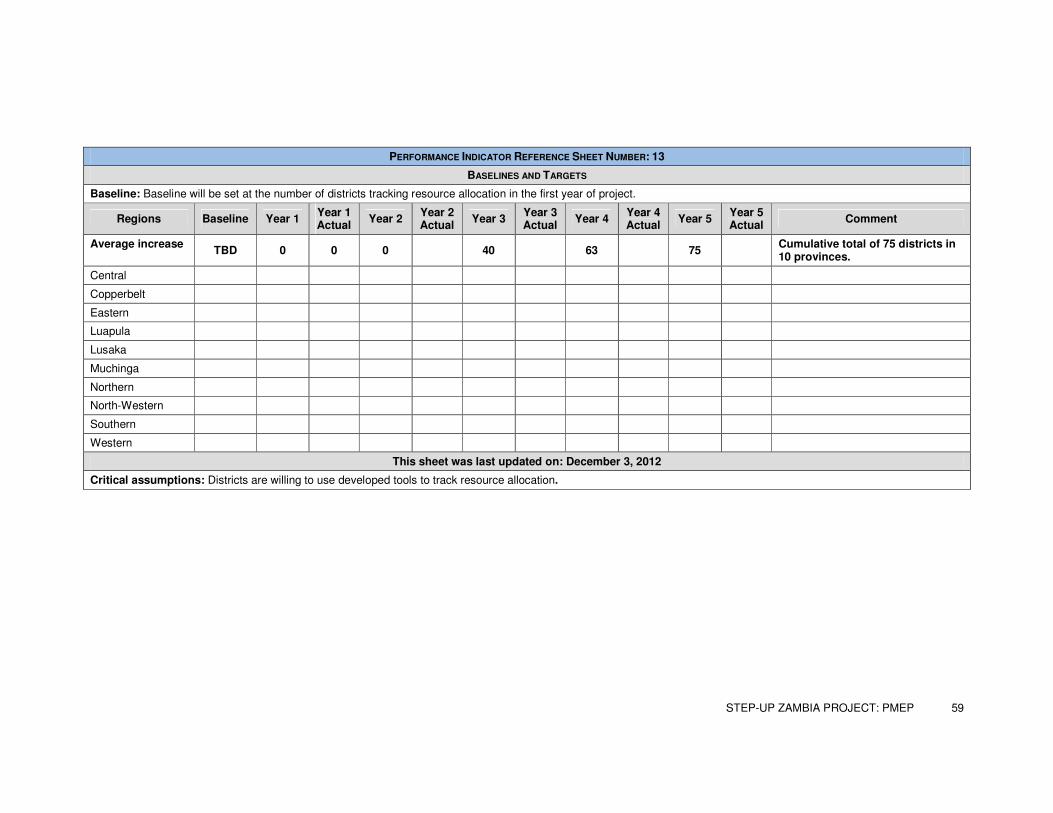
STEP-UP ZAMBIA PROJECT: PMEP 59
PERFORMANCE INDICATOR REFERENCE SHEET NUMBER: 13
BASELINES AND TARGETS
Baseline: Baseline will be set at the number of districts tracking resource allocation in the first year of project.
Regions Baseline Year 1 Year 1 Actual
Year 2 Year 2 Actual
Year 3 Year 3 Actual
Year 4 Year 4 Actual
Year 5 Year 5 Actual
Comment
Average increase TBD 0 0 0 40 63 75
Cumulative total of 75 districts in 10 provinces.
Central
Copperbelt
Eastern
Luapula
Lusaka
Muchinga
Northern
North-Western
Southern
Western
This sheet was last updated on: December 3, 2012
Critical assumptions: Districts are willing to use developed tools to track resource allocation.