Embed Size (px)
Citation preview

International Journal of Progressive Research in Science and Engineering
Volume-1, Issue-6, September-2020
www.ijprse.com
16
Strength Properties of Concrete by Partial Replacement of Course Aggregate with C & D Waste and Fine Aggregate with Foundry
Sand for M25 Grade Concrete
Revanna E 1, Ravi Kumar C M2, Pruthviraj S R1, Maruthi T1, Raghavendra S1
1Student, Department of Studies in Civil Engineering, University B D T College of Engg, Davanagere, India.
2Associate Professor, Department of Studies in Civil Engineering, University B D T College of Engg, Davanagere, India.
Corresponding Author: [email protected]
Abstract: - Concrete is most consumption in the world after the water. Commonly concrete is composed with cement and
aggregates. In now a day’s aggregates is depletes in nature, cost is also high due to more consumption of concrete. On Other hand
construction and demolition waste (C & D waste) and industrial by-product like a waste is produce millions of tons per year, so
the disposal of waste is major problem that is dumping. So utilize some amount of waste product to make concrete. Hence in the
current study an attempt has been made to minimize the cost of aggregates and effectively utilizing the C & D waste and foundry
sand by utilizing with concrete mix M25 by studying the mechanical behavior of this concrete mix by partially replacing fine
aggregate with foundry sand and coarse aggregate with C & D waste. In this study partial replacement5of fine5aggregate with
foundry sand5and coarse aggregate with C & D waste, also adding polypropylene fiber (0.3%). Experimental study is conducted
to evaluate strength characteristic of hardened concrete. The fine aggregate has been replaced with foundry sand in the range of 0%, to 30% by weight of fine aggregate and partially replacing coarse aggregate with C & D waste in the range of 0%, to 40% by
weight of coarse aggregate, with and without adding polypropylene fiber. The optimum strength of concrete mix is obtained for
the represent of 20% foundry sand and 30% C & D waste. Also optimum mix combination specimens are prepared and determine
their mechanical property at testing dates of curing.
Key Words— foundry sand (FS), Construction and Demolition Waste (C & D Waste), polypropylene fiber (PPF).
I. INTRODUCTION Concrete is the only major building material that can be
delivered to the job site in a plastic state. The global
consumption of aggregate is very high. Now a day’s natural
resources are depleting so it increasing extraction of natural
sources like aggregates causing many problems, loosing water
retaining sand strata, loss of vegetation on the bank of river
etc. The sand and coarse aggregate is highly expensive and
depleting. It has become very important protect the natural resources. To overcome this problem, we use other alternative
materials for concrete production. So in this experiment we
utilize foundry sand, foundry sand is a by-product of metal
smelting and replacing with fine aggregate in varies
percentage and recycled aggregate from dig of road concrete
as C & D waste, replacing with coarse aggregate in varies
percentage. Also polypropylene fiber is added to the concrete
in less varies percentage by weight of cement. This fiber
increases the ductility of the concrete. In this experimental
investigation an attempt is made to study the effect of partial
replacement of sand with foundry sand and coarse aggregate by C & D waste in the mechanical properties of M25 grade
concrete.
1.1 Cement Here, Cement is used of 43grade ordinary Portland cement
(OPC) with brand name ACC is used for all concrete mixes.
The cement used is fresh and without any lumps and
properties of cement conforming to IS4031:1999.
1.2 Fine aggregate Manufactured sand is used as fine aggregate. The M-sand
passing through 4.75 mm size sieve is used in the preparation
of specimen. Sieve analysis have zone II.
1.3 Foundry sand Foundry sand has highly silica sand and uniform characteristics. It is the by-product of ferrous and nonferrous
metal casting industries. Ferrous and non-ferrous metal
castings industries highly produce the by-product of foundry
sand and it is available to be recycled into other products from
industry. At present in India 165-170 million tons of foundry
is produced. In the process of casting, molding sands are
recycled and reused many times. Moreover, the recycled sand
degrades to the point that has no longer been reused in the
casting process.

International Journal of Progressive Research in Science and Engineering
Volume-1, Issue-6, September-2020
www.ijprse.com
17
Fig.1. Foundry sand
1.4 Coarse aggregate
The Course aggregate is replaced with construction and demolition (C&D) waste. One of the major problems
being faced by cities and towns relates to the management
of C&D Waste. Waste quantities are increasing and
municipal authorities are not able to upgrade or scale up the
facilities required for proper management o f such wastes.
Cities and towns, in future, will not get wastelands for the
further dumping of wastes. For the replacement of coarse
aggregate in some amount of percentage by demolished
waste gives strength closer to the strength of plain concrete
and strength retention was recorded in the range of some
percentage for the recycled concrete mix. Many type of C & D waste are used such as pieces ceramic tiles, pieces of
bricks, building waste concrete, dig of drainage concrete and
dig of road concrete extra. In this experiment the main source
for recycled aggregates is construction and demolition
waste. Reuse of demolition waste appears to be an effective
solution and the most appropriate and large scale use would
be to use it as aggregates to produce concrete for new
construction. The main source for recycled aggregates is
construction and demolition waste. Most of the waste
materials produced by demolishing structures are disposed
by dumping them as landfill or for reclaiming land, in
future will not get wastelands for the further dumping of wastes. In fact, there will be a need to go for total recycling
and reuse of waste and aim for Zero Waste for landfilling.
Reuse of demolition waste appears to be an effective
solution and the most appropriate and large scale use would
be to use it as aggregates to produce concrete for new
construction. Recycled aggregate concrete utilizes
demolition material from concrete and dig of road concrete
as aggregate.
Fig.2. Raw material of C & D waste from Road concrete
1.5 Fiber reinforced concrete (FRC) Fibers are grating does not corrode like steel grating
and is therefore used in corrosive environments to reduce
maintenances cost, in this experimental work poly propylene
fibers are used. It is harder; more heat resistance.
Polypropylene is the second most widely produced
commodity plastic.
II. MATERIALS AND METHODOLOGY
2.1 Materials The properties of fresh concrete and hardened concrete of
M25 grade mixes are depends on the properties of the constituents used in its making. Therefore, preliminary test
was conducted on the materials to determine their
characteristic properties as per code of practice are reported
below.
Materials Used in this Project are:
2.1.1 Cement
2.1.2 F i n e aggregate
a) Manufactured sand
b) Foundry sand
2.1.3 Coarse aggregate
a) Natural aggregate
b) Construction Demolition waste
2.1.4. Water
2.1.5. Polypropylene fiber
2.1.1 Cement
Here, Cement is used of 43grade ordinary Portland cement (OPC) The specific gravity, normal consistency, initial and
final setting time of cement were found as per Indian
standard specifications
Basic Test on Cement:
Grade of Cement : 43 grade (ACC)
Specific Gravity : 3.1
Normal Consistency : 30 %

International Journal of Progressive Research in Science and Engineering
Volume-1, Issue-6, September-2020
www.ijprse.com
18
Initial Setting time : 35 minutes
Final Setting time : 600 minutes
2.1.2 Fine Aggregates (FA)
a. Manufactured sand:
Manufactured sand is used as fine aggregate. The
M-sand passing through 4.75 mm size sieve is used in the
preparation of specimen. The M-sand confirm to grading
zone II as per IS: 383-1970. The properties of sand such as
fineness modulus and specific gravity were determined a s
per IS : 2386-1963.
Basic Test on M-Sand:
Specific Gravity : 2.46
Silt content : 4%
Bulkiness of sand : 6%
Grading of Sand : Zone – II
b. Foundry sand:
Foundry sand has shape of semi corned or circular.
Grain size of foundry sand is uniformly distributed; it is high
quality silica sand. It is used in the foundry casting process.
The foundry sand is passing through the 4.75 mm sieve is
used in the preparation of concrete.
Basic Test on Foundry sand:
Specific gravity : 2.47
Water absorption : 0.45%
Bulking of sand : 4%
Silt content : Nil
2.1.3 Course Aggregate (CA)
The coarse aggregate used in the investigation is
20 mm down size locally available crushed stone obtained
from quarries. It occupies almost of volume in concrete and
hence shows influence on various properties such as
strength, workability, durability and economy of concrete.
a. Natural aggregate (NA):
The aggregate having size more than 4.75 mm is termed as coarse aggregate.
Basic Test on Natural aggregate:
Specific Gravity : 2.69
Flakiness : 11.4%
Water Absorption : 1%
Shape : Angular
b. Construction Demolition waste: It used as coarse aggregate for concrete. The
demolished waste concrete coarse aggregates were obtained
by crushing the waste concrete from dig of road concrete
that were dismantled due t o completion of their life span
and it passing through 20 mm sieve and retained on12.5
mm sieve and as given in IS: 383-1970 is used for all the
specimens.
Basic Test on C&D Waste:
Specific Gravity : 2.45
Flakiness : 5.36%
Water Absorption : 2.37
2.1.4 Water: Palatable (portable) water has been used
throughout this research work.
2.1.5 Poly Propylene Fibers (PPF): A fiber grating does not corrode like steel grating
and is therefore used in corrosive environments to reduce
maintenance costs. The poly propylene fibers are used in this
project 0.3%. It is harder, more heat resistance.
Properties of Poly propylene fiber:
Material : Polypropylene fiber
Type : CT 2424
Filament diameter : 25 Microns
Cut length : 12mm
2.2 Methodology
2.2.1 The Following methodology is adopted for the present work:
Fig.3. Methodology Flowchart
2.3 Experimental Details
2.3.1 Mix Design, Means, Modes and Methods:
In this experiment conducted the grades of concrete
Collection of ingredient of concrete and basic tests
Mix design as per IS: 10262
Mixing with specified proportion
Casting/molding
De molding after 24 hours
Curing and mechanical property tests

International Journal of Progressive Research in Science and Engineering
Volume-1, Issue-6, September-2020
www.ijprse.com
19
M-25. The mix design was carried out as per IS 10262-
2009. The trials have been prepared and M-25 grade was
design for this experiment having the mix proportion
1:1.51:2.58 and the water cement ratio are 0.45. All locally
available materials are used during the preparation of the mix
proportion. Table.1. Mix Proportion as per IS 10262-2009
Materials Quantity in
Kg/m3
Proportion
Cement 426 1
Fine aggregate 644.33 1.51
Coarse aggregate 1102.02 2.58
Water 191.5 0.45
2.3.2 Casting of specimens:
The cement, M-sand, coarse aggregate, foundry sand and C&D waste were weighed in a dry condition
and they mixed together in a pan mixer in order to avoid
cement, aggregate and water loss. As the order of
M25concrete mixtures were prepared with polypropylene
with foundry sand and C & D waste substitution. The
foundry sand and C & D waste substitution rate was varied
between 0% to 30% and 0% to 40% respectively, in
increments of 10%. Similarly, without polypropylene
concrete mixture has prepared. Cubes and cylinders with a
size of ( 150×150×150) mm and ( 150×300) mm were
prepared. Beams having a size of (100 × 100×500) mm, all the specimens were filled with concrete in three layers,
and each layer of the concrete was effectively compacted
by table vibrator.
Fig.4. sample of cube Casting
2.3.3 Curing of Specimens: After casting, all the test specimens were kept at
room temperature for 24hrs and thereafter were de molded
and transferred to the curing tank until their test in dates.
Specimen was tested for 7, 14 and 28
days
Fig.5. Curing of specimens in curing tank
2.3.4 Testing of Specimens
After completion of the curing the testing samples
are dry about half an hour. Then Specimens are tested for its
dates such as 7, 14 and 28 days for compressive strength,
and dates 7, 28 days for split tensile, shear and flexure
strength by universal testing machine (UTM).
Fig.6. Testing of specimens in UTM
III. RESULTS AND DISCUSSION
3.1. Partially replacement of foundry sand to find optimum dosage
A. With and without PPF as replace Foundry Sand for 7 days
of curing:

International Journal of Progressive Research in Science and Engineering
Volume-1, Issue-6, September-2020
www.ijprse.com
20
Table.3. Without PPF as replaced Foundry Sand at 7 days of curing.
Table.4. With PPF as replaced Foundry Sand at 7 days of curing.
B. With and without PPF as replaced Foundry Sand for 14
days of curing:
Table.5. Without PPF as replaced Foundry Sand at 14 days of curing.
SL Replacement of
Materials
Avg. Compressive
Strength in MPA
1 0% 30.66
2 10% 32.88
3 20% 34.21
4 30% 33.18
Table.6. With PPF as replaced Foundry Sand at 14 days of curing.
SL Replacement of
Materials
Avg. Compressive
Strength in MPA
1 0% 33.03
2 10% 34.96
3 20% 37.03
4 30% 35.99
C. With and without PPF as replaced Foundry Sand for 28 days of curing:
Table.7. Without PPF as replaced Foundry Sand at 28 days of
curing.
Table.8. With PPF as replaced Foundry Sand at 28 days of curing.
Chart.1. Graphical Representation of Foundry
sand with and without fiber for 7days
Chart.2. Graphical Representation of Foundry sand with and
without fiber for 14 days
05
1015202530
0% 10% 20% 30%
Co
mp
ress
ive
Str
en
gh
t (N
/m
m2)
Replaced Percentage (%)
Foundry sand without and with Fibres at 7 Days
Foundry Sand without Fibres at 7 DaysFoundry Sand with Fibres at 7 Days
0
10
20
30
40
0% 10% 20% 30%
Co
mp
ress
ive
Str
en
gh
t (N
/m
m2)
Replaced Percentage (%)
Foundry sand without and with Fibres at 14 Days
Foundry Sand without Fibres at 14 DaysFoundry Sand with Fibres at 14 Days
SL Replacement of
Materials
Avg. Compressive
Strength in MPA
1 0% 22.66
2 10% 22.51
3 20% 25.77
4 30% 23.85
SL Replacement of
Materials
Avg. Compressive
Strength in MPA
1 0% 24.29
2 10% 25.77
3 20% 27.55
4 30% 25.62
SL Replacement of
Materials
Avg. Compressive
Strength in MPA
1 0% 34.21
2 10% 36.73
3 20% 37.92
4 30% 37.03
SL Replacement of
Materials
Avg. Compressive
Strength in MPA
1 0% 35.85
2 10% 39.40
3 20% 42.66
4 30% 37.47

International Journal of Progressive Research in Science and Engineering
Volume-1, Issue-6, September-2020
www.ijprse.com
21
Chart.3. Graphical Representation of Foundry sand with and
without fiber for 28 days
Inference: From the above Tables 3,4,5,6,7 and 8 represents the
compressive strength of concrete with partially replacement
of foundry sand for 0%, 10%, 20%and 30% by weight of fine
aggregates for both with and without poly propylene fibers
and above graph represents the 20% optimum percentage of
foundry sand by comparing with and without fibers. For all
the tables shows increase in compressive strength then
without fiber at 7, 14 and 28 days of curing.
3.2 Partially replacement of c & d waste to find optimum dosage: A. With and without PPF as replaced C & D waste for 7 days
of curing:
Table.9. Without PPF as replaced C & D waste at 7 days of curing
SL Replacement of
Materials
Avg. Compressive
Strength in MPA
1 0% 22.66
2 10% 23.70
3 20% 23.99
4 30% 24.73
5 40% 22.66
Table.10. With PPF as replaced C & D waste at 7 days of curing.
SL Replacement of
Materials
Avg. Compressive
Strength in MPA
1 0% 24.29
2 10% 24.14
3 20% 25.92
4 30% 26.33
5 40% 22.66
B. With and without PPF as replaced C & D waste for 14 days of curing.
Table.11. Without PPF as replaced C & D Waste at 14 days of curing.
SL Replacement of
Materials
Avg. Compressive
Strength in MPA
1 0% 30.66
2 10% 31.55
3 20% 32.44
4 30% 33.03
5 40% 31.99
Table.12. With PPF as replaced C & D Waste at 14 days of curing.
SL Replacement of
Materials
Avg. Compressive
Strength in MPA
1 0% 33.03
2 10% 33.33
3 20% 34.36
4 30% 36.14
5 40% 33.03
C. With and without PPF as replaced C & D waste for 28 days
of curing.
Table.13. Without PPF as replaced C & D waste at 28 days of curing.
SL Replacement of Materials
Avg. Compressive Strength in MPA
1 0% 34.21
2 10% 34.22
3 20% 34.51
4 30% 35.40
5 40% 34.66
Table.14. With PPF as replaced C & D waste at 28 days of curing.
SL Replacement of
Materials
Avg. Compressive
Strength in MPA
1 0% 35.85
2 10% 35.85
0
10
20
30
40
50
0% 10% 20% 30%
Co
mp
ress
ive
Str
en
gh
t (N
/mm
2)
Replaced Percentage (%)
Foundry sand without and with Fibres at 28 Days
Foundry Sand without Fibres at 28 DaysFoundry Sand with Fibres at 28 Days
International Journal of Progressive Research in Science and Engineering
Volume-1, Issue-6, September-2020
www.ijprse.com
22
3 20% 37.77
4 30% 39.70
5 40% 36.43
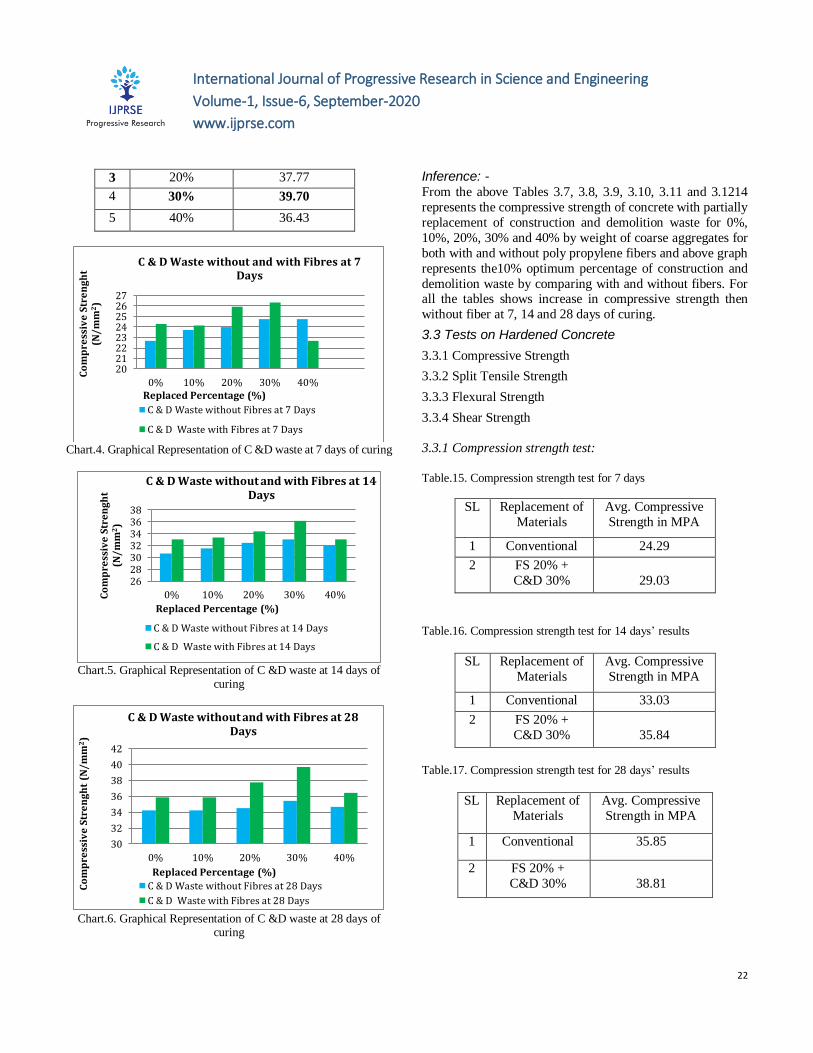
Chart.4. Graphical Representation of C &D waste at 7 days of curing
Chart.5. Graphical Representation of C &D waste at 14 days of
curing
Chart.6. Graphical Representation of C &D waste at 28 days of
curing
Inference: - From the above Tables 3.7, 3.8, 3.9, 3.10, 3.11 and 3.1214
represents the compressive strength of concrete with partially
replacement of construction and demolition waste for 0%,
10%, 20%, 30% and 40% by weight of coarse aggregates for
both with and without poly propylene fibers and above graph
represents the10% optimum percentage of construction and
demolition waste by comparing with and without fibers. For all the tables shows increase in compressive strength then
without fiber at 7, 14 and 28 days of curing.
3.3 Tests on Hardened Concrete
3.3.1 Compressive Strength
3.3.2 Split Tensile Strength
3.3.3 Flexural Strength
3.3.4 Shear Strength
3.3.1 Compression strength test:
Table.15. Compression strength test for 7 days
SL Replacement of
Materials
Avg. Compressive
Strength in MPA
1 Conventional 24.29
2 FS 20% +
C&D 30%
29.03
Table.16. Compression strength test for 14 days’ results
SL Replacement of
Materials
Avg. Compressive
Strength in MPA
1 Conventional 33.03
2 FS 20% +
C&D 30%
35.84
Table.17. Compression strength test for 28 days’ results
SL Replacement of
Materials
Avg. Compressive
Strength in MPA
1 Conventional 35.85
2 FS 20% +
C&D 30%
38.81
2021222324252627
0% 10% 20% 30% 40%
Co
mp
ress
ive
Str
en
gh
t (N
/m
m2)
Replaced Percentage (%)
C & D Waste without and with Fibres at 7 Days
C & D Waste without Fibres at 7 Days
C & D Waste with Fibres at 7 Days
26283032343638
0% 10% 20% 30% 40%Co
mp
ress
ive
Str
en
gh
t (N
/m
m2)
Replaced Percentage (%)
C & D Waste without and with Fibres at 14 Days
C & D Waste without Fibres at 14 Days
C & D Waste with Fibres at 14 Days
30
32
34
36
38
40
42
0% 10% 20% 30% 40%
Co
mp
ress
ive
Str
en
gh
t (N
/m
m2)
Replaced Percentage (%)
C & D Waste without and with Fibres at 28 Days
C & D Waste without Fibres at 28 Days
C & D Waste with Fibres at 28 Days

International Journal of Progressive Research in Science and Engineering
Volume-1, Issue-6, September-2020
www.ijprse.com
23
SL Replacement of
Materials
Avg. Flexural
Strength in MPA
1 Conventional 2.82
2 FS 20% +
C&D 30%
3.10
Chart.7. Comparison of compressive strength between conventional
and optimum concrete cubs for 7, 14 & 28 days
3.3.2 Split tensile strength test.
Table.18. Split tensile strength test for 7 days
Table.19. Split tensile strength test for 28 days
Chart.8. Comparison of split tensile strength between conventional
and optimum concrete for 7& 28 days
3.3.3 Flexural tensile strength test.
Table.20. Flexural tensile strength test for 7 days results
Table.21. Flexural tensile strength test for 28 days results
Chart.9. Comparison of flexural strength between conventional
and optimum concrete for 7 & 28 days
3.3.4 Shear Strength test:
Table.22. Shear Strength test for 7 days results
SL Replacement of
Materials
Avg. Shear
Strength in MPA
1 Conventional 5.92
2 FS 20% +
C&D 30%
7.78
0
10
20
30
40
50
Conventional FS20%+C&D30%
Co
mp
ress
ive
Str
en
gh
t (N
/m
m2)
Compressive strength test at 7, 14 & 28 Days
7day
14day
28day
0
1
2
3
4
Conventional FS20%+C&D30%Sp
lit
ten
sile
Str
en
gh
t (N
/m
m2)
Split tensile test at 7 & 28 Days
7days28days
0
1
2
3
4
5
Conventional FS20%+C&D30%Fle
xu
ral
Str
en
gh
t (N
/m
m2)
Flexural test at 7 & 28 Days
7days
28days
SL Replacement of
Materials
Avg. Split Tensile
Strength in MPA
1 Conventional 2.17
2 FS 20% +
C&D 30%
2.45
SL Replacement of
Materials
Avg. Split Tensile
Strength in MPA
1 Conventional 2.97
2 FS 20% +
C&D 30%
3.49
SL Replacement of
Materials
Avg. Flexural
Strength in MPA
1 Conventional 3.29
2 FS 20% +
C&D 30%
3.92

International Journal of Progressive Research in Science and Engineering
Volume-1, Issue-6, September-2020
www.ijprse.com
24
Table.23. Shear Strength test for 28 days results SL Replacement of
Materials
Avg. Shear
Strength in MPA
1 Conventional 9.62
2 FS 20% +
C&D 30%
12.23
Fig.10. Comparison of shear strength between conventional
and optimum concrete for 7, 14 & 28 days
IV. CONCLUSION
In this study, the mean target strength of M25 grade concrete
is achieved combined effect of using foundry sand and C &
D waste as partial replacement for fine aggregate and coarse aggregate respectively. We observe from the experimental
result that it is clear that the concrete made with 20% foundry
sand replacement with fine aggregate and 30% C & D waste
replacement with coarse aggregate, with 0.3%
polypropylene fiber shows higher compressive strength
than other mixes so it concludes that 20% foundry sand
replacement with fine-aggregate and 30% C & D waste
replacement with coarse aggregate is optimum value of
compressive strength results. Mechanical properties such as
compressive strength, split tensile strength, flexural strength
and shear strength were increased with replaced foundry sand and C &D waste (optimum20%+30%) with
polypropylene fiber than conventional concrete.
The compressive strength of conventional concrete
cubes is 35.85 Mpa at 28days, whereas compressive
strength of optimum amount of partially replaced
both foundry sand as 20% and C & D waste 30% at
28 days found to be 38.81Mpa. Also it found that
the compressive strength partially replaced
concrete have 7.63% higher strength than the
conventional concrete respectively.
The split tensile strength of conventional concrete
cylinder is 2.97 Mpa at 28 days, whereas split
tensile strength of optimum amount of partially
replaced both foundry sand as 20% and C & D
waste 30% at 28 days found to be 3.49 Mpa. Also
it found that the split tensile strength partially
replaced concrete have 14.9% higher strength than
the conventional concrete respectively.
The flexural strength of conventional concrete beam is 3.29 Mpa at 28 days, whereas compressive
strength of optimum amount of partially replaced
both foundry sand as 20% and C & D waste 30%
at 28 days found to be 3.92 Mpa. Also it found that
the flexural strength partially replaced concrete
have 16.07% higher strength than the conventional
concrete respectively.
The shear strength of conventional concrete cube is
9.62 Mpa at 28 days, whereas shear strength of
optimum amount of partially replaced both foundry sand as 20% and C & D waste 30% at 28 days
found to be 12.23 Mpa. Also it found that the
shear strength partially replaced concrete have
21.34% higher strength than the conventional
concrete respectively.
REFERENCES
[1]. Gatadi kiran kumar, Ipsita bose Roy choudhury, V. Subbalakshmi, Alluri S naveen reddy. “Strength of M25 and M60 Grade Concrete with used foundry Sand” (2019).
[2]. D. Dharani, V. Arivu thiravida selvan. “Experimental investigation on partial replacement of fine aggregate by foundry Sand” (2018).
[3]. vinitha dsouza. “Evaluation of Strength Properties of Concrete by Partial Replacement of Natural Sand with
Foundry Sand” (2017). [4]. G.Ganesh prabhu, Jin wookbang, Byungjaelee,
Junghwanhyun and Yunyongkim. “Mechanical and durability properties of concrete made with used foundry sand as fine aggregate” (2015).
[5]. DR K.V. S. Gopala, Krishna sastry, A.Ravitheja, DR.T.Chandra sekhara reddy. “Effect of foundry sand and minerals admixtures on mechanical properties of
concrete” (2018). [6]. Prerna tighare, MR.R.C.Singh. “Determination of
compressive strength of concrete made with natural aggregates and varying percentages of demolished waste concrete aggregates” (2018).
[7]. Gowri Shankar M, Nagarajan V, Eswaramoorthi P,
Karthik prabhu T. “Performance assessment and cost effectiveness in replacement of aggregates with construction and demolition waste in concrete” (2018).
[8]. Ashraf M,Wagih, Hossamz. El-karmot, Magda ebid, Samir h. Okba. “Recycled construction and demolition concrete wastes aggregate for structural concrete” (2012).
[9]. P. Saravana kumar and G. Dhinakaran, ph.d. “Effect of admixed recycled aggregate concrete on properties of fresh and hardened concrete” (2012).
0
2
4
6
8
10
12
14
Conventional FS20%+C&D30%
Sh
ea
r S
tre
ng
ht
(N/
mm
2)
Sheartest at 7 & 28 Days
7days28days

International Journal of Progressive Research in Science and Engineering
Volume-1, Issue-6, September-2020
www.ijprse.com
25
[10]. K C Pandaa, P K Balb “Properties of self-compacting concrete using recycled coarse aggregate” (2013).
[11]. V Divya prasad, E Lalith prakash, M ABISHEK, K
Ushanth dev, C K Sanjay kiran “Study on concrete containing waste foundry sand, fly ash and polypropylene fibre using taguchi method” (2018).
[12]. IS 456: 2000 code of practice for plain and reinforced concrete (third revision).
[13]. IS 516: 1959 method of test for strength of concrete. [14]. Shetty. M.s, (2010) “concrete technology” S. Chand and
company Ltd, Delhi.
[15]. IS: 10262-2009 Recommended Guidelines for Concrete mix design (Reaffirmed 2004).
[16]. IS:383-1970 Specification for Coarse and Fine aggregates from Natural Sources for concrete (Second Revision) (Reaffirmed 2002).