Embed Size (px)
Citation preview

lable at ScienceDirect
Journal of Rock Mechanics and Geotechnical Engineering 11 (2019) 562e575
Contents lists avai
Journal of Rock Mechanics andGeotechnical Engineering
journal homepage: www.rockgeotech.org
Full Length Article
Strength of massive to moderately jointed hard rock masses
R.P. Bewick a,*, P.K. Kaiser b, F. Amann c
aGolder Associates Ltd., 33 Mackenzie Street, Sudbury, Ontario, P3C 4Y1, Canadab Laurentian University, 935 Ramsey Lake Rd, Sudbury, P3E 2C6, CanadacRWTH Aachen Lochnerstrasse, Aachen, 4-20, D-52064, Germany
a r t i c l e i n f o
Article history:Received 25 July 2018Received in revised form24 September 2018Accepted 9 October 2018Available online 27 December 2018
Keywords:Brittle rockUniaxial compressive strength (UCS)Geological strength index (GSI)Massive to moderately jointed rock masses
* Corresponding author.E-mail address: [email protected] (R.P. Bewick)Peer review under responsibility of Institute of R
nese Academy of Sciences.
https://doi.org/10.1016/j.jrmge.2018.10.0031674-7755 � 2019 Institute of Rock and Soil MechanicNC-ND license (http://creativecommons.org/licenses/
a b s t r a c t
The Hoek-Brown (HB) failure criterion and the geological strength index (GSI) were developed for theestimation of rock mass strength in jointed and blocky ground where rock mass failure is dominated bysliding along open joints and rotation of rock blocks. In massive, veined and moderately jointed rock inwhich rock blocks cannot formwithout failure of intact rock, the approach to obtain HB parameters mustbe modified. Typical situations when these modifications are required include the design of pillars,excavation and cavern stability, strainburst potential assessment, and tunnel support in deep under-ground conditions (around s1/sci > 0.15, where s1 is the major principal compressive stress and sci is theunconfined compressive strength of the homogeneous rock) in hard brittle rocks with GSI � 65. In thisarticle, the strength of massive to moderately jointed hard rock masses is investigated, and an approachis presented to estimate the rock mass strength envelope using laboratory data from uniaxial and triaxialcompressive strength tests without reliance on the HB-GSI equations. The data from tests on specimensobtained from massive to moderately jointed heterogeneous (veined) rock masses are used to obtain therock and rock mass strengths at confining stress ranges that are relevant for deep tunnelling and mining;and a methodology is presented for this purpose from laboratory data alone. By directly obtaining theequivalent HB rock mass strength envelope for massive to moderately jointed rock from laboratory tests,the HB-GSI rock mass strength estimation approach is complemented for conditions where the GSI-equations are not applicable. Guidance is also provided on how to apply the proposed approach whenlaboratory test data are not or not yet available.� 2019 Institute of Rock and Soil Mechanics, Chinese Academy of Sciences. Production and hosting byElsevier B.V. This is an open access article under the CC BY-NC-ND license (http://creativecommons.org/
licenses/by-nc-nd/4.0/).
1. Introduction
Conventional approaches for rock mass strength estimationassume that the failure process is dominated by block rotation ordislocation along joints. However, in massive to moderately jointedhard rock masses, there is not enough kinematic freedom forrelative block movements to occur and thus extensional fractureprocesses within the rock blocks through intact rock must occur atlow confinement and shear rupture through intact rock at highconfinement. These strength-impacting failure processes need tobe considered and a different means for rock mass strengthdetermination should be adopted.
The conventional approach introduced by Hoek and Brown(1980a), most recently updated by Hoek and Brown (2019), was
.ock and Soil Mechanics, Chi-
s, Chinese Academy of Sciences. Prby-nc-nd/4.0/).
established to link the rock mass quality and the nonlinear Hoek-Brown (HB) intact rock strength envelope to estimate thestrength envelope of the rockmass. For this purpose, the GeologicalStrength Index (GSI) strength equations (Eq. 3(a)e(c) in Section 2)were developed (Hoek et al., 1995) to obtain the rock mass pa-rameters mb and s. These GSI-strength equations were establishedfor heavily jointed and blocky rock masses, where the failure pro-cess is associated with block rotation. They have been demon-strated to be flawedwhen applied without modification tomassive,veined, and moderately jointed brittle rocks when GSI typicallyexceeds 65 (Cai et al., 2004). For such rock masses, the GSI-strengthequations are not valid because rock blocks cannot form withoutfailure through intact rock (which includes healed veins). Unfor-tunately, there is currently no methodology available to obtain arepresentative or equivalent rock mass strength envelope formassive to moderately jointed rock masses.
In this context, a methodology is presented to estimate strengthparameters for massive tomoderately jointed brittle rockmasses. Itcovers the relevant confining stress range for deep tunnelling and
oduction and hosting by Elsevier B.V. This is an open access article under the CC BY-

R.P. Bewick et al. / Journal of Rock Mechanics and Geotechnical Engineering 11 (2019) 562e575 563
mining, where both extensional and shear failure modes throughintact rock are anticipated. The merit of this approach is that thestrength of massive to moderately jointed rock masses can beestimated from good quality laboratory triaxial test results. Asummary of the terminologies adopted for this article is presentedin Appendix I.
2. Rock and rock mass failure criteria
A nonlinear failure criterionwas introduced by Hoek and Brown(1980a,b) to first provide intact and then rock mass strength inputsfor the design of underground excavations in rock masses that canbe considered homogenous and isotropic. The intact rock strengthwas established by a fit through laboratory triaxial test data asfollows:
s01 ¼ s03 þ s0ci
�mi
s03s0ci
þ 1�0:5
(1)
where s01 is the major principal effective stress at failure; s03 is theminor principal effective stress at failure; s0ci is the unconfinedcompressive strength of the homogeneous rock; and mi is a ma-terial constant for the homogeneous rock.
For Eq. (1), the unconfined compressive strength s0ci is obtainedby fitting through a series of triaxial test results that include uni-axial compressive strength (UCS) values (i.e. s0ci is not determinedfrom UCS alone). Hoek (1990) then established the generalized HBcriterion for the rock mass:
s01 ¼ s03 þ s0ci
�mb
s03s0ci
þ s�a
(2)
where mb, s and a are the rock mass constants.Later, Hoek (1994) and Hoek et al. (1995) introduced the GSI as a
tool for collecting field information to link engineering geologyobservations to the rock mass strength through the HB failure cri-terion. The GSI is used to scale the intact rock constants mi, s ¼ 1and a¼ 0.5 in Eq. (1) to obtain rockmass constantsmb, s and a in Eq.(2). These scaling equations (Eq. 3(a)e(b)) are called ‘GSI-strengthequations’ as follows:
mb ¼ miexp½ðGSI � 100Þ=ð28� 14DÞ� (3a)
s ¼ exp½ðGSI � 100Þ=ð9� 3DÞ� (3b)
a ¼ 12þ 16
�e�GSI=15 � e�20=3
�(3c)
where D is a parameter that depends upon the degree of distur-bance to which the rock mass has been subjected by blast damageand stress relaxation (Hoek and Brown, 2019).
Hoek and Brown (2019) reiterated that the GSI rock masscharacterization approach is set up to address two principal factorsinfluencing the strength of a rock mass: (1) the blockiness; and (2)the surface conditions of the block-forming joints. It follows thatthe GSI-strength equations (Eq. (3a)e(3c)) are intended for blockyground but not for massive to moderately jointed rock masseswhere blocks do not form without fracturing of intact rock. Acomparison of rock mass descriptions in Fig. 1 suggests that thetransition from jointed rock (with >3 persistent joint sets) tomassive or moderately jointed rock (with <3 persistent joint sets)occurs at approximately GSI � 65 (Cai et al., 2004). For such rockmass conditions, the classification introduced by Terzaghi (1946)suggests spalling conditions and popping rock, which is consis-tent with observations in underground excavations in highly
stressed massive to moderately jointed rock masses. This articletherefore focusses on obtaining the estimates of rock mass strengthparameters for massive to moderately jointed brittle rock masseswith GSI � 65, i.e. when Eq. (3a)e(3c) is not applicable and the rockmass can be considered to have isotropic strength.
2.1. Failure envelopes for massive to moderately jointed hard brittlerock masses
Near excavation boundaries in massive to moderately jointedrock masses, rock predominately fails by extensile processes leadingto the progressive formation of thin slabs of rock referred to as spalls.The tensile fractures initiate in compression due to local tensilestress concentrations which are generated from heterogeneities (e.g.Diederichs, 1999), stemming from both geometric (e.g. grain shapeand size, veinlets, and micro-cracks) and stiffness contrasts (e.g.modulus of different mineral grains and veins of differing materialthan the rock matrix). The extent of tensile fracture propagationdepends on the magnitude of confinement (Hoek, 1968). At lowconfining stresses, tensile fractures can easily propagate and interactwith persistent or non-persistent joints to form a broken or fracturedrock mass (Fig. 2a). Away from excavation boundaries (e.g. in thecore of wide pillars), tensile fractures are inhibited and shear rup-tures form (e.g. Gay and Ortlepp, 1979) (see Fig. 2b). This failureprocess results in short en echelon fractures which eventuallyinteract and coalesce into a propagating shear rupture zone.
Like rock behaviour at the tunnel scale, the rupture mode oflaboratory test specimens also changes with increasing confiningstress (Paterson, 1958; Jaeger and Cook, 1976). In uniaxialcompression, the dominant fracturing process involves long tensilefractures parallel to the applied axial load, resulting in rupture ofthe specimen by axial splitting. As the confining pressure isincreased, the specimen rupture mode will transition from axialsplitting to shear rupture. This transition occurs near the spallinglimit, which is represented in the principal stress space betweenthe ratios of s1/s3 ¼ 10 and 20 (Kaiser et al., 2000). To the left of thespalling limit (low confining stress conditions), the axial splittingdominates, and to the right (high confining stress conditions), theshear rupture dominates. Eventually, at very high confinement, thespecimen failure process becomes ductile, resulting in plastic flowand specimen barrelling.
Whereas the failure processes or failure modes are comparable,the peak strengths in the laboratory and in the field differ.Bieniawski (1967a,b,c) found, from laboratory tests, that cracksinitiate under unconfined compression conditions at stress mag-nitudes of approximately 30%e50% of the UCS, and if the axialstress exceeds approximately 70%e80% of the UCS, the crackdamage (CD) threshold is reached and cracks grow in an unstablemanner (i.e. if the stress is maintained, the specimen fails aftersome time). He suggested that the ‘true’ yield strength of a brittlerock is in the range of 0.7e0.8 of the UCS (i.e. CD threshold). Ob-servations of spalling around tunnels in brittle, massive to moder-ately jointed rock masses by Martin (1993) showed that at lowconfining stresses, the rock mass strength is not equal to the ‘true’yield strength as defined by Bieniawski (1967a,b,c) but instead, it isoften 30%e50% of the UCS, which coincideswith the crack initiation(CI) threshold. This supports the findings that: (1) CI marks thelower limit of the long-term in situ strength of rock; and (2) CI is amaterial property (CI is scale- and stress-path-independent asrecently demonstrated by Amann et al., 2018). Thus, CI dominatesthe strength reduction at low confinement in massive to moder-ately jointed rock masses, and CI determined from axially loadedrock core specimens in the laboratory can reliably be used to definethe strength of massive to moderately jointed rock masses nearexcavation boundaries.

Fig. 1. Comparison of rock mass descriptors from Terzaghi’s classification table (left; modified from Terzaghi, 1946) and quantified GSI-chart (right; modified from Cai et al., 2004).
Fig. 2. (a) Spalled ground behind shotcrete around an underground excavation at low confining stress; and (b) shear rupture zone created ahead of an advancing stope face underhigh confining stress (from Ortlepp, 1997).
R.P. Bewick et al. / Journal of Rock Mechanics and Geotechnical Engineering 11 (2019) 562e575564
At high confinement, rock can be loaded beyond the CIthreshold. This is primarily caused by a change in failure mode. Atconfining stresses beyond the spalling limit, distributed but shortmicrocracks form and coalescence in such a manner to form amacroscopic shear rupture zone, which is consistent with obser-vations made by Ortlepp (1997) at the field scale. Although, athigher confining stresses, i.e. at s1/s3 ¼ 3 to 6 (Bieniawski(1967a,b,c); see Fig. 3), unstable crack growth is suppressed, andthe distributed shear failure processes causing ductile yield (bar-relling) occur, i.e. CD no longer is a control on long-term strength.Thus, the rock mass strength of massive to moderately jointed rock
masses at high confining stresses is: (1) much higher than thedifferential stress at CI; (2) not dominated by unstable crack growth(CD); and (3) equal to a scaled laboratory strength. By use of distinctelement method to simulate highly interlocked, non-persistentlyjointed rock mass, Bahrani and Kaiser (2017) developed a ratio-nale for the estimation of confined peak strength of crack-damagedrocks and suggested methods for the estimation of the confinedstrength of heterogeneous (veined or defected) rocks. This workconfirmed that it is reasonable to assume that the peak strength ofhighly confined massive rock masses is typically around 80% of thelaboratory strength.

Fig. 3. (a) Tri-linear failure envelope (red) relative to a HB intact rock strength envelope. For this example, the spalling strength ranges from 0.3UCS to 0.5UCS, the confined strengthis reduced by a factor of 0.8, and the spalling limit ranges from s1/s3 ¼ 10 to 20, and crack growth suppression limit s1/s3 < 6 after Bieniawski (1967a,b,c); (b) equivalent nonlinearfit (green) satisfying four critical conditions at points 1 to 4 (see text for additional details).
R.P. Bewick et al. / Journal of Rock Mechanics and Geotechnical Engineering 11 (2019) 562e575 565
Due to the changes in failure process and strength withincreasing confining pressure, which are bounded by the spallinglimit, the rock mass strength envelope for massive to moderatelyjointed rock masses is often of a S- or tri-linear shape (Kaiser et al.,2000; Kaiser and Kim, 2015). This envelope is shown together withthe HB peak strength envelope obtained in the laboratory for intactrock in Fig. 3a. The solid red lines provide the anticipated range forthe rock mass strength given the laboratory strength of the intactrock. The rockmass strength starts at the spalling strength obtainedfrom CI in laboratory tests, transitions within a spalling limit rangeof s1/s3 ¼ 10 to 20, and then follows the confined strength at 80% ofthe laboratory strength.Whereas CI controls the rockmass strengthto the left of the spalling limit, scale effects control the confinedrock mass strength to the right of the spalling limit at the tunnelscale. The rock mass strength of massive to moderately jointed rockmasses at low and high confining stresses can thus be determinedfrom laboratory tests.
Whereas the tri-linear envelope (solid red envelope in Fig. 3a)can be established from laboratory tests, it is still necessary torepresent the tri-linear envelope by a nonlinear (or linear) envelopeas current numerical stress modelling tools often cannot accom-modate the tri-linear envelope. The resulting ‘equivalent’ envelope
Fig. 4. Rock mass with joint bounded blocks con
(shown in green; see Fig. 3b) must satisfy four conditions: (1)tensile strength of the rock mass; (2) unconfined rock massstrength (spalling strength); (3) strength at the spalling limittransition from spalling to shear rupture; and (4) strength atconfining stress at the transition to ductile behaviour (e.g. at s1/s3 z 6) where the shear failure envelope of the massive rock massis reached.
2.2. Massive to moderately jointed rock masses with vein networks(heterogeneous rocks)
The HB-GSI approach as well as rock testing methods, e.g. ISRM(1979) and ASTM (1991) and Fairhurst and Hudson (1999), weredeveloped for homogeneous rocks. Therefore, for massive tomoderately jointed rock masses composed of homogeneous rocks,the intact rock strength can be determined using UCS, triaxialcompressive strength (TCS), and Brazilian indirect tensile strength(BTS) (Bewick et al., 2015). When strong homogeneous rock spec-imens are tested, the predominant failure type of the specimen isfracturing through intact rock that does not contain visible frac-tures, and foliations, or veins. Thus, the laboratory strength testresults are representative and often follow a normal distribution
taining heterogeneities in the form of veins.
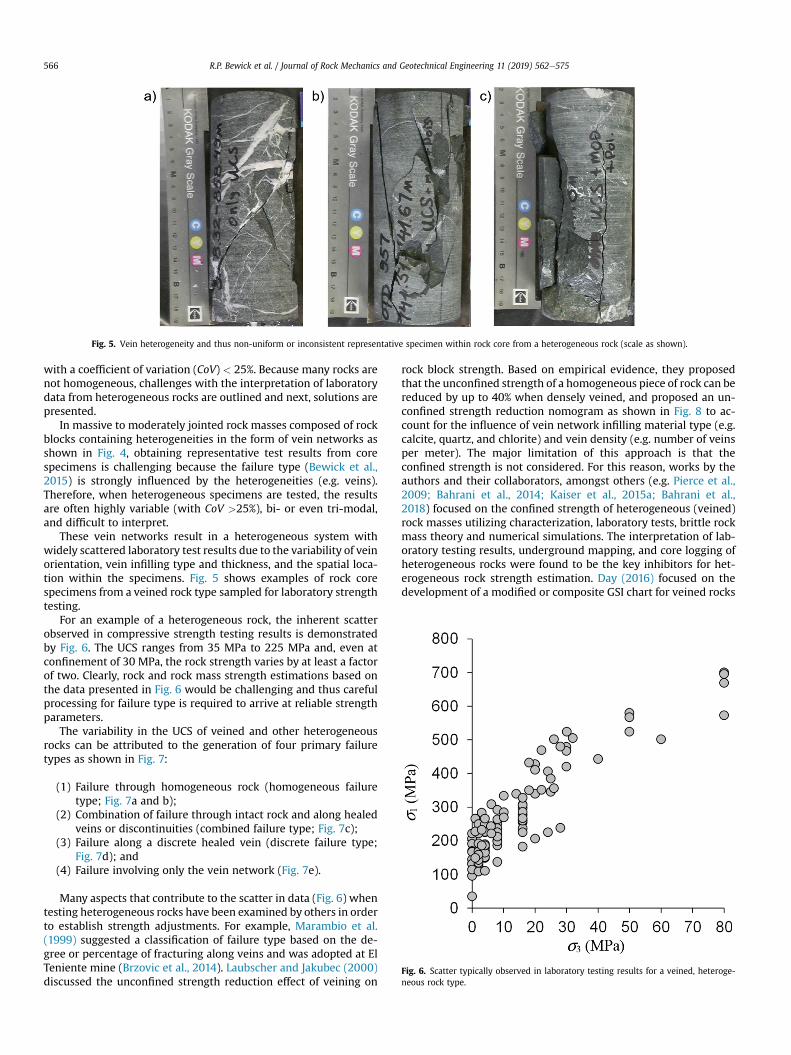
Fig. 5. Vein heterogeneity and thus non-uniform or inconsistent representative specimen within rock core from a heterogeneous rock (scale as shown).
Fig. 6. Scatter typically observed in laboratory testing results for a veined, heteroge-neous rock type.
R.P. Bewick et al. / Journal of Rock Mechanics and Geotechnical Engineering 11 (2019) 562e575566
with a coefficient of variation (CoV) < 25%. Because many rocks arenot homogeneous, challenges with the interpretation of laboratorydata from heterogeneous rocks are outlined and next, solutions arepresented.
In massive to moderately jointed rock masses composed of rockblocks containing heterogeneities in the form of vein networks asshown in Fig. 4, obtaining representative test results from corespecimens is challenging because the failure type (Bewick et al.,2015) is strongly influenced by the heterogeneities (e.g. veins).Therefore, when heterogeneous specimens are tested, the resultsare often highly variable (with CoV >25%), bi- or even tri-modal,and difficult to interpret.
These vein networks result in a heterogeneous system withwidely scattered laboratory test results due to the variability of veinorientation, vein infilling type and thickness, and the spatial loca-tion within the specimens. Fig. 5 shows examples of rock corespecimens from a veined rock type sampled for laboratory strengthtesting.
For an example of a heterogeneous rock, the inherent scatterobserved in compressive strength testing results is demonstratedby Fig. 6. The UCS ranges from 35 MPa to 225 MPa and, even atconfinement of 30 MPa, the rock strength varies by at least a factorof two. Clearly, rock and rock mass strength estimations based onthe data presented in Fig. 6 would be challenging and thus carefulprocessing for failure type is required to arrive at reliable strengthparameters.
The variability in the UCS of veined and other heterogeneousrocks can be attributed to the generation of four primary failuretypes as shown in Fig. 7:
(1) Failure through homogeneous rock (homogeneous failuretype; Fig. 7a and b);
(2) Combination of failure through intact rock and along healedveins or discontinuities (combined failure type; Fig. 7c);
(3) Failure along a discrete healed vein (discrete failure type;Fig. 7d); and
(4) Failure involving only the vein network (Fig. 7e).
Many aspects that contribute to the scatter in data (Fig. 6) whentesting heterogeneous rocks have been examined by others in orderto establish strength adjustments. For example, Marambio et al.(1999) suggested a classification of failure type based on the de-gree or percentage of fracturing along veins and was adopted at ElTeniente mine (Brzovic et al., 2014). Laubscher and Jakubec (2000)discussed the unconfined strength reduction effect of veining on
rock block strength. Based on empirical evidence, they proposedthat the unconfined strength of a homogeneous piece of rock can bereduced by up to 40% when densely veined, and proposed an un-confined strength reduction nomogram as shown in Fig. 8 to ac-count for the influence of vein network infilling material type (e.g.calcite, quartz, and chlorite) and vein density (e.g. number of veinsper meter). The major limitation of this approach is that theconfined strength is not considered. For this reason, works by theauthors and their collaborators, amongst others (e.g. Pierce et al.,2009; Bahrani et al., 2014; Kaiser et al., 2015a; Bahrani et al.,2018) focused on the confined strength of heterogeneous (veined)rock masses utilizing characterization, laboratory tests, brittle rockmass theory and numerical simulations. The interpretation of lab-oratory testing results, underground mapping, and core logging ofheterogeneous rocks were found to be the key inhibitors for het-erogeneous rock strength estimation. Day (2016) focused on thedevelopment of a modified or composite GSI chart for veined rocks

Fig. 7. Failure types in veined laboratory test specimens before and after testing (modified from Bewick et al., 2015): (a) homogeneous break via splitting; (b) homogeneous breakvia shear rupture; (c) combined break; (d) discrete vein break; and (e) break around/along veins, clasts or nodules.
Fig. 8. Reduction in unconfined rock strength due to veining. Nomogram createdbased on Laubscher and Jakubec (2000).
R.P. Bewick et al. / Journal of Rock Mechanics and Geotechnical Engineering 11 (2019) 562e575 567
to estimate the rock mass strength. Others, including Mas Ivars(2010), Brzovic et al. (2014), Turichshev and Hadjigeorgiou (2015),Vallejos et al. (2016), and Bahrani et al. (2018), investigated theinfluence of veins on rock strength using synthetic rock massmodels and calibrated them on laboratory triaxial test results fromveined rock cores. These investigations show that many charac-teristics of veins (e.g. strength, geometry, and stiffness) impact boththe rock mass strength and modulus.
Unfortunately, there is no consensus on how to arrive at thestrength of massive to moderately jointed rock masses containingrock blocks with heterogeneities (veins). In addition, there is noconsistent treatment of heterogeneous rocks for rockmass strengthinterpretation purposes available in the literature. In the following,a methodology is presented to estimate the rock mass strength formassive to moderately jointed homogeneous and heterogeneous
rock masses. Emphasis is placed on a consistent interpretationprocess. This is illustrated on a heterogeneous biotite quartzmonzonite (BQM; rock type; testing procedures described inAppendix II) rock testing dataset in Section 3 and application of theprocess on a large dataset including ten heterogeneous intact rocktypes in Section 4.
3. Strength of heterogeneous biotite quartz monzonite
A comprehensive UCS and TCS dataset from a heterogeneousBQM is used to determine massive to moderately jointed rock massstrength from laboratory testing data. The impacts of failure type onthe rock’s compressive strength are illustrated, and a means for theconsistent treatment of heterogeneous rock testing data is pre-sented. Unfortunately, tensile strength testing data or failure modeclassifications (axial splitting, mixed shear-axial failure, and shearrupture) for determination of the spalling limit are not currentlyavailable for this rock type.
This section is structured to determine the tri-linear failureenvelope starting at the CI threshold and ending at the confinedrock mass strength envelope. It is shown that filtering for threeprimary failure types (axial splitting, mixed shear-axial failure, andshear rupture) is necessary to interpret the BQM test data. Theresulting interpretations provide strength characteristics for eachfailure type which improves the understanding of the impact ofheterogeneities (in this case veins) on a rock’s peak strength. Theinterpretation methodology presented in this section is not limitedto the BQM and a normalized dataset containing 554 test results ofa variety of heterogeneous rock types, classified by failure type, andvein infilling is presented in Section 4.
3.1. Strength test data and interpretation for representativestrength envelope
The failure type of each specimen was assessed and groupedinto the following categories: (1) homogeneous; (2) combined; and

Fig. 9. Failure type classifications (before and after testing) in BQM core 63 mm diameter for scale: (a), (b) homogeneous; (c), (d) combined; and (e), (f) discrete.
R.P. Bewick et al. / Journal of Rock Mechanics and Geotechnical Engineering 11 (2019) 562e575568
(3) discrete vein as outlined previously in Section 2.2. Examples ofthe three BQM failure type classes are shown in Fig. 9 before andafter testing. The resulting dataset is presented in Fig. 10 sorted byfailure type. The scatter in the testing data can largely be attributedto the failure types. In the following sections, the homogeneous andcombined failure types are interpreted. The procedure for pro-cessing discrete failure type data is outlined in Appendix III and thefindings are integrated in Sections 3.3 and 3.4.
For the rock mass strength determination in the low confine-ment range, it is necessary to establish the CI threshold. As outlinedin Section 2.1, the CI threshold represents the in situ unconfinedcompressive strength for massive to moderately jointed rockmasses (see fitting point 2 in Fig. 3b).
3.2. Crack initiation threshold
The low confinement rock mass strength (left of the spallinglimit) is determined from the laboratory measured CI (as outlinedin Section 2.1). The CI stress magnitudes were assessed for thehomogenous and combined failure type test data up to 50 MPa ofconfining stress. Fig. 11a shows the CI magnitudes sorted by failuretype for the UCS tests alone (which includes the discrete failure
Fig. 10. Dataset for BQM sorted by failure type.
type for comparison purposes), and Fig. 11b shows the homoge-neous and combined failure type CI magnitudes up to 50 MPa ofconfining stress along with the TCS results. Since CI is often statednormalized to UCS, the UCS values of the homogeneous and com-bined failure types are summarized in Table 1 and Fig. 11a as UCS50(values converted to 50 mm core diameter).
The CI values shown in Fig.11a for the homogeneous failure typeat 45 MPa and the combined failure type at 27 MPa are lowercompared to hard brittle rocks when normalized to the UCS50values, i.e. homogeneous (CI/UCS50 ¼ 45/206¼ 0.22) and combined(CI/UCS50 ¼ 27/140 ¼ 0.19). The discrete CI magnitudes are in linewith the combined failure type classified specimens, suggestingvein control on CI.
The CI results in Fig. 11d, plotted as differential stress, indicatethat CI is independent of confining stress. While the last finding isnot new and consistent with the findings of others (e.g. Diederichs,1999; Amann et al., 2011), the lower CI found for the combinedfailure type compared to the homogeneous failure type and theoverall low CI/UCS ratio (0.22 and 0.19, for homogenous and com-bined, respectively) in veined rocks are new.
3.3. Triaxial compressive strength
The confined rock mass strength is scaled to the right of thespalling limit (as outlined in Section 2.1) from the overall HB fit tothe laboratory data. Using the procedure outlined by Hoek andBrown (1997), separate HB failure envelopes were obtained forthe test results from specimens with homogeneous and combinedfailure types and the envelope for discrete failure types was ob-tained by the processing procedure summarized in Appendix III.The test results plotted in the principal stress space are shown forhomogeneous failure type in Fig.12a, and are combined failure typein Fig. 12b together with the fitted HB envelopes. The resulting HBfitting parameters sci and mi are summarized in Table 1 along withthe coefficient of determination (R2) and the average UCS50 values.
The three strength envelopes (homogeneous, combined, anddiscrete) are presented in Fig. 12c to illustrate how the strengthdecreases from the homogeneous failure type (or specimens not orminimally impacted by veins) to the combined failure type (failurethrough homogeneous rock and along veins), and to the discretefailure type (failure along a single predefined healed plane ofweakness). It is important to note that the discrete failure envelopehas a non-zero intercept at zero confinement, indicating a cohesivestrength component. The homogeneous failure type is strongest atzero confining pressure but the mi value for the combined failuretype (mi ¼ 31.3) is 1.8 times that of the homogeneous failure type(mi ¼ 17.5) because of the higher dilatant characteristics of het-erogeneous rocks at low confinement. Thus, as confining pressuresincrease, the strength of the combined failure type tends towards,

Fig. 11. (a) CI versus UCS; (b) CI data in principal stress space shown with peak strength data used in the CI assessment; (c) ‘Zoomed’ in view of the CI data in the principal stressspace; and (d) CI data plotted to show that CI is independent of confining stress.
Table 1Summary of HB parameters for homogeneous and combined failure types.
Failure type sci (MPa) mi R2 Average UCS50 (MPa)
Homogeneous 248 17.5 0.93 206Combined 128 31.3 0.94 140
Note: UCS50 is the UCS normalized to 50 mm specimen diameter.
R.P. Bewick et al. / Journal of Rock Mechanics and Geotechnical Engineering 11 (2019) 562e575 569
but never reaches, that of the homogeneous (i.e. the strengthreduction impact of veins decreases with increasing confiningstress). At low confining stresses, shearing along veins induces in-ternal extension failure and causes the specimen to dilate (to theleft of the spalling limit). With increasing confining stress (to theright of spalling limit), dilatancy is increasingly suppressed andfailure is forced by shear through the rock matrix, thus eliminatingsome of the strength lowering effect of the veins. At s3 < UCS/10,the strength is highly variable and much lower than that at higherconfinements (e.g. in the range of 50%e80%UCS at s3 ¼ 20 MPa).
These envelopes are interpreted as representing three strengthcomponents of veined rock. Like the rock mass strength scalingconcepts for jointed rock masses (Hoek and Brown, 1980a,2019),where the rock mass has a scaled strength from the homogeneousintact rock to the rock mass based on the spacing of joint sets (rock
block size) and block bounding joint surface character, the strengthof veined rock can be obtained by scaling from the homogeneousstrength component. From the results presented for the BQM,strength reduction of massive to moderately jointed rock masses iscaptured in the laboratory. However, because the laboratory scalestill does not capture specimen scale effects in the confined region(i.e. right of the spalling limit), it is scaled by an additional 20% to afactor of 0.8 of the strength to obtain the confined rock massstrength for both the homogeneous and combined failure types.
3.4. BQM rock mass strength envelope
In Fig. 13, the tri-linear rockmass strength envelopes of the BQMrock mass for homogeneous failure type (Fig. 13a) and combinedfailure type (Fig. 13b) are presented using the unconfined rockmassstrengths (outlined in Section 3.2 for BQM CI; see point A in Fig. 13),a spalling limit of 15 (Area B), and the confined rock strengthsscaled by a reduction factor of 0.8 to the right of the spalling limit(outlined in Section 3.3; Area C in Fig. 13). These tri-linear enve-lopes are representative of the rock mass strength in the field forthe massive to moderately jointed BQM rock masses. The homo-geneous failure type rock mass strength relates to failure processesor volumes of rock where veins or other defects are playing a minor

Fig. 12. (a) Homogeneous failure type HB fit, (b) combined failure type HB fit, and (c) homogeneous, combined, and discrete envelopes on one plot. See Table 1 for fittingparameters.
Fig. 13. BQM rock mass strength: (a) Homogeneous failure type laboratory strength (Fig. 12a) and interpreted rock mass tri-linear strength, and (b) Combined failure type laboratorystrength (Fig. 12b) and interpreted rock mass tri-linear strength. Also showing the discrete failure type strength for reference.
R.P. Bewick et al. / Journal of Rock Mechanics and Geotechnical Engineering 11 (2019) 562e575570
role while the combined failure type rock mass strength relates tofailure processes or volumes of rock, where both fracturing throughthe rock and along veins occur.
It is of interest to note that the peak strength of the homoge-neous rock mass converges at high confinement (>60 MPa) towardthe strength of discrete failure types. Also, the peak strength of theheterogeneous rock mass with combined failure type converges atconfinements exceeding the spalling limit (>15 MPa in this case)toward the strength of the discrete failure type. It follows that theconfined strength of a heterogeneous rock mass with a vein densitymay be able to be approximated by the strength of the discretefailure type (after proper processing as described in Appendix III).This is investigated further in Section 4 with a larger and morecomprehensive dataset.
4. Heterogeneous (veined) hard brittle rock strength
Laboratory strength testing datasets of heterogeneous rocktypes have been processed and are summarized in Appendix IV toconfirm the general applicability of the strength interpretationprocess outlined in Section 3 and to understand the broader impactof veins on the rock strength. The complied dataset contains 554compressive strength test results for ten heterogeneous rock types.The cores are veined with vein infilling ranging in Moh’s hardnessfrom 2 to 4 (typically vuggy altered quartz, calcite, chlorite, and
pyrite), based on Laubscher and Jakubec (2000). The test data wereclassified by three failure types (homogeneous, combined, anddiscrete) and fitted for the homogeneous and combined failuretypes with HB envelopes as outlined in previous sections. Thediscrete failure type is processed using the procedure summarizedin Appendix III. The HB fitting parameters are summarized inTable A3 in Appendix IV along with the discrete vein strength pa-rameters c, (f þ i) (friction plus dilation angle), and sc. For clarity,UCSi, sci andmi are used to describe the properties of homogeneousfailure type, UCScc, scc andmc for rock failing with combined failuretype, and UCSd for the discrete failure type. The dataset wasnormalized to each rock type’s homogeneous compressive strength(sci) for comparative purposes.
The normalized datasets with homogeneous and combinedfailure types are plotted in Fig. 14a and then are separatelyconsidered with respective HB strength envelope fits in Fig. 14b andc. The specimens with combined failure type have an averagecompressive strength intercept of scc ¼ 0.65sci and mc ¼ 20 is 1.33times higher than the mi ¼ 15. For the ten rock types listed inTable D1, eight of ten rock types show mc-values ranging between1.3 and 1.9 times mi. One rock type could not be fitted to obtain miwhile the SK (Skarn) rock type has a ratio below 1 due to theinsufficient homogeneous failure type data. As explained in Section3.3 for the BQM, higher mi-values are found for the combinedfailure type because of elevated dilation at low confining stress as

Fig. 14. Homogeneous and combined failure types for the dataset summarized in Table A3 (Appendix IV): (a) Triaxial testing data scatter plot showing homogenous and combinedfailure points; (b) HB fit for the homogeneous failure type; (c) HB fit for the combined failure type; and (d) Comparison of HB envelopes and discrete failure envelopes (also shown isscaled confined rock strength by factor 0.8 to the right of a spalling limit of 10).
Table 2Normalized UCS50 statistics by various failure types.
Failure type Mean Minimum Maximum SD CoV Count
Homogeneous (UCSi) 1.01 0.44 2.21 0.26 26% 92Combined (UCScc) 0.61 0.10 1.28 0.19 32% 133Discrete (UCSd) 0.47 0.12 1.19 0.22 47% 43Available UCS data 0.73 0.10 2.21 0.31 43% 269
Note: SD is the standard deviation.
R.P. Bewick et al. / Journal of Rock Mechanics and Geotechnical Engineering 11 (2019) 562e575 571
discussed. As also found for the BQM rock type in Section 3, at highconfinement, the strength of the combined failure type can beapproximated by the strength of discrete failure type as shown inFig. 14d where the grey area represents the mean and upper boundenvelopes of the discrete failure type. This grey area contains thecombined failure type 0.8 times reduced confined strength enve-lope. Confirming this strength reduction with this large dataset isintriguing as it shows that the strength of discrete veins could be acontrol on the confined strength and shows how scale effectsdominate the reduction in strength from the laboratory.
The UCS testing data (normalized to 50 mm core diameter, i.e.UCS50) were processed separately. The summary of the impact offailure type on the mean UCS50 and the CoV is provided in Table 2.
The specimens with homogeneous failure type have, per defi-nition, amean normalizedUCSi50/sciz 1 and a relatively low CoV of26%. Those with combined failure type have a reduced strength atUCScc50/sci ¼ 0.61 and a CoV value of 32%. The best fit strength ofthe combined failure type is consistently lower by about 0.39sci.Specimens with discrete failure type resulted in an even lowermean unconfined strength of UCSd50/sci ¼ 0.47 and a CoV of 47%.
The UCS50 values for the unsorted dataset (not by failure type)are plotted in a histogram in Fig. 15a and for the sorted data (byfailure type) in Fig. 15b. Comparing Fig. 15a and b, the mean UCS50
for homogenous failure type is around the 80th percentile of thecumulative frequency distributionwhereas those for combined anddiscrete failure types are centred around 40% and 20%, respectively.This information can be used to anticipate UCS50 distributions inunfiltered datasets when the actual specimens or high-qualityspecimen photographs are not available for interpretation.
The impact of vein infilling (i.e. hardness) was assessed for thespecimens with combined failure type and the results are sum-marized in Table 3.
In Table 3, within the Moh’s hardness ranging from 2 to 4, thereseems to be little impact of the hardness on the mean normalizedUCS50 (the mean normalized UCS50 values ranging from 0.59 to0.63). The CoV, however, progressively increases from 17%-29%e46% for Moh’s hardness of 4-3 and 2, respectively. The nomogram

Fig. 15. UCS50 histograms showing (a) overall UCS50 distribution not sorted by failure type and (b) UCS50 distributions by failure types of homogeneous, combined, and discrete.
Table 3Combined failure type normalized UCS50 statistics by Moh’s hardness.
Moh’s hardness Mean Minimum Maximum SD CoV (%) Count
2 0.59 0.1 1.28 0.27 46 273 0.63 0.22 1.05 0.18 29 664 0.59 0.51 0.78 0.1 17 6
Note: SD is the standard deviation.
R.P. Bewick et al. / Journal of Rock Mechanics and Geotechnical Engineering 11 (2019) 562e575572
developed by Laubscher and Jakubec (2000), presented in Fig. 8,suggests that a higher vein hardness should reduce the strengthfrom the homogeneous rock strength by about 5% for a given veinintensity. Even though there is insufficient data to conclusivelycomment on the validity of the entire nomogram shown in Fig. 8,the results presented in this article suggest that for veins withhardness ranging from 2 to 4, and for similar vein intensities, themean strength reduction should be similar, but the variability isexpected to increase with decreasing vein hardness, i.e. Moh’shardness from 4 to 2.
The dataset presented in this section shows that the impact offailure type is applicable to various heterogeneous rock types.There is a constant normalized strength reduction from homoge-neous failure type to combined failure type strength for veins witha Moh’s hardness ranging from 2 to 4 and a consistently higher mi-value for the combined failure type. In addition, the confined rockmass strength is controlled by the strength of the discrete veins.The results also show that a heterogeneous rock type’s distributionof UCS50 test results can be used to estimate the UCS of the ho-mogeneous, combined, and discrete failure type strength compo-nents when failure type classifications are not available.
In the following section, guidelines are presented to estimateequivalent rock mass strength envelopes for massive to moderatelyjointed rock masses in both homogeneous and heterogeneousrocks. Such equivalent rock mass strength envelopes are neededwhen the tri-linear strength envelopes from laboratory strengthtesting must be approximated for analytical or numerical stressmodels.
5. Guidance on obtaining equivalent rock mass strengthenvelopes
5.1. Tri-linear strength envelope
The tri-linear envelope is divided into four parts as illustrated byFig. 3a:
(1) The tensile strength; Hoek and Brown (2019) providedguidance for this purpose;
(2) The spalling strength defined by the CI threshold which isdetermined from laboratory testing or assumed to rangebetween 0.22 and 0.4UCS50 for homogeneous failure typeand 0.19e0.3UCS50 for the combined failure type;
(3) The spalling limits, defined as the ratio between themajor andminor principal stress s1/s3. It ranges from 10 to 20 (a lowerrange,10e15, is applicable for heterogeneous rocks and is to beanticipated at the rock mass scale; unless the transition fromaxial splitting to shear rupture is determined from laboratorytest failure modes, s1/s3 ¼ 10 to 15 can be assumed); and
(4) The confined strength of the rock mass is obtained byreducing the homogeneous and combined failure type HBenvelopes to 80% due to scale effects to the right of thespalling limit.
5.2. Laboratory testing for tri-linear envelope determination
Laboratory testing should be completed to determine the tri-linear envelope by considering the following:
(1) Test program for homogeneous rocks at a minimum shouldprovide six data points with three left and three right of anassumed spalling limit; substantially more, up to five timesmore, tests may be required for heterogeneous rock types.
(2) Prior to data interpretation, data should be normalised to thediameter of a 50 mm specimen.
(3) Invalid data is to be removed (including tests that do notconform to a length to diameter ratio of 2.0e2.5; if limiteddata are available, the authors typically remove tests with alength to diameter ratio < 1.8).
(4) Data must be filtered for axial splitting, shear-axial (or mixedmode), and shear failure modes to assess the spalling limit.
(5) Data must be filtered for homogeneous, combined anddiscrete failure types.
(6) CI is determined in the laboratory as this represents the rockmass strength at low confining stress (left of the spallinglimit) for each failure type.
(7) Data should only be fitted in the brittle failure zone definedby s1/s3 > 3 to 6.
(8) Fitting of HB envelopes should utilize tensile test data ifreliable. If only Brazilian indirect tensile testing data areavailable, these tests should be reduced by the factors 0.7, 0.8,

R.P. Bewick et al. / Journal of Rock Mechanics and Geotechnical Engineering 11 (2019) 562e575 573
and 0.9 for sedimentary, igneous, and metamorphic rocks,respectively (Perras and Diederichs, 2014) and used withcaution (Hoek and Brown, 2019).
5.3. Equivalent rock mass strength envelopes
The equivalent HB rock mass strength envelope is determinedby fitting the tri-linear envelope separately for the homogeneousand combined failure types to capture the following (see Fig. 3a andb):
(1) The tensile strength of the rock mass: Hoek and Brown(2019) provided guidance for this purpose.
(2) The unconfined rock mass compressive strength which is thespalling strength determined from CI.
(3) The strength at the transition from spalling to shear failurebased on spalling limits s1/s3 ¼ 10 to 20 (midpoint betweenCI and rock mass confined strength at spalling limit).
(4) The strength at the confinement when the shear failure en-velope of the rock mass (80% of the confined laboratorystrength) is reached. This point should be selected at apractically meaningful confining stress, i.e. at a confinementwhere no strength loss is anticipated (typically at s1/s3 � 6).
For the homogeneous failure type envelope of the BQM, theequivalent HB envelope is shown in Fig. 16a (fitted to points 2 to 4in Fig. 3 only because no tensile strength data are available). Thisenvelope was fitted following the above listed interpretation steps.It starts at a compressive strength of the rock mass, srm ¼ 45 MPa(i.e. CI is the unconfined rock mass strength or spalling limit) and isrepresented by rock mass constants mrm ¼ 24, srm ¼ 1, andarm ¼ 0.65. As shown in Fig. 16b, with increasing confinement, theequivalent rock mass strength in parts under-, over- and then againunder-estimates the tri-linear strength for this rock mass. For thecase presented in Fig. 16, a confining stress s3 ¼ 60 MPa at s1/s3 ¼ 8.3 was selected for the intersection point 4 (Fig. 3). Thismeans that the equivalent rock mass strength tends to underesti-mate the actual (tri-linear) rockmass strength between the spallinglimit and s3 ¼ 60 MPa. The fitting procedure must respect the fourpoints listed above and balance the areas of over- and under-estimation depending on the relevant confining range for a given
Fig. 16. BQM homogeneous failure type tri-linear envelope from Fig. 13a, fitted with an eqcomparison to the tri-linear envelope showing areas of over- and under-estimation of rockestimated in this example. Points 2e4 as outlined in Fig. 3 are also shown.
engineering problem. The areas of over- and underestimation are acompromise to capture the strength at both low (left of the spallinglimit) and high confinement (right of the spalling limit).
Numerical stress modelling sensitivities were completed byKaiser et al. (2015b) using the equivalent rock mass strength en-velope approach. The assessment of both low confinement andhigh confinement aspects were captured sufficiently to haveconfidence in the peak strength estimation approach presentedhere. It is beyond the scope of this article to cover the issue ofpost-peak strength determination for brittle hard rock masses andthe reader is referred to Kaiser (2016a,b). However, it is importantto point out that when the above-recommended approach forequivalent peak rock mass strength determination is followed,field confirmation by analytical and numerical models must makeuse of appropriate post-peak strength models. Most stress modeloutcomes are sensitive to the adopted plastic strain-dependentpost-peak strength loss model and this must be consideredwhen confirming the validity of the adopted equivalent peakstrength model.
5.4. Rock mass strength determination when limited laboratory testdata are available
It is often impossible to obtain test data of good quality aspresented in this article. Furthermore, it is often necessary toestablish meaningful rock mass strength parameters during studiesor for locations where detailed rock test data are not yet or willnever be available. In such situations, if the CI threshold and spal-ling limit are not determined from laboratory test data, it isnecessary to make meaningful geomechanics assumptions. Kaiser(2016b,c) provided guidance for this purpose and the followingsimplifications can be made:
(1) Estimate the laboratory homogeneous failure type envelope:
uivalentmass s
C Estimate a range of UCSi and select a representative value.C Estimate mi range using Table 8.3 as indicated in Hoek
et al. (1995).C Estimate tensile strength representative value and range.
(2) Estimate the laboratory combined failure type envelope:
C Estimate UCScc based on the dataset in this article,UCScc z 0.65UCSi.
rock mass strength envelope. (b) Equivalent rock mass strength envelope intrength for a spalling limit of s1/s3 ¼ 15. Note that tensile strength is under-

R.P. Bewick et al. / Journal of Rock Mechanics and Geotechnical Engineering 11 (2019) 562e575574
C Estimate mc usingmc ¼ 1.4mi based on the dataset in thisarticle (possible range mc ¼ 1.3e1.9mi).
C Estimate tensile strength representative value and range.
(3) Estimate of rock mass strength:C For the low confinement range, use mi ¼ 0; CIhomogeneous ¼ 0.3UCSi (range between 0.2UCSi and0.4UCSi); CI combined ¼ 0.24UCScc (range between0.2UCScc and 0.3UCScc).
C Approximate spalling limit as s1/s3 ¼ 15 (range of s1/s3 ¼ 10 to 20).
C For the high confinement range, the confined laboratorystrength for the homogeneous and combined failuretypes is both reduced by 0.8.
The above listed guidance likely underestimates the rock massstrength of massive to moderately jointed rock masses consideringthe data presented in this article, but it is a reasonable startingpoint when limited testing data are available and some conserva-tism is required. As more test data become available, the validity ofeach set of parameters needs to be confirmed or adjusted. Forexample, triaxial tests should be used to evaluate and anchor thehigh confinement strength envelope. Furthermore, as soon as un-derground access is provided, the consequences of the resultingestimated rock mass strength need to be confirmed again by fieldobservation of near excavation behaviour.
6. Conclusions
The HB-GSI equations for estimating equivalent rock massstrength were not intended for and are found to be not applicablefor massive to moderately jointed rock masses (i.e. GSI � 65). Forthese rock masses, the field-scale rock mass strength can bedetermined using laboratory strength test data with scale and rockbehaviour adjustments.
Whereas rather limited work has been completed on massive tomoderately jointed rock masses with rock blocks dominated byvein networks or other healed networks of heterogeneities (i.e.heterogeneous or defected rocks), it is shown that, like massive tomoderately jointed rock masses with rock blocks composed ofrelatively homogeneous rock, the rock mass strength of heteroge-neous rocks can also be determined using laboratory testing datawith adjustments for vein network characteristics.
A laboratory compressive strength testing dataset of BQM (aheterogeneous rock type) is presented and processed to introduce amethodology for the estimation of rockmass strength in massive tomoderately jointed rock masses using laboratory data. Critical tothis methodology is the use of high quality and failure type clas-sified laboratory strength data. By classifying the failure of thespecimens as either failure predominately through homogeneousrock (homogeneous), through a combination of fracturing throughhomogeneous rock and along healed discontinuities (combined), orfailure along a single healed discrete discontinuity (discrete), it ispossible to directly determine the impact of heterogeneities on rockstrength reduction over a practically relevant confining stressrange. In addition, it is shown that the heterogeneous rock haslower CI magnitudes than those of homogeneous rocks.
The interpretation methodology was applied to a dataset con-taining 554 compressive tests from ten different rock types. Thedata were sorted by failure type and vein hardness. For veins withMoh’s hardness of 2e4, the mean combined failure typecompressive strength (scc) can be estimated as 0.65 of the homo-geneous compressive strength (sci) whereas the HBmi-value for thecombined failure type (mc) ranges from 1.3 to 1.9 times mi. Theextended dataset also shows that vein hardness impacts thecompressive strength variability but not the average strength.
Most importantly, from a practical perspective, a systematicmethodology for estimating equivalent rock mass strength pa-rameters (generalizing the tri-linear rock strength envelope) isoutlined and guidance is provided to estimate strength parametersets if quality data are not or not yet available. This article thusprovides the means to establish preliminary estimates of rock massstrength from massive to moderately jointed rock masses withoutlaboratory tests. This methodology compliments the HB-GSIapproach for rock mass strength estimation of massive to moder-ately jointed rock masses, i.e. when the generalized HB-GSI equa-tions are not applicable.
Conflicts of interest
The authors wish to confirm that there are no known conflicts ofinterest associated with this publication and there has been nosignificant financial support for this work that could have influ-enced its outcome.
Acknowledgments
The authors wish to acknowledge Rio Tinto for sponsoring muchof the work outlined in this article through the Rio Tinto Centre forUndergroundMine Construction (an affiliate of CEMI) as well as thefinancial contributions of NSERC (Natural Sciences and EngineeringResearch Council of Canada). The list is too long of individuals thathave contributed in some form to the research reflected in thisarticle, but we recognize that much value was derived from dis-cussions and contributions of others. We thank them all in thisanonymous fashion.
Professor Ted Brown has participated in many review panelsrelated to the design of excavations in rock masses composed ofheterogeneous (veined) rock blocks. The challenge identified dur-ing these reviews was often that unreliable rock mass strengthestimates were derived due to inadequate or inappropriate pro-cedures and methodologies of data interpretation. We are thushumbled to be asked to submit this article for publication in avolume honouring Ted Brown. The work presented in this article toaddress these challenges has evolved over the last decade and theauthors hope that our findings will assist the next generation ofunderground projects.
Appendix A. Supplementary data
Supplementary data to this article can be found online athttps://doi.org/10.1016/j.jrmge.2018.10.003.
References
Amann F, Button EA, Evans KF, Blümel M, Gischig VS. Experimental study of thebrittle behavior of clayshale under unconfined compression. Rock Mechanicsand Rock Engineering 2011;44(4):415e30.
Amann F, Le Gonidec Y, Senis M, Gschwind S, Wassermann J, Nussbaum C, Sarout J.Analysis of acoustic emissions recorded during a mine-by experiment in anunderground research laboratory in clay shales. International Journal of RockMechanics and Mining Sciences 2018;106:51e9.
ASTM. D 2938-86. Standard test method for unconfined compressive strength ofintact rock core specimens. ASTM; 1991.
Bahrani N, Kaiser PK, Valley B. Distinct element method simulation of ananalogue for a highly interlocked, non-persistently jointed rock mass.International Journal of Rock Mechanics and Mining Sciences 2014;71:117e30.
Bahrani N, Kaiser PK. Estimation of confined peak strength of crack-damaged rocks.Rock Mechanics and Rock Engineering 2017;50(2):309e26.
Bahrani N, Kaiser PK, Corkum A. Suggested methods for estimation of confinedstrength of heterogeneous (defected) rocks. In: Caving 2018. Vancouver: Can-ada; 2018.
Bewick RP, Amann F, Kaiser PK, Martin CD. Interpretation of UCS test results forengineering design. In: Proceedings of the 13th international congress on rock

R.P. Bewick et al. / Journal of Rock Mechanics and Geotechnical Engineering 11 (2019) 562e575 575
mechanics: ISRM congress 2015 e advances in applied & theoretical rock me-chanics. Montreal, Canada: International Society for Rock Mechanics and RockEngineering; 2015. Paper 521.
Bieniawski ZT. Mechanism of brittle fracture of rock, part I d theory of the fractureprocess. Journal of Rock Mechanics and Mining Sciences and GeomechanicsAbstracts 1967a;4(4):395e404.
Bieniawski ZT. Mechanism of brittle fracture of rock, part II dexperimental studies.International Journal of Rock Mechanics and Mining Sciences & GeomechanicsAbstracts 1967b;4(4):419e23.
Bieniawski ZT. Mechanism of brittle fracture of rock, part II dfracture in tensionand under long-term. International Journal of Rock Mechanics and MiningSciences & Geomechanics Abstracts 1967c;4(4):425e6.
Brzovic A, Schachter P, Santos C de los, Vallejos JA, Mas Ivars D. Characterization andsynthetic simulations to determine rock mass behaviour at the El TenienteMine, Chile. Part 1. In: Caving; 2014. Santiago Chile; 2014.
Cai M, Kaiser PK, Uno H, Tasaka Y, Minami M. Estimation of rock mass strengthand deformation modulus of jointed hard rock masses using the GSIsystem. International Journal of Rock Mechanics and Mining Sciences2004;41(1):3e19.
Day J. The influence of healed intrablock rock mass structure on the behaviour ofdeep excavations in complex rock masses. PhD Thesis. Kingston Ontario Can-ada: Queen’s University; 2016.
Diederichs MS. Instability of hard rock masses: the role of tensile damage andrelaxation. PhD Thesis. University of Waterloo; 1999.
Fairhurst CE, Hudson JA. ISRM suggested method for the complete stress-straincurve for intact rock in uniaxial compression. International Journal of RockMechanics and Mining Sciences 1999;36(3):279e89.
Gay NC, Ortlepp WD. Anatomy of a mining induced fault zone. Geological Society ofAmerica Bulletin 1979;90:47e58.
Hoek E. Brittle failure of rock. In: Stagg KG, Zienciewicz OC, editors. Rock mechanicsin engineering Practice. London: Wiley; 1968. p. 99e124.
Hoek E, Brown ET. Underground excavations in rock. London: The Institution ofMining and Metallurgy; 1980a.
Hoek E, Brown ET. Empirical strength criterion for rock masses. Journalof Geotechnical and Geoenvironmental Engineering 1980b;106(GT9):1013e35.
Hoek E. Estimating Mohr-Coulomb friction and cohesion values from the Hoek-Brown failure criterion. Journal of Rock Mechanics and Mining Sciences andGeomechanics Abstracts 1990;12(3):227e9.
Hoek E. Strength of rock and rock masses. ISRM News Journal 1994;2(2):4e16.Hoek E, Kaiser PK, Bawden WF. Support for underground excavations in hard rock.
Balkema; 1995. p. 215.Hoek E, Brown ET. Practical estimates of rock mass strength. International Journal of
Rock Mechanics and Mining Sciences 1997;34(8):1165e86.Hoek E, Brown ET. The Hoek-Brown failure criterion and GSI e 2018 Edition. Journal
of Rock Mechanics and Geological Engineering 2019;11(3):445e63.International Society for Rock Mechanics (ISRM). ISRM suggested methods for
determining the uniaxial compressive strength and deformability of rock ma-terials. ISRM; 1979.
Jaeger JC, Cook NGW. Fundamentals of rock mechanics. 2nd ed. London: Chapmanand Hall; 1976.
Kaiser PK, Diederichs MS, Martin CD, Sharp J, Steiner W. Underground works inhard rock tunneling and mining. In: Proceedings of the international conferenceon geotechnical and geological engineering. Melbourne, Australia: TechnomicPublishing Company; 2000. p. 841e926.
Kaiser PK, Kim B. Characterization of strength of intact brittle rock consideringconfinement dependent failure processes. Rock Mechanics and Rock Engi-neering 2015;48(1):107e19.
Kaiser PK, Amann F, Bewick RP. Overcoming challenges of rock masscharacterization for underground construction in deep mines. In: Proceedingsof the 13th international congress on rock mechanics: ISRM congress 2015 e
advances in applied & theoretical rock mechanics. Montreal, Canada: Interna-tional Society for Rock Mechanics and Rock Engineering; 2015a.
Kaiser PK, Bewick RP, Amann F, Pierce M. Best practice in rock mass characterizationfor brittle rock masses. Rio Tinto: Rio Tinto Centre for Underground MineConstruction; 2015b. p. 149.
Kaiser PK. Underground rock engineering to match the rock’s behaviour - a freshlook at old problems. In: MTS lecture at the 50th US rock mechanics sympo-sium. American Rock Mechanics Association (ARMA); 2016a.
Kaiser PK. Challenges in rock mass strength determination for design of deep un-derground excavations. ISRM; 2016b.
Kaiser PK. Ground support for constructability of deep underground excavations echallenges of managing highly stressed ground in civil and mining projects. In:Sir muir wood lecture of international tunnelling association at world tunnel-ling congress; 2016. p. 1e33. San Francisco.
Laubscher DH, Jakubec J. The MRMR rock mass classification for jointed rockmasses. In: Underground mining methods: engineering fundamentals and in-ternational case studies. SMME; 2000. p. 475e81.
Marambio F, Pereira J, Russo A. Comportamiento estudio propiedades geotécnicasproyecto Pipa Norte. Internal report SGL-280/1999 of the superintendence ge-ology. CODELCO-Chile El Teniente Division; 1999 (in Spanish).
Martin CD. Strength of massive Lac du Bonnet granite around underground open-ings. PhD Thesis. Canada: University of Manitoba; 1993.
Mas Ivars D. Bonded particle model for jointed rock mass. PhD Thesis. Sweden:Royal Institute of Technology (KTH); 2010.
Ortlepp WD. Rock fracture and rockbursts. South African Institute of Mining andMetallurgy; 1997.
Paterson MS. Experimental deformation and faulting in Wombeyan marble. Bulletinof the Geological Society of America 1958;69(4):465e76.
Perras MA, Diederichs MS. A review of the tensile strength of rock: concepts andtesting. Geotechnical and Geological Engineering 2014;32(2):525e46.
Pierce M, Gaida M, DeGagne D. Estimation of rock block strength. In: Diederichs M,Grasselli G, editors. ROCKENG09, 3rd Can-US rock mechanics symposium;2009. PAPER 4360.
Terzaghi K. Rock defects and loads on tunnel supports. In: Proctor RV, White TL,editors. Rock tunneling with steel supports. Youngstown, OH: CommercialShearing and Stamping Company; 1946.
Turichshev A, Hadjigeorgiou J. Experimental and numerical investigations into thestrength of intact veined rock. Rock Mechanics and Rock Engineering2015;48(5):1897e912.
Vallejos J, Suzuki K, Brzovic A, Mas Ivars D. Application of synthetic rock massmodeling to veined core-size samples. International Journal of Rock Mechanicsand Mining Sciences 2016;81:47e61.
Dr. Rob Bewick consults internationally and is a leadmining rock mechanics engineer in Golder. Dr. Bewick hascompleted expert reviews, site visits, and integrated minescale stability optimizations for several seismic events androckbursts causing damage and closure to mine excava-tions at both the local and global scales. He has providedpractical recommendations for rehabilitation, miningsequence, and ground support for mines in Australia,Brazil, Canada, Indonesia, Sweden, and USA. Rob hasextensive experience in rock mass characterization and indeep and shallow underground hard rock environments aswell as block caving.
Dr. Peter Kaiser joined Laurentian University in 1987 asProfessor of Mining Engineering and Chair for Rock Engi-neering and Ground Control at the Bharti School of Engi-neering. He was the founding President of MIRARCO atLaurentian University and later was seconded to theCentre for Excellence in Mining Innovation (CEMI) asFounding Director and then as Director of the Rio TintoCentre for Underground Mine Construction. Dr. Kaiser is aFellow of the Engineering Institute of Canada (EIC) and theCanadian Academy of Engineers and in 2013 was awardedthe Julian C. Smith Medal of the EIC for “Achievement inthe Development of Canada” He is the author of more than300 technical and scientific geomechanics publications. Asa geomechanics specialist in applied research for under-
ground mining and civil construction, he is consulting to numerous consulting com-panies, mines and public agencies.
Dr. Florian Amann is Professor for Engineering Geology atthe RWTH University in Aachen, Germany. His researchactivities span from fundamental rock mechanics for un-derground excavations and landslides to THM-coupledprocesses associated with deep geothermal energy exploi-tation and nuclear waste repositories.