Embed Size (px)
Citation preview
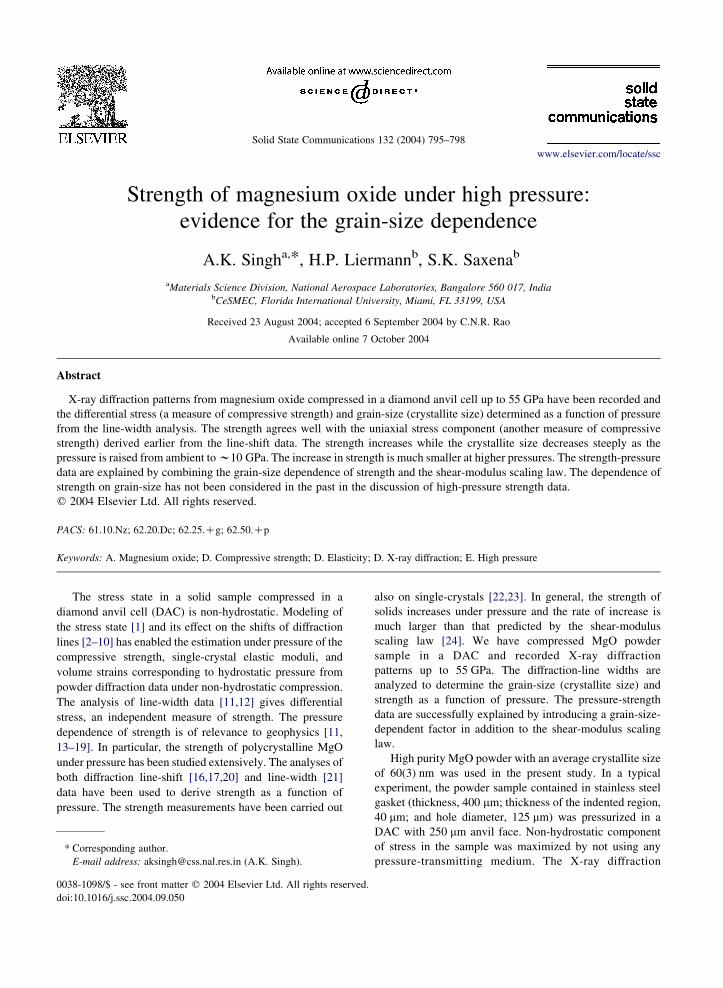
Strength of magnesium oxide under high pressure:
evidence for the grain-size dependence
A.K. Singha,*, H.P. Liermannb, S.K. Saxenab
aMaterials Science Division, National Aerospace Laboratories, Bangalore 560 017, IndiabCeSMEC, Florida International University, Miami, FL 33199, USA
Received 23 August 2004; accepted 6 September 2004 by C.N.R. Rao
Available online 7 October 2004
Abstract
X-ray diffraction patterns from magnesium oxide compressed in a diamond anvil cell up to 55 GPa have been recorded and
the differential stress (a measure of compressive strength) and grain-size (crystallite size) determined as a function of pressure
from the line-width analysis. The strength agrees well with the uniaxial stress component (another measure of compressive
strength) derived earlier from the line-shift data. The strength increases while the crystallite size decreases steeply as the
pressure is raised from ambient to w10 GPa. The increase in strength is much smaller at higher pressures. The strength-pressure
data are explained by combining the grain-size dependence of strength and the shear-modulus scaling law. The dependence of
strength on grain-size has not been considered in the past in the discussion of high-pressure strength data.
q 2004 Elsevier Ltd. All rights reserved.
PACS: 61.10.Nz; 62.20.Dc; 62.25.Cg; 62.50.Cp
Keywords: A. Magnesium oxide; D. Compressive strength; D. Elasticity; D. X-ray diffraction; E. High pressure
The stress state in a solid sample compressed in a
diamond anvil cell (DAC) is non-hydrostatic. Modeling of
the stress state [1] and its effect on the shifts of diffraction
lines [2–10] has enabled the estimation under pressure of the
compressive strength, single-crystal elastic moduli, and
volume strains corresponding to hydrostatic pressure from
powder diffraction data under non-hydrostatic compression.
The analysis of line-width data [11,12] gives differential
stress, an independent measure of strength. The pressure
dependence of strength is of relevance to geophysics [11,
13–19]. In particular, the strength of polycrystalline MgO
under pressure has been studied extensively. The analyses of
both diffraction line-shift [16,17,20] and line-width [21]
data have been used to derive strength as a function of
pressure. The strength measurements have been carried out
0038-1098/$ - see front matter q 2004 Elsevier Ltd. All rights reserved.
doi:10.1016/j.ssc.2004.09.050
* Corresponding author.
E-mail address: [email protected] (A.K. Singh).
also on single-crystals [22,23]. In general, the strength of
solids increases under pressure and the rate of increase is
much larger than that predicted by the shear-modulus
scaling law [24]. We have compressed MgO powder
sample in a DAC and recorded X-ray diffraction
patterns up to 55 GPa. The diffraction-line widths are
analyzed to determine the grain-size (crystallite size) and
strength as a function of pressure. The pressure-strength
data are successfully explained by introducing a grain-size-
dependent factor in addition to the shear-modulus scaling
law.
High purity MgO powder with an average crystallite size
of 60(3) nm was used in the present study. In a typical
experiment, the powder sample contained in stainless steel
gasket (thickness, 400 mm; thickness of the indented region,
40 mm; and hole diameter, 125 mm) was pressurized in a
DAC with 250 mm anvil face. Non-hydrostatic component
of stress in the sample was maximized by not using any
pressure-transmitting medium. The X-ray diffraction
Solid State Communications 132 (2004) 795–798
www.elsevier.com/locate/ssc
A.K. Singh et al. / Solid State Communications 132 (2004) 795–798796
patterns were recorded on an image plate using 10 mm
incident X-ray beam (wavelength lZ0.03678 nm) from
HPCAT synchrotron beam line at the Advanced Photon
Source (APS), Chicago. The first nine diffraction lines from
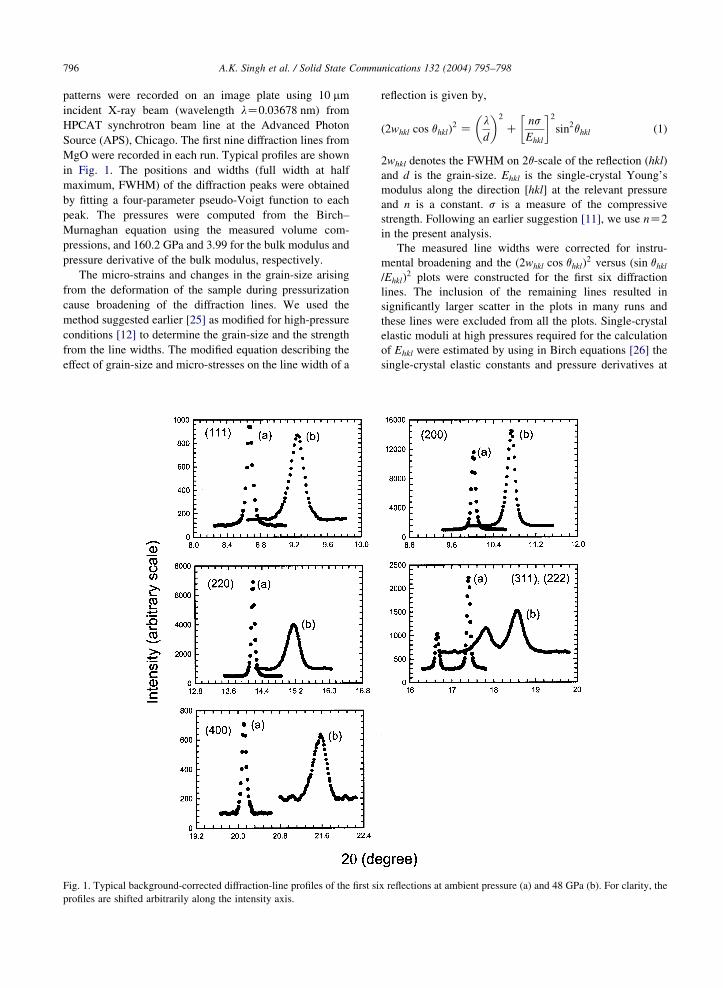
MgO were recorded in each run. Typical profiles are shown
in Fig. 1. The positions and widths (full width at half
maximum, FWHM) of the diffraction peaks were obtained
by fitting a four-parameter pseudo-Voigt function to each
peak. The pressures were computed from the Birch–
Murnaghan equation using the measured volume com-
pressions, and 160.2 GPa and 3.99 for the bulk modulus and
pressure derivative of the bulk modulus, respectively.
The micro-strains and changes in the grain-size arising
from the deformation of the sample during pressurization
cause broadening of the diffraction lines. We used the
method suggested earlier [25] as modified for high-pressure
conditions [12] to determine the grain-size and the strength
from the line widths. The modified equation describing the
effect of grain-size and micro-stresses on the line width of a
Fig. 1. Typical background-corrected diffraction-line profiles of the first si
profiles are shifted arbitrarily along the intensity axis.
reflection is given by,
ð2whkl cos qhklÞ2 Z
l
d
� �2
Cns
Ehkl
� �2
sin2qhkl (1)
2whkl denotes the FWHM on 2q-scale of the reflection (hkl)
and d is the grain-size. Ehkl is the single-crystal Young’s
modulus along the direction [hkl] at the relevant pressure
and n is a constant. s is a measure of the compressive
strength. Following an earlier suggestion [11], we use nZ2
in the present analysis.
The measured line widths were corrected for instru-
mental broadening and the ð2whkl cos qhklÞ2 versus ðsin qhkl
=EhklÞ2 plots were constructed for the first six diffraction
lines. The inclusion of the remaining lines resulted in
significantly larger scatter in the plots in many runs and
these lines were excluded from all the plots. Single-crystal
elastic moduli at high pressures required for the calculation
of Ehkl were estimated by using in Birch equations [26] the
single-crystal elastic constants and pressure derivatives at
x reflections at ambient pressure (a) and 48 GPa (b). For clarity, the
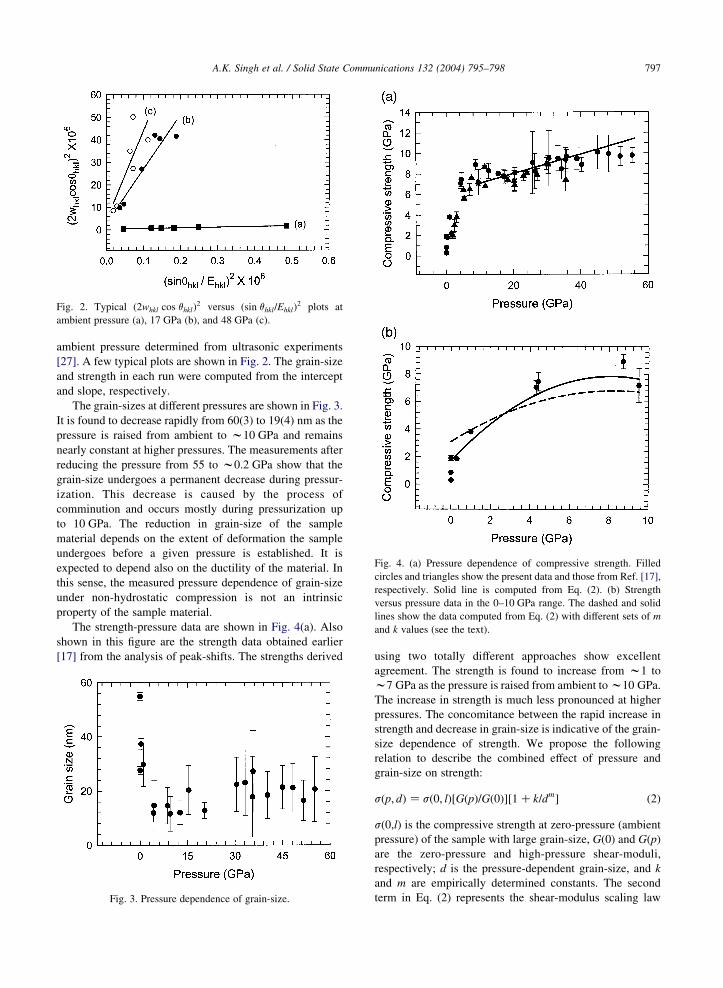
Fig. 2. Typical ð2whkl cos qhklÞ2 versus ðsin qhkl=EhklÞ
2 plots at
ambient pressure (a), 17 GPa (b), and 48 GPa (c).
Fig. 4. (a) Pressure dependence of compressive strength. Filled
circles and triangles show the present data and those from Ref. [17],
respectively. Solid line is computed from Eq. (2). (b) Strength
versus pressure data in the 0–10 GPa range. The dashed and solid
lines show the data computed from Eq. (2) with different sets of m
and k values (see the text).
A.K. Singh et al. / Solid State Communications 132 (2004) 795–798 797
ambient pressure determined from ultrasonic experiments
[27]. A few typical plots are shown in Fig. 2. The grain-size
and strength in each run were computed from the intercept
and slope, respectively.
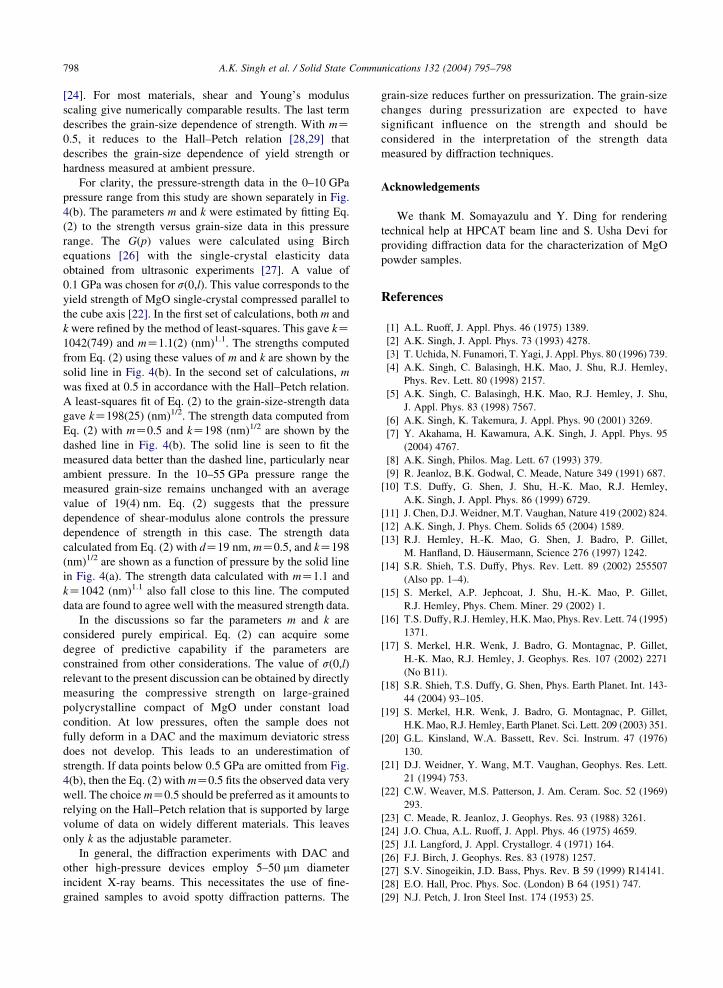
The grain-sizes at different pressures are shown in Fig. 3.
It is found to decrease rapidly from 60(3) to 19(4) nm as the
pressure is raised from ambient to w10 GPa and remains
nearly constant at higher pressures. The measurements after
reducing the pressure from 55 to w0.2 GPa show that the
grain-size undergoes a permanent decrease during pressur-
ization. This decrease is caused by the process of
comminution and occurs mostly during pressurization up
to 10 GPa. The reduction in grain-size of the sample
material depends on the extent of deformation the sample
undergoes before a given pressure is established. It is
expected to depend also on the ductility of the material. In
this sense, the measured pressure dependence of grain-size
under non-hydrostatic compression is not an intrinsic
property of the sample material.
The strength-pressure data are shown in Fig. 4(a). Also
shown in this figure are the strength data obtained earlier
[17] from the analysis of peak-shifts. The strengths derived
Fig. 3. Pressure dependence of grain-size.
using two totally different approaches show excellent
agreement. The strength is found to increase from w1 to
w7 GPa as the pressure is raised from ambient to w10 GPa.
The increase in strength is much less pronounced at higher
pressures. The concomitance between the rapid increase in
strength and decrease in grain-size is indicative of the grain-
size dependence of strength. We propose the following
relation to describe the combined effect of pressure and
grain-size on strength:
sðp; dÞZ sð0; lÞ½GðpÞ=Gð0Þ�½1Ck=dm� (2)
s(0,l) is the compressive strength at zero-pressure (ambient
pressure) of the sample with large grain-size, G(0) and G(p)
are the zero-pressure and high-pressure shear-moduli,
respectively; d is the pressure-dependent grain-size, and k
and m are empirically determined constants. The second
term in Eq. (2) represents the shear-modulus scaling law
A.K. Singh et al. / Solid State Communications 132 (2004) 795–798798
[24]. For most materials, shear and Young’s modulus
scaling give numerically comparable results. The last term
describes the grain-size dependence of strength. With mZ0.5, it reduces to the Hall–Petch relation [28,29] that
describes the grain-size dependence of yield strength or
hardness measured at ambient pressure.
For clarity, the pressure-strength data in the 0–10 GPa
pressure range from this study are shown separately in Fig.
4(b). The parameters m and k were estimated by fitting Eq.
(2) to the strength versus grain-size data in this pressure
range. The G(p) values were calculated using Birch
equations [26] with the single-crystal elasticity data
obtained from ultrasonic experiments [27]. A value of
0.1 GPa was chosen for s(0,l). This value corresponds to the
yield strength of MgO single-crystal compressed parallel to
the cube axis [22]. In the first set of calculations, both m and
k were refined by the method of least-squares. This gave kZ1042(749) and mZ1.1(2) (nm)1.1. The strengths computed
from Eq. (2) using these values of m and k are shown by the
solid line in Fig. 4(b). In the second set of calculations, m
was fixed at 0.5 in accordance with the Hall–Petch relation.
A least-squares fit of Eq. (2) to the grain-size-strength data
gave kZ198(25) (nm)1/2. The strength data computed from
Eq. (2) with mZ0.5 and kZ198 (nm)1/2 are shown by the
dashed line in Fig. 4(b). The solid line is seen to fit the
measured data better than the dashed line, particularly near
ambient pressure. In the 10–55 GPa pressure range the
measured grain-size remains unchanged with an average
value of 19(4) nm. Eq. (2) suggests that the pressure
dependence of shear-modulus alone controls the pressure
dependence of strength in this case. The strength data
calculated from Eq. (2) with dZ19 nm, mZ0.5, and kZ198
(nm)1/2 are shown as a function of pressure by the solid line
in Fig. 4(a). The strength data calculated with mZ1.1 and
kZ1042 (nm)1.1 also fall close to this line. The computed
data are found to agree well with the measured strength data.
In the discussions so far the parameters m and k are
considered purely empirical. Eq. (2) can acquire some
degree of predictive capability if the parameters are
constrained from other considerations. The value of s(0,l)
relevant to the present discussion can be obtained by directly
measuring the compressive strength on large-grained
polycrystalline compact of MgO under constant load
condition. At low pressures, often the sample does not
fully deform in a DAC and the maximum deviatoric stress
does not develop. This leads to an underestimation of
strength. If data points below 0.5 GPa are omitted from Fig.
4(b), then the Eq. (2) with mZ0.5 fits the observed data very
well. The choice mZ0.5 should be preferred as it amounts to
relying on the Hall–Petch relation that is supported by large
volume of data on widely different materials. This leaves
only k as the adjustable parameter.
In general, the diffraction experiments with DAC and
other high-pressure devices employ 5–50 mm diameter
incident X-ray beams. This necessitates the use of fine-
grained samples to avoid spotty diffraction patterns. The
grain-size reduces further on pressurization. The grain-size
changes during pressurization are expected to have
significant influence on the strength and should be
considered in the interpretation of the strength data
measured by diffraction techniques.
Acknowledgements
We thank M. Somayazulu and Y. Ding for rendering
technical help at HPCAT beam line and S. Usha Devi for
providing diffraction data for the characterization of MgO
powder samples.
References
[1] A.L. Ruoff, J. Appl. Phys. 46 (1975) 1389.
[2] A.K. Singh, J. Appl. Phys. 73 (1993) 4278.
[3] T. Uchida, N. Funamori, T. Yagi, J. Appl. Phys. 80 (1996) 739.
[4] A.K. Singh, C. Balasingh, H.K. Mao, J. Shu, R.J. Hemley,
Phys. Rev. Lett. 80 (1998) 2157.
[5] A.K. Singh, C. Balasingh, H.K. Mao, R.J. Hemley, J. Shu,
J. Appl. Phys. 83 (1998) 7567.
[6] A.K. Singh, K. Takemura, J. Appl. Phys. 90 (2001) 3269.
[7] Y. Akahama, H. Kawamura, A.K. Singh, J. Appl. Phys. 95
(2004) 4767.
[8] A.K. Singh, Philos. Mag. Lett. 67 (1993) 379.
[9] R. Jeanloz, B.K. Godwal, C. Meade, Nature 349 (1991) 687.
[10] T.S. Duffy, G. Shen, J. Shu, H.-K. Mao, R.J. Hemley,
A.K. Singh, J. Appl. Phys. 86 (1999) 6729.
[11] J. Chen, D.J. Weidner, M.T. Vaughan, Nature 419 (2002) 824.
[12] A.K. Singh, J. Phys. Chem. Solids 65 (2004) 1589.
[13] R.J. Hemley, H.-K. Mao, G. Shen, J. Badro, P. Gillet,
M. Hanfland, D. Hausermann, Science 276 (1997) 1242.
[14] S.R. Shieh, T.S. Duffy, Phys. Rev. Lett. 89 (2002) 255507
(Also pp. 1–4).
[15] S. Merkel, A.P. Jephcoat, J. Shu, H.-K. Mao, P. Gillet,
R.J. Hemley, Phys. Chem. Miner. 29 (2002) 1.
[16] T.S. Duffy, R.J. Hemley, H.K. Mao, Phys. Rev. Lett. 74 (1995)
1371.
[17] S. Merkel, H.R. Wenk, J. Badro, G. Montagnac, P. Gillet,
H.-K. Mao, R.J. Hemley, J. Geophys. Res. 107 (2002) 2271
(No B11).
[18] S.R. Shieh, T.S. Duffy, G. Shen, Phys. Earth Planet. Int. 143-
44 (2004) 93–105.
[19] S. Merkel, H.R. Wenk, J. Badro, G. Montagnac, P. Gillet,
H.K. Mao, R.J. Hemley, Earth Planet. Sci. Lett. 209 (2003) 351.
[20] G.L. Kinsland, W.A. Bassett, Rev. Sci. Instrum. 47 (1976)
130.
[21] D.J. Weidner, Y. Wang, M.T. Vaughan, Geophys. Res. Lett.
21 (1994) 753.
[22] C.W. Weaver, M.S. Patterson, J. Am. Ceram. Soc. 52 (1969)
293.
[23] C. Meade, R. Jeanloz, J. Geophys. Res. 93 (1988) 3261.
[24] J.O. Chua, A.L. Ruoff, J. Appl. Phys. 46 (1975) 4659.
[25] J.I. Langford, J. Appl. Crystallogr. 4 (1971) 164.
[26] F.J. Birch, J. Geophys. Res. 83 (1978) 1257.
[27] S.V. Sinogeikin, J.D. Bass, Phys. Rev. B 59 (1999) R14141.
[28] E.O. Hall, Proc. Phys. Soc. (London) B 64 (1951) 747.
[29] N.J. Petch, J. Iron Steel Inst. 174 (1953) 25.