Embed Size (px)
Citation preview

STRENGTH • DIVERSITY • EXCELLENCEFall 2015
The Employees of the California State University

1
TABLE OF CONTENTSCSU STAFFEmployees by Occupational Group and CampusEmployee Headcount by Occupational Group*, Fall 2015 and Prior Years ......... 4Occupational Profile of Full-Time Employees (Headcount), Fall 2015 ................. 5Headcount of Employees by Occupational Group, Fall 2015 and Prior Years ..... 5Distribution of Salary by Occupational Group, Fall 2015 and Prior Years ........... 6Employees Salary by Collective Bargaining Unit, Fall 2015 ................................ 6Distribution of Salary by Collective Bargaining Unit, Fall 2015 .......................... 6Employee Headcount by Campus, Fall 2015 ........................................................ 7Employee Headcount by Campus, Fall 2015 and Prior Year ................................ 8
Employees by Gender and EthnicityEmployee Headcount by Gender and Ethnicity, Fall 2015 ............................10-11Employee Headcount by Gender and Ethnicity, Fall 2015 and Prior Years ........ 12Employees by Gender and Ethnicity, Fall 2015 and Prior Years ........................ 13Percentage of Full-Time Employees within Occupational Groups* by Gender and Ethnicity, Fall 2015..................................................................... 13 Occupational Profile of Full-Time Employee Headcount by Gender and Ethnicity, Fall 2015 ......................................................................... 14Occupational Profile of Full-Time Employee Headcount by Ethnicity, Fall 2015 ............................................................................................................ 15Headcount of Full-Time Employees by Occupational Group* and Ethnicity, Fall 2015 and Five Years Earlier ......................................................................... 16
Age Distribution of CSU EmployeesAge Distribution of Full-Time Employee Headcount by Faculty and Staff Status, Fall 2015 ................................................................................ 17Age Distribution of Full-Time Employee Headcount by Gender and Minority Status, Fall 2015........................................................................... 17Minority Employees as a Percentage of Full-Time Employees by Age Group and Job Category (Headcount), Fall 2015 .......................................................... 18Female Employees as a Percentage of Full-Time Employees by Age Group and Job Category (Headcount), Fall 2015 .......................................................... 18Percentage of Full-Time Employees By Age Group, Fall 2015 ........................... 19Age Distribution by Job Category, Fall 2015 ..................................................... 19
CSU FACULTYGender and EthnicityFull-Time Faculty by Rank, Gender and Ethnicity (Headcount), Fall 2015 and Five Years Earlier......................................................................................... 22Full-Time Faculty by Tenure Status, Gender and Ethnicity (Headcount), Fall 2015 and Five Years Earlier ......................................................................... 23Headcount of Part-Time Faculty by Gender and Ethnicity, Fall 2015 ................. 23
Tenure StatusHeadcount of Full-Time Faculty with Tenure, with Doctorate, by Rank, Fall 2015 .............................................................................................. 24Headcount of Full-Time Faculty by Tenure Status and Ethnicity, Fall 2015 and Five Years Earlier ......................................................................... 24
New FacultyNew Full-Time, Tenure-Track Faculty by Rank (Headcount), with Tenure, Fall 2015 and Five Years Earlier ......................................................................... 26
Promotions & TenurePromotions Among Full-Time Faculty (Headcount), Fall 2015 and Prior Year ... 27
Number of Faculty Granted Tenure (Headcount)*, Fall 2015 ............................. 27
SeparationsSeparations Among Full-Time Faculty by Cause and Appointment Status (Headcount), 2014-15 and 2013-14.................................................................... 27
Salary Average Salaries* for Full-Time Faculty by Rank and Appointment Type (Headcount), Fall 2015 ....................................................................................... 28
CampusHeadcount of Full-Time Faculty by Rank and Campus, Fall 2015 ...................... 28Headcount of Full-Time Faculty by Rank, Fall 2015 and Prior Years ................. 29
TECHNICAL NOTES AND GLOSSARYIPEDS Database, Oracle/PeopleSoft.................................................................. 30Campus Information Retrieval System (CIRS) – Data Prior To 2012 ................. 30CSU Faculty Recruitment Survey ....................................................................... 31Other Definitions ................................................................................................ 31

CSU STAFFCSU STAFF, FALL 2015
MONTEREY BAY COUNSELING CENTER DIRECTOR NAMED SOCIAL WORKER OF THE YEAR
Cal State Monterey Bay’s Director of Health and Wellness Services Caroline Haskell has been honored as Social Worker of the Year. The award was presented this spring by the National Association of Social Workers’ Central Coast Unit.
Haskell is the founding director of the Counseling Center. As a board-certified, licensed clinical social worker, she oversees the services and programs offered through Monterey Bay’s Health and Wellness Services, including the Personal Growth and Counseling Center, Campus Health Center, Campus Chaplaincy, Health Promotion & Education, and Student Disability Resources.
With 25 years of experience, she also provides direct clinical counseling and psychological services for students, staff and faculty. She serves as the campus affiliate director of the National Coalition Building Institute, a nonprofit leadership training organization that works to eliminate prejudice and intergroup conflict in communities throughout the world.
Haskell has served as a national consultant and lecturer to many institutions of higher education, including Smith College, Stanford University, UC Berkeley, UC San Francisco, UC Davis and Columbia University.
She was awarded the status of Certified Diplomate by the American Psychotherapy Association, and has been a certified cognitive behavioral therapist and certified addictions specialist with the National Board of Cognitive Behavioral Therapists. In 2012, Haskell was appointed to the Monterey County Mental Health Commission.
She was honored with the Jay Foss Clinical Services Award by the Monterey County Mental Health Commission in 2010 in recognition of the outstanding mental health services she has provided in the local community. She received the President’s Medal as Administrator of the Year for exemplary service to the university and commitment to its vision in 2005.
2 3
LETTER FROMLORI LAMBVice Chancellor, Human Resources
Dear Friends of the California State University,
Much like the students we serve each day, the employees of the California State University are an extremely talented, diverse and motivated group. Our faculty and staff play an essential role in executing the mission of the CSU: to adequately prepare a new generation of leaders in the state of California and beyond.
As you will find in the following report, more employees belong to the CSU family than ever before. The number of total new hires in 2015 was the highest such figure since 2007. Many of these new employees are specifically focused on the CSU’s student success initiatives to provide students with a clearer path to graduation and to eliminate the achievement gap among underrepresented minority students.
This report also demonstrates the CSU’s commitment to diversity in our workforce. Our employees come from a rich array of backgrounds and experiences, providing our students with the opportunity to encounter new perspectives and to go on to succeed in an increasingly connected, global work environment. The value of a CSU education remains strong, and as a system we are well-positioned for continued success in large part due to the commitment of employees at all 23 campuses and the Chancellor’s Office. In addition, the university places a high value on retention, going to great lengths to provide the CSU workforce with attractive benefits and a motivating atmosphere at work.
I invite you to enjoy this publication, which in addition to updated data also includes notable recent achievements by students and faculty. My hope is that in reading the 2015 Employee Profile, you’ll gain a greater understanding of the people who make the CSU such a special place to work and learn.
Warm regards,
Lori Lamb Vice Chancellor, Human Resources
The CSU is committed to providing a welcoming, accommodating and personally rewarding work environment for its faculty and staff. The information in this report, which draws on data from analytics for CSU employees for fall 2015, illustrates the growth of the system’s workforce, as well as hiring practices that are leading to an increasingly diverse staff. The faculty and staff of the California State University are varied in their personal and professional backgrounds; in the skills and abilities they bring to their work; and in the successes they achieve as representatives of the university.
The CSU currently employs more than 49,000 faculty and staff statewide—the most in its 56-year history. Particular importance has been placed on hiring employees in student services and on tenure-track recruitments, as these hires focus more resources on mission-critical activities that specifically support student success. These and other hiring practices also reaffirm the CSU’s commitment to growth that aligns with the university’s priorities. On the following pages you’ll find information on the numbers of faculty and staff employed in various occupational categories, as well as the numbers employed at each campus.
Due to significant changes to reporting requirements for the Integrated Postsecondary Education Data System (IPEDS) beginning in 2012, reporting groups have been realigned and cannot be compared directly to groups reported in prior Employee Profiles (2011 and earlier). Employee reporting has been aligned with the Standard Occupational Classifications published by the National Bureau of Labor Standards that were established in 2010.
Note: Percentages may not add up to 100 percent because of rounding.

4 5
EMPLOYEE HEADCOUNT BY OCCUPATIONAL GROUP* Fall 2015 and Prior YearsFall 2015
OCCUPATIONAL GROUP FULL-TIME PART-TIME TOTAL
Faculty 12,278 13,055 25,333
Professional/Technical 12,506 954 13,460
Office/Administrative Support 4,560 262 4,822
Service Occupations 2,232 116 2,348
Construction/Maintenance/Transportation 1,671 17 1,688
Management 1,636 7 1,643
TOTAL 34,883 14,411 49,294
Fall 2014
OCCUPATIONAL GROUP FULL-TIME PART-TIME TOTAL
Faculty 11,833 12,572 24,405
Professional/Technical 11,798 974 12,772
Office/Administrative Support 4,520 281 4,801
Service Occupations 2,151 100 2,251
Construction/Maintenance/Transportation 1,635 29 1,664
Management 1,515 9 1,524
TOTAL 33,452 13,965 47,417
Fall 2013
OCCUPATIONAL GROUP FULL-TIME PART-TIME TOTAL
Faculty 11,453 11,693 23,146
Professional/Technical 11,249 999 12,248
Office/Administrative Support 4,512 330 4,842
Service Occupations 2,057 105 2,162
Construction/Maintenance/Transportation 1,609 30 1,639
Management 1,411 12 1,423
TOTAL 32,291 13,169 45,460
Employees by Occupational Group and Campus OCCUPATIONAL PROFILE OF FULL-TIME EMPLOYEES (HEADCOUNT)Fall 2015
*Refer to Technical Notes and Glossary for the definitions of the Occupational Groups.
Note: Table includes all employees with the exception of student employees, other intermittent or casual employees, and faculty teaching in extension, special sessions and summer sessions.
35.2%4.7%
4.8%
6.4%
13.1%
35.9%
Management
Professional/Technical Occupations
Faculty
Office/Administrative Support
Service Occupations
Construction/Maintenance/Transportation
HEADCOUNT OF EMPLOYEES BY OCCUPATIONAL GROUPFall 2015 and Prior Years
Management
Professional/Technical Occupations
Faculty
Office/Administrative Support
Service Occupations
Construction/Maintenance/Transportation
0
5,000
2013 2014 2015
10,000
15,000
20,000
25,000
30,000
35,000
40,000
45,000
50,000
23,146 24,405 25,333
12,24812,772
13,460
4,8424,801
4,8222,1622,251
2,3481,639
1,6641,688
1,4231,524
1,643

6 7
DISTRIBUTION OF SALARY BY OCCUPATIONAL GROUPFall 2015 and Prior Years (Percent of Total Actual Salary)
Management
Professional/Technical Occupations
Faculty
Office/Administrative Support
Service Occupations
Construction/Maintenance/Transportation
2013
2014
2015
0% 50% 100%
47.0%
47.7%
47.7%
Academic Professionals of California
State Employees Trade Council
Statewide University Police Association
International Union of Operating Engineers
English Language Program, Cal State Los Angeles
California Faculty Association
Excluded Classes
Confidential Classes
Management Personnel Plan
Union of American Physicians and Dentists
California State University Employees Union
(CSUEU)
EMPLOYEES SALARY BY COLLECTIVE BARGAINING UNITFall 2015
DISTRIBUTION OF SALARY BY COLLECTIVE BARGAINING UNITFall 2015 (Percent of Total)
COLLECTIVE BARGAINING UNIT PERCENT OF TOTAL SALARY*
Confidential Classes 0.9%
Excluded Classes 0.1%
Management Personnel Plan 15.7%
Union of American Physicians and Dentists 0.4%
California State University Employees Union (CSUEU) 25.2%
California Faculty Association 49.6%
Academic Professionals of California 4.8%
State Employees Trade Council 2.3%
Statewide University Police Association 1.0%
International Union of Operating Engineers 0.03%
English Language Program, Cal State Los Angeles 0.02%
49.6%
15.7%
0.4%
25.2%
4.8%2.3%
1.0% 0.03% 0.02%0.9%
0.1%
Note: Salary expenditures as of October 31, 2015.(Salary Expenditures = Annual Base Salary * FTE)
31.0%
30.4%
30.3%
6.9% 8.2%
3.4%
3.3%
3.3%
3.5%
3.6%
3.6%
7.1% 7.9%
7.4% 7.7%
EMPLOYEE HEADCOUNT BY CAMPUSFall 2015
Note: Table includes all employees with the exception of student employees, other intermittent or casual employees, and faculty teaching in extension, special sessions and summer sessions.
CAMPUS TOTAL FULL-TIME PART-TIME FULL-TIME
EQUIVALENTS (FTE)
Bakersfield 989 778 211 874.2
Channel Islands 896 681 215 797.6
Chico 1,913 1,391 522 1,659.7
Dominguez Hills 1,449 888 561 1,117.4
East Bay 1,811 1,255 556 1,520.7
Fresno 2,334 1,659 675 1,932.7
Fullerton 3,596 2,481 1,115 2,977.7
Humboldt 1,238 910 328 1,070.1
Long Beach 3,790 2,596 1,194 3,110.6
Los Angeles 2,422 1,562 860 1,978.8
Maritime Academy 282 251 31 269.3
Monterey Bay 980 716 264 850.5
Northridge 3,699 2,486 1,213 3,045.7
Pomona 2,328 1,617 711 1,979.9
Sacramento 2,874 2,016 858 2,378.0
San Bernardino 1,942 1,412 530 1,670.3
San Diego 3,314 2,445 869 2,795.7
San Francisco 3,235 2,244 991 2,686.9
San José 3,172 1,992 1,180 2,535.8
San Luis Obispo 2,630 2,175 455 2,393.5
San Marcos 1,481 1,057 424 1,252.8
Sonoma 1,292 945 347 1,099.1
Stanislaus 1,067 778 289 889.5
Chancellor’s Office 560 548 12 555.4
TOTAL 49,294 34,883 14,411 41,441.9
SAVING TIME, MONEY AND THE ENVIRONMENT Cal Poly Pomona students are living out the “Learn by Doing” philosophy through undergraduate research and transforming ideas into reality at the Student Innovation Idea Lab (iLab). Under the supervision and mentorship of professors, students are collaborating to create various projects on environmental preservation.
The battery-powered scooter, designed by Cal Poly Pomona students, is tailored to meet the needs of commuters who travel using urban transit, bus or car but must walk another mile before reaching their destination. Unlike the traditional electrical scooter, this product is uniquely designed to take up substantially less surface area when folded and weighs about 15 pounds compared to the traditional range of 21 to 46 pounds. The scooter saves time for commuters and money compared to automobile transportation, as well as protects the environment by eliminating carbon emissions, fuel and congestion.
The LonoDrop project on water conservation is another way students are preserving the environment. Shaped in the form of a water droplet, the LonoDrop is a motion sensor hung on showerheads that triggers LED lights to turn on while users are showering. The sensor changes color to indicate how long users have been showering to encourage shorter showers of up to five minutes, compared to the average 11.5 minutes users spend. The project aims to spread awareness of habits that can easily be changed to save water and to help users track their daily water usage.
Students are also developing a more environmentally friendly process for coating active pharmaceutical ingredient powders that reduces overall cost of production. By using a dry coating process, they avoid releasing harsh chemicals into the atmosphere from evaporation that occurs during a wet process.

8 9
EMPLOYEE HEADCOUNT BY CAMPUSFall 2015 and Prior Year
Notes: Staff excludes instructional faculty personnel.
Table includes all employees with the exception of student employees, other intermittent or casual employees, and faculty teaching in extension, special sessions and summer sessions.
FULL-TIME PART-TIME TOTAL
CAMPUS FACULTY STAFF FACULTY STAFF FALL 2015 FALL 2014
Bakersfield 268 510 179 32 989 924
Channel Islands 184 497 196 19 896 858
Chico 511 880 458 64 1,913 1,895
Dominguez Hills 315 573 517 44 1,449 1,334
East Bay 354 901 481 75 1,811 1,698
Fresno 686 973 652 23 2,334 2,248
Fullerton 981 1,500 1,069 46 3,596 3,531
Humboldt 281 629 271 57 1,238 1,198
Long Beach 1,026 1,570 1,099 95 3,790 3,643
Los Angeles 622 940 811 49 2,422 2,236
Maritime Academy 66 185 22 9 282 271
Monterey Bay 226 490 226 38 980 939
Northridge 937 1,549 1,130 83 3,699 3,630
Pomona 573 1,044 652 59 2,328 2,216
Sacramento 717 1,299 792 66 2,874 2,745
San Bernardino 455 957 487 43 1,942 1,852
San Diego 855 1,590 778 91 3,314 3,233
San Francisco 819 1,425 813 178 3,235 3,195
San José 698 1,294 1,100 80 3,172 3,100
San Luis Obispo 823 1,352 385 70 2,630 2,515
San Marcos 341 716 377 47 1,481 1,327
Sonoma 246 699 300 47 1,292 1,262
Stanislaus 294 484 260 29 1,067 1,020
Chancellor’s Office 548 12 560 547
TOTAL 12,278 22,605 13,055 1,356 49,294 47,417
SERVING THOSE WHO SERVE As the Civilian Assistant Director of Veterans Affairs and Commuter Programs, Jay Derrico has earned the respect of CSU Channel Islands’ military veterans by doing what comes naturally to him: listening and caring.
He draws on his background as a former college counselor and church pastor to help CI’s 115 student veterans and their 150 dependents navigate veterans’ benefits, deployments and paperwork and adapt to college and civilian life.
“We’re all thankful to have someone like Jay Derrico at CI,” says William Vaughn, a 2015 graduate, Navy veteran and president of the Student Veterans Organization. “His dedication to our veterans goes well beyond anyone else I have ever seen. It’s people like Jay who help our veteran population transition into the university lifestyle and obtain our ultimate goals in graduation.”
Derrico came to CI as a career counselor in 2007. After being asked to start CI’s Veterans Resource Center in 2011, Derrico set out to create a place where veterans would feel at home. He interviewed CI’s veteran population, researched issues faced by veterans in university settings, and adopted practices from the nation’s best Veterans Resource Centers. “The most important thing was building trust so veterans would see the center as a place where they’d find the answers and resources they needed,” states Derrico. “My philosophy is to deal with the whole person and not just the student. I see my role as helping them achieve positive change and reach their goals, whether in their personal lives, academic lives, or their lives after college.”
Partnering with Career Development Services and the Henry “Hank” L. Lacayo Institute, Derrico developed an internship program matching student veterans with employers for paid internships that often lead
to jobs. He helped launch the annual Medallion Ceremony, where graduating veterans are honored by President Rush, the CI community, members of Congress, and military and local dignitaries. He also runs a mentoring program, organizes career development workshops, serves as advisor to the Student Veterans Organization, conducts outreach at community colleges, hosts a week-long series of events for Veterans Day, and invites the campus community to the Veterans Resource Center for cake and ice cream on military anniversaries. His most recent efforts include creating a scholarship for veterans and pursuing grants to fund more internship programs and staff to serve veterans.
Derrico’s dedication has helped CI earn national recognition five years in a row as a “Military Friendly School.” It also earned Derrico a 2014 Maximus Award—an honor awarded to one outstanding staff member each year by students.
“It’s not just a 9 to 5 job for Jay. He genuinely cares about the well-being and success of every student,” says 2014 CI graduate and U.S. Marine veteran Mark Scott. “Jay went out of his way to find me an internship with a veteran-friendly employer matching my career goals. You could say it changed the course of my career because I am a full-time employee at the same place two years later.”
“One of the privileges of my job is seeing people grow,” Derrico says. “It’s not advising. It’s more about listening and bringing the answer out of them instead of telling and suggesting things.” Above all, Derrico enjoys working one-on-one with students, counseling them over coffee, joining them on Student Veterans Organization hikes, or providing an on-campus sanctuary where they can study and socialize.
SDSU’S OCHOA MAKES SPACE EXPLORATION HISTORY TWICE
NASA astronaut Ellen Ochoa—an alumna of San Diego State University—has made history twice; she was the first Hispanic woman to go into space, and now she is the first Hispanic and second female to direct the NASA Johnson Space Center. Ochoa is the veteran of four American space flights and logged nearly 1,000 hours in space.
As director of the NASA Johnson Space Center, Ochoa is recognized as an effective NASA ambassador, delivering more than 300 speeches promoting science and engineering careers. Four schools bear her name in California, Washington and Texas.
Ochoa has been recognized with several NASA awards, including the Distinguished Service Medal, Exceptional Service Medal, Outstanding Leadership Medal, and four Space Flight Medals. She is also a recipient of numerous awards, including the Harvard Foundation Science Award, Women in Aerospace Outstanding Achievement Award, the Hispanic Engineer Albert Baez Award for Outstanding Technical Contribution to Humanity, the Hispanic Heritage Leadership Award, and San Diego State University Alumna of the Year.
After graduating in 1980 with her bachelor’s degree in physics from San Diego State, she earned her master’s degree and Ph.D. in electrical engineering at Stanford. She is the co-inventor of three patented optical analysis systems and the author of numerous technical papers.
Ochoa serves on the board of Service Corporation International, is an ex-officio board member of the Houston Technology Center and the Bay Area Houston Economic Partnership, and is Director Emerita of the Manned Space Flight Education Foundation, Inc. which operates Space Center Houston. She is also chair of the Nomination Evaluation Committee for the National Medal of Technology and Innovation.

10 11
COMBATING HATE THROUGH EMPOWERING IMAGES AND DIALOGUE
Hate violence toward Arab, Muslim, and Sikh communities markedly increased after September 11, 2001. Nearly 15 years later, those identified as or perceived
to be Arab or Muslim continue to experience prejudice and hostility.
In 2012, a series of hate ads—protected as First Amendment speech—were sponsored by the American Freedom Defense Initiative and placed on regional public transportation. Those ads prompted a community-based participatory research project to explore the experiences of those coping with Islamophobia and anti-Arab prejudice.
With direction from San José State Professor Edward Mamary, community participants took photographs representing their everyday experiences of Islamophobia and anti-Arab prejudice. These images served as a basis for discussions about responding to prejudice and discrimination with resilience, cultural pride, and self-determination. The project was called: Living in an Unfinished America: Shared Experiences of Discrimination and Resilience by Arab, Muslim and Sikh Americans.
“At the conclusion of the project, the community was proud of how it demonstrated not only the heart-wrenching pain caused by these ads but also the amazing strength of the community to rise to the challenge of supporting one another,” notes Theresa Sparks, executive director of the San Francisco Human Rights Commission.
Partners included the Council on American-Islamic Relations, Asian Law Caucus, Arab Cultural and Community Center, Islamic Networks Group, Sikh Coalition, the San Francisco Department of Public Health, and the San Francisco District Attorney’s Office. The project was funded by the San Francisco Municipal Transportation Agency, the San Francisco Human Rights Commission, and the San Francisco Department of Public Health.
Widely recognized for its inclusive policies and outreach, the CSU is home to an incredibly diverse student body across all its campuses. Likewise, the university employs faculty and staff of every race, ethnicity, gender, age and background. The average age of CSU employees is 47.5 years, and the 50-to-59 age group is the largest.
More than 38 percent of employees are minorities, as are more than 42 percent of full-time employees. An increase in the hiring of female professors has created a rich talent pool of full-time faculty that is now more than 45 percent female. In fact, over 73 percent of all employees at the CSU are either women or minorities.
The university seeks to invest in talented people across the entire spectrum of backgrounds and experiences; in doing so, we can increase the range of perspectives available to students in the classroom. Expanding diversity at the CSU serves to expand the horizons of our students, support their academic success and better prepare them to be part of a globalized workforce.
Employees by Gender and Ethnicity
Note: Graph includes information on the gender and ethnicity of CSU employees, data for all employees (both full-time and part-time). Exceptions include student employees, other intermittent or casual employees, and faculty teaching in extension, special sessions and summer sessions. Gender was not stated for five full-time employees.
Percentages referenced throughout report may not add up to 100% because of rounding.
FULL-TIME PART-TIME
ALL EMPLOYEES
EMPLOYEE HEADCOUNT BY GENDER AND ETHNICITYFall 2015
White Male
Minority Male
Minority Female
White Female
Race/Ethnicity/Gender Unknown
25.4% 29.2%
18.3% 12.8%
15.8%
34.6%
23.9%
27.9%
4.5%
5.4%
29.9%
26.5%
16.7%
21.5%
7.6%
Note: Table includes all employees with the exception of student employees, other intermittent or casual employees, and faculty teaching in extension, special sessions and summer sessions. Gender was not stated for five full-time employees.
EMPLOYEE HEADCOUNT BY GENDER AND ETHNICITYFall 2015
ETHNICITY/GENDER FULL-TIME PERCENT PART-TIME PERCENT TOTAL PERCENT
White Male 8,854 25.4% 4,202 29.2% 13,056 26.5%
Minority Male 6,385 18.3% 1,842 12.8% 8,227 16.7%
Minority Female 8,340 23.9% 2,275 15.8% 10,615 21.5%
White Female 9,744 27.9% 4,993 34.6% 14,737 29.9%
Race/Ethnicity/Gender Unknown 1,560 4.5% 1,099 7.6% 2,659 5.4%
TOTAL 34,883 100.0% 14,411 100.0% 49,294 100.0%
TREADING NEW TERRAINS IN PHYSICS AND ASTRONOMYScientists and student researchers at Cal State Fullerton’s Gravitational Wave Physics and Astronomy Center (GWPAC) have helped uncover a new window into the universe.
With the Laser Interferometer Gravitational-wave Observatory (LIGO) Scientific Collaboration—a group of more than 1,000 scientists around the world—Cal State Fullerton professors have detected gravitational waves for the first time, confirming Albert Einstein’s prediction in his General Theory of Relativity. The sounds of the universe, gravitational waves can reveal how the universe has changed, how stars and galaxies have formed and evolved, how astrophysical objects like black holes behave and much more, providing a new way to explore the universe.
GWPAC brings together faculty, staff and students interested in gravitational-wave science from a variety of backgrounds, and the center is a hub for faculty-student research activities. Faculty mentors train the next generation of leaders in gravitational-wave science; to date, nearly 40 students have had the opportunity to participate in this groundbreaking
research, with some conducting gravitational-wave research in countries such as Italy and Korea.
Students can contribute to research during their undergraduate career by developing simulations of violent astronomical events, analyzing data from computer simulations, and creating visualizations from simulated data—observing and studying things in the universe that have never been seen before.

12 13
EMPLOYEE HEADCOUNT BY GENDER AND ETHNICITYFall 2015 and Prior Years
White Male
Minority Male
Minority Female
White Female
Race/Ethnicity/Gender Unknown
Fall 20100
5,000
10,000
15,000
20,000
25,000
30,000
35,000
40,000
45,000
50,000
Fall 2011 Fall 2012 Fall 2013 Fall 2014 Fall 2015
12,235
6,815
8,479
13,698
1,6572,016 2,021
2,1982,399
2,659
13,885 13,98714,100
14,50414,737
12,311
6,998
8,728
12,315
7,092
8,949
12,541
7,322
9,2999,900
10,615
12,831
7,783
13,056
8,227
EMPLOYEES BY GENDER AND ETHNICITYFall 2015 and Prior Years
White Male
Minority Male
Minority Female
White Female
Race/Ethnicity/Gender Unknown
Fall 20100.0%
5.0%
10.0%
15.0%
20.0%
25.0%
30.0%
35.0%
Fall 2011 Fall 2012 Fall 2013 Fall 2014 Fall 2015
PERCENTAGE OF FULL-TIME EMPLOYEES WITHIN OCCUPATIONAL GROUPS* BY GENDER AND ETHNICITYFall 2015
*Refer to Technical Notes and Glossary for the definitions of the Occupational Groups.
White Male
Minority Male
Minority Female
White Female
Race/Ethnicity/ Gender Unknown
PROFESSIONAL / TECHNICAL
OPERATIONS
4.5%
20.9% 28.6%
17.1%28.9%
SERVICE OCCUPATIONS
4.6%
20.2%
7.9%
23.4%
43.9%
MANAGEMENT
4.0%16.4%
14.9%
30.7%
33.9%CONSTRUCTION / MAINTENANCE /
TRANSPORTATION
1.9%
41.6%5.0%
48.8%
2.7%
OFFICE / ADMINISTRATIVE
SUPPORT
4.0%5.1%
45.5%
8.4%
37.1%
FACULTY
4.6%15.2%
15.8%
30.3%
34.1%
CSU Bakersfield houses one of the few Fab Labs in California, providing students and members of the community access to complex technologies that were once only accessible to engineers and technicians. The campus’s Fabrication Laboratory, or “Fab Lab,” consists of fabrication and rapid prototyping machines, including 3D printers, laser cutters, vinyl cutters and computer-controlled sewing machines.
These sophisticated machines make it possible for students and others to explore the entire engineering design process from concept to drawing and models to prototype and redesign to final product. Even those with little technological expertise can learn to use this highly complex equipment, allowing artists, engineers, teachers and those in other disciplines the chance to produce innovative work.
The lab isn’t just for CSU Bakersfield students and faculty, though; in fact, the space is predicated on the notion of open access and community-building. The Fab Lab offers tours, activities and summer camps to students from neighboring K-12 schools, exposing kids to technology and innovation. Community members can use the lab at specified hours to develop their business and create prototypes, too.
But the Fab Lab is more than just a space to create; it also gives members access to the wider community of Fab Labs, all linked by a desire to share knowledge, collaborate and innovate. With more than 850 Fab Labs around the world, Bakersfield is part of a global network aiming to tap into the creative potential of the entire world, developing creators, not consumers.
BUILDING A GLOBAL COMMUNITY OF CREATORS

14 15
MINORITY MALEAMERICAN INDIAN OR
ALASKA NATIVEASIAN
NATIVE HAWAIIAN OR OTHER PACIFIC
ISLANDER
TWO OR MOREETHNICITIES /
RACES
WHITE
BLACK ORAFRICAN
AMERICAN
HISPANIC
Faculty
Professional/Technical Occupations
Office/Administrative Support
Service Occupations
Construction/Maintenance/Transportation
Management
OCCUPATIONAL PROFILE OF FULL-TIME EMPLOYEE HEADCOUNT BY ETHNICITYFall 2015
OCCUPATIONAL PROFILE OF FULL-TIME EMPLOYEE HEADCOUNT BY GENDER AND ETHNICITYFall 2015
MINORITY FEMALE
WHITE FEMALE WHITE MALE
Faculty
Professional/Technical Occupations
Office/Administrative Support
Service Occupations
Construction/Maintenance/Transportation
Management
COMBINING TECHNOLOGY AND COMMUNITY ENGAGEMENT
Stanislaus State students are exploring the community and region of the Central Valley through the Keck Visual Anthropology Lab (KVAL) and the Geography program.
At KVAL, students tell the untold stories of the cultural communities that make up the Central Valley through short films and a digital video
archive of cultural events. Through their work, students are preserving the heritages of people from Laos, Cambodia, India, Japan, Mexico, Pakistan and Israel.
KVAL facilitates interdisciplinary collaboration as students from diverse academic backgrounds, such as anthropology, film and art, work together towards the common goal of honoring the stories of the Central Valley.
Students have a safe space to reflect on their own histories and document the important stories of the community at KVAL. The process of creating films and footage has proven to be transformational for both students and interview subjects. The finished products are tools to create awareness, tolerance, education and enlightenment within a given culture as well as those who interact with it from the outside. Students use the contemporary language of digital media to tell the age-old stories of the Central Valley, engaging with the community and participating in experiential learning.
Meanwhile, in the Geography program, undergraduate and graduate students are utilizing Geographic Information Systems (GIS) and other geospatial tools such as web mapping to explore the Central Valley. Research projects and internships emphasize community engagement. One student is using an unmanned aerial vehicle to examine water use and the health of plants in the community, downloading information and visualizing data on a map. Another student is working on creating a spatial database of all the information needed to run the campus garden, including planting and watering times, number of seeds to plant, pest management, harvest dates, and expected and actual yield. By incorporating tools like GIS, students can study and visualize the surrounding community.
6.3%
24.9%
17.3%
37.1%
38.2% 47.3%
6.3%9.2%
5.1%
2.6%
29.6%
5.2%0.5%1.8%
0.4%
22.4%30.5%
8.4%3.3%
37.7% 38.6%3.3%2.5%
5.4%
9.5%
40.6%
18.8%6.1%
4.3%
10.1%
20.1%
40.5%
17.7% 13.8%2.4%
8.9%
12.2%
14.6%
48.0%
23.4%3.8%3.8%
5.7%
16.3%
46.9%
2.7%7.0%
14.7%
21.6%36.2%
42.5%
5.7%4.6%
3.4%
10.3%
33.5%
5.6%
13.0%
32.1%
3.8%10.9%
15.3%
6.0%33.5%42.9%
3.2%
16 17
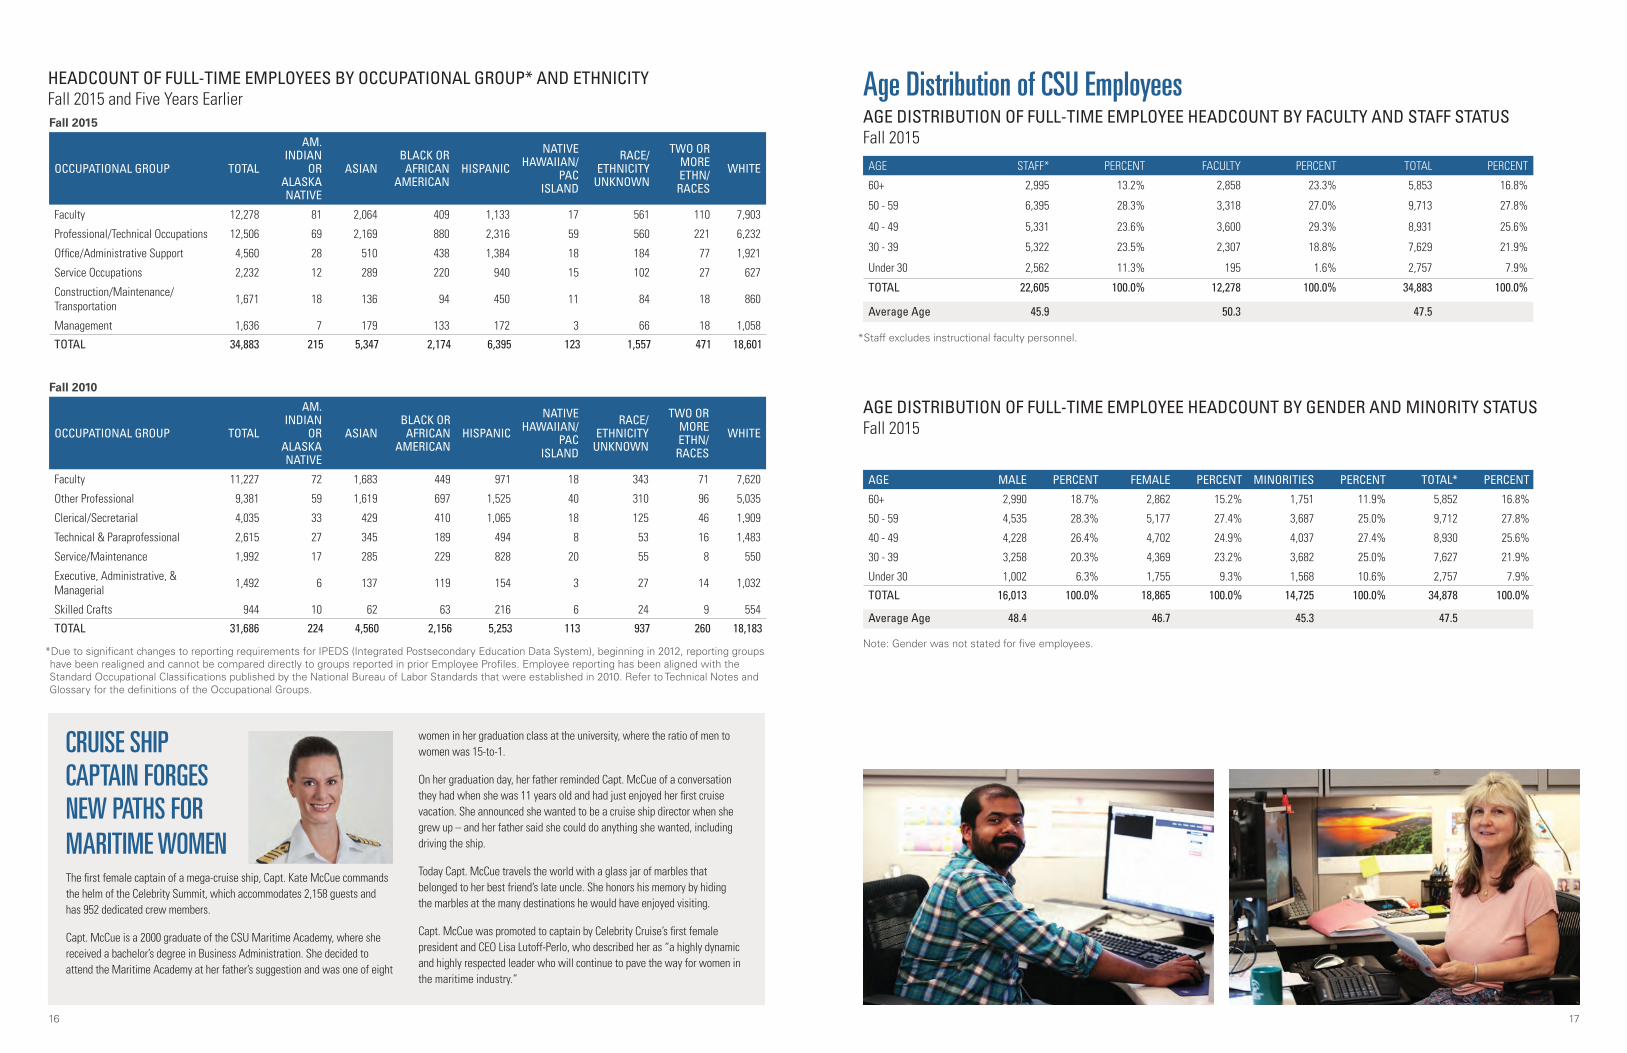
HEADCOUNT OF FULL-TIME EMPLOYEES BY OCCUPATIONAL GROUP* AND ETHNICITYFall 2015 and Five Years Earlier
OCCUPATIONAL GROUP TOTAL
AM. INDIAN
OR ALASKA NATIVE
ASIANBLACK OR
AFRICAN AMERICAN
HISPANIC
NATIVEHAWAIIAN/
PAC ISLAND
RACE/ ETHNICITY
UNKNOWN
TWO OR MORE ETHN/
RACES
WHITE
Faculty 12,278 81 2,064 409 1,133 17 561 110 7,903
Professional/Technical Occupations 12,506 69 2,169 880 2,316 59 560 221 6,232
Office/Administrative Support 4,560 28 510 438 1,384 18 184 77 1,921
Service Occupations 2,232 12 289 220 940 15 102 27 627
Construction/Maintenance/ Transportation 1,671 18 136 94 450 11 84 18 860
Management 1,636 7 179 133 172 3 66 18 1,058
TOTAL 34,883 215 5,347 2,174 6,395 123 1,557 471 18,601
OCCUPATIONAL GROUP TOTAL
AM. INDIAN
OR ALASKA NATIVE
ASIANBLACK OR
AFRICAN AMERICAN
HISPANIC
NATIVEHAWAIIAN/
PAC ISLAND
RACE/ ETHNICITY
UNKNOWN
TWO OR MORE ETHN/
RACES
WHITE
Faculty 11,227 72 1,683 449 971 18 343 71 7,620
Other Professional 9,381 59 1,619 697 1,525 40 310 96 5,035
Clerical/Secretarial 4,035 33 429 410 1,065 18 125 46 1,909
Technical & Paraprofessional 2,615 27 345 189 494 8 53 16 1,483
Service/Maintenance 1,992 17 285 229 828 20 55 8 550
Executive, Administrative, & Managerial 1,492 6 137 119 154 3 27 14 1,032
Skilled Crafts 944 10 62 63 216 6 24 9 554
TOTAL 31,686 224 4,560 2,156 5,253 113 937 260 18,183
*Due to significant changes to reporting requirements for IPEDS (Integrated Postsecondary Education Data System), beginning in 2012, reporting groups have been realigned and cannot be compared directly to groups reported in prior Employee Profiles. Employee reporting has been aligned with the Standard Occupational Classifications published by the National Bureau of Labor Standards that were established in 2010. Refer to Technical Notes and Glossary for the definitions of the Occupational Groups.
Fall 2010
Fall 2015 AGE DISTRIBUTION OF FULL-TIME EMPLOYEE HEADCOUNT BY FACULTY AND STAFF STATUSFall 2015
*Staff excludes instructional faculty personnel.
AGE STAFF* PERCENT FACULTY PERCENT TOTAL PERCENT
60+ 2,995 13.2% 2,858 23.3% 5,853 16.8%
50 - 59 6,395 28.3% 3,318 27.0% 9,713 27.8%
40 - 49 5,331 23.6% 3,600 29.3% 8,931 25.6%
30 - 39 5,322 23.5% 2,307 18.8% 7,629 21.9%
Under 30 2,562 11.3% 195 1.6% 2,757 7.9%
TOTAL 22,605 100.0% 12,278 100.0% 34,883 100.0%
Average Age 45.9 50.3 47.5
Age Distribution of CSU Employees
AGE DISTRIBUTION OF FULL-TIME EMPLOYEE HEADCOUNT BY GENDER AND MINORITY STATUSFall 2015
Note: Gender was not stated for five employees.
AGE MALE PERCENT FEMALE PERCENT MINORITIES PERCENT TOTAL* PERCENT
60+ 2,990 18.7% 2,862 15.2% 1,751 11.9% 5,852 16.8%
50 - 59 4,535 28.3% 5,177 27.4% 3,687 25.0% 9,712 27.8%
40 - 49 4,228 26.4% 4,702 24.9% 4,037 27.4% 8,930 25.6%
30 - 39 3,258 20.3% 4,369 23.2% 3,682 25.0% 7,627 21.9%
Under 30 1,002 6.3% 1,755 9.3% 1,568 10.6% 2,757 7.9%
TOTAL 16,013 100.0% 18,865 100.0% 14,725 100.0% 34,878 100.0%
Average Age 48.4 46.7 45.3 47.5
CRUISE SHIP CAPTAIN FORGES NEW PATHS FOR MARITIME WOMEN The first female captain of a mega-cruise ship, Capt. Kate McCue commands the helm of the Celebrity Summit, which accommodates 2,158 guests and has 952 dedicated crew members.
Capt. McCue is a 2000 graduate of the CSU Maritime Academy, where she received a bachelor’s degree in Business Administration. She decided to attend the Maritime Academy at her father’s suggestion and was one of eight
women in her graduation class at the university, where the ratio of men to women was 15-to-1.
On her graduation day, her father reminded Capt. McCue of a conversation they had when she was 11 years old and had just enjoyed her first cruise vacation. She announced she wanted to be a cruise ship director when she grew up – and her father said she could do anything she wanted, including driving the ship.
Today Capt. McCue travels the world with a glass jar of marbles that belonged to her best friend’s late uncle. She honors his memory by hiding the marbles at the many destinations he would have enjoyed visiting.
Capt. McCue was promoted to captain by Celebrity Cruise’s first female president and CEO Lisa Lutoff-Perlo, who described her as “a highly dynamic and highly respected leader who will continue to pave the way for women in the maritime industry.”

18 19
LANDMARK CSU STUDY TO GAUGE COLLEGE STUDENTS’ HOMELESSNESS AND HUNGER
Dr. Rashida Crutchfield is heading an unprecedented statewide study of homelessness and food insecurity among college students, a little-discussed and somewhat hidden issue the California State University is addressing at many of its 23 campuses.
“It’s estimated there are more than 56,000 homeless college students
nationwide, but there are no studies regarding food insecurity,” says Dr. Crutchfield, assistant professor in Cal State Long Beach’s School of Social Work. “As a system, it’s important for the CSU to think about students’ basic needs. It’s part of our commitment to student success.”
The first phase of Dr. Crutchfield’s study—the first of its kind by a public university system—was completed in January 2016 and the second should be done by the summer, with the final data analysis phase due to be completed in May 2017. Its goal is to develop systematic solutions enabling every college and university in the country to find these students and ensure they reach their full potential without worrying about where their next meal is coming from or where they will be sleeping.
In June 2016, the CSU Conference to Best Meet the Needs of Housing Displaced and Food Insecure Students operationalized the study and helped participants know about programming, implementation and best practices regarding these issues. “The CSU study was spurred by one homeless and hungry student whom CSU Chancellor Timothy P. White learned about,” Dr. Crutchfield said. Campus efforts such as Sacramento State’s ASI Food Pantry and Cal State Long Beach’s Meals Assistance Program have sprung up systemwide in response to ongoing student needs, but Chancellor White stressed funding for research and piloting is essential to better understand this at-risk student population and provide the services they need to live and to excel academically.
Dr. Crutchfield has studied the twin issues of youth homelessness and food insecurity for many years. “I worked at Covenant House, a Los Angeles shelter for homeless youth,” she notes. “I watched our residents’ resiliency and ability to achieve despite incredible barriers. It was compelling and inspiring, which led me to do my dissertation on homelessness during my college years.”
“No two stories are alike,” Dr. Crutchfield says. “One of our students has lived in both shelters and transitional housing as a parent with children, sometimes living in her car, and always pushing to get her degree. She knows she’ll never be self-sufficient without the degree, but it’s been quite a struggle. She describes being homeless as a full-time job, but she is making success happen and graduating in spring 2016.”
E.g., In the “60 and above” age group of full-time support employees, 46.3 percent are minorities.
MINORITY EMPLOYEES AS A PERCENTAGE OF FULL-TIME EMPLOYEES BY AGE GROUP AND JOB CATEGORY (HEADCOUNT)Fall 2015
AGE SUPPORT*PROFESSIONAL,
TECHNICAL & MANAGERIAL**
FACULTY ALL FULL-TIME EMPLOYEES
60+ 46.3% 27.7% 24.8% 29.9%
50 - 59 51.2% 37.2% 28.5% 38.0%
40 - 49 58.2% 49.5% 34.5% 45.2%
30 - 39 59.1% 50.5% 36.6% 48.3%
Under 30 63.4% 54.2% 36.9% 56.9%
All Ages 55.4% 44.0% 31.1% 42.2%
*Support includes persons in the following employee categories: Construction/Maintenance/Transportation, Office/Administrative Support and Service Occupations.
**Professional, Technical & Managerial includes persons in the following employee categories: Management and Professional/ Technical Occupations.
E.g., In the “60 and above” age group of full-time support employees, 55.9 percent are female. These tables provide information on the age distribution of full-time employees by faculty and staff status, gender and ethnicity.
FEMALE EMPLOYEES AS A PERCENTAGE OF FULL-TIME EMPLOYEES BY AGE GROUP AND JOB CATEGORY (HEADCOUNT)Fall 2015
AGE SUPPORT*PROFESSIONAL,
TECHNICAL & MANAGERIAL**
FACULTY ALL FULL-TIME EMPLOYEES
60+ 55.9% 57.2% 40.7% 48.9%
50 - 59 53.1% 59.2% 46.7% 53.3%
40 - 49 52.5% 55.7% 49.7% 52.6%
30 - 39 56.7% 60.3% 53.1% 57.3%
Under 30 66.2% 62.1% 59.5% 63.7%
All Ages 55.9% 58.6% 47.6% 54.1%
AGE DISTRIBUTION BY JOB CATEGORYFall 2015
PERCENTAGE OF FULL-TIME EMPLOYEES BY AGE GROUPFall 2015
Support Professional, Technical & Managerial Faculty
5%
10%
15%
20%
25%
30%
35%
0%
20.3
%26
.4%
5%
10%
15%
20%
25%
30%
35%
0%
28.3
%18
.7%
23.2
%
27.4
%15
.2%
10.6
%25
.0%
27.4
%25
.0%
11.9
%
7.9%
21.9
%25
.6% 27
.8%
16.8
%
9.3%
6.3%
24.9
%
C O N F E R E N C E
FOOD ANDHOUSINGSECURITY

20 21
Dr. Joely Proudfit directs the California Indian Culture and Sovereignty Center at Cal State San Marcos, where she is the department chair of American Indian Studies. Honored recently by the California Conference on American Indian Education as Educator of the Year, Dr. Proudfit is a descendent of the Pechanga
Band of Luiseno Mission Indians and returned to her native homeland when she joined the CSUSM family in fall 2008.
She had intended to join the military after becoming the first in her family to graduate from high school, but a counselor suggested she apply to Cal State Long Beach.
There she earned a bachelor’s degree in political science from Cal State Long Beach and a master’s degree and Ph.D. in political science from Northern Arizona University. She is a three-time tenured CSU professor (San Francisco State, Cal State San Bernardino and Cal State San Marcos).
Since arriving at CSUSM, Dr. Proudfit has collaborated with the Office of Tribal Liaison, the Native Advisory Council and Tribal Communities and students to develop award-winning curriculum, materials and campaigns that are culturally relevant to Native American students. She leads campus community outreach efforts to nearly 35 tribal nations in the region as well as research in support of the maintenance of sovereignty and culture within the tribal communities.
Providing services from career training to cutting-edge research, the California Indian Culture and Sovereignty Center’s work has earned support from at least one local tribe, the San Manuel Band of Mission Indians in San Bernardino County. In November 2013, Proudfit’s staff hosted the inaugural San Diego American Indian Film Festival.
“I am so humbled by the opportunities that the CSU has provided me—I now look to serve, mentor and educate at every occasion,” Dr. Proudfit says. “I’m proud to say that CSUSM is the premiere American Indian-serving institution, with more than 430 American Indian and Alaska Native students, the highest in the state per capita—and we are still growing.”
Faculty members at the CSU are established, highly regarded leaders in their fields. The knowledge they impart in the classroom is vital to helping our students learn, persist in their studies and attain their degree.
Since 2006, the total faculty at the California State University has increased by 9.3 percent, and tenure-track hires have grown each of the last two years. Today, at more than 25,000 in total, faculty comprise the largest portion of CSU employees—and their numbers continue to rise. And in recent years, the faculty has become increasingly diverse in both gender and ethnicity.
Most important, the university enjoys a partnership with faculty that allows professors to focus on sharing their rich knowledge and expertise with students. The CSU has recently proven its commitment to partnering with the California Faculty Association union, taking an important step toward ensuring faculty are appropriately compensated for the vital work they do. This spirit of cooperation bodes well for future negotiations with our talented, dedicated faculty, raising the odds that all parties will continue to collaborate to achieve our shared goals. The CSU faculty themselves exemplify the possibilities within every student to succeed and achieve at every level throughout society.
Note: Percentages may not add up to 100 percent because of rounding.
CSU FACULTY, FALL 2015
21
CSU FACULTY
SAN MARCOS PROFESSOR FURTHERS NATIVE AMERICAN EDUCATION AND CULTURE
WANG AWARD-WINNING PROFESSOR IS ‘LIVING THE DREAM’
CSU Dominguez Hills’ Dr. Kamal Hamdan has received the statewide 2016 Wang Family Excellence Award recognizing his outstanding work in education and professional applied sciences. Dr. Hamdan is the Annenberg Endowed Professor and director of the
Center for Innovation in STEM Education at CSU Dominguez Hills.
He also directs the California STEM Institute for Innovation and Improvement and has been instrumental in securing grants exceeding $47 million to develop much-needed teaching staff in high-need urban and rural area schools.
Dr. Hamdan has helped CSUDH prepare more math and science teachers in six years than at any other CSU campus and has helped prepare exceptional teachers who are transforming the lives of inner-city students. Through his work, he is redefining the clinical experience for aspiring teachers and offering them, K-12 students, parents and the community authentic science, technology, engineering and mathematics experiences.
He has been serving as the principal investigator and director for multiple grants-funded projects for 11 years. Through a number of projects, Dr. Hamdan has developed multiple pathways for students that extend from high school to graduate school and lead to teacher certification. He oversees projects including the Transition to Teaching Program, Math and Science Teacher Initiative, Noyce Scholars Program, Urban Teacher Residency and Master Teacher Fellows.
“It is a privilege to be in a position to help others achieve their dreams,” he says. “I am inspired by the spirit of the children we educate, the passion of the teachers we prepare and the resiliency of the community we serve. I am living my dream.”
Dr. Proudfit (far left) and CSUSM President Dr. Karen Haynes (far right) stand alongside graduates at the 2015 American Indian Honoring Ceremony.

22 23
FULL-TIME FACULTY BY RANK, GENDER AND ETHNICITY (HEADCOUNT)Fall 2015 and Five Years Earlier
FACULTY RANK WHITEMALE
MINORITYMALE
MINORITY FEMALE
WHITEFEMALE
RACE/ETHNICITY/GENDER UNKNOWN TOTAL PERCENT
OF TOTAL
Professor 1,915 842 545 1,238 130 4,670 38.0%
Associate Professor 772 459 470 774 111 2,586 21.1%
Assistant Professor 658 384 512 703 193 2,450 20.0%
Instructor 0 0 0 0 0 0 0.0%
Tenure-Track Subtotal 3,345 1,685 1,527 2,715 434 9,706 79.1%
Lecturer 840 260 342 1,003 127 2,572 20.9%
TOTAL 4,185 1,945 1,869 3,718 561 12,278 100.0%
FACULTY RANK WHITEMALE
MINORITYMALE
MINORITYFEMALE
WHITEFEMALE
RACE/ETHNICITY/GENDER UNKNOWN TOTAL PERCENT
OF TOTAL
Professor 2,026 793 420 1,194 70 4,503 40.1%
Associate Professor 959 442 391 816 88 2,696 24.0%
Assistant Professor 670 390 471 691 141 2,363 21.0%
Instructor 0 0 0 1 0 1 0.0%
Tenure-Track Subtotal 3,655 1,625 1,282 2,702 299 9,563 85.2%
Lecturer 549 149 208 714 44 1,664 14.8%
TOTAL 4,204 1,774 1,490 3,416 343 11,227 100.0%
Gender and EthnicityThese tables represent information on the gender and ethnicity of CSU full-time faculty in fall 2015, as well as five years earlier. In fall 2015, over 31 percent of full-time CSU faculty were ethnic minorities, and over 45 percent were female. In fall 2010, over 29 percent of full-time faculty were ethnic minorities, and over 43 percent were female.
FULL-TIME FACULTY BY TENURE STATUS, GENDER AND ETHNICITY (HEADCOUNT)Fall 2015 and Five Years Earlier
TENURE STATUS WHITEMALE
MINORITYMALE
MINORITY FEMALE
WHITEFEMALE
RACE/ETHNICITY/GENDER UNKNOWN TOTAL PERCENT
OF TOTAL
Tenured 2,631 1,258 977 1,951 222 7,039 57.3%
Probationary 714 427 550 764 212 2,667 21.7%
Tenure-Track Subtotal 3,345 1,685 1,527 2,715 434 9,706 79.1%
Temporary 840 260 342 1,003 127 2,572 20.9%
TOTAL 4,185 1,945 1,869 3,718 561 12,278 100.0%
TENURE STATUS WHITEMALE
MINORITYMALE
MINORITY FEMALE
WHITEFEMALE
RACE/ETHNICITY/GENDER UNKNOWN TOTAL PERCENT
OF TOTAL
Tenured 2,903 1,187 797 1,953 152 6,992 62.3%
Probationary 737 426 476 740 147 2,526 22.5%
Tenure-Track Subtotal 3,640 1,613 1,273 2,693 299 9,518 84.8%
Temporary 564 161 217 723 44 1,709 15.2%
TOTAL 4,204 1,774 1,490 3,416 343 11,227 100.0%
Fall 2015
Fall 2010
Fall 2010
Fall 2015
PUBLIC ADMINISTRATION SCHOLAR WINS STATEWIDE HONOR FOR OUTSTANDING RESEARCH
One of the world’s most-cited scholars of public administration, Dr. Montgomery Van Wart recently received the California State University’s Outstanding Scholarship, Research and Creative Activities Award. Dr. Van Wart, a professor of public administration at Cal State
San Bernardino since 2005, also received the Paul P. Van Riper Award for Excellence and Service from the American Society for Public Administration and received CSUSB’s inaugural award for outstanding research.
He has worked in higher education for more than 25 years, nearly always in administrative roles. He is a longtime chair of the Department of Public Administration and served as Interim Dean of the College of Business and Public Administration.
Prior to coming to Cal State San Bernardino, he was chair of the Department of Public Administration at the University of Central Florida, a visiting professor at Rutgers and a senior research fellow at KU Leuven (formerly Catholic University) in Belgium. He is a visiting professor at the University of Hong Kong.
He considers research critical to effective teaching in the classroom and is a prodigious researcher and writer, producing an average of three works per year for the past 25 years. He has more than 90 publications and his work appears in the best journals in his field.
Upon receiving the CSU award, Dr. Van Wart said, “Our students really like knowing that their professors are involved in world-class research; it makes the classroom cutting edge and brings renown to our university.”
HEADCOUNT OF PART-TIME FACULTY BY GENDER AND ETHNICITYFall 2015
GENDER TOTALBLACK OR AFRICAN
AMERICAN
AMER. INDIAN/ALASKA NATIVE
ASIAN HISPANIC WHITE
NATIVEHAWAIIAN/
PACIFIC ISLANDER
TWOOR
MORERACES
RACE/ETHNICITY/
GENDERUNKNOWN
Female 6,938 307 48 729 743 4,500 15 101 495
Male 6,105 234 39 670 640 3,952 9 66 495
Unknown 12 0 0 1 1 6 0 0 4
TOTAL 13,055 541 87 1,400 1,384 8,458 24 167 994
LAUDED PROFESSOR HAS A PASSION FOR TEACHING, A PASSION FOR ‘CODE’
With a teaching style CSU Bakersfield students describe as passionate and encouraging, Dr. Huaqing Wang received the university’s Millie Ablin Excellence in Teaching Award this year, recognizing his 25 years of renowned teaching fervor.
“His caring for student success is legendary in the department,” noted one of his colleagues in the Department of Computer and Electrical Engineering and Computer Science. “Students would receive emails in response to their questions on weekends, late at night and in summer, whenever they needed it in and out of class.”
Before joining the CSU Bakersfield faculty in fall 1988, Dr. Wang graduated with his Ph.D. in computer science from Case Western Reserve University.
“The skills he taught us transcended mere classwork but gave us skills for life,” says Josh Hardin, one of Dr. Wang’s computer science students. “His courses make you dream about the code. If his students ‘dream code,’ you can rest assured that Dr. Wang probably eats, breathes and drinks code.”
24 25
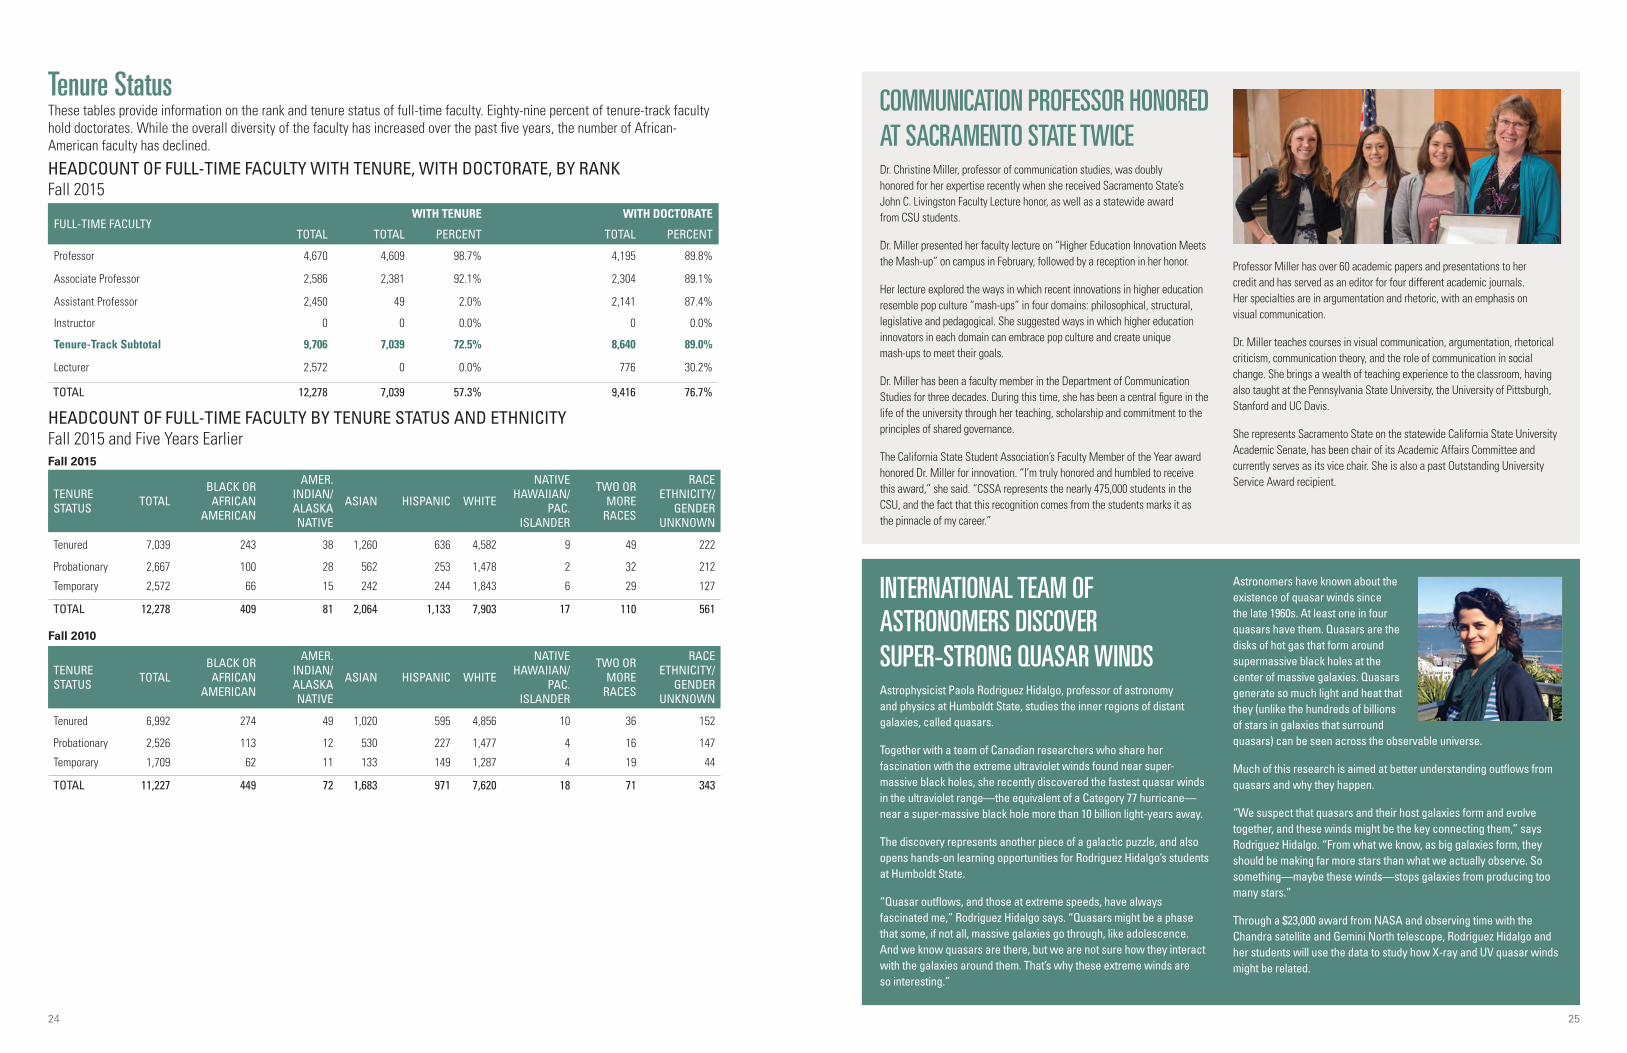
These tables provide information on the rank and tenure status of full-time faculty. Eighty-nine percent of tenure-track faculty hold doctorates. While the overall diversity of the faculty has increased over the past five years, the number of African-American faculty has declined.
INTERNATIONAL TEAM OF ASTRONOMERS DISCOVER SUPER-STRONG QUASAR WINDS Astrophysicist Paola Rodriguez Hidalgo, professor of astronomy and physics at Humboldt State, studies the inner regions of distant galaxies, called quasars.
Together with a team of Canadian researchers who share her fascination with the extreme ultraviolet winds found near super-massive black holes, she recently discovered the fastest quasar winds in the ultraviolet range—the equivalent of a Category 77 hurricane—near a super-massive black hole more than 10 billion light-years away.
The discovery represents another piece of a galactic puzzle, and also opens hands-on learning opportunities for Rodriguez Hidalgo’s students at Humboldt State.
“Quasar outflows, and those at extreme speeds, have always fascinated me,” Rodriguez Hidalgo says. “Quasars might be a phase that some, if not all, massive galaxies go through, like adolescence. And we know quasars are there, but we are not sure how they interact with the galaxies around them. That’s why these extreme winds are so interesting.”
Astronomers have known about the existence of quasar winds since the late 1960s. At least one in four quasars have them. Quasars are the disks of hot gas that form around supermassive black holes at the center of massive galaxies. Quasars generate so much light and heat that they (unlike the hundreds of billions of stars in galaxies that surround quasars) can be seen across the observable universe.
Much of this research is aimed at better understanding outflows from quasars and why they happen.
“We suspect that quasars and their host galaxies form and evolve together, and these winds might be the key connecting them,” says Rodriguez Hidalgo. “From what we know, as big galaxies form, they should be making far more stars than what we actually observe. So something—maybe these winds—stops galaxies from producing too many stars.”
Through a $23,000 award from NASA and observing time with the Chandra satellite and Gemini North telescope, Rodriguez Hidalgo and her students will use the data to study how X-ray and UV quasar winds might be related.
HEADCOUNT OF FULL-TIME FACULTY WITH TENURE, WITH DOCTORATE, BY RANKFall 2015
FULL-TIME FACULTYTOTAL
WITH TENURE WITH DOCTORATE
TOTAL PERCENT TOTAL PERCENT
Professor 4,670 4,609 98.7% 4,195 89.8%
Associate Professor 2,586 2,381 92.1% 2,304 89.1%
Assistant Professor 2,450 49 2.0% 2,141 87.4%
Instructor 0 0 0.0% 0 0.0%
Tenure-Track Subtotal 9,706 7,039 72.5% 8,640 89.0%
Lecturer 2,572 0 0.0% 776 30.2%
TOTAL 12,278 7,039 57.3% 9,416 76.7%
HEADCOUNT OF FULL-TIME FACULTY BY TENURE STATUS AND ETHNICITYFall 2015 and Five Years Earlier
TENURE STATUS TOTAL
BLACK OR AFRICAN
AMERICAN
AMER. INDIAN/ALASKA NATIVE
ASIAN HISPANIC WHITE
NATIVEHAWAIIAN/
PAC. ISLANDER
TWO ORMORE
RACES
RACE ETHNICITY/
GENDER UNKNOWN
Tenured 7,039 243 38 1,260 636 4,582 9 49 222
Probationary 2,667 100 28 562 253 1,478 2 32 212
Temporary 2,572 66 15 242 244 1,843 6 29 127
TOTAL 12,278 409 81 2,064 1,133 7,903 17 110 561
TENURE STATUS TOTAL
BLACK OR AFRICAN
AMERICAN
AMER. INDIAN/ALASKA NATIVE
ASIAN HISPANIC WHITE
NATIVEHAWAIIAN/
PAC. ISLANDER
TWO ORMORE
RACES
RACE ETHNICITY/
GENDER UNKNOWN
Tenured 6,992 274 49 1,020 595 4,856 10 36 152
Probationary 2,526 113 12 530 227 1,477 4 16 147
Temporary 1,709 62 11 133 149 1,287 4 19 44
TOTAL 11,227 449 72 1,683 971 7,620 18 71 343
Tenure Status
Fall 2015
Fall 2010
COMMUNICATION PROFESSOR HONORED AT SACRAMENTO STATE TWICE Dr. Christine Miller, professor of communication studies, was doubly honored for her expertise recently when she received Sacramento State’s John C. Livingston Faculty Lecture honor, as well as a statewide award from CSU students.
Dr. Miller presented her faculty lecture on “Higher Education Innovation Meets the Mash-up” on campus in February, followed by a reception in her honor.
Her lecture explored the ways in which recent innovations in higher education resemble pop culture “mash-ups” in four domains: philosophical, structural, legislative and pedagogical. She suggested ways in which higher education innovators in each domain can embrace pop culture and create unique mash-ups to meet their goals.
Dr. Miller has been a faculty member in the Department of Communication Studies for three decades. During this time, she has been a central figure in the life of the university through her teaching, scholarship and commitment to the principles of shared governance.
The California State Student Association’s Faculty Member of the Year award honored Dr. Miller for innovation. “I’m truly honored and humbled to receive this award,” she said. “CSSA represents the nearly 475,000 students in the CSU, and the fact that this recognition comes from the students marks it as the pinnacle of my career.”
Professor Miller has over 60 academic papers and presentations to her credit and has served as an editor for four different academic journals. Her specialties are in argumentation and rhetoric, with an emphasis on visual communication.
Dr. Miller teaches courses in visual communication, argumentation, rhetorical criticism, communication theory, and the role of communication in social change. She brings a wealth of teaching experience to the classroom, having also taught at the Pennsylvania State University, the University of Pittsburgh, Stanford and UC Davis.
She represents Sacramento State on the statewide California State University Academic Senate, has been chair of its Academic Affairs Committee and currently serves as its vice chair. She is also a past Outstanding University Service Award recipient.

26 27
In recent years, dedicated efforts by the CSU to invest in the future of our students have led to an increase in the number of faculty hires. Significantly, 463 female professors and 327 minority professors were added to the tenure track as of fall 2015, out of a total of 849 new tenure-track faculty members. This helps to ensure that a diverse group of professors will continue to lead instruction at the CSU for years to come.
More information on new faculty hired by the CSU is available in an annual report on the Faculty Recruitment Survey. This report contains detailed information on faculty recruitment, faculty demographics and salary offers to new faculty.
These new faculty members join a storied tradition of empowerment, stewardship and investment in CSU students as they mature into the education leaders of tomorrow in California and beyond.
New Faculty
NEW FULL-TIME, TENURE-TRACK FACULTY BY RANK (HEADCOUNT), WITH TENUREFall 2015 and Five Years EarlierFall 2015
ACADEMIC RANK TOTAL MALE FEMALE MINORITIES
Professor 10 8 2 5
Associate Professor 33 19 14 18
Assistant Professor 806 359 447 304
TOTAL 849 386 463 327
Fall 2010
ACADEMIC RANK TOTAL MALE FEMALE MINORITIES
Professor 8 3 5 2
Associate Professor 7 3 4 2
Assistant Professor 92 50 42 34
Instructor 1 1 0 0
TOTAL 108 57 51 38
Source: CSU annual reports on Faculty Recruitment Survey
PROFESSOR PUTS SONOMA STATE ON THE INTERSTELLAR MAP
Physics and Astronomy Professor Lynn Cominsky is putting Sonoma State University on the interstellar map.
Dr, Cominsky has taught at the Rohnert Park campus for three decades, and also works with NASA and other space
exploration agencies on, among other things, the study of black holes. One of those agencies is Laser Interferometer Gravitational-wave Observatory (LIGO), which confirmed a key piece of Albert Einstein’s Theory of Relativity by detecting gravitational waves emanating from the collision of two black holes in deep space.
She joined LIGO’s program advisory committee for a three-year term in 2007, and she now chairs the education working group for the LIGO Scientific Collaboration.
“I am thrilled to be a small part of the LIGO outreach effort,” she says. “Studying black holes has been most of my life’s work, and the discovery of gravitational waves using LIGO detectors will open an entirely new branch of astronomy.”
Dr. Comisky joined the Sonoma State faculty in 1986 and became chair of the Physics and Astronomy Department in 2004. Previously, she worked with the UC Berkeley Space Sciences Laboratory and NASA’s Extreme Ultraviolet Explorer Satellite Project. She did her undergraduate work at Brandeis University and earned her Ph.D. from MIT.
As the founder of Sonoma State’s Education and Public Outreach Group, Dr. Cominsky’s mission is to develop exciting educational materials that inspire students in grades 5 through community college to pursue STEM careers, to train teachers nationwide in the use of these materials and to enhance science literacy in the general public.
“I’m passionate about providing opportunities for female and underrepresented minority students to ‘learn by making’ through hands-on activities that include computer programming and electronics,” she says.
“These skills are badly needed for the U.S. to stay economically competitive, and they are some of the most challenging to teach and to learn.”
The tables below present information on tenured/tenure track and full-time temporary faculty who separated from CSU employment in 2014-2015 and in the prior year. In 2014-2015, 58 percent of the separations were retirements.
Promotions & TenureThe following tables present data on the number of full-time faculty unit employees who were promoted to a higher academic rank effective fall 2014 and fall 2015 and the number of faculty who earned tenure effective fall 2015. These data include promotions and awards of tenure to instructional faculty as well as non-instructional members of the faculty bargaining unit (librarians and counselor faculty).
Ranks include equivalent ranks for librarians and counselor faculty.Source: CIRS Compendium Report G01
Source: Data from custom report run using CIRS (Campus Information Retrieval System) data program prodpgm (pdc9520a/b)
*Includes those granted tenure between 7/1/15 and 12/31/15
PROMOTION TO FALL 2014 FALL 2015
Professor 362 298
Associate Professor 361 249
Assistant Professor 4 3
TOTAL 727 550
Unknown 7 7
PROMOTIONS AMONG FULL-TIME FACULTY (HEADCOUNT) Fall 2015 and Prior Year
TOTAL 269
NUMBER OF FACULTY GRANTED TENURE (HEADCOUNT)* Fall 2015
Separations
SEPARATIONS AMONG FULL-TIME FACULTY BY CAUSE AND APPOINTMENT STATUS (HEADCOUNT)2014-15 and 2013-14
TENURE STATUS
FULL-TIME HEADCOUNT
(2013-14)
RETIREMENT DEATH RESIGNATION NOT REHIRED TOTAL SEPARATIONS
Number Percent* Number Percent* Number Percent* Number Percent* Number Percent*
Tenured 7,207 348 4.8% 14 0.2% 66 0.9% 2 0.0% 430 6.0%
Probationary 2,226 7 0.3% 0 0.0% 95 4.3% 10 0.4% 112 5.0%
Temporary 2,400 52 2.2% 3 0.1% 25 1.0% 85 3.5% 165 6.9%
TOTAL 11,833 407 3.4% 17 0.1% 186 1.6% 97 0.8% 707 6.0%
TENURE STATUS
FULL-TIME HEADCOUNT
(2012-13)
RETIREMENT DEATH RESIGNATION NOT REHIRED TOTAL SEPARATIONS
Number Percent* Number Percent* Number Percent* Number Percent* Number Percent*
Tenured 7,272 344 4.7% 17 0.2% 83 1.1% 7 0.1% 451 6.2%
Probationary 2,010 7 0.3% 2 0.1% 98 4.9% 21 1.0% 128 6.4%
Temporary 2,171 60 2.8% 5 0.2% 22 1.0% 66 3.0% 153 7.0%
TOTAL 11,453 411 3.6% 24 0.2% 203 1.8% 94 0.8% 732 6.4%
*Separations as percent of full-time employees within each tenure status (tenured, probationary, temporary, or total faculty).
Notes: Tables on faculty separations exclude all temporary faculty with part-time appointments. Retiring faculty who enter FERP are included, but FERP faculty who exited the program during the years reported are excluded. Reappointed lecturers are also excluded.
Source: CIRS Compendium Report K19
2014-15
2013-14

28 29
SalaryAVERAGE SALARIES* FOR FULL-TIME FACULTY BY RANK AND APPOINTMENT TYPE (HEADCOUNT) Fall 2015
ACADEMIC YEAR 12-MONTH
ACADEMIC RANK HEADCOUNT AVERAGE SALARIES HEADCOUNT AVERAGE
SALARIES
Professor 4,196 $96,517 474 $118,509
Associate Professor 2,489 $81,015 97 $98,039
Assistant Professor 2,438 $73,919 12 $88,811
Lecturer 2,425 $56,781 147 $76,801
TOTAL 11,548 $80,061 730 $106,902
*Only includes base salaries; additional compensation earned through additional appointments, such as extra quarter assignments and summer sessions, are not included.
Note: In the 2007 and prior editions of the Profile of CSU Employees, 12-month faculty salaries were adjusted using a conversion factor of 9/11 and then combined with academic year salaries to provide average salaries by rank on an academic year basis. Beginning in 2008, in an effort to provide more detailed information about salaries, the academic year and 12-month salaries are reported separately and without any adjustments.
RENOWNED VICTIMOLOGY EXPERT’S VISION HONORED WITH NATIONAL AWARD
World-renowned criminology and victimology expert Dr. John P. Dussich, Fresno State professor emeritus of criminology, received the
prestigious Ronald Wilson Reagan Public Policy Award from the Office for Victims of Crime honoring his leadership, vision and innovation leading to significant changes in public policy and practice that benefit crime victims. It was presented at the National Crime Victims’ Service Awards ceremony held in Washington, D.C.
Dr. Dussich, who joined the Fresno State faculty in 2003, created the victim advocate concept, establishing the first program in Fort Lauderdale, Fla., in 1974. He is the founder of the National Organization for Victim Assistance, which he launched in Fresno in 1976. Attorney General Loretta Lynch honored nine individuals, programs, teams and organizations at the April ceremony.
Dr. Dussich has taught, conducted research and provided victim services throughout the world, including in the Sudan, Croatia, Israel, El Salvador, Guatemala, Nepal and China. He is the founding secretary general of the World Society of Victimology, which was launched in Munster, Germany in 1979. He served as the society’s president and was instrumental in the founding of the American Society of Victimology.
Dr. Yoshiko Takahashi, associate professor of criminology, nominated Dr. Dussich for the award. “I have worked with Dr. Dussich for more than seven years as a colleague and his commitment to victim services throughout his career make him well-qualified for this award,” Dr. Takahashi said. “His contribution and efforts to further victims’ rights, education and advocacy are admirable.”
CampusHEADCOUNT OF FULL-TIME FACULTY BY RANK AND CAMPUSFall 2015
CAMPUS PROFESSOR ASSOCIATE PROFESSOR
ASSISTANT PROFESSOR
TENURE-TRACK SUBTOTAL LECTURER ALL
FULL-TIME
Bakersfield 75 54 49 178 90 268
Channel Islands 49 18 45 112 72 184
Chico 213 104 108 425 86 511
Dominguez Hills 93 65 65 223 92 315
East Bay 123 93 88 304 50 354
Fresno 218 150 150 518 168 686
Fullerton 305 239 216 760 221 981
Humboldt 115 46 61 222 59 281
Long Beach 367 210 179 756 270 1,026
Los Angeles 275 107 96 478 144 622
Maritime Academy 19 11 21 51 15 66
Monterey Bay 51 40 56 147 79 226
Northridge 385 175 212 772 165 937
Pomona 240 96 145 481 92 573
Sacramento 344 137 114 595 122 717
San Bernardino 200 68 95 363 92 455
San Diego 332 219 140 691 164 855
San Francisco 326 235 134 695 124 819
San José 312 154 145 611 87 698
San Luis Obispo 280 193 163 636 187 823
San Marcos 108 71 67 246 95 341
Sonoma 121 54 36 211 35 246
Stanislaus 119 47 65 231 63 294
TOTAL 4,670 2,586 2,450 9,706 2,572 12,278
HEADCOUNT OF FULL-TIME FACULTY BY RANKFall 2015 and Prior Years
Professor
Associate Professor
Assistant Professor
Lecturer
20100
2,000
4,000
6,000
8,000
10,000
12,000
2011 2012 2013 2014 2015
4,503
2,696
2,363
1,664 1,827 1,991 2,1712,400
2,572
2,247 2,004 1,876 2,033 2,450
2,706 2,686 2,706 2,686 2,586
4,549 4,664 4,700 4,714 4,670
OUTSTANDING PROFESSOR SUPPORTS STUDENTS AND THE EAST BAY COMMUNITY
Dr. Lettie Ramirez has been honored by Cal State East Bay, as its Outstanding Contributor to Community Engagement for her grant writing and support of local public education. The award honors a faculty member deeply committed to the surrounding community. The honor recognized her dedication to East Bay neighborhoods and for generating more than $11 million in federal, state and private funding
for professional development for teachers. Dr. Ramirez, who has been a member of the Department of Teacher Education at Cal State East Bay since 1994, focuses her research on English language learners, multicultural education and Latinos in higher education.
Dr. Ramirez is a leader in GANAS, East Bay’s program for Latino transfer students. She has co-authored two books and is serving as the vice president of the American Association of Colleges for Teacher Education. She is also on the board of the California Association of Bilingual Education.

30 31
This reference booklet contains fall 2015 snapshot information on employees at all 23 campuses and the Chancellor’s Office. All tables and charts in the Employee Profile exclude student employees, other intermittent or casual employees, and faculty teaching in extension, special sessions and summer sessions. Employees are included regardless of the source of funds used to pay their salaries. Due to significant changes to reporting requirements for the Integrated Postsecondary Education Data System (IPEDS) beginning in 2012, reporting groups have been realigned and cannot be compared directly to groups reported in prior Employee Profiles. Employee reporting has been aligned with the 2010 Standard Occupational Classifications published by the National Bureau of Labor Standards. Data presented in this report were obtained from the following sources:
1. IPEDS DATABASE, ORACLE / PEOPLESOFT
Construction/Maintenance/Transportation
Consolidates two IPEDS reporting groups: 1. Natural Resources, Construction and Maintenance Occupations; 2. Production, Transportation and Material Moving Occupations. Includes electricians, mechanics, carpenters, painters, agricultural workers, gardeners, equipment technicians, equipment operators, etc. Most employees in this group were previously reported in the Skilled Crafts group; of the remainder, most were previously reported in the Technical and Paraprofessional or Service/Maintenance groups.
FacultyAll regular instructional faculty, including department chairs and lecturers. Excludes librarians, coaches and counselors. Also excludes extension or summer session faculty.
Management*
Includes executives, vice presidents, directors, managers, deans and other management personnel with primary (and major) responsibility for management of the institution or recognized subdivision or department, etc. Employees in the Management group customarily and regularly direct the work of others and perform work directly related to management policies or general business operations (supervisors are no longer included in this group). All employees in the Management group are classified by the CSU as either Executives or members of the Management Personnel Plan. Employees in this group were previously reported in the Executive, Administrative and Managerial group.
Office/Administrative Support
Includes departmental secretaries; payroll, receiving and account clerks; administrative assistants and coordinators; accounting technicians, data entry operators, credential analysts and evaluators; property clerks; police dispatchers, etc. Most employees in this group were previously reported in the Clerical and Secretarial group; of the remainder, most were formerly reported in the Technical and Paraprofessional or Service/Maintenance groups.
Professional/Technical Occupations
Consolidates six IPEDS reporting groups: 1. Community Service, Legal, Arts, and Media Occupations; 2. Business and Financial Operations Occupations; 3. Healthcare Practitioner and Technical Occupations; 4. Computer, Engineering, and Science Occupations; 5. Non-Postsecondary Teaching; 6. Librarians, Archivists, and Curators. Most employees in these six groups were previously reported either as Professional or Technical and Paraprofessional. Also includes coaches and counselors.
Service OccupationsIncludes custodians, grounds workers, police officers, food service workers, parking officers, etc. Most employees in this group were previously reported in the Service/Maintenance group; of the remainder, most were previously reported in the Other Professional or Technical and Paraprofessional groups.
2. CAMPUS INFORMATION RETRIEVAL SYSTEM (CIRS) - PRIOR YEARS DATA
Clerical & Secretarial Includes departmental secretaries; payroll, receiving and account clerks; etc.
Executive, Administrative, & Managerial*
Includes executives, vice presidents, directors, managers, deans, accounting supervisors, employment supervisors and any other management personnel with primary (and major) responsibility for management of the institution or recognized subdivision or department, etc. or any other supervisory personnel with responsibility for professional employees. Employees in the Executive, Administrative, and Managerial group customarily and regularly direct the work of others and perform work directly related to management policies or general business operations or supervise the work of professional employees and perform work similar to that of those they supervise. All employees in the Executive, Administrative & Managerial group are classified by the CSU as either Executives or members of the Management Personnel Plan (MPP).
TECHNICAL NOTES AND GLOSSARY
*Employees in CSU’s Management Personnel Plan (MPP) are assigned to IPEDS occupational groups based on their job responsibilities. Besides the Management group, MPP employees are distributed across several other occupational groups.
TECH
NICA
L NOT
ES A
ND G
LOSS
ARY
30
FacultyAll regular instructional faculty, including department chairs and lecturers. Excludes librarians, coaches and counselors (counted among “Other Professional”). Also excludes extension or summer session faculty.
Other Professional Includes employees whose jobs require a college education or comparable experience; excludes faculty and individuals meeting the IPEDS definition of Executive, Administrative, & Managerial employees.
Service/Maintenance Includes custodians, gardeners, laborers, campus guards, etc.
Skilled Crafts Includes electricians, mechanics, carpenters, etc.
Technical & Paraprofessional
Includes employees whose jobs require skills acquired in a junior college or equivalent on-the-job training, such as computer operators, instructional support, and equipment technicians.
3. CSU FACULTY RECRUITMENT SURVEY
New Faculty
Instructional faculty members appointed to tenure-track positions and scheduled to begin service during the 2014/15 academic year, as reported by campuses in the annual CSU Faculty Recruitment Survey. Includes all employees newly appointed to tenure-track positions at the reporting campus, including those who previously held tenure-track appointments elsewhere in the CSU or temporary appointments at the reporting campus or other CSU campuses. Does not include employees appointed as tenure-track librarians or counselors.
TECHNICAL NOTES AND GLOSSARY
FERP Faculty Refers to faculty employees who participate in the Faculty Early Retirement Program.
FTE Positions Refers to the total “full-time equivalent positions” filled by all full-time and part-time employees.
Full-Time Individuals employed “100% time”; includes full-time employees on leave with pay.
Lecturer Includes all instructional faculty with temporary appointments (non-tenure track).
MinorityIncludes individuals who reported an ethnic/racial background other than “White.” Individuals who did not report an ethnic/racial background are counted in a “Race/Ethnicity/Gender Unknown” category.
Part-Time Includes employees whose assignments at a given campus are less than 100% time. Individuals employed simultaneously at two campuses are counted as two employees.
Probationary Faculty Tenure-track faculty employees who have not been awarded tenure. Includes individuals serving a “terminal” year.
Race/Ethnicity/Gender Unknown
Includes all individuals who did not self-report a racial/ethnic background and/or gender.
Staff Employees Refers to all employees who are not “faculty” as defined above.
Support Includes persons in the following employee categories: Clerical & Secretarial, Technical & Paraprofessional, Skilled Crafts, and Service/Maintenance.
Temporary Faculty Members of the faculty bargaining unit with temporary appointments (non-tenure track). Include lecturers, temporary librarians, faculty coaches, and temporary faculty counselors.
Tenured Faculty Tenure-track faculty employees who have been awarded tenure.
Total Data shown throughout this report exclude student employees, intermittent employees and extension and summer session faculty.
Note: Percentages referenced throughout report may not add up to 100 percent because of rounding.
Questions about the data in the Employee Profile should be directed to: [email protected]

32

401 Golden Shore, 6th Floor, Long Beach, CA 90802-4210www.calstate.edu
STRENGTH • DIVERSITY • EXCELLENCE