Embed Size (px)
Citation preview

The Japanese Geotechnical Society
Soils and Foundations
Soils and Foundations 2012;52(1):126–145
0038-0
hosting
Peer re
doi:10.
Abbr
with fu
failure
compre
cementnCor
E-m
806 & 201
by Elsev
view und
1016/j.san
Pr
eviations:
ll unload
envelope
ssion; CD
-mixed gr
respondin
ail addre
www.sciencedirect.comjournal homepage: www.elsevier.com/locate/sandf
Strength and deformation characteristics of cement-mixedgravelly soil in multiple-step triaxial compression
A. Taheria,n, Y. Sasakia, F. Tatsuokaa, K. Watanabeb
aDepartment of Civil Engineering, Tokyo University of Science, Noda, Chiba 278-8510, JapanbRailway Technical Research Institute, Hikaricho Kokubunji, Tokyo, Japan
Available online 7 February 2012
Abstract
When backfill is mixed with cement and compacted in the field, it is very difficult to obtain the multiple similar samples needed to
determine a Mohr–Coulomb (M–C) failure envelope by a set of triaxial compression (TC) tests at different levels of effective confining
pressure ðs0hsÞ, due to the inevitably large heterogeneity. The effects of the intermediate loading histories, with and without large stress–
amplitude unload/reload cycles, on the stress–strain properties of compacted cement-mixed well-graded gravelly soil, particularly the
peak strength, were evaluated in multiple-step loading (ML) drained TC tests using a single specimen. A set of single-step loading (SL)
tests at different s0hs were also performed. Similar specimens, prepared in the laboratory, were used for the tests in this study. Although
the M–C failure envelope can be quite accurately determined by relevant ML tests, the peak strength may be underestimated if (a) TC
loading is ceased far before the peak stress state or (b) TC reloading is started after the peak stress state has been passed at previous
loading steps. Cases (a) and (b) may take place in both ML tests, with increasing and decreasing s0h, while Case (b) may take place in ML
tests with decreasing s0h. The reloading stress–strain relation at the intermediate stage in ML tests may become very soft due to the
additional damage caused by a negative irreversible shear strain increment occurring in the immediately preceding unloading process.
This effect gradually decreases during reloading, while it totally disappears once large-scale yielding has started, with essentially no effect
on the peak strength. It is of the first priority to perform ML tests by increasing s0h. It is recommended that ML tests be performed by
decreasing s0h if possible, because the peak stress may be closely reached at some intermediate steps. An upper envelope of results from a
pair of ML tests, with increasing and decreasing s0h, could be more representative of the true M–C failure envelope.
& 2012. The Japanese Geotechnical Society. Production and hosting by Elsevier B.V. All rights reserved.
Keywords: Cement-mixed gravel; Deformation; Mohr–Coulomb failure envelope; Multiple-step loading; Strength; Triaxial compression test (IGC: D6/E14)
2. The Japanese Geotechnical Society. Production and
ier B.V. All rights reserved.
er responsibility of The Japanese Geotechnical Society
df.2012.01.015
oduction and hosting by Elsevier
ML, multiple-step loading; SL, single-step loading; w/U,
ing; w/oU, without full unloading; M–C, Mohr–Coulomb
; LDT, local deformation transducer; TC, triaxial
, consolidated drained; TE, triaxial extension; CMG,
avel.
g author.
ss: [email protected] (A. Taheri).
1. Introduction
The use of a cement-mixed granular material, with amuch smaller amount of cement than ordinary concreteemployed in civil engineering construction projects, is nowgaining wide acceptance. A number of critical civil engi-neering projects have become feasible due to the applica-tion of various compacted cement-mixed soil technologies(e.g., Hansen and Reinhardt, 1990; Schrader, 1996;Tatsuoka et al., 1997). It is not usually difficult to producecompacted cement-mixed soil with mechanical propertiesclose to those of natural sedimentary soft rock (Tatsuokaand Kohata, 1995; Tatsuoka et al., 1997). The constructionof bridge abutments for high-speed railways, whichrequires a high level of ultimate stability against high
Nomenclature
s01 maximum effective principal stresss03 minimum effective principal stresss0v vertical (axial) effective stresss0h horizontal (lateral) effective stressq deviator stress ð ¼ s
0
1�s0
3 ¼ s0
v�s0hÞ
qmax maximum deviator stressqpeak peak strengthc0
effective cohesionf0
effective friction angleD50 particle size for which 50% is finer
Dmax maximum particle sizeGs specific gravity of solid particlesUc uniformity coefficient(rd)max maximum dry densitywopt optimum water contentrd dry densitywi water contentc/g cement content per gravel weightE0 energy level for standard Proctor compaction
testn coefficient of proportionalitym scaling factor
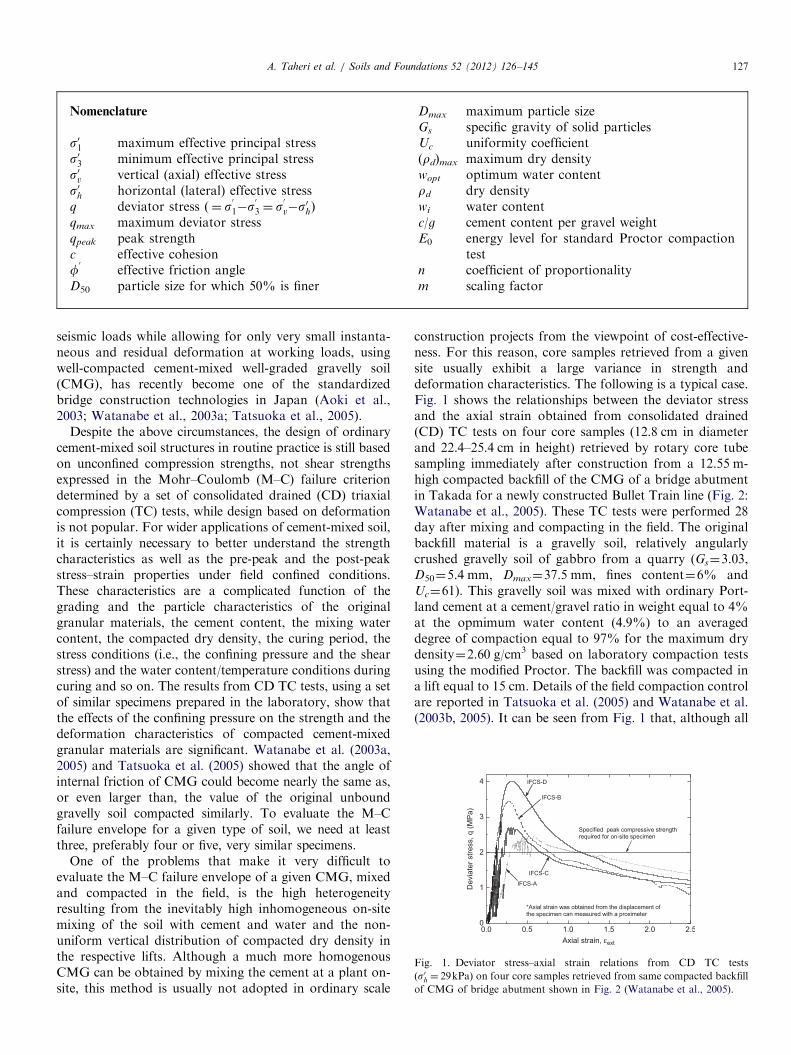
Fig. 1. Deviator stress–axial strain relations from CD TC tests
ðs0h ¼ 29kPaÞ on four core samples retrieved from same compacted backfill
of CMG of bridge abutment shown in Fig. 2 (Watanabe et al., 2005).
A. Taheri et al. / Soils and Foundations 52 (2012) 126–145 127
seismic loads while allowing for only very small instanta-neous and residual deformation at working loads, usingwell-compacted cement-mixed well-graded gravelly soil(CMG), has recently become one of the standardizedbridge construction technologies in Japan (Aoki et al.,2003; Watanabe et al., 2003a; Tatsuoka et al., 2005).
Despite the above circumstances, the design of ordinarycement-mixed soil structures in routine practice is still basedon unconfined compression strengths, not shear strengthsexpressed in the Mohr–Coulomb (M–C) failure criteriondetermined by a set of consolidated drained (CD) triaxialcompression (TC) tests, while design based on deformationis not popular. For wider applications of cement-mixed soil,it is certainly necessary to better understand the strengthcharacteristics as well as the pre-peak and the post-peakstress–strain properties under field confined conditions.These characteristics are a complicated function of thegrading and the particle characteristics of the originalgranular materials, the cement content, the mixing watercontent, the compacted dry density, the curing period, thestress conditions (i.e., the confining pressure and the shearstress) and the water content/temperature conditions duringcuring and so on. The results from CD TC tests, using a setof similar specimens prepared in the laboratory, show thatthe effects of the confining pressure on the strength and thedeformation characteristics of compacted cement-mixedgranular materials are significant. Watanabe et al. (2003a,2005) and Tatsuoka et al. (2005) showed that the angle ofinternal friction of CMG could become nearly the same as,or even larger than, the value of the original unboundgravelly soil compacted similarly. To evaluate the M–Cfailure envelope for a given type of soil, we need at leastthree, preferably four or five, very similar specimens.
One of the problems that make it very difficult toevaluate the M–C failure envelope of a given CMG, mixedand compacted in the field, is the high heterogeneityresulting from the inevitably high inhomogeneous on-sitemixing of the soil with cement and water and the non-uniform vertical distribution of compacted dry density inthe respective lifts. Although a much more homogenousCMG can be obtained by mixing the cement at a plant on-site, this method is usually not adopted in ordinary scale
construction projects from the viewpoint of cost-effective-ness. For this reason, core samples retrieved from a givensite usually exhibit a large variance in strength anddeformation characteristics. The following is a typical case.Fig. 1 shows the relationships between the deviator stressand the axial strain obtained from consolidated drained(CD) TC tests on four core samples (12.8 cm in diameterand 22.4–25.4 cm in height) retrieved by rotary core tubesampling immediately after construction from a 12.55 m-high compacted backfill of the CMG of a bridge abutmentin Takada for a newly constructed Bullet Train line (Fig. 2:Watanabe et al., 2005). These TC tests were performed 28day after mixing and compacting in the field. The originalbackfill material is a gravelly soil, relatively angularlycrushed gravelly soil of gabbro from a quarry (Gs¼3.03,D50¼5.4 mm, Dmax¼37.5 mm, fines content¼6% andUc¼61). This gravelly soil was mixed with ordinary Port-land cement at a cement/gravel ratio in weight equal to 4%at the opmimum water content (4.9%) to an averageddegree of compaction equal to 97% for the maximum drydensity¼2.60 g/cm3 based on laboratory compaction testsusing the modified Proctor. The backfill was compacted ina lift equal to 15 cm. Details of the field compaction controlare reported in Tatsuoka et al. (2005) and Watanabe et al.(2003b, 2005). It can be seen from Fig. 1 that, although all
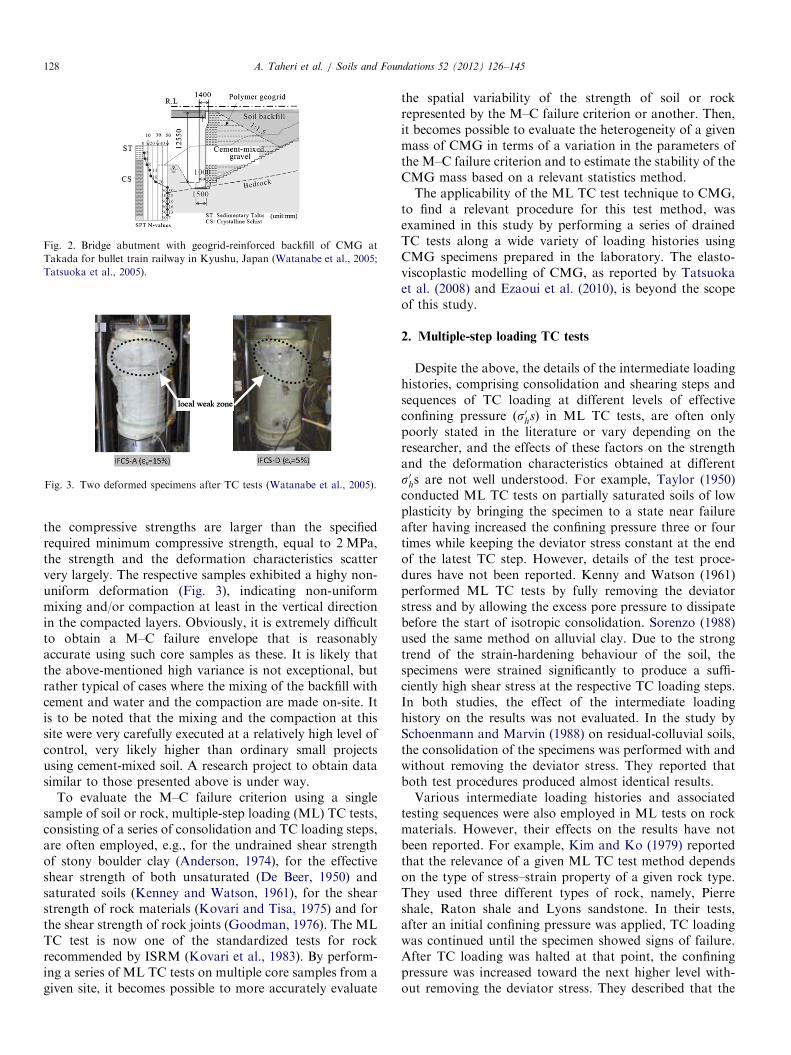
Fig. 2. Bridge abutment with geogrid-reinforced backfill of CMG at
Takada for bullet train railway in Kyushu, Japan (Watanabe et al., 2005;
Tatsuoka et al., 2005).
Fig. 3. Two deformed specimens after TC tests (Watanabe et al., 2005).
A. Taheri et al. / Soils and Foundations 52 (2012) 126–145128
the compressive strengths are larger than the specifiedrequired minimum compressive strength, equal to 2 MPa,the strength and the deformation characteristics scattervery largely. The respective samples exhibited a highy non-uniform deformation (Fig. 3), indicating non-uniformmixing and/or compaction at least in the vertical directionin the compacted layers. Obviously, it is extremely difficultto obtain a M–C failure envelope that is reasonablyaccurate using such core samples as these. It is likely thatthe above-mentioned high variance is not exceptional, butrather typical of cases where the mixing of the backfill withcement and water and the compaction are made on-site. Itis to be noted that the mixing and the compaction at thissite were very carefully executed at a relatively high level ofcontrol, very likely higher than ordinary small projectsusing cement-mixed soil. A research project to obtain datasimilar to those presented above is under way.
To evaluate the M–C failure criterion using a singlesample of soil or rock, multiple-step loading (ML) TC tests,consisting of a series of consolidation and TC loading steps,are often employed, e.g., for the undrained shear strengthof stony boulder clay (Anderson, 1974), for the effectiveshear strength of both unsaturated (De Beer, 1950) andsaturated soils (Kenney and Watson, 1961), for the shearstrength of rock materials (Kovari and Tisa, 1975) and forthe shear strength of rock joints (Goodman, 1976). The MLTC test is now one of the standardized tests for rockrecommended by ISRM (Kovari et al., 1983). By perform-ing a series of ML TC tests on multiple core samples from agiven site, it becomes possible to more accurately evaluate
the spatial variability of the strength of soil or rockrepresented by the M–C failure criterion or another. Then,it becomes possible to evaluate the heterogeneity of a givenmass of CMG in terms of a variation in the parameters ofthe M–C failure criterion and to estimate the stability of theCMG mass based on a relevant statistics method.The applicability of the ML TC test technique to CMG,
to find a relevant procedure for this test method, wasexamined in this study by performing a series of drainedTC tests along a wide variety of loading histories usingCMG specimens prepared in the laboratory. The elasto-viscoplastic modelling of CMG, as reported by Tatsuokaet al. (2008) and Ezaoui et al. (2010), is beyond the scopeof this study.
2. Multiple-step loading TC tests
Despite the above, the details of the intermediate loadinghistories, comprising consolidation and shearing steps andsequences of TC loading at different levels of effectiveconfining pressure ðs0hsÞ in ML TC tests, are often onlypoorly stated in the literature or vary depending on theresearcher, and the effects of these factors on the strengthand the deformation characteristics obtained at differents0hs are not well understood. For example, Taylor (1950)conducted ML TC tests on partially saturated soils of lowplasticity by bringing the specimen to a state near failureafter having increased the confining pressure three or fourtimes while keeping the deviator stress constant at the endof the latest TC step. However, details of the test proce-dures have not been reported. Kenny and Watson (1961)performed ML TC tests by fully removing the deviatorstress and by allowing the excess pore pressure to dissipatebefore the start of isotropic consolidation. Sorenzo (1988)used the same method on alluvial clay. Due to the strongtrend of the strain-hardening behaviour of the soil, thespecimens were strained significantly to produce a suffi-ciently high shear stress at the respective TC loading steps.In both studies, the effect of the intermediate loadinghistory on the results was not evaluated. In the study bySchoenmann and Marvin (1988) on residual-colluvial soils,the consolidation of the specimens was performed with andwithout removing the deviator stress. They reported thatboth test procedures produced almost identical results.Various intermediate loading histories and associated
testing sequences were also employed in ML tests on rockmaterials. However, their effects on the results have notbeen reported. For example, Kim and Ko (1979) reportedthat the relevance of a given ML TC test method dependson the type of stress–strain property of a given rock type.They used three different types of rock, namely, Pierreshale, Raton shale and Lyons sandstone. In their tests,after an initial confining pressure was applied, TC loadingwas continued until the specimen showed signs of failure.After TC loading was halted at that point, the confiningpressure was increased toward the next higher level with-out removing the deviator stress. They described that the

A. Taheri et al. / Soils and Foundations 52 (2012) 126–145 129
amount of underestimation of the shear strength para-meters depends on the failure mode that the rock isexpected to have. As the rock becomes stronger, itgenerally becomes more brittle, which may result in thespecimen losing its integrity with an increase in damageduring multiple-step loading tests, and consequently, anincrease in the margin between the results of single-stepand multiple-step tests. Akai et al. (1981) found that in anumber of ML TC tests on siltstone and tuff, it oftenbecame difficult to continue the ML TC testing, becausesoon after the specimen approached the failure state, itexhibited abrupt post-peak strain-softening before theincrease in confining pressure. They controlled the lateralstrain during TC loading to avoid abrupt failure. Cainet al. (1986) and Crawford and Wylie (1987) modified theML test procedure to detect imminent failure in respectiveTC loading stages. They suggested that the point at whichthe volumetric strain returned to zero in the volumetricstrain versus axial strain relation was the point of the axialload reversal. In both studies, the confining pressure wasincreased under isotropic conditions before the start of thenext TC loading. Pagoulatos (2004) also employed thisloading method, while the TC loading was reversed whenthe volumetric characteristics of the specimen changedfrom contraction to dilation. Taheri and Tani (2008) notonly increased, but also decreased, the confining pressurein their ML TC tests on sedimentary soft rock.
In summary, the previous researchers have suggestedthat the following three factors may have a significanteffect on the results of the ML TC tests on soft andmedium-hard rock:
(a)
TC loading may have been halted too early before thepeak stress state during strain-hardening.(b)
In the ML TC tests on samples that exhibit significantstrain-softening, the peak strength may be underestimatedat the second (or later) TC step and subsequent steps. Thispossibility increases with an increase in the brittleness (i.e.,the ratio of residual strength to peak strength). Thisunderestimation is due to the fact that the peak stressstate has been passed during previous TC steps, appliedbefore the start of the TC loading at the current step.(c)
A bound specimen is continuously damaged by theshearing that is applied after the bonding has developed.A specimen may be damaged by excessive shearing atprevious TC steps and/or by negative shearing duringunloading to a higher extent than the one that would beexperienced by the same loading history in a correspond-ing SL TC test. This additional damage may result in theunder-estimation of the peak strength evaluated by the SLTC tests at the second (or later) TC loading step andsubsequent steps in the ML TC tests.To alleviate the last problem with sedimentary soft rock(i.e., mudstone and siltstone), a damage model was proposed
to correct the ML test results for a predicted amount ofdamage (Tani, 2007; Taheri and Tani, 2009a,b). Yet, it is notwell understood when and how the damage develops duringthe whole loading histories applied in a given ML TC test onnatural hard and soft rock. Taheri and Tani (2009b) alsoshowed that with mudstone that exhibits significant strain-softening behaviour at lower s0hs, an upper bound for c0 anda lower bound for f0 are obtained from the ML TC testswith increasing s0h, while an upper bound for f0 and a lowerbound for c0 result from the ML TC tests with decreasing s0h.This is likely to be because in the ML TC tests withdecreasing s0h, the underestimation of the peak strength byfactor b), and possibly also by factor c), becomes moresignificant at later steps at lower s0hs, when the materialbecomes more brittle.The strength and deformation characteristics of the CMG
prepared in the laboratory were studied rather comprehen-sively by Watanabe et al. (2003a), Kongsukprasert andTatsuoka (2003, 2005, 2007), Lohani et al. (2004),Kongsukprasert et al. (2005, 2007) and others. These studiesshowed that, like hard soil/soft rock, well compacted CMGexhibits the trend of strain-hardening behaviour that becomesstronger at higher s0hs and the trend of strain-softeningbehaviour that becomes stronger at lower s0hs. This impliesthat the M–C failure criterion of CMG from a given ML TCtest may be subjected to the effects of two factors, (a) and (b)described above, like hard soil/soft rock. The effect of factor(c) should also be taken into account if necessary. No study onthe relevance of the ML TC tests on CMG can be found in theliterature. Therefore, the particular concerns presented hereinclude the following:
(1)
When should the TC compression be ceased at a givenTC loading step?(2)
How much should the deviator stress be decreasedtoward the isotropic stress state before changing s0h tothe value at the next TC loading step?(3)
How should the stress path during the consolidationstage be?(4)
How much should s0h be changed to move to the nextTC loading stage?(5)
Should s0h be increased or decreased in order to moveto the next TC loading step?In view of the above, the following three series of CDTC tests of compacted CMG were performed in thepresent study:
(1)
a set of single-step loading (SL) CD TC tests towardthe ultimate failure at different s0hs to evaluate thestress–strain relations under continuous monotonicloading with no previous shearing,(2)
a set of multiple-step loading (ML) CD TC tests inwhich the effective confining pressure ðs0hÞ is eitherincreased or decreased to move to the next TC loadingstep and(3)
a set of TC tests at fixed s0h applying several unload/reload cycles to increase the stress amplitude fromdifferent fixed shear stresses during otherwise mono-tonic loading at a constant strain rate to evaluate the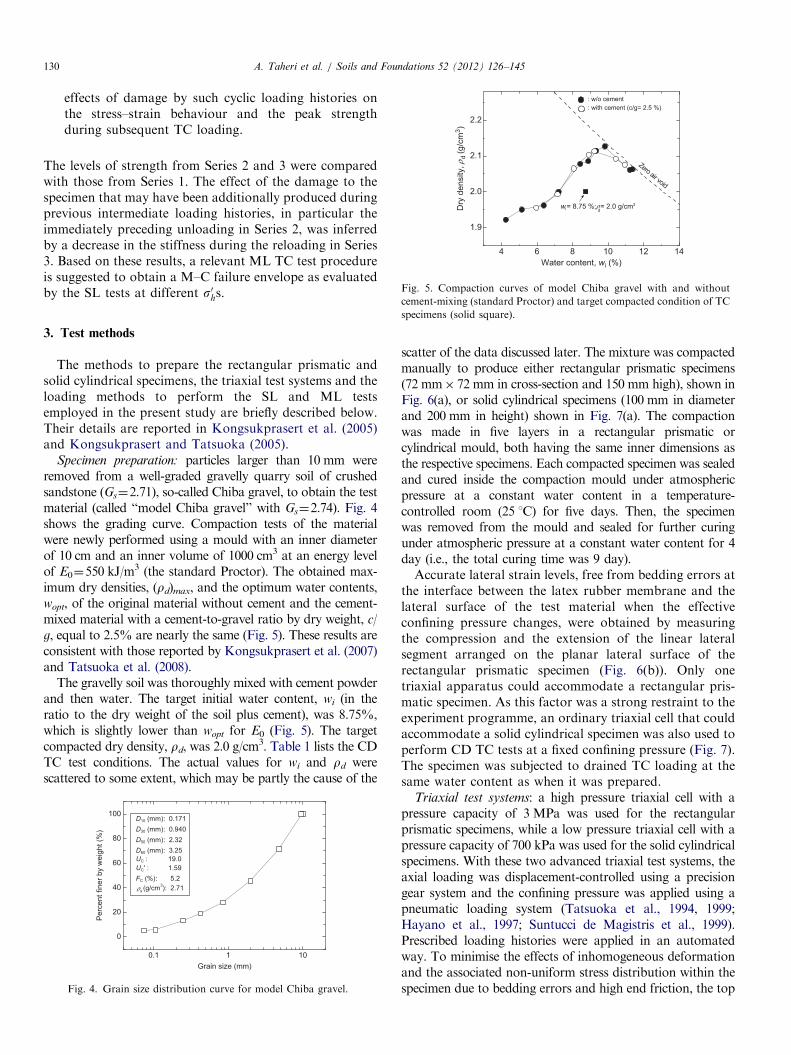
2.2: with cement (c/g= 2.5 %)
m3 )
: w/o cement
A. Taheri et al. / Soils and Foundations 52 (2012) 126–145130
effects of damage by such cyclic loading histories onthe stress–strain behaviour and the peak strengthduring subsequent TC loading.
4
1.9
2.0
2.1
w = 8.75 %; = 2.0 g/cm
Zero air void
Dry
den
sity
, d
(g/c
Water content, wi (%)6 8 10 12 14
Fig. 5. Compaction curves of model Chiba gravel with and without
cement-mixing (standard Proctor) and target compacted condition of TC
The levels of strength from Series 2 and 3 were comparedwith those from Series 1. The effect of the damage to thespecimen that may have been additionally produced duringprevious intermediate loading histories, in particular theimmediately preceding unloading in Series 2, was inferredby a decrease in the stiffness during the reloading in Series3. Based on these results, a relevant ML TC test procedureis suggested to obtain a M–C failure envelope as evaluatedby the SL tests at different s0hs.
specimens (solid square).
3. Test methods
The methods to prepare the rectangular prismatic andsolid cylindrical specimens, the triaxial test systems and theloading methods to perform the SL and ML testsemployed in the present study are briefly described below.Their details are reported in Kongsukprasert et al. (2005)and Kongsukprasert and Tatsuoka (2005).
Specimen preparation: particles larger than 10 mm wereremoved from a well-graded gravelly quarry soil of crushedsandstone (Gs¼2.71), so-called Chiba gravel, to obtain the testmaterial (called ‘‘model Chiba gravel’’ with Gs¼2.74). Fig. 4shows the grading curve. Compaction tests of the materialwere newly performed using a mould with an inner diameterof 10 cm and an inner volume of 1000 cm3 at an energy levelof E0¼550 kJ/m
3 (the standard Proctor). The obtained max-imum dry densities, (rd)max, and the optimum water contents,wopt, of the original material without cement and the cement-mixed material with a cement-to-gravel ratio by dry weight, c/g, equal to 2.5% are nearly the same (Fig. 5). These results areconsistent with those reported by Kongsukprasert et al. (2007)and Tatsuoka et al. (2008).
The gravelly soil was thoroughly mixed with cement powderand then water. The target initial water content, wi (in theratio to the dry weight of the soil plus cement), was 8.75%,which is slightly lower than wopt for E0 (Fig. 5). The targetcompacted dry density, rd, was 2.0 g/cm
3. Table 1 lists the CDTC test conditions. The actual values for wi and rd werescattered to some extent, which may be partly the cause of the
0.1
0
20
40
60
80
100D (mm): 0.171D (mm): 0.940D (mm): 2.32D (mm): 3.25U : 19.0U ' : 1.59F (%): 5.2
(g/cm ): 2.71
Per
cent
fine
r by
wei
ght (
%)
Grain size (mm)1 10
Fig. 4. Grain size distribution curve for model Chiba gravel.
scatter of the data discussed later. The mixture was compactedmanually to produce either rectangular prismatic specimens(72 mm� 72 mm in cross-section and 150 mm high), shown inFig. 6(a), or solid cylindrical specimens (100 mm in diameterand 200 mm in height) shown in Fig. 7(a). The compactionwas made in five layers in a rectangular prismatic orcylindrical mould, both having the same inner dimensions asthe respective specimens. Each compacted specimen was sealedand cured inside the compaction mould under atmosphericpressure at a constant water content in a temperature-controlled room (25 1C) for five days. Then, the specimenwas removed from the mould and sealed for further curingunder atmospheric pressure at a constant water content for 4day (i.e., the total curing time was 9 day).Accurate lateral strain levels, free from bedding errors at
the interface between the latex rubber membrane and thelateral surface of the test material when the effectiveconfining pressure changes, were obtained by measuringthe compression and the extension of the linear lateralsegment arranged on the planar lateral surface of therectangular prismatic specimen (Fig. 6(b)). Only onetriaxial apparatus could accommodate a rectangular pris-matic specimen. As this factor was a strong restraint to theexperiment programme, an ordinary triaxial cell that couldaccommodate a solid cylindrical specimen was also used toperform CD TC tests at a fixed confining pressure (Fig. 7).The specimen was subjected to drained TC loading at thesame water content as when it was prepared.
Triaxial test systems: a high pressure triaxial cell with apressure capacity of 3 MPa was used for the rectangularprismatic specimens, while a low pressure triaxial cell with apressure capacity of 700 kPa was used for the solid cylindricalspecimens. With these two advanced triaxial test systems, theaxial loading was displacement-controlled using a precisiongear system and the confining pressure was applied using apneumatic loading system (Tatsuoka et al., 1994, 1999;Hayano et al., 1997; Suntucci de Magistris et al., 1999).Prescribed loading histories were applied in an automatedway. To minimise the effects of inhomogeneous deformationand the associated non-uniform stress distribution within thespecimen due to bedding errors and high end friction, the top
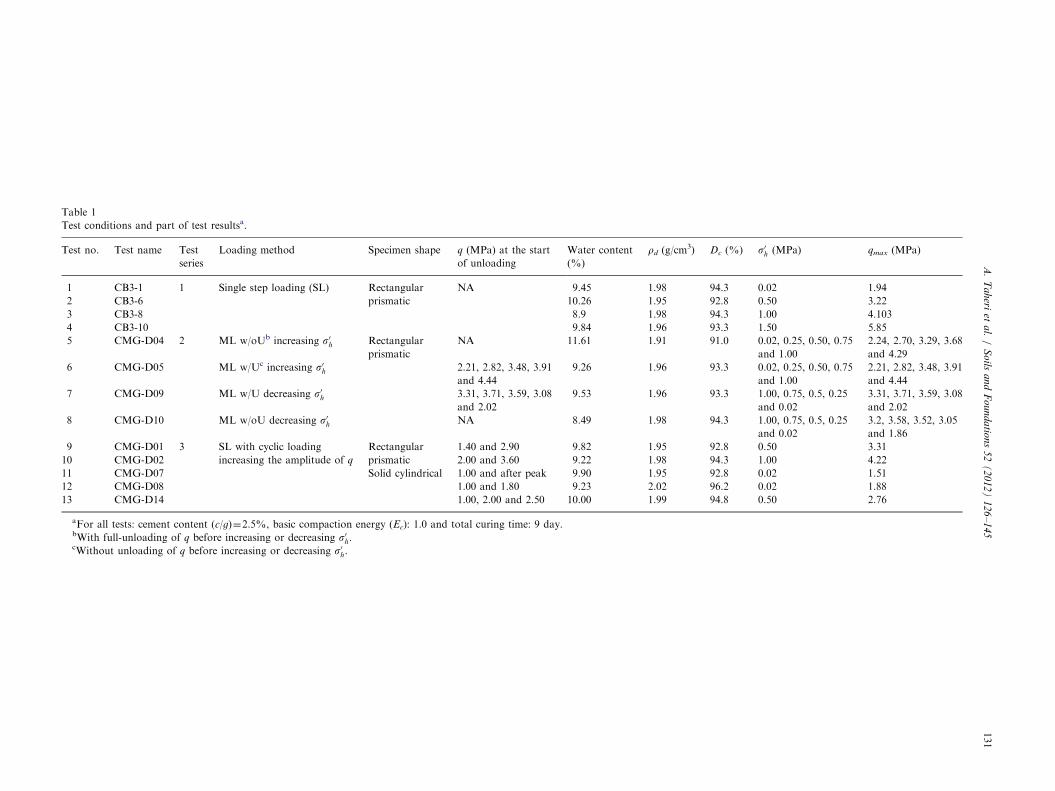
Table 1
Test conditions and part of test resultsa.
Test no. Test name Test
series
Loading method Specimen shape q (MPa) at the start
of unloading
Water content
(%)
rd (g/cm3) Dc (%) s0h (MPa) qmax (MPa)
1 CB3-1 1 Single step loading (SL) Rectangular
prismatic
NA 9.45 1.98 94.3 0.02 1.94
2 CB3-6 10.26 1.95 92.8 0.50 3.22
3 CB3-8 8.9 1.98 94.3 1.00 4.103
4 CB3-10 9.84 1.96 93.3 1.50 5.85
5 CMG-D04 2 ML w/oUb increasing s0h Rectangular
prismatic
NA 11.61 1.91 91.0 0.02, 0.25, 0.50, 0.75
and 1.00
2.24, 2.70, 3.29, 3.68
and 4.29
6 CMG-D05 ML w/Uc increasing s0h 2.21, 2.82, 3.48, 3.91
and 4.44
9.26 1.96 93.3 0.02, 0.25, 0.50, 0.75
and 1.00
2.21, 2.82, 3.48, 3.91
and 4.44
7 CMG-D09 ML w/U decreasing s0h 3.31, 3.71, 3.59, 3.08
and 2.02
9.53 1.96 93.3 1.00, 0.75, 0.5, 0.25
and 0.02
3.31, 3.71, 3.59, 3.08
and 2.02
8 CMG-D10 ML w/oU decreasing s0h NA 8.49 1.98 94.3 1.00, 0.75, 0.5, 0.25
and 0.02
3.2, 3.58, 3.52, 3.05
and 1.86
9 CMG-D01 3 SL with cyclic loading
increasing the amplitude of q
Rectangular
prismatic
1.40 and 2.90 9.82 1.95 92.8 0.50 3.31
10 CMG-D02 2.00 and 3.60 9.22 1.98 94.3 1.00 4.22
11 CMG-D07 Solid cylindrical 1.00 and after peak 9.90 1.95 92.8 0.02 1.51
12 CMG-D08 1.00 and 1.80 9.23 2.02 96.2 0.02 1.88
13 CMG-D14 1.00, 2.00 and 2.50 10.00 1.99 94.8 0.50 2.76
aFor all tests: cement content (c/g)¼2.5%, basic compaction energy (Ec): 1.0 and total curing time: 9 day.bWith full-unloading of q before increasing or decreasing s0h.cWithout unloading of q before increasing or decreasing s0h.
A.
Ta
heri
eta
l./
So
ilsa
nd
Fo
un
da
tion
s5
2(
20
12
)1
26
–1
45
131

Fig. 7. Typical solid cylindrical specimen: (a) after curing for 9 day in
compaction mould and (b) instrumented under partial vacuum with
rubber membrane in triaxial cell.
Fig. 6. Typical rectangular prismatic specimen: (a) after curing for 5 day
in compaction mould and (b) instrumented under partial vacuum with
rubber membrane in triaxial cell.
Fig. 8. Schematic diagrams showing effective stress paths in (a) single-
step loading (SL) tests,( b-1) and (b-2) multiple-step loading (ML) tests
with full unloading—increasing and decreasing s0
h and (c-1) and (c-2) ML
tests with partial unloading—increasing and decreasing s0
h.
A. Taheri et al. / Soils and Foundations 52 (2012) 126–145132
and the bottom of the specimen were made smooth bypasting a thin layer of gypsum slurry and, after it hadsolidified, lubricated by smearing a thin layer of silicongrease. Thrust force, induced by non-symmetric deformationdue to shear banding in the specimen, may damage theapparatus (particularly a load cell fixed between the specimencap and the loading piston). To alleviate the above, the highpressure triaxial cell has a specimen pedestal placed on thebearing system that allows free lateral displacements in anydirection. In tests using the low pressure triaxial cell, the axialloading was stopped before noticeable unsymmetric deforma-tion had developed in the specimen.
Axial strains were sensitively and accurately measuredlocally with a pair of 160-mm-long LDTs (Goto et al.,1991) set on opposite lateral faces of the rectangularprismatic specimen (Fig. 6(b)) or at opposite ends of thediameter of the solid cylindrical specimen (Fig. 7(b)). Lateralstrain levels of the rectangular prismatic specimen werealso measured locally with two sets of three lateral LDTs(six in total) arranged on the opposite lateral faces of thespecimen. Lateral strains of the solid cylindrical specimenwere measured locally by three clip gauges arranged atthree heights (5/6, 3/6 and 1/6 of the specimen height fromthe specimen bottom) (Fig. 7(b)). The local lateral strainof the solid cylindrical specimen, measured as above, isfree from bedding errors at the specimen lateral face ifthe effective lateral confining pressure is kept constant.Axial and lateral strain levels obtained by averaging thereadings of the respective sets of local gauges are presented inthis paper.
Loading methods: the specimen was isotropically consoli-dated at s0h ¼ 20kPa by means of partial vacuum,
and LDTs and other instruments were set; this took about2 h. Then, the following three series of CD TC testswere performed. The absolute value of the axial strain rateduring the TC loading, unloading and reloading (includingten-minute unload/reload cycles) was equal to 0.03%/min inall the tests. Since the specimens were unsaturated as they werewhen they were compacted, it is very likely that the specimenswere essentially under drained conditions at this relatively lowstrain rate:
(1)
Series 1 (SL TC tests at different levels of constanteffective confining pressure, s0h ; Fig. 8(a)): the specimenwas isotropically consolidated at s0h ¼ 0:02 or 0.50 or 1.00or 1.50 MPa and cured for two hours before the start ofthe continuously drained TC loading toward ultimatefailure to determine the original stress–strain propertiesat constant s0h that are free from any effects of previousTC loading history at the same s0h or other s0hs. Toevaluate the quasi-elastic properties, ten-minute unload/reload cycles were applied at several intermediate stagesduring otherwise continuous TC loading.
(2)
Series 2: the following different ML tests were per-formed to specifically evaluate the possible effects offactors (a), (b) and (c), explained before, on the stress–strain behaviour at respective steps in the ML tests: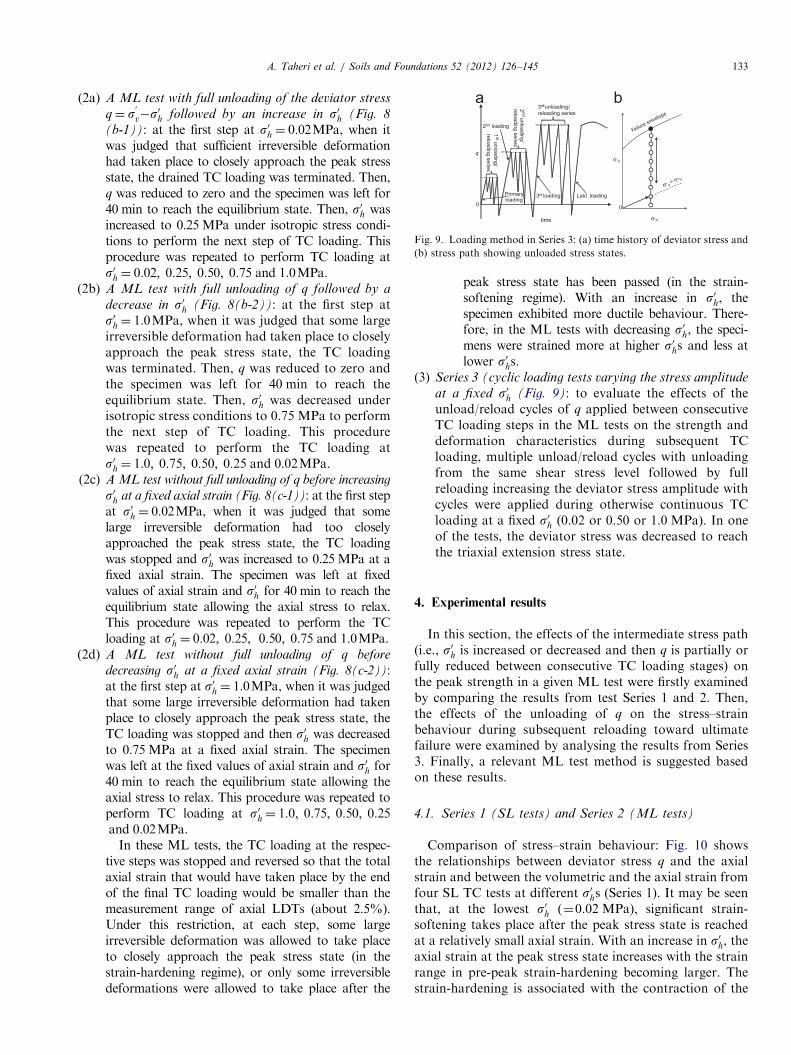
(3)
Fig. 9. Loading method in Series 3: (a) time history of deviator stress and
(b) stress path showing unloaded stress states.
A. Taheri et al. / Soils and Foundations 52 (2012) 126–145 133
(2a) A ML test with full unloading of the deviator stress
q¼ s0
v�s0h followed by an increase in s0h (Fig. 8
(b-1)): at the first step at s0h ¼ 0:02MPa, when itwas judged that sufficient irreversible deformationhad taken place to closely approach the peak stressstate, the drained TC loading was terminated. Then,q was reduced to zero and the specimen was left for40 min to reach the equilibrium state. Then, s0h wasincreased to 0.25 MPa under isotropic stress condi-tions to perform the next step of TC loading. Thisprocedure was repeated to perform TC loading ats0h ¼ 0:02; 0:25; 0:50; 0:75 and 1:0MPa.
(2b) A ML test with full unloading of q followed by a
decrease in s0h (Fig. 8(b-2)): at the first step ats0h ¼ 1:0MPa, when it was judged that some largeirreversible deformation had taken place to closelyapproach the peak stress state, the TC loadingwas terminated. Then, q was reduced to zero andthe specimen was left for 40 min to reach theequilibrium state. Then, s0h was decreased underisotropic stress conditions to 0.75 MPa to performthe next step of TC loading. This procedurewas repeated to perform the TC loading ats0h ¼ 1:0; 0:75; 0:50; 0:25 and 0:02MPa.
(2c) A ML test without full unloading of q before increasing
s0h at a fixed axial strain (Fig. 8(c-1)): at the first stepat s0h ¼ 0:02MPa, when it was judged that somelarge irreversible deformation had too closelyapproached the peak stress state, the TC loadingwas stopped and s0h was increased to 0.25 MPa at afixed axial strain. The specimen was left at fixedvalues of axial strain and s0h for 40 min to reach theequilibrium state allowing the axial stress to relax.This procedure was repeated to perform the TCloading at s0h ¼ 0:02; 0:25; 0:50; 0:75 and 1:0MPa.
(2d) A ML test without full unloading of q before
decreasing s0h at a fixed axial strain (Fig. 8(c-2)):at the first step at s0h ¼ 1:0MPa, when it was judgedthat some large irreversible deformation had takenplace to closely approach the peak stress state, theTC loading was stopped and then s0h was decreasedto 0.75 MPa at a fixed axial strain. The specimenwas left at the fixed values of axial strain and s0h for40 min to reach the equilibrium state allowing theaxial stress to relax. This procedure was repeated toperform TC loading at s0h ¼ 1:0; 0:75; 0:50; 0:25and 0:02MPa.In these ML tests, the TC loading at the respec-
tive steps was stopped and reversed so that the totalaxial strain that would have taken place by the endof the final TC loading would be smaller than themeasurement range of axial LDTs (about 2.5%).Under this restriction, at each step, some largeirreversible deformation was allowed to take placeto closely approach the peak stress state (in thestrain-hardening regime), or only some irreversibledeformations were allowed to take place after the
peak stress state has been passed (in the strain-softening regime). With an increase in s0h, thespecimen exhibited more ductile behaviour. There-fore, in the ML tests with decreasing s0h, the speci-mens were strained more at higher s0hs and less atlower s0 s.
hSeries 3 (cyclic loading tests varying the stress amplitude
at a fixed s0h (Fig. 9): to evaluate the effects of theunload/reload cycles of q applied between consecutiveTC loading steps in the ML tests on the strength anddeformation characteristics during subsequent TCloading, multiple unload/reload cycles with unloadingfrom the same shear stress level followed by fullreloading increasing the deviator stress amplitude withcycles were applied during otherwise continuous TCloading at a fixed s0h (0.02 or 0.50 or 1.0 MPa). In oneof the tests, the deviator stress was decreased to reachthe triaxial extension stress state.
4. Experimental results
In this section, the effects of the intermediate stress path(i.e., s0h is increased or decreased and then q is partially orfully reduced between consecutive TC loading stages) onthe peak strength in a given ML test were firstly examinedby comparing the results from test Series 1 and 2. Then,the effects of the unloading of q on the stress–strainbehaviour during subsequent reloading toward ultimatefailure were examined by analysing the results from Series3. Finally, a relevant ML test method is suggested basedon these results.
4.1. Series 1 (SL tests) and Series 2 (ML tests)
Comparison of stress–strain behaviour: Fig. 10 showsthe relationships between deviator stress q and the axialstrain and between the volumetric and the axial strain fromfour SL TC tests at different s0hs (Series 1). It may be seenthat, at the lowest s0h (¼0.02 MPa), significant strain-softening takes place after the peak stress state is reachedat a relatively small axial strain. With an increase in s0h, theaxial strain at the peak stress state increases with the strainrange in pre-peak strain-hardening becoming larger. Thestrain-hardening is associated with the contraction of the
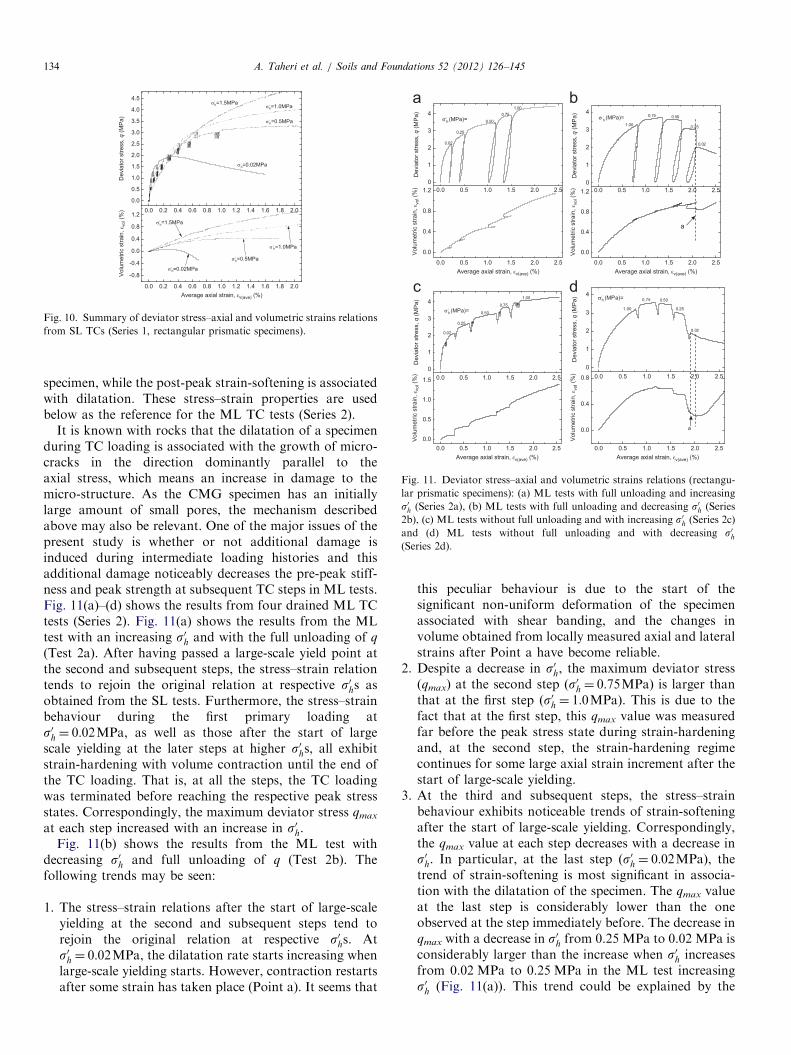
Fig. 10. Summary of deviator stress–axial and volumetric strains relations
from SL TCs (Series 1, rectangular prismatic specimens).
Fig. 11. Deviator stress–axial and volumetric strains relations (rectangu-
lar prismatic specimens): (a) ML tests with full unloading and increasing
s0h (Series 2a), (b) ML tests with full unloading and decreasing s0h (Series
2b), (c) ML tests without full unloading and with increasing s0h (Series 2c)
and (d) ML tests without full unloading and with decreasing s0h(Series 2d).
A. Taheri et al. / Soils and Foundations 52 (2012) 126–145134
specimen, while the post-peak strain-softening is associatedwith dilatation. These stress–strain properties are usedbelow as the reference for the ML TC tests (Series 2).
It is known with rocks that the dilatation of a specimenduring TC loading is associated with the growth of micro-cracks in the direction dominantly parallel to theaxial stress, which means an increase in damage to themicro-structure. As the CMG specimen has an initiallylarge amount of small pores, the mechanism describedabove may also be relevant. One of the major issues of thepresent study is whether or not additional damage isinduced during intermediate loading histories and thisadditional damage noticeably decreases the pre-peak stiff-ness and peak strength at subsequent TC steps in ML tests.Fig. 11(a)–(d) shows the results from four drained ML TCtests (Series 2). Fig. 11(a) shows the results from the MLtest with an increasing s0h and with the full unloading of q
(Test 2a). After having passed a large-scale yield point atthe second and subsequent steps, the stress–strain relationtends to rejoin the original relation at respective s0hs asobtained from the SL tests. Furthermore, the stress–strainbehaviour during the first primary loading ats0h ¼ 0:02MPa, as well as those after the start of largescale yielding at the later steps at higher s0hs, all exhibitstrain-hardening with volume contraction until the end ofthe TC loading. That is, at all the steps, the TC loadingwas terminated before reaching the respective peak stressstates. Correspondingly, the maximum deviator stress qmax
at each step increased with an increase in s0h.Fig. 11(b) shows the results from the ML test with
decreasing s0h and full unloading of q (Test 2b). Thefollowing trends may be seen:
1.
The stress–strain relations after the start of large-scaleyielding at the second and subsequent steps tend torejoin the original relation at respective s0hs. Ats0h ¼ 0:02MPa, the dilatation rate starts increasing whenlarge-scale yielding starts. However, contraction restartsafter some strain has taken place (Point a). It seems thatthis peculiar behaviour is due to the start of thesignificant non-uniform deformation of the specimenassociated with shear banding, and the changes involume obtained from locally measured axial and lateralstrains after Point a have become reliable.
2.
Despite a decrease in s0h, the maximum deviator stress(qmax) at the second step ðs0h ¼ 0:75MPaÞ is larger thanthat at the first step ðs0h ¼ 1:0MPaÞ. This is due to thefact that at the first step, this qmax value was measuredfar before the peak stress state during strain-hardeningand, at the second step, the strain-hardening regimecontinues for some large axial strain increment after thestart of large-scale yielding.3.
At the third and subsequent steps, the stress–strainbehaviour exhibits noticeable trends of strain-softeningafter the start of large-scale yielding. Correspondingly,the qmax value at each step decreases with a decrease ins0h. In particular, at the last step ðs0h ¼ 0:02MPaÞ, thetrend of strain-softening is most significant in associa-tion with the dilatation of the specimen. The qmax valueat the last step is considerably lower than the oneobserved at the step immediately before. The decrease inqmax with a decrease in s0h from 0.25 MPa to 0.02 MPa isconsiderably larger than the increase when s0h increasesfrom 0.02 MPa to 0.25 MPa in the ML test increasings0h (Fig. 11(a)). This trend could be explained by the
Fig
cre
Fig. 13. Comparison of results from ML tests with and without full
unloading: (a) increasing s0h and (b) decreasing s0h.
A. Taheri et al. / Soils and Foundations 52 (2012) 126–145 135
following two factors: (1) in the SL tests, the axial strainat the peak stress state decreases and the trend of post-peak strain softening becomes stronger with a decreasein s0h (Fig. 10); (2) in the course of the ML test, thecumulative axial strain becomes larger at later steps.Therefore, the peak stress state has been already passedat the start of the TC loading at this last step and thestress–strain behaviour after the start of large scaleyielding is already post-peak strain-softening behaviour.It will be examined later whether or not additionaldamage was induced during the unloading processesprior to the last step (in particular, during the oneimmediately before) and it could be another factor for aparticularly low qmax value at the last step.
The changes in volume during unloading, seen inFig. 11(a) and (b) are an expansion reflecting the dominanttrend of elastic expansion associated with a decrease in theeffective axial stress. On the other hand, the changes involume during reloading are contraction due to bothelastic contraction and in-elastic contraction associatedwith slight strain-hardening yielding. Sharp changes in thetangential slope of the volumetric strain–axial strainrelation cannot be seen at the start of large-scale yielding,unlike the deviator stress–axial strain relation. Therefore,it is difficult to find the start of the large-scale yieldingfrom these volumetric strain–axial strain relations.
Fig. 11(c) shows the results from the ML test withoutthe full unloading of q while increasing s0h fixing the axialstrain (Test 2c). Fig. 12(a) shows the stress path (i.e., thes0
v–s0h relation) measured in this test. In the process ofincreasing s0h, the axial loading device was locked. Despitethe above, the axial strain of the specimen slightlyincreased, due likely to the following two mechanisms:(a) compression of the specimen by an increase in theconfining pressure was not perfectly restrained as theloading system was not perfectly rigid; (b) by its viscousproperties, some axial creep deformation of the specimentook place associated with a release of elastic strain energystored in the loading frame. Fig. 11(d) shows the resultsfrom the ML test without full unloading of q whiledecreasing s0h fixing the axial strain (Test 2d). Fig. 12(b)shows the stress path measured in this test. Despite the factthat the axial loading device was locked, the axial strain ofthe specimen slightly increased in the process of decreasing
. 12. Measured stress paths of (a) ML test with partial unloading—in-
asing s0h and (b) ML test with partial unloading—decreasing s0h.
s, due likely to a) shear yielding enhanced by a decrease ins0h that was not perfectly restrained by the loading systemand b) axial creep deformation as explained above.Fig. 13(a) and (b) compares the q–ev relations from ML
tests with full and partial unloading of q. The stress–strainbehaviour after the start of the large-scale yielding atrespective steps in the two ML tests with partial unloadingof q (Fig. 11(c) and (d)) is very similar to the one in thecorresponding ML tests with full unloading (Fig. 11(a) and(b)). This fact indicates that, in the ML tests with the fullunloading of q, even if some additional damage takesplace during the unloading and reloading of q betweenconsecutive steps, its effect on the stress–strain behaviourafter large-scale yielding (including the peak strength) isnegligible, if any. Yet, it may be seen from Fig. 13 that alarge-scale yield point, where the tangent stiffness changesabruptly, along the reloading stress–strain relation, can bemuch clearly determined in ML tests with the partialunloading of q. This fact indicates that some additionaldamage takes place in association with the development ofa small increment in negative irreversible shear strainduring the full-unloading of q. It seems that this event iscaused by the release of elastic strain energy that has beenstored inside the specimen during TC loading, but theeffects of this additional damage are fully recovered aftersmall large-yielding has taken place. These points areexamined in detail below.Fig. 14(a)–(e) compares the q–ev curves during primary
loading or reloading at s0h ¼ 0:02; 0:25; 0:50; 0:75 and1:0MPa from the ML tests increasing and decreasing s0hwith full unloading of q at intermediate stages (Series 2aand 2c). In this plot, the axial strain at the start of the TCloading at each step was redefined as zero. The results fromthe SL tests at s0h ¼ 0:02; 0:50 and 1:0MPa are alsoplotted. Under the same primary loading condition, thestrength at s0h ¼ 0:02MPa from the SL test is slightly lowerthan that at the first step in the ML test increasing s0h(Fig. 14(a)), while the strength at s0h ¼ 1:0MPa from theSL test is nearly the same as that at the first step in the MLtest decreasing s0h (Fig. 14(e)). The former result is due verylikely to an inevitable scatter among the specimens. Yet,the trend of the stress–strain behaviour from the SL tests isa good reference for the ML tests. It may be seen fromthese figures that, at the same s0h, the stiffness until the
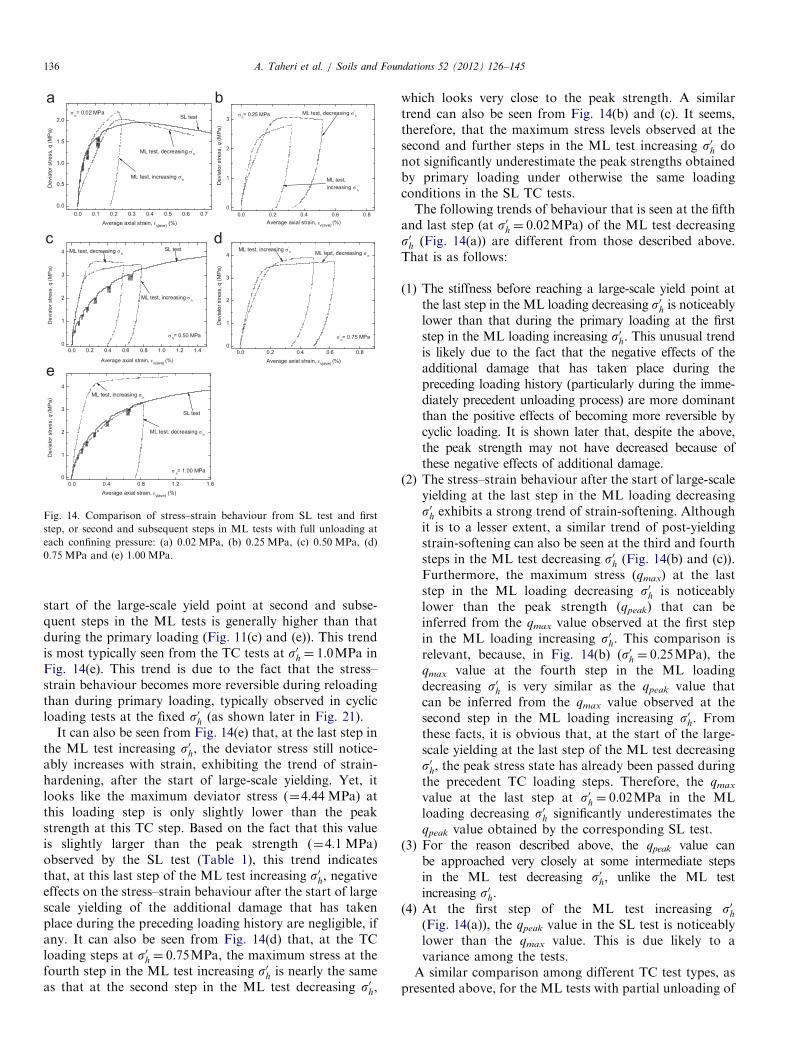
Fig. 14. Comparison of stress–strain behaviour from SL test and first
step, or second and subsequent steps in ML tests with full unloading at
each confining pressure: (a) 0.02 MPa, (b) 0.25 MPa, (c) 0.50 MPa, (d)
0.75 MPa and (e) 1.00 MPa.
A. Taheri et al. / Soils and Foundations 52 (2012) 126–145136
start of the large-scale yield point at second and subse-quent steps in the ML tests is generally higher than thatduring the primary loading (Fig. 11(c) and (e)). This trendis most typically seen from the TC tests at s0h ¼ 1:0MPa inFig. 14(e). This trend is due to the fact that the stress–strain behaviour becomes more reversible during reloadingthan during primary loading, typically observed in cyclicloading tests at the fixed s0h (as shown later in Fig. 21).
It can also be seen from Fig. 14(e) that, at the last step inthe ML test increasing s0h, the deviator stress still notice-ably increases with strain, exhibiting the trend of strain-hardening, after the start of large-scale yielding. Yet, itlooks like the maximum deviator stress (¼4.44 MPa) atthis loading step is only slightly lower than the peakstrength at this TC step. Based on the fact that this valueis slightly larger than the peak strength (¼4.1 MPa)observed by the SL test (Table 1), this trend indicatesthat, at this last step of the ML test increasing s0h, negativeeffects on the stress–strain behaviour after the start of largescale yielding of the additional damage that has takenplace during the preceding loading history are negligible, ifany. It can also be seen from Fig. 14(d) that, at the TCloading steps at s0h ¼ 0:75MPa, the maximum stress at thefourth step in the ML test increasing s0h is nearly the sameas that at the second step in the ML test decreasing s0h,
which looks very close to the peak strength. A similartrend can also be seen from Fig. 14(b) and (c). It seems,therefore, that the maximum stress levels observed at thesecond and further steps in the ML test increasing s0h donot significantly underestimate the peak strengths obtainedby primary loading under otherwise the same loadingconditions in the SL TC tests.The following trends of behaviour that is seen at the fifth
and last step (at s0h ¼ 0:02MPa) of the ML test decreasings0h (Fig. 14(a)) are different from those described above.That is as follows:
(1)
The stiffness before reaching a large-scale yield point atthe last step in the ML loading decreasing s0h is noticeablylower than that during the primary loading at the firststep in the ML loading increasing s0h. This unusual trendis likely due to the fact that the negative effects of theadditional damage that has taken place during thepreceding loading history (particularly during the imme-diately precedent unloading process) are more dominantthan the positive effects of becoming more reversible bycyclic loading. It is shown later that, despite the above,the peak strength may not have decreased because ofthese negative effects of additional damage.(2)
The stress–strain behaviour after the start of large-scaleyielding at the last step in the ML loading decreasings0h exhibits a strong trend of strain-softening. Althoughit is to a lesser extent, a similar trend of post-yieldingstrain-softening can also be seen at the third and fourthsteps in the ML test decreasing s0h (Fig. 14(b) and (c)).Furthermore, the maximum stress (qmax) at the laststep in the ML loading decreasing s0h is noticeablylower than the peak strength (qpeak) that can beinferred from the qmax value observed at the first stepin the ML loading increasing s0h. This comparison isrelevant, because, in Fig. 14(b) ðs0h ¼ 0:25MPaÞ, theqmax value at the fourth step in the ML loadingdecreasing s0h is very similar as the qpeak value thatcan be inferred from the qmax value observed at thesecond step in the ML loading increasing s0h. Fromthese facts, it is obvious that, at the start of the large-scale yielding at the last step of the ML test decreasings0h, the peak stress state has already been passed duringthe precedent TC loading steps. Therefore, the qmaxvalue at the last step at s0h ¼ 0:02MPa in the MLloading decreasing s0h significantly underestimates theqpeak value obtained by the corresponding SL test.
(3)
For the reason described above, the qpeak value canbe approached very closely at some intermediate stepsin the ML test decreasing s0h, unlike the ML testincreasing s0h.(4)
At the first step of the ML test increasing s0h(Fig. 14(a)), the qpeak value in the SL test is noticeablylower than the qmax value. This is due likely to avariance among the tests.A similar comparison among different TC test types, aspresented above, for the ML tests with partial unloading of
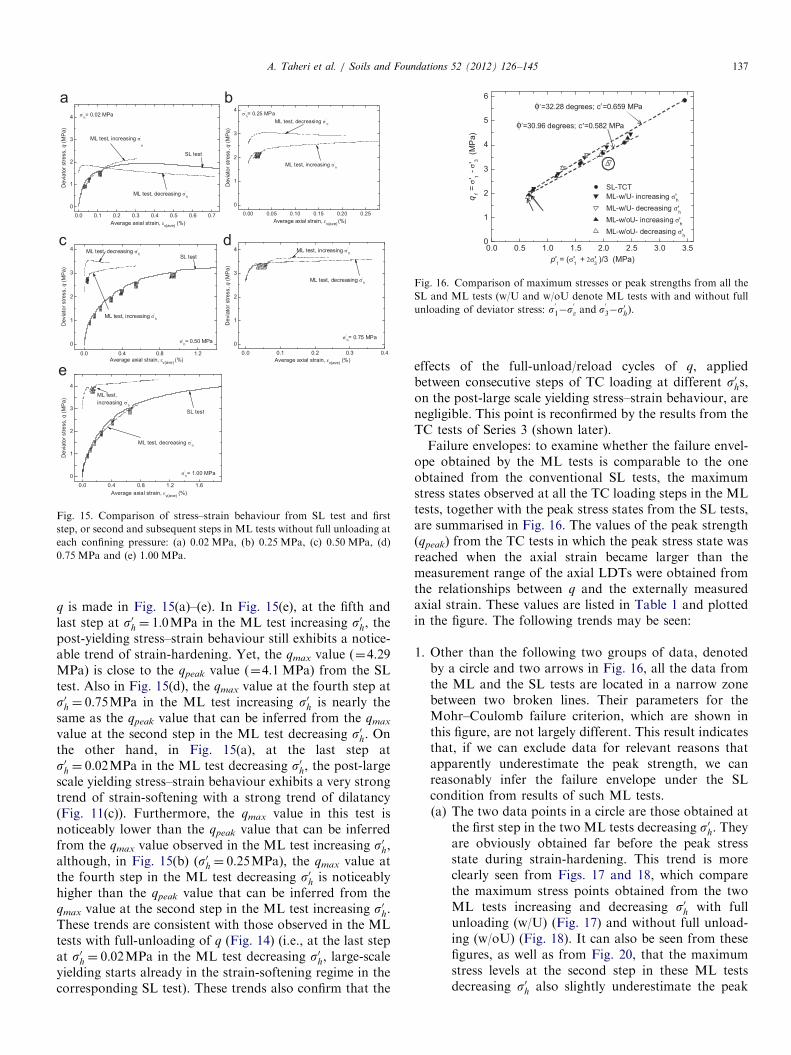
Fig. 15. Comparison of stress–strain behaviour from SL test and first
step, or second and subsequent steps in ML tests without full unloading at
each confining pressure: (a) 0.02 MPa, (b) 0.25 MPa, (c) 0.50 MPa, (d)
0.75 MPa and (e) 1.00 MPa.
Fig. 16. Comparison of maximum stresses or peak strengths from all the
SL and ML tests (w/U and w/oU denote ML tests with and without full
unloading of deviator stress: s0
1�s0
v and s0
3�s0h).
A. Taheri et al. / Soils and Foundations 52 (2012) 126–145 137
q is made in Fig. 15(a)–(e). In Fig. 15(e), at the fifth andlast step at s0h ¼ 1:0MPa in the ML test increasing s0h, thepost-yielding stress–strain behaviour still exhibits a notice-able trend of strain-hardening. Yet, the qmax value (¼4.29MPa) is close to the qpeak value (¼4.1 MPa) from the SLtest. Also in Fig. 15(d), the qmax value at the fourth step ats0h ¼ 0:75MPa in the ML test increasing s0h is nearly thesame as the qpeak value that can be inferred from the qmax
value at the second step in the ML test decreasing s0h. Onthe other hand, in Fig. 15(a), at the last step ats0h ¼ 0:02MPa in the ML test decreasing s0h, the post-largescale yielding stress–strain behaviour exhibits a very strongtrend of strain-softening with a strong trend of dilatancy(Fig. 11(c)). Furthermore, the qmax value in this test isnoticeably lower than the qpeak value that can be inferredfrom the qmax value observed in the ML test increasing s0h,although, in Fig. 15(b) ðs0h ¼ 0:25MPaÞ, the qmax value atthe fourth step in the ML test decreasing s0h is noticeablyhigher than the qpeak value that can be inferred from theqmax value at the second step in the ML test increasing s0h.These trends are consistent with those observed in the MLtests with full-unloading of q (Fig. 14) (i.e., at the last stepat s0h ¼ 0:02MPa in the ML test decreasing s0h, large-scaleyielding starts already in the strain-softening regime in thecorresponding SL test). These trends also confirm that the
effects of the full-unload/reload cycles of q, appliedbetween consecutive steps of TC loading at different s0hs,on the post-large scale yielding stress–strain behaviour, arenegligible. This point is reconfirmed by the results from theTC tests of Series 3 (shown later).Failure envelopes: to examine whether the failure envel-
ope obtained by the ML tests is comparable to the oneobtained from the conventional SL tests, the maximumstress states observed at all the TC loading steps in the MLtests, together with the peak stress states from the SL tests,are summarised in Fig. 16. The values of the peak strength(qpeak) from the TC tests in which the peak stress state wasreached when the axial strain became larger than themeasurement range of the axial LDTs were obtained fromthe relationships between q and the externally measuredaxial strain. These values are listed in Table 1 and plottedin the figure. The following trends may be seen:
1.
Other than the following two groups of data, denotedby a circle and two arrows in Fig. 16, all the data fromthe ML and the SL tests are located in a narrow zonebetween two broken lines. Their parameters for theMohr–Coulomb failure criterion, which are shown inthis figure, are not largely different. This result indicatesthat, if we can exclude data for relevant reasons thatapparently underestimate the peak strength, we canreasonably infer the failure envelope under the SLcondition from results of such ML tests.(a) The two data points in a circle are those obtained atthe first step in the two ML tests decreasing s0h. Theyare obviously obtained far before the peak stressstate during strain-hardening. This trend is moreclearly seen from Figs. 17 and 18, which comparethe maximum stress points obtained from the twoML tests increasing and decreasing s0h with fullunloading (w/U) (Fig. 17) and without full unload-ing (w/oU) (Fig. 18). It can also be seen from thesefigures, as well as from Fig. 20, that the maximumstress levels at the second step in these ML testsdecreasing s0 also slightly underestimate the peak
h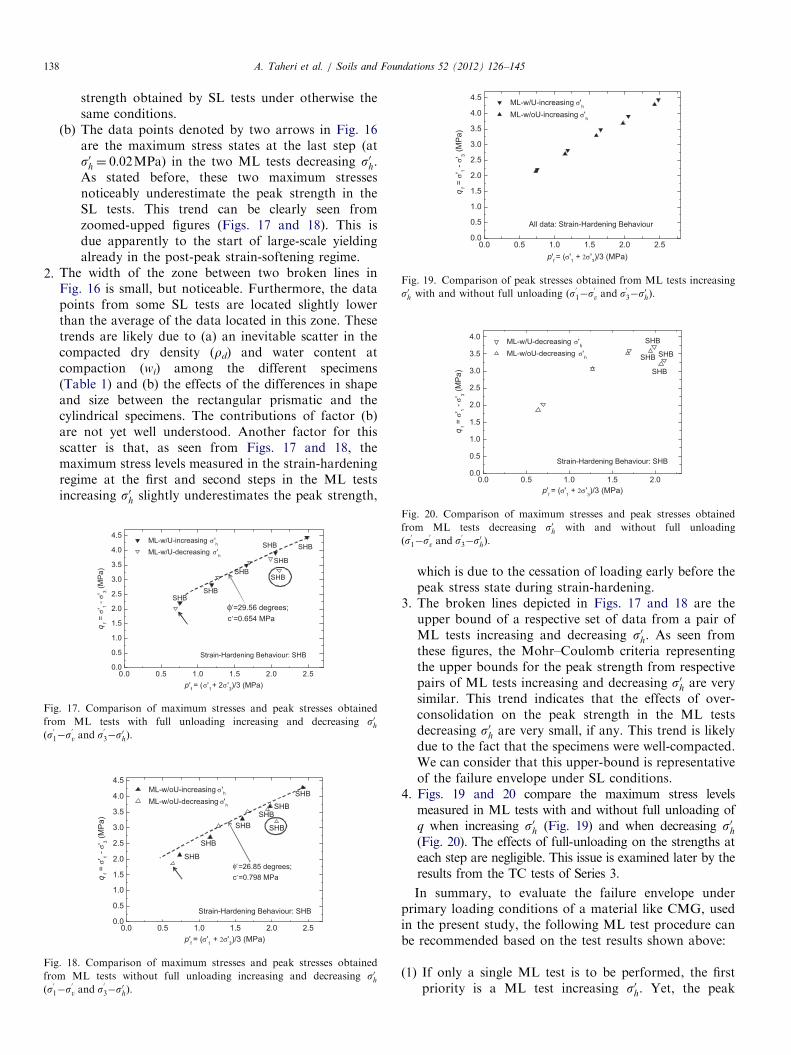
Fig
fro
ðs0
1
Fig
fro
ðs0
1
A. Taheri et al. / Soils and Foundations 52 (2012) 126–145138
strength obtained by SL tests under otherwise thesame conditions.
(b) The data points denoted by two arrows in Fig. 16are the maximum stress states at the last step (ats0h ¼ 0:02MPa) in the two ML tests decreasing s0h.As stated before, these two maximum stressesnoticeably underestimate the peak strength in theSL tests. This trend can be clearly seen fromzoomed-upped figures (Figs. 17 and 18). This isdue apparently to the start of large-scale yieldingalready in the post-peak strain-softening regime.
. 17
m M
�s0
v
. 18
m M
�s0
v
Fig. 19. Comparison of peak stresses obtained from ML tests increasing
2.s0h with and without full unloading ðs0
1�s0
v and s0
3�s0hÞ.
The width of the zone between two broken lines inFig. 16 is small, but noticeable. Furthermore, the datapoints from some SL tests are located slightly lowerthan the average of the data located in this zone. Thesetrends are likely due to (a) an inevitable scatter in thecompacted dry density (rd) and water content atcompaction (wi) among the different specimens(Table 1) and (b) the effects of the differences in shapeand size between the rectangular prismatic and thecylindrical specimens. The contributions of factor (b)are not yet well understood. Another factor for thisscatter is that, as seen from Figs. 17 and 18, themaximum stress levels measured in the strain-hardeningregime at the first and second steps in the ML testsincreasing s0h slightly underestimates the peak strength,
. Comparison of maximum stresses and peak stresses obtained
L tests with full unloading increasing and decreasing s0hand s
0
3�s0hÞ.
. Comparison of maximum stresses and peak stresses obtained
L tests without full unloading increasing and decreasing s0hand s
0
3�s0hÞ.
Fig. 20. Comparison of maximum stresses and peak stresses obtained
from ML tests decreasing s0h with and without full unloading
ðs0
1�s0
v and s0
3�s0hÞ.
which is due to the cessation of loading early before thepeak stress state during strain-hardening.
3.
The broken lines depicted in Figs. 17 and 18 are theupper bound of a respective set of data from a pair ofML tests increasing and decreasing s0h. As seen fromthese figures, the Mohr–Coulomb criteria representingthe upper bounds for the peak strength from respectivepairs of ML tests increasing and decreasing s0h are verysimilar. This trend indicates that the effects of over-consolidation on the peak strength in the ML testsdecreasing s0h are very small, if any. This trend is likelydue to the fact that the specimens were well-compacted.We can consider that this upper-bound is representativeof the failure envelope under SL conditions.4.
Figs. 19 and 20 compare the maximum stress levelsmeasured in ML tests with and without full unloading ofq when increasing s0h (Fig. 19) and when decreasing s0h(Fig. 20). The effects of full-unloading on the strengths ateach step are negligible. This issue is examined later by theresults from the TC tests of Series 3.In summary, to evaluate the failure envelope underprimary loading conditions of a material like CMG, used
in the present study, the following ML test procedure canbe recommended based on the test results shown above:(1)
If only a single ML test is to be performed, the firstpriority is a ML test increasing s0h. Yet, the peak
(2)
A. Taheri et al. / Soils and Foundations 52 (2012) 126–145 139
strength is underestimated if loading is reversed beforethe peak stress state is reached during strain-hardening.On the other hand, in a ML test decreasing s0h, thepeak strength may be underestimated to a higher extentboth at early steps for the same reason cited above andat later steps due mainly to the start of large scaleyielding in a post-peak strain-softening regime.(a) At least with CMG, used in the present study,
depending on the convenience of testing in a givencase, the deviator stress could be either fullyunloaded or partially unloaded between consecu-tive TC steps. The method in which the confiningpressure is increased while locking the axial loadingdevice is one of the simplest testing procedures inthis respect. Moreover, this method could excludethe possible negative effects of additional damagethat may take place during the full unloading of q,as explained in details in the next section.
(b) The total axial strain that can be applied to a singlespecimen in a ML test should be subjected to somelimitations. In the present study, the TC loadingwas reversed at each step so that the total axialstrain at the last (i.e., fifth) step would be within themeasurement range of axial LDTs (about 2.5%).With an increase in s0h, the specimen exhibits moreductile behaviour. Then, in a ML test increasing s0h,the TC loading at all steps can be maintainedwithin a strain-hardening regime.
Fig. 21. Deviator stress–axial and volumetric strain relations from TC
tests with several cycles of unload/reload and continuous monotonic
loading TC tests: (a) Test no. CMG-D08 (SC) and CB3-1, s0
¼0.02MPa,
If feasible, it is recommended that an additional ML testdecreasing s0h be performed using as similar a sample aspossible to that used in the ML test increasing s0h. In thisML test, it is very likely that the peak stress state isapproached very closely at the intermediate steps. Whenthe effects of data scatter can be properly evaluated, theupper envelope of a data set from a pair of ML testsincreasing and decreasing s0h (as shown in Figs. 17 and18) may be obtained, which should be more representa-tive of the true failure envelope than the one obtained bya single ML test increasing s0h.
h
(b) Test CMG-D07 (SC) and CB3-1, s0
h¼0.02 MPa, (c) Test CMG-D01
and CB3-6, s0
h¼0.5 MPa, (d) Test CMG-D02 and CB3-8, s0
h¼1.0 MPa
and (e) Test CMG-D14 (SC) and CB3-6, s0
h¼0.50 MPa (SC: solid
cylindrical specimens).
4.2. Effects of unload/reload cycles with large stressamplitudes (Series 3)
It is examined in this section whether the effects of cyclicloading with a relatively large stress amplitude, as applied inthe ML tests with full-unloading of q, on the stress–strainbehaviour (including the peak strength) at subsequent load-ing steps are significant or not. Fig. 21 shows the wholestress–strain relations from the TC tests at different fixed s0hsin which deviator stress q was decreased from different fixeddeviator stress levels, followed by full reloading with increas-ing the deviator stress amplitude with cycles (Series 3, Fig. 9).These relations are compared with those from a SL test at thesame s0h. After the start of large-scale yielding during the lastreloading toward ultimate failure, the stress–strain behaviourtends to rejoin the one obtained by continuous primary ML
performed under otherwise the same conditions. In Fig. 22,the peak strengths from these TC tests (hollow circles) havebeen added to those presented in Fig. 16. It may be seen that,despite some scatter in the data, the peak strength does notdecrease by applying several unload/reload cycles withrelatively large stress amplitudes. These results reconfirmthat, in the ML tests, effects on the stress–strain behaviourwhen exhibiting large-scale yielding and the peak strength ofadditional damage that takes place during intermediateloading histories, other than the one that takes place duringprimary loading in the SL tests, are negligible, if any.Fig. 23 illustrates the proportional rule that is often
employed to describe the hysteretic stress–strain (y – x)
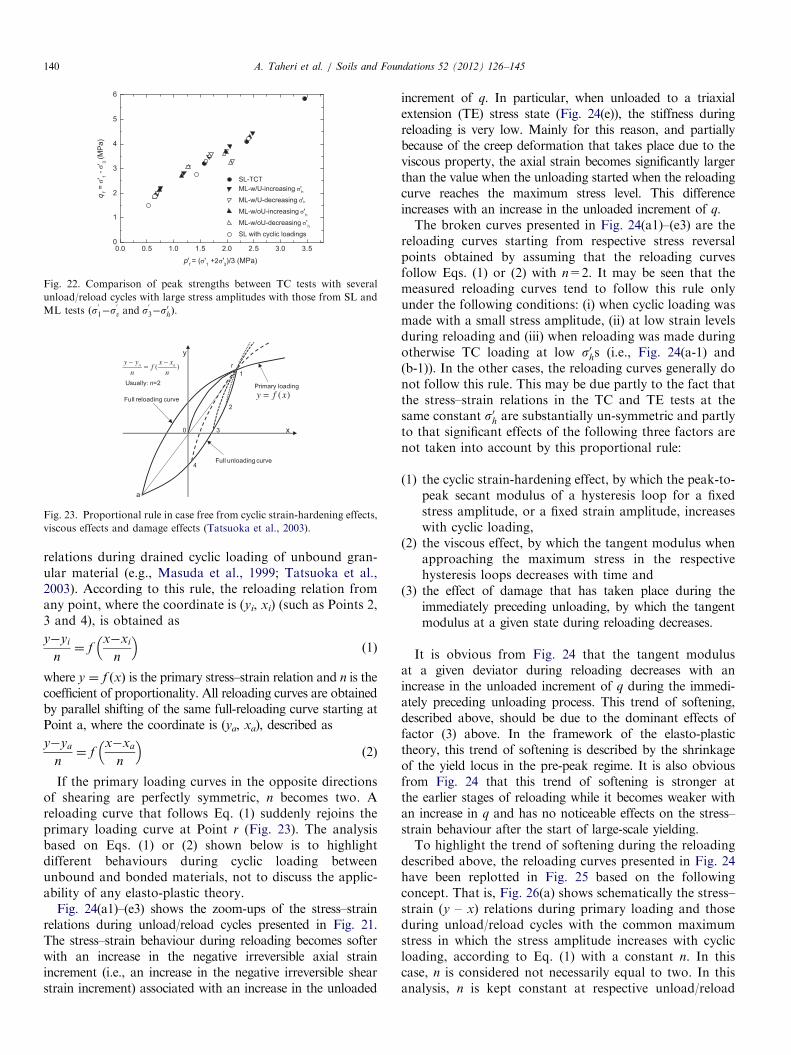
Fig. 22. Comparison of peak strengths between TC tests with several
unload/reload cycles with large stress amplitudes with those from SL and
ML tests ðs0
1�s0
v and s0
3�s0hÞ.
Fig. 23. Proportional rule in case free from cyclic strain-hardening effects,
viscous effects and damage effects (Tatsuoka et al., 2003).
A. Taheri et al. / Soils and Foundations 52 (2012) 126–145140
relations during drained cyclic loading of unbound gran-ular material (e.g., Masuda et al., 1999; Tatsuoka et al.,2003). According to this rule, the reloading relation fromany point, where the coordinate is (yi, xi) (such as Points 2,3 and 4), is obtained as
y�yi
n¼ f
x�xi
n
� �ð1Þ
where y ¼ f ðxÞ is the primary stress–strain relation and n is thecoefficient of proportionality. All reloading curves are obtainedby parallel shifting of the same full-reloading curve starting atPoint a, where the coordinate is (ya, xa), described as
y�ya
n¼ f
x�xa
n
� �ð2Þ
If the primary loading curves in the opposite directionsof shearing are perfectly symmetric, n becomes two. Areloading curve that follows Eq. (1) suddenly rejoins theprimary loading curve at Point r (Fig. 23). The analysisbased on Eqs. (1) or (2) shown below is to highlightdifferent behaviours during cyclic loading betweenunbound and bonded materials, not to discuss the applic-ability of any elasto-plastic theory.
Fig. 24(a1)–(e3) shows the zoom-ups of the stress–strainrelations during unload/reload cycles presented in Fig. 21.The stress–strain behaviour during reloading becomes softerwith an increase in the negative irreversible axial strainincrement (i.e., an increase in the negative irreversible shearstrain increment) associated with an increase in the unloaded
increment of q. In particular, when unloaded to a triaxialextension (TE) stress state (Fig. 24(e)), the stiffness duringreloading is very low. Mainly for this reason, and partiallybecause of the creep deformation that takes place due to theviscous property, the axial strain becomes significantly largerthan the value when the unloading started when the reloadingcurve reaches the maximum stress level. This differenceincreases with an increase in the unloaded increment of q.The broken curves presented in Fig. 24(a1)–(e3) are the
reloading curves starting from respective stress reversalpoints obtained by assuming that the reloading curvesfollow Eqs. (1) or (2) with n=2. It may be seen that themeasured reloading curves tend to follow this rule onlyunder the following conditions: (i) when cyclic loading wasmade with a small stress amplitude, (ii) at low strain levelsduring reloading and (iii) when reloading was made duringotherwise TC loading at low s0hs (i.e., Fig. 24(a-1) and(b-1)). In the other cases, the reloading curves generally donot follow this rule. This may be due partly to the fact thatthe stress–strain relations in the TC and TE tests at thesame constant s0h are substantially un-symmetric and partlyto that significant effects of the following three factors arenot taken into account by this proportional rule:
(1)
the cyclic strain-hardening effect, by which the peak-to-peak secant modulus of a hysteresis loop for a fixedstress amplitude, or a fixed strain amplitude, increaseswith cyclic loading,(2)
the viscous effect, by which the tangent modulus whenapproaching the maximum stress in the respectivehysteresis loops decreases with time and(3)
the effect of damage that has taken place during theimmediately preceding unloading, by which the tangentmodulus at a given state during reloading decreases.It is obvious from Fig. 24 that the tangent modulusat a given deviator during reloading decreases with anincrease in the unloaded increment of q during the immedi-ately preceding unloading process. This trend of softening,described above, should be due to the dominant effects offactor (3) above. In the framework of the elasto-plastictheory, this trend of softening is described by the shrinkageof the yield locus in the pre-peak regime. It is also obviousfrom Fig. 24 that this trend of softening is stronger atthe earlier stages of reloading while it becomes weaker withan increase in q and has no noticeable effects on the stress–strain behaviour after the start of large-scale yielding.To highlight the trend of softening during the reloading
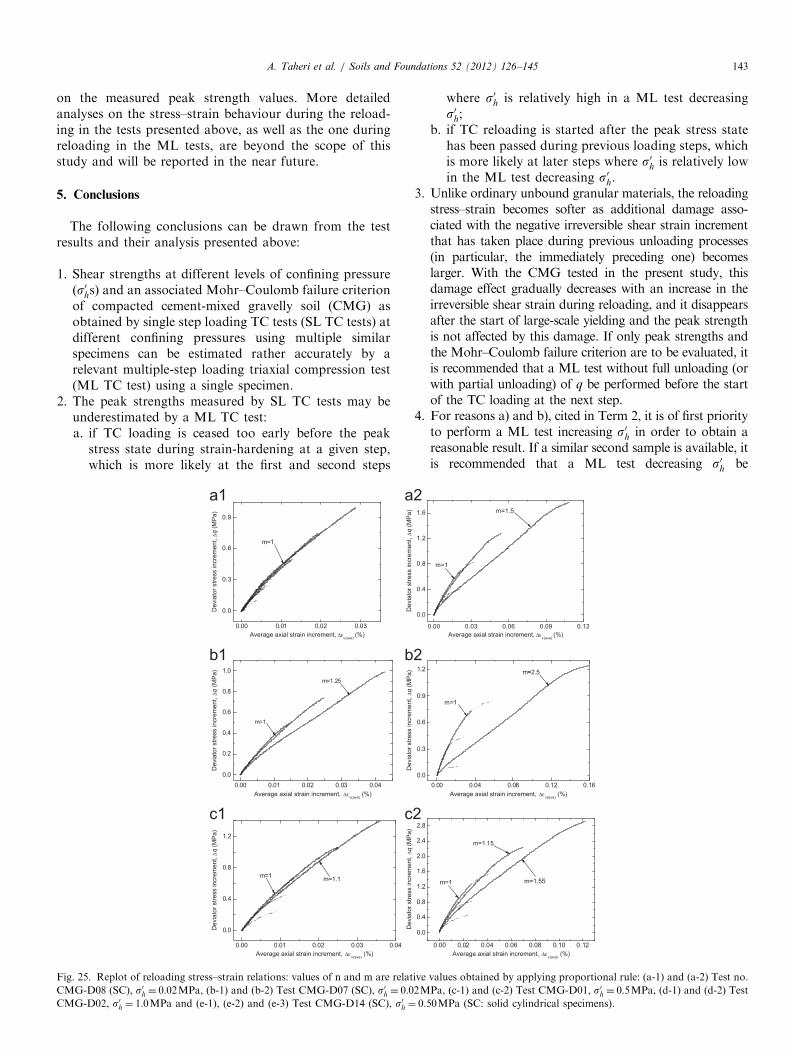
described above, the reloading curves presented in Fig. 24have been replotted in Fig. 25 based on the followingconcept. That is, Fig. 26(a) shows schematically the stress–strain (y – x) relations during primary loading and thoseduring unload/reload cycles with the common maximumstress in which the stress amplitude increases with cyclicloading, according to Eq. (1) with a constant n. In thiscase, n is considered not necessarily equal to two. In thisanalysis, n is kept constant at respective unload/reload

A. Taheri et al. / Soils and Foundations 52 (2012) 126–145 141
cycles. It is to be noted that the effects of the three factors,(1)–(3), are not involved in the relations presented inFig. 26(a). When the reloading curves presented inFig. 26(a) are shifted to start from the common origin,Eq. (1) is changed to Eq. (3) and the relations presented inFig. 26(a) are replotted, as shown in Fig. 26(b):
Dy
n¼ f
Dx
n
� �ð3Þ
Eq. (3) can be refined as
Dy¼ f nðDxÞ ð4Þ
The actual reloading relations shifted to start from thecommon origin presented in Fig. 25 are generally not likethose plotted in Fig. 26(b), but they are like those plottedin Fig. 26(c). Representing the first reloading curve byEq. (4), it is assumed that the second and subsequentreloading curves can be represented by
Dy¼ f n Dx
m
� �ð5Þ
Fig. 24. Zoom-ups of stress–strain relations during several unload/reload cycle
when following proportional rule): (a-1) and (a-2) Test no. CMG-D08 (SC), s0h(c-2) Test CMG-D01, s0h ¼ 0:05MPa, (d-1) and (d-2) Test CMG-D02, s0h ¼ 1:0solid cylindrical specimens).
where m may increase from 1.0 with cyclic loading. Thevalues of m shown in Fig. 25 are those obtained by fittingEq. (5) to respective reloading relations. That is, eachobtained m value is the ratio of axial strain between a givenreloading curve and the first reloading curve at a fixed Dq
value (i.e., 50 kPa). Then, the trend of softening duringreloading with cyclic loading can be represented by anincrease in m from 1.0 with cyclic loading. It seems that theeffect of factor (1) ‘‘cyclic strain-hardening effect’’ is notsignificant when compared with that of factor (3) ‘‘addi-tional damage effect’’. In this analysis, it was taken intoaccount that the effect of creep deformation (i.e., factor 2)becomes more significant when approaching the maximumstress point from which unloading has started and thistrend becomes stronger as the maximum stress becomescloser to the peak stress observed by continuous mono-tonic loading. The segments of the stress–strain curvewhere the tangent stiffness becomes noticeably low dueto creep deformation are depicted by dotted curves inFig. 25 and ignored in the discussion below.
s by increasing stress amplitude (broken curves denote reloading relations
¼ 0:02MPa, (b-1) and (b-2) Test CMG-D07 (SC), s0h ¼ 0:02MPa, (c-1) and
MPa and (e-1), (e-2), and (e-3) Test CMG-D14 (SC), s0h ¼ 0:50MPa (SC:
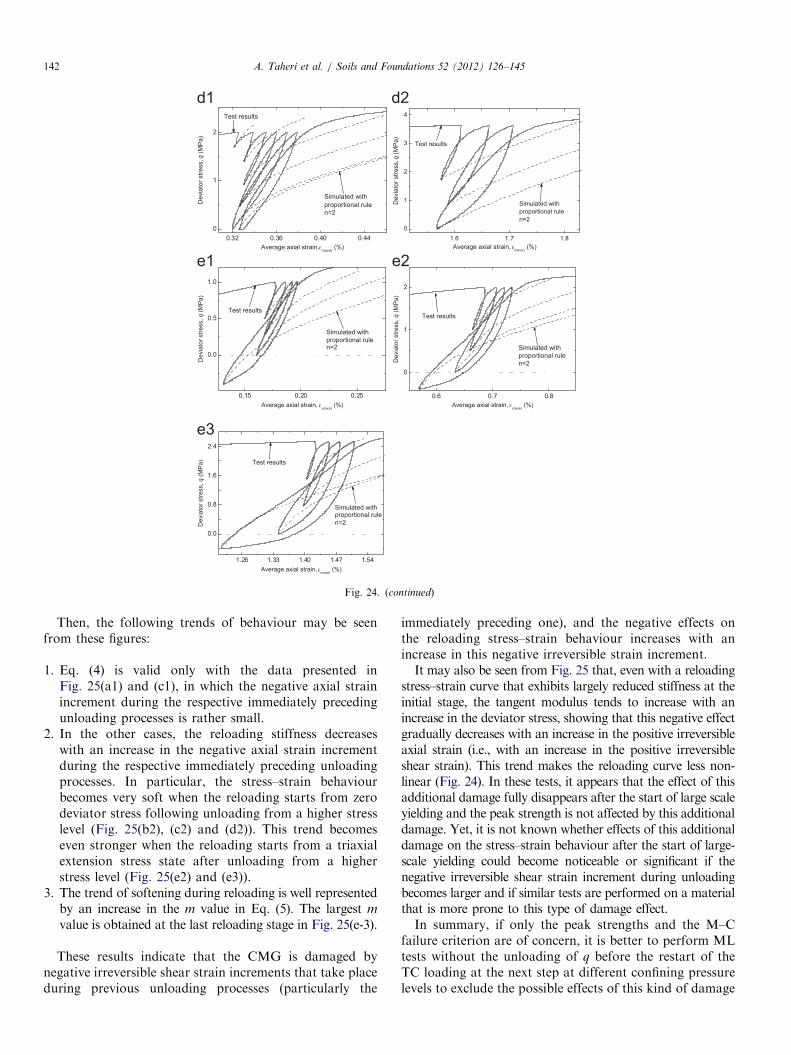
Fig. 24. (continued)
A. Taheri et al. / Soils and Foundations 52 (2012) 126–145142
Then, the following trends of behaviour may be seenfrom these figures:
1.
Eq. (4) is valid only with the data presented inFig. 25(a1) and (c1), in which the negative axial strainincrement during the respective immediately precedingunloading processes is rather small.2.
In the other cases, the reloading stiffness decreaseswith an increase in the negative axial strain incrementduring the respective immediately preceding unloadingprocesses. In particular, the stress–strain behaviourbecomes very soft when the reloading starts from zerodeviator stress following unloading from a higher stresslevel (Fig. 25(b2), (c2) and (d2)). This trend becomeseven stronger when the reloading starts from a triaxialextension stress state after unloading from a higherstress level (Fig. 25(e2) and (e3)).3.
The trend of softening during reloading is well representedby an increase in the m value in Eq. (5). The largest mvalue is obtained at the last reloading stage in Fig. 25(e-3).
These results indicate that the CMG is damaged bynegative irreversible shear strain increments that take placeduring previous unloading processes (particularly the
immediately preceding one), and the negative effects onthe reloading stress–strain behaviour increases with anincrease in this negative irreversible strain increment.It may also be seen from Fig. 25 that, even with a reloading
stress–strain curve that exhibits largely reduced stiffness at theinitial stage, the tangent modulus tends to increase with anincrease in the deviator stress, showing that this negative effectgradually decreases with an increase in the positive irreversibleaxial strain (i.e., with an increase in the positive irreversibleshear strain). This trend makes the reloading curve less non-linear (Fig. 24). In these tests, it appears that the effect of thisadditional damage fully disappears after the start of large scaleyielding and the peak strength is not affected by this additionaldamage. Yet, it is not known whether effects of this additionaldamage on the stress–strain behaviour after the start of large-scale yielding could become noticeable or significant if thenegative irreversible shear strain increment during unloadingbecomes larger and if similar tests are performed on a materialthat is more prone to this type of damage effect.In summary, if only the peak strengths and the M–C
failure criterion are of concern, it is better to perform MLtests without the unloading of q before the restart of theTC loading at the next step at different confining pressurelevels to exclude the possible effects of this kind of damage
3.
A. Taheri et al. / Soils and Foundations 52 (2012) 126–145 143
on the measured peak strength values. More detailedanalyses on the stress–strain behaviour during the reload-ing in the tests presented above, as well as the one duringreloading in the ML tests, are beyond the scope of thisstudy and will be reported in the near future.
5. Conclusions
The following conclusions can be drawn from the testresults and their analysis presented above:
1.
Fig
CM
CM
Shear strengths at different levels of confining pressureðs0hsÞ and an associated Mohr–Coulomb failure criterionof compacted cement-mixed gravelly soil (CMG) asobtained by single step loading TC tests (SL TC tests) atdifferent confining pressures using multiple similarspecimens can be estimated rather accurately by arelevant multiple-step loading triaxial compression test(ML TC test) using a single specimen.
2.
The peak strengths measured by SL TC tests may beunderestimated by a ML TC test:a. if TC loading is ceased too early before the peakstress state during strain-hardening at a given step,which is more likely at the first and second steps
. 25
G-
G-
. Replot of reloading stress–strain relations: values of n and m are relative
D08 (SC), s0h ¼ 0:02MPa, (b-1) and (b-2) Test CMG-D07 (SC), s0h ¼ 0:02MD02, s0h ¼ 1:0MPa and (e-1), (e-2) and (e-3) Test CMG-D14 (SC), s0h ¼ 0:5
where s0h is relatively high in a ML test decreasings0h;
b. if TC reloading is started after the peak stress statehas been passed during previous loading steps, whichis more likely at later steps where s0h is relatively lowin the ML test decreasing s0h.
valu
Pa,
0M
Unlike ordinary unbound granular materials, the reloadingstress–strain becomes softer as additional damage asso-ciated with the negative irreversible shear strain incrementthat has taken place during previous unloading processes(in particular, the immediately preceding one) becomeslarger. With the CMG tested in the present study, thisdamage effect gradually decreases with an increase in theirreversible shear strain during reloading, and it disappearsafter the start of large-scale yielding and the peak strengthis not affected by this damage. If only peak strengths andthe Mohr–Coulomb failure criterion are to be evaluated, itis recommended that a ML test without full unloading (orwith partial unloading) of q be performed before the startof the TC loading at the next step.
4.
For reasons a) and b), cited in Term 2, it is of first priorityto perform a ML test increasing s0h in order to obtain areasonable result. If a similar second sample is available, itis recommended that a ML test decreasing s0h bees obtained by applying proportional rule: (a-1) and (a-2) Test no.
(c-1) and (c-2) Test CMG-D01, s0h ¼ 0:5MPa, (d-1) and (d-2) Test
Pa (SC: solid cylindrical specimens).
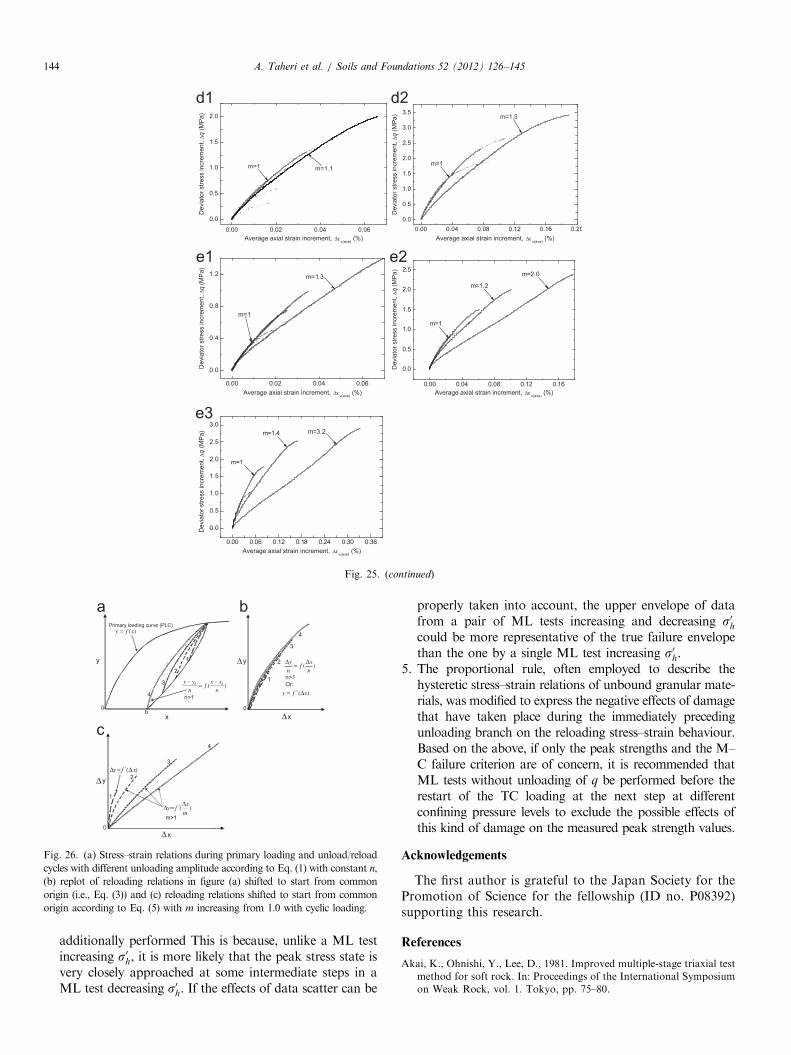
Fig. 25. (continued)
Fig. 26. (a) Stress–strain relations during primary loading and unload/reload
cycles with different unloading amplitude according to Eq. (1) with constant n,
(b) replot of reloading relations in figure (a) shifted to start from common
origin (i.e., Eq. (3)) and (c) reloading relations shifted to start from common
origin according to Eq. (5) with m increasing from 1.0 with cyclic loading.
A. Taheri et al. / Soils and Foundations 52 (2012) 126–145144
additionally performed This is because, unlike a ML testincreasing s0h, it is more likely that the peak stress state isvery closely approached at some intermediate steps in aML test decreasing s0h. If the effects of data scatter can be
properly taken into account, the upper envelope of datafrom a pair of ML tests increasing and decreasing s0hcould be more representative of the true failure envelopethan the one by a single ML test increasing s0h.
5.
The proportional rule, often employed to describe thehysteretic stress–strain relations of unbound granular mate-rials, was modified to express the negative effects of damagethat have taken place during the immediately precedingunloading branch on the reloading stress–strain behaviour.Based on the above, if only the peak strengths and the M–C failure criterion are of concern, it is recommended thatML tests without unloading of q be performed before therestart of the TC loading at the next step at differentconfining pressure levels to exclude the possible effects ofthis kind of damage on the measured peak strength values.Acknowledgements
The first author is grateful to the Japan Society for thePromotion of Science for the fellowship (ID no. P08392)supporting this research.
References
Akai, K., Ohnishi, Y., Lee, D., 1981. Improved multiple-stage triaxial testmethod for soft rock. In: Proceedings of the International Symposiumon Weak Rock, vol. 1. Tokyo, pp. 75–80.
A. Taheri et al. / Soils and Foundations 52 (2012) 126–145 145
Anderson, W.F., 1974. The use of multi-stage triaxial tests to find theundrained strength parameters of stony boulder clay. In: Proceedingsof Institute of Civil Engineering, Pt. 2, vol. 57. Thomas Telford Ltd.,London, pp. 367–373.
Aoki, H., Yonezawa, T., Watanabe, O., Tateyama, M., Tatsuoka, F.,2003. Results from field full-scale loading tests on a bridge abutmentwith backfill of geogrid-reinforced cement-mixed gravel. GeosyntheticsEngineering Journal, Japanese Chapter of International GeosyntheticsSociety 18, 237–248 (in Japanese).
Cain, P. Yuen, C. Lebel, G. Crawford, A. Lau, D., 1986. Triaxial Testing ofBrittle Sandstone Using a Multiple Failure State Method. Energy, Minesand Resources, Canada—CANMET. Division Report ERP/CRL 86-104(IR). Energy Research Program. Coal Research Laboratories.
Crawford, A., Wylie, D., 1987. A modified multiple failure state triaxialtesting method. In: Proceedings of 28th US Symposium on RockMechanics. pp. 133–140.
De Beer, E.E., 1950. The cell test. Geotechnique 2 (2), 162–172.Ezaoui, A., Tatsuoka, F., Sano, Y., Iguchi, Y., Maeda, Y., Sasaki, Y.,
Duttine, A., 2010. Ageing effects on the yielding characteristics ofcement-mixed granular materials. Soils and Foundations 50 (5), 705–724.
Goodman, R.E., 1976. Methods of Geological Engineering in Discontin-uous Rocks. West Publishing Company, pp. 158–180.
Goto, S., Tatsuoka, F., Shibuya, S., Kim, Y.S., Soto, T., 1991. A simplegauge for local small strain measurements in the laboratory. Soils andFoundations 31 (1), 169–180.
Hansen, K.D., Reinhardt, W.G., 1990. Roller-Compacted ConcreteDams. McGraw-Hill, Inc..
Hayano, K., Sato, T., Tatsuoka, F., 1997. Deformation characteristics ofa sedimentary soft rock from triaxial compression tests rectangularprism specimens. Geotechnique 47 (3), 439–449.
Kenney, T.C., Watson, G.H., 1961. Multiple-stage triaxial tests fordetermination c0 and a0 of saturated soils. In: Proceedings of FifthInternational Conference on Soil Mechanics and Foundation Engi-neering, vol. 1, pp. 191–195.
Kim, M.M., Ko, H.Y., 1979. Multistage triaxial testing of rocks.Geotechnical Testing Journal 2, 98–105.
Kovari, K., Tisa, A., 1975. Multiple failure state and strain controlledtriaxial tests. Rock Mechanics 7, 17–33.
Kovari, K., Tisa, A., Einstein, H.H., Franklin, J.A., 1983. Suggestedmethods for determining the strength of rock material in triaxialcompression: revised version. International Journal of RockMechanics and Mining Sciences 20 (6), 283–290.
Kongsukprasert, L., Tatsuoka, F., Tateyama, M., 2005. Several factorsaffecting the strength and deformation characteristics cement-mixedgravel. Soils and Foundations 45 (3), 107–124.
Kongsukprasert, L., Tatsuoka, F., 2003. Viscous effects coupled withaging effects on the stress–strain behavior of cement-mixed gravel. In:Dia Benedetto et al. (Eds.), Proceedings of Third InternationalConference on Pre-Failure Deformation Characteristics of Geomater-ials, vol. 1. Lyon, Balkema, pp. 569–577.
Kongsukprasert, L., Tatsuoka, F., 2005. Ageing and viscous effectson the deformation and strength characteristics on cemented-mixedgravelly soil in triaxial compression. Soils and Foundations 45 (6), 55–74.
Kongsukprasert, L., Tatsuoka, F., 2007. Small strain stiffness and non-linear stress–strain behavior of cemented-mixed gravelly soil. Soils andFoundations 47 (2), 375–394.
Kongsukprasert, L., Tatsuoka, F., Takahashi, H., 2007. Effects of curingperiod and stress conditions on the strength and deformation character-istics of cement-mixed soil. Soils and Foundations 47 (3), 577–596.
Lohani, T.N., Kongsukprasert, L., Watanabe, K., Tatsuoka, F., 2004.Strength and deformation properties of cemented-mixed gravel evaluatedby triaxial compression tests. Soils and Foundations 44 (5), 95–108.
Masuda, T., Tatsuoka, F., Yamada, S., Sato, T., 1999. Stress–strainbehaviour of sand in plane strain compression, extension and cyclicloading tests. Soils and Foundations 39 (5), 31–45.
Pagoulatos, A., 2004. Evaluation of Multistage Triaxial Testing on BereaSandstone. M.Sc. Thesis. The University of Oklahama.
Santucci de Magistris, F., Koseki, J., Amaya, M., Hamaya, S., Sato, T.,Tatsuoka, F., 1999. A triaxial testing system to evaluate stress–strainbehaviour of soils for wide range of strain rate. Geotechnical TestingJournal, ASTM 22 (1), 44–60.
Schoenemann, M.R., Pyles, M.R., 1988. Stress path Considerations inmultistage triaxial testing, advanced triaxial testing of soils and rocks.In: Donaghe, Robert T., Chancy, Ronald C., Silver, Marshall L.(Eds.), Proceedings of ASTM STP 977, pp. 732–739.
Schrader, E.K., 1996. Compaction of Roller Compacted Concrete. ACISpecial Publication (SP96-6), pp. 77–101.
Sorenzo, M., 1988. Results and interpretation of multistage triaxialcompression tests, advanced triaxial testing of soils and rocks. In:Donaghe, Robert T., Chancy, Ronald C., Silver, Marshall L. (Eds.),Proceedings of ASTM STP 977. American Society for Testing andMaterials, Philadelphia, pp. 353–362.
Taheri, A., Tani, K., 2008. Proposal of a new multiple-step loadingtriaxial compression testing method. In: Proceedings of Fifth AsianRock Mechanics Symposium, pp. 517–524.
Taheri, A., Tani, K., 2009a. Simulation of multiple-step loading triaxialcompression test on a mudstone by a new damage model. In:Proceedings of International Symposium on Rock Mechanics,SINOROCK 2009, p. 8.
Taheri, A., Tani, K., 2009b. Developing a generalized multiple-steploading damage model to predict rock behaviour during multiple-steploading triaxial compression test. In: Proceedings of 17th InternationalConference on Soil Mechanics and Geotechnical Engineering. Alex-andria, Egypt, pp. 429–432.
Tani, K., 2007. Proposal of multiple-step loading damage model tosimulate multiple-step loading triaxial compression test. In: Proceed-ings of First Sri Lankan Society International Conference on Soil andRock Engineering, p. 6.
Tatsuoka, F., Sato, T., Park, C.S., Kim, Y.S., Mukabi, J.N., Kohata, Y.,1994. Measurement of elastic properties of geomaterials in laboratorycompression tests. Geotechnical Testing Journal, ASTM 17 (1), 80–94.
Tatsuoka, F., Kohata, Y., 1995. Stiffness of hard soils and soft rocks inengineering applications, Keynote Lecture. In: Shibuya et al. (Eds.),Proceedings of International Symposium Pre-Failure Deformation ofGeomaterials, vol. 2. Balkema, pp. 947–1063.
Tatsuoka, F., Uchida, K., Ouchi, T., Kohata, Y., 1997. Properties ofcement-treated soils in Trans-Tokyo Bay Highway Project, GroundImprovement. Thomas Telford 1 (1), 37–58.
Tatsuoka, F., Jardine, R.J., Lo Presti, D., Di Benedetto, H., Kodaka, T.,1999. Characterization the Pre-failure deformation of geomaterials,theme lecture for the plenary session no. 1. In: Proceedings of 14thICSMFE, vol. 4. Hamburg, 1997, pp. 2129–2164.
Tatsuoka, F., Masuda, T., Siddiquee, M.S.A., 2003. Modelling the stress–strain behaviour of sand in cyclic plane strain loading. Geotechnicaland Environmental Engineering, Journal of Geotechnical and Envir-onmental Engineering, ASCE 129 (6), 450–467 (June 1).
Tatsuoka, F., Tateyama, M., Aoki, H., Watanabe, K., 2005. In:Indradratna and Chu (Eds.), Bridge Abutment Made of Cement-Mixed Gravel Backfill, Ground Improvement, Case Histories, vol. 3.Elsevier Geo-Engineering Book Series, pp. 829–873.
Tatsuoka, F., Di Benedetto, H., Kongkitkul, W., Kongsukprasert, L., Nishi,T., Sano, Y., 2008. Modeling of ageing effects on the elasto-viscoplasticbehaviour of geomaterial. Soils and Foundations 48 (2), 155–174.
Taylor, D.W., 1950. Triaxial Testing of Soils and Bituminous Mixtures,ASTM STP 106. American Society for Testing of Materials, Philadel-phia, pp. 180–191.
Watanabe, K., Tateyama, M., Jiang, G., Tatsuoka, F., Lohani, T.N., 2003a.In: Strength characteristics of cement-mixed gravel evaluated by largetriaxial compression tests. In: Di Benedetto et al. (Eds.), Proceedings ofThird International Conference on Pre-Failure Deformation Character-istics of Geomaterials, vol. 1. Lyon, Balkema, pp. 683–693.
Watanabe, O., Nasu, Y., Aoki, H., Yonezawa, T., Tateyama, M.,Tatsuoka, F., 2003b. Construction control of approach block ofcemented mixed gravel backfill. In: Proceedings of 58th AnnualConference on Japanese Society for Civil Engineers, vol. 3. Tokush-ima, pp. 1091–1092 (in Japanese).
Watanabe, K., Tateyama, M., Yonezawa, T., Aoki, H., 2005. Strengthcharacteristics and construction management of cement-mixedgravel. In: Proceedings of the 16th International Conferenceon Soil Mechanics and Geotechnical Engineering, IS-OSAKA,pp. 619–622.