Embed Size (px)
Citation preview
ELSEVIER
J. Construct. Steel Research 30 (1994) 259 281 q'~ 1994 Elsevier Science Limited
Printed in Malta. All rights reserved 0143-974X/94/$7.00
Strength Analysis of Concrete-Filled Thin-Walled Steel Box Columns
H. B. Ge & T. U s a m i *
Department of Civil Engineering, Nagoya University, Furou-cho, Chikusa-ku, Nagoya 464-01, Japan
(Received 15 July 1992; revised version received 18 May 1993; accepted 29 June 1993)
A B S T R A C T
An elasto-plastic .finite displacement analysis of concrete-filled thin-walled steel stub-columns of box shape is presented. In the analysis, a hardening-softening model is used to describe rationally the elasto-plastic behavior of concrete. A contact element for the interface combined with a bilinear constrained shell element for the plate and a cubic element for the concrete is employed. Both initial geometrical impe(fections and residual stresses are also considered in the plate elements. Analytical results are then compared with previous experimental results. In addition, a parmetric study is conducted to investigate the effects of various parameters such as the plate aspect ratio, the plate width thickness ratio and the concrete strength
on the column strength. Finally, a design formula for concretezfilled stub-columns in compression is proposed.
1 I N T R O D U C T I O N
In a previous paper,1 an experimental study on the structural perform- ances of concrete-filled thin-walled steel box stub-columns was presented. The concrete-filled column has been increasingly used as one of the important elements in buildings, bridges and so forth, because of their excellent earthquake-resistant properties, namely, high stiffness, high strength, high ductility and large energy absorption capacity. Moreover, concrete-filled composite colunmns also have the advantage that they require no formwork and no reinforcement.
*To whom correspondence should be addressed.
259
260 ff. B. Ge, 7~ Usami
Design codes such as BS 5400 Part 5, 2 AC1-318-833 and DIN 18806 Teil 14 have been proposed for designing composite columns. In Japan, a draft recommendation for bridge piers concerning composite columns with box-sections was prepared by the Hanshin Expressway Highway Public Cooperation. 5 However, very few experimental studies on the local buck- ling strength of concrete-filled thin-walled steel box columns are available, although a great number of studies 6 a have been carried out for columns with small plate width-thickness ratios. Although the limiting plate width-thickness ratios, for which local buckling is prevented, are specified in Eurocode 4, 9 in practical designs the steel portion may exceed those values in some cases. Therefore, further investigations seem to be neces- sary. Compared to the available experimental work, almost no theoretical work on elasto-plastic finite displacement analysis of concrete-filled col- umns is available.
This paper presents an elasto-plastic finite displacement analysis on the concrete-filled thin-walled steel stub-columns of box shape. In the analysis, a hardening-softening model developed by Wu and Tanabe 1° is used to describe the elasto-plastic behavior of concrete. A contact element 1~ for the interface combined with a bilinear constrained shell element for the plate member and a three-dimensional arbitrarily distorted cubic element for the concrete member is employed. Both initial geometrical imperfec- tions and residual stresses are considered in the plate elements. Analytical results were then compared with previous experimental results. ~ In addi- tion, a parametric study was conducted to investigate the effects of various parameters including the plate aspect ratio, the plate width thickness ratio and the concrete strength on the column strength. Finally, a design formula is proposed for concrete-filled box stub-columns in compression.
2 O U T L I N E O F A N A L Y S I S
To compute the load deformation characteristics of steel and concrete- filled steel columns of box shape, the MARC research program ~2 was used in this study.
2.1 Analytical model
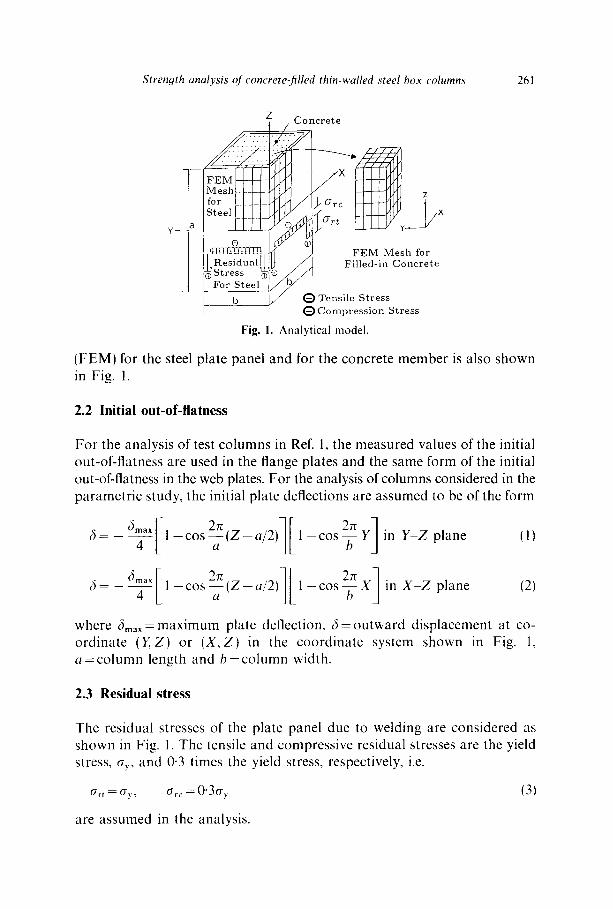
Concrete is assumed to be filled in between two rigid diaphragms provided at the column ends. Thus, one-eighth of the part between two diaphragms of the column, as shown in Fig. 1, is taken for the analysis because of symmetry. Because of the existence of both diaphragms and the filled-in concrete, the loaded edges are assumed to be fixed. Finite element mesh
Strength analysis of concrete-filled thin-walled steel box columns 261
Z Concrete
h 4 ~ ) FEM Mesh for ~ l s d s U "a I ~ J O ~ / / ~ Filled-in Concrete
__ ~ F;Ts:ee l ~ rl b Y I~ Tensile Stress
I ~1 Compression Stress
Fig. I. Analytical model.
(FEM) for the steel plate panel and for the concrete member is also shown in Fig. 1.
2.2 Initial out-of-flatness
For the analysis of test columns in Ref. 1, the measured values of the initial out-of-flatness are used in the flange plates and the same form of the initial out-of-flatness in the web plates. For the analysis of columns considered in the parametric study, the initial plate deflections are assumed to be of the form
co 2 ,z 4[1 ,,,
(5-- (~max l _ c o s 2 n ( Z _ a / 2 ) 1 - - C o s T X in X Z plane 4 a
12)
where ~Smax=maximum plate deflection, ~3=outward displacement at co- ordinate (Y,Z) or (X,Z) in the coordinate system shown in Fig. 1, a =co lumn length and b = column width.
2.3 Residual stress
The residual stresses of the plate panel due to welding are considered as shown in Fig. 1. The tensile and compressive residual stresses are the yield stress, C~y, and 0"3 times the yield stress, respectively, i.e.
a,, = ay, a~ = 0"3C7y (3)
are assumed in the analysis.
262 tt. B. Ge, 7~ Usami
2.4 Element type
Three element types were considered:
1. An eight-node thin shell discrete Kirchhoff element was employed for the steel plate element. This kind of element has four corner nodes with three degrees of freedom at each node and four mid-side nodes with only one degree of freedom (rotation of edge about itself) at each node. It has been found 12"xa that the element used gives good results for the analysis of complicated plate structures since the absence of local higher-order degress of freedom will allow for direct connections between folded plates without trying requirements along the folds.
2. An eight-node isoparametric element with three global degrees of freedom per node was used to model the concrete element.
3. In addition, to account for the interaction between steel and con- crete, a contact element ~'12 was employed between any two nodes of the interface. The true distance gap, in which the two end-points will be at least a given minimum distance apart, is then assumed in this study. Therefore, the constraint enforced by this true distance gap is
I X 4 - X l l ~>d (4)
where X1, X4=coordina te vectors of the first node and the fourth node respectively, and d = m i n i m u m distance between the end- points = half of the plate thickness in this study.
3 M A T E R I A L N O N L I N E A R I T I E S
3.1 Steel material
The von Mises yield criterion with normality flow rule is adopted to account for the material nonlinearity of the steel plate. No strain harden- ing is considered.
3.2 Concrete material
A large number of material models using the classical plastic theory with a well-pronounced yield plateau have been developed referring to metals. TM However, this may be inappropriate for concrete. In order to
Strength analysis of concrete-filled thin-walled steel box columns 263
find satisfactory hardening rules and formulations of the inelastic dilatancy, of the hydrostatic pressure sensitivity, of the strain-softening tendency and of microcracking, etc., extended and appropriate inves- tigations are necessary. The endochronic theory of inelasticity has been extended to concrete by Bazant e t al . 15 The model characterizes the accumulation of inelastic strain by a scalar parameter function of strain increments and the resulting law seems to be able to model some of the essential features of concrete behavior. Unfortunately, however, it is comparatively complex for practical application, since it has a lot of parameters. In this study, an elasto-plastic model proposed by Wu and Tanabe 1° is used. This constitutive model is proposed for concrete under compressive loading referring especially to the classical work- hardening plasticity theory, in which compression is either strain harden- ing or strain softening. Nonlinear behavior such as microcracking etc. is dealt with by an accumulated damage parameter and a subsequent loading surface in the stress surface is defined depending on the plastic strain history through the introduced damage parameter. In the im- plementation of the problem, the Drucker-Prager type yield surface relating to the well-known Mohr-Coulomb criterion, where the mobil- ized friction angle and mobilized cohesion are introduced, is adopted with the associative flow rule. The main characteristics of this model are: (1) both strain-hardening behavior and strain-softening behavior can be modeled; and (2) it is easy to use because only four material parameters are needed to determine the response of concrete be- havior.
4 N U M E R I C A L R E S U L T S
4.1 Prediction of concrete behavior
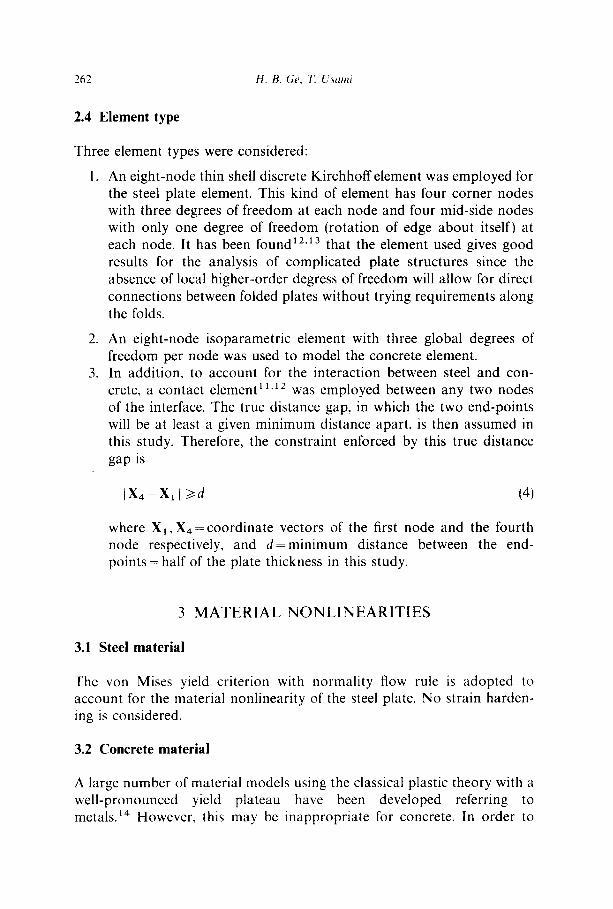
To determine material parameters from test data, a computer program to analyze concrete behavior in compression has been written based on the numerical algorithm of the model. 1° First, the values of material par- ameters are arbitrarily varied to know which parameter affects what. For instance, it is found that the softening behavior varies with different values of the softening parameter, t/, and the softening compliance in- creases with that parameter. Next, by trial-and-error approach, the values of material parameters are found by fitting Kupfer's experimental data of concrete in uniaxial compression. 16 A comparison of uniaxial test data and predictions is shown in Fig. 2. The solid lines in the figure are predicted uniaxial compressive stress-strain curves obtained using three
264 H. B. Ge, T. Usami
-50
-4O
P~
ca -30 C~ pa
co -20
< ><
< -I0
I 0.1 --0.2 0.3
AXIAL S T R A I N ( x l O -~)
Kupfer , Hitsdor f, and R u s c h (1969) E = 2 4 9 0 0 . 0 M P a
fc=32.1MPa # = 0 . 1 8 c=13.4MPa ~ = 3 0 °
M = 2 . 0
Fig. 2. Fit of uniaxial test data of concrete.
-50
--4O ~g, Bi a ~
co -30 co
cn -20 1 _ _
5 X
< - 10 - .
- [ - - 9 - - d 1 = 0- 2
_2_J Y-Axia l T e s t j
/
f . |
• • - . E x p e r i m e n t
- C a l c u l a t i o n
- - i
-0.1 -0.2 0.3
AXIAL S T R A I N (x 10 -2 )
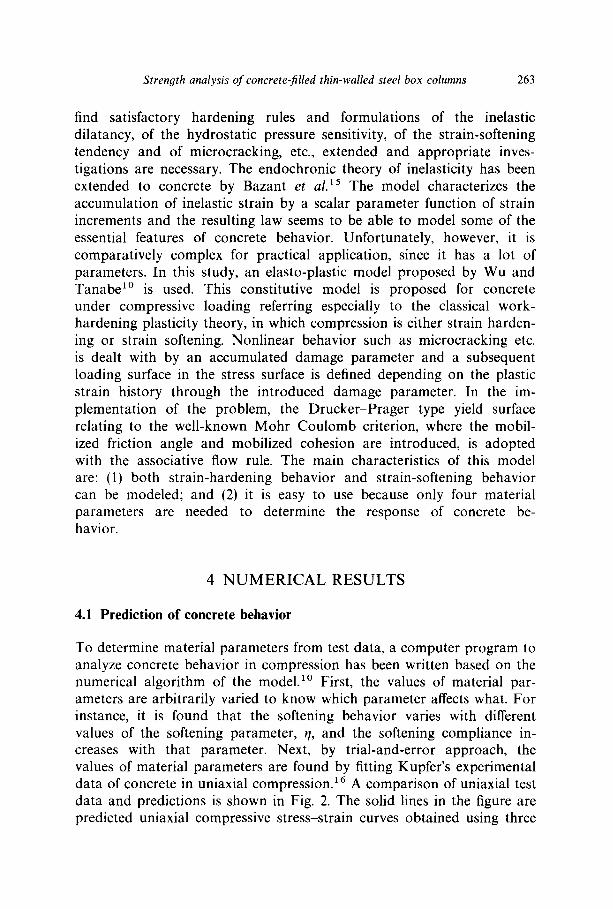
Kupfer , Hilsdorf, and Rusch (1969) E = 2 4 9 0 0 . 0 M P a
f~=32.1MPa c=13.4MPa #=0 .18 ¢ = 3 0 °
M=2.0 ;2=0.27
Fig. 3. Fit of biaxial test data of concrete.
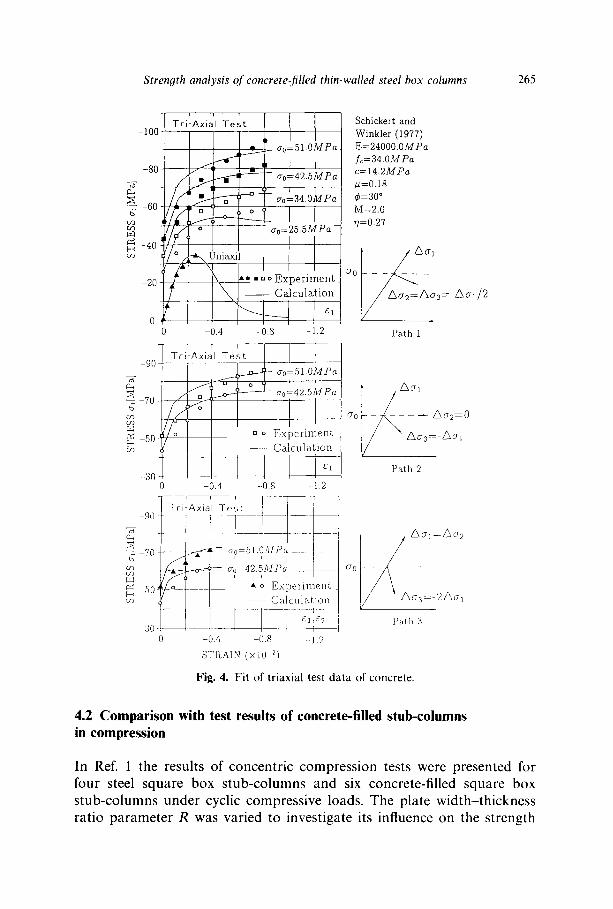
different values of the softening parameter, q. As is seen, the hardening and softening behavior of concrete may be rationally predicted using t/=0"27. The other three parameters used are M = 2.0, c=fc/2"4, ~b = 30 ° (see Refs 10 and 17). Predictions of stress-strain response for biaxiaP 6 and triaxiaP 8 tests are then conducted using the same parameters as in the uniaxial case. Reasonable agreement is seen in the comparisons for different loading paths, as shown in Figs 3 and 4.
Strength analysis of concrete-filled thin-walled steel box columns 265
-100
-8O
-= -60
-40 ' c o
20-
0 0
-90
-70 b
-50 o"3
--30
90
O~
70
50'
30
II Tri-Axial Tes t
. . . .1~w_2-~ ~o=51"OMPa
~ /e ~ ao:42.SMPa' ~ i - I I
\ • [] o E x p e r i m e n t
~ 'x - C a l c u l a t i o n
0.4 -0.8 -1.2
' I t Tri-Axial T e s t
~._m.-J L Cro=51.OMPa o
/ ao=42.5MPa
o E x p e r i m e n t
- - C a l c u l a t i o n
0 0.4 -0.8 -1.2
(o__ t _ ] E x p e r i m e n t
I [ - - C a h u l a t i o n
-0.4 08 ]2
S'I'RA]N (x]0 -~)
Schickert and Winkler (1977) E=24000.OMPa fc=34.0MPa c=14.2MPa ~=0 . i8 ¢=30 ° M=2.0 ~=0.27
(70
Ao3:-Aol/2
Path ]
• ~ O l
Path 2
/ Gel=ha2
o0 [~Ao3-- 2 / 5 o l
Path 3
Fig. 4. Fit of triaxial test data of concrete.
4.2 Comparison with test results of concrete-filled stub-columns in compression
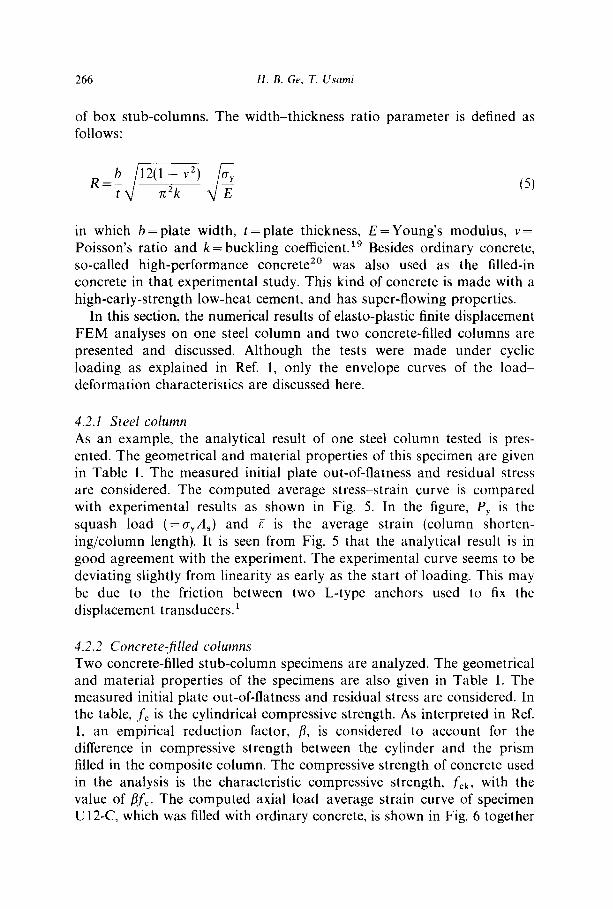
In Ref. 1 the results of concentric compression tests were presented for four steel square box stub-columns and six concrete-filled square box stub-columns under cyclic compressive loads. The plate width-thickness ratio parameter R was varied to investigate its influence on the strength
266 H. B. Ge, 32 Usami
of box stub-columns. The width- thickness ratio parameter is defined as follows:
R - t X/ ~z2k 15)
in which b = p l a t e width, t = p l a t e thickness, E = Y o u n g ' s modulus , v= Poisson's ratio and k = buckling coefficient. 19 Besides ordinary concrete, so-called high-performance concrete 2° was also used as the filled-in concrete in that experimental study. This kind of concrete is made with a high-early-strength low-heat cement, and has super-flowing properties.
In this section, the numerical results of elasto-plastic finite displacement FEM analyses on one steel column and two concrete-filled columns are presented and discussed. Al though the tests were made under cyclic loading as explained in Ref. 1, only the envelope curves of the load- deformation characteristics are discussed here.
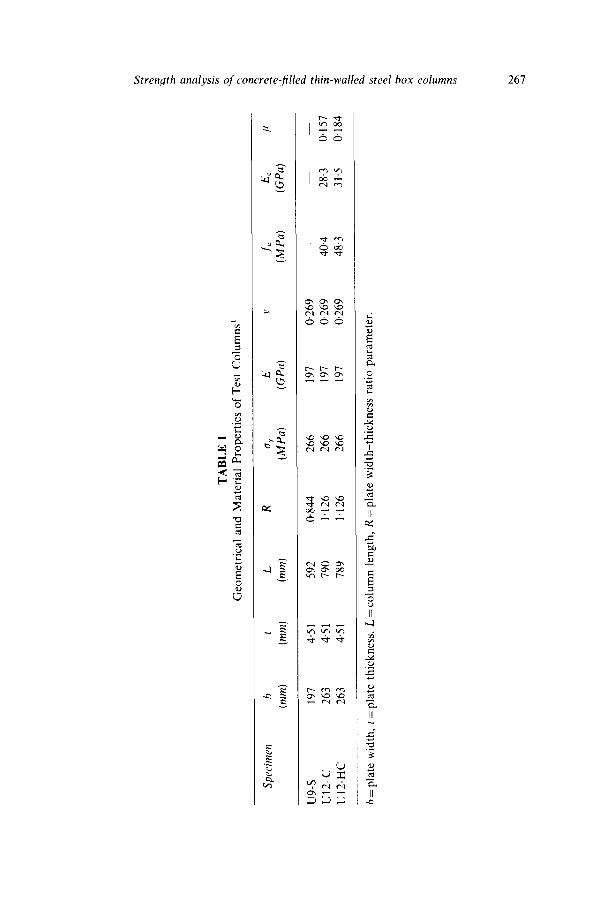
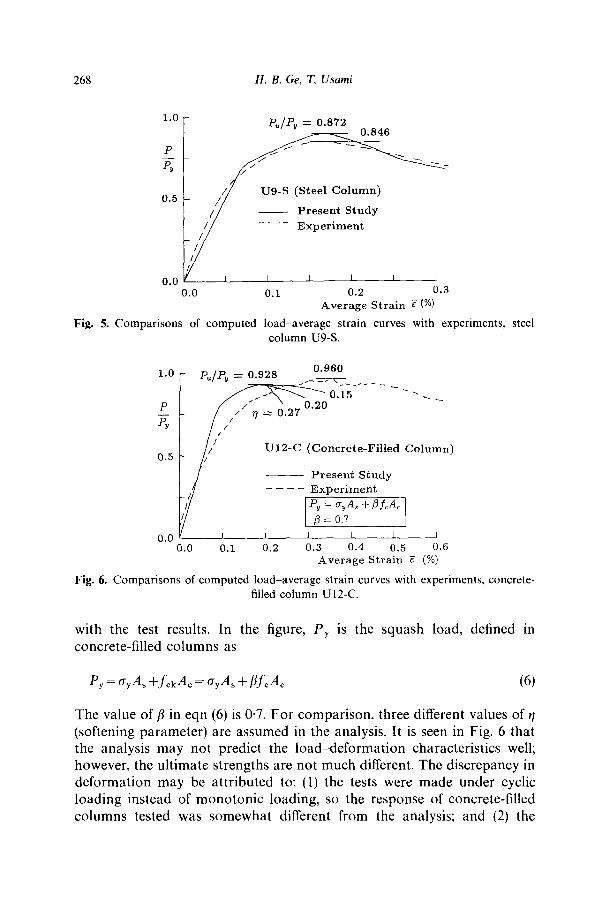
4.2.1 Steel column As an example, the analytical result of one steel column tested is pres- ented. The geometrical and material properties of this specimen are given in Table 1. The measured initial plate out-of-flatness and residual stress are considered. The computed average stress-strain curve is compared with experimental results as shown in Fig. 5. In the figure, Py is the squash load (=o'yAs) and g is the average strain (column shorten- ing/column length). It is seen from Fig. 5 that the analytical result is in good agreement with the experiment. The experimental curve seems to be deviating slightly from linearity as early as the start of loading. This may be due to the friction between two L-type anchors used to fix the displacement transducers, t
4.2.2 Concrete#illed columns Two concrete-filled s tub-column specimens are analyzed. The geometrical and material properties of the specimens are also given in Table 1. The measured initial plate out-of-flatness and residual stress are considered. In the table, fc is the cylindrical compressive strength. As interpreted in Ref. 1, an empirical reduction factor, /3, is considered to account for the difference in compressive strength between the cylinder and the prism filled in the composi te column. The compressive strength of concrete used in the analysis is the characteristic compressive strength, fck, with the value of/3f~. The computed axial load-average strain curve of specimen U12-C, which was filled with ordinary concrete, is shown in Fig. 6 together
TA
BL
E
1 G
eom
etri
cal
and
Mat
eria
l P
rope
rtie
s of
Tes
t C
olu
mn
s ~
Spec
imen
b
t L
R
ay
E
v
f c
E~
(mm
) (ra
m)
(mm
) (M
Pa)
(GPa
) (M
Pa)
(GPa
)
U9-
S
197
4.51
59
2 0.
844
266
197
0.26
9 --
--
U
l2-C
26
3 4-
51
790
1.12
6 26
6 19
7 0-
269
40.4
28
.3
0.15
7 U
12-H
C
263
4.51
78
9 1.
126
266
197
0.26
9 48
.3
31.5
0.
184
b =
plat
e w
idth
, t =
pla
te t
hic
kn
ess,
L =
col
um
n l
engt
h, R
= p
late
wid
th-t
hic
kn
ess
rati
o pa
ram
eter
.
268 H. B. Ge, T. Usami
1.o Pu/P~ = o.sr2 ~ 0.846
/ / ug-S (Steel Column) 0.5 / / /
/ / Present Study /
Exper iment
0.0 I I I I I I 0.0 0.I 0.2 0.3
Average Strain e (%)
Fig. 5. Comparisons of computed load-average strain curves with experiments, steel column U9-S.
1.0 Pu/P~ = 0.928 0.960
o 5 ; . . . . . - - - _ = 0.2 0 . 2 0
l / / U12-C (Concrete-Fi l led Column) O.5
J Present Study Exper iment
]P~ = cr~As + flfcA~ 0.7 ]
0 . 0 1 I I I 1 I
0.0 0.1 0.2 0.3 0.4 0,5 0.6 Average Strain ~ (%)
Fig. 6. Comparisons of computed load-average strain curves with experiments, concrete- filled column Ut2-C.
with the test results. In the figure, Py is the squash load, defined in concrete-filled columns as
Py = oyAs + f c k A c = OyAs + f l feAc (6)
The value of fl in eqn (6) is 0.7. For comparison, three different values of q (softening parameter) are assumed in the analysis. It is seen in Fig. 6 that the analysis may not predict the load-deformation characteristics well; however, the ultimate strengths are not much different. The discrepancy in deformation may be attributed to: (1) the tests were made under cyclic loading instead of monotonic loading, so the response of concrete-filled columns tested was somewhat different from the analysis; and (2) the
Strength analysis of concrete-filled thin-walled steel box columns 269
1.129 P,/ Py= 1.084
1.0 /~=0.85 ~ - " "" "~
0.5 U12-HC (Concre te -F i l l ed Column)
/ P resen t S tudy E x p e r i m e n t
I P=0.v J 0.0 1 I I I I I
0.0 0.1 0.2 0.3 0.4 0.5 0.6 Average S t ra in ~ (%)
Fig. 7. Comparisons of computed load-average strain curves with experiments, concrete- filled columns U12-HC.
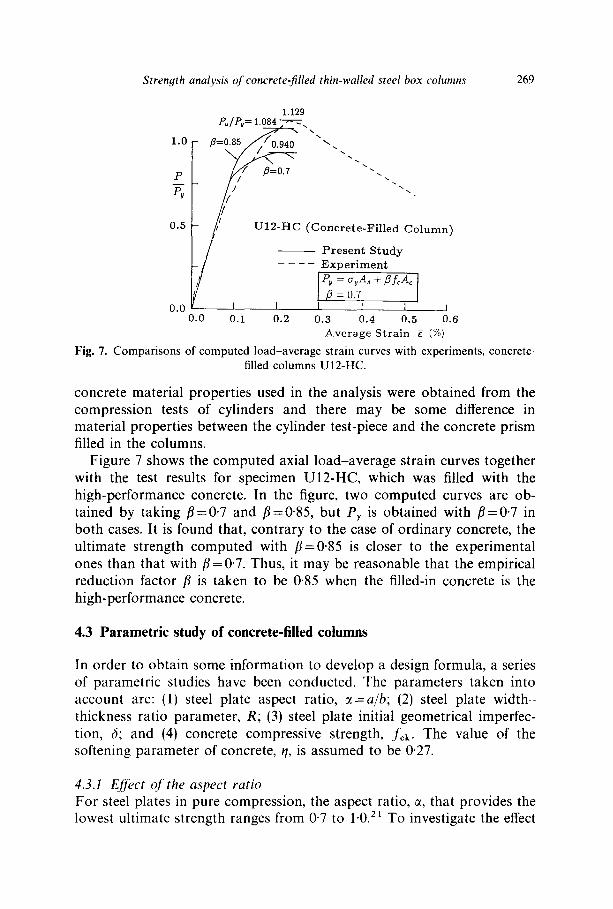
concrete material properties used in the analysis were obtained from the compression tests of cylinders and there may be some difference in material properties between the cylinder test-piece and the concrete prism filled in the columns.
Figure 7 shows the computed axial load-average strain curves together with the test results for specimen U12-HC, which was filled with the high-performance concrete. In the figure, two computed curves are ob- tained by taking 13=0"7 and 13=-0.85, but Py is obtained with 13=0-7 in both cases. It is found that, contrary to the case of ordinary concrete, the ultimate strength computed with 13=0"85 is closer to the experimental ones than that with 13 = 0"7. Thus, it may be reasonable that the empirical reduction factor 13 is taken to be 0"85 when the filled-in concrete is the high-performance concrete.
4.3 Parametric study of concrete-filled columns
In order to obtain some information to develop a design formula, a series of parametric studies have been conducted. The parameters taken into account are: (1) steel plate aspect ratio, ~=a/b; (2) steel plate width- thickness ratio parameter, R; (3) steel plate initial geometrical imperfec- tion, 6; and (4) concrete compressive strength, fck. The value of the softening parameter of concrete, q, is assumed to be 0.27.
4.3.1 Effect of the aspect ratio For steel plates in pure compression, the aspect ratio, ~, that provides the lowest ultimate strength ranges from 0"7 to 1"0. zl To investigate the effect
270 H. B. Ge, T. Usami
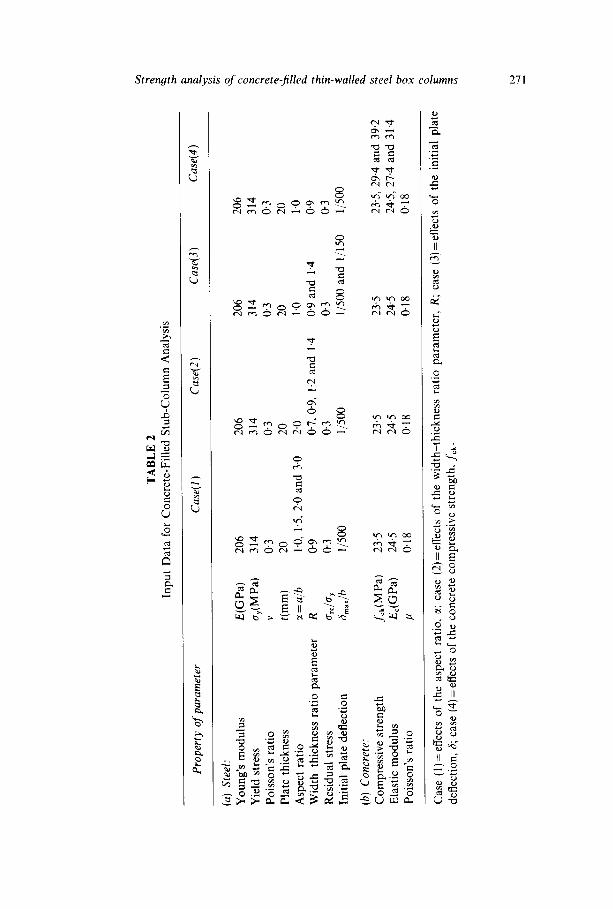
of the aspect ratio on the strength of the concrete-filled stub-column, elasto-plastic FEM analyses have been made on four concrete-filled columns with different aspect ratios. The input data are summarized in Table 2. The values of e are varied from 1.0 to 3"0.
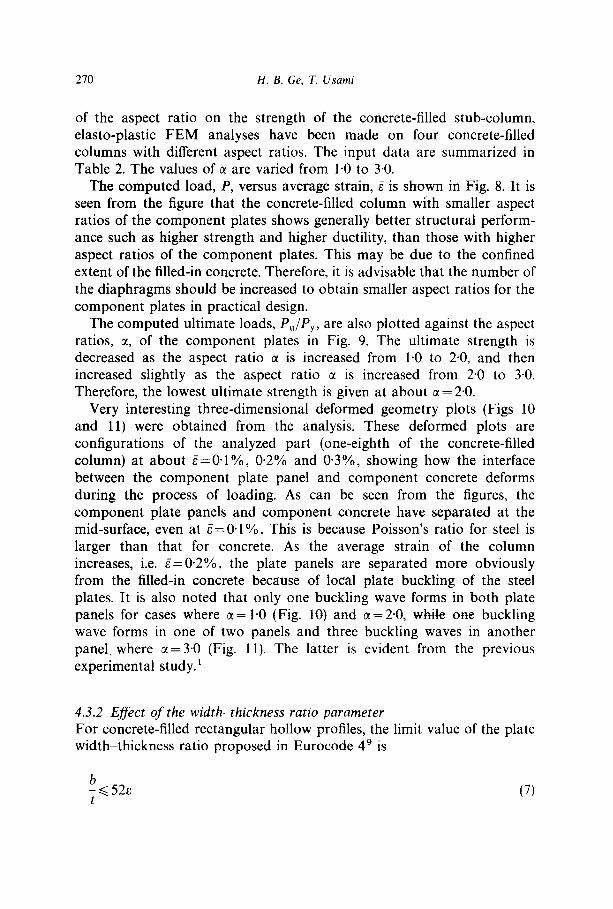
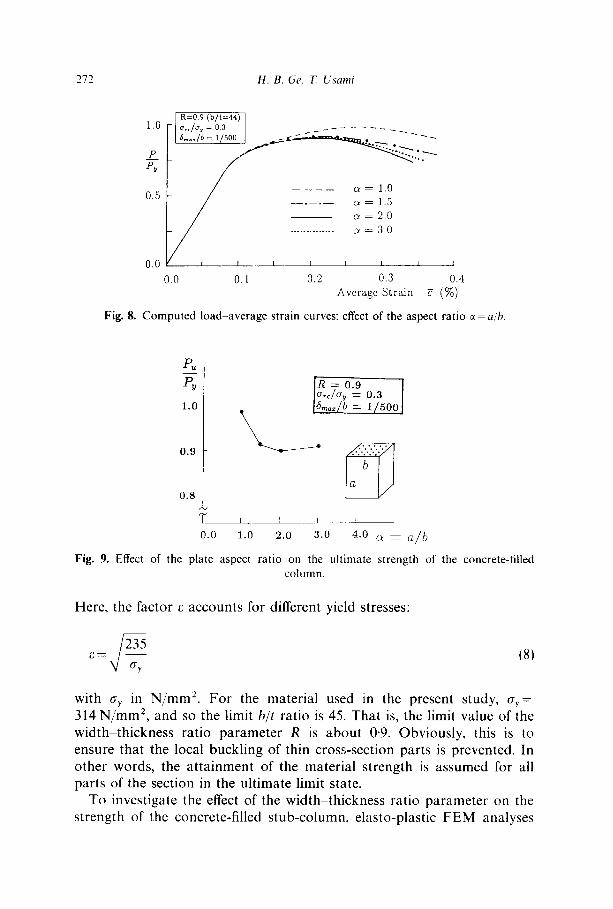
The computed load, P, versus average strain, g is shown in Fig. 8. It is seen from the figure that the concrete-filled column with smaller aspect ratios of the component plates shows generally better structural perform- ance such as higher strength and higher ductility, than those with higher aspect ratios of the component plates. This may be due to the confined extent of the filled-in concrete. Therefore, it is advisable that the number of the diaphragms should be increased to obtain smaller aspect ratios for the component plates in practical design.
The computed ultimate loads, Pu/Py, a r e also plotted against the aspect ratios, ~, of the component plates in Fig. 9. The ultimate strength is decreased as the aspect ratio ~ is increased from 1.0 to 2-0, and then increased slightly as the aspect ratio ~ is increased from 2"0 to 3-0. Therefore, the lowest ultimate strength is given at about ~ = 2.0.
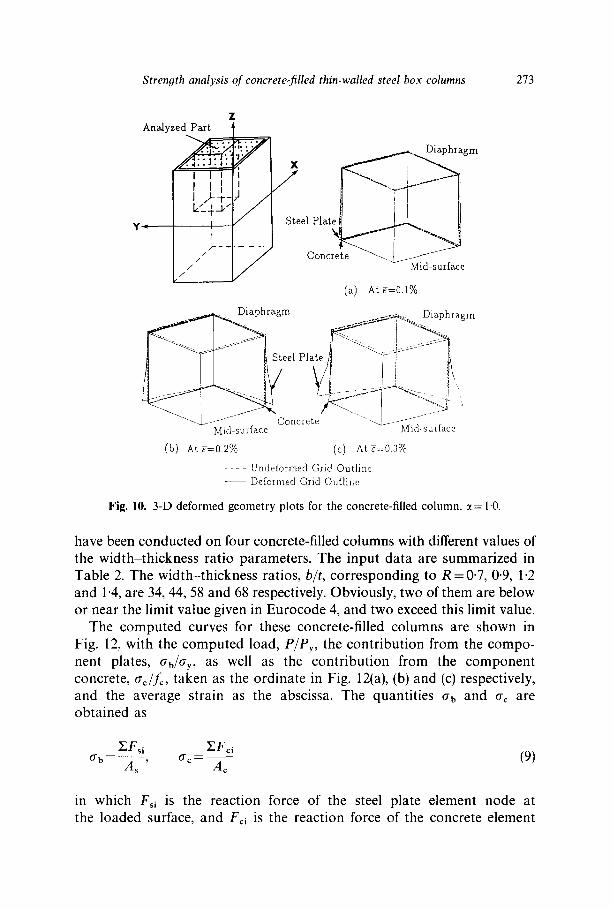
Very interesting three-dimensional deformed geometry plots (Figs 10 and 11) were obtained from the analysis. These deformed plots are configurations of the analyzed part (one-eighth of the concrete-filled column) at about ~=0-1%, 0-2% and 0-3%, showing how the interface between the component plate panel and component concrete deforms during the process of loading. As can be seen from the figures, the component plate panels and component concrete have separated at the mid-surface, even at g=0-1%. This is because Poisson's ratio for steel is larger than that for concrete. As the average strain of the column increases, i.e. g=0-2%, the plate panels are separated more obviously from the filled-in concrete because of local plate buckling of the steel plates. It is also noted that only one buckling wave forms in both plate panels for cases where ~= 1'0 (Fig. t0) and ct=2-0, while one buckling wave forms in one of two panels and three buckling waves in another panel where ~t=3.0 (Fig. 11). The latter is evident from the previous experimental study. 1
4.3.2 Effect of the width-thickness ratio parameter For concrete-filled rectangular hollow profiles, the limit value of the plate width-thickness ratio proposed in Eurocode 4 9 is
b - ~< 52~ (7) t
TA
BL
E 2
In
put
Dat
a fo
r C
oncr
ete-
Fil
led
Stu
b-C
olum
n A
naly
sis
Prop
erty
of p
aram
eter
C
ase(
1 )
Cas
e(2)
C
ase(
3)
Cas
e(4)
(a)
Stee
l: Y
oung
's m
odul
us
E(G
Pa)
20
6 20
6 Y
ield
str
ess
Cry
(MPa
) 31
4 31
4 P
oiss
on's
rat
io
v 0.
3 0.
3 P
late
thi
ckne
ss
t(m
m)
20
20
Asp
ect
rati
o ~=
a/b
1.0,
1.5
, 2"0
and
3-0
2'
0 W
idth
-thi
ckne
ss r
atio
par
amet
er
R
0"9
0.7,
0-9
, 1.
2 an
d 1.
4 R
esid
ual
stre
ss
O'r
c/6
), 0"
3 0"
3 In
itia
l pl
ate
defl
ecti
on
6m~/
b 1/
500
1/50
0
(b)
Con
cret
e:
Com
pres
sive
str
engt
h fC
k(M
Pa)
23"5
23
"5
Ela
stic
mod
ulus
E
c(G
Pa)
24
.5
24.5
P
oiss
on's
rat
io
/~
0.18
0'
18
206
206
314
314
0"3
0'3
20
20
1"0
1"0
0"9
and
1"4
0-9
0"3
0"3
1/50
0 an
d 1/
150
1/50
0
23.5
23
.5,
29.4
and
39.
2 24
.5
24.5
, 27
.4 a
nd 3
1'4
0.18
0.
18
%.
,=
e~
e~
Cas
e (1
)=ef
fect
s of
the
asp
ect
rati
o, ~
; ca
se (
2)=
effe
cts
of t
he w
idth
-thi
ckne
ss r
atio
par
amet
er,
R;
case
(3)
=ef
fect
s of
the
ini
tial
pla
te
defl
ecti
on,
,5; c
ase
(4)=
eff
ects
of
the
conc
rete
com
pres
sive
str
engt
h, f
ck.
272 H. B. Ge, T. Usami
R = 0 . 9 (b / t=44 ) ] 1 , 0 a ,~ /a u = 0.3 ] . . . . . . . .
p_ ........ ~.-~. Pv
. . . . CY
0.5 / . . . . . c~ = 1.5
/ - - o< = 2.0
. . . . . . . . . . . . o < = 3 , 0
0.0 I I i i I i l I
0 0 0. l 0.2 0.3 0.4 Average St ra in g (%)
Fig. 8. Computed load-average strain curves: effect of the aspect ratio a = a/b,
G I R = 0.9 1 I°,~/o~ = 0.3 I 1.0 [6ma~/b = 1 / 5 0 0 2
0.9
0.8
I [ _ _ _ _ P
0.0 1.0 2.0 :).0 4.0 c~ = a / b
Fig, 9. Effect of the plate aspect ratio on the ultimate strength of the concrete-filled column.
Here, the factor c accounts for different yield stresses:
~ / O ' y (8)
with O-y in N / m m 2. For the material used in the present study, ay= 314 N / m m 2, and so the limit bit ratio is 45. That is, the limit value of the width-thickness ratio parameter R is about 0"9. Obviously, this is to ensure that the local buckling of thin cross-section parts is prevented. In other words, the attainment of the material strength is assumed for all parts of the section in the ultimate limit state.
To investigate the effect of the width-thickness ratio parameter on the strength of the concrete-filled stub-column, elasto-plastic FEM analyses
Strength analysis of concrete-filled thin-walled steel box columns 273
Z A n a l y z e ~
y -
¢ I I I [ ~ '~ ~ Di~phragrn
f l ' , ' | , ,x-~-]; ~ / " "i I / v--'+-~'l / I / / 'K--J aee' Ply'
(a) at g=0.1%
. ~ . ~ , ~ i a p h r agm ~ . Diaphragm
oncre~~ ~ Mid-surface Mid~safface
(b) At ~-=0.2% (c) At3=0.3%
-- Undeformed Grid Outline - - Deformed Grid Outline
Fig. 10. 3-D deformed geometry plots for the concrete-filled column, ~ = 1.0.
have been conducted on four concrete-filled columns with different values of the width-thickness ratio parameters. The input data are summarized in Table 2. The width-thickness ratios, b/t, corresponding to R = 0"7, 0"9, 1"2 and 1"4, are 34, 44, 58 and 68 respectively. Obviously, two of them are below or near the limit value given in Eurocode 4, and two exceed this limit value.
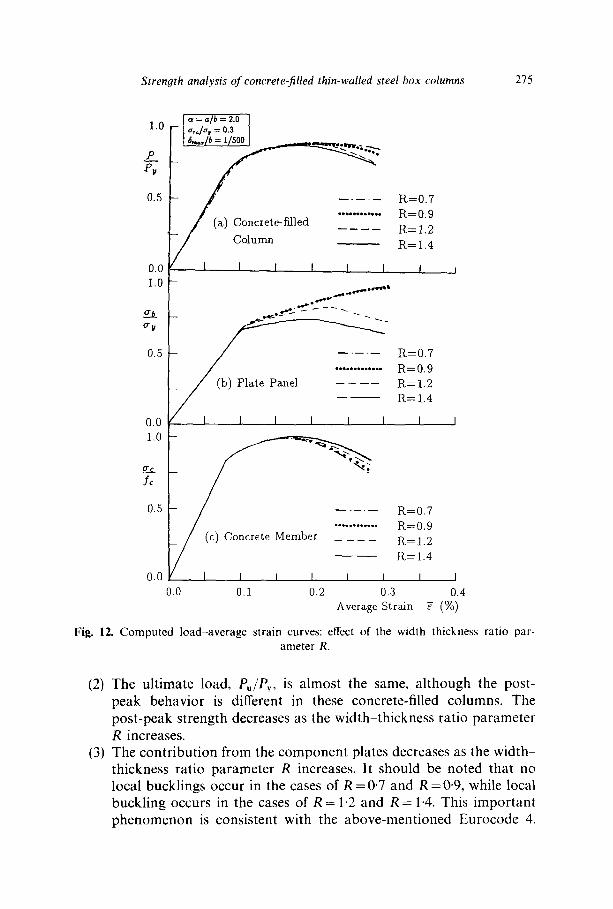
The computed curves for these concrete-filled columns are shown in Fig. 12, with the computed load, P/Py, the contribution from the compo- nent plates, Ob/O'y , a s well as the contribution from the component concrete, a¢/f~, taken as the ordinate in Fig. 12(a), (b) and (c) respectively, and the average strain as the abscissa. The quantities o b and O-c are obtained as
ZFsi ZFci O'b-- A s ' a c - A¢ (9)
in which Fsi is the reaction force of the steel plate element node at the loaded surface, and Fci is the reaction force of the concrete element
274 H. B. Ge, T. Usami
...... ~_~,_. Diaphragm
~ ' v - "
I , I
e el P l a <
Mid-surface Concrete
(a) At ~=oA%
Diaphragm
i ] " I
...... .~-~ ~ x ~ . Steel Plate
Mid-surface Concrete
(b) At ~=0.2% - - - Undeformed Grid Outline - - Deformed Grid Outline
Diaphragm
Mid-surface (c) At g=0.3%
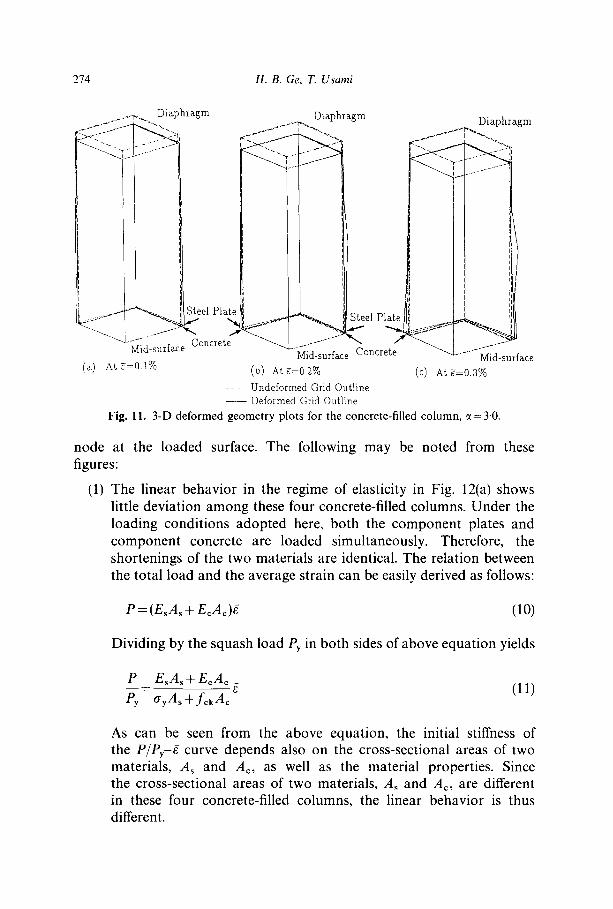
Fig. 11. 3-D deformed geometry plots for the concrete-filled column, ~ = 3.0.
node at the loaded surface. The following may be noted from these figures:
(1) The linear behavior in the regime of elasticity in Fig. 12(a) shows little deviation among these four concrete-filled columns. Under the loading conditions adopted here, both the component plates and component concrete are loaded simultaneously. Therefore, the shortenings of the two materials are identical. The relation between the total load and the average strain can be easily derived as follows:
P = (EsA~ + E~A~)g (10)
Dividing by the squash load Py in both sides of above equation yields
P EsA~+E¢Ac _
- e ( 1 1 ) Py %As+ f~kAc
As can be seen from the above equation, the initial stiffness of the P/Py-g curve depends also on the cross-sectional areas of two materials, As and Ac, as well as the material properties. Since the cross-sectional areas of two materials, As and A~, are different in these four concrete-filled columns, the linear behavior is thus different.
Strength analysis of concrete-filled thin-walled steel box columns 275
~, = o /b = 2.0 ] 1.0 o,o/,,, = 0.a I
"Pv .
0.5 R=0.7
/ (~)Concrete-filled ~ ......... ~- R=0.9 R=1.2 R= 1.4 Column
i
0 . o I I i I I I I J 1 . 0 -
0.5 . . . . . R=0.7 R---0.9 R = l . 2 R=1.4
0 . 0 1 I I I I I . I I 1 . o -
/ C o n c r e t e Me ~"~;
/¢
0.5 R=0.7
tuber ............ R=0.9 R=1.2 R = I A
0.0 I I I I I I I I 0.0 0.1 0,2 0.3 0.4
Average Strain g (%)
Fig. 12. Computed load-average strain curves: effect of the width thickness ratio par- ameter R.
(2) The ultimate load, Pu/Py, is almost the same, although the post- peak behavior is different in these concrete-filled columns. The post-peak strength decreases as the width-thickness ratio parameter R increases.
(3) The contribution from the component plates decreases as the width- thickness ratio parameter R increases. It should be noted that no local bucklings occur in the cases of R =0"7 and R =0-9, while local buckling occurs in the cases of R = 1.2 and R = 1.4. This important phenomenon is consistent with the above-mentioned Eurocode 4.
276 H. B. Ge, T. Usami
Moreover, the contributions from the component plates are nearly the same and closer to 1"0 when the width-thickness ratio parameter R is less than 0"9.
(4) The maximum strengths of the component concrete are almost the same. It may be said that the increase in the strength of concrete due to the confinement of the steel box could not be expected.
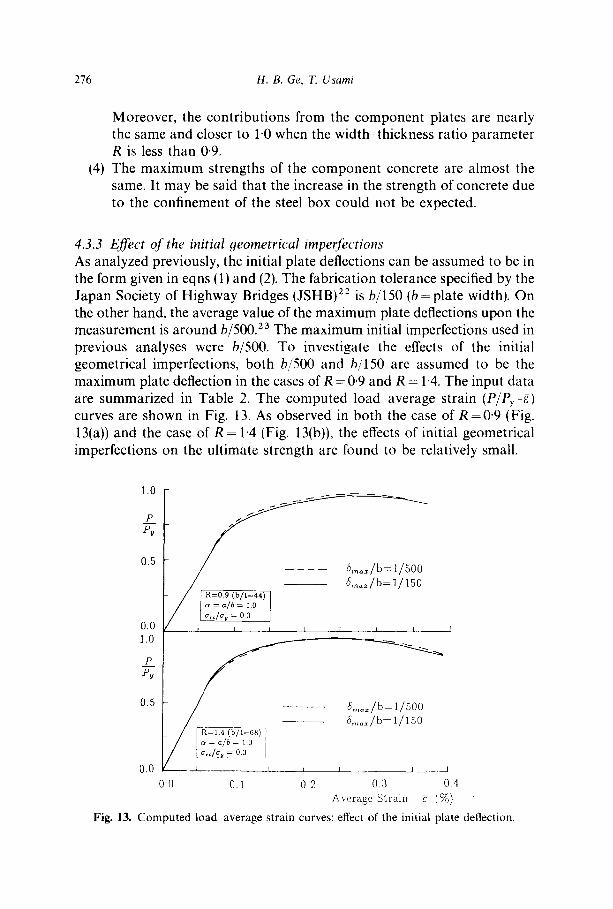
4.3.3 Effect of the initial ,qeometrical imperfections As analyzed previously, the initial plate deflections can be assumed to be in the form given in eqns (1) and (2). The fabrication tolerance specified by the Japan Society of Highway Bridges (JSHB) 22 is b/150 (b= plate width). On the other hand, the average value of the maximum plate deflections upon the measurement is around b / 5 0 0 . 23 The maximum initial imperfections used in previous analyses were b/500. To investigate the effects of the initial geometrical imperfections, both b/500 and b/150 are assumed to be the maximum plate deflection in the cases of R = 0.9 and R = 1'4. The input data are summarized in Table 2. The computed load-average strain (P/Py-g) curves are shown in Fig. 13. As observed in both the case of R = 0-9 (Fig. 13(a)) and the case of R = 1"4 (Fig. 13(b)), the effects of initial geometrical imperfections on the ultimate strength are found to be relatively small.
1.0
P__ Pv
0.5
0.0 1.0
P Pu
0.5
0.0
~ = / b = ] / 1 5 0
/ ~ho/b2~o I / o,o/o~ = oa I
I I I I I I
/ i ~_=/b_a.o / i °,o/°~ = o.a
I I
0.0 0.1
..... /b=l/s0o
I I i I I
0.2 0.3 0 4 Average Strain e (%)
Fig. 13. Computed load average strain curves: effect of the initial plate deflection.
Strength analysis of concrete-filled thin-walled steel box columns 277
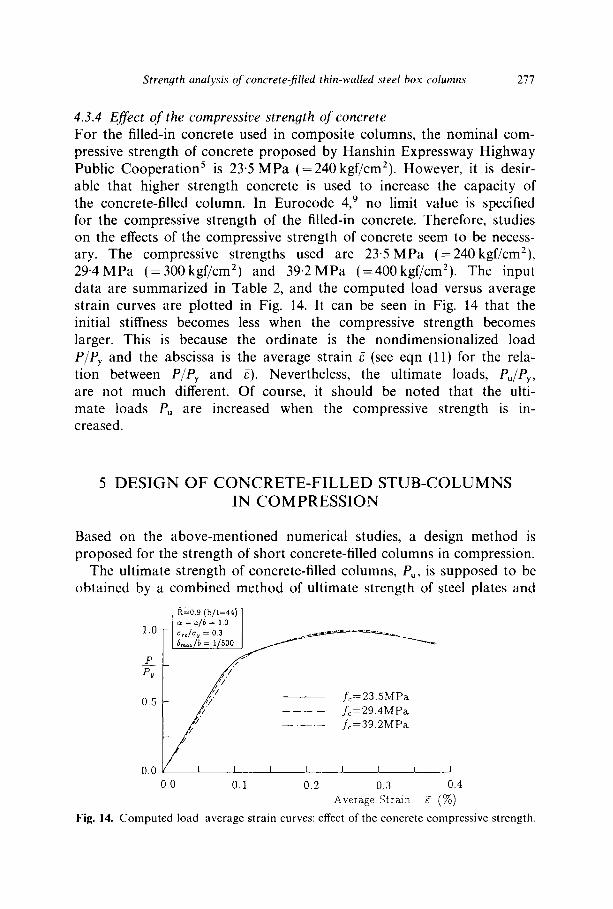
4.3.4 Effect of the compressive strength of concrete For the filled-in concrete used in composite columns, the nominal com- pressive strength of concrete proposed by Hanshin Expressway Highway Public Cooperation s is 23.5 MPa (= 240 kgf/cm2). However, it is desir- able that higher strength concrete is used to increase the capacity of the concrete-filled column. In Eurocode 4, 9 n o limit value is specified for the compressive strength of the filled-in concrete. Therefore, studies on the effects of the compressive strength of concrete seem to be necess- ary. The compressive strengths used are 23.5MPa (-- 240 kgf/cm2), 29.4MPa (= 300 kgf/cm z) and 39.2MPa (=400kgf/cm2). The input data are summarized in Table 2, and the computed load versus average strain curves are plotted in Fig. 14. It can be seen in Fig. 14 that the initial stiffness becomes less when the compressive strength becomes larger. This is because the ordinate is the nondimensionalized load P/Py and the abscissa is the average strain g (see eqn (11) for the rela- tion between P/Py and g). Nevertheless, the ultimate loads, Po/Py, are not much different. Of course, it should be noted that the ulti- mate loads Po are increased when the compressive strength is in- creased.
5 D E S I G N O F C O N C R E T E - F I L L E D S T U B - C O L U M N S IN C O M P R E S S I O N
Based on the above-mentioned numerical studies, a design method is proposed for the strength of short concrete-filled columns in compression.
The ultimate strength of concrete-filled columns, P,, is supposed to be obtained by a combined method of ultimate strength of steel plates and
R = 0 . 9 ( b / t = 4 4 ) o~ = a / b = 1.0
] . 0 a , c / a ~ = 0.3 . . . . . . . . . . . . .
P v '~ /
0.5 / ~ / - - f~=23.5MPa ~ ' - - f~=29.4MPa. / f~=39.2MPa
0.0 I I 1 I l I I
0.0 0.1 0.2 0.3 0.4 Average Strain ~ (%)
Fig. 14. Computed load average strata curves: effect of the concrete compressive strength.
278 H. B. Ge, T. Usami
filled-in concrete as follows:
P, = abAs +/3f~dA~ (12)
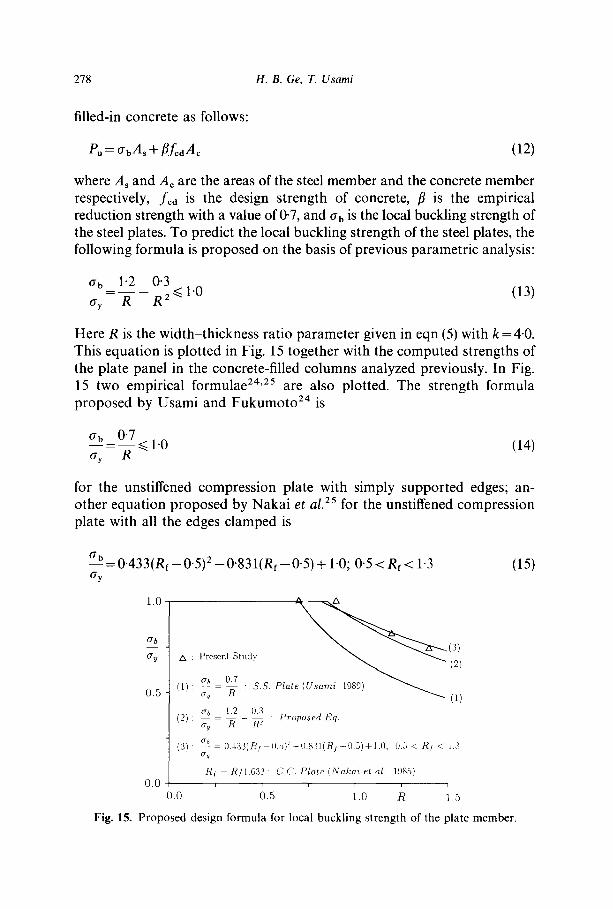
where A~ and Ac are the areas of the steel member and the concrete member respectively, fc~ is the design strength of concrete, /3 is the empirical reduction strength with a value of 0.7, and ab is the local buckling strength of the steel plates. To predict the local buckling strength of the steel plates, the following formula is proposed on the basis of previous parametric analysis:
O" b 1"2 0"3 O'y - - R R2-~< 1"0 (13)
Here R is the width-thickness ratio parameter given in eqn (5) with k = 4-0. This equation is plotted in Fig. 15 together with the computed strengths of the plate panel in the concrete-filled columns analyzed previously. In Fig. 15 two empirical formulae 24'25 are also plotted. The strength formula proposed by Usami and Fukumoto 24 is
O- b 0"7 a~- = R- ~< 1-0 (14)
for the unstiffened compression plate with simply supported edges; an- other equation proposed by Nakai et a l } s for the unstiffened compression plate with all the edges clamped is
ab = 0 " 4 3 3 ( R f - 0"5) z - 0"83 l ( R f - - 0"5) + 1"0; 0"5 < R f < 1"3 Oy
o
a b O'y A : Present S t u d y (3)
(23 ab 0.7 ~
0.5 (~) ~ = ~ : ~.~. P~t~ (u~m~ 198o) ~ (~)
ab 1.2 0.3 (2): = - au ~ Rj - : Proposed Eq.
(3): ~b_ = 0.433(Rf-O.5)-'-I).S3](Rf-0.5)+l.O, 0.5 < R/ < 1.3 o'y
Rf = R/1.633: ('.C. Pla te(Nakaie t al. 1985) 0.0 . . . . . .
0.0 0.5 1.0 R 1.5
(15)
Fig. 15. P r o p o s e d des ign f o r m u l a for local b u c k l i n g s t r e n g t h of the p la te m e m b e r .
Strength analysis of concrete-filled thin-walled steel box columns 279
where Rf is the plate width-thickness parameter with k = 10"67 (all the edges clamped) in eqn (5). It is found that the computed strengths of the plate panel in the concrete-filled columns are close to the predicted values of a clamped plate. The design method proposed in Eurocode 4 9 is available only for those concrete-filled columns with small plate width- thickness ratio parameters so that no local plate buckling would occur. The above proposed equation, however, can be used to account for the effects of local plate buckling. It is noted that the proposed equation is identical to Eurocode 4 when the width-thickness ratio is within the limit (i.e. R = 0"9) specified in the code.
6 C O N C L U S I O N S
From the analysis on concrete-filled thin-walled stub-columns of box shape, the following important conclusions may be drawn:
1. An elasto-plastic model of concrete is observed to predict satisfactor- ily the stress-strain characteristic of concrete subjected to uniaxial and biaxial compressive loading.
2. The ultimate strengths of concrete-filled columns obtained from the analysis generally agree well with the experimental results.
3. An empirical reduction factor proposed in Ref. 1, fl=0.7, for the cylindrical compressive strength of concrete, is found to be adequate for the ordinary filled-in concrete; fl = 0.85 may be more rational for the high-performance concrete.
4. The lowest ultimate strength of concrete-filled columns is obtained when the plate aspect ratio, ~t, is about 2"0.
5. Local plate buckling would occur when the width-thickness ratio parameter, R (eqn (5)). is larger than 0.9.
6. The effects of initial geometrical imperfections of plate panels on the ultimate strength are relatively small.
7. The nondimensionalized ultimate loads, Pu/Py, are not sensitive to the concrete strength, although the ultimate strengths, Pu, of concrete- filled columns are increased when the concrete strength is increased.
8. A design formula (eqns (12) and (13)) is proposed to account for the effects of local plate buckling on the strength of concrete-filled columns.
R E F E R E N C E S
1. Ge, H. B. & Usami, T., Strength of concrete-filled steel box columns: expe- riment. J. Struct. Engng, ASCE, 118(11) (1992) 3036 54.
280 H. B. Ge, 7~ Usami
2. BS 5400, Steel, Concrete and Composite Bridges, Part 5: Code (~f" Practice for Design of Composite Bridges. British Standards Institution, London, 1979.
3. ACI 318-83, Building Code Requirements Jbr Reinforced Concrete. ACI Committee 318, American Concrete Institute, Detroit, MI, 1983.
4. DIN 18806 Teil 1, Tragfi~higkeit yon Verbundstiitzen, Berechnung und Bemes- sung, 1981.
5. Hanshin Expressway Highway Public Cooperation, Recommendation of De- sign and Construction of Steel Bridges Piers with Composite Columns (Concrete Filled Structures), 1986 (in Japanese).
6. Kitada, T., Nakai, H. & Yoshida, Y., Experimental study on ultimate strength of composite square short columns using rolled steel plate with small ribs. Proc. 2nd Symposium on Research and Application ~1" Composite Constructions, Committee of Structural Engineering, JSCE, 1989, pp. t89-94 (in Japanese).
7. Narayanan, R., Steel Concrete Composite Structures: Stability and Strength. Elsevier Applied Science, London, 1988.
8. Nakai, H., Yoshikawa, O. & Terada, H., An experimental study on ultimate strength of composite columns for compression and bending. Proc. JSCE, Struct. Engng/Earthquake Engng, 3(2) (1986) 235s-245s.
9. Eurocode 4, Design of Composite Structures, Composite Columns, 1990. 10. Wu, Z. S. & Tanabe, T., A hardening-softening model of concrete subjected
to compressive loading. J. Struct. Engng, Architect. Inst. Jpn, 36b (1990) 153-62.
11. MARC Analysis Research Corporation, MARC Background Information, 1988.
12. MARC Analysis Research Corporation, MARC User Information Manual, 1988.
13. Usami, T., Wada, M., Kato, M. & Ge, H. B., Ultimate compressive strength of plate assemblies. Proc. International Conference on Steel and Aluminium Structures, Singapore, May 1991.
14. Chen, W. F., Plasticity in Reinforced Concrete. McGraw-Hill, New York, 1982.
15. Bazant, Z. P. & Bhat, P. D., Endochronic theory of inelasticity and failure of concrete. J. Engng. Mech. Div., ASCE, 102(4) (1976) 331 44.
16. Kupfer, H. B., Hilsdorf, H. K. & Riisch, H., Behavior of concrete under biaxial stresses. Am. Concrete Inst. J., 66 (1969) 656-66.
17. Tanabe, T. & Wu, Z. S., Strain softening under bi-axial tension and compres- sion. IABSE Colloq. Rep., 62 (1991) 623-36.
18. Schickert, G. & Winkler, H., Results of tests concerning strength and strain of concrete subjected to multiaxial compressive stresses. Report No. 46, Bundesanstalt ffir Material, Berlin, 1977.
19. Galambos, T. V. (ed.), Guide to Stability Design Criteria Jor Metal Structure,~, 4th edn. John Wiley & Sons, New York, 1988.
20. Ozawa, K., Maekawa, K., Kunishima, M. & Okamura, H., High performance concrete based on the durability design of concrete structures. Proc. 2nd East Asia Pacific Conference on Structural Engineering and Construction, Chiang Mai, Thailand, 1989.
Strength analysis of concrete-filled thin-walled steel box columns 281
21. Bradfield, C. D., An evaluation of the elastic-plastic analysis of steel plates loaded by uniaxial in-plane compression. Int. J. Mech. Sci., 24(3) (1982) 127 46.
22. Japan Society of Highway Bridges (JSHB), Specifications for the Design of Highway Bridges, 1990 (in Japanese).
23. Fukumoto, Y. (ed.), Guidelines for Stability Design of Steel Structures. Japan Society of Civil Engineering, 1987 (in Japanese).
24. Usami, T. & Fukumoto, Y., Deformation analysis of locally buckled steel compression members. J. Construct. Steel Res., 13 (1989) 111-35.
25. Nakai, H., Kitada, T. & Yoshikawa, O., A design method of steel plate elements in concrete filled square steel tubular columns. Proc. JSCE, No. 356 (I-3) (1985) 405-13 (in Japanese).


![[CIDECT DG5] -- Design Guide for Concrete Filled Hollow Section Columns Under Static and Seismic Loading](https://img.pdfslide.us/doc/110x75/55720cfb497959fc0b8c516d/cidect-dg5-design-guide-for-concrete-filled-hollow-section-columns-under-static-and-seismic-loading.jpg)

![STUDY ON THE EFFECT OF SPACERS ON THE ULTIMATE …ijstc.shirazu.ac.ir/article_1863_e16fc189512fa66834b0670038afaa2d… · walled lipped-channel section columns. Kwon and Hancock [4]](https://img.pdfslide.us/doc/110x75/60178eb02e825c04db3655b8/study-on-the-effect-of-spacers-on-the-ultimate-ijstc-walled-lipped-channel-section.jpg)