Embed Size (px)
Citation preview
Master’s DissertationStructural
Mechanics
REGINA HERMELIN
STRENGTH ANALYSESOF WOODEN I-BEAMSWITH A HOLE IN THE WEB

Detta är en tom sida!
Copyright © 2006 by Structural Mechanics, LTH, Sweden.Printed by KFS I Lund AB, Lund, Sweden, February, 2006.
For information, address:
Division of Structural Mechanics, LTH, Lund University, Box 118, SE-221 00 Lund, Sweden.Homepage: http://www.byggmek.lth.se
Structural Mechanics
Master’s Dissertation by
Regina Hermelin
Supervisors:
Per Johan Gustafsson and Erik Serrano,Div. of Structural Mechanics
ISRN LUTVDG/TVSM--06/5138--SE (1-74)ISSN 0281-6679
STRENGTH ANALYSES
OF WOODEN I-BEAMS
WITH A HOLE IN THE WEB

Detta är en tom sida!
Acknowledgements
The work presented in this master’s thesis was carried out during the autumn andwinter 2005/2006 at the Division of Structural Mechanics at Lund Institute of Tech-nology in Sweden.
I would like to thank my supervisors Prof. Per Johan Gustafsson and Dr. ErikSerrano, for sacrificing their time, for valuable discussions and for their guidancethroughout the work with this thesis.
Lund, January 2006
Regina Hermelin
iii

Detta är en tom sida!
Abstract
Wood-based light-weight I-beams are today widely used in the construction industry.An important feature of these beams is that the user can make holes in the webwhere needed. Today there is no general method used to calculate the reducedstrength of these beams with a hole in the web. The calculation methods varybetween the manufacturers and are commonly based on empirical results. The aimof this master’s thesis was to create finite element models of this type of beamsand with these investigate the stress distribution in beams with holes in the web,where a crack would likely occur and in what direction it will grow. The aim wasfurthermore to calculate the shear force capacity for beams with holes by use ofdifferent models based on fracture mechanics theory, as well as investigate howchanges in the material properties influence the shear force capacity, and finally toevaluate the currently used calculation methods and suggest improvements or a newmethod.
Calculations showing the location of the most stressed point and the orientationof the principal stresses in an area surrounding this point were performed for anumber of load cases. For load cases dominated by shear force the results indicateddiagonal cracking in 45◦ direction. The load cases with pure normal or momentloading indicated fracture in the upper or lower edge of the hole. Furthermore, thecalculated stresses indicated that a crack would both initiate and continue to growalong an approximately straight line perpendicular to the edge of the hole.
Three methods based on fracture mechanics were used in the finite elementcalculations of the shear force capacity; the point stress criterion, the mean stresscriterion and the initial crack criterion. The calculated shear force capacity fromthese methods was compared to the shear force capacity gained in a previouslyperformed test study. In this study 11 beam geometries were tested, and to be ableto compare the calculations, the same geometries and load cases were used in thepresent study. The results show that the mean stress criterion and the initial crackcriterion are suitable for shear force capacity calculations for beams with holes inthe web. The point stress criterion severely underestimated the shear force capacityfor some beams. The calculation method used by the manufacturers Swelite andForestia was evaluated by comparing the results from the test study with the resultsfrom using this method. This comparison showed that this method overestimatedthe real shear force capacity for one beam. A new calculation method can be basedon the mean stress criterion, since this method gave values well corresponding tothe results from the test study and since this is a fairly easy method to use.
v

Detta är en tom sida!
Sammanfattning
Trabaserade lattbalkar ar idag vanligt forekommande i byggnadsindustrin. En viktigegenskap hos dessa balkar ar att anvandaren kan gora hal i livet dar det behovs,for installationer eller liknande. Idag finns det dock ingen allmant anvand metod foratt berakna den reducerade tvarkraftskapaciteten for dessa balkar med hal i livet.Berakningsmetoderna varierar mellan de olika tillverkarna och ar vanligtvis baseradepa empiriska resultat. Syftet med detta examensarbete var att skapa finita element-modeller av denna typ av balk och med dessa undersoka spanningsfordelningen ibalkar med hal i livet, samt var en spricka troligtvis uppkommer och i vilken riktningden sedan vaxer. Syftet var vidare att berakna tvarkraftskapaciteten for balkar medhal med hjalp av olika modeller baserade pa brottmekanik, samt att undersoka hurforandringar av de ingaende materialens egenskaper paverkar tvarkraftskapaciteten,och slutligen utvardera nuvarande berakningsmetoder samt foresla forbattringareller en ny metod.
Berakningar som visade laget for den mest anstrangda punkten och huvud-spanningarnas orientering i ett omrade runt denna punkt gjordes for ett antal olikalastfall. For lastfall dominerade av tvarkraft indikerade resultaten diagonal sprick-bildning i 45◦-riktning. Belastning med enbart normalkraft eller moment indikeradebrott i halets ovre eller undre kant. Beraknade spanningar indikerade vidare att enbrottspricka bade initieras och sedan fortsatter att propagera ungefar langs en raklinje vinkelratt mot halets kant.
Tre metoder baserade pa brottmekanik anvandes i finita elementberakningarnaav tvarkraftskapaciteten; punktspanningskriteriet, medelspanningskriteriet och ini-tialsprickakriteriet. Den beraknade tvarkraftskapaciteten fran dessa metoder jam-fordes med tvarkraftskapaciteten fran tidigare provningar av 11 olika balkgeometrier,och for att gora berakningarna jamforbara anvandes samma geometrier och lastfall idenna studie. Resultaten visade att medelspanningskriteriet och intialsprickakriteri-et ar lampliga for berakning av den reducerade tvarkraftskapaciteten hos balkar medhal i livet. Punktspanningskriteriet underskattade tvarkraftskapaciteten kraftigt fornagra balkar. Berakningsmetoden som anvands av de tva nordiska tillverkarna Sweliteoch Forestia utvarderades genom jamforelse mellan resultat fran provningarna ochresultat fran denna metod. Denna jamforelse visade att berakningsmetoden over-skattade den verkliga tvarkraftskapaciteten for en balk. En ny berakningsmetodforeslas baseras pa medelspanningskriteriet, da denna metod gav varden som valoverrensstamde med resultaten fran provningarna, samt da denna metod ar tamligenenkel att anvanda.
vii

Detta är en tom sida!
Contents
1 Introduction 11.1 Background . . . . . . . . . . . . . . . . . . . . . . . . . . . . . . . . 11.2 Objectives . . . . . . . . . . . . . . . . . . . . . . . . . . . . . . . . . 21.3 Limitations . . . . . . . . . . . . . . . . . . . . . . . . . . . . . . . . 21.4 Audience . . . . . . . . . . . . . . . . . . . . . . . . . . . . . . . . . . 31.5 Methodology . . . . . . . . . . . . . . . . . . . . . . . . . . . . . . . 31.6 Disposition . . . . . . . . . . . . . . . . . . . . . . . . . . . . . . . . 3
2 Theory 52.1 Wood-based light-weight I-beams . . . . . . . . . . . . . . . . . . . . 52.2 Current calculation methods . . . . . . . . . . . . . . . . . . . . . . . 6
2.2.1 FinnForest . . . . . . . . . . . . . . . . . . . . . . . . . . . . . 62.2.2 Swelite . . . . . . . . . . . . . . . . . . . . . . . . . . . . . . . 72.2.3 Forestia . . . . . . . . . . . . . . . . . . . . . . . . . . . . . . 8
2.3 Beam failure . . . . . . . . . . . . . . . . . . . . . . . . . . . . . . . . 82.4 Fracture Mechanics . . . . . . . . . . . . . . . . . . . . . . . . . . . . 9
2.4.1 The point stress criterion . . . . . . . . . . . . . . . . . . . . . 102.4.2 The mean stress criterion . . . . . . . . . . . . . . . . . . . . . 102.4.3 The initial crack criterion . . . . . . . . . . . . . . . . . . . . 12
2.5 Materials . . . . . . . . . . . . . . . . . . . . . . . . . . . . . . . . . 14
3 Stress distribution and crack location and orientation 173.1 The model . . . . . . . . . . . . . . . . . . . . . . . . . . . . . . . . . 173.2 Pure normal, shear and moment loading . . . . . . . . . . . . . . . . 19
3.2.1 Method . . . . . . . . . . . . . . . . . . . . . . . . . . . . . . 193.2.2 Results . . . . . . . . . . . . . . . . . . . . . . . . . . . . . . . 203.2.3 Discussion . . . . . . . . . . . . . . . . . . . . . . . . . . . . . 23
3.3 Combined load cases . . . . . . . . . . . . . . . . . . . . . . . . . . . 233.3.1 Method . . . . . . . . . . . . . . . . . . . . . . . . . . . . . . 233.3.2 Results . . . . . . . . . . . . . . . . . . . . . . . . . . . . . . . 24
3.4 Conclusions . . . . . . . . . . . . . . . . . . . . . . . . . . . . . . . . 27
ix
x CONTENTS
4 Beam strength calculations by means of three fracture criteria 294.1 Beam geometries . . . . . . . . . . . . . . . . . . . . . . . . . . . . . 294.2 Converting point load to shear force . . . . . . . . . . . . . . . . . . . 304.3 Summary of results from beam tests . . . . . . . . . . . . . . . . . . 314.4 Finite Element calculations . . . . . . . . . . . . . . . . . . . . . . . 314.5 Location and growth direction for cracks . . . . . . . . . . . . . . . . 324.6 The point stress criterion . . . . . . . . . . . . . . . . . . . . . . . . . 33
4.6.1 Method . . . . . . . . . . . . . . . . . . . . . . . . . . . . . . 334.6.2 Results . . . . . . . . . . . . . . . . . . . . . . . . . . . . . . . 33
4.7 The mean stress criterion . . . . . . . . . . . . . . . . . . . . . . . . . 344.7.1 Method . . . . . . . . . . . . . . . . . . . . . . . . . . . . . . 344.7.2 Results . . . . . . . . . . . . . . . . . . . . . . . . . . . . . . . 354.7.3 Discussion . . . . . . . . . . . . . . . . . . . . . . . . . . . . . 36
4.8 The initial crack criterion . . . . . . . . . . . . . . . . . . . . . . . . 374.8.1 Method . . . . . . . . . . . . . . . . . . . . . . . . . . . . . . 374.8.2 Results . . . . . . . . . . . . . . . . . . . . . . . . . . . . . . . 384.8.3 Discussion . . . . . . . . . . . . . . . . . . . . . . . . . . . . . 40
4.9 Cracks that do not fit into the web . . . . . . . . . . . . . . . . . . . 41
5 Evaluation and new calculation method 435.1 Evaluation of the calculation criteria . . . . . . . . . . . . . . . . . . 435.2 Evaluation of current calculation method . . . . . . . . . . . . . . . . 46
5.2.1 Method . . . . . . . . . . . . . . . . . . . . . . . . . . . . . . 465.2.2 Results . . . . . . . . . . . . . . . . . . . . . . . . . . . . . . . 465.2.3 Discussion . . . . . . . . . . . . . . . . . . . . . . . . . . . . . 47
5.3 Beam parameter study . . . . . . . . . . . . . . . . . . . . . . . . . . 485.3.1 Method . . . . . . . . . . . . . . . . . . . . . . . . . . . . . . 485.3.2 Results . . . . . . . . . . . . . . . . . . . . . . . . . . . . . . . 49
5.4 New approximate strength equation . . . . . . . . . . . . . . . . . . . 51
6 Conclusions 556.1 Concluding remarks . . . . . . . . . . . . . . . . . . . . . . . . . . . . 556.2 Future work . . . . . . . . . . . . . . . . . . . . . . . . . . . . . . . . 56
A Stress distribution in beams 59
B Mean stress plots 67
Chapter 1
Introduction
1.1 Background
Wood-based light-weight I-beams, also known as I-joists, are today widely used andaccepted in the construction industry around the world. The beams are mainly usedin floors, roofs and walls in residual buildings, and also to some extent in commercialconstructions [8]. There are a number of manufacturers of wood-based light-weightI-beams on the Nordic market, for example the Swedish manufacturer Swelite, theNorwegian Forestia and the Finnish FinnForest.
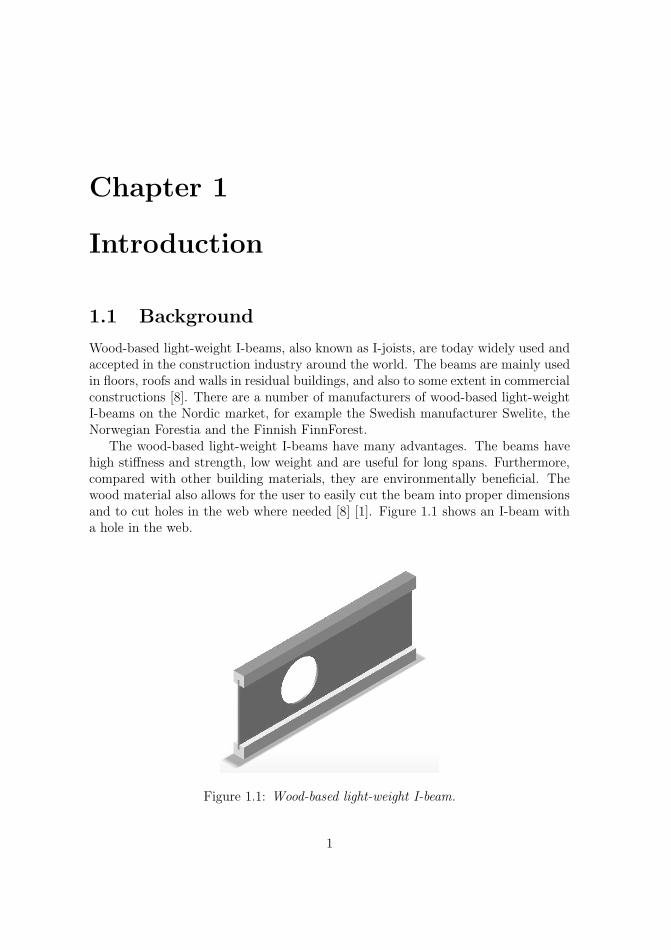
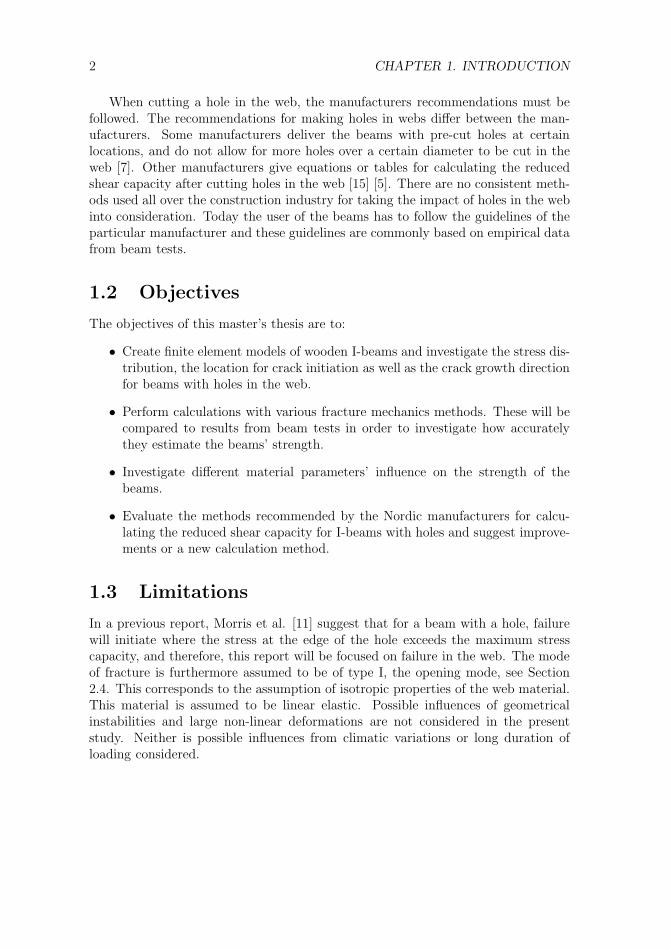
The wood-based light-weight I-beams have many advantages. The beams havehigh stiffness and strength, low weight and are useful for long spans. Furthermore,compared with other building materials, they are environmentally beneficial. Thewood material also allows for the user to easily cut the beam into proper dimensionsand to cut holes in the web where needed [8] [1]. Figure 1.1 shows an I-beam witha hole in the web.
Figure 1.1: Wood-based light-weight I-beam.
1
2 CHAPTER 1. INTRODUCTION
When cutting a hole in the web, the manufacturers recommendations must befollowed. The recommendations for making holes in webs differ between the man-ufacturers. Some manufacturers deliver the beams with pre-cut holes at certainlocations, and do not allow for more holes over a certain diameter to be cut in theweb [7]. Other manufacturers give equations or tables for calculating the reducedshear capacity after cutting holes in the web [15] [5]. There are no consistent meth-ods used all over the construction industry for taking the impact of holes in the webinto consideration. Today the user of the beams has to follow the guidelines of theparticular manufacturer and these guidelines are commonly based on empirical datafrom beam tests.
1.2 Objectives
The objectives of this master’s thesis are to:
• Create finite element models of wooden I-beams and investigate the stress dis-tribution, the location for crack initiation as well as the crack growth directionfor beams with holes in the web.
• Perform calculations with various fracture mechanics methods. These will becompared to results from beam tests in order to investigate how accuratelythey estimate the beams’ strength.
• Investigate different material parameters’ influence on the strength of thebeams.
• Evaluate the methods recommended by the Nordic manufacturers for calcu-lating the reduced shear capacity for I-beams with holes and suggest improve-ments or a new calculation method.
1.3 Limitations
In a previous report, Morris et al. [11] suggest that for a beam with a hole, failurewill initiate where the stress at the edge of the hole exceeds the maximum stresscapacity, and therefore, this report will be focused on failure in the web. The modeof fracture is furthermore assumed to be of type I, the opening mode, see Section2.4. This corresponds to the assumption of isotropic properties of the web material.This material is assumed to be linear elastic. Possible influences of geometricalinstabilities and large non-linear deformations are not considered in the presentstudy. Neither is possible influences from climatic variations or long duration ofloading considered.
1.4. AUDIENCE 3
1.4 Audience
To fully comprehend this thesis, some knowledge in structural mechanics, the finiteelement method and wood is required, but most important is a keen interest inwood-based building materials and their features.
1.5 Methodology
First the stress distribution and possible crack direction in beams with cut holeswere investigated by modeling beams with different hole diameters and applied loadcases in a finite element program. The program used was ABAQUS 6.5. The resultsfrom this investigation were used in the next step, where certain beams were modeledand analyzed with respect to strength. The beams analyzed had the same geome-try and type of loading as the beams tested in a previous experimental study [14].The calculations were performed for three different criteria, that were established bystudying fracture mechanics theories. The results from the calculations were evalu-ated and the influences from the material parameters were studied. The final taskwas to evaluate the calculation methods recommended by the Nordic manufacturersand suggest improvements or other calculation methods that would better describethe true shear force capacity for wooden I-beams with cut holes. The plots in thisthesis were made with MATLAB 7.0.4 and the report was written with LATEX2ε.
1.6 Disposition
Chapter 2 includes the theory used in this study. The current calculation methodsrecommended by the Nordic manufacturers are brought to attention, as well as thefracture mechanics theories and the material properties that will be used in thecalculations in the following chapters.
Chapter 3 is focused on the stress distribution and probable direction of crackgrowth in beams with holes. In this chapter finite element calculations are performedfor beams with three hole diameters and for a range of load cases.
Chapter 4 deals with calculations of the shear force capacity for different beamswith holes. These calculations were performed for three different criteria, that weredescribed in Chapter 2.
In Chapter 5 the results from the use of the three criteria are evaluated. An ad-ditional parameter study is conducted, where the focus is on the material propertiesand the effect changes of these have on the shear force capacity. This chapter alsoincludes an evaluation of the current calculation methods with respect to the resultsin Chapter 4 and suggestions for improving these calculation methods.
In Chapter 6 some conclusions are drawn and suggestions for future research aregiven.

Detta är en tom sida!
Chapter 2
Theory
2.1 Wood-based light-weight I-beams
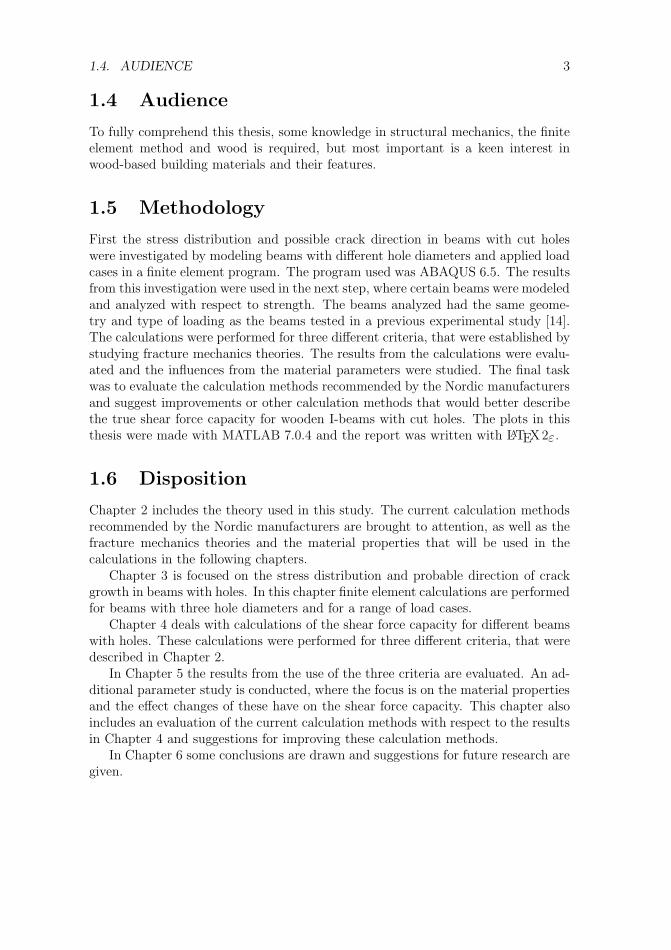
There are numerous manufacturers of wood-based light-weight I-beams, and theyoffer a range of web and flange materials and many different methods for calculatingthe shear capacity of beams with holes in the web. Georgia-Pacific produces anI-beam with a web made of Oriented Strand Board (OSB) with three pre-cut holes[7]. The Finnish manufacturer FinnForest produces an I-beam with a system ofpre-made holes (knock-outs) in the web with a diameter of 38 mm and a distancebetween the holes of 300 mm. The web is made of OSB-board and the flanges ofLaminated Veneer Lumber (LVL) [4]. The Swedish manufacturer Swelite producesa beam with a web made of 8 mm thick High Density Fibre Board (HDFB) andflanges made of solid wood [15]. The Norwegian manufacturer Forestia producesan I-beam with a web made of particle board and flanges made of solid wood [5].Figure 2.1 shows one of the light-weight wood-based I-beams that Swelite offers tothe market.
Figure 2.1: One of Swelite’s light-weight wood-based I-beams [9].
5
6 CHAPTER 2. THEORY
2.2 Current calculation methods
This master’s thesis will focus on the calculation methods suggested by the twoNordic manufacturers Swelite and Forestia. These two manufacturers do not providepre-cut holes in the beams, but equations to take the reduced capacity of beams withcut holes into consideration. The Finnish manufacturer FinnForest’s calculationmethod is not included, since this method is not comparable with those from Sweliteand Forestia. However, FinnForest’s calculation method will be brought to attentionand its comparability will be discussed in the following section.
2.2.1 FinnForest
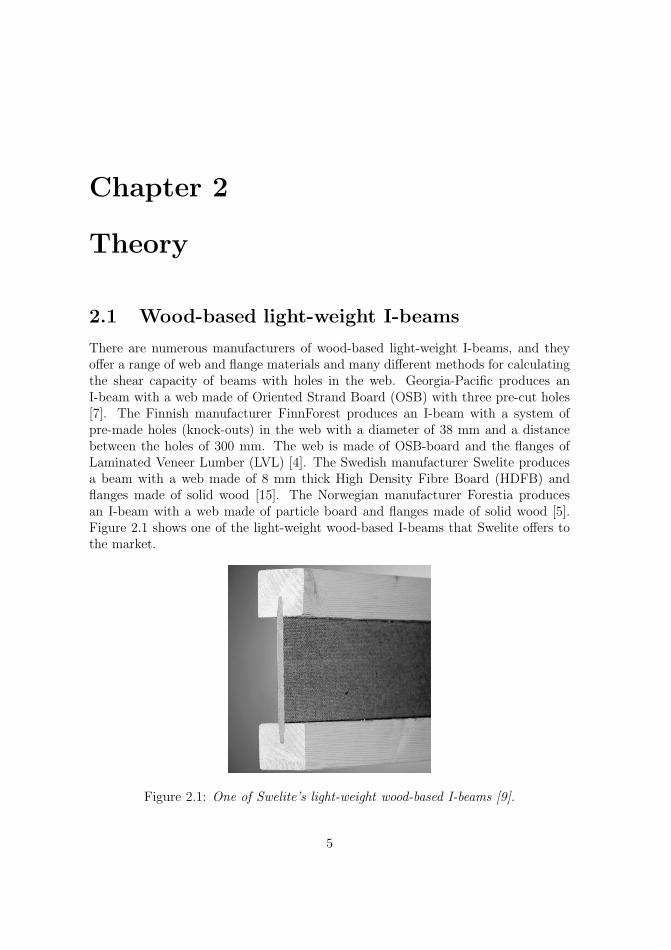
The Finnish manufacturer FinnForest produces an I-beam named Finnjoist I-joistthat is provided with knock-out holes of diameter 38 mm and a 300 mm spacingbetween the centers of these holes. Additional holes can be cut in the web if certainrestrictions are followed. The reduced characteristic shear force capacity Vk,hole isthen calculated with Equation 2.1 [4]. Figure 2.2 shows the cross-section of FinnjoistI-joist [4].
Figure 2.2: Cross-section of Finnjoist I-joist. Figure adopted from [4]
Vk,hole = 1.1kholeVk ≤ Vk (2.1)
where Vk is the characteristic shear capacity for the beam without the additionalhole. The reduction factor khole is calculated with Equation 2.2 [4].
khole =hw + hf − kshapehhole − 38k
hw,eff − 38, 0 ≤ khole ≤ 1 (2.2)
2.2. CURRENT CALCULATION METHODS 7
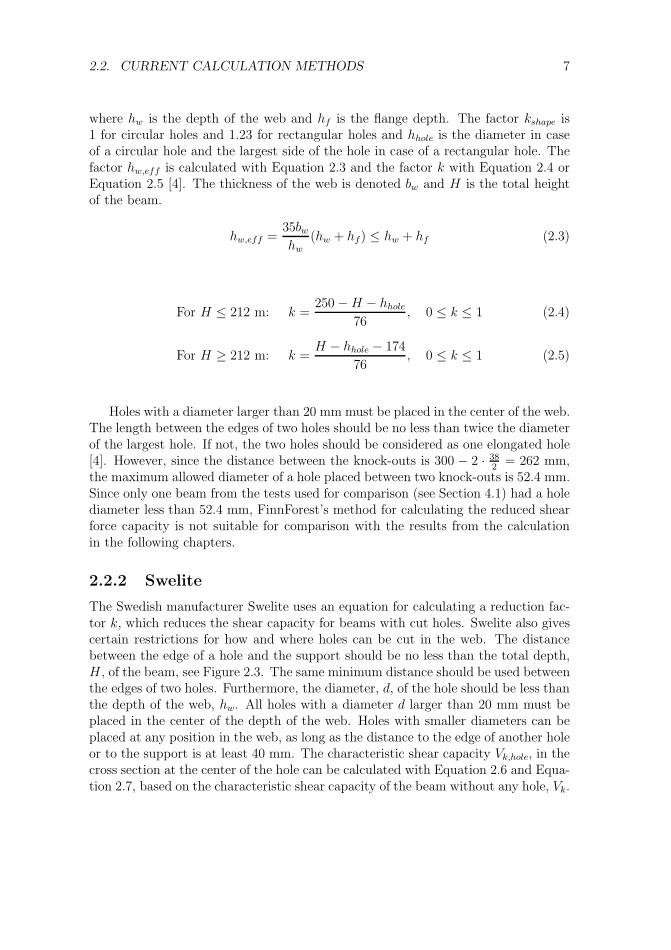
where hw is the depth of the web and hf is the flange depth. The factor kshape is1 for circular holes and 1.23 for rectangular holes and hhole is the diameter in caseof a circular hole and the largest side of the hole in case of a rectangular hole. Thefactor hw,eff is calculated with Equation 2.3 and the factor k with Equation 2.4 orEquation 2.5 [4]. The thickness of the web is denoted bw and H is the total heightof the beam.
hw,eff =35bw
hw
(hw + hf) ≤ hw + hf (2.3)
For H ≤ 212 m: k =250 − H − hhole
76, 0 ≤ k ≤ 1 (2.4)
For H ≥ 212 m: k =H − hhole − 174
76, 0 ≤ k ≤ 1 (2.5)
Holes with a diameter larger than 20 mm must be placed in the center of the web.The length between the edges of two holes should be no less than twice the diameterof the largest hole. If not, the two holes should be considered as one elongated hole[4]. However, since the distance between the knock-outs is 300 − 2 · 38
2= 262 mm,
the maximum allowed diameter of a hole placed between two knock-outs is 52.4 mm.Since only one beam from the tests used for comparison (see Section 4.1) had a holediameter less than 52.4 mm, FinnForest’s method for calculating the reduced shearforce capacity is not suitable for comparison with the results from the calculationin the following chapters.
2.2.2 Swelite
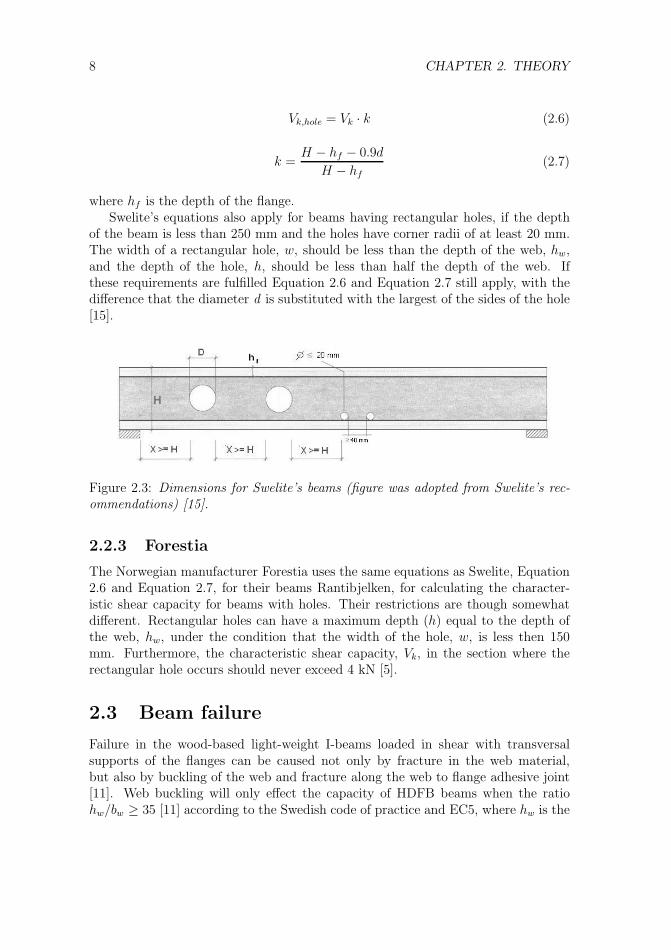
The Swedish manufacturer Swelite uses an equation for calculating a reduction fac-tor k, which reduces the shear capacity for beams with cut holes. Swelite also givescertain restrictions for how and where holes can be cut in the web. The distancebetween the edge of a hole and the support should be no less than the total depth,H , of the beam, see Figure 2.3. The same minimum distance should be used betweenthe edges of two holes. Furthermore, the diameter, d, of the hole should be less thanthe depth of the web, hw. All holes with a diameter d larger than 20 mm must beplaced in the center of the depth of the web. Holes with smaller diameters can beplaced at any position in the web, as long as the distance to the edge of another holeor to the support is at least 40 mm. The characteristic shear capacity Vk,hole, in thecross section at the center of the hole can be calculated with Equation 2.6 and Equa-tion 2.7, based on the characteristic shear capacity of the beam without any hole, Vk.
8 CHAPTER 2. THEORY
Vk,hole = Vk · k (2.6)
k =H − hf − 0.9d
H − hf
(2.7)
where hf is the depth of the flange.Swelite’s equations also apply for beams having rectangular holes, if the depth
of the beam is less than 250 mm and the holes have corner radii of at least 20 mm.The width of a rectangular hole, w, should be less than the depth of the web, hw,and the depth of the hole, h, should be less than half the depth of the web. Ifthese requirements are fulfilled Equation 2.6 and Equation 2.7 still apply, with thedifference that the diameter d is substituted with the largest of the sides of the hole[15].
Figure 2.3: Dimensions for Swelite’s beams (figure was adopted from Swelite’s rec-ommendations) [15].
2.2.3 Forestia
The Norwegian manufacturer Forestia uses the same equations as Swelite, Equation2.6 and Equation 2.7, for their beams Rantibjelken, for calculating the character-istic shear capacity for beams with holes. Their restrictions are though somewhatdifferent. Rectangular holes can have a maximum depth (h) equal to the depth ofthe web, hw, under the condition that the width of the hole, w, is less then 150mm. Furthermore, the characteristic shear capacity, Vk, in the section where therectangular hole occurs should never exceed 4 kN [5].
2.3 Beam failure
Failure in the wood-based light-weight I-beams loaded in shear with transversalsupports of the flanges can be caused not only by fracture in the web material,but also by buckling of the web and fracture along the web to flange adhesive joint[11]. Web buckling will only effect the capacity of HDFB beams when the ratiohw/bw ≥ 35 [11] according to the Swedish code of practice and EC5, where hw is the
2.4. FRACTURE MECHANICS 9
depth of the web and bw is the thickness of the web. With a web thickness of 8 mm,this results in a depth of the beam of at least 280 mm. Most beams used in thisstudy have a depth of 220 mm, (see Chapter 3 and Chapter 4 for further informationabout used beams) and therefore, buckling will not be investigated further. SinceMorris et al. in a previous report [11] suggest that failure in beams with holes willinitiate in the web, fracture along the web to flange adhesive joint will neither beinvestigated.
Additionally, failure in the web needs to be defined precisely. Previous beamtests [14] showed that beams with holes will have cracks running from the edge ofthe hole to the web to flange joint on both the upper and lower side of the hole, aftercomplete failure. This raises the question of how to define failure in the web. Shouldfailure be considered as crack growth on one side or on both sides of the hole? If acrack starts to grow in the weakest point at the edge of the hole, the area over whichto distribute the stresses on this side of the hole will be smaller. Thus, the stresseson the other side of the hole will increase and this can lead to crack initiation andgrowth on the other side of the hole. The increased magnitude of the stress on theother side of the hole results in a lower failure load needed for the second crack toinitiate. Thus, the initiation of the first crack in the weakest point will decrease thefailure load needed for initiation of the second crack on the other side of the hole,and therefore failure in the web will be defined as crack growth in the part with theweakest point throughout the rest of this master’s thesis.
2.4 Fracture Mechanics
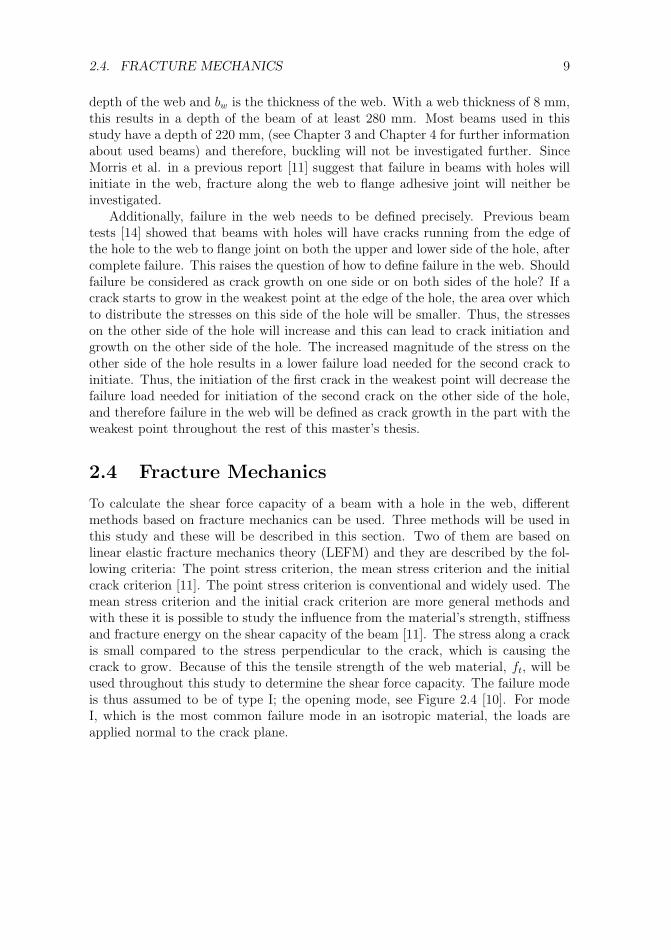
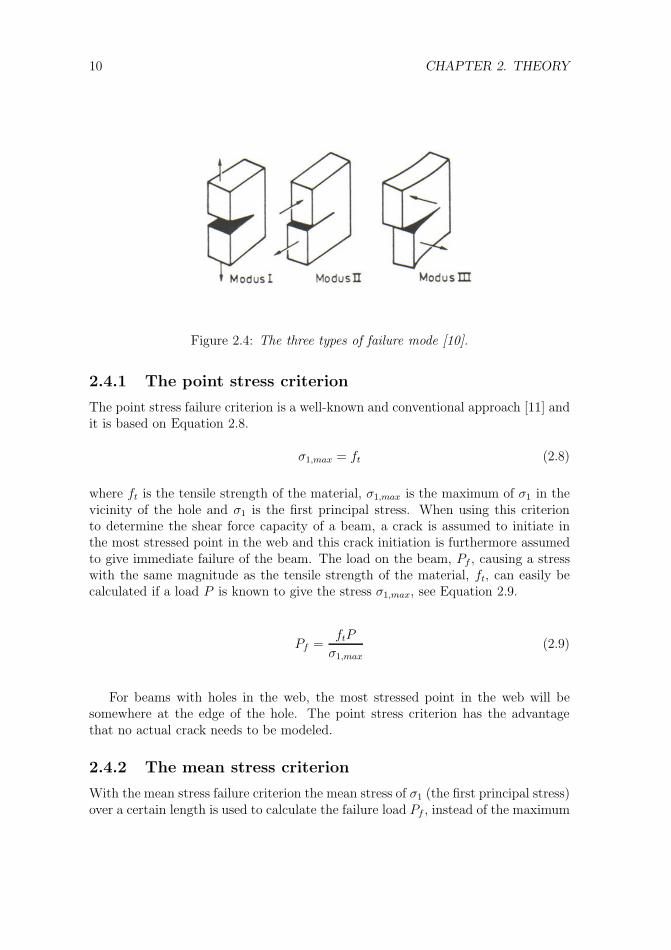
To calculate the shear force capacity of a beam with a hole in the web, differentmethods based on fracture mechanics can be used. Three methods will be used inthis study and these will be described in this section. Two of them are based onlinear elastic fracture mechanics theory (LEFM) and they are described by the fol-lowing criteria: The point stress criterion, the mean stress criterion and the initialcrack criterion [11]. The point stress criterion is conventional and widely used. Themean stress criterion and the initial crack criterion are more general methods andwith these it is possible to study the influence from the material’s strength, stiffnessand fracture energy on the shear capacity of the beam [11]. The stress along a crackis small compared to the stress perpendicular to the crack, which is causing thecrack to grow. Because of this the tensile strength of the web material, ft, will beused throughout this study to determine the shear force capacity. The failure modeis thus assumed to be of type I; the opening mode, see Figure 2.4 [10]. For modeI, which is the most common failure mode in an isotropic material, the loads areapplied normal to the crack plane.
10 CHAPTER 2. THEORY
Figure 2.4: The three types of failure mode [10].
2.4.1 The point stress criterion
The point stress failure criterion is a well-known and conventional approach [11] andit is based on Equation 2.8.
σ1,max = ft (2.8)
where ft is the tensile strength of the material, σ1,max is the maximum of σ1 in thevicinity of the hole and σ1 is the first principal stress. When using this criterionto determine the shear force capacity of a beam, a crack is assumed to initiate inthe most stressed point in the web and this crack initiation is furthermore assumedto give immediate failure of the beam. The load on the beam, Pf , causing a stresswith the same magnitude as the tensile strength of the material, ft, can easily becalculated if a load P is known to give the stress σ1,max, see Equation 2.9.
Pf =ftP
σ1,max
(2.9)
For beams with holes in the web, the most stressed point in the web will besomewhere at the edge of the hole. The point stress criterion has the advantagethat no actual crack needs to be modeled.
2.4.2 The mean stress criterion
With the mean stress failure criterion the mean stress of σ1 (the first principal stress)over a certain length is used to calculate the failure load Pf , instead of the maximum
2.4. FRACTURE MECHANICS 11
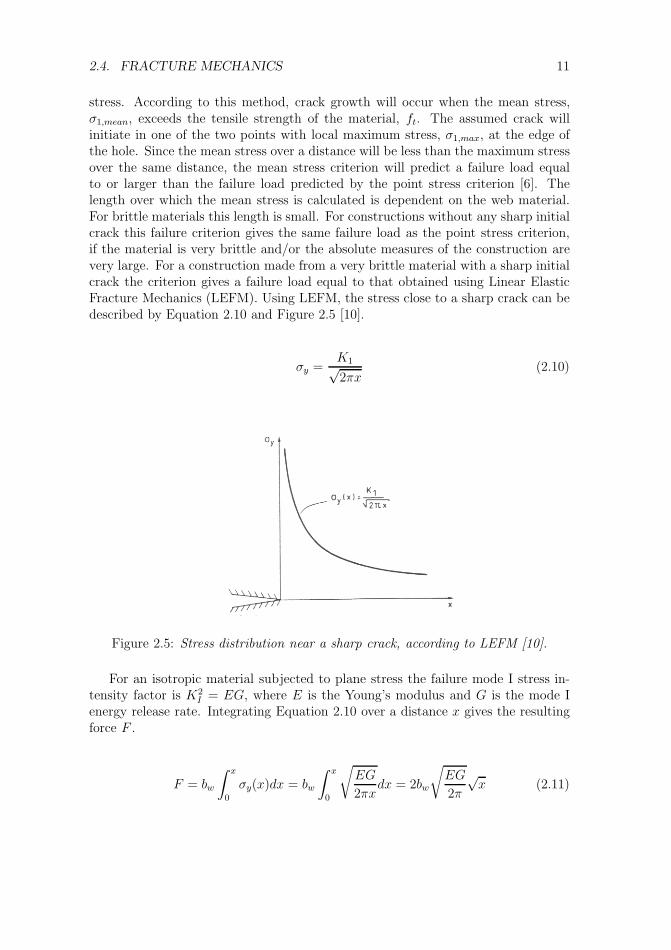
stress. According to this method, crack growth will occur when the mean stress,σ1,mean, exceeds the tensile strength of the material, ft. The assumed crack willinitiate in one of the two points with local maximum stress, σ1,max, at the edge ofthe hole. Since the mean stress over a distance will be less than the maximum stressover the same distance, the mean stress criterion will predict a failure load equalto or larger than the failure load predicted by the point stress criterion [6]. Thelength over which the mean stress is calculated is dependent on the web material.For brittle materials this length is small. For constructions without any sharp initialcrack this failure criterion gives the same failure load as the point stress criterion,if the material is very brittle and/or the absolute measures of the construction arevery large. For a construction made from a very brittle material with a sharp initialcrack the criterion gives a failure load equal to that obtained using Linear ElasticFracture Mechanics (LEFM). Using LEFM, the stress close to a sharp crack can bedescribed by Equation 2.10 and Figure 2.5 [10].
σy =K1√2πx
(2.10)
Figure 2.5: Stress distribution near a sharp crack, according to LEFM [10].
For an isotropic material subjected to plane stress the failure mode I stress in-tensity factor is K2
I = EG, where E is the Young’s modulus and G is the mode Ienergy release rate. Integrating Equation 2.10 over a distance x gives the resultingforce F .
F = bw
∫ x
0
σy(x)dx = bw
∫ x
0
√EG
2πxdx = 2bw
√EG
2π
√x (2.11)
12 CHAPTER 2. THEORY
where bw is the thickness of the web. The mean stress over the distance x canbe calculated with Equation 2.12.
σ1,mean =F
bwx=
√EG
2π
2√x
(2.12)
A specific length x0 is chosen so that the mean stress (σ1,mean) over this lengthequals the tensile strength ft of the material, and so that the energy release rate Gequals the fracture energy Gf . This gives Equation 2.13 [10].
ft =
√EGf
2π
2√x0
⇒ x0 =2
π
EGf
f 2t
(2.13)
After the mean stress over this length has been calculated, the failure load actingon the beam can be calculated with Equation 2.14.
Pf =ftP
σ1,mean
(2.14)
where P is the external load which by means of some stress calculation method, e g.the finite element method, is known to give the mean stress σ1,mean. This methodalso has the advantage that no crack needs to be modeled.
2.4.3 The initial crack criterion
With the initial crack criterion a crack in the beam is introduced, starting from thepoint of the maximum of the first principal stress, σ1,max, at the edge of the hole.The crack will have the initial length a0. The magnitude of a0 is derived so that thefailure load calculated from the initial crack criterion is the same as if calculatedwith LEFM for an infinite plate in a homogenous stress state. The stress intensityat the tip of the crack can be calculated with Equation 2.15 [6].
K1 = σ√
πa0 (2.15)
2.4. FRACTURE MECHANICS 13
Equation 2.15 is analogous with Equation 2.10 for the mean stress criterion. Byreplacing π in Equation 2.11 with π
2, and x with a0, the length a0 can be derived
in the same way as the derivation of x0. The magnitude of a0 will then be half themagnitude of x0 [6].
a0 =x0
2(2.16)
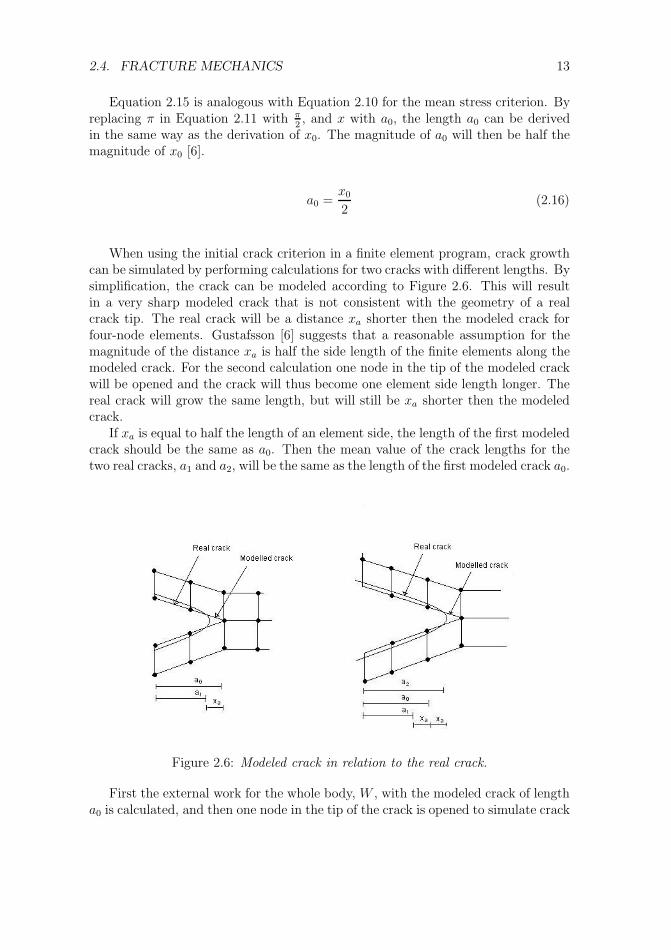
When using the initial crack criterion in a finite element program, crack growthcan be simulated by performing calculations for two cracks with different lengths. Bysimplification, the crack can be modeled according to Figure 2.6. This will resultin a very sharp modeled crack that is not consistent with the geometry of a realcrack tip. The real crack will be a distance xa shorter then the modeled crack forfour-node elements. Gustafsson [6] suggests that a reasonable assumption for themagnitude of the distance xa is half the side length of the finite elements along themodeled crack. For the second calculation one node in the tip of the modeled crackwill be opened and the crack will thus become one element side length longer. Thereal crack will grow the same length, but will still be xa shorter then the modeledcrack.
If xa is equal to half the length of an element side, the length of the first modeledcrack should be the same as a0. Then the mean value of the crack lengths for thetwo real cracks, a1 and a2, will be the same as the length of the first modeled crack a0.
Figure 2.6: Modeled crack in relation to the real crack.
First the external work for the whole body, W , with the modeled crack of lengtha0 is calculated, and then one node in the tip of the crack is opened to simulate crack
14 CHAPTER 2. THEORY
growth. The external work for the whole body is calculated with the new longercrack, a0 + 2xa. With the difference in external work for the two crack lengths andwith the magnitude of these lengths, the energy release rate G can be calculated.The energy release rate G during crack extension, mode I, when the beam is loadedwith a single load P can thus be expressed by Equation 2.17 [10].
G =P 2
2bw
∂C
∂a=
∂W
bw∂a(2.17)
where C is the compliance and ∂W∂a
for a = a0 is calculated with Equation 2.18.
∂W
∂a� ΔW
Δa=
W2 − W1
a0 + 2xa − a0
=W2 − W1
2xa
(2.18)
With the energy release rate G calculated for the load P , and the fracture energyGf , the failure load Pf for the beam can be calculated with Equation 2.19.
P 2f
P 2=
Gf
G⇒ Pf = P
√Gf
G(2.19)
2.5 Materials
The web material data used throughout this study is taken from a study by Morris etal. [11]. In this study the properties of the material used in beams manufactured byMasonite AB were examined. The web material was made from High Density FibreBoard (HDFB), in-plane isotropic, with a density ρ = 950 kg/m3. The thicknessof the board, bw, was 8 mm. From the material tests the average tensile strengthft = 30.0 MPa. Young’s modulus for the web E = 5748 MPa and Poisson’s ratiov = 0.2 [11].
The fracture energy, Gf , for the web material was also tested by Morris et al. Atesting procedure for determining the fracture energy for tension perpendicular tothe grain, (i. e. failure mode I, see Section 2.4) was used [12]. With this methoda test specimen with a saw cut is tested during three-point bending by applying aload at midpoint and having the specimen simply supported in both ends [12]. Thetotal work of fracture for two thicknesses, 40 mm and 80 mm, were calculated [11].A small size effect was found, consistent with a previous study by Persson et al.[13]. Persson et al. suggest that an extrapolated value to zero sample size can bea relevant value for the real fracture energy [13]. The mean value of the total work
2.5. MATERIALS 15
of fracture for the sample with thickness 40 mm was 3623 J/m2 and for the 80 mmsample 3752 J/m2. Thus, by extrapolation to 0 mm, the fracture energy Gf = 3494J/m2 [11].
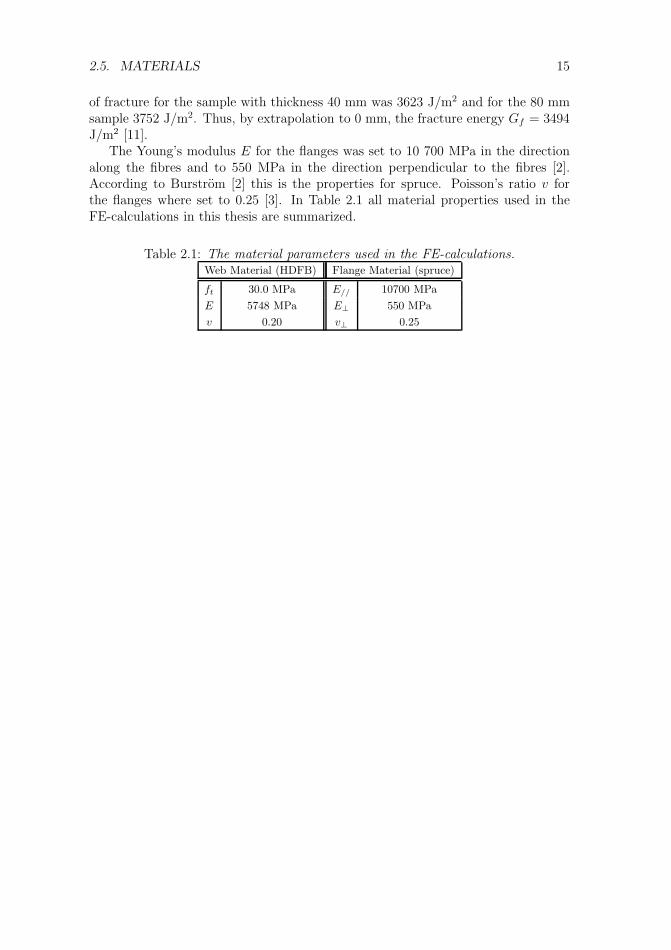
The Young’s modulus E for the flanges was set to 10 700 MPa in the directionalong the fibres and to 550 MPa in the direction perpendicular to the fibres [2].According to Burstrom [2] this is the properties for spruce. Poisson’s ratio v forthe flanges where set to 0.25 [3]. In Table 2.1 all material properties used in theFE-calculations in this thesis are summarized.
Table 2.1: The material parameters used in the FE-calculations.Web Material (HDFB) Flange Material (spruce)
ft 30.0 MPa E// 10700 MPaE 5748 MPa E⊥ 550 MPav 0.20 v⊥ 0.25

Detta är en tom sida!
Chapter 3
Stress distribution and cracklocation and orientation
This chapter deals with the distribution of stresses and the location and magnitudeof the first of the maximum principal stress (σ1,max) in I-beams with holes subjectedto pure normal, shear and moment cross section forces. Stress images are presentedto visualize how σ1,max is distributed in the beams for simple load cases. Somecalculations will also be presented for load combinations to examine what influencedifferent forces have on the total stress distribution in the beam. This will be usedwhen making assumptions on where a crack will initiate and in what direction itwill grow for different combined load cases.
3.1 The model
The geometrical model used to calculate the stress distribution had dimensionsaccording to Figure 3.1 below. The thickness of the web, bw, was set to 8 mm andthe thickness of the flanges, bf , to 47 mm. Swelite produces beams with this crosssection and Forestia’s Rantibjelken is also produced with the same cross section,except for the web thickness, which is 10 mm instead of 8 mm. The length of thebeam was set so that the influence from the concentrated loads applied in the endof the beam would not affect the stress distribution in the area around the hole.According to Swelite’s directives, the distance from the edge of a hole to a supportshould be no less then the depth of the beam, H [15]. Therefore, the total length ofthe beam models has been set to three times the depth of the beam. The calculationswere performed for three different hole diameters d: 40.0, 63.0 and 94.5 mm. Theholes were placed in the center of the beams during all calculations. The web andthe flanges were modeled with material properties according to Section 2.5.
The beam was modeled with two-dimensional plane stress elements in ABAQUS.The web was made isotropic and the flanges were given the elastic type lamina, sincethey were made of solid wood and hence, were orthotropic. To achieve boundaryconditions according to beam theory at the end of the beam and to enable simple
17
18 CHAPTER 3. STRESS DISTRIBUTION AND CRACK LOCATION...
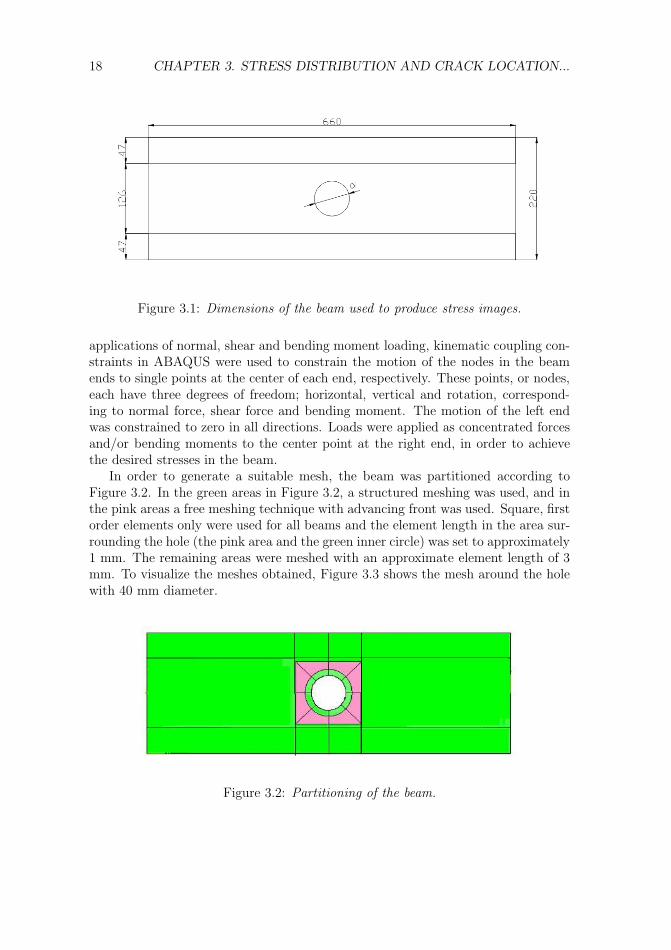
Figure 3.1: Dimensions of the beam used to produce stress images.
applications of normal, shear and bending moment loading, kinematic coupling con-straints in ABAQUS were used to constrain the motion of the nodes in the beamends to single points at the center of each end, respectively. These points, or nodes,each have three degrees of freedom; horizontal, vertical and rotation, correspond-ing to normal force, shear force and bending moment. The motion of the left endwas constrained to zero in all directions. Loads were applied as concentrated forcesand/or bending moments to the center point at the right end, in order to achievethe desired stresses in the beam.
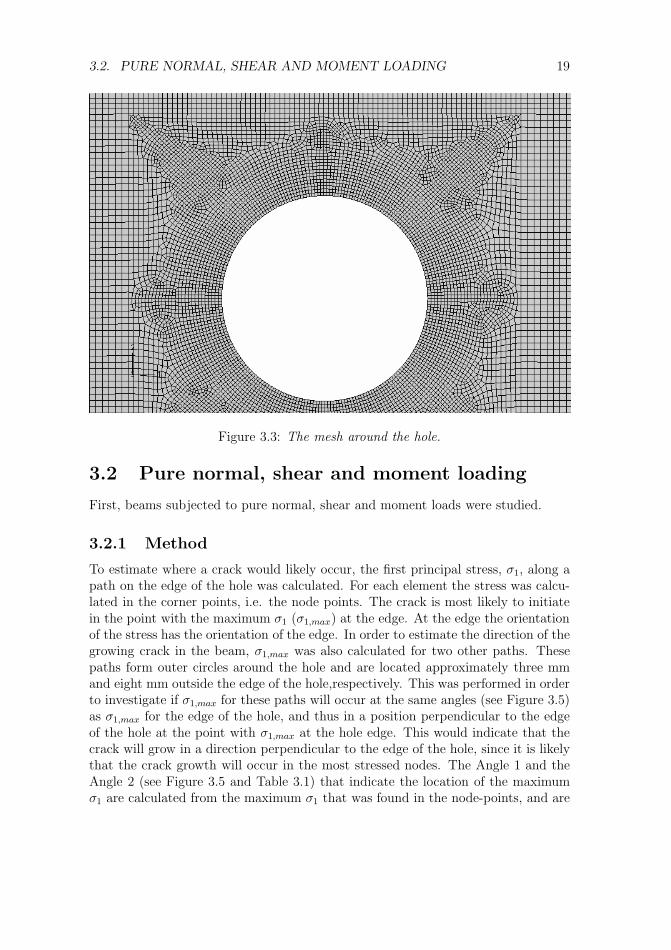
In order to generate a suitable mesh, the beam was partitioned according toFigure 3.2. In the green areas in Figure 3.2, a structured meshing was used, and inthe pink areas a free meshing technique with advancing front was used. Square, firstorder elements only were used for all beams and the element length in the area sur-rounding the hole (the pink area and the green inner circle) was set to approximately1 mm. The remaining areas were meshed with an approximate element length of 3mm. To visualize the meshes obtained, Figure 3.3 shows the mesh around the holewith 40 mm diameter.
Figure 3.2: Partitioning of the beam.
3.2. PURE NORMAL, SHEAR AND MOMENT LOADING 19
Figure 3.3: The mesh around the hole.
3.2 Pure normal, shear and moment loading
First, beams subjected to pure normal, shear and moment loads were studied.
3.2.1 Method
To estimate where a crack would likely occur, the first principal stress, σ1, along apath on the edge of the hole was calculated. For each element the stress was calcu-lated in the corner points, i.e. the node points. The crack is most likely to initiatein the point with the maximum σ1 (σ1,max) at the edge. At the edge the orientationof the stress has the orientation of the edge. In order to estimate the direction of thegrowing crack in the beam, σ1,max was also calculated for two other paths. Thesepaths form outer circles around the hole and are located approximately three mmand eight mm outside the edge of the hole,respectively. This was performed in orderto investigate if σ1,max for these paths will occur at the same angles (see Figure 3.5)as σ1,max for the edge of the hole, and thus in a position perpendicular to the edgeof the hole at the point with σ1,max at the hole edge. This would indicate that thecrack will grow in a direction perpendicular to the edge of the hole, since it is likelythat the crack growth will occur in the most stressed nodes. The Angle 1 and theAngle 2 (see Figure 3.5 and Table 3.1) that indicate the location of the maximumσ1 are calculated from the maximum σ1 that was found in the node-points, and are
20 CHAPTER 3. STRESS DISTRIBUTION AND CRACK LOCATION...
thus indicating the location of the node with the maximum σ1.All forces were applied at the right end of the beam. To achieve a pure normal
force loading in the beam, a normal load of magnitude 1 · 10−6 N was applied to theright end of the beam, pulling the beam horizontally. This was performed for thethree different hole diameters. The influence of shear loading was also examined forthe three hole diameters. To achieve pure shear force at the center of the hole, a shearforce and a moment were applied at the right end of the beam. The shear force had aload of magnitude 1 ·10−6 N. The moment was added to eliminate the moment effectcaused by positioning the shear force at the end of the beam instead of at the centerof the hole. This moment had a magnitude of V ·L/2 = 1 · 10−6 · 660/2 = 330 · 10−6
Nmm, where V is the shear force and L is the total length of the beam in mm. Toachieve stress caused by pure moment load, a moment load of magnitude 1·10−6 N inthe negative direction was applied at the right end of the beam. Note however, thatfor the calculations of Angle 1 and Angle 2 (see Figure 3.5) the absolute magnitudeof the forces is irrelevant for the results, while the ratios are of importance.
3.2.2 Results
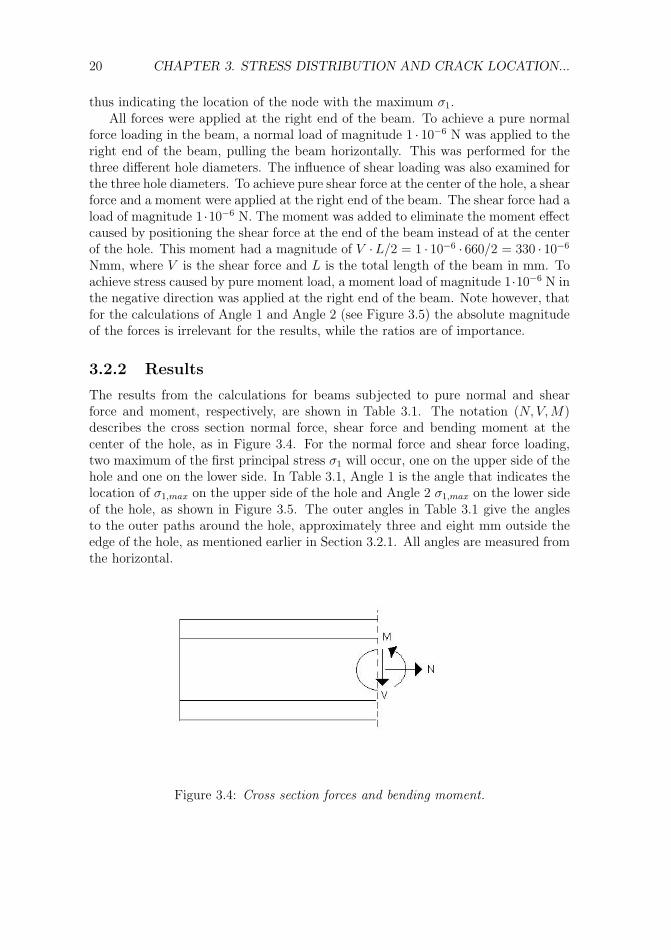
The results from the calculations for beams subjected to pure normal and shearforce and moment, respectively, are shown in Table 3.1. The notation (N, V,M)describes the cross section normal force, shear force and bending moment at thecenter of the hole, as in Figure 3.4. For the normal force and shear force loading,two maximum of the first principal stress σ1 will occur, one on the upper side of thehole and one on the lower side. In Table 3.1, Angle 1 is the angle that indicates thelocation of σ1,max on the upper side of the hole and Angle 2 σ1,max on the lower sideof the hole, as shown in Figure 3.5. The outer angles in Table 3.1 give the anglesto the outer paths around the hole, approximately three and eight mm outside theedge of the hole, as mentioned earlier in Section 3.2.1. All angles are measured fromthe horizontal.
Figure 3.4: Cross section forces and bending moment.
3.2. PURE NORMAL, SHEAR AND MOMENT LOADING 21
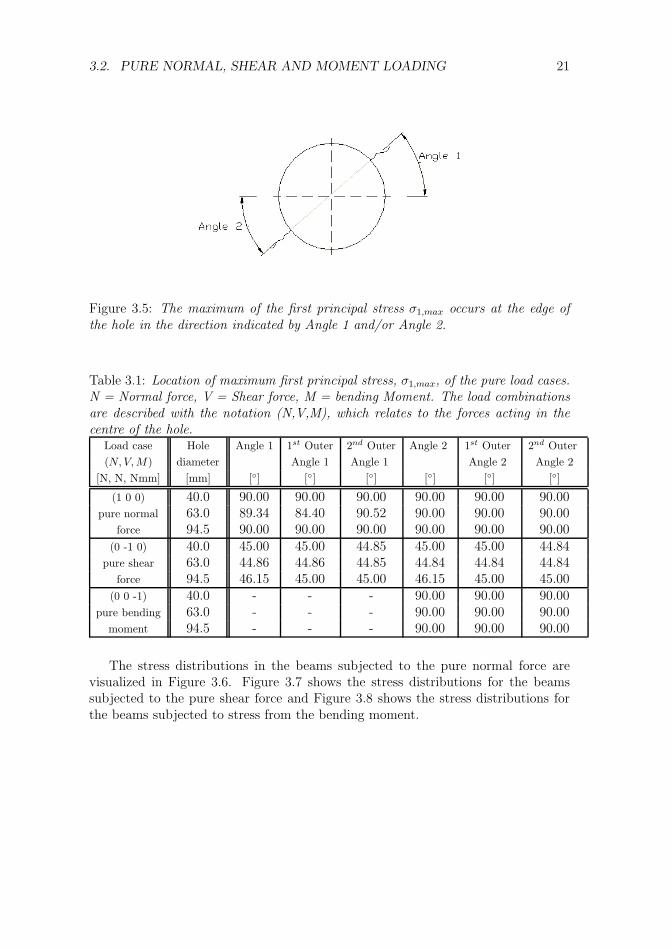
Figure 3.5: The maximum of the first principal stress σ1,max occurs at the edge ofthe hole in the direction indicated by Angle 1 and/or Angle 2.
Table 3.1: Location of maximum first principal stress, σ1,max, of the pure load cases.N = Normal force, V = Shear force, M = bending Moment. The load combinationsare described with the notation (N,V,M), which relates to the forces acting in thecentre of the hole.
Load case Hole Angle 1 1st Outer 2nd Outer Angle 2 1st Outer 2nd Outer(N, V, M) diameter Angle 1 Angle 1 Angle 2 Angle 2
[N, N, Nmm] [mm] [◦] [◦] [◦] [◦] [◦] [◦]
(1 0 0) 40.0 90.00 90.00 90.00 90.00 90.00 90.00pure normal 63.0 89.34 84.40 90.52 90.00 90.00 90.00
force 94.5 90.00 90.00 90.00 90.00 90.00 90.00
(0 -1 0) 40.0 45.00 45.00 44.85 45.00 45.00 44.84pure shear 63.0 44.86 44.86 44.85 44.84 44.84 44.84
force 94.5 46.15 45.00 45.00 46.15 45.00 45.00(0 0 -1) 40.0 - - - 90.00 90.00 90.00
pure bending 63.0 - - - 90.00 90.00 90.00moment 94.5 - - - 90.00 90.00 90.00
The stress distributions in the beams subjected to the pure normal force arevisualized in Figure 3.6. Figure 3.7 shows the stress distributions for the beamssubjected to the pure shear force and Figure 3.8 shows the stress distributions forthe beams subjected to stress from the bending moment.
22 CHAPTER 3. STRESS DISTRIBUTION AND CRACK LOCATION...
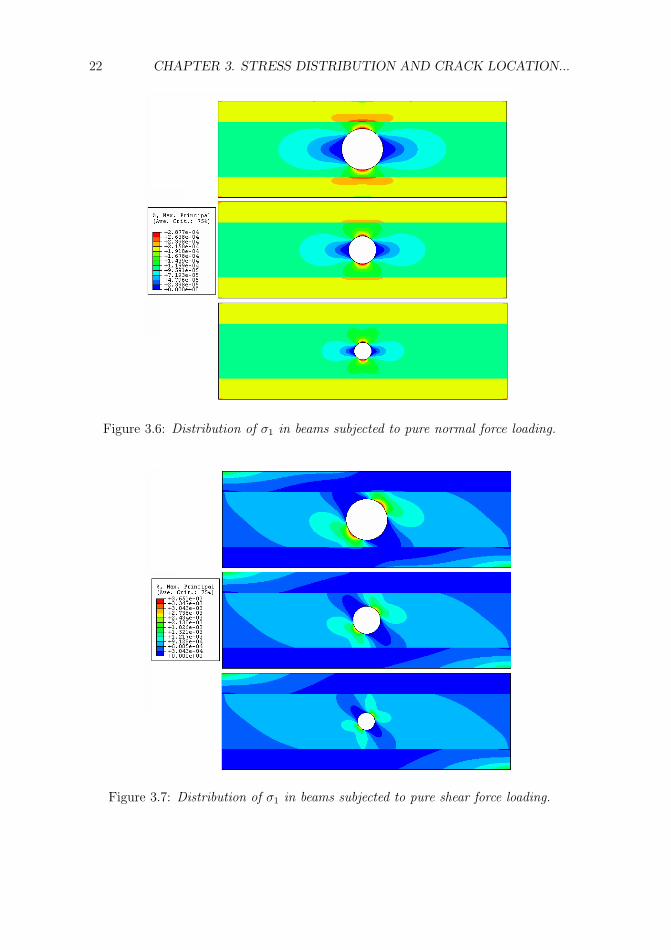
Figure 3.6: Distribution of σ1 in beams subjected to pure normal force loading.
Figure 3.7: Distribution of σ1 in beams subjected to pure shear force loading.
3.3. COMBINED LOAD CASES 23
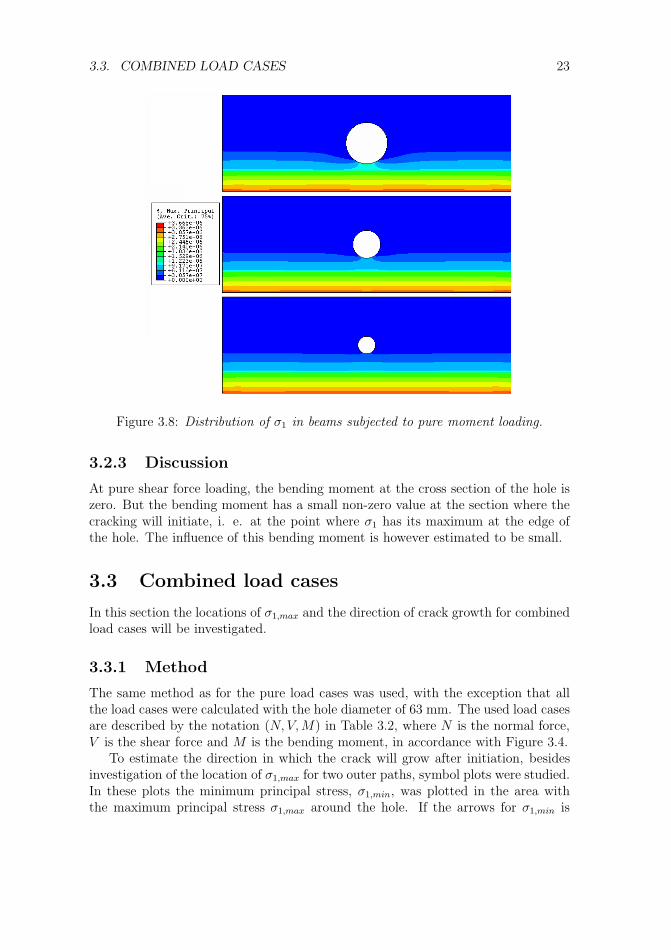
Figure 3.8: Distribution of σ1 in beams subjected to pure moment loading.
3.2.3 Discussion
At pure shear force loading, the bending moment at the cross section of the hole iszero. But the bending moment has a small non-zero value at the section where thecracking will initiate, i. e. at the point where σ1 has its maximum at the edge ofthe hole. The influence of this bending moment is however estimated to be small.
3.3 Combined load cases
In this section the locations of σ1,max and the direction of crack growth for combinedload cases will be investigated.
3.3.1 Method
The same method as for the pure load cases was used, with the exception that allthe load cases were calculated with the hole diameter of 63 mm. The used load casesare described by the notation (N, V,M) in Table 3.2, where N is the normal force,V is the shear force and M is the bending moment, in accordance with Figure 3.4.
To estimate the direction in which the crack will grow after initiation, besidesinvestigation of the location of σ1,max for two outer paths, symbol plots were studied.In these plots the minimum principal stress, σ1,min, was plotted in the area withthe maximum principal stress σ1,max around the hole. If the arrows for σ1,min is
24 CHAPTER 3. STRESS DISTRIBUTION AND CRACK LOCATION...
approximately in a straight line from the location of σ1,max at the hole edge to thelocation of σ1,max at the inner paths, the assumption that the crack will grow in thisdirection can be made. Crack growth will likely occur in the direction perpendicularto the maximum stress, hence, in the direction of the minimum stress.
3.3.2 Results
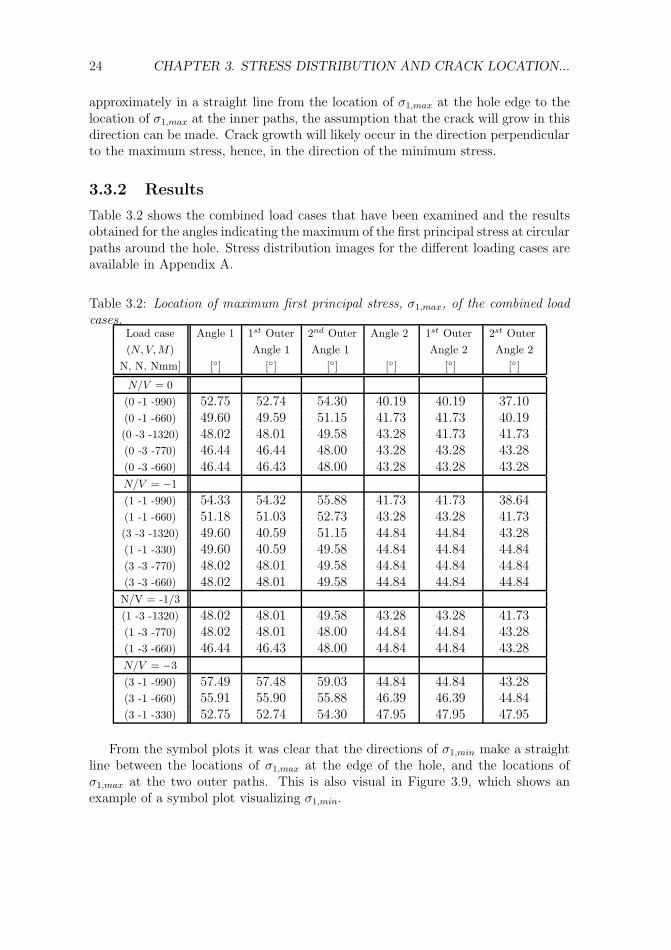
Table 3.2 shows the combined load cases that have been examined and the resultsobtained for the angles indicating the maximum of the first principal stress at circularpaths around the hole. Stress distribution images for the different loading cases areavailable in Appendix A.
Table 3.2: Location of maximum first principal stress, σ1,max, of the combined loadcases.
Load case Angle 1 1st Outer 2nd Outer Angle 2 1st Outer 2st Outer(N, V, M) Angle 1 Angle 1 Angle 2 Angle 2
N, N, Nmm] [◦] [◦] [◦] [◦] [◦] [◦]
N/V = 0(0 -1 -990) 52.75 52.74 54.30 40.19 40.19 37.10(0 -1 -660) 49.60 49.59 51.15 41.73 41.73 40.19(0 -3 -1320) 48.02 48.01 49.58 43.28 41.73 41.73(0 -3 -770) 46.44 46.44 48.00 43.28 43.28 43.28(0 -3 -660) 46.44 46.43 48.00 43.28 43.28 43.28N/V = −1(1 -1 -990) 54.33 54.32 55.88 41.73 41.73 38.64(1 -1 -660) 51.18 51.03 52.73 43.28 43.28 41.73(3 -3 -1320) 49.60 40.59 51.15 44.84 44.84 43.28(1 -1 -330) 49.60 40.59 49.58 44.84 44.84 44.84(3 -3 -770) 48.02 48.01 49.58 44.84 44.84 44.84(3 -3 -660) 48.02 48.01 49.58 44.84 44.84 44.84N/V = -1/3(1 -3 -1320) 48.02 48.01 49.58 43.28 43.28 41.73(1 -3 -770) 48.02 48.01 48.00 44.84 44.84 43.28(1 -3 -660) 46.44 46.43 48.00 44.84 44.84 43.28N/V = −3(3 -1 -990) 57.49 57.48 59.03 44.84 44.84 43.28(3 -1 -660) 55.91 55.90 55.88 46.39 46.39 44.84(3 -1 -330) 52.75 52.74 54.30 47.95 47.95 47.95
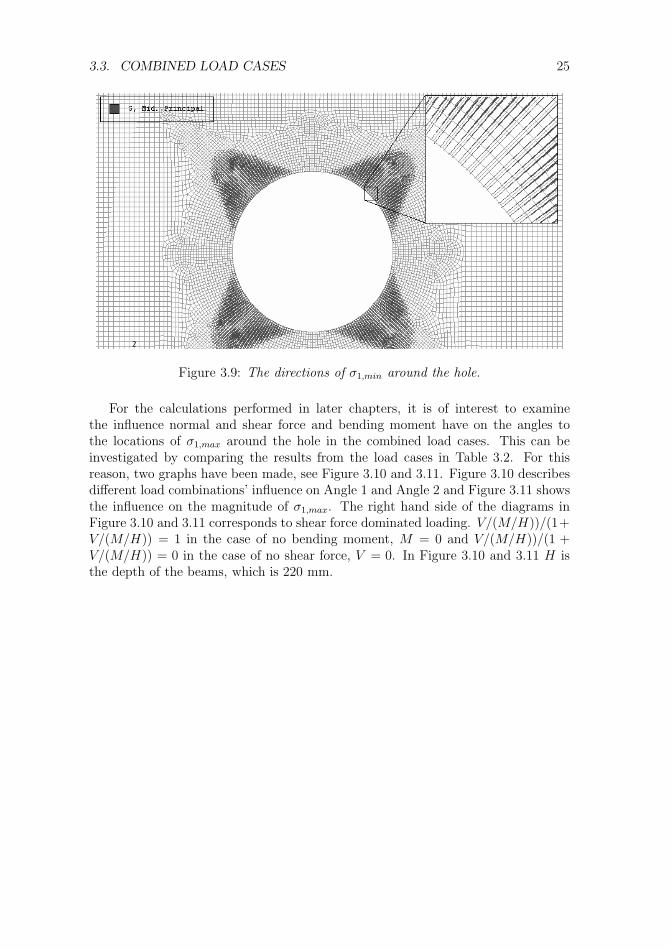
From the symbol plots it was clear that the directions of σ1,min make a straightline between the locations of σ1,max at the edge of the hole, and the locations ofσ1,max at the two outer paths. This is also visual in Figure 3.9, which shows anexample of a symbol plot visualizing σ1,min.
3.3. COMBINED LOAD CASES 25
Figure 3.9: The directions of σ1,min around the hole.
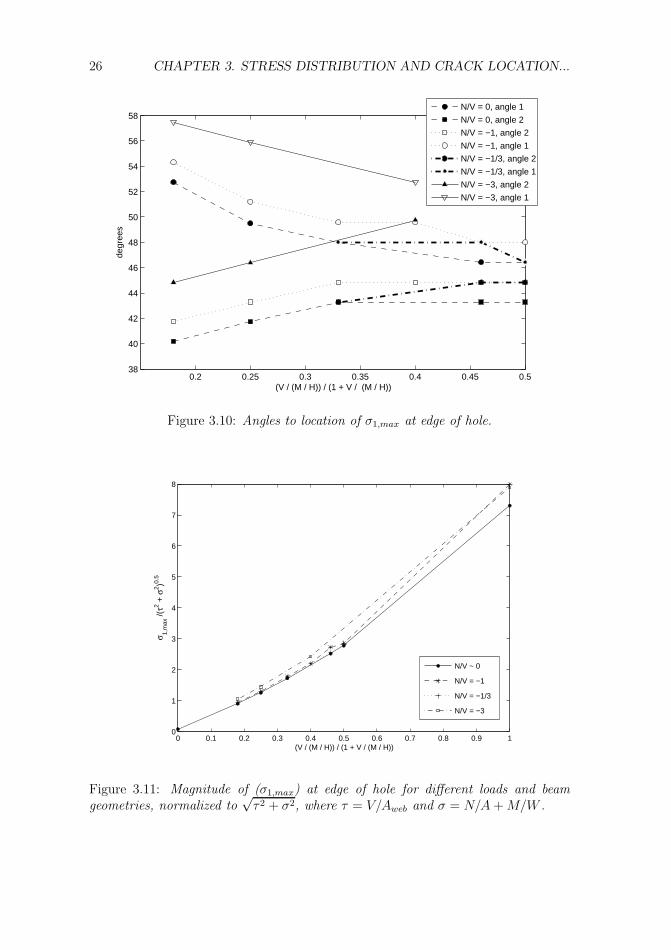
For the calculations performed in later chapters, it is of interest to examinethe influence normal and shear force and bending moment have on the angles tothe locations of σ1,max around the hole in the combined load cases. This can beinvestigated by comparing the results from the load cases in Table 3.2. For thisreason, two graphs have been made, see Figure 3.10 and 3.11. Figure 3.10 describesdifferent load combinations’ influence on Angle 1 and Angle 2 and Figure 3.11 showsthe influence on the magnitude of σ1,max. The right hand side of the diagrams inFigure 3.10 and 3.11 corresponds to shear force dominated loading. V/(M/H))/(1+V/(M/H)) = 1 in the case of no bending moment, M = 0 and V/(M/H))/(1 +V/(M/H)) = 0 in the case of no shear force, V = 0. In Figure 3.10 and 3.11 H isthe depth of the beams, which is 220 mm.
26 CHAPTER 3. STRESS DISTRIBUTION AND CRACK LOCATION...
0.2 0.25 0.3 0.35 0.4 0.45 0.538
40
42
44
46
48
50
52
54
56
58
(V / (M / H)) / (1 + V / (M / H))
degr
ees
N/V = 0, angle 1
N/V = 0, angle 2
N/V = −1, angle 2
N/V = −1, angle 1
N/V = −1/3, angle 2
N/V = −1/3, angle 1
N/V = −3, angle 2
N/V = −3, angle 1
Figure 3.10: Angles to location of σ1,max at edge of hole.
0 0.1 0.2 0.3 0.4 0.5 0.6 0.7 0.8 0.9 10
1
2
3
4
5
6
7
8
(V / (M / H)) / (1 + V / (M / H))
σ 1,m
ax /(
τ2 + σ
2 )0.5
N/V ~ 0
N/V = −1
N/V = −1/3
N/V = −3
Figure 3.11: Magnitude of (σ1,max) at edge of hole for different loads and beamgeometries, normalized to
√τ 2 + σ2, where τ = V/Aweb and σ = N/A + M/W .
3.4. CONCLUSIONS 27
3.4 Conclusions
The conclusions that can be drawn from the calculations in this chapter are, firstof all, that the location of the maximum of the first principal stress, σ1,max, aroundthe hole can differ significantly from 45◦, depending on the load combination. In thecalculations in the later chapters, it is therefore necessary to examine the locationof σ1,max around the hole for each load case. Secondly, the angles to the locationsof σ1,max at the two outer paths differ very little from the angle at the edge of thehole. The differences occur because the maximum σ1 at the outer paths for some ofthe beams is located one or two nodes away along the path from the node that givesthe same angle as for σ1,max for the edge of the hole. The differences of the stressmagnitudes in the outer paths in the nodes indicated by Angle 1 or 2 and in thenodes indicated by Outer Angle 1 or 2, or Second Outer Angle 1 or 2, are small, andcan be considered insignificant to the total magnitudes of the stresses. From thisresult the conclusion can be drawn, that the angles to the location of σ1,max alongcircular paths around the hole are the same for the same load case, no matter if thepaths are right at the edge of the hole, or a few nodes from the edge. Furthermore,from the results in Table 3.2 and from the symbol plots investigated, the conclusionthat the crack will grow at an angle perpendicular to the edge of the hole, can bedrawn.

Detta är en tom sida!
Chapter 4
Beam strength calculations bymeans of three fracture criteria
The shear force capacities of beams with holes was calculated by use of the threefracture mechanics criteria that were defined in Chapter 2. The calculations wereperformed with the finite element method.
4.1 Beam geometries
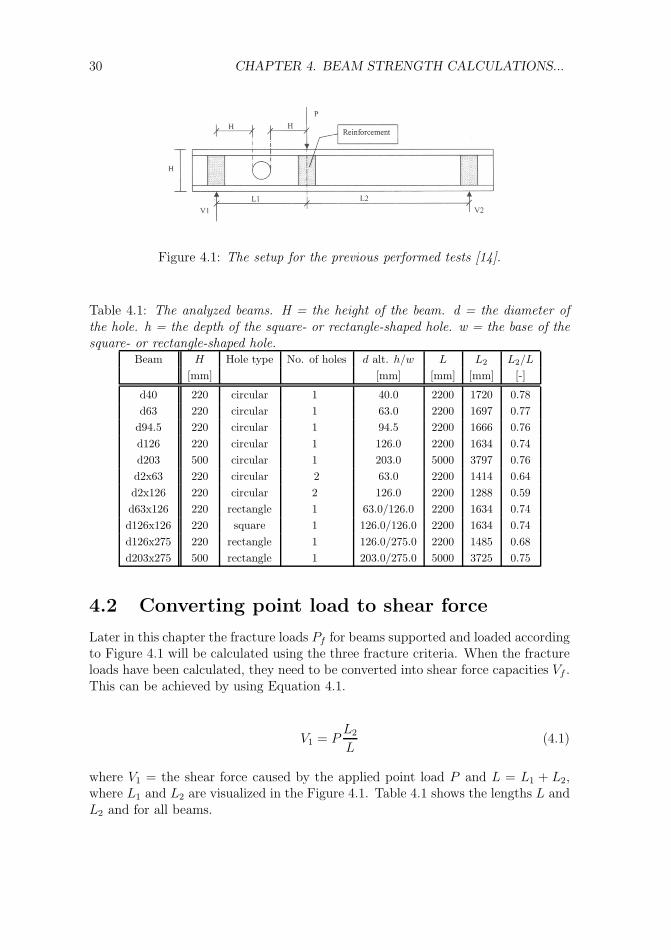
The calculations involved 11 differently shaped beams. The geometries of the mod-eled beams and the load situations that were analyzed were taken from a reportby Serrano [14], that contained results from laboratory tests of wooden I-beamsmanufactured by Swelite. By using the same geometries and load situations, theresults from the FE-calculations can be compared with the results from the tests.All beams except two had a depth H of 220 mm. These beams (d203 and d203x275)had instead a depth H of 500 mm. All beams had a web thickness, bw, of 8 mm, aflange thickness, bf , of 47 mm and a flange depth, hf , of 47 mm. The beams hada total length of 11H and the free span had a length of 10H. The distance fromthe edge of the hole to the left support was H mm as well as the distance betweenthe edges of the holes for the beams with two holes. For the square- and rectangle-shaped holes, the corners where cut with a radius of 20 mm. The types of holesused and their dimensions are included in Table 4.1, where L = L1 + L2. Figure 4.1shows the beam geometries and the test setup.
29
30 CHAPTER 4. BEAM STRENGTH CALCULATIONS...
Figure 4.1: The setup for the previous performed tests [14].
Table 4.1: The analyzed beams. H = the height of the beam. d = the diameter ofthe hole. h = the depth of the square- or rectangle-shaped hole. w = the base of thesquare- or rectangle-shaped hole.
Beam H Hole type No. of holes d alt. h/w L L2 L2/L
[mm] [mm] [mm] [mm] [-]
d40 220 circular 1 40.0 2200 1720 0.78d63 220 circular 1 63.0 2200 1697 0.77
d94.5 220 circular 1 94.5 2200 1666 0.76d126 220 circular 1 126.0 2200 1634 0.74d203 500 circular 1 203.0 5000 3797 0.76d2x63 220 circular 2 63.0 2200 1414 0.64d2x126 220 circular 2 126.0 2200 1288 0.59d63x126 220 rectangle 1 63.0/126.0 2200 1634 0.74d126x126 220 square 1 126.0/126.0 2200 1634 0.74d126x275 220 rectangle 1 126.0/275.0 2200 1485 0.68d203x275 500 rectangle 1 203.0/275.0 5000 3725 0.75
4.2 Converting point load to shear force
Later in this chapter the fracture loads Pf for beams supported and loaded accordingto Figure 4.1 will be calculated using the three fracture criteria. When the fractureloads have been calculated, they need to be converted into shear force capacities Vf .This can be achieved by using Equation 4.1.
V1 = PL2
L(4.1)
where V1 = the shear force caused by the applied point load P and L = L1 + L2,where L1 and L2 are visualized in the Figure 4.1. Table 4.1 shows the lengths L andL2 and for all beams.
4.3. SUMMARY OF RESULTS FROM BEAM TESTS 31
4.3 Summary of results from beam tests
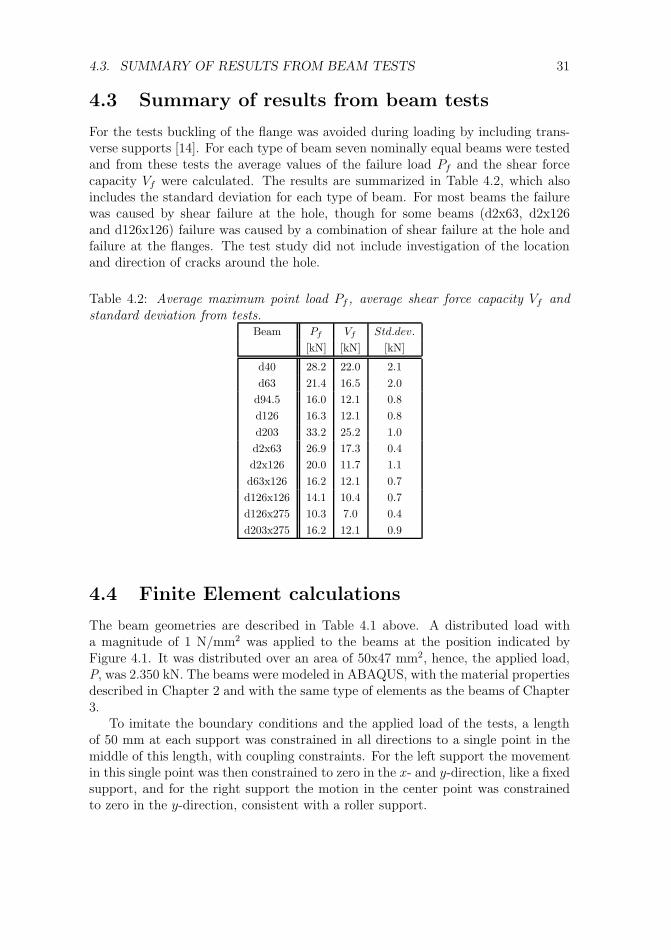
For the tests buckling of the flange was avoided during loading by including trans-verse supports [14]. For each type of beam seven nominally equal beams were testedand from these tests the average values of the failure load Pf and the shear forcecapacity Vf were calculated. The results are summarized in Table 4.2, which alsoincludes the standard deviation for each type of beam. For most beams the failurewas caused by shear failure at the hole, though for some beams (d2x63, d2x126and d126x126) failure was caused by a combination of shear failure at the hole andfailure at the flanges. The test study did not include investigation of the locationand direction of cracks around the hole.
Table 4.2: Average maximum point load Pf , average shear force capacity Vf andstandard deviation from tests.
Beam Pf Vf Std.dev.
[kN] [kN] [kN]
d40 28.2 22.0 2.1d63 21.4 16.5 2.0
d94.5 16.0 12.1 0.8d126 16.3 12.1 0.8d203 33.2 25.2 1.0d2x63 26.9 17.3 0.4d2x126 20.0 11.7 1.1d63x126 16.2 12.1 0.7d126x126 14.1 10.4 0.7d126x275 10.3 7.0 0.4d203x275 16.2 12.1 0.9
4.4 Finite Element calculations
The beam geometries are described in Table 4.1 above. A distributed load witha magnitude of 1 N/mm2 was applied to the beams at the position indicated byFigure 4.1. It was distributed over an area of 50x47 mm2, hence, the applied load,P, was 2.350 kN. The beams were modeled in ABAQUS, with the material propertiesdescribed in Chapter 2 and with the same type of elements as the beams of Chapter3.
To imitate the boundary conditions and the applied load of the tests, a lengthof 50 mm at each support was constrained in all directions to a single point in themiddle of this length, with coupling constraints. For the left support the movementin this single point was then constrained to zero in the x- and y-direction, like a fixedsupport, and for the right support the motion in the center point was constrainedto zero in the y-direction, consistent with a roller support.
32 CHAPTER 4. BEAM STRENGTH CALCULATIONS...
The beams were meshed in a similar manner as the beams in Chapter 3. Forthe beams with a hole diameter d equal to the total depth of the web hw, triangularelements were used in the area around the top and the bottom of the hole, wherethe web area was very small. The partitioning and the meshes were similar to thosein Figure 3.2 and 3.3.
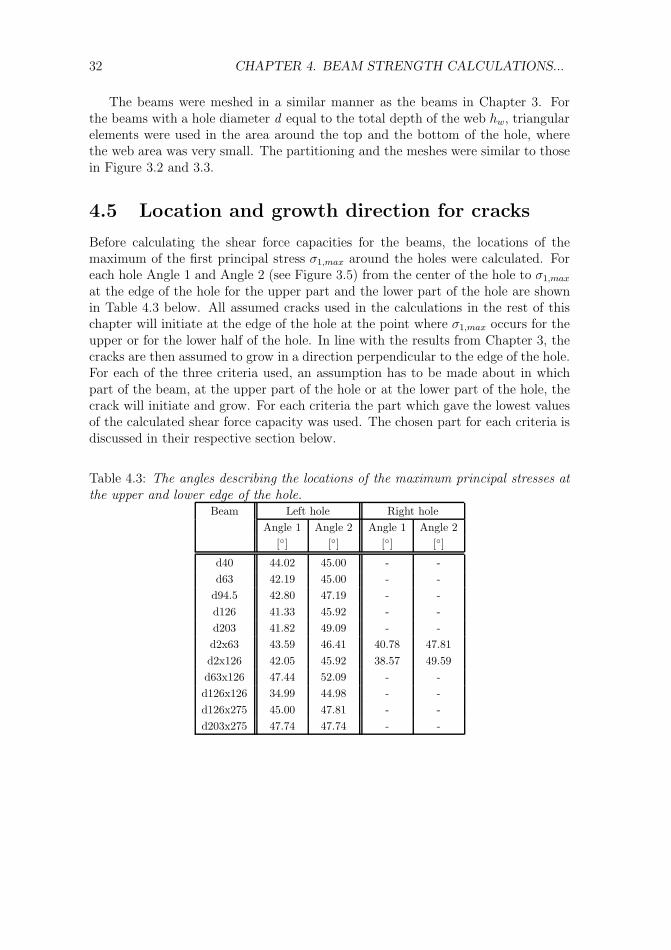
4.5 Location and growth direction for cracks
Before calculating the shear force capacities for the beams, the locations of themaximum of the first principal stress σ1,max around the holes were calculated. Foreach hole Angle 1 and Angle 2 (see Figure 3.5) from the center of the hole to σ1,max
at the edge of the hole for the upper part and the lower part of the hole are shownin Table 4.3 below. All assumed cracks used in the calculations in the rest of thischapter will initiate at the edge of the hole at the point where σ1,max occurs for theupper or for the lower half of the hole. In line with the results from Chapter 3, thecracks are then assumed to grow in a direction perpendicular to the edge of the hole.For each of the three criteria used, an assumption has to be made about in whichpart of the beam, at the upper part of the hole or at the lower part of the hole, thecrack will initiate and grow. For each criteria the part which gave the lowest valuesof the calculated shear force capacity was used. The chosen part for each criteria isdiscussed in their respective section below.
Table 4.3: The angles describing the locations of the maximum principal stresses atthe upper and lower edge of the hole.
Beam Left hole Right holeAngle 1 Angle 2 Angle 1 Angle 2
[◦] [◦] [◦] [◦]
d40 44.02 45.00 - -d63 42.19 45.00 - -
d94.5 42.80 47.19 - -d126 41.33 45.92 - -d203 41.82 49.09 - -d2x63 43.59 46.41 40.78 47.81d2x126 42.05 45.92 38.57 49.59d63x126 47.44 52.09 - -d126x126 34.99 44.98 - -d126x275 45.00 47.81 - -d203x275 47.74 47.74 - -
4.6. THE POINT STRESS CRITERION 33
4.6 The point stress criterion
4.6.1 Method
The shear force capacity was calculated with the point stress criterion by use of thefailure criterion σ1,max = ft (see Section 2.4.1), where ft = 30.0 MPa (see Section2.5) and by determining the first principal stress σ1 in the nodes at the edge of thehole. The largest of these stresses, σ1,max were used to calculate the failure loads Pf
for the beams as mentioned in Chapter 2. From these failure loads the shear forcecapacities Vf for the beams could be calculated.
4.6.2 Results
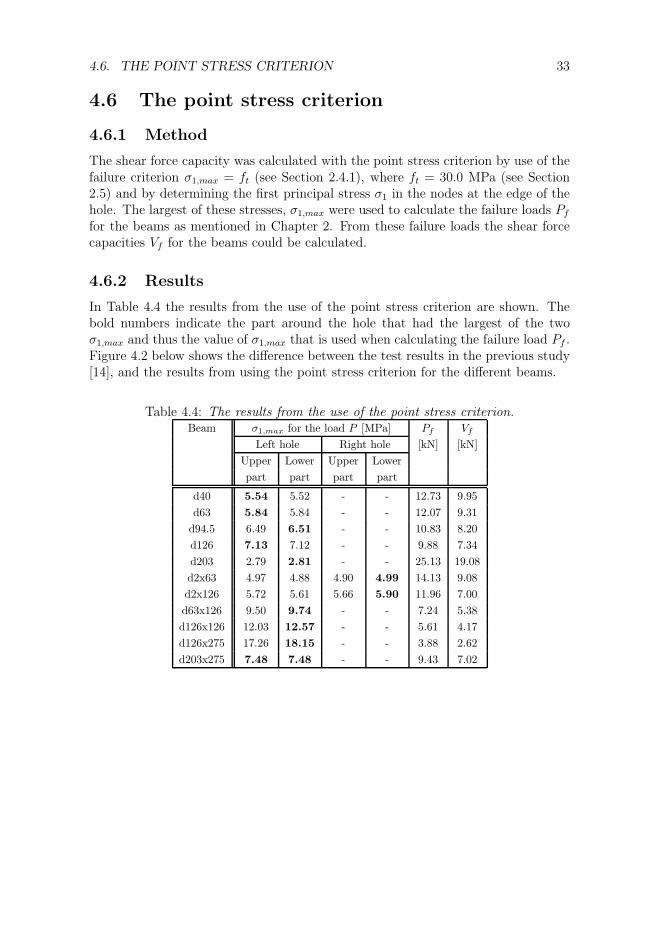
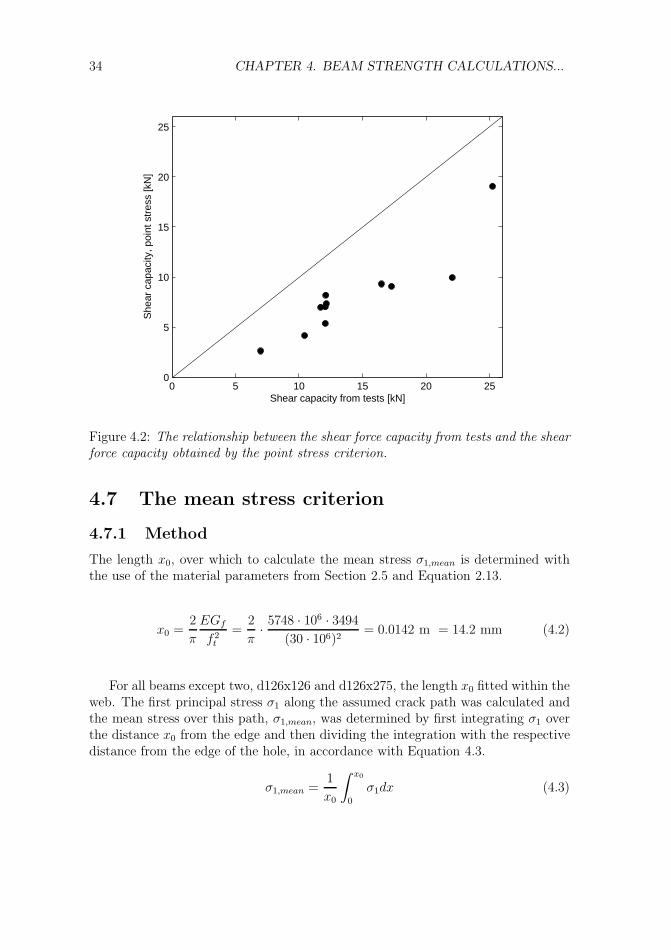
In Table 4.4 the results from the use of the point stress criterion are shown. Thebold numbers indicate the part around the hole that had the largest of the twoσ1,max and thus the value of σ1,max that is used when calculating the failure load Pf .Figure 4.2 below shows the difference between the test results in the previous study[14], and the results from using the point stress criterion for the different beams.
Table 4.4: The results from the use of the point stress criterion.Beam σ1,max for the load P [MPa] Pf Vf
Left hole Right hole [kN] [kN]Upper Lower Upper Lowerpart part part part
d40 5.54 5.52 - - 12.73 9.95d63 5.84 5.84 - - 12.07 9.31
d94.5 6.49 6.51 - - 10.83 8.20d126 7.13 7.12 - - 9.88 7.34d203 2.79 2.81 - - 25.13 19.08d2x63 4.97 4.88 4.90 4.99 14.13 9.08d2x126 5.72 5.61 5.66 5.90 11.96 7.00d63x126 9.50 9.74 - - 7.24 5.38d126x126 12.03 12.57 - - 5.61 4.17d126x275 17.26 18.15 - - 3.88 2.62d203x275 7.48 7.48 - - 9.43 7.02
34 CHAPTER 4. BEAM STRENGTH CALCULATIONS...
0 5 10 15 20 250
5
10
15
20
25
Shear capacity from tests [kN]
She
ar c
apac
ity, p
oint
str
ess
[kN
]
Figure 4.2: The relationship between the shear force capacity from tests and the shearforce capacity obtained by the point stress criterion.
4.7 The mean stress criterion
4.7.1 Method
The length x0, over which to calculate the mean stress σ1,mean is determined withthe use of the material parameters from Section 2.5 and Equation 2.13.
x0 =2
π
EGf
f 2t
=2
π· 5748 · 106 · 3494
(30 · 106)2= 0.0142 m = 14.2 mm (4.2)
For all beams except two, d126x126 and d126x275, the length x0 fitted within theweb. The first principal stress σ1 along the assumed crack path was calculated andthe mean stress over this path, σ1,mean, was determined by first integrating σ1 overthe distance x0 from the edge and then dividing the integration with the respectivedistance from the edge of the hole, in accordance with Equation 4.3.
σ1,mean =1
x0
∫ x0
0
σ1dx (4.3)
4.7. THE MEAN STRESS CRITERION 35
This mean stress is then used to calculate the failure load Pf in accordance withChapter 2. The failure load Pf is then converted into the shear force capacity Vf .Fracture occurs when σ1,mean = ft.
4.7.2 Results
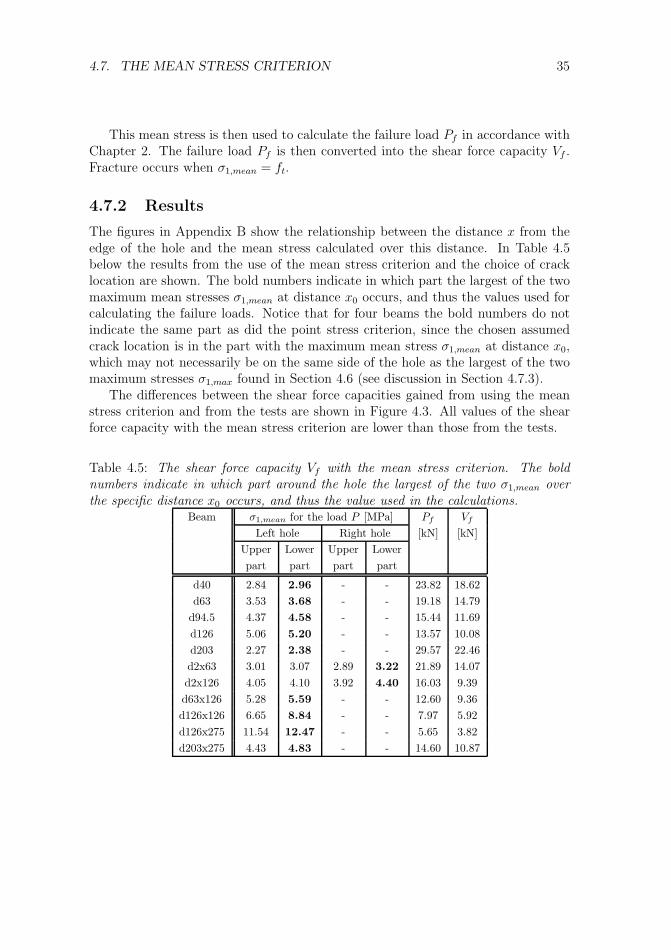
The figures in Appendix B show the relationship between the distance x from theedge of the hole and the mean stress calculated over this distance. In Table 4.5below the results from the use of the mean stress criterion and the choice of cracklocation are shown. The bold numbers indicate in which part the largest of the twomaximum mean stresses σ1,mean at distance x0 occurs, and thus the values used forcalculating the failure loads. Notice that for four beams the bold numbers do notindicate the same part as did the point stress criterion, since the chosen assumedcrack location is in the part with the maximum mean stress σ1,mean at distance x0,which may not necessarily be on the same side of the hole as the largest of the twomaximum stresses σ1,max found in Section 4.6 (see discussion in Section 4.7.3).
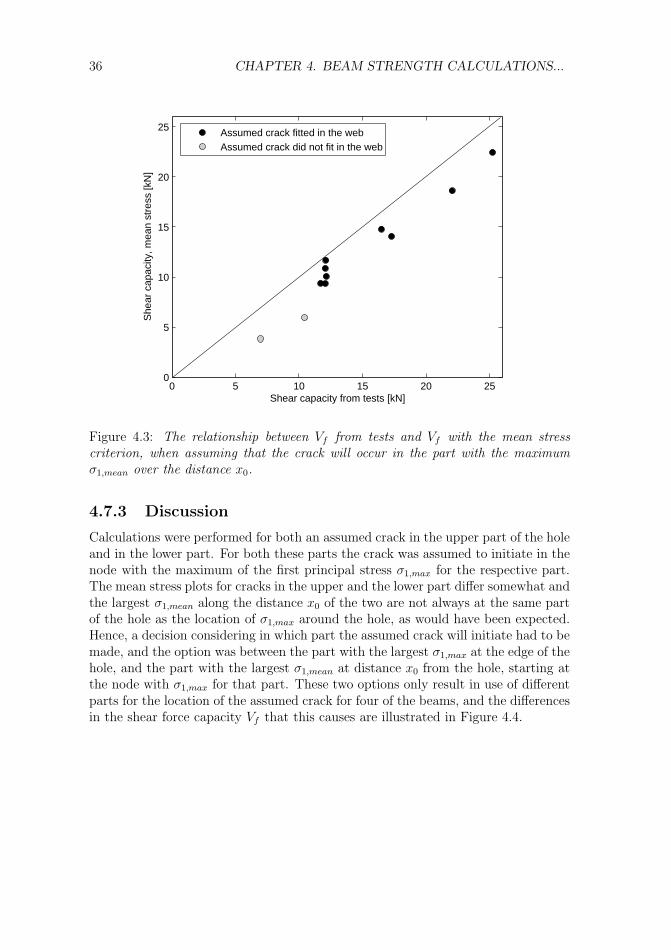
The differences between the shear force capacities gained from using the meanstress criterion and from the tests are shown in Figure 4.3. All values of the shearforce capacity with the mean stress criterion are lower than those from the tests.
Table 4.5: The shear force capacity Vf with the mean stress criterion. The boldnumbers indicate in which part around the hole the largest of the two σ1,mean overthe specific distance x0 occurs, and thus the value used in the calculations.
Beam σ1,mean for the load P [MPa] Pf Vf
Left hole Right hole [kN] [kN]Upper Lower Upper Lowerpart part part part
d40 2.84 2.96 - - 23.82 18.62d63 3.53 3.68 - - 19.18 14.79
d94.5 4.37 4.58 - - 15.44 11.69d126 5.06 5.20 - - 13.57 10.08d203 2.27 2.38 - - 29.57 22.46d2x63 3.01 3.07 2.89 3.22 21.89 14.07d2x126 4.05 4.10 3.92 4.40 16.03 9.39d63x126 5.28 5.59 - - 12.60 9.36d126x126 6.65 8.84 - - 7.97 5.92d126x275 11.54 12.47 - - 5.65 3.82d203x275 4.43 4.83 - - 14.60 10.87
36 CHAPTER 4. BEAM STRENGTH CALCULATIONS...
0 5 10 15 20 250
5
10
15
20
25
Shear capacity from tests [kN]
She
ar c
apac
ity, m
ean
stre
ss [k
N]
Assumed crack fitted in the webAssumed crack did not fit in the web
Figure 4.3: The relationship between Vf from tests and Vf with the mean stresscriterion, when assuming that the crack will occur in the part with the maximumσ1,mean over the distance x0.
4.7.3 Discussion
Calculations were performed for both an assumed crack in the upper part of the holeand in the lower part. For both these parts the crack was assumed to initiate in thenode with the maximum of the first principal stress σ1,max for the respective part.The mean stress plots for cracks in the upper and the lower part differ somewhat andthe largest σ1,mean along the distance x0 of the two are not always at the same partof the hole as the location of σ1,max around the hole, as would have been expected.Hence, a decision considering in which part the assumed crack will initiate had to bemade, and the option was between the part with the largest σ1,max at the edge of thehole, and the part with the largest σ1,mean at distance x0 from the hole, starting atthe node with σ1,max for that part. These two options only result in use of differentparts for the location of the assumed crack for four of the beams, and the differencesin the shear force capacity Vf that this causes are illustrated in Figure 4.4.
4.8. THE INITIAL CRACK CRITERION 37
d40 d63 d126 d203x2755
10
15
20
25
Beam
She
ar fo
rce
capa
city
, mea
n st
ress
crit
erio
n [k
N]
Assumed crack in the part with the maximum mean stressAssumed crack in the part with the maximum point stress
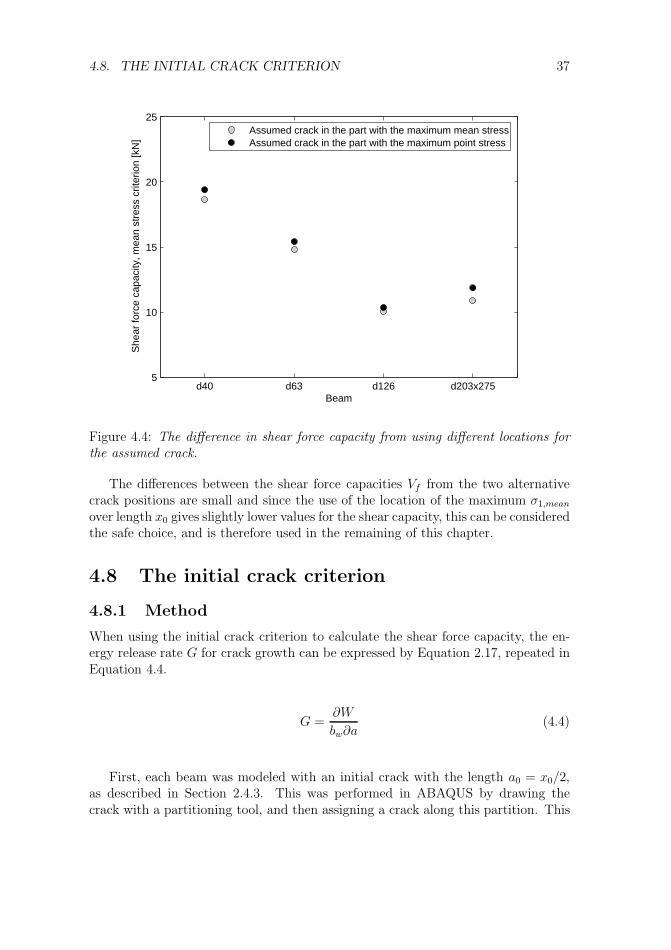
Figure 4.4: The difference in shear force capacity from using different locations forthe assumed crack.
The differences between the shear force capacities Vf from the two alternativecrack positions are small and since the use of the location of the maximum σ1,mean
over length x0 gives slightly lower values for the shear capacity, this can be consideredthe safe choice, and is therefore used in the remaining of this chapter.
4.8 The initial crack criterion
4.8.1 Method
When using the initial crack criterion to calculate the shear force capacity, the en-ergy release rate G for crack growth can be expressed by Equation 2.17, repeated inEquation 4.4.
G =∂W
bw∂a(4.4)
First, each beam was modeled with an initial crack with the length a0 = x0/2,as described in Section 2.4.3. This was performed in ABAQUS by drawing thecrack with a partitioning tool, and then assigning a crack along this partition. This
38 CHAPTER 4. BEAM STRENGTH CALCULATIONS...
resulted in double nodes along the line. For the lower part of the hole for beamd126x275 the length a0 did not fit into the web. Instead the longest possible lengthin the same direction that fitted within the web was used. The cracks for all beamsinitiated in the node with the maximum of the first principal stress σ1,max at the edgeof the hole in the upper or lower part, and grew in the direction perpendicular to theedge of the hole. For this first crack the external work W1 was calculated and thenone node at the tip of the crack was opened to simulate crack growth. This resultedin a new crack with length a0 + 2xa. The external work W2 for the new crack wascalculated, as well as the growth length Δa for the crack (see Section 2.4.3 and Fig-ure 2.6). These values were then used to calculate the energy release rate G for eachbeam with crack lengths according to Table 4.6 and from the specific applied load P :
G ≈ ΔW
bwΔa=
W2 − W1
bw(a0 + 2xa − a0)(4.5)
To calculate the failure load Pf the critical value of the energy release rate Gf
was used (Gf = 3494 J/m2 as mentioned in Section 2.5):
Gf = G(P 2
f
P 2) ⇒ Pf = P
√Gf
G(4.6)
All alternative positions for the cracks, which are the upper and lower part ofthe hole and also the right or the left hole for the cases with two holes, were modeledand tested in ABAQUS.
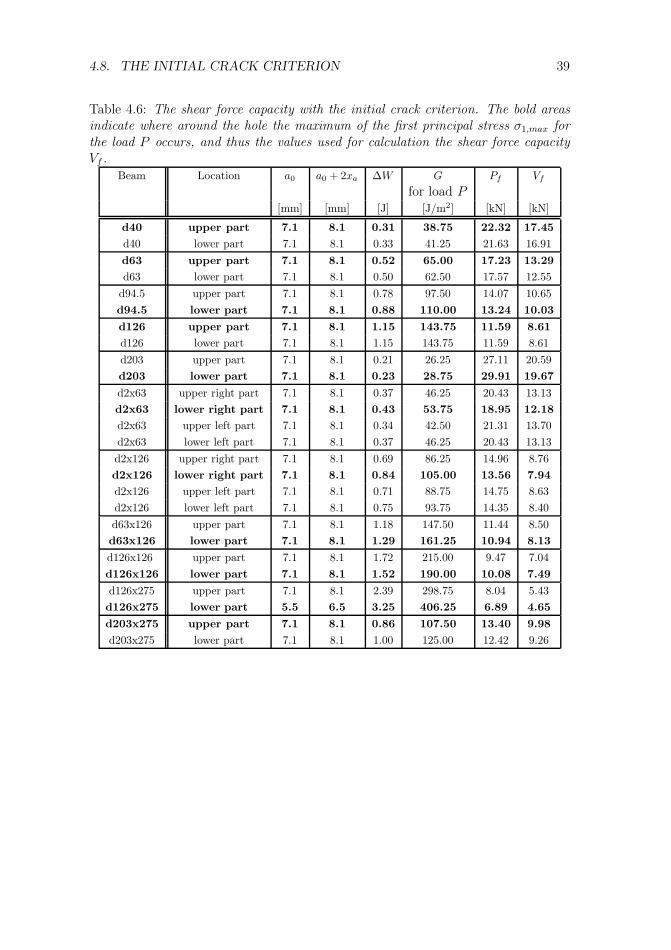
4.8.2 Results
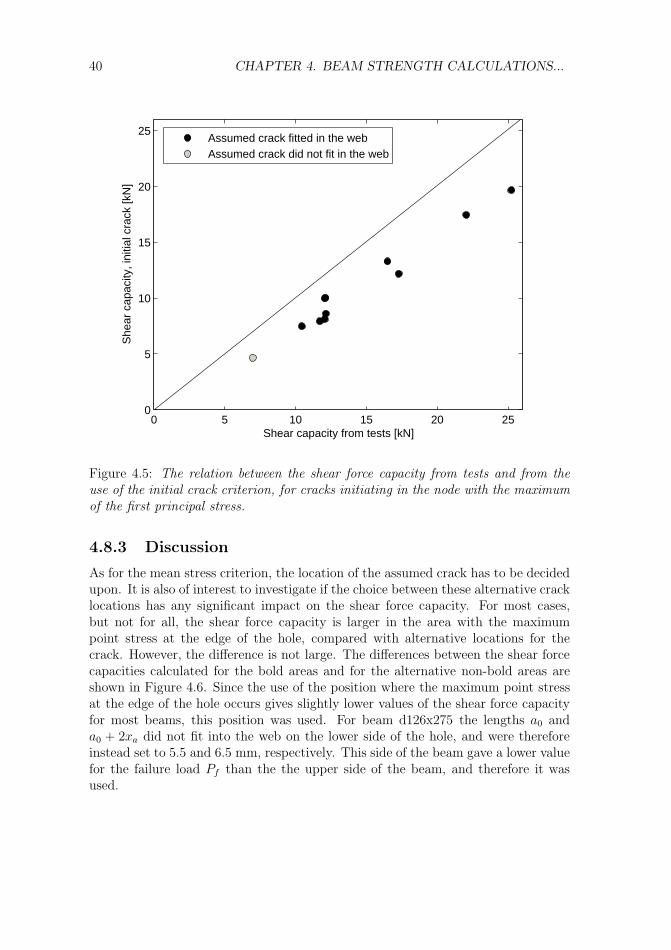
The results are shown in Table 4.6. The bold areas indicate the part with the largestof the two σ1,max at the edge of the hole, one occurring at each side of the hole. Thenon-bold areas can be considered as alternatives to this area for the location of themodeled crack. The relation between the shear force capacity Vf from the previoustests and from the use of the initial crack criterion (the bold areas) is shown inFigure 4.5.
4.8. THE INITIAL CRACK CRITERION 39
Table 4.6: The shear force capacity with the initial crack criterion. The bold areasindicate where around the hole the maximum of the first principal stress σ1,max forthe load P occurs, and thus the values used for calculation the shear force capacityVf .
Beam Location a0 a0 + 2xa ΔW G Pf Vf
for load P[mm] [mm] [J] [J/m2] [kN] [kN]
d40 upper part 7.1 8.1 0.31 38.75 22.32 17.45d40 lower part 7.1 8.1 0.33 41.25 21.63 16.91d63 upper part 7.1 8.1 0.52 65.00 17.23 13.29d63 lower part 7.1 8.1 0.50 62.50 17.57 12.55
d94.5 upper part 7.1 8.1 0.78 97.50 14.07 10.65d94.5 lower part 7.1 8.1 0.88 110.00 13.24 10.03d126 upper part 7.1 8.1 1.15 143.75 11.59 8.61d126 lower part 7.1 8.1 1.15 143.75 11.59 8.61d203 upper part 7.1 8.1 0.21 26.25 27.11 20.59d203 lower part 7.1 8.1 0.23 28.75 29.91 19.67
d2x63 upper right part 7.1 8.1 0.37 46.25 20.43 13.13d2x63 lower right part 7.1 8.1 0.43 53.75 18.95 12.18d2x63 upper left part 7.1 8.1 0.34 42.50 21.31 13.70d2x63 lower left part 7.1 8.1 0.37 46.25 20.43 13.13d2x126 upper right part 7.1 8.1 0.69 86.25 14.96 8.76d2x126 lower right part 7.1 8.1 0.84 105.00 13.56 7.94d2x126 upper left part 7.1 8.1 0.71 88.75 14.75 8.63d2x126 lower left part 7.1 8.1 0.75 93.75 14.35 8.40d63x126 upper part 7.1 8.1 1.18 147.50 11.44 8.50d63x126 lower part 7.1 8.1 1.29 161.25 10.94 8.13d126x126 upper part 7.1 8.1 1.72 215.00 9.47 7.04d126x126 lower part 7.1 8.1 1.52 190.00 10.08 7.49d126x275 upper part 7.1 8.1 2.39 298.75 8.04 5.43d126x275 lower part 5.5 6.5 3.25 406.25 6.89 4.65d203x275 upper part 7.1 8.1 0.86 107.50 13.40 9.98d203x275 lower part 7.1 8.1 1.00 125.00 12.42 9.26
40 CHAPTER 4. BEAM STRENGTH CALCULATIONS...
0 5 10 15 20 250
5
10
15
20
25
Shear capacity from tests [kN]
She
ar c
apac
ity, i
nitia
l cra
ck [k
N]
Assumed crack fitted in the webAssumed crack did not fit in the web
Figure 4.5: The relation between the shear force capacity from tests and from theuse of the initial crack criterion, for cracks initiating in the node with the maximumof the first principal stress.
4.8.3 Discussion
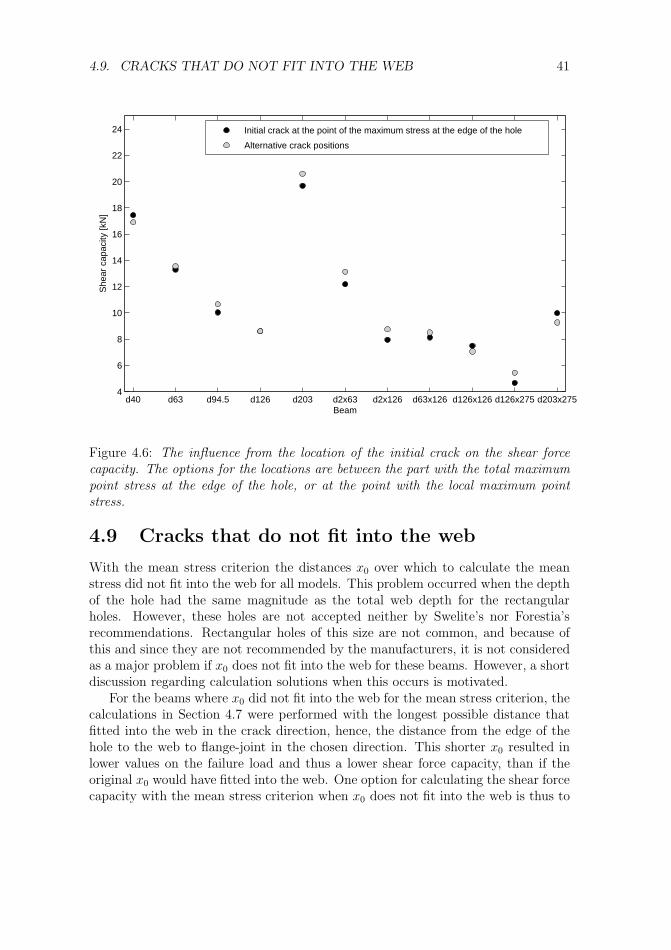
As for the mean stress criterion, the location of the assumed crack has to be decidedupon. It is also of interest to investigate if the choice between these alternative cracklocations has any significant impact on the shear force capacity. For most cases,but not for all, the shear force capacity is larger in the area with the maximumpoint stress at the edge of the hole, compared with alternative locations for thecrack. However, the difference is not large. The differences between the shear forcecapacities calculated for the bold areas and for the alternative non-bold areas areshown in Figure 4.6. Since the use of the position where the maximum point stressat the edge of the hole occurs gives slightly lower values of the shear force capacityfor most beams, this position was used. For beam d126x275 the lengths a0 anda0 + 2xa did not fit into the web on the lower side of the hole, and were thereforeinstead set to 5.5 and 6.5 mm, respectively. This side of the beam gave a lower valuefor the failure load Pf than the the upper side of the beam, and therefore it wasused.
4.9. CRACKS THAT DO NOT FIT INTO THE WEB 41
d40 d63 d94.5 d126 d203 d2x63 d2x126 d63x126 d126x126 d126x275 d203x2754
6
8
10
12
14
16
18
20
22
24
Beam
She
ar c
apac
ity [k
N]
Initial crack at the point of the maximum stress at the edge of the hole
Alternative crack positions
Figure 4.6: The influence from the location of the initial crack on the shear forcecapacity. The options for the locations are between the part with the total maximumpoint stress at the edge of the hole, or at the point with the local maximum pointstress.
4.9 Cracks that do not fit into the web
With the mean stress criterion the distances x0 over which to calculate the meanstress did not fit into the web for all models. This problem occurred when the depthof the hole had the same magnitude as the total web depth for the rectangularholes. However, these holes are not accepted neither by Swelite’s nor Forestia’srecommendations. Rectangular holes of this size are not common, and because ofthis and since they are not recommended by the manufacturers, it is not consideredas a major problem if x0 does not fit into the web for these beams. However, a shortdiscussion regarding calculation solutions when this occurs is motivated.
For the beams where x0 did not fit into the web for the mean stress criterion, thecalculations in Section 4.7 were performed with the longest possible distance thatfitted into the web in the crack direction, hence, the distance from the edge of thehole to the web to flange-joint in the chosen direction. This shorter x0 resulted inlower values on the failure load and thus a lower shear force capacity, than if theoriginal x0 would have fitted into the web. One option for calculating the shear forcecapacity with the mean stress criterion when x0 does not fit into the web is thus to
42 CHAPTER 4. BEAM STRENGTH CALCULATIONS...
use the longest possible values for x0 for these beams instead. This will however notrepresent the actual shear force capacity accurately.
For the point stress criterion this problem does not exist, since the shear forcecapacity is calculated for the maximum of the first principal stress σ1,max in onesingle node. Another alternative for calculating the shear force capacity for thebeams where x0 did not fit into the web is therefore to use the point stress criterioninstead of the mean stress criterion. This is a relatively easy way to estimate theshear force capacity Vf , and since the point stress criterion gives lower values on theshear force capacity than the mean stress criterion, this will give value on the safeside.
Yet another alternative would be to use the initial crack criterion for these mod-els. Since the assumed crack length will be maximum x0/2 plus the length of anelement side, this crack is more likely to fit within the web, and the extent of thisproblem will thus be reduced. In the calculations in Section 4.8 the assumed cracka0 did not fit into the web for the lower side of the model d126x275. When thisoccurred the calculations were instead performed with the longest possible crack.Since the original assumed crack a0 was half the size of x0, the difference that theshorter a0 makes is smaller, than the difference a shorter x0 makes. The use of theinitial crack criterion for the models where the original x0 does not fit into the webcan thus be motivated, but the calculations with the initial crack criterion are farmore complicated.
Another option is to still use the mean stress criterion, but manipulating theσmean/x plots (see Appendix B) and thus gain a value for the distance x0, thoughsomewhat modified. When calculating the mean stress over the distance x, first ofall the maximum stress at the distance x is calculated. With this modified meanstress method, the maximum stress plots is elongated by dragging the lowest valuehorizontally, and thus setting the maximum stress at all following distances fromthe edge of the hole to the value at the longest possible distance in the web fromthe edge along the assumed crack path. This modified plot is then integrated andeach value of the stress is divided by the distance x, just as in previous calculations.
Chapter 5
Evaluation and new calculationmethod
5.1 Evaluation of the calculation criteria
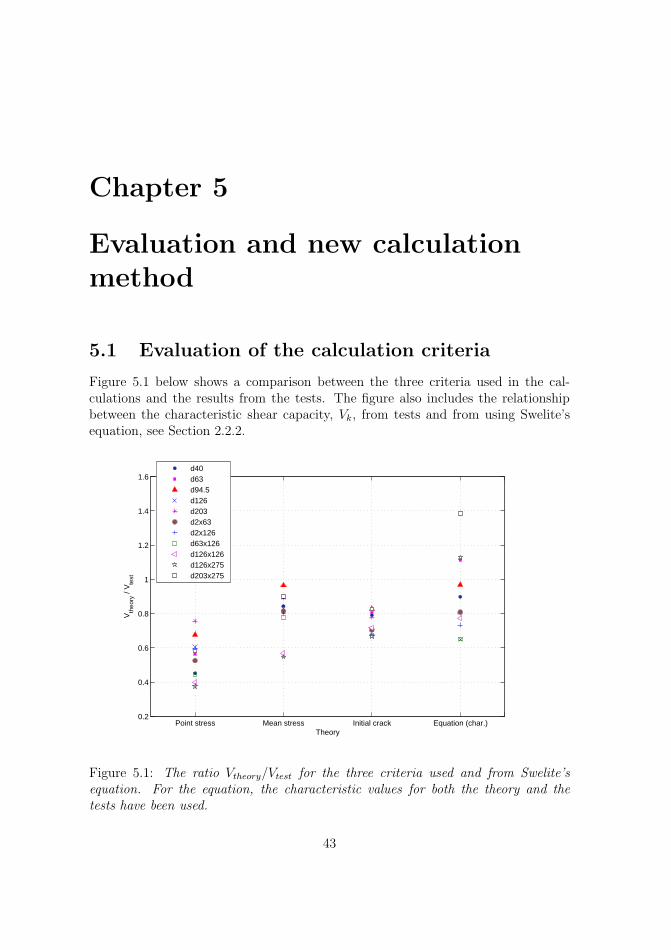
Figure 5.1 below shows a comparison between the three criteria used in the cal-culations and the results from the tests. The figure also includes the relationshipbetween the characteristic shear capacity, Vk, from tests and from using Swelite’sequation, see Section 2.2.2.
Point stress Mean stress Initial crack Equation (char.)0.2
0.4
0.6
0.8
1
1.2
1.4
1.6
Theory
Vth
eory
/ V
test
d40d63d94.5d126d203d2x63d2x126d63x126d126x126d126x275d203x275
Figure 5.1: The ratio Vtheory/Vtest for the three criteria used and from Swelite’sequation. For the equation, the characteristic values for both the theory and thetests have been used.
43
44 CHAPTER 5. EVALUATION AND NEW CALCULATION METHOD
Since the material used in the models may not correspond to the material usedin the previous tests, the ratio between the largest and smallest Vtheory/Vtest for thedifferent theories is of interest, and not how close Vtheory/Vtest is to 1.
With the exception of the two models d126x126 and d126x275, for which thecrack length x0 did not fit into the web, the use of the mean stress criterion gavea small ratio of approximately 0.96/0.78 = 1.23 for Vtheory/Vtest. The initial crackcriterion also gave a small Vtheory/Vtest ratio, approximately 0.83/0.68 = 1.22. Thepoint stress criterion gives the highest value of the same ratio among the threecriteria, approximately 0.76/0.38 = 2.00. The equation gave the largest Vtheory/Vtest
ratio, approximately 1.39/0.65 = 2.14 and can thus be considered as not a suitableway of calculating the reduced shear force capacity for a beam with a hole in the web,especially since three of these characteristic values are lower than the correspondingcharacteristic values from the tests (see Section 5.2).
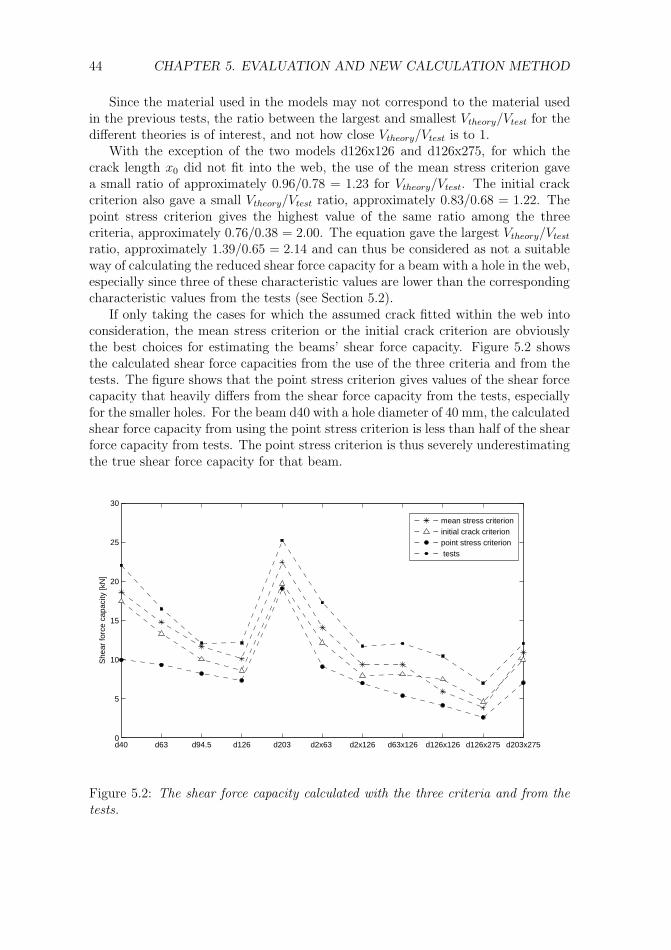
If only taking the cases for which the assumed crack fitted within the web intoconsideration, the mean stress criterion or the initial crack criterion are obviouslythe best choices for estimating the beams’ shear force capacity. Figure 5.2 showsthe calculated shear force capacities from the use of the three criteria and from thetests. The figure shows that the point stress criterion gives values of the shear forcecapacity that heavily differs from the shear force capacity from the tests, especiallyfor the smaller holes. For the beam d40 with a hole diameter of 40 mm, the calculatedshear force capacity from using the point stress criterion is less than half of the shearforce capacity from tests. The point stress criterion is thus severely underestimatingthe true shear force capacity for that beam.
d40 d63 d94.5 d126 d203 d2x63 d2x126 d63x126 d126x126 d126x275 d203x2750
5
10
15
20
25
30
She
ar fo
rce
capa
city
[kN
]
mean stress criterioninitial crack criterionpoint stress criterion tests
Figure 5.2: The shear force capacity calculated with the three criteria and from thetests.
5.1. EVALUATION OF THE CALCULATION CRITERIA 45
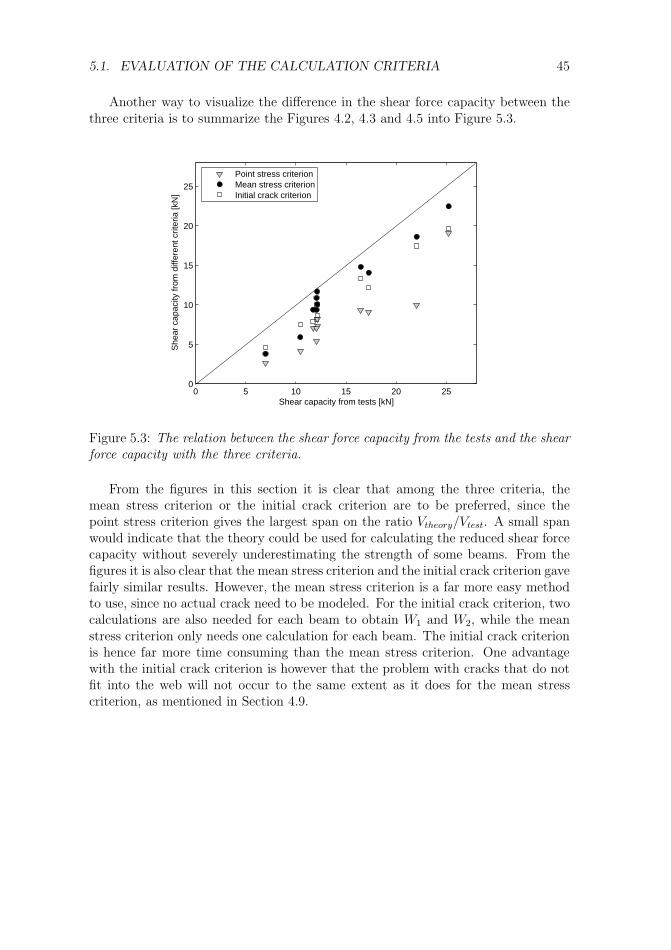
Another way to visualize the difference in the shear force capacity between thethree criteria is to summarize the Figures 4.2, 4.3 and 4.5 into Figure 5.3.
0 5 10 15 20 250
5
10
15
20
25
Shear capacity from tests [kN]
She
ar c
apac
ity fr
om d
iffer
ent c
riter
ia [k
N]
Point stress criterionMean stress criterionInitial crack criterion
Figure 5.3: The relation between the shear force capacity from the tests and the shearforce capacity with the three criteria.
From the figures in this section it is clear that among the three criteria, themean stress criterion or the initial crack criterion are to be preferred, since thepoint stress criterion gives the largest span on the ratio Vtheory/Vtest. A small spanwould indicate that the theory could be used for calculating the reduced shear forcecapacity without severely underestimating the strength of some beams. From thefigures it is also clear that the mean stress criterion and the initial crack criterion gavefairly similar results. However, the mean stress criterion is a far more easy methodto use, since no actual crack need to be modeled. For the initial crack criterion, twocalculations are also needed for each beam to obtain W1 and W2, while the meanstress criterion only needs one calculation for each beam. The initial crack criterionis hence far more time consuming than the mean stress criterion. One advantagewith the initial crack criterion is however that the problem with cracks that do notfit into the web will not occur to the same extent as it does for the mean stresscriterion, as mentioned in Section 4.9.
46 CHAPTER 5. EVALUATION AND NEW CALCULATION METHOD
5.2 Evaluation of current calculation method
5.2.1 Method
The calculation method used by Swelite and Forestia, for calculating the reducedshear force capacity for I-beams with holes in the web was mentioned in Section 2.2and the equations used will be repeated here for convenience.
Vk,hole = Vk · k (5.1)
k =H − hf − 0.9d
H − hf
(5.2)
The reduced characteristic shear capacity, Vk,hole, is calculated from the charac-teristic shear capacity for the beam without any hole, Vk, by multiplying it with thereduction factor k. The factor k is based on the total beam depth H , the depth ofthe flanges, hf , and the diameter of the hole, d.
In the study that contained the results from the test [14], that have been used forcomparison throughout this thesis, the shear force capacities for the tested beamswere compared to the shear force capacities from the equations. For this comparison,the mean values of the shear force capacities from the tests for each type of beamwere converted into the characteristic shear force capacities Vk,test, by use of thestandard deviation. These values were compared to the characteristic shear forcecapacities calculated with Equation 5.1 and Equation 5.2 using the characteristicshear force capacity for a beam of type H 220 without any hole, Vk, given by Swelite[15].
5.2.2 Results
Figure 5.4 shows the comparison between the characteristic shear force capacitiesfrom the tests, Vk,test and the characteristic shear force capacities from the use ofthe equations recommended by Swelite and Forestia, Vk,hole.
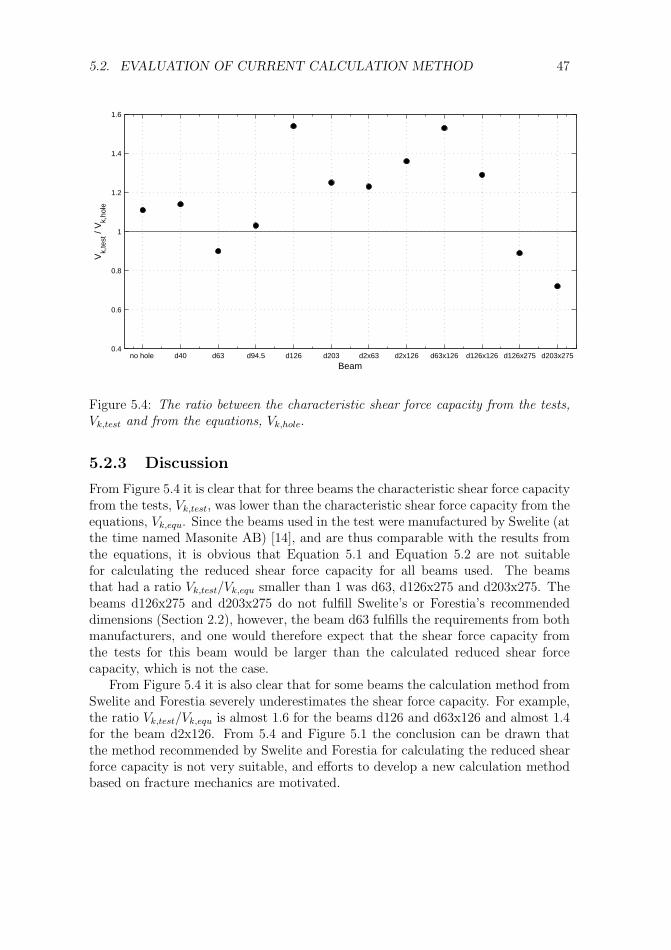
5.2. EVALUATION OF CURRENT CALCULATION METHOD 47
no hole d40 d63 d94.5 d126 d203 d2x63 d2x126 d63x126 d126x126 d126x275 d203x2750.4
0.6
0.8
1
1.2
1.4
1.6
Beam
Vk,
test
/ V
k,ho
le
Figure 5.4: The ratio between the characteristic shear force capacity from the tests,Vk,test and from the equations, Vk,hole.
5.2.3 Discussion
From Figure 5.4 it is clear that for three beams the characteristic shear force capacityfrom the tests, Vk,test, was lower than the characteristic shear force capacity from theequations, Vk,equ. Since the beams used in the test were manufactured by Swelite (atthe time named Masonite AB) [14], and are thus comparable with the results fromthe equations, it is obvious that Equation 5.1 and Equation 5.2 are not suitablefor calculating the reduced shear force capacity for all beams used. The beamsthat had a ratio Vk,test/Vk,equ smaller than 1 was d63, d126x275 and d203x275. Thebeams d126x275 and d203x275 do not fulfill Swelite’s or Forestia’s recommendeddimensions (Section 2.2), however, the beam d63 fulfills the requirements from bothmanufacturers, and one would therefore expect that the shear force capacity fromthe tests for this beam would be larger than the calculated reduced shear forcecapacity, which is not the case.
From Figure 5.4 it is also clear that for some beams the calculation method fromSwelite and Forestia severely underestimates the shear force capacity. For example,the ratio Vk,test/Vk,equ is almost 1.6 for the beams d126 and d63x126 and almost 1.4for the beam d2x126. From 5.4 and Figure 5.1 the conclusion can be drawn thatthe method recommended by Swelite and Forestia for calculating the reduced shearforce capacity is not very suitable, and efforts to develop a new calculation methodbased on fracture mechanics are motivated.
48 CHAPTER 5. EVALUATION AND NEW CALCULATION METHOD
5.3 Beam parameter study
The parameter study was based on the mean stress criterion, since this methodresulted in a short span for the ratio Vtheory/Vtest, and since this is a fairly easymethod to use, as was discussed in Section 5.1. The parameters investigated are thematerial parameters E, Gf and ft. The reason for this additional parameter studyis that the values of these parameters in the previous tests are not known. Becauseof this the used values of these parameters in the calculations in Chapter 4 may notbe near the values for the real beams used in the test. Therefore it is of interest toinvestigate how much a change in these values influence the calculations.
5.3.1 Method
The influence from the Young’s modulus E, the fracture energy Gf and the tensilestrength ft on the shear force capacity Vf was investigated. A change in any ofthese parameters will result in a change in the distance x0, over which to calculatethe mean stress, and thus a change in the magnitude of the failure load Pf andultimately the shear force capacity Vf . By including these material parameters in adimensionless value X , see Equation 5.3, they can be compared to the shear forcecapacity for different beams with a span of tensile strengths.
X =hw
EGf
f2t
(5.3)
where hw is the depth of the web.The span of X includes variations of E between 3 000 MPa and 16 000 MPa, with
all other values kept constant and given by Chapter 2. By instead changing only Gf
instead of E, Gf will vary between 1900 J/m2 and 10 000 J/m2. By changing onlyft, ft will vary between 18 and 41 MPa. For some beams which had a diameter ofthe hole of the same magnitude as the depth of the web, this could not be calculated,since the assumed crack lengths did not fit into the web. The beams for which x0 inChapter 4 did not fit into the web were therefore excluded from the calculations inthis parameter study. The value X for the previously mentioned span was plottedagainst Y , see Equation 5.4, which included the shear force capacity of the beamVf , the thickness of the web bw, the depth of the web hw and the tensile strength ofthe web material, ft.
Y =Vf
bwhwft
(5.4)
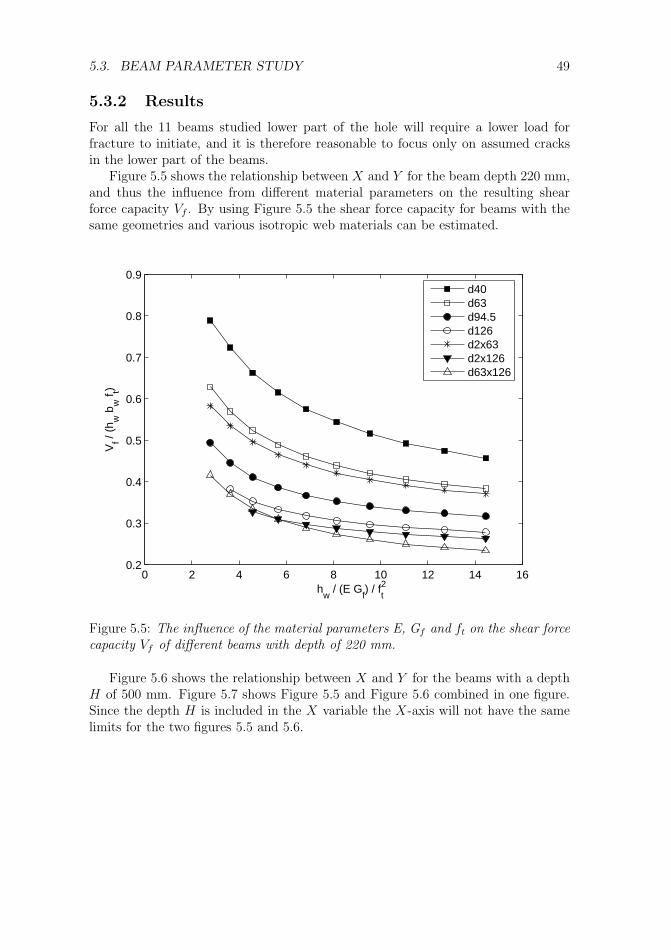
5.3. BEAM PARAMETER STUDY 49
5.3.2 Results
For all the 11 beams studied lower part of the hole will require a lower load forfracture to initiate, and it is therefore reasonable to focus only on assumed cracksin the lower part of the beams.
Figure 5.5 shows the relationship between X and Y for the beam depth 220 mm,and thus the influence from different material parameters on the resulting shearforce capacity Vf . By using Figure 5.5 the shear force capacity for beams with thesame geometries and various isotropic web materials can be estimated.
0 2 4 6 8 10 12 14 160.2
0.3
0.4
0.5
0.6
0.7
0.8
0.9
hw
/ (E Gf) / f
t2
Vf /
(hw
bw
f t)
d40d63d94.5d126d2x63d2x126d63x126
Figure 5.5: The influence of the material parameters E, Gf and ft on the shear forcecapacity Vf of different beams with depth of 220 mm.
Figure 5.6 shows the relationship between X and Y for the beams with a depthH of 500 mm. Figure 5.7 shows Figure 5.5 and Figure 5.6 combined in one figure.Since the depth H is included in the X variable the X-axis will not have the samelimits for the two figures 5.5 and 5.6.
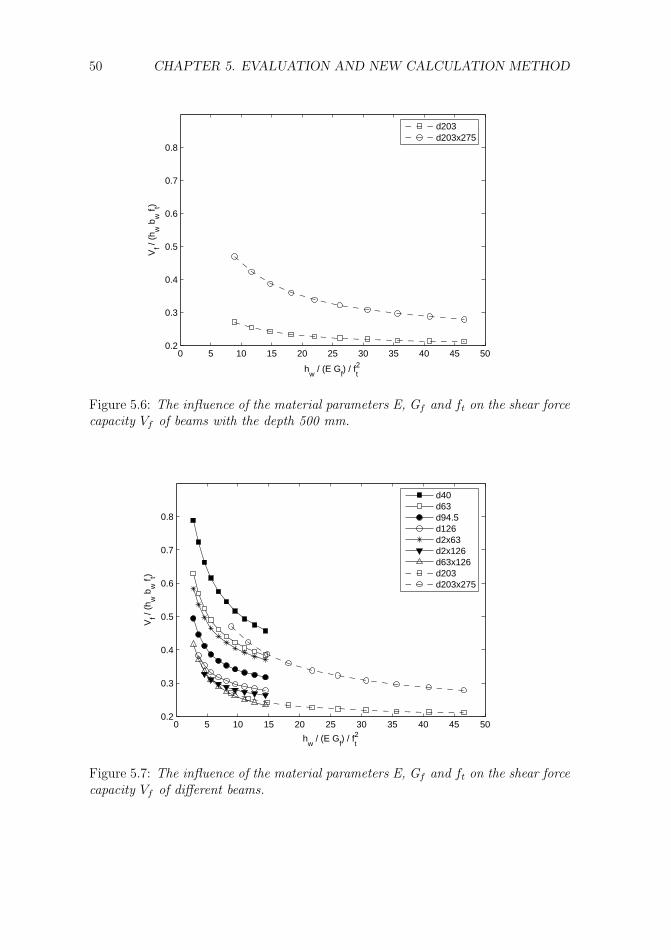
50 CHAPTER 5. EVALUATION AND NEW CALCULATION METHOD
0 5 10 15 20 25 30 35 40 45 500.2
0.3
0.4
0.5
0.6
0.7
0.8
hw
/ (E Gf) / f
t2
Vf /
(hw
bw
f t)
d203d203x275
Figure 5.6: The influence of the material parameters E, Gf and ft on the shear forcecapacity Vf of beams with the depth 500 mm.
0 5 10 15 20 25 30 35 40 45 500.2
0.3
0.4
0.5
0.6
0.7
0.8
hw
/ (E Gf) / f
t2
Vf /
(hw
bw
f t)
d40d63d94.5d126d2x63d2x126d63x126d203d203x275
Figure 5.7: The influence of the material parameters E, Gf and ft on the shear forcecapacity Vf of different beams.
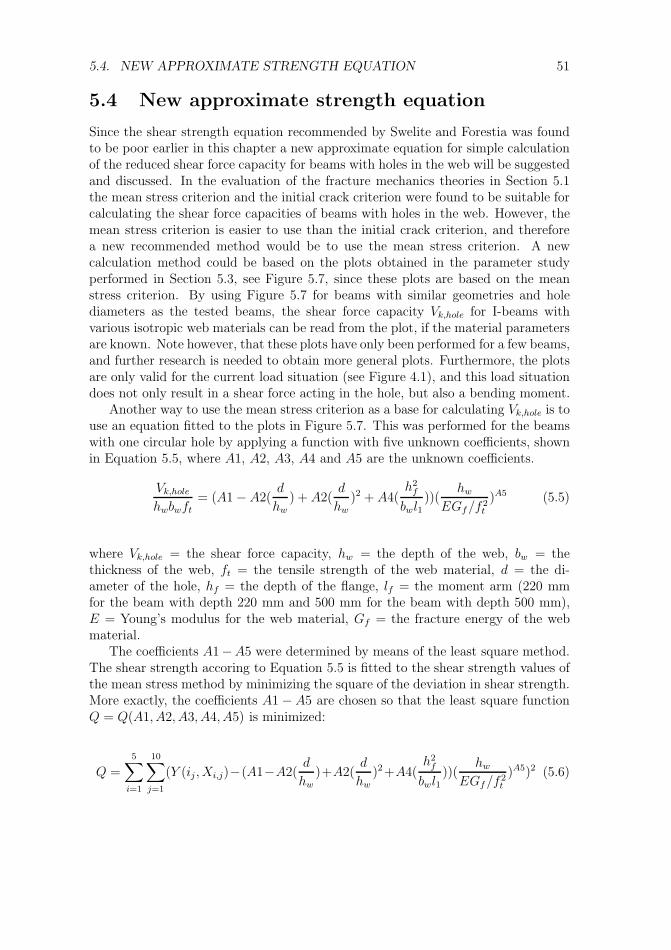
5.4. NEW APPROXIMATE STRENGTH EQUATION 51
5.4 New approximate strength equation
Since the shear strength equation recommended by Swelite and Forestia was foundto be poor earlier in this chapter a new approximate equation for simple calculationof the reduced shear force capacity for beams with holes in the web will be suggestedand discussed. In the evaluation of the fracture mechanics theories in Section 5.1the mean stress criterion and the initial crack criterion were found to be suitable forcalculating the shear force capacities of beams with holes in the web. However, themean stress criterion is easier to use than the initial crack criterion, and thereforea new recommended method would be to use the mean stress criterion. A newcalculation method could be based on the plots obtained in the parameter studyperformed in Section 5.3, see Figure 5.7, since these plots are based on the meanstress criterion. By using Figure 5.7 for beams with similar geometries and holediameters as the tested beams, the shear force capacity Vk,hole for I-beams withvarious isotropic web materials can be read from the plot, if the material parametersare known. Note however, that these plots have only been performed for a few beams,and further research is needed to obtain more general plots. Furthermore, the plotsare only valid for the current load situation (see Figure 4.1), and this load situationdoes not only result in a shear force acting in the hole, but also a bending moment.
Another way to use the mean stress criterion as a base for calculating Vk,hole is touse an equation fitted to the plots in Figure 5.7. This was performed for the beamswith one circular hole by applying a function with five unknown coefficients, shownin Equation 5.5, where A1, A2, A3, A4 and A5 are the unknown coefficients.
Vk,hole
hwbwft
= (A1 − A2(d
hw
) + A2(d
hw
)2 + A4(h2
f
bwl1))(
hw
EGf /f 2t
)A5 (5.5)
where Vk,hole = the shear force capacity, hw = the depth of the web, bw = thethickness of the web, ft = the tensile strength of the web material, d = the di-ameter of the hole, hf = the depth of the flange, lf = the moment arm (220 mmfor the beam with depth 220 mm and 500 mm for the beam with depth 500 mm),E = Young’s modulus for the web material, Gf = the fracture energy of the webmaterial.
The coefficients A1−A5 were determined by means of the least square method.The shear strength accoring to Equation 5.5 is fitted to the shear strength values ofthe mean stress method by minimizing the square of the deviation in shear strength.More exactly, the coefficients A1 − A5 are chosen so that the least square functionQ = Q(A1, A2, A3, A4, A5) is minimized:
Q =
5∑i=1
10∑j=1
(Y (ij , Xi,j)−(A1−A2(d
hw
)+A2(d
hw
)2+A4(h2
f
bwl1))(
hw
EGf /f 2t
)A5)2 (5.6)
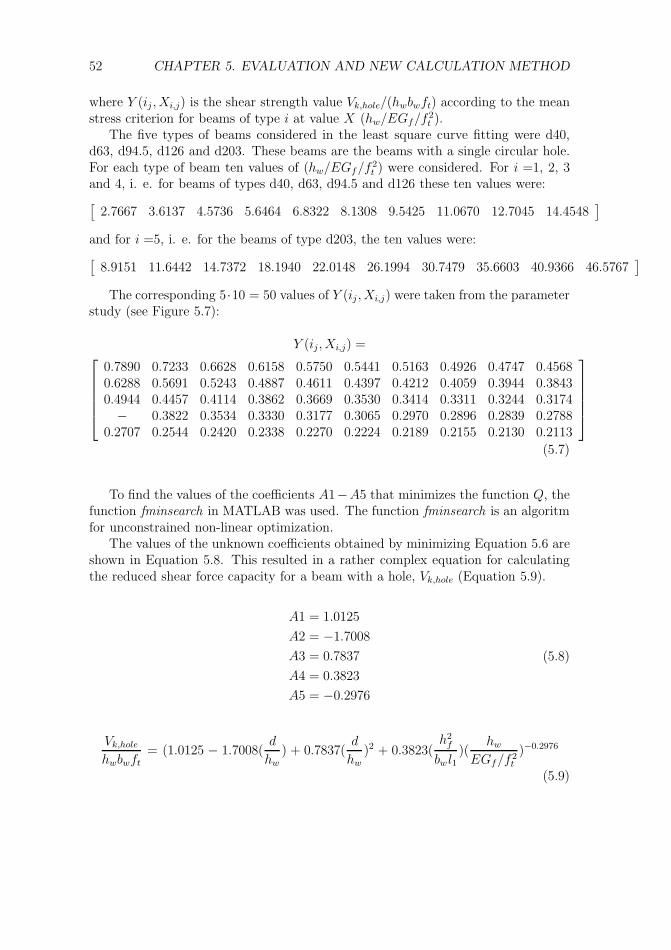
52 CHAPTER 5. EVALUATION AND NEW CALCULATION METHOD
where Y (ij , Xi,j) is the shear strength value Vk,hole/(hwbwft) according to the meanstress criterion for beams of type i at value X (hw/EGf/f
2t ).
The five types of beams considered in the least square curve fitting were d40,d63, d94.5, d126 and d203. These beams are the beams with a single circular hole.For each type of beam ten values of (hw/EGf/f 2
t ) were considered. For i =1, 2, 3and 4, i. e. for beams of types d40, d63, d94.5 and d126 these ten values were:
[2.7667 3.6137 4.5736 5.6464 6.8322 8.1308 9.5425 11.0670 12.7045 14.4548
]and for i =5, i. e. for the beams of type d203, the ten values were:
[8.9151 11.6442 14.7372 18.1940 22.0148 26.1994 30.7479 35.6603 40.9366 46.5767
]The corresponding 5·10 = 50 values of Y (ij , Xi,j) were taken from the parameter
study (see Figure 5.7):
Y (ij, Xi,j) =⎡⎢⎢⎢⎢⎣
0.7890 0.7233 0.6628 0.6158 0.5750 0.5441 0.5163 0.4926 0.4747 0.45680.6288 0.5691 0.5243 0.4887 0.4611 0.4397 0.4212 0.4059 0.3944 0.38430.4944 0.4457 0.4114 0.3862 0.3669 0.3530 0.3414 0.3311 0.3244 0.3174− 0.3822 0.3534 0.3330 0.3177 0.3065 0.2970 0.2896 0.2839 0.2788
0.2707 0.2544 0.2420 0.2338 0.2270 0.2224 0.2189 0.2155 0.2130 0.2113
⎤⎥⎥⎥⎥⎦
(5.7)
To find the values of the coefficients A1−A5 that minimizes the function Q, thefunction fminsearch in MATLAB was used. The function fminsearch is an algoritmfor unconstrained non-linear optimization.
The values of the unknown coefficients obtained by minimizing Equation 5.6 areshown in Equation 5.8. This resulted in a rather complex equation for calculatingthe reduced shear force capacity for a beam with a hole, Vk,hole (Equation 5.9).
A1 = 1.0125
A2 = −1.7008
A3 = 0.7837
A4 = 0.3823
A5 = −0.2976
(5.8)
Vk,hole
hwbwft
= (1.0125 − 1.7008(d
hw
) + 0.7837(d
hw
)2 + 0.3823(h2
f
bw l1)(
hw
EGf/f 2t
)−0.2976
(5.9)
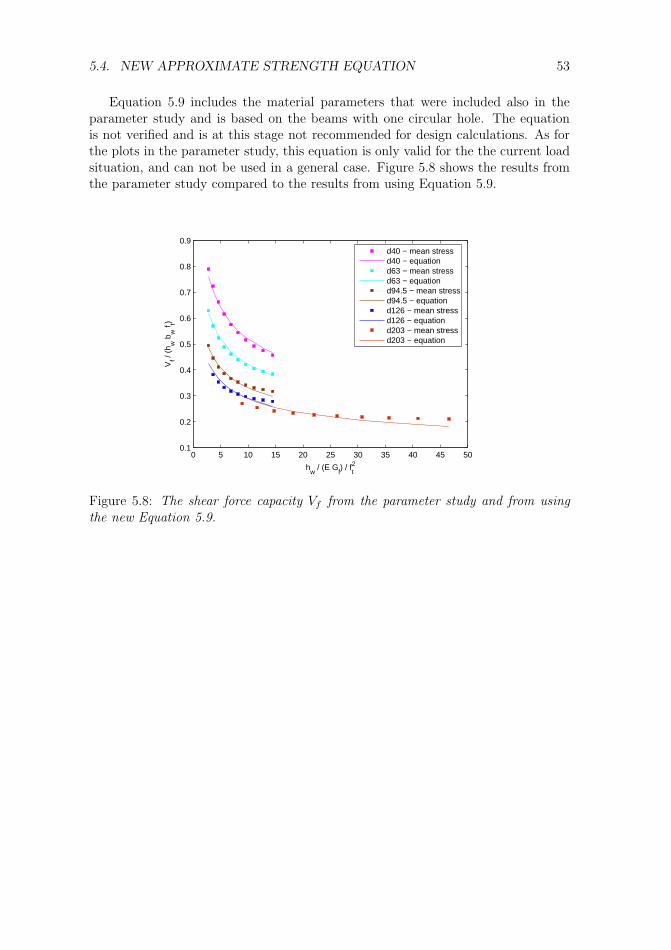
5.4. NEW APPROXIMATE STRENGTH EQUATION 53
Equation 5.9 includes the material parameters that were included also in theparameter study and is based on the beams with one circular hole. The equationis not verified and is at this stage not recommended for design calculations. As forthe plots in the parameter study, this equation is only valid for the the current loadsituation, and can not be used in a general case. Figure 5.8 shows the results fromthe parameter study compared to the results from using Equation 5.9.
0 5 10 15 20 25 30 35 40 45 500.1
0.2
0.3
0.4
0.5
0.6
0.7
0.8
0.9
hw
/ (E Gf) / f
t2
Vf /
(hw
bw
f t)
d40 − mean stressd40 − equationd63 − mean stressd63 − equationd94.5 − mean stressd94.5 − equationd126 − mean stressd126 − equationd203 − mean stressd203 − equation
Figure 5.8: The shear force capacity Vf from the parameter study and from usingthe new Equation 5.9.

Detta är en tom sida!
Chapter 6
Conclusions
6.1 Concluding remarks
The work with this master’s thesis has resulted in conclusions that will be discussedin this section.
By studying the angles to the location of the maximum of the first principal stressat the edge of the hole and three and eight nodes outside the hole (approximatelythree and eight mm outside the hole respectively), it was found that this angle canvary significantly from 45 ◦. It was also found that the angles for the outer pathsdiffer very little from the angle at the edge of the hole, and the conclusion thata crack will grow in an angle perpendicular to the edge of the hole could thus bedrawn.
In the calculations of the shear force capacity for beams with holes in the web,three criteria based on fracture mechanics theory were used. By comparing theratio Vtheory/Vtest for the three criteria, where Vtest is the shear force capacity from aprevious test study of the same beam geometries and load cases, it was found thatthe mean stress criterion and the initial crack criterion are suitable for calculatingthe shear force capacity of beams with holes. The point stress criterion however wasnot suitable since this method severely underestimated the shear force capacity ofsome beams.
By evaluating the current method for calculating the reduced shear force capacityfor beams with holes in the web used by Swelite and Forestia, it was found that thismethod does not give values corresponding well with the shear force capacity forthe tested beams. For three of the types of beams studied the characteristic shearforce capacity calculated by the current method was larger than the characteristicshear force capacity from the tests. This method also underestimated the shear forcecapacity for some beams considerably. The calculation method used by Swelite andForestia does accordingly not seem very accurate and suitable for calculating theshear force capacity for beams with holes. An attempt was made to develop analternative shear strength equation. This equation shows how the size of a circularhole and how the different material property parameters are predicted to affectthe shear strength. The alternative equation can, however, at the present stage of
55
56 CHAPTER 6. CONCLUSIONS
knowledge not be recommended for use in design. Further work on verification andgeneralization is needed.
6.2 Future work
During the work with this thesis, some areas that need further investigation havesprung to mind, and these are mentioned in this section.
• The calculations in this study have been compared to previous tests including11 beam geometries. The mean stress method needs to be verified further bycomparison to more empirical results.
• The new calculation method suggested in this study was based on the resultsfrom primarily the beam height 220 mm. A further development of these cal-culation methods based on more beam heights is needed as well as verificationof the equations.
• A more general calculation method, that is valid for various load cases isneeded.
Bibliography
[1] American Forest and Paper Association, (1999) Allowable Stress Design - Man-ual For Engineered Wood Constructions.
[2] Burstrom, P-G. (2001) Byggnadsmaterial - Uppbyggnad, tillverkning och egen-skaper. Studentlitteratur, Lund.
[3] Danewid, R., Johansson, C-J. and Isaksson, T. (2000) Trakonstruktioner. Di-vision of Structrual Engineering, Lund University, Lund.
[4] European Organisation for Technical Approvals. (2004) European TechnicalApproval No. ETA-02/0026, VTT rakennus-ja yhdyskunta tekniikka, Espoo.
[5] European Organisation for Technical Approvals. (2004) European TechnicalApproval No. ETA-03/0056, Norwegian Building Research Institute, Oslo.
[6] Gustafsson, P-J. (2002) Mean stress approach and initial crack approach. Re-port ”Fracture Mechanics Models for Strength Analysis of Timber Beams witha Hole of a Notch” of RILEM TC-133, Lund University, Lund.
[7] http://www.gp.com, (2005) Homepage of Georgia-Pacific.
[8] http://www.i-joist.org/home.asp, (2005) Wood I-Joist Manufacturers Associa-tion.
[9] http://www.swelite.se, (2005) Homepage of Swelite.
[10] Landelius, J. (1989) Finit Area Metoden - en bra metod for berakning avuppflakningsbrott? Report TVSM-5043, Lund Institute of Technology, Lund.
[11] Morris, V., Gustafsson, P-J. and Serrano, E. (1995) The shear strength oflight-weight beams with and without a hole - a preliminary study. COST 508 -Wood Mechanics Proc. of the 1995 Wood Mechanics Workshop on MechanicalProperties of Panel Products. Watford, UK.
[12] Nordtest Method. (1993) WOOD: Fracture Energy in Tension Perpendicularto the Grain, NT BUILD 422 Project 944-90, Gustafsson, P-J. and Larsen,H-J., Espoo, Finland.
57
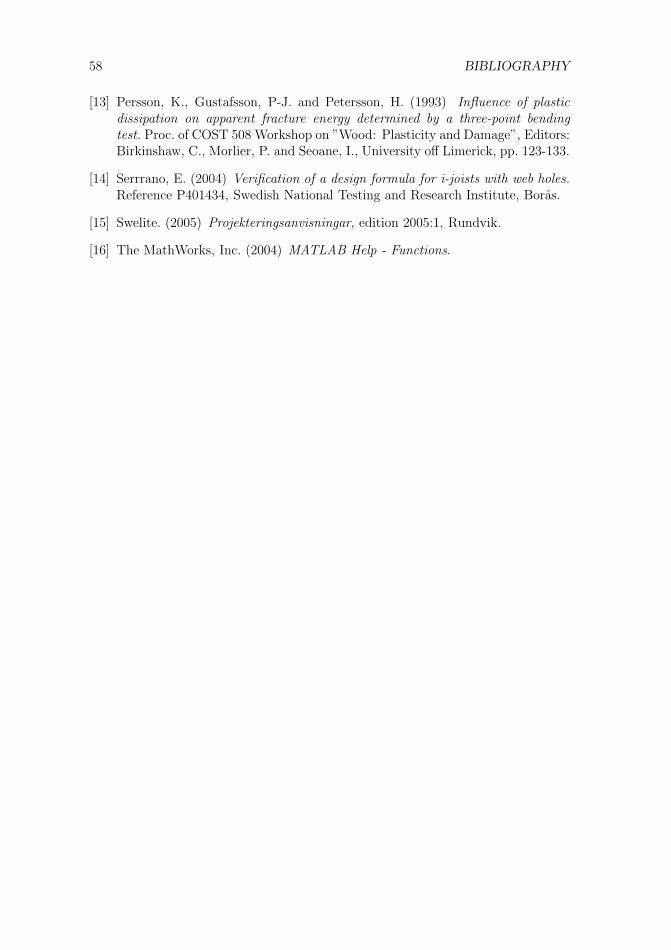
58 BIBLIOGRAPHY
[13] Persson, K., Gustafsson, P-J. and Petersson, H. (1993) Influence of plasticdissipation on apparent fracture energy determined by a three-point bendingtest. Proc. of COST 508 Workshop on ”Wood: Plasticity and Damage”, Editors:Birkinshaw, C., Morlier, P. and Seoane, I., University off Limerick, pp. 123-133.
[14] Serrrano, E. (2004) Verification of a design formula for i-joists with web holes.Reference P401434, Swedish National Testing and Research Institute, Boras.
[15] Swelite. (2005) Projekteringsanvisningar, edition 2005:1, Rundvik.
[16] The MathWorks, Inc. (2004) MATLAB Help - Functions.
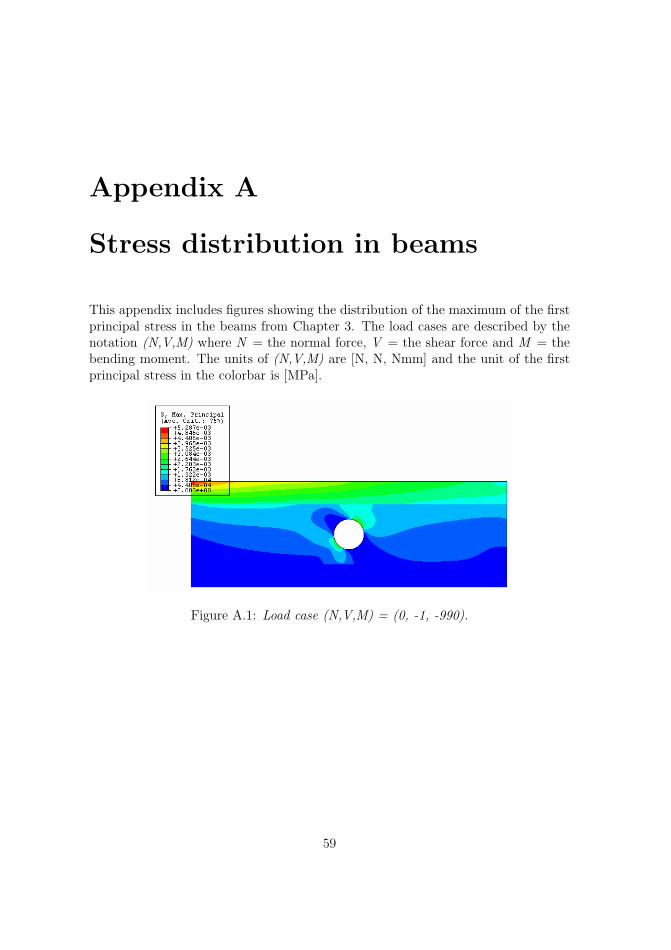
Appendix A
Stress distribution in beams
This appendix includes figures showing the distribution of the maximum of the firstprincipal stress in the beams from Chapter 3. The load cases are described by thenotation (N,V,M) where N = the normal force, V = the shear force and M = thebending moment. The units of (N,V,M) are [N, N, Nmm] and the unit of the firstprincipal stress in the colorbar is [MPa].
Figure A.1: Load case (N,V,M) = (0, -1, -990).
59
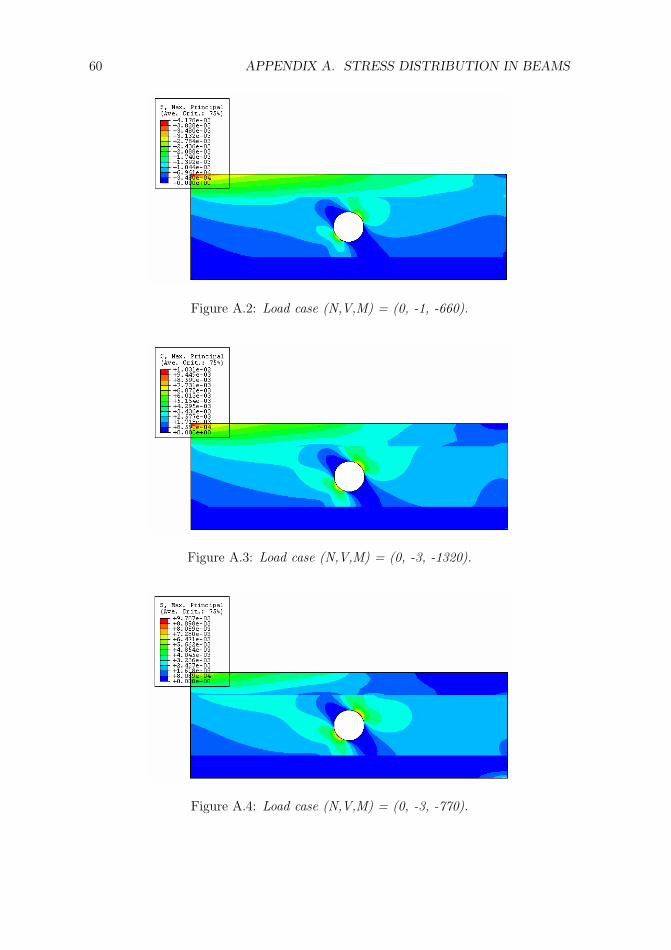
60 APPENDIX A. STRESS DISTRIBUTION IN BEAMS
Figure A.2: Load case (N,V,M) = (0, -1, -660).
Figure A.3: Load case (N,V,M) = (0, -3, -1320).
Figure A.4: Load case (N,V,M) = (0, -3, -770).
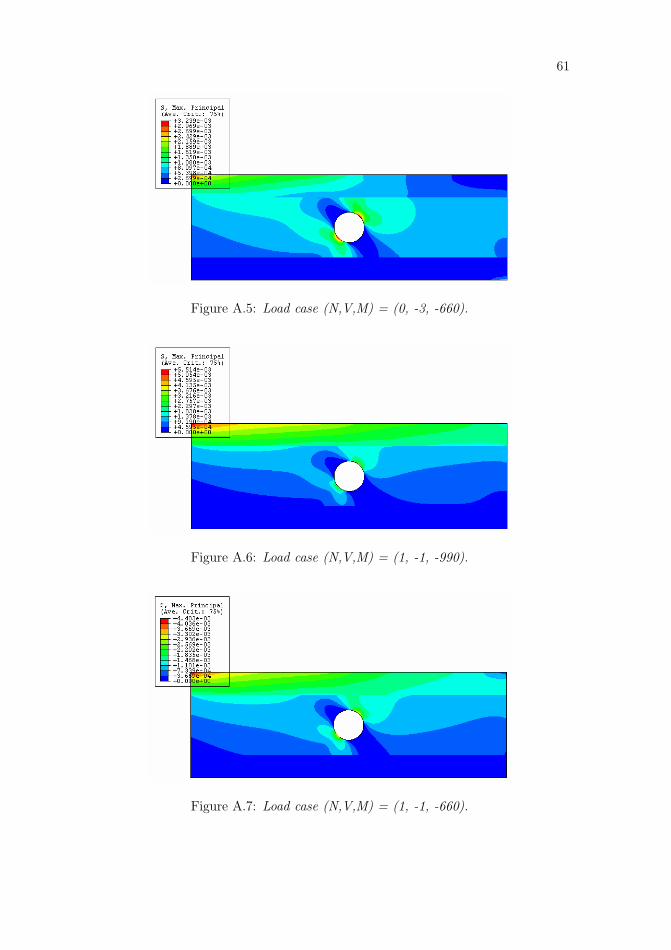
61
Figure A.5: Load case (N,V,M) = (0, -3, -660).
Figure A.6: Load case (N,V,M) = (1, -1, -990).
Figure A.7: Load case (N,V,M) = (1, -1, -660).
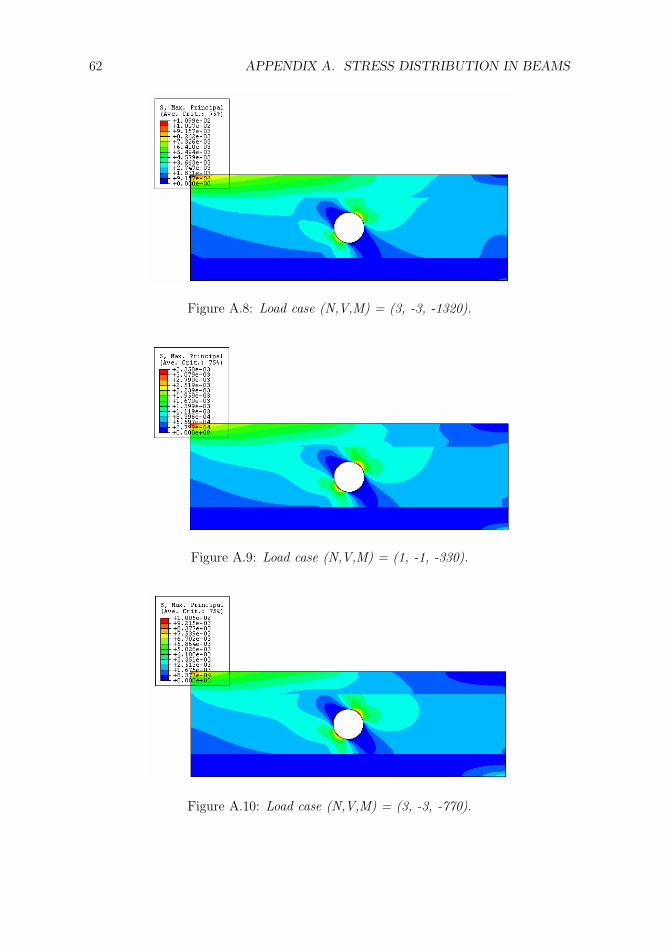
62 APPENDIX A. STRESS DISTRIBUTION IN BEAMS
Figure A.8: Load case (N,V,M) = (3, -3, -1320).
Figure A.9: Load case (N,V,M) = (1, -1, -330).
Figure A.10: Load case (N,V,M) = (3, -3, -770).
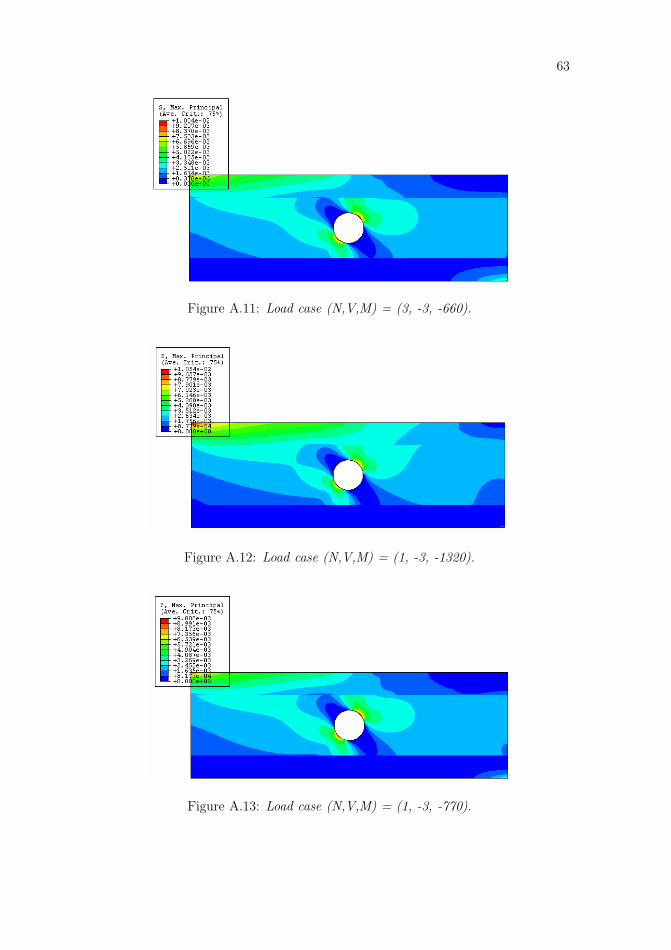
63
Figure A.11: Load case (N,V,M) = (3, -3, -660).
Figure A.12: Load case (N,V,M) = (1, -3, -1320).
Figure A.13: Load case (N,V,M) = (1, -3, -770).
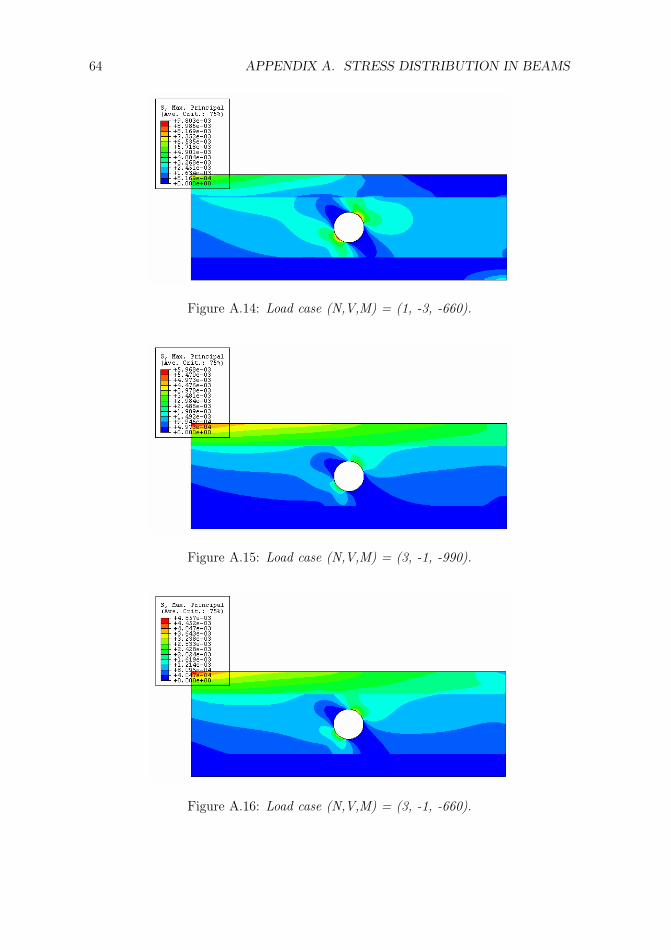
64 APPENDIX A. STRESS DISTRIBUTION IN BEAMS
Figure A.14: Load case (N,V,M) = (1, -3, -660).
Figure A.15: Load case (N,V,M) = (3, -1, -990).
Figure A.16: Load case (N,V,M) = (3, -1, -660).
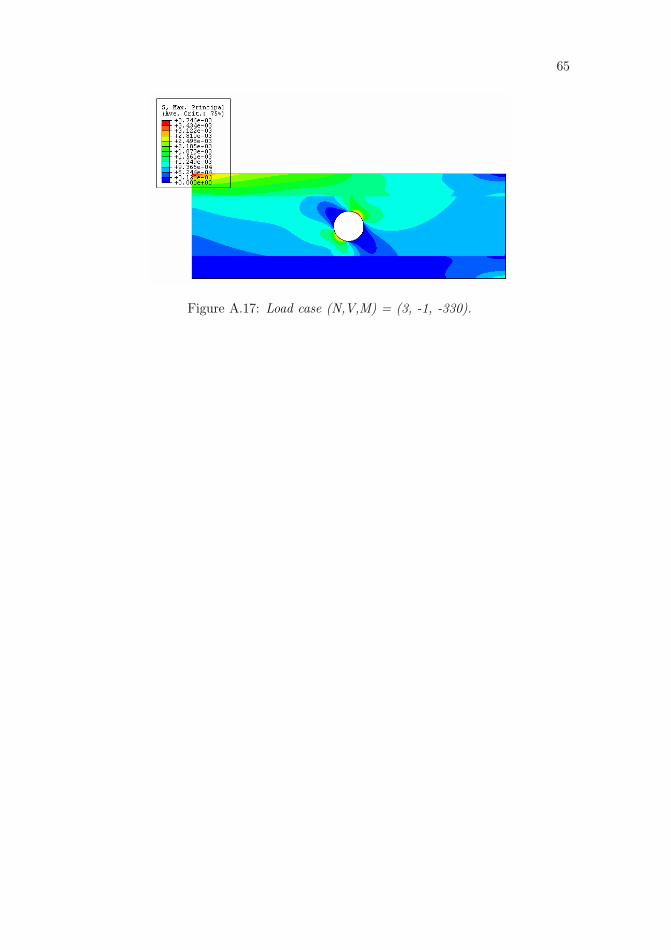
65
Figure A.17: Load case (N,V,M) = (3, -1, -330).

Detta är en tom sida!
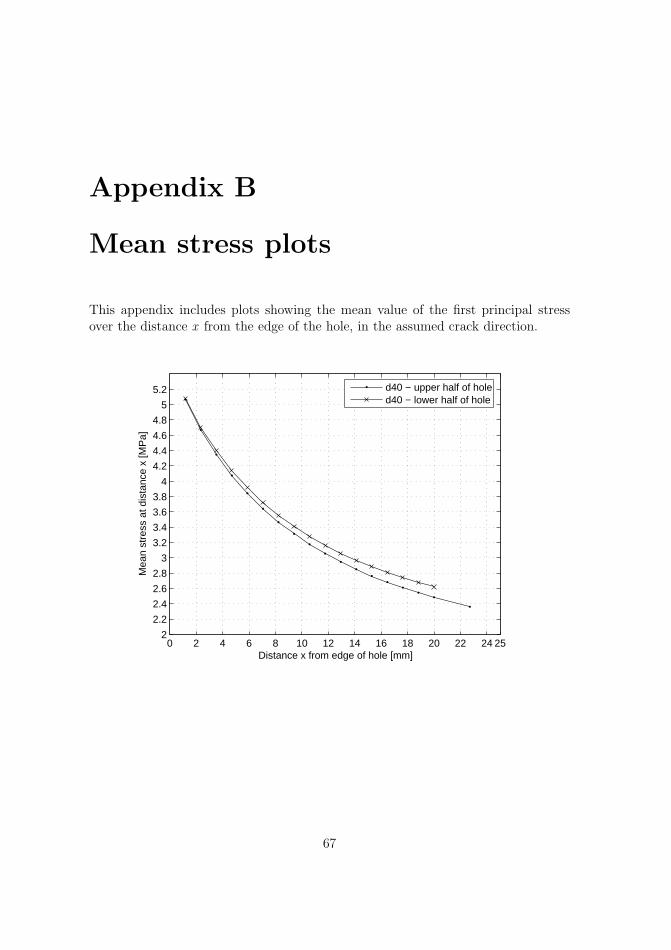
Appendix B
Mean stress plots
This appendix includes plots showing the mean value of the first principal stressover the distance x from the edge of the hole, in the assumed crack direction.
0 2 4 6 8 10 12 14 16 18 20 22 24 252
2.2
2.4
2.6
2.8
3
3.2
3.4
3.6
3.8
4
4.2
4.4
4.6
4.8
5
5.2
Distance x from edge of hole [mm]
Mea
n st
ress
at d
ista
nce
x [M
Pa]
d40 − upper half of holed40 − lower half of hole
67
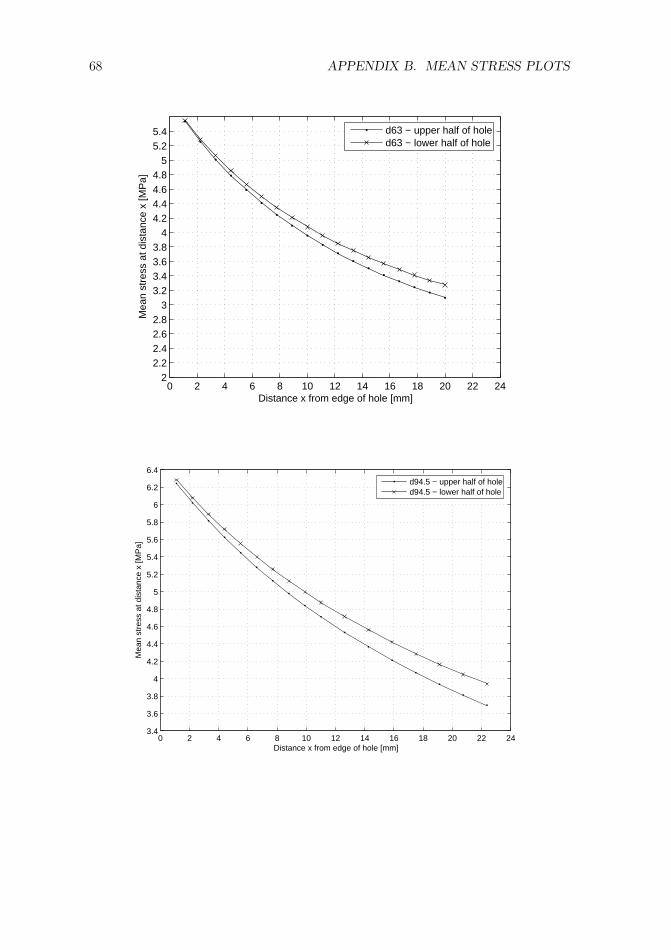
68 APPENDIX B. MEAN STRESS PLOTS
0 2 4 6 8 10 12 14 16 18 20 22 242
2.22.42.62.8
33.23.43.63.8
44.24.44.64.8
55.25.4
Distance x from edge of hole [mm]
Mea
n st
ress
at d
ista
nce
x [M
Pa]
d63 − upper half of holed63 − lower half of hole
0 2 4 6 8 10 12 14 16 18 20 22 243.4
3.6
3.8
4
4.2
4.4
4.6
4.8
5
5.2
5.4
5.6
5.8
6
6.2
6.4
Distance x from edge of hole [mm]
Mea
n st
ress
at d
ista
nce
x [M
Pa]
d94.5 − upper half of holed94.5 − lower half of hole
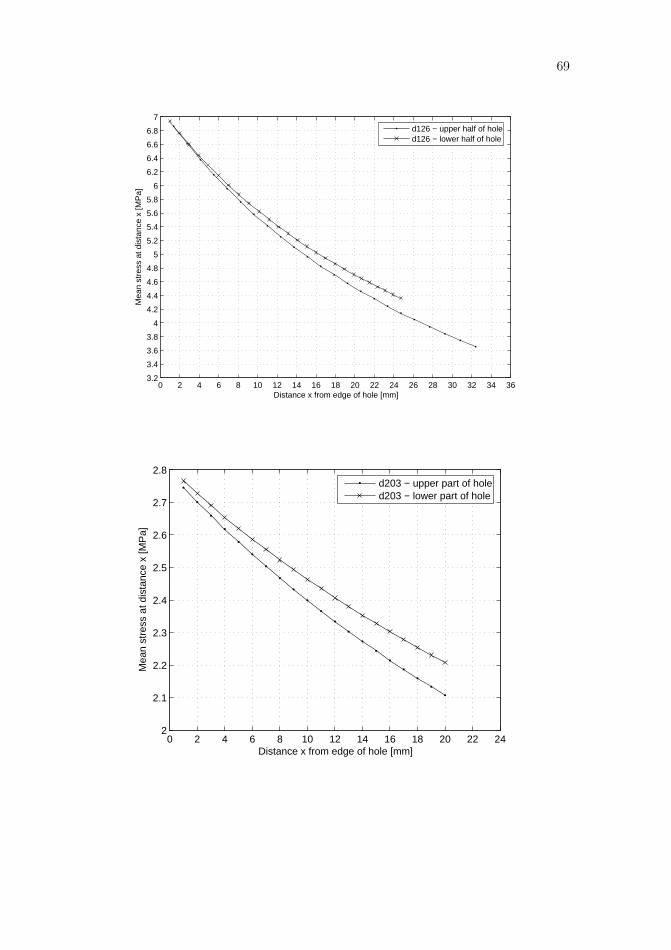
69
0 2 4 6 8 10 12 14 16 18 20 22 24 26 28 30 32 34 363.2
3.4
3.6
3.8
4
4.2
4.4
4.6
4.8
5
5.2
5.4
5.6
5.8
6
6.2
6.4
6.6
6.8
7
Distance x from edge of hole [mm]
Mea
n st
ress
at d
ista
nce
x [M
Pa]
d126 − upper half of holed126 − lower half of hole
0 2 4 6 8 10 12 14 16 18 20 22 242
2.1
2.2
2.3
2.4
2.5
2.6
2.7
2.8
Distance x from edge of hole [mm]
Mea
n st
ress
at d
ista
nce
x [M
Pa]
d203 − upper part of holed203 − lower part of hole
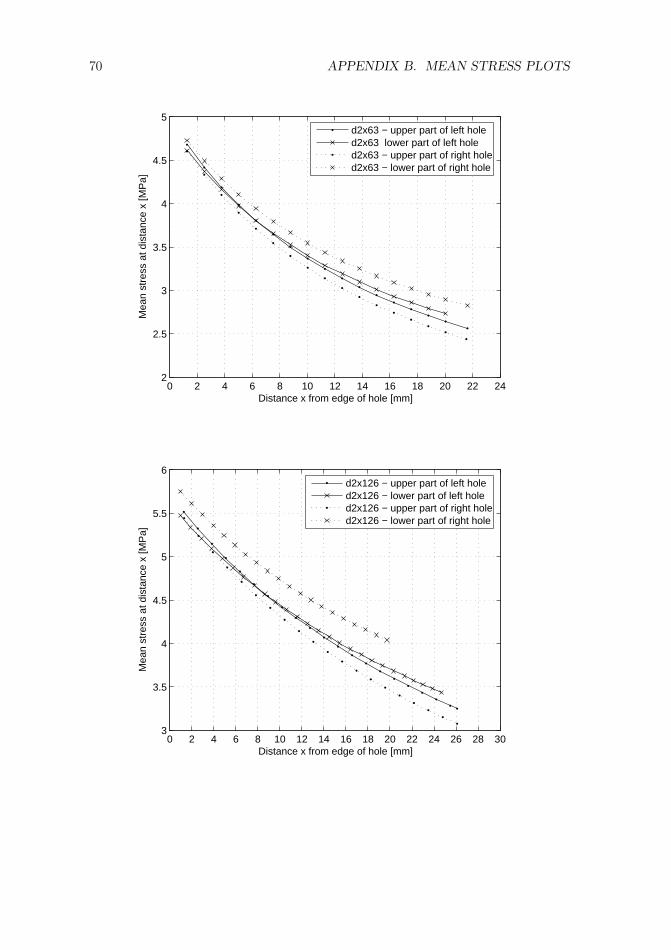
70 APPENDIX B. MEAN STRESS PLOTS
0 2 4 6 8 10 12 14 16 18 20 22 242
2.5
3
3.5
4
4.5
5
Distance x from edge of hole [mm]
Mea
n st
ress
at d
ista
nce
x [M
Pa]
d2x63 − upper part of left holed2x63 lower part of left holed2x63 − upper part of right holed2x63 − lower part of right hole
0 2 4 6 8 10 12 14 16 18 20 22 24 26 28 303
3.5
4
4.5
5
5.5
6
Distance x from edge of hole [mm]
Mea
n st
ress
at d
ista
nce
x [M
Pa]
d2x126 − upper part of left holed2x126 − lower part of left holed2x126 − upper part of right holed2x126 − lower part of right hole
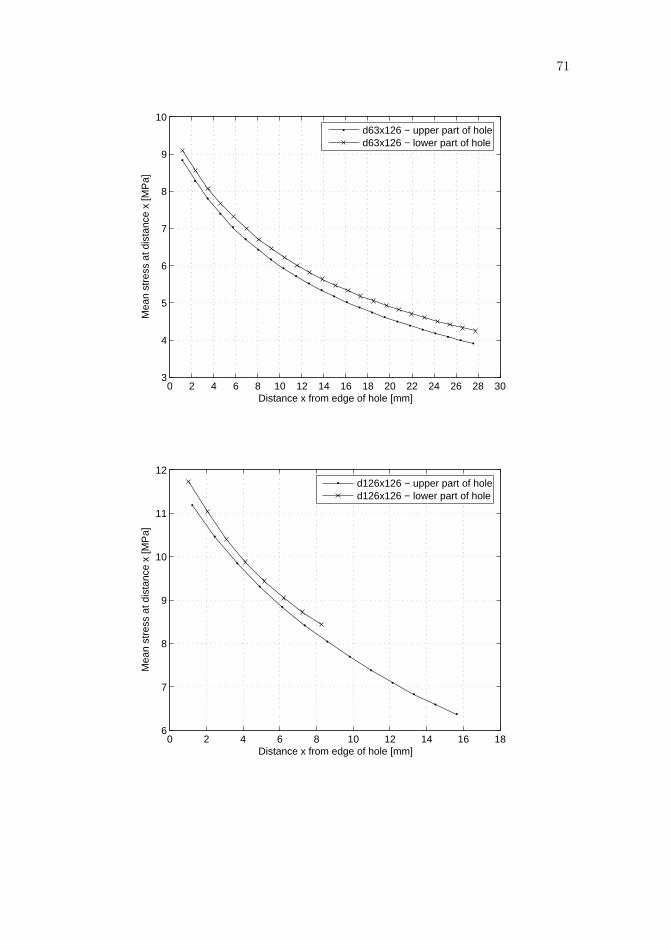
71
0 2 4 6 8 10 12 14 16 18 20 22 24 26 28 303
4
5
6
7
8
9
10
Distance x from edge of hole [mm]
Mea
n st
ress
at d
ista
nce
x [M
Pa]
d63x126 − upper part of holed63x126 − lower part of hole
0 2 4 6 8 10 12 14 16 186
7
8
9
10
11
12
Distance x from edge of hole [mm]
Mea
n st
ress
at d
ista
nce
x [M
Pa]
d126x126 − upper part of holed126x126 − lower part of hole
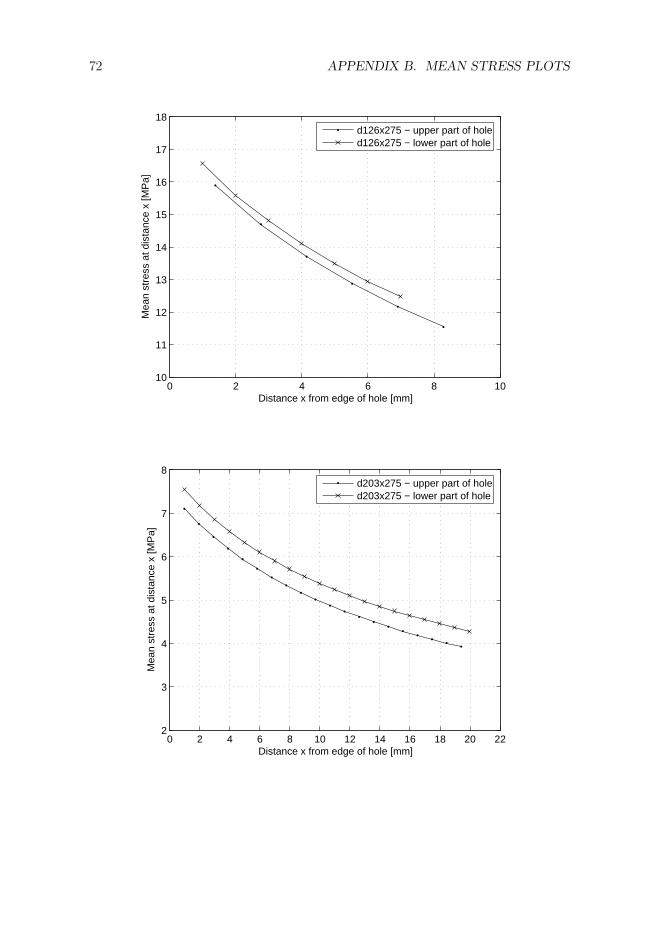
72 APPENDIX B. MEAN STRESS PLOTS
0 2 4 6 8 1010
11
12
13
14
15
16
17
18
Distance x from edge of hole [mm]
Mea
n st
ress
at d
ista
nce
x [M
Pa]
d126x275 − upper part of holed126x275 − lower part of hole
0 2 4 6 8 10 12 14 16 18 20 222
3
4
5
6
7
8
Distance x from edge of hole [mm]
Mea
n st
ress
at d
ista
nce
x [M
Pa]
d203x275 − upper part of holed203x275 − lower part of hole


![Strengthening Defected Dam Gates under Cavitation ...journals.modares.ac.ir/article-15-25449-fa.pdf · bonded FRP [7] Failure mode analyses of reinforced concrete beams strengthened](https://img.pdfslide.us/doc/110x75/5fb90acd0c818f6d767fedcb/strengthening-defected-dam-gates-under-cavitation-bonded-frp-7-failure-mode.jpg)