Embed Size (px)
Citation preview
Interim Financial Statements
FRONT STREET SPECIAL OPPORTUNITIES CLASS
FOR THE SIX MONTHS PERIOD ENDED APRIL 30, 2017
NOTICE OF NO AUDITOR REVIEW OF THE INTERIM FINANCIAL STATEMENTS The accompanying interim financial statements have not been reviewed by the external auditors of the Fund in accordance with standards established by the Chartered Professional Accountants of Canada. The external auditors will be auditing the annual financial statements of the Fund in accordance with Canadian generally accepted auditing standards.
FRONT STREET SPECIAL OPPORTUNITIES CLASS
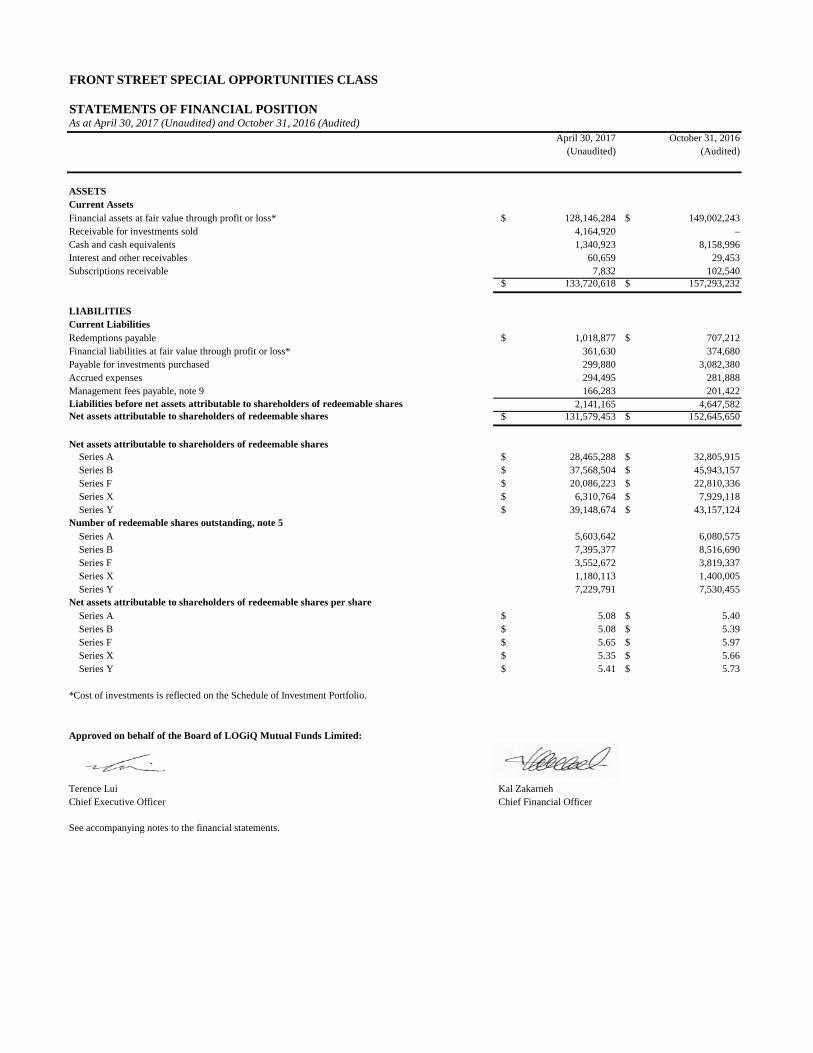
STATEMENTS OF FINANCIAL POSITIONAs at April 30, 2017 (Unaudited) and October 31, 2016 (Audited)
April 30, 2017 October 31, 2016 (Unaudited) (Audited)
ASSETSCurrent AssetsFinancial assets at fair value through profit or loss* $ 128,146,284 $ 149,002,243 Receivable for investments sold 4,164,920 – Cash and cash equivalents 1,340,923 8,158,996 Interest and other receivables 60,659 29,453 Subscriptions receivable 7,832 102,540
$ 133,720,618 $ 157,293,232
LIABILITIESCurrent LiabilitiesRedemptions payable $ 1,018,877 $ 707,212 Financial liabilities at fair value through profit or loss* 361,630 374,680 Payable for investments purchased 299,880 3,082,380 Accrued expenses 294,495 281,888 Management fees payable, note 9 166,283 201,422 Liabilities before net assets attributable to shareholders of redeemable shares 2,141,165 4,647,582 Net assets attributable to shareholders of redeemable shares $ 131,579,453 $ 152,645,650
Series A $ 28,465,288 $ 32,805,915 Series B $ 37,568,504 $ 45,943,157 Series F $ 20,086,223 $ 22,810,336 Series X $ 6,310,764 $ 7,929,118 Series Y $ 39,148,674 $ 43,157,124
Number of redeemable shares outstanding, note 5Series A 5,603,642 6,080,575 Series B 7,395,377 8,516,690 Series F 3,552,672 3,819,337 Series X 1,180,113 1,400,005 Series Y 7,229,791 7,530,455
Net assets attributable to shareholders of redeemable shares per shareSeries A $ 5.08 $ 5.40 Series B $ 5.08 $ 5.39 Series F $ 5.65 $ 5.97 Series X $ 5.35 $ 5.66 Series Y $ 5.41 $ 5.73
*Cost of investments is reflected on the Schedule of Investment Portfolio.
Approved on behalf of the Board of LOGiQ Mutual Funds Limited:
Terence Lui Kal ZakarnehChief Executive Officer Chief Financial Officer
See accompanying notes to the financial statements.
Net assets attributable to shareholders of redeemable shares
FRONT STREET SPECIAL OPPORTUNITIES CLASS
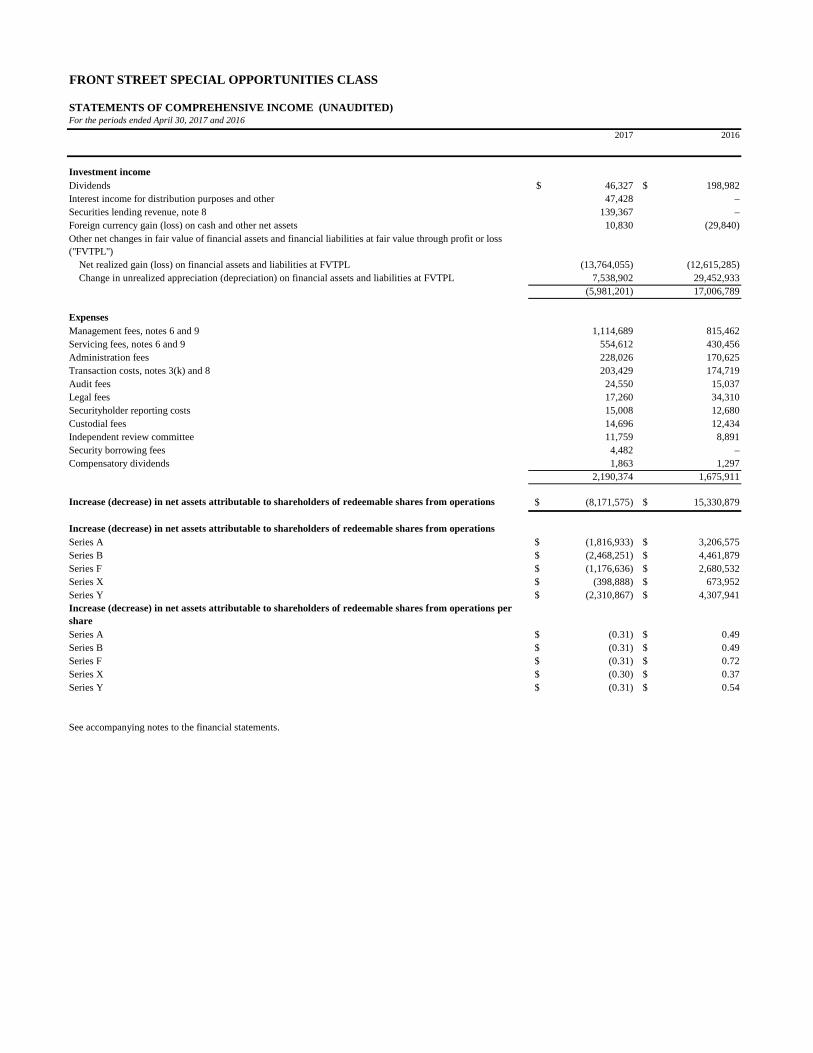
STATEMENTS OF COMPREHENSIVE INCOME (UNAUDITED)For the periods ended April 30, 2017 and 2016
2017 2016
Investment incomeDividends $ 46,327 $ 198,982 Interest income for distribution purposes and other 47,428 – Securities lending revenue, note 8 139,367 – Foreign currency gain (loss) on cash and other net assets 10,830 (29,840) Other net changes in fair value of financial assets and financial liabilities at fair value through profit or loss ("FVTPL")
Net realized gain (loss) on financial assets and liabilities at FVTPL (13,764,055) (12,615,285) Change in unrealized appreciation (depreciation) on financial assets and liabilities at FVTPL 7,538,902 29,452,933
(5,981,201) 17,006,789
ExpensesManagement fees, notes 6 and 9 1,114,689 815,462 Servicing fees, notes 6 and 9 554,612 430,456 Administration fees 228,026 170,625 Transaction costs, notes 3(k) and 8 203,429 174,719 Audit fees 24,550 15,037 Legal fees 17,260 34,310 Securityholder reporting costs 15,008 12,680 Custodial fees 14,696 12,434 Independent review committee 11,759 8,891 Security borrowing fees 4,482 – Compensatory dividends 1,863 1,297
2,190,374 1,675,911
Increase (decrease) in net assets attributable to shareholders of redeemable shares from operations $ (8,171,575) $ 15,330,879
Increase (decrease) in net assets attributable to shareholders of redeemable shares from operationsSeries A $ (1,816,933) $ 3,206,575 Series B $ (2,468,251) $ 4,461,879 Series F $ (1,176,636) $ 2,680,532 Series X $ (398,888) $ 673,952 Series Y $ (2,310,867) $ 4,307,941 Increase (decrease) in net assets attributable to shareholders of redeemable shares from operations per shareSeries A $ (0.31) $ 0.49 Series B $ (0.31) $ 0.49 Series F $ (0.31) $ 0.72 Series X $ (0.30) $ 0.37 Series Y $ (0.31) $ 0.54
See accompanying notes to the financial statements.
FRONT STREET SPECIAL OPPORTUNITIES CLASS
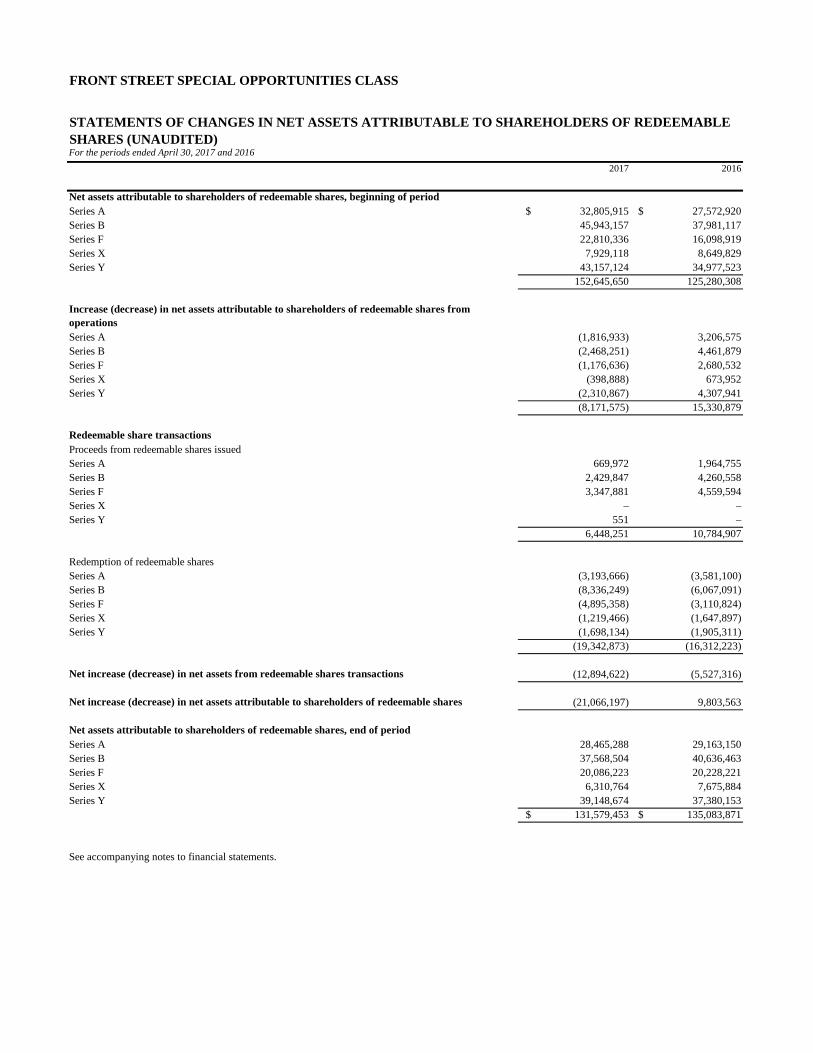
For the periods ended April 30, 2017 and 20162017 2016
Net assets attributable to shareholders of redeemable shares, beginning of periodSeries A $ 32,805,915 $ 27,572,920 Series B 45,943,157 37,981,117 Series F 22,810,336 16,098,919 Series X 7,929,118 8,649,829 Series Y 43,157,124 34,977,523
152,645,650 125,280,308
Increase (decrease) in net assets attributable to shareholders of redeemable shares from operationsSeries A (1,816,933) 3,206,575 Series B (2,468,251) 4,461,879 Series F (1,176,636) 2,680,532 Series X (398,888) 673,952 Series Y (2,310,867) 4,307,941
(8,171,575) 15,330,879
Redeemable share transactionsProceeds from redeemable shares issuedSeries A 669,972 1,964,755 Series B 2,429,847 4,260,558 Series F 3,347,881 4,559,594 Series X – – Series Y 551 –
6,448,251 10,784,907
Redemption of redeemable sharesSeries A (3,193,666) (3,581,100) Series B (8,336,249) (6,067,091) Series F (4,895,358) (3,110,824) Series X (1,219,466) (1,647,897) Series Y (1,698,134) (1,905,311)
(19,342,873) (16,312,223)
Net increase (decrease) in net assets from redeemable shares transactions (12,894,622) (5,527,316)
Net increase (decrease) in net assets attributable to shareholders of redeemable shares (21,066,197) 9,803,563
Net assets attributable to shareholders of redeemable shares, end of periodSeries A 28,465,288 29,163,150 Series B 37,568,504 40,636,463 Series F 20,086,223 20,228,221 Series X 6,310,764 7,675,884 Series Y 39,148,674 37,380,153
$ 131,579,453 $ 135,083,871
See accompanying notes to financial statements.
STATEMENTS OF CHANGES IN NET ASSETS ATTRIBUTABLE TO SHAREHOLDERS OF REDEEMABLE SHARES (UNAUDITED)
FRONT STREET SPECIAL OPPORTUNITIES CLASS
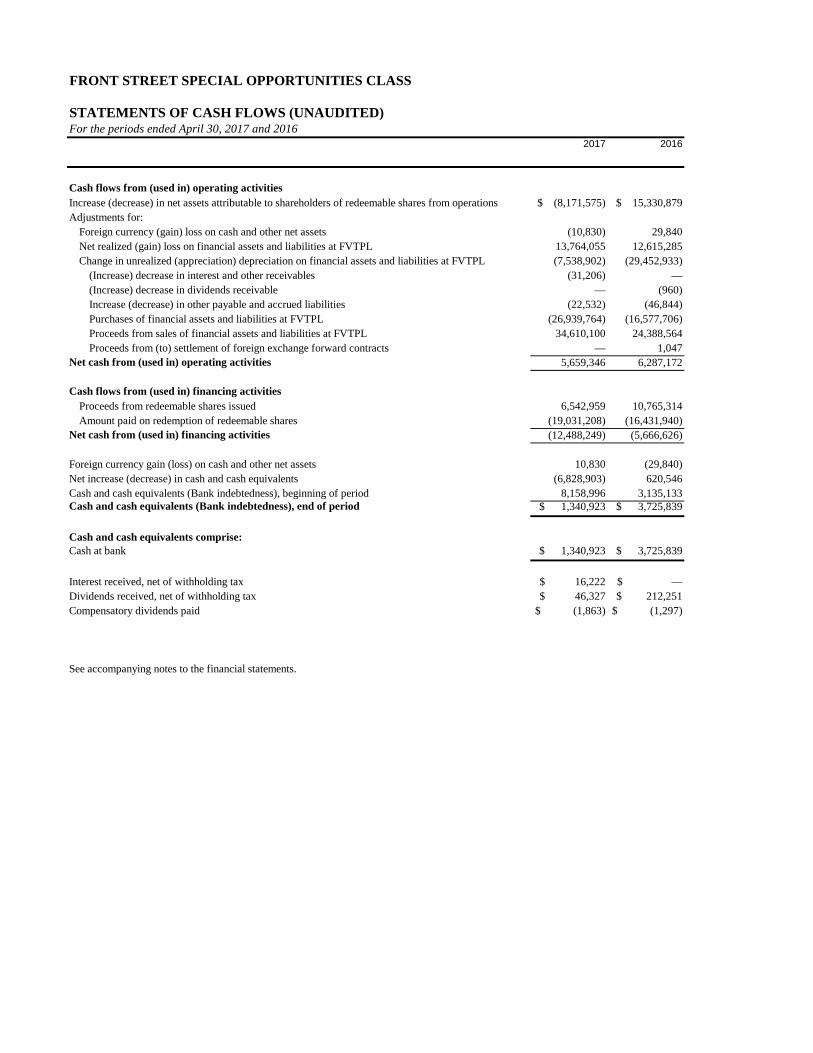
STATEMENTS OF CASH FLOWS (UNAUDITED)
2017 2016
Cash flows from (used in) operating activitiesIncrease (decrease) in net assets attributable to shareholders of redeemable shares from operations $ (8,171,575) $ 15,330,879 Adjustments for:
Foreign currency (gain) loss on cash and other net assets (10,830) 29,840 Net realized (gain) loss on financial assets and liabilities at FVTPL 13,764,055 12,615,285 Change in unrealized (appreciation) depreciation on financial assets and liabilities at FVTPL (7,538,902) (29,452,933)
(Increase) decrease in interest and other receivables (31,206) — (Increase) decrease in dividends receivable — (960) Increase (decrease) in other payable and accrued liabilities (22,532) (46,844) Purchases of financial assets and liabilities at FVTPL (26,939,764) (16,577,706) Proceeds from sales of financial assets and liabilities at FVTPL 34,610,100 24,388,564 Proceeds from (to) settlement of foreign exchange forward contracts — 1,047
Net cash from (used in) operating activities 5,659,346 6,287,172
Cash flows from (used in) financing activitiesProceeds from redeemable shares issued 6,542,959 10,765,314 Amount paid on redemption of redeemable shares (19,031,208) (16,431,940)
Net cash from (used in) financing activities (12,488,249) (5,666,626)
Foreign currency gain (loss) on cash and other net assets 10,830 (29,840) Net increase (decrease) in cash and cash equivalents (6,828,903) 620,546 Cash and cash equivalents (Bank indebtedness), beginning of period 8,158,996 3,135,133 Cash and cash equivalents (Bank indebtedness), end of period $ 1,340,923 $ 3,725,839
Cash and cash equivalents comprise:Cash at bank $ 1,340,923 $ 3,725,839
Interest received, net of withholding tax $ 16,222 $ — Dividends received, net of withholding tax $ 46,327 $ 212,251 Compensatory dividends paid $ (1,863) $ (1,297)
See accompanying notes to the financial statements.
For the periods ended April 30, 2017 and 2016
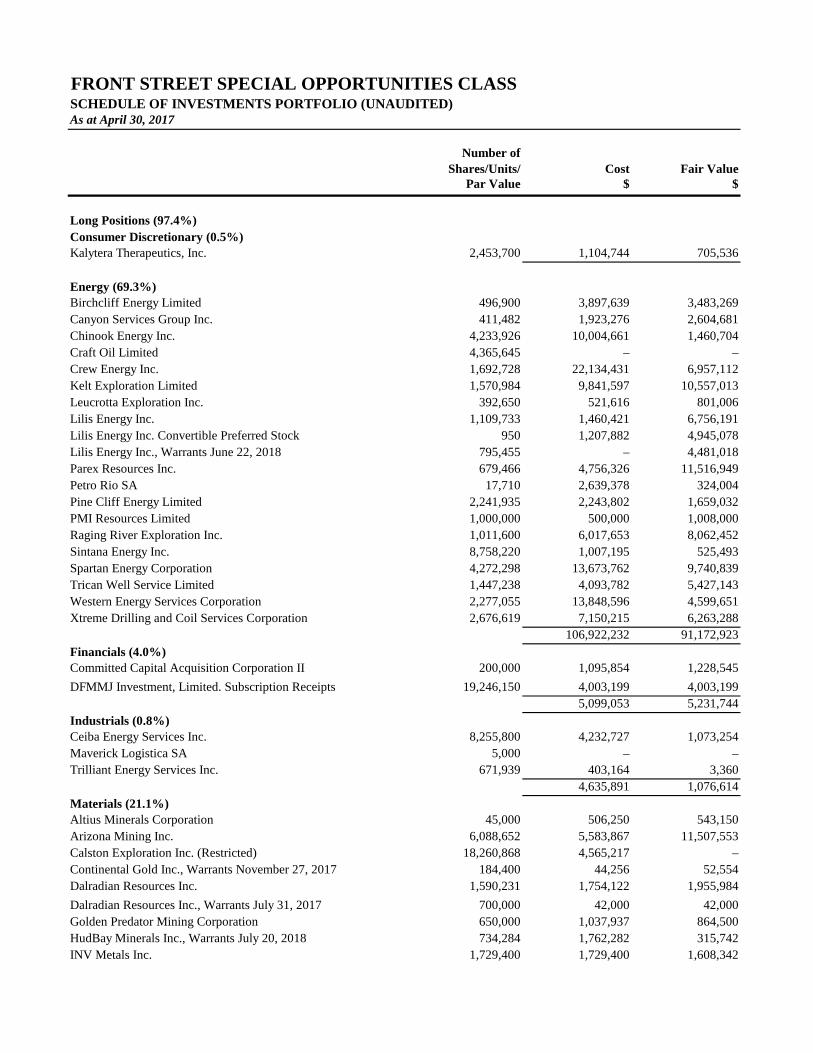
As at April 30, 2017
Number of Shares/Units/ Cost Fair Value
Par Value $ $
Kalytera Therapeutics, Inc. 2,453,700 1,104,744 705,536
Birchcliff Energy Limited 496,900 3,897,639 3,483,269Canyon Services Group Inc. 411,482 1,923,276 2,604,681Chinook Energy Inc. 4,233,926 10,004,661 1,460,704Craft Oil Limited 4,365,645 – –Crew Energy Inc. 1,692,728 22,134,431 6,957,112Kelt Exploration Limited 1,570,984 9,841,597 10,557,013Leucrotta Exploration Inc. 392,650 521,616 801,006Lilis Energy Inc. 1,109,733 1,460,421 6,756,191Lilis Energy Inc. Convertible Preferred Stock 950 1,207,882 4,945,078Lilis Energy Inc., Warrants June 22, 2018 795,455 – 4,481,018Parex Resources Inc. 679,466 4,756,326 11,516,949Petro Rio SA 17,710 2,639,378 324,004Pine Cliff Energy Limited 2,241,935 2,243,802 1,659,032PMI Resources Limited 1,000,000 500,000 1,008,000Raging River Exploration Inc. 1,011,600 6,017,653 8,062,452Sintana Energy Inc. 8,758,220 1,007,195 525,493Spartan Energy Corporation 4,272,298 13,673,762 9,740,839Trican Well Service Limited 1,447,238 4,093,782 5,427,143Western Energy Services Corporation 2,277,055 13,848,596 4,599,651Xtreme Drilling and Coil Services Corporation 2,676,619 7,150,215 6,263,288
106,922,232 91,172,923
Committed Capital Acquisition Corporation II 200,000 1,095,854 1,228,545DFMMJ Investment, Limited. Subscription Receipts 19,246,150 4,003,199 4,003,199
5,099,053 5,231,744
Ceiba Energy Services Inc. 8,255,800 4,232,727 1,073,254Maverick Logistica SA 5,000 – –Trilliant Energy Services Inc. 671,939 403,164 3,360
4,635,891 1,076,614
Altius Minerals Corporation 45,000 506,250 543,150Arizona Mining Inc. 6,088,652 5,583,867 11,507,553Calston Exploration Inc. (Restricted) 18,260,868 4,565,217 –Continental Gold Inc., Warrants November 27, 2017 184,400 44,256 52,554Dalradian Resources Inc. 1,590,231 1,754,122 1,955,984Dalradian Resources Inc., Warrants July 31, 2017 700,000 42,000 42,000Golden Predator Mining Corporation 650,000 1,037,937 864,500HudBay Minerals Inc., Warrants July 20, 2018 734,284 1,762,282 315,742INV Metals Inc. 1,729,400 1,729,400 1,608,342
FRONT STREET SPECIAL OPPORTUNITIES CLASSSCHEDULE OF INVESTMENTS PORTFOLIO (UNAUDITED)
Long Positions (97.4%)Consumer Discretionary (0.5%)
Energy (69.3%)
Financials (4.0%)
Industrials (0.8%)
Materials (21.1%)
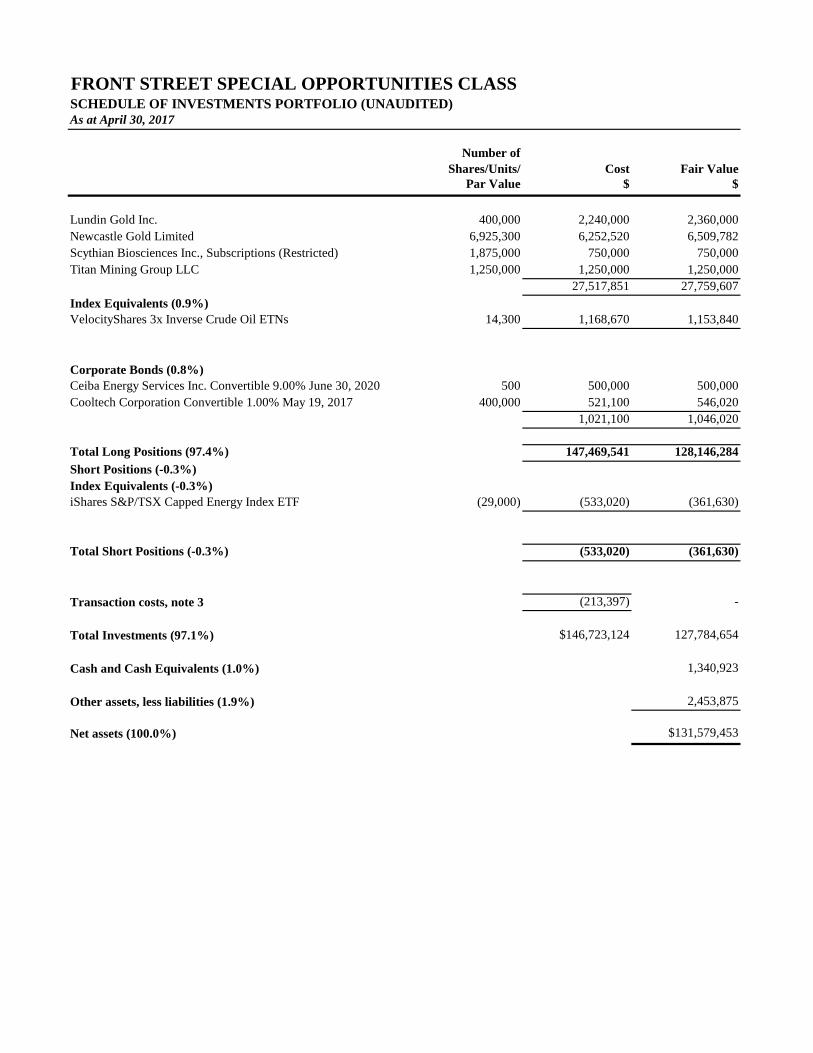
As at April 30, 2017
Number of Shares/Units/ Cost Fair Value
Par Value $ $
FRONT STREET SPECIAL OPPORTUNITIES CLASSSCHEDULE OF INVESTMENTS PORTFOLIO (UNAUDITED)
Lundin Gold Inc. 400,000 2,240,000 2,360,000Newcastle Gold Limited 6,925,300 6,252,520 6,509,782Scythian Biosciences Inc., Subscriptions (Restricted) 1,875,000 750,000 750,000Titan Mining Group LLC 1,250,000 1,250,000 1,250,000
27,517,851 27,759,607
VelocityShares 3x Inverse Crude Oil ETNs 14,300 1,168,670 1,153,840
Ceiba Energy Services Inc. Convertible 9.00% June 30, 2020 500 500,000 500,000Cooltech Corporation Convertible 1.00% May 19, 2017 400,000 521,100 546,020
1,021,100 1,046,020
Total Long Positions (97.4%) 147,469,541 128,146,284
iShares S&P/TSX Capped Energy Index ETF (29,000) (533,020) (361,630)
Total Short Positions (-0.3%) (533,020) (361,630)
(213,397) -
$146,723,124 127,784,654
1,340,923
2,453,875
$131,579,453
Transaction costs, note 3
Short Positions (-0.3%)Index Equivalents (-0.3%)
Index Equivalents (0.9%)
Corporate Bonds (0.8%)
Net assets (100.0%)
Total Investments (97.1%)
Cash and Cash Equivalents (1.0%)
Other assets, less liabilities (1.9%)
FRONT STREET SPECIAL OPPORTUNITIES CLASS NOTES TO THE FINANCIAL STATEMENTS APRIL 30, 2017 AND 2016 (UNAUDITED)
1. THE FUND
Front Street Special Opportunities Class (the "Fund") is a class of shares of Front Street Mutual Funds Limited (the "Corporation"), a mutual fund corporation incorporated under the Canada Business Corporations Act on April 11, 2006, and is authorized to issue an unlimited number of classes of shares in multiple series. The Fund's registered address is 77 King Street West, 21st Floor, Toronto, Ontario, Canada, M5K 1G8.
Pursuant to an amalgamation of Front Street Mutual Funds Limited and Front Street Special Opportunities Canadian Fund Ltd. on December 1, 2009, a new class of shares of Front Street Mutual Funds Limited was created, being Front Street Special Opportunities Canadian Fund (of which Series A, B, F, X and Y shares were created). Existing shareholders of the Series A, Series B and Series F shares of the Front Street Special Opportunities Canadian Fund Ltd. received Series X, Series Y or Series F shares respectively of Front Street Special Opportunities Canadian Fund class of shares of Front Street Mutual Funds Limited.
Pursuant to the notice of change in legal structure, the name of the Fund was changed to Front Street Special Opportunities Class on June 27, 2012. Reference is made to the Fund's Simplified Prospectus for additional information on the Fund's structure. On January 26, 2016, Front Street U.S. MLP Income Fund Ltd. amalgamated with Front Street Mutual Funds Limited.
The foregoing interim financial statements and accompanying notes to the financial statements presented herein are for the Fund. Separate financial statements of each of the other classes of shares of the Corporation have also been prepared as at April 30, 2017.
LOGiQ Capital 2016 (formerly Front Street Capital 2004) is the Manager of the Fund (the “Manager”). Effective November 16, 2015, CIBC Mellon replaced RBC Investor Services Trust as the custodian and replaced Citigroup Fund Services Canada, to provide shareholder recordkeeping services and fund accounting services.
The Fund's investment objective is to provide Fund security holders capital appreciation through the investment in equity securities of companies whose product, service or management team the Investor Advisor believes can realize value and growth. The Manager may rely on "top down" fundamental research to identify equity securities of companies in a particular industry or sector, but portfolio diversification will be driven primarily from the Fund's investments, as opposed to targeting sector weights.
FRONT STREET SPECIAL OPPORTUNITIES CLASS NOTES TO THE FINANCIAL STATEMENTS APRIL 30, 2017 AND 2016 (UNAUDITED)
2. BASIS OF PRESENTATION (a) Statement of compliance
These interim financial statements have been prepared in accordance with International Financial Reporting Standards ("IFRS") as published by the International Accounting Standards Board ("IASB").
These interim financial statements were authorized for issue by the Board of Directors on June 28, 2017.
(b) Basis of preparation
These interim financial statements have been prepared on the IFRS Standards that are published at the time of preparation and that are effective as at April 30, 2017 the Fund's interim reporting date.
(c) Basis of measurement
These interim financial statements have been prepared on the historical cost basis, except for financial assets and liabilities at fair value through profit or loss which are measured at fair value.
(d) Functional and presentation currency
The interim financial statements have been presented in Canadian dollars, which is the Fund's functional currency, and all values are rounded to the nearest dollar except where otherwise indicated.
3. SUMMARY OF SIGNIFICANT ACCOUNTING POLICIES
The accounting policies described below have been applied consistently to all periods presented in these interim financial statements.
(a) Financial instruments:
Classification of financial instruments
The Fund classifies its financial assets and financial liabilities at initial recognition into the following categories, in accordance with IAS 39, Financial Instruments: Recognition and Measurement:
FRONT STREET SPECIAL OPPORTUNITIES CLASS NOTES TO THE FINANCIAL STATEMENTS APRIL 30, 2017 AND 2016 (UNAUDITED)
3. SUMMARY OF SIGNIFICANT ACCOUNTING POLICIES (Continued...)
(a) Financial instruments: (Continued...)
Financial assets and liabilities at fair value through profit or loss
The category of financial assets and liabilities at fair value through profit or loss is sub-divided into the following two sub-categories.
Financial assets and liabilities held for trading: financial assets are classified as held for trading if they are acquired for the purpose of selling and/or repurchasing in the near term. Derivatives are classified as held for trading unless they are designated as effective hedging instruments as defined by IAS 39. The Fund’s policy is not to apply hedge accounting.
Financial instruments designated as fair value through profit or loss upon initial recognition: these include equities, treasury bills, and other interest-bearing investments. These financial assets are designated upon initial recognition on the basis that they are part of a group of financial assets that are managed and have their performance evaluated on a fair value basis, in accordance with risk management and investment strategies of the Fund as set out in the Fund’s Investment Guidelines.
The Fund recognizes financial instruments at fair value upon initial recognition. Transaction costs
include brokerage commissions incurred in the purchase and sale of portfolio investments in which the Fund invests. All such costs are expensed in the period incurred and presented in the statements of comprehensive income. Purchases and sales of financial assets are recognized at their trade date. The Fund's investments and derivative assets and liabilities are measured at fair value through profit or loss (FVTPL), including certain investments in debt securities which have been designated at FVTPL. The Fund's obligations for net assets attributable to shareholders of redeemable shares are presented at the redemption amount. All other financial assets and liabilities are measured at amortized cost. Under this method, financial assets and liabilities reflect the amount required to be received or paid, discounted, when appropriate, at the contract's effective interest rate. The Fund's accounting policies for measuring the fair value of its investments and derivatives, except for warrants classified as level 2 are identical to those used in measuring its net asset value ("NAV") for transactions with shareholders.
Financial assets and financial liabilities are offset and the net amount reported in the statements of
financial position if there is a currently enforceable legal right to offset the recognized amounts and there is an intention to settle on a net basis, or to realize the asset and settle the liability simultaneously. Quantitative information on the impact on the Fund’s statements of financial position if all amounts were set off is required.
FRONT STREET SPECIAL OPPORTUNITIES CLASS NOTES TO THE FINANCIAL STATEMENTS APRIL 30, 2017 AND 2016 (UNAUDITED)
3. SUMMARY OF SIGNIFICANT ACCOUNTING POLICIES (Continued...)
(b) Fair value measurement:
The Fund’s portfolio investments are classified as fair value through profit or loss (“FVTPL”). Any unrealized gain or loss arising due to changes in fair value during the reporting period is presented separately in the statements of comprehensive income. Portfolio investments cannot be reclassified out of the FVTPL category while they are held.
Fair value is the price that would be received to sell an asset or paid to transfer a liability in a transaction between market participants at the measurement date. The fair value of financial instruments traded in active markets should be measured based on a price within the bid and ask spread that is most representative of fair value and allows the use of mid-market pricing or other pricing conventions that are used by market participants as a practical expedient for fair value measurement within a bid-ask spread. The Fund has determined the closing sale price to be most reflective of fair value unless this price is outside the bid and ask spread. When the closing sale price of financial instruments traded in active markets is outside the bid and ask spread, such financial instruments are measured based on the bid price for securities owned or held long and on the asking price for securities sold short. The fair value of financial instruments not traded in an active market (including, but not limited to securities in private companies, warrants and restricted securities) are determined using valuation techniques. Depending on the circumstances, the Fund may use several methods and make assumptions based on market conditions existing at each reporting date. Valuation techniques may include, without limitation, the use of comparable recent arm’s length transactions, discounted cash flow analysis, option-pricing models and other valuation techniques commonly used by market participants. Estimated fair values for investments in securities not traded in an active market are based on inherent uncertainties and the resulting values may differ from values that would have been used had a ready market existed for such investments.
The fair value of financial instruments which are restricted as to transferability are valued at the fair
value of the unrestricted investment as provided above less a discount of 2% per month up to four months.
Short-term investments, if any, are valued at the aggregate of cost and accrued interest receivable,
which approximates fair value.
For financial statement reporting purposes, under National Instrument 81-106 (“NI 81-106”) the Fund is required to disclose the differences between net assets attributable to redeemable shares per share and net asset value per share, including any differences in valuation principles or practices for the purposes of calculating net asset value versus those required under IFRS. A reconciliation between the net assets attributable to redeemable shares per share for financial reporting purposes and net asset value for investor transactions is presented in note 11 (Reconciliation of Net Asset Value to IFRS Net Assets Attributable to Shareholders of Redeemable Shares).
Investments in mutual funds or pooled funds are valued based on the net asset value per share at the
close of trading on the financial statement date.
FRONT STREET SPECIAL OPPORTUNITIES CLASS NOTES TO THE FINANCIAL STATEMENTS APRIL 30, 2017 AND 2016 (UNAUDITED)
3. SUMMARY OF SIGNIFICANT ACCOUNTING POLICIES (Continued...)
(c) Cash and cash equivalents
Cash and cash equivalents comprise deposits with banks and highly liquid financial assets with maturities of three months or less from the acquisition date that are subject to an insignificant risk of changes in their fair value and are used by the Fund in the management of short-term commitments, other than cash collateral provided in respect of derivatives and securities borrowing transactions.
(d) Redeemable shares
The Fund classifies redeemable shares issued as financial liabilities or equity instruments in accordance with the substance of the contractual terms of the instruments. The Fund has multiple classes of redeemable shares that do not have identical features and therefore, do not qualify as equity under IAS 32, Financial Instruments. The redeemable shares, which are classified as financial liabilities and measured at redemption amount, provide investors with the right to require redemption, subject to available liquidity, for cash at a share price based on the Fund's valuation policies at each redemption date. The shares represent the residual interest in the Fund.
(e) Impairment of financial assets
At the end of each reporting period, the Fund reviews its financial assets that are carried at amortized cost for any objective evidence that a financial asset or group of financial assets is impaired. If there is objective evidence that an impairment loss has been incurred, the amount of the loss is measured and recognized as the difference between the asset's carrying amount and the present value of estimated future cash flows (excluding future credit losses that have not been incurred) discounted at the financial asset's original effective interest rate. If, in a subsequent period, the amount of the impairment loss decreases and the decrease can be related objectively to an event occurring after the impairment was recognized, the previously recognized impairment loss shall be reversed.
(f) Investment transactions and income recognition
Investment transactions are accounted for on a trade date basis. Realized gains and losses are
calculated on a weighted average cost basis.
Revenue from investments is recognized on the accrual basis. Interest for distribution purposes shown on the statements of comprehensive income represents the coupon interest received by the Fund accounted for on an accrual basis and is recognized through profit and loss. Dividend revenue is recognized on the ex-dividend date.
FRONT STREET SPECIAL OPPORTUNITIES CLASS NOTES TO THE FINANCIAL STATEMENTS APRIL 30, 2017 AND 2016 (UNAUDITED)
3. SUMMARY OF SIGNIFICANT ACCOUNTING POLICIES (Continued...)
(g) Securities lending, repurchase and reverse repurchase transactions
The Fund is permitted to enter into securities lending, repurchase and reverse repurchase transactions as set out in the Simplified Prospectus. These transactions involve the temporary exchange of securities for collateral with a commitment to redeliver the same securities on a future date. The value of cash or securities held as collateral must at least 102% of the fair value of the securities loaned, sold or purchased. Income is earned from these transactions in the form of fees paid by the counterparty and, in certain circumstances, interest paid on cash or securities held as collateral. Income earned from these transactions is recognized on an accrual basis and included in the statements of comprehensive income under the heading securities lending revenue.
(h) Foreign currency translation
The fair value of investments and derivatives, other assets and liabilities denominated in foreign currencies are translated at the exchange rate between the functional currency and the foreign currency at each of the valuation date. Foreign currency transactions, including purchase and sales of investments, investment income and expenses are translated at the exchange rate between the functional currency and the foreign currency at the date of the transaction.
Realized and unrealized exchange gains and losses on foreign currency cash and cash equivalents and
other assets and liabilities are presented as “Foreign currency gain (loss) on cash and cash equivalents and other net assets”. Realized and unrealized exchange gains and losses on investments and derivatives are presented within “Other net changes in fair value of financial assets and financial liabilities at fair value through profit or loss”.
(i) Increase (decrease) in net assets attributable to shareholders of redeemable shares from operations
per share
Increase (decrease) in net assets attributable to shareholders of redeemable shares from operations per share is calculated by dividing the increase (decrease) in net assets attributable to shareholders of redeemable shares from operations of a series by the average number of shares outstanding of that series during the period.
(j) Net assets attributable to shareholders of redeemable shares per share
The net assets attributable to shareholders of redeemable shares per share are calculated by dividing
the net assets of a series of shares by the total number of redeemable shares of that series outstanding at the end of the period.
FRONT STREET SPECIAL OPPORTUNITIES CLASS NOTES TO THE FINANCIAL STATEMENTS APRIL 30, 2017 AND 2016 (UNAUDITED)
3. SUMMARY OF SIGNIFICANT ACCOUNTING POLICIES (Continued...)
(k) Transaction costs
Portfolio transaction costs are expensed and are included in "Transaction costs" in the statements of comprehensive income. Transaction costs are incremental costs that are directly attributable to the acquisition, issue or disposal of an investment, which include fees and commissions paid to agents, advisors, brokers and dealers, levies by regulatory agencies and securities exchanges. The individual security's cost shown on the schedule of investment portfolio includes only those transaction costs incurred on the acquisition of portfolio investments.
(l) Provisions
The Fund recognizes a provision, if as a result of a prior event, the Fund has a current obligation requiring the outflow of resources to settle. Provisions are recorded at the Manager’s best estimates of the most probable outcome of any future settlement.
(m) Interests in subsidiaries, associates and unconsolidated structured entities
The Fund meets the definition of an investment entity and as such, does not consolidate the entities it controls. Instead, interests in entities subject to control are classified as fair value through profit or loss, and measured at fair value.
The Fund may invest in redeemable units of other investment funds as part of its investment strategy. The nature and purpose of the investee funds generally is to manage assets on behalf of third party investors and generate fees for the investment manager, and are financed through the issue of redeemable units to investors.
The maximum exposure to loss from interests in investee funds is equal to the fair value of the investment in those respective funds, which are included in financial assets at fair value through profit and loss in the statement of financial position.
(n) Future changes in accounting standards:
IFRS 9 - Financial Instruments
IFRS 9 was issued in November 2009 with an implementation date of annual periods beginning on or after January 1, 2018. It addresses classification and measurement of financial assets and replaces the multiple categories and measurement models in IAS 39 for debt instruments with a new mixed measurement model having only two categories: amortized cost and fair value through profit or loss. IFRS 9 also replaces the models for measuring equity instruments and such instruments are either recognized at fair value through profit or loss or at fair value through other comprehensive income. Where such equity instruments are measured at fair value through other comprehensive income, dividends, to the extent not clearly representing a return of investment, are recognized in profit or loss; however, other gains and losses (including impairments) associated with such instruments remain in accumulated comprehensive income indefinitely. The Manager is in the process of evaluating the impact of this standard on the financial statements.
FRONT STREET SPECIAL OPPORTUNITIES CLASS NOTES TO THE FINANCIAL STATEMENTS APRIL 30, 2017 AND 2016 (UNAUDITED)
4. CRITICAL ACCOUNTING ESTIMATES AND JUDGMENTS
The timely preparation of financial statements requires the Fund to make estimates, judgments and
assumptions that affect the reported amounts of assets, liabilities, revenues and expenses, and the disclosure of contingent assets and liabilities. The following summarizes the accounting judgments, estimates and assumptions the Fund considers significant:
(a) Valuation of investments
Portfolio investments are measured and reported at fair value through profit or loss. Portfolio
investments may include securities not traded in an active market, the fair value of which is determined using valuation techniques. Such estimates of fair value of portfolio investments not traded in an active market involve assumptions and uncertainties, and may include matters of significant judgment. Therefore, such estimates are subjective and cannot be determined with precision. Changes in assumptions may significantly affect the estimates.
(b) Other judgments, estimates and assumptions
Estimates are also used when determining the amount of impairment of assets and the likelihood of contingencies.
(c) Assessment as investment entity
The Manager has concluded that the Fund has the characteristics of an investment entity, in that it has more than one investment and is managed in accordance with the articles of incorporation and prospectus; the investments are predominantly in the form of equities and similar securities; it has more than one investor and its investors are not related parties. These conclusions will be reassessed on an annual basis, if any of these criteria or characteristics change.
5. REDEEMABLE SHARES
Net assets attributable to holders of redeemable shares consists of amounts paid for shares, undistributed income, realized gains and losses and unrealized appreciation (depreciation) of financial assets at FVTPL, and represents the capital of the Fund. The Fund may issue an unlimited number of redeemable shares. Each share is redeemable at the option of the shareholder in accordance with the articles of incorporation and prospectus, and entitles the shareholder to a proportionate interest in the net assets of the Fund. The Fund has no restrictions or specified capital requirements on subscriptions or redemptions of shares.
FRONT STREET SPECIAL OPPORTUNITIES CLASS NOTES TO THE FINANCIAL STATEMENTS APRIL 30, 2017 AND 2016 (UNAUDITED)
5. REDEEMABLE SHARES (Continued...)
The authorized capital of the Fund consists of an unlimited number of mutual fund shares, available in five series. Redemption and commission fees vary according to each series of shares as follows:
Series A shares
Redemption fees payable to the Manager may be applicable upon the sale of shares of this series based on the original cost amount and the time to disposition. A redemption fee of 3% applies to shares of this series sold within the first 18 months following acquisition. A redemption fee of 2% applies to shares of this series sold between the first 18 months to 36 months following acquisition. No redemption fee applies to shares of this series sold after the third period following acquisition.
Series B shares
Commission fees payable to brokers, dealers or advisors may be applicable upon the purchase of shares of this series up to 5% of the gross purchase amount, at the discretion of the broker, dealer or advisor.
Series F shares
No redemption or commission fees are applicable to shares of this series.
Series X shares
No redemption or commission fees are applicable to shares of this series.
Series Y shares
No redemption or commission fees are applicable to shares of this series.
FRONT STREET SPECIAL OPPORTUNITIES CLASS NOTES TO THE FINANCIAL STATEMENTS APRIL 30, 2017 AND 2016 (UNAUDITED)
5. REDEEMABLE SHARES (Continued...)
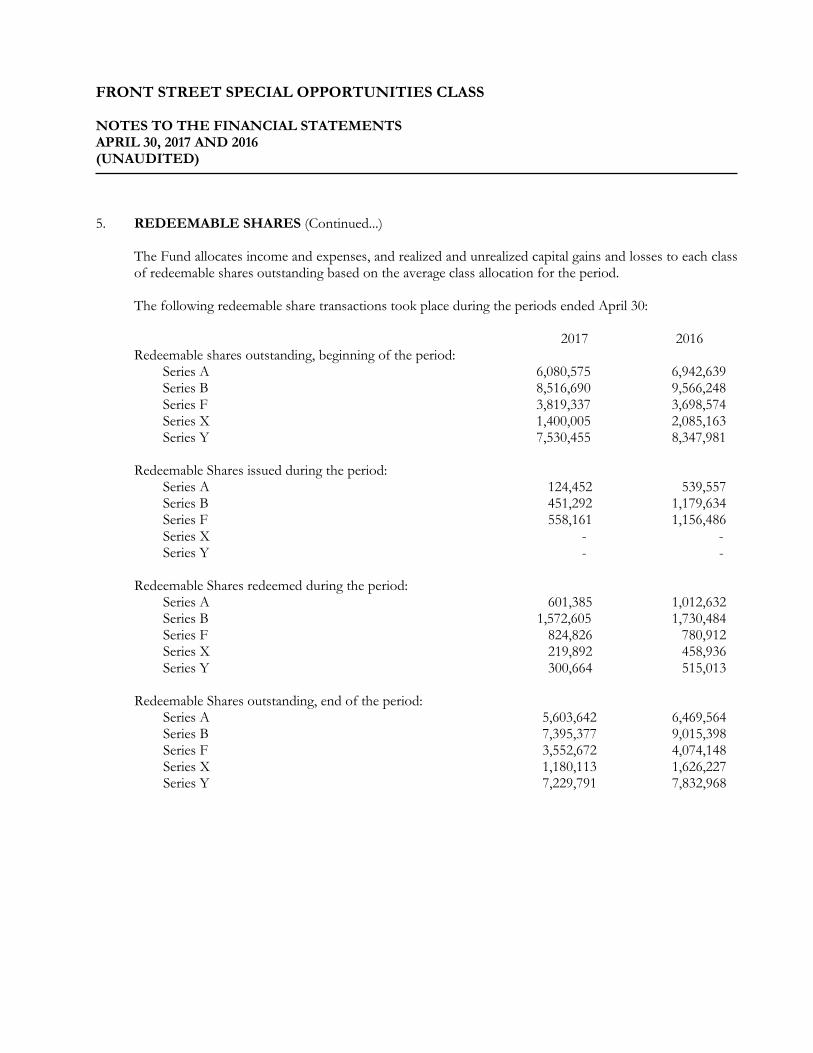
The Fund allocates income and expenses, and realized and unrealized capital gains and losses to each class of redeemable shares outstanding based on the average class allocation for the period.
The following redeemable share transactions took place during the periods ended April 30:
2017 2016
Redeemable shares outstanding, beginning of the period: Series A 6,080,575 6,942,639 Series B 8,516,690 9,566,248 Series F 3,819,337 3,698,574 Series X 1,400,005 2,085,163 Series Y 7,530,455 8,347,981
Redeemable Shares issued during the period: Series A 124,452 539,557 Series B 451,292 1,179,634 Series F 558,161 1,156,486 Series X - - Series Y - -
Redeemable Shares redeemed during the period: Series A 601,385 1,012,632 Series B 1,572,605 1,730,484 Series F 824,826 780,912 Series X 219,892 458,936 Series Y 300,664 515,013
Redeemable Shares outstanding, end of the period: Series A 5,603,642 6,469,564 Series B 7,395,377 9,015,398 Series F 3,552,672 4,074,148 Series X 1,180,113 1,626,227 Series Y 7,229,791 7,832,968
FRONT STREET SPECIAL OPPORTUNITIES CLASS NOTES TO THE FINANCIAL STATEMENTS APRIL 30, 2017 AND 2016 (UNAUDITED)
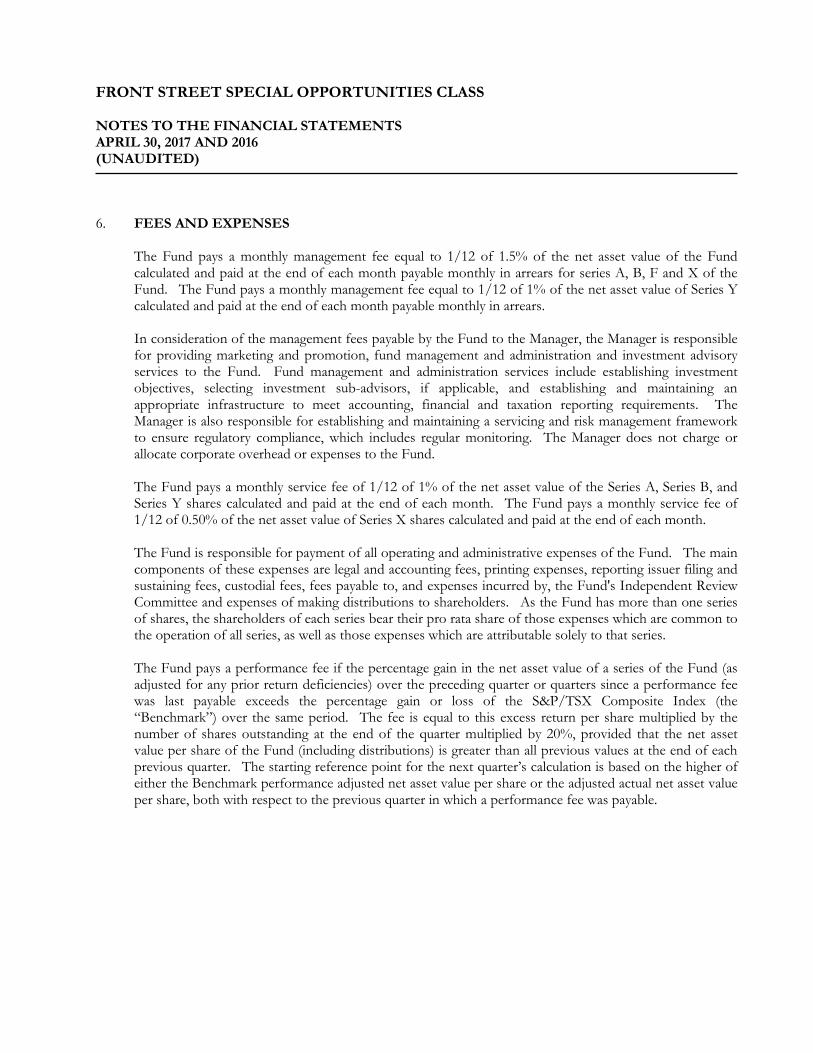
6. FEES AND EXPENSES
The Fund pays a monthly management fee equal to 1/12 of 1.5% of the net asset value of the Fund calculated and paid at the end of each month payable monthly in arrears for series A, B, F and X of the Fund. The Fund pays a monthly management fee equal to 1/12 of 1% of the net asset value of Series Y calculated and paid at the end of each month payable monthly in arrears.
In consideration of the management fees payable by the Fund to the Manager, the Manager is responsible for providing marketing and promotion, fund management and administration and investment advisory services to the Fund. Fund management and administration services include establishing investment objectives, selecting investment sub-advisors, if applicable, and establishing and maintaining an appropriate infrastructure to meet accounting, financial and taxation reporting requirements. The Manager is also responsible for establishing and maintaining a servicing and risk management framework to ensure regulatory compliance, which includes regular monitoring. The Manager does not charge or allocate corporate overhead or expenses to the Fund.
The Fund pays a monthly service fee of 1/12 of 1% of the net asset value of the Series A, Series B, and Series Y shares calculated and paid at the end of each month. The Fund pays a monthly service fee of 1/12 of 0.50% of the net asset value of Series X shares calculated and paid at the end of each month.
The Fund is responsible for payment of all operating and administrative expenses of the Fund. The main components of these expenses are legal and accounting fees, printing expenses, reporting issuer filing and sustaining fees, custodial fees, fees payable to, and expenses incurred by, the Fund's Independent Review Committee and expenses of making distributions to shareholders. As the Fund has more than one series of shares, the shareholders of each series bear their pro rata share of those expenses which are common to the operation of all series, as well as those expenses which are attributable solely to that series.
The Fund pays a performance fee if the percentage gain in the net asset value of a series of the Fund (as adjusted for any prior return deficiencies) over the preceding quarter or quarters since a performance fee was last payable exceeds the percentage gain or loss of the S&P/TSX Composite Index (the “Benchmark”) over the same period. The fee is equal to this excess return per share multiplied by the number of shares outstanding at the end of the quarter multiplied by 20%, provided that the net asset value per share of the Fund (including distributions) is greater than all previous values at the end of each previous quarter. The starting reference point for the next quarter’s calculation is based on the higher of either the Benchmark performance adjusted net asset value per share or the adjusted actual net asset value per share, both with respect to the previous quarter in which a performance fee was payable.
FRONT STREET SPECIAL OPPORTUNITIES CLASS NOTES TO THE FINANCIAL STATEMENTS APRIL 30, 2017 AND 2016 (UNAUDITED)
7. INCOME TAX DISTRIBUTION
The Fund qualifies as a mutual fund corporation under the Income Tax Act (Canada). The Corporation will earn three types of income, Canadian dividends, taxable capital gains and other net taxable income. The income of the Fund, including taxable capital gains, will be subject to income tax at applicable corporate tax rates, after claiming allowable deductions for expenses and applicable credits for foreign taxes paid on foreign-source income. Income tax on capital gains is refundable to the Fund to the extent that such gains are distributed to shareholders as capital gains dividends or the Fund's share are redeemed. Gains and losses realized by the Fund in relation to certain derivative transactions and short sale transactions may be taxed on account of income as opposed to on account of capital. Other income is subject to tax at normal corporate rates and is not subject to refundable tax treatment.
The Fund may elect in the prescribed manner and form in order to have the dividends it distributes treated as capital gains dividends to the extent that the dividends do not exceed the Fund's capital gains dividend account. The capital gains dividend account will be represented by the amount by which capital gains realized by the Fund while it was a mutual fund corporation exceed the aggregate of:
(a) capital losses realized by the Fund while it was a mutual fund corporation; (b) certain capital gains dividends previously paid by it; and (c) amounts in respect of which the Fund received capital gains tax refunds.
The Corporation is a single legal entity for tax purposes and is not taxed on a fund-by-fund basis. Non-capital and capital losses of the Corporation may be applied against the income and/or capital gains attributable to the Corporation as a whole irrespective of the Fund from which the income, gains and/or losses arise. Therefore, where the Corporation has positive net taxable income, any current tax liability can be offset with the utilization of unused prior period tax losses of the Corporation. Further, the payment of capital gains dividends, will also reduce or eliminate any taxes payable by the Corporation. This eliminates the requirement for a net tax provision for the Fund.
The Corporation's shares are qualified investments for registered plans.
FRONT STREET SPECIAL OPPORTUNITIES CLASS NOTES TO THE FINANCIAL STATEMENTS APRIL 30, 2017 AND 2016 (UNAUDITED)
8. SECURITIES LENDING
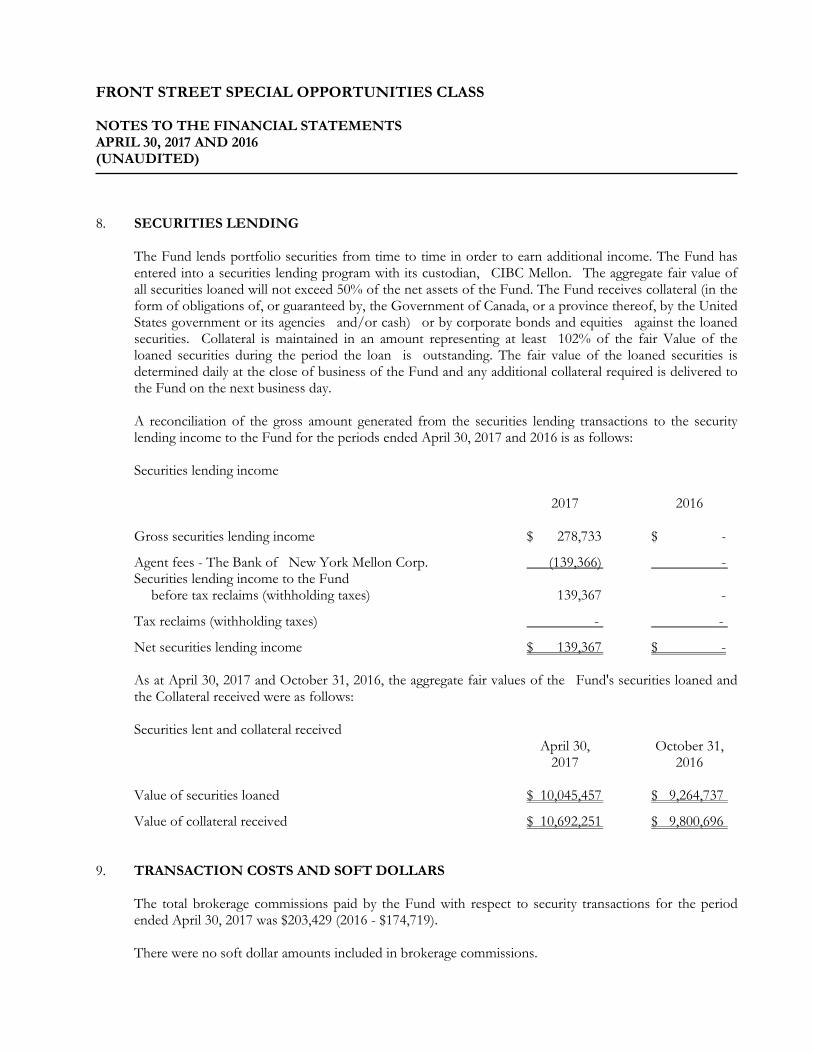
The Fund lends portfolio securities from time to time in order to earn additional income. The Fund has entered into a securities lending program with its custodian, CIBC Mellon. The aggregate fair value of all securities loaned will not exceed 50% of the net assets of the Fund. The Fund receives collateral (in the form of obligations of, or guaranteed by, the Government of Canada, or a province thereof, by the United States government or its agencies and/or cash) or by corporate bonds and equities against the loaned securities. Collateral is maintained in an amount representing at least 102% of the fair Value of the loaned securities during the period the loan is outstanding. The fair value of the loaned securities is determined daily at the close of business of the Fund and any additional collateral required is delivered to the Fund on the next business day. A reconciliation of the gross amount generated from the securities lending transactions to the security lending income to the Fund for the periods ended April 30, 2017 and 2016 is as follows: Securities lending income
2017 2016
Gross securities lending income $ 278,733 $ -
Agent fees - The Bank of New York Mellon Corp. (139,366) - Securities lending income to the Fund before tax reclaims (withholding taxes) 139,367 -
Tax reclaims (withholding taxes) - -
Net securities lending income $ 139,367 $ - As at April 30, 2017 and October 31, 2016, the aggregate fair values of the Fund's securities loaned and the Collateral received were as follows: Securities lent and collateral received
April 30, October 31, 2017 2016
Value of securities loaned $ 10,045,457 $ 9,264,737
Value of collateral received $ 10,692,251 $ 9,800,696
9. TRANSACTION COSTS AND SOFT DOLLARS
The total brokerage commissions paid by the Fund with respect to security transactions for the period ended April 30, 2017 was $203,429 (2016 - $174,719).
There were no soft dollar amounts included in brokerage commissions.
FRONT STREET SPECIAL OPPORTUNITIES CLASS NOTES TO THE FINANCIAL STATEMENTS APRIL 30, 2017 AND 2016 (UNAUDITED)
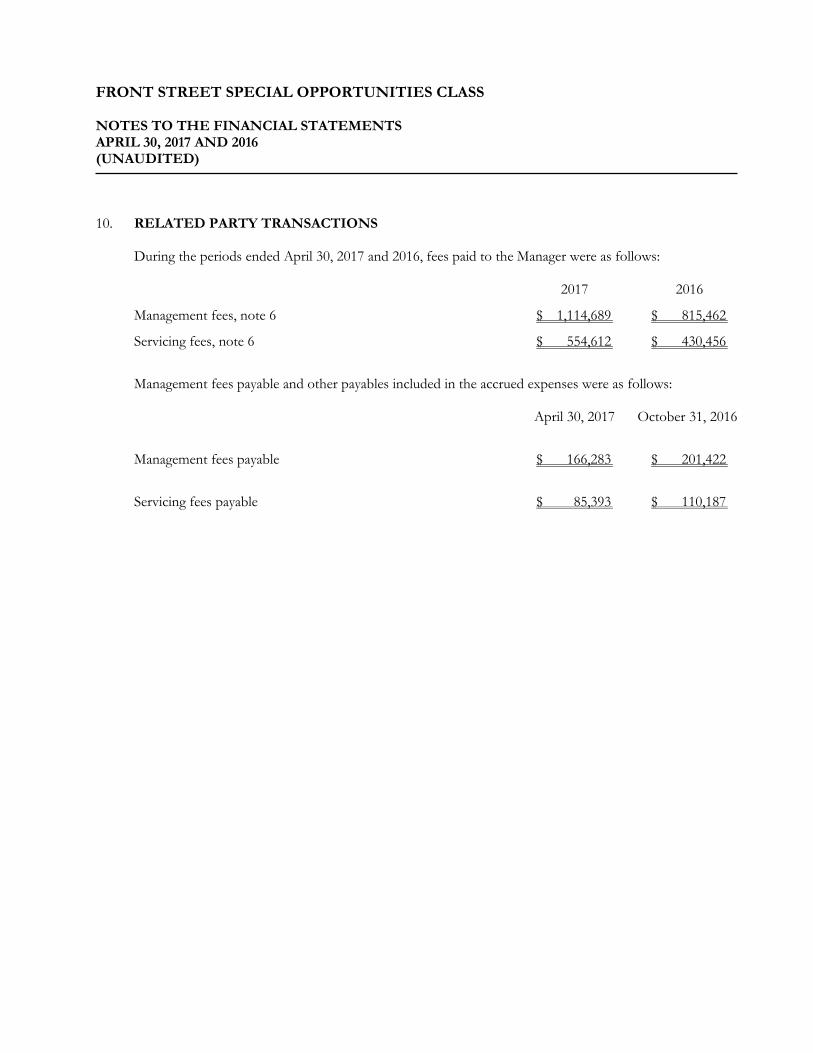
10. RELATED PARTY TRANSACTIONS
During the periods ended April 30, 2017 and 2016, fees paid to the Manager were as follows: 2017 2016
Management fees, note 6 $ 1,114,689 $ 815,462
Servicing fees, note 6 $ 554,612 $ 430,456
Management fees payable and other payables included in the accrued expenses were as follows:
April 30, 2017 October 31, 2016
Management fees payable $ 166,283 $ 201,422
Servicing fees payable $ 85,393 $ 110,187
FRONT STREET SPECIAL OPPORTUNITIES CLASS NOTES TO THE FINANCIAL STATEMENTS APRIL 30, 2017 AND 2016 (UNAUDITED)
10. RELATED PARTY TRANSACTIONS (Continued...)
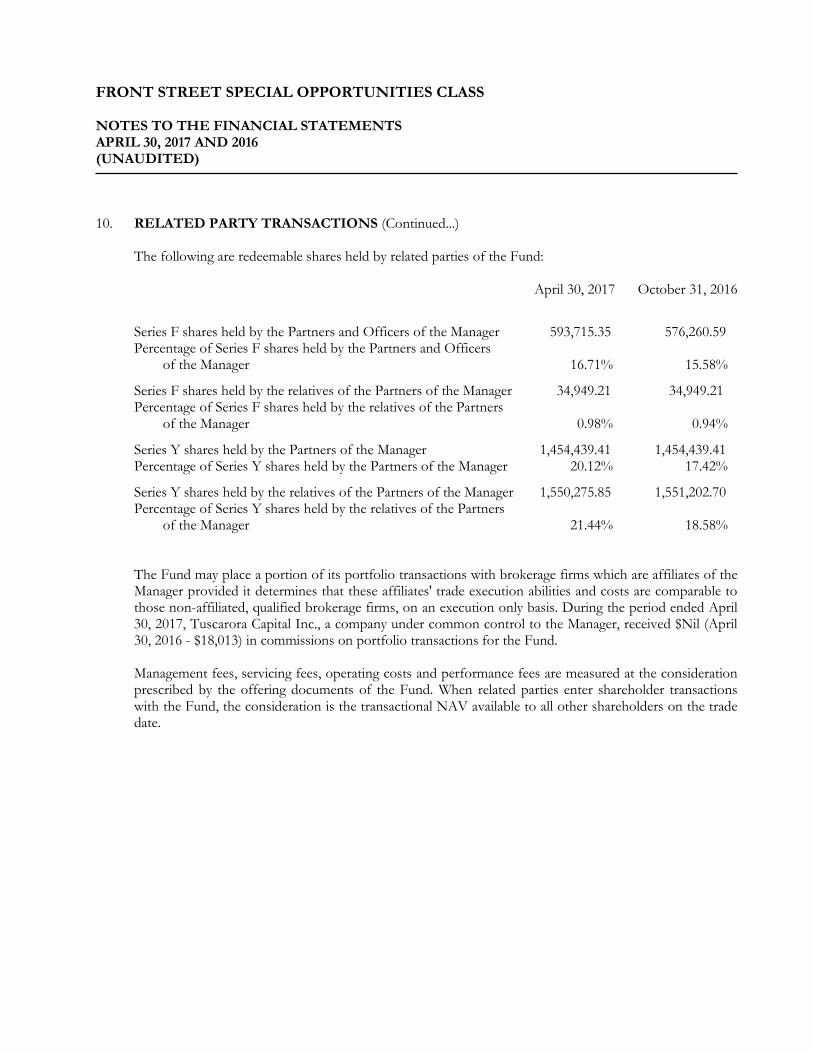
The following are redeemable shares held by related parties of the Fund: April 30, 2017 October 31, 2016
Series F shares held by the Partners and Officers of the Manager 593,715.35 576,260.59 Percentage of Series F shares held by the Partners and Officers of the Manager 16.71% 15.58%
Series F shares held by the relatives of the Partners of the Manager 34,949.21 34,949.21 Percentage of Series F shares held by the relatives of the Partners of the Manager 0.98% 0.94%
Series Y shares held by the Partners of the Manager 1,454,439.41 1,454,439.41 Percentage of Series Y shares held by the Partners of the Manager 20.12% 17.42%
Series Y shares held by the relatives of the Partners of the Manager 1,550,275.85 1,551,202.70 Percentage of Series Y shares held by the relatives of the Partners of the Manager 21.44% 18.58%
The Fund may place a portion of its portfolio transactions with brokerage firms which are affiliates of the Manager provided it determines that these affiliates' trade execution abilities and costs are comparable to those non-affiliated, qualified brokerage firms, on an execution only basis. During the period ended April 30, 2017, Tuscarora Capital Inc., a company under common control to the Manager, received $Nil (April 30, 2016 - $18,013) in commissions on portfolio transactions for the Fund.
Management fees, servicing fees, operating costs and performance fees are measured at the consideration prescribed by the offering documents of the Fund. When related parties enter shareholder transactions with the Fund, the consideration is the transactional NAV available to all other shareholders on the trade date.
FRONT STREET SPECIAL OPPORTUNITIES CLASS NOTES TO THE FINANCIAL STATEMENTS APRIL 30, 2017 AND 2016 (UNAUDITED)
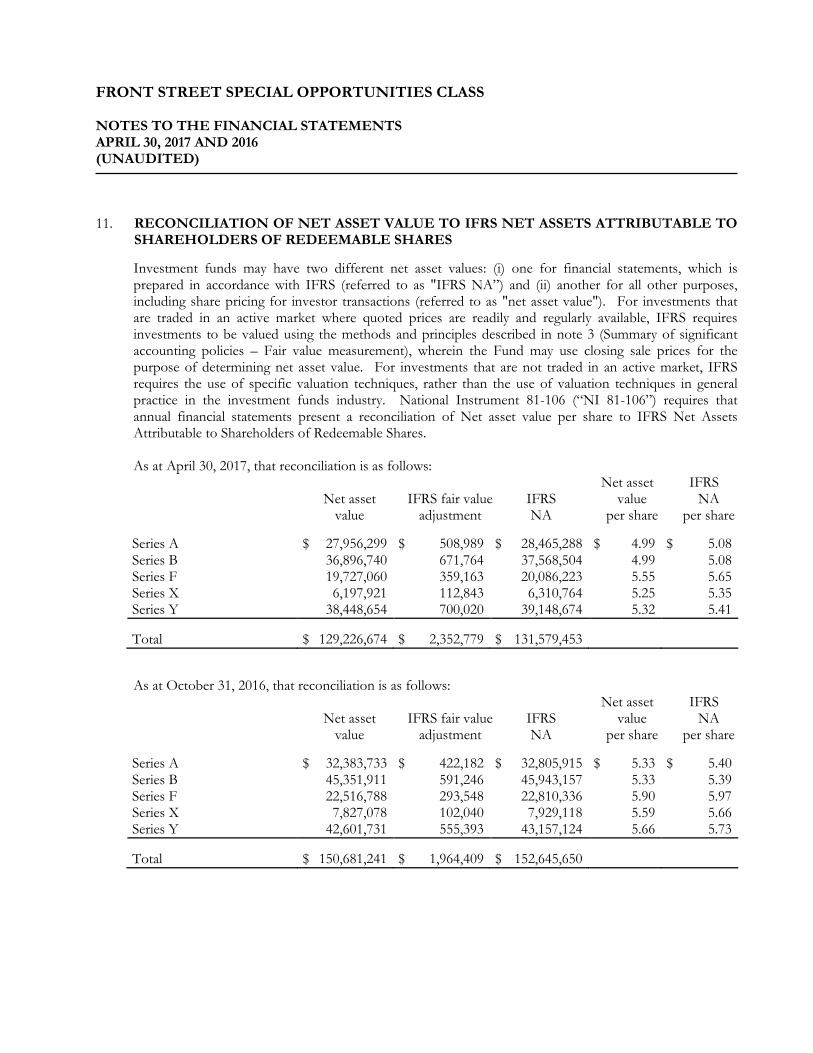
11. RECONCILIATION OF NET ASSET VALUE TO IFRS NET ASSETS ATTRIBUTABLE TO
SHAREHOLDERS OF REDEEMABLE SHARES
Investment funds may have two different net asset values: (i) one for financial statements, which is prepared in accordance with IFRS (referred to as "IFRS NA”) and (ii) another for all other purposes, including share pricing for investor transactions (referred to as "net asset value"). For investments that are traded in an active market where quoted prices are readily and regularly available, IFRS requires investments to be valued using the methods and principles described in note 3 (Summary of significant accounting policies – Fair value measurement), wherein the Fund may use closing sale prices for the purpose of determining net asset value. For investments that are not traded in an active market, IFRS requires the use of specific valuation techniques, rather than the use of valuation techniques in general practice in the investment funds industry. National Instrument 81-106 (“NI 81-106”) requires that annual financial statements present a reconciliation of Net asset value per share to IFRS Net Assets Attributable to Shareholders of Redeemable Shares. As at April 30, 2017, that reconciliation is as follows:
Net asset IFRS Net asset IFRS fair value IFRS value NA value adjustment NA per share per share
Series A $ 27,956,299 $ 508,989 $ 28,465,288 $ 4.99 $ 5.08 Series B 36,896,740 671,764 37,568,504 4.99 5.08 Series F 19,727,060 359,163 20,086,223 5.55 5.65 Series X 6,197,921 112,843 6,310,764 5.25 5.35 Series Y 38,448,654 700,020 39,148,674 5.32 5.41 Total
$ 129,226,674
$ 2,352,779
$ 131,579,453
As at October 31, 2016, that reconciliation is as follows: Net asset IFRS
Net asset IFRS fair value IFRS value NA value adjustment NA per share per share
Series A $ 32,383,733 $ 422,182 $ 32,805,915 $ 5.33 $ 5.40 Series B 45,351,911 591,246 45,943,157 5.33 5.39 Series F 22,516,788 293,548 22,810,336 5.90 5.97 Series X 7,827,078 102,040 7,929,118 5.59 5.66 Series Y 42,601,731 555,393 43,157,124 5.66 5.73 Total
$ 150,681,241
$ 1,964,409
$ 152,645,650
FRONT STREET SPECIAL OPPORTUNITIES CLASS NOTES TO THE FINANCIAL STATEMENTS APRIL 30, 2017 AND 2016 (UNAUDITED)
12. RISKS ASSOCIATED WITH FINANCIAL INSTRUMENTS
The Fund's financial instruments consist of financial assets and liabilities at FVTPL, cash and cash equivalents, dividends receivable, subscriptions receivable, interest and other receivables, receivables for investments sold, accrued expenses and redemptions payable. It is the Manager's opinion that due to the short term nature of these financial instruments, the Fund is not exposed to significant market price, currency, interest rate, liquidity, cash flow, credit, and portfolio concentration risks arising from these financial instruments except as described below. The fair value of these financial instruments approximate their carrying values, unless otherwise noted. All securities present a risk of loss of capital. The Manager seeks to minimize potential adverse effects of these risks on the Fund’s performance by employing professional, experienced portfolio advisors, by daily monitoring of the Fund’s positions and market events, and by diversifying the investment portfolio within the constraints of the investment objective. To assist in managing risk, the Manager also maintains a governance structure that oversees the Fund’s investment activities and monitors compliance with the Fund’s stated investment strategy and securities regulations. The schedule of investment portfolio presents the securities held by the Fund as at April 30, 2017 and groups the securities by asset type, sector and/or market segment. Significant risks that are relevant to the Fund are discussed below.
The Fund is exposed to financial risks, including market risk, currency risk, interest rate risk, liquidity risk, cash flow risk, credit risk and concentration risk. The Fund’s overall risk management program seeks to minimize potentially adverse effects of those risks on the Fund’s financial performance. The Fund moderates financial risks through the careful selection of portfolio investments and other financial instruments within the parameters of the investment guidelines, strategies and objectives.
FRONT STREET SPECIAL OPPORTUNITIES CLASS NOTES TO THE FINANCIAL STATEMENTS APRIL 30, 2017 AND 2016 (UNAUDITED)
12. RISKS ASSOCIATED WITH FINANCIAL INSTRUMENTS (Continued...)
i) Market price risk
Market price risk, is the risk that the fair value or future cash flows of a financial instrument will fluctuate because of changes in market prices (other than those arising from interest rate risk or currency risk), whether those changes are caused by factors specific to the individual financial instrument, its issuer, or factors affecting similar financial instruments traded in the market.
The Fund is exposed to market price risk arising from its investments in securities. The Manager manages the Fund’s market price risk on a daily basis in accordance with the Fund’s investment objective and policies.
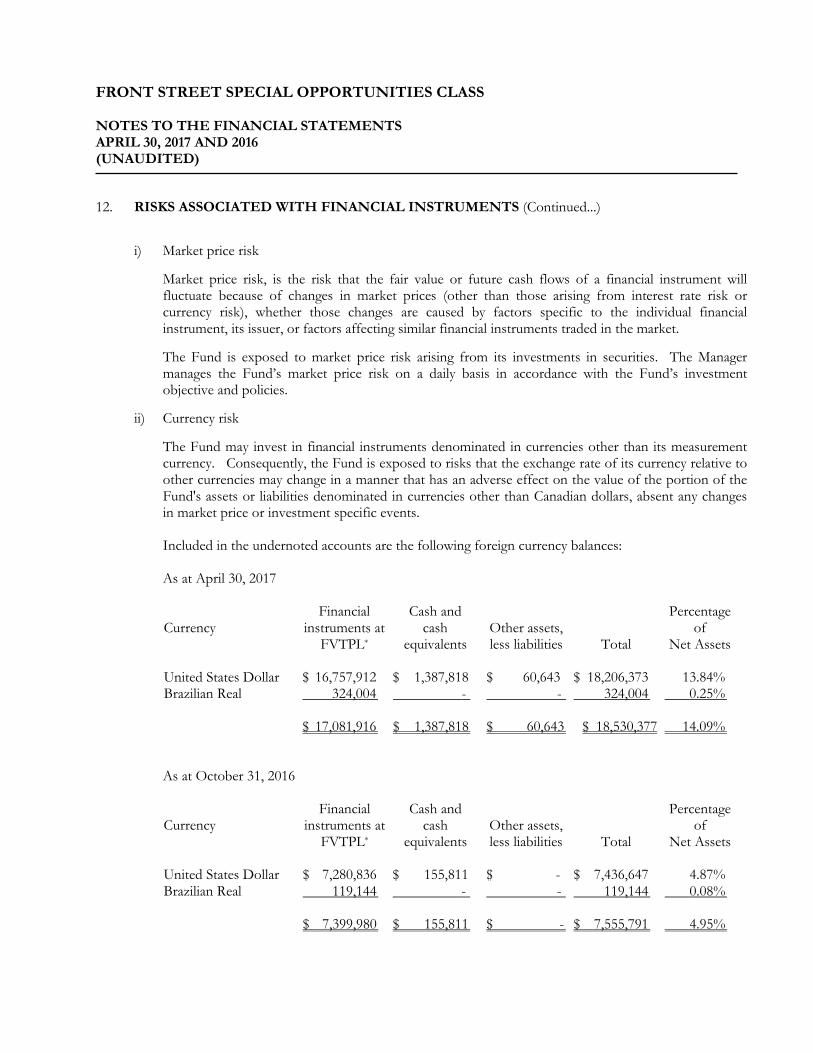
ii) Currency risk
The Fund may invest in financial instruments denominated in currencies other than its measurement currency. Consequently, the Fund is exposed to risks that the exchange rate of its currency relative to other currencies may change in a manner that has an adverse effect on the value of the portion of the Fund's assets or liabilities denominated in currencies other than Canadian dollars, absent any changes in market price or investment specific events.
Included in the undernoted accounts are the following foreign currency balances:
As at April 30, 2017
Currency
Financial
instruments at FVTPL*
Cash and
cash equivalents
Other assets, less liabilities
Total
Percentage
of Net Assets
United States Dollar $ 16,757,912 $ 1,387,818 $ 60,643 $ 18,206,373 13.84% Brazilian Real 324,004 - - 324,004 0.25%
$ 17,081,916
$ 1,387,818 $ 60,643
$ 18,530,377
14.09%
As at October 31, 2016
Currency
Financial
instruments at FVTPL*
Cash and
cash equivalents
Other assets, less liabilities
Total
Percentage
of Net Assets
United States Dollar $ 7,280,836 $ 155,811 $ - $ 7,436,647 4.87% Brazilian Real 119,144 - - 119,144 0.08%
$ 7,399,980
$ 155,811 $ -
$ 7,555,791
4.95%
FRONT STREET SPECIAL OPPORTUNITIES CLASS NOTES TO THE FINANCIAL STATEMENTS APRIL 30, 2017 AND 2016 (UNAUDITED)
12. RISKS ASSOCIATED WITH FINANCIAL INSTRUMENTS (Continued...)
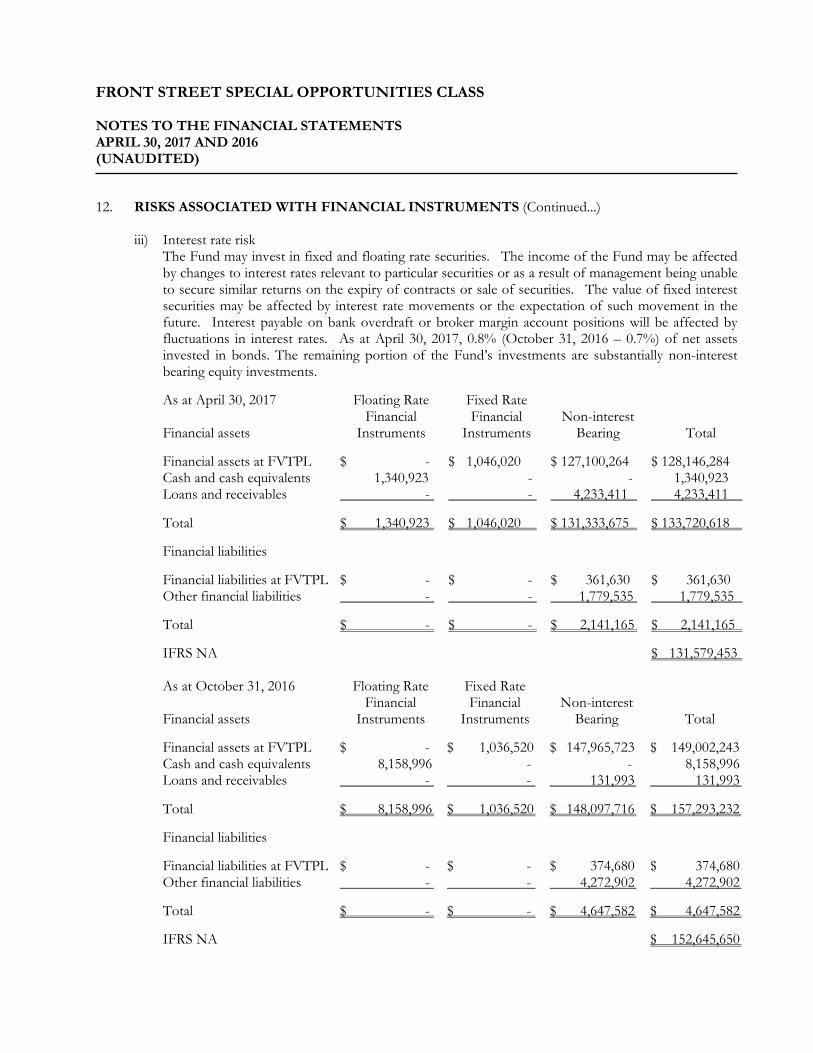
iii) Interest rate risk The Fund may invest in fixed and floating rate securities. The income of the Fund may be affected by changes to interest rates relevant to particular securities or as a result of management being unable to secure similar returns on the expiry of contracts or sale of securities. The value of fixed interest securities may be affected by interest rate movements or the expectation of such movement in the future. Interest payable on bank overdraft or broker margin account positions will be affected by fluctuations in interest rates. As at April 30, 2017, 0.8% (October 31, 2016 – 0.7%) of net assets invested in bonds. The remaining portion of the Fund’s investments are substantially non-interest bearing equity investments.
As at April 30, 2017
Financial assets
Floating Rate Financial
Instruments
Fixed Rate Financial
Instruments
Non-interest
Bearing
Total
Financial assets at FVTPL $ - $ 1,046,020 $ 127,100,264 $ 128,146,284 Cash and cash equivalents 1,340,923 - - 1,340,923 Loans and receivables - - 4,233,411 4,233,411 Total $ 1,340,923 $ 1,046,020 $ 131,333,675 $ 133,720,618 Financial liabilities
Financial liabilities at FVTPL $ - $ - $ 361,630 $ 361,630 Other financial liabilities - - 1,779,535 1,779,535
Total $ - $ - $ 2,141,165 $ 2,141,165
IFRS NA $ 131,579,453
As at October 31, 2016
Financial assets
Floating Rate Financial
Instruments
Fixed Rate Financial
Instruments
Non-interest
Bearing
Total
Financial assets at FVTPL $ - $ 1,036,520 $ 147,965,723 $ 149,002,243 Cash and cash equivalents 8,158,996 - - 8,158,996 Loans and receivables - - 131,993 131,993 Total $ 8,158,996 $ 1,036,520 $ 148,097,716 $ 157,293,232 Financial liabilities
Financial liabilities at FVTPL $ - $ - $ 374,680 $ 374,680 Other financial liabilities - - 4,272,902 4,272,902
Total $ - $ - $ 4,647,582 $ 4,647,582
IFRS NA $ 152,645,650
FRONT STREET SPECIAL OPPORTUNITIES CLASS NOTES TO THE FINANCIAL STATEMENTS APRIL 30, 2017 AND 2016 (UNAUDITED)
12. RISKS ASSOCIATED WITH FINANCIAL INSTRUMENTS (Continued...)
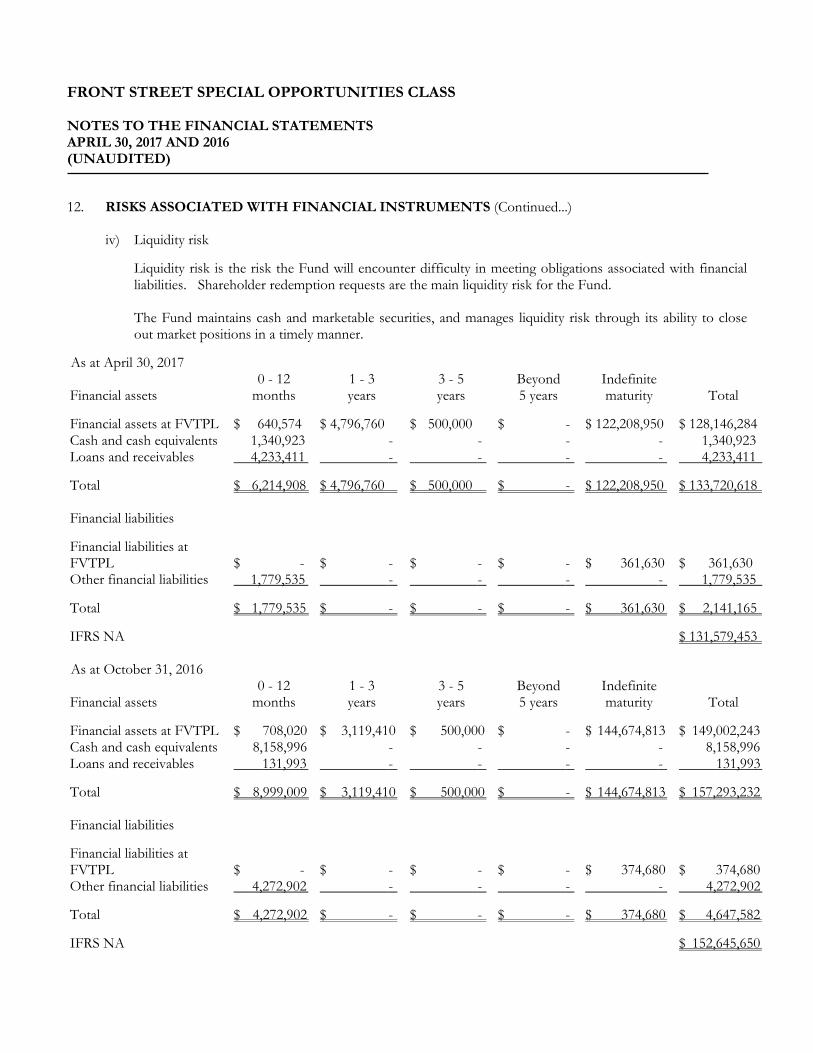
iv) Liquidity risk
Liquidity risk is the risk the Fund will encounter difficulty in meeting obligations associated with financial liabilities. Shareholder redemption requests are the main liquidity risk for the Fund.
The Fund maintains cash and marketable securities, and manages liquidity risk through its ability to close out market positions in a timely manner.
As at April 30, 2017 Financial assets
0 - 12 months
1 - 3 years
3 - 5 years
Beyond 5 years
Indefinite maturity
Total
Financial assets at FVTPL $ 640,574 $ 4,796,760 $ 500,000 $ - $ 122,208,950 $ 128,146,284 Cash and cash equivalents 1,340,923 - - - - 1,340,923 Loans and receivables 4,233,411 - - - - 4,233,411 Total
$ 6,214,908
$ 4,796,760
$ 500,000
$ -
$ 122,208,950
$ 133,720,618
Financial liabilities
Financial liabilities at FVTPL
$ -
$ -
$ -
$ -
$ 361,630
$ 361,630 Other financial liabilities 1,779,535 - - - - 1,779,535
Total $ 1,779,535 $ - $ - $ - $ 361,630 $ 2,141,165 IFRS NA $ 131,579,453 As at October 31, 2016 Financial assets
0 - 12 months
1 - 3 years
3 - 5 years
Beyond 5 years
Indefinite maturity
Total
Financial assets at FVTPL $ 708,020 $ 3,119,410 $ 500,000 $ - $ 144,674,813 $ 149,002,243 Cash and cash equivalents 8,158,996 - - - - 8,158,996 Loans and receivables 131,993 - - - - 131,993 Total
$ 8,999,009
$ 3,119,410
$ 500,000
$ -
$ 144,674,813
$ 157,293,232
Financial liabilities
Financial liabilities at FVTPL
$ -
$ -
$ -
$ -
$ 374,680
$ 374,680 Other financial liabilities 4,272,902 - - - - 4,272,902
Total $ 4,272,902 $ - $ - $ - $ 374,680 $ 4,647,582 IFRS NA $ 152,645,650
FRONT STREET SPECIAL OPPORTUNITIES CLASS NOTES TO THE FINANCIAL STATEMENTS APRIL 30, 2017 AND 2016 (UNAUDITED)
12. RISKS ASSOCIATED WITH FINANCIAL INSTRUMENTS (Continued...)
iv) Liquidity risk (Continued...)
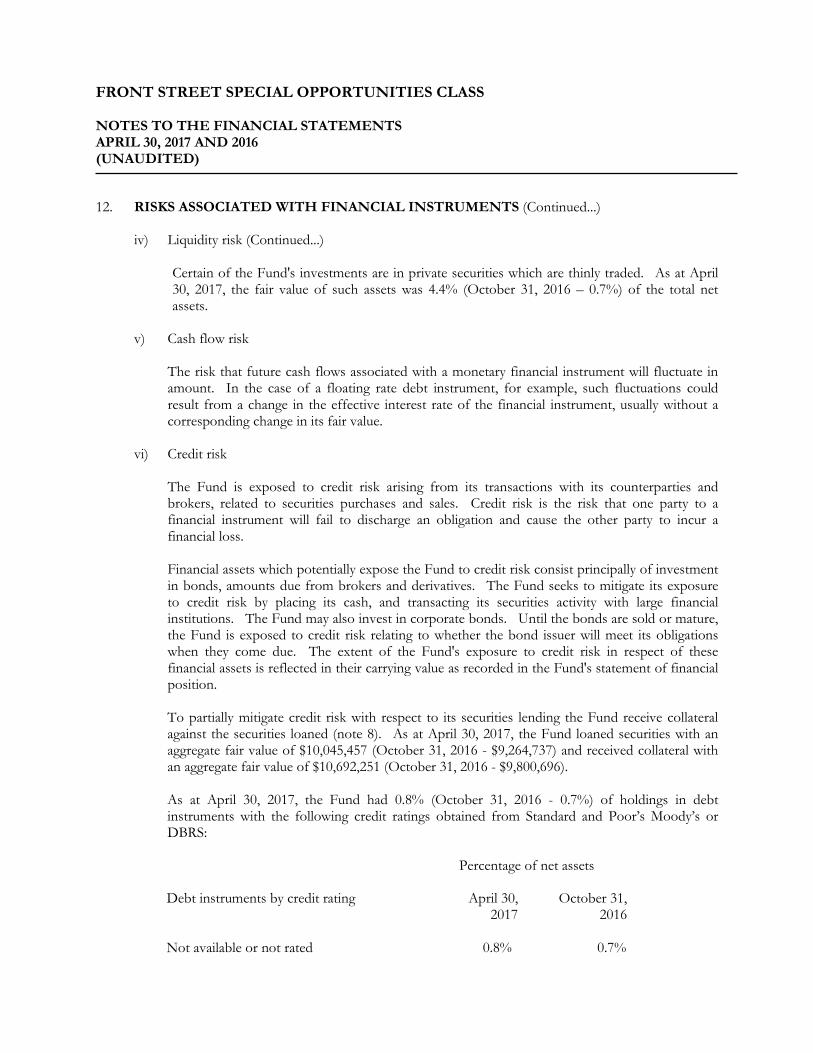
Certain of the Fund's investments are in private securities which are thinly traded. As at April 30, 2017, the fair value of such assets was 4.4% (October 31, 2016 – 0.7%) of the total net assets.
v) Cash flow risk
The risk that future cash flows associated with a monetary financial instrument will fluctuate in amount. In the case of a floating rate debt instrument, for example, such fluctuations could result from a change in the effective interest rate of the financial instrument, usually without a corresponding change in its fair value.
vi) Credit risk
The Fund is exposed to credit risk arising from its transactions with its counterparties and brokers, related to securities purchases and sales. Credit risk is the risk that one party to a financial instrument will fail to discharge an obligation and cause the other party to incur a financial loss.
Financial assets which potentially expose the Fund to credit risk consist principally of investment in bonds, amounts due from brokers and derivatives. The Fund seeks to mitigate its exposure to credit risk by placing its cash, and transacting its securities activity with large financial institutions. The Fund may also invest in corporate bonds. Until the bonds are sold or mature, the Fund is exposed to credit risk relating to whether the bond issuer will meet its obligations when they come due. The extent of the Fund's exposure to credit risk in respect of these financial assets is reflected in their carrying value as recorded in the Fund's statement of financial position.
To partially mitigate credit risk with respect to its securities lending the Fund receive collateral against the securities loaned (note 8). As at April 30, 2017, the Fund loaned securities with an aggregate fair value of $10,045,457 (October 31, 2016 - $9,264,737) and received collateral with an aggregate fair value of $10,692,251 (October 31, 2016 - $9,800,696).
As at April 30, 2017, the Fund had 0.8% (October 31, 2016 - 0.7%) of holdings in debt instruments with the following credit ratings obtained from Standard and Poor’s Moody’s or DBRS:
Percentage of net assets
Debt instruments by credit rating
April 30, 2017
October 31, 2016
Not available or not rated
0.8%
0.7%
FRONT STREET SPECIAL OPPORTUNITIES CLASS NOTES TO THE FINANCIAL STATEMENTS APRIL 30, 2017 AND 2016 (UNAUDITED)
12. RISKS ASSOCIATED WITH FINANCIAL INSTRUMENTS (Continued...)
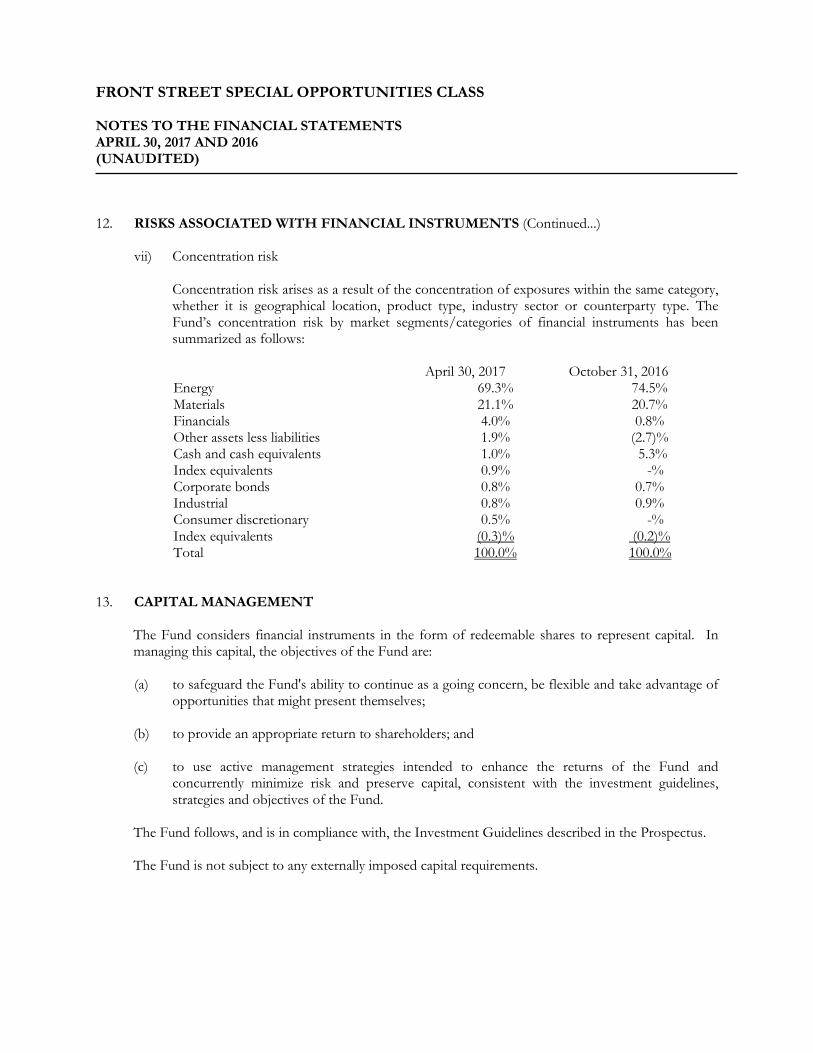
vii) Concentration risk
Concentration risk arises as a result of the concentration of exposures within the same category, whether it is geographical location, product type, industry sector or counterparty type. The Fund’s concentration risk by market segments/categories of financial instruments has been summarized as follows:
April 30, 2017 October 31, 2016 Energy 69.3% 74.5% Materials 21.1% 20.7% Financials 4.0% 0.8% Other assets less liabilities 1.9% (2.7)% Cash and cash equivalents 1.0% 5.3% Index equivalents 0.9% -% Corporate bonds 0.8% 0.7% Industrial 0.8% 0.9% Consumer discretionary 0.5% -% Index equivalents (0.3)% (0.2)% Total 100.0% 100.0%
13. CAPITAL MANAGEMENT
The Fund considers financial instruments in the form of redeemable shares to represent capital. In managing this capital, the objectives of the Fund are:
(a) to safeguard the Fund's ability to continue as a going concern, be flexible and take advantage of
opportunities that might present themselves;
(b) to provide an appropriate return to shareholders; and
(c) to use active management strategies intended to enhance the returns of the Fund and concurrently minimize risk and preserve capital, consistent with the investment guidelines, strategies and objectives of the Fund.
The Fund follows, and is in compliance with, the Investment Guidelines described in the Prospectus.
The Fund is not subject to any externally imposed capital requirements.
FRONT STREET SPECIAL OPPORTUNITIES CLASS NOTES TO THE FINANCIAL STATEMENTS APRIL 30, 2017 AND 2016 (UNAUDITED)
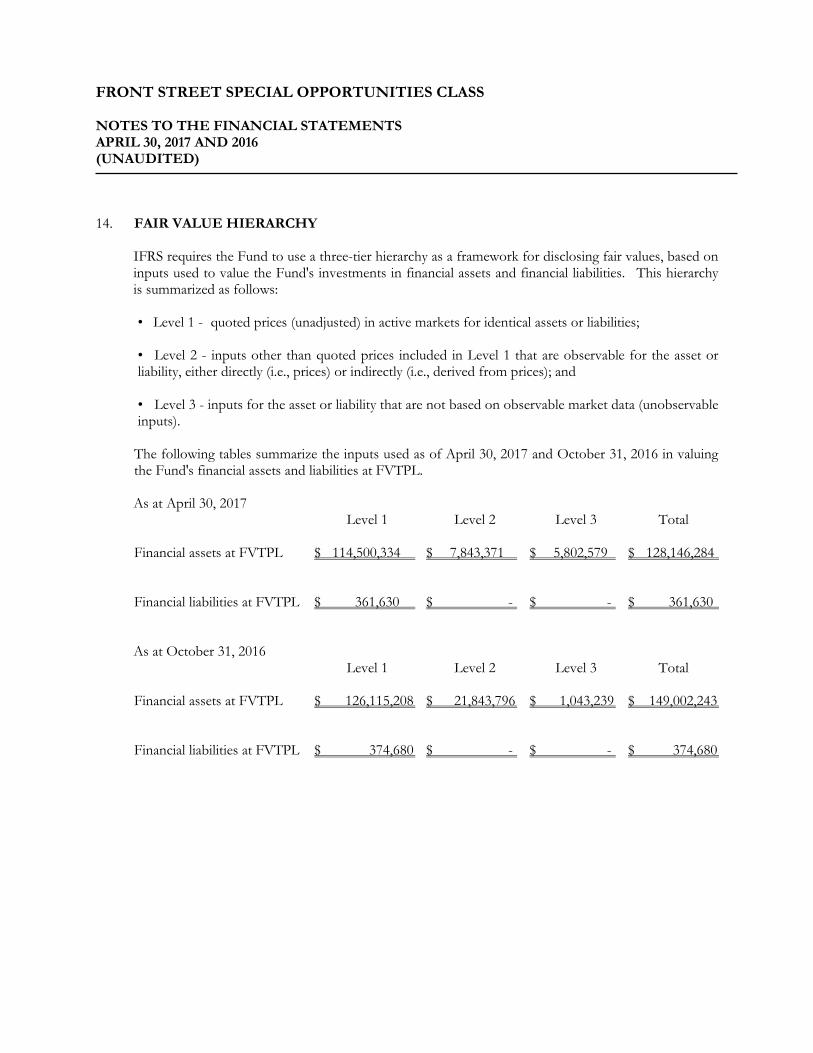
14. FAIR VALUE HIERARCHY
IFRS requires the Fund to use a three-tier hierarchy as a framework for disclosing fair values, based on inputs used to value the Fund's investments in financial assets and financial liabilities. This hierarchy is summarized as follows:
• Level 1 - quoted prices (unadjusted) in active markets for identical assets or liabilities;
• Level 2 - inputs other than quoted prices included in Level 1 that are observable for the asset or liability, either directly (i.e., prices) or indirectly (i.e., derived from prices); and
• Level 3 - inputs for the asset or liability that are not based on observable market data (unobservable
inputs).
The following tables summarize the inputs used as of April 30, 2017 and October 31, 2016 in valuing the Fund's financial assets and liabilities at FVTPL.
As at April 30, 2017 Level 1 Level 2 Level 3 Total
Financial assets at FVTPL $ 114,500,334 $ 7,843,371 $ 5,802,579 $ 128,146,284 Financial liabilities at FVTPL $ 361,630 $ - $ - $ 361,630
As at October 31, 2016 Level 1 Level 2 Level 3 Total
Financial assets at FVTPL $ 126,115,208 $ 21,843,796 $ 1,043,239 $ 149,002,243 Financial liabilities at FVTPL $ 374,680 $ - $ - $ 374,680
FRONT STREET SPECIAL OPPORTUNITIES CLASS NOTES TO THE FINANCIAL STATEMENTS APRIL 30, 2017 AND 2016 (UNAUDITED)
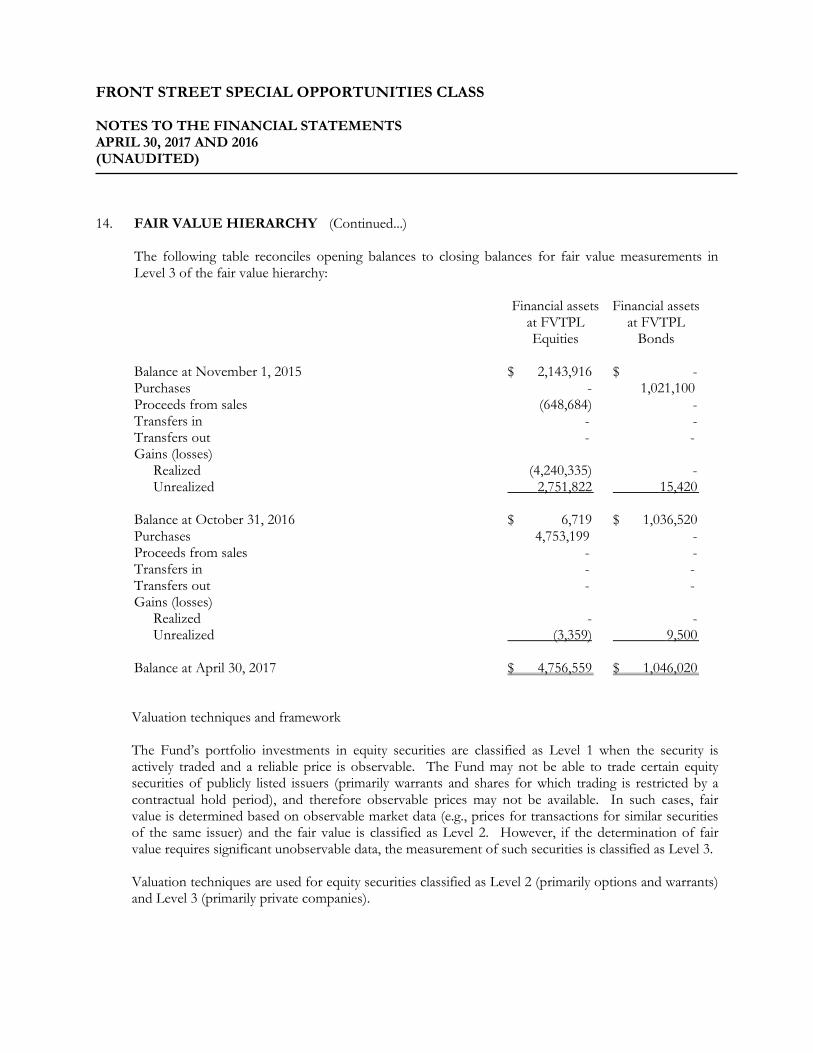
14. FAIR VALUE HIERARCHY (Continued...)
The following table reconciles opening balances to closing balances for fair value measurements in Level 3 of the fair value hierarchy:
Financial assets Financial assets at FVTPL at FVTPL Equities Bonds Balance at November 1, 2015 $ 2,143,916 $ - Purchases - 1,021,100 Proceeds from sales (648,684) - Transfers in - - Transfers out - - Gains (losses) Realized (4,240,335) - Unrealized 2,751,822 15,420 Balance at October 31, 2016 $ 6,719 $ 1,036,520 Purchases 4,753,199 - Proceeds from sales - - Transfers in - - Transfers out - - Gains (losses) Realized - - Unrealized (3,359) 9,500 Balance at April 30, 2017 $ 4,756,559 $ 1,046,020
Valuation techniques and framework
The Fund’s portfolio investments in equity securities are classified as Level 1 when the security is actively traded and a reliable price is observable. The Fund may not be able to trade certain equity securities of publicly listed issuers (primarily warrants and shares for which trading is restricted by a contractual hold period), and therefore observable prices may not be available. In such cases, fair value is determined based on observable market data (e.g., prices for transactions for similar securities of the same issuer) and the fair value is classified as Level 2. However, if the determination of fair value requires significant unobservable data, the measurement of such securities is classified as Level 3.
Valuation techniques are used for equity securities classified as Level 2 (primarily options and warrants) and Level 3 (primarily private companies).
FRONT STREET SPECIAL OPPORTUNITIES CLASS NOTES TO THE FINANCIAL STATEMENTS APRIL 30, 2017 AND 2016 (UNAUDITED)
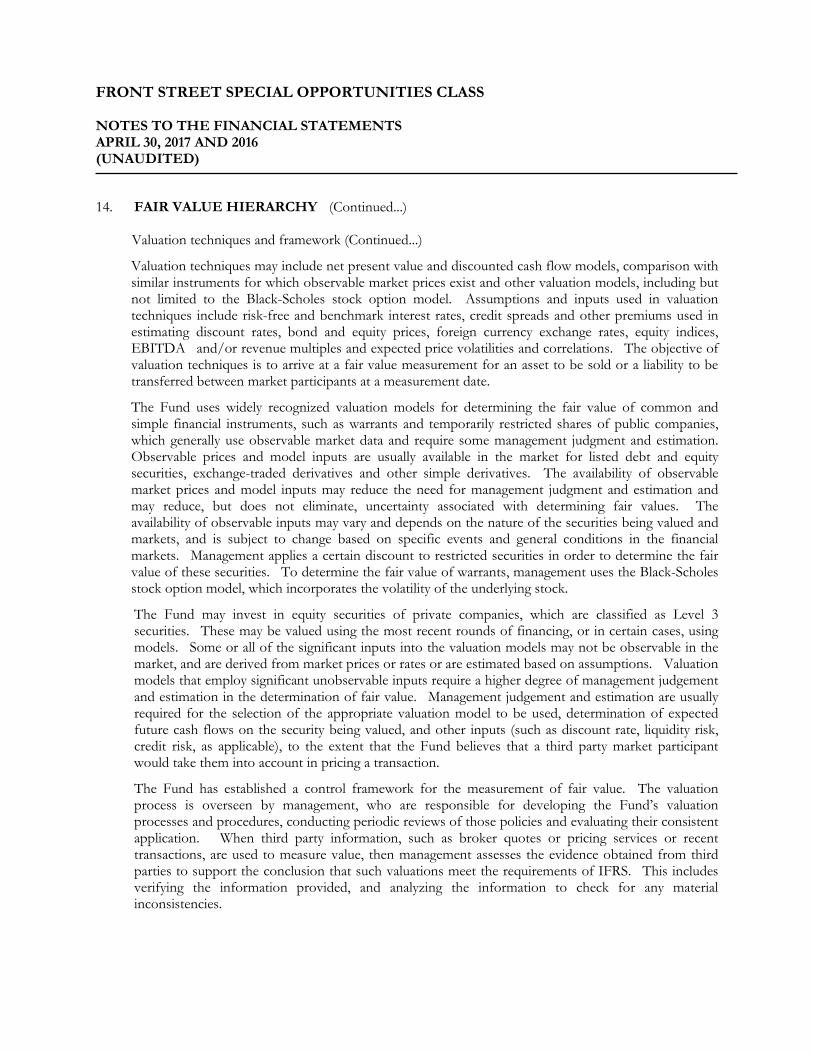
14. FAIR VALUE HIERARCHY (Continued...)
Valuation techniques and framework (Continued...)
Valuation techniques may include net present value and discounted cash flow models, comparison with similar instruments for which observable market prices exist and other valuation models, including but not limited to the Black-Scholes stock option model. Assumptions and inputs used in valuation techniques include risk-free and benchmark interest rates, credit spreads and other premiums used in estimating discount rates, bond and equity prices, foreign currency exchange rates, equity indices, EBITDA and/or revenue multiples and expected price volatilities and correlations. The objective of valuation techniques is to arrive at a fair value measurement for an asset to be sold or a liability to be transferred between market participants at a measurement date.
The Fund uses widely recognized valuation models for determining the fair value of common and simple financial instruments, such as warrants and temporarily restricted shares of public companies, which generally use observable market data and require some management judgment and estimation. Observable prices and model inputs are usually available in the market for listed debt and equity securities, exchange-traded derivatives and other simple derivatives. The availability of observable market prices and model inputs may reduce the need for management judgment and estimation and may reduce, but does not eliminate, uncertainty associated with determining fair values. The availability of observable inputs may vary and depends on the nature of the securities being valued and markets, and is subject to change based on specific events and general conditions in the financial markets. Management applies a certain discount to restricted securities in order to determine the fair value of these securities. To determine the fair value of warrants, management uses the Black-Scholes stock option model, which incorporates the volatility of the underlying stock.
The Fund may invest in equity securities of private companies, which are classified as Level 3 securities. These may be valued using the most recent rounds of financing, or in certain cases, using models. Some or all of the significant inputs into the valuation models may not be observable in the market, and are derived from market prices or rates or are estimated based on assumptions. Valuation models that employ significant unobservable inputs require a higher degree of management judgement and estimation in the determination of fair value. Management judgement and estimation are usually required for the selection of the appropriate valuation model to be used, determination of expected future cash flows on the security being valued, and other inputs (such as discount rate, liquidity risk, credit risk, as applicable), to the extent that the Fund believes that a third party market participant would take them into account in pricing a transaction.
The Fund has established a control framework for the measurement of fair value. The valuation process is overseen by management, who are responsible for developing the Fund’s valuation processes and procedures, conducting periodic reviews of those policies and evaluating their consistent application. When third party information, such as broker quotes or pricing services or recent transactions, are used to measure value, then management assesses the evidence obtained from third parties to support the conclusion that such valuations meet the requirements of IFRS. This includes verifying the information provided, and analyzing the information to check for any material inconsistencies.
FRONT STREET SPECIAL OPPORTUNITIES CLASS NOTES TO THE FINANCIAL STATEMENTS APRIL 30, 2017 AND 2016 (UNAUDITED)
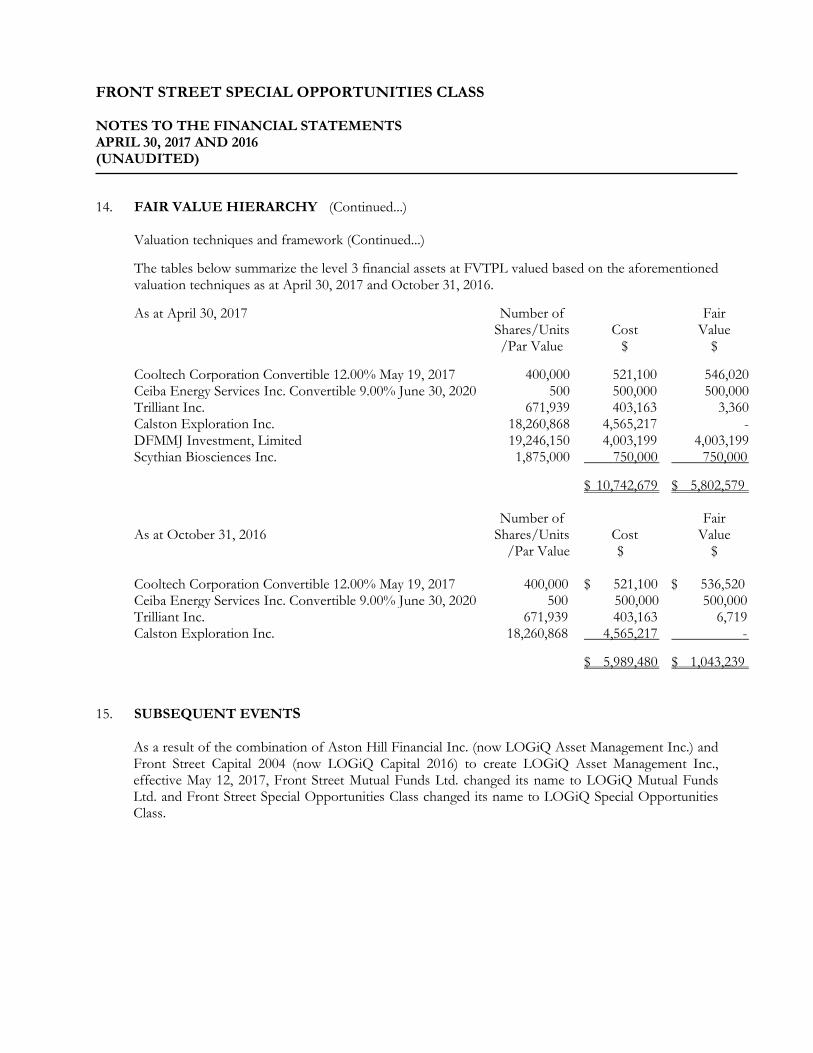
14. FAIR VALUE HIERARCHY (Continued...) Valuation techniques and framework (Continued...)
The tables below summarize the level 3 financial assets at FVTPL valued based on the aforementioned valuation techniques as at April 30, 2017 and October 31, 2016. As at April 30, 2017
Number of Shares/Units /Par Value
Cost
$
Fair Value
$
Cooltech Corporation Convertible 12.00% May 19, 2017 400,000 521,100 546,020 Ceiba Energy Services Inc. Convertible 9.00% June 30, 2020 500 500,000 500,000 Trilliant Inc. 671,939 403,163 3,360 Calston Exploration Inc. 18,260,868 4,565,217 - DFMMJ Investment, Limited 19,246,150 4,003,199 4,003,199 Scythian Biosciences Inc. 1,875,000 750,000 750,000
$ 10,742,679
$ 5,802,579 As at October 31, 2016
Number of Shares/Units
/Par Value
Cost $
Fair Value
$
Cooltech Corporation Convertible 12.00% May 19, 2017 400,000 $ 521,100 $ 536,520 Ceiba Energy Services Inc. Convertible 9.00% June 30, 2020 500 500,000 500,000 Trilliant Inc. 671,939 403,163 6,719 Calston Exploration Inc. 18,260,868 4,565,217 -
$ 5,989,480
$ 1,043,239
15. SUBSEQUENT EVENTS
As a result of the combination of Aston Hill Financial Inc. (now LOGiQ Asset Management Inc.) and Front Street Capital 2004 (now LOGiQ Capital 2016) to create LOGiQ Asset Management Inc., effective May 12, 2017, Front Street Mutual Funds Ltd. changed its name to LOGiQ Mutual Funds Ltd. and Front Street Special Opportunities Class changed its name to LOGiQ Special Opportunities Class.