Embed Size (px)
Citation preview
Street-Level Repression: Protest, Policing, and Dissentin Uganda
Travis Curtice & Brandon Behlendorf ∗
May 31, 2020
Abstract
In many countries, police are both guardians of public safety and the primaryinstruments of state repression. Used to quell dissent, excessive police action can drivefurther collective action, leading to a repression-dissent nexus. Yet does repression spurdissent for all, or only for those already dissenting? We theorize repression by policecauses political backlash, decreasing support for police and increasing political dissent.We argue these effects are conditioned by individuals’ proximity to the repressive actand support for the ruling party. Using a nationally representative survey experimentof 1,920 Ugandans, we find robust evidence for political backlash effects of repressionacross all demographics, regardless of proximity to the event. By examining the politicsof policing, we show excessive police-violence triggers political backlash, decreasinggeneral support for the security apparatus and increasing willingness to publicly dissentfor some populations.
Conditionally accepted at the Journal of Conflict Resolution
Keywords: repression, policing, collective action, survey experiment, Uganda
Replication files, supplementary material and online appendix will be available on theauthor’s website.
∗We thank Courtenay Conrad, Charles Crabtree, Guy Grossman, Jennifer Gandhi, David Davis, VeslaWeaver, Nirvikar Jassal, Javier Osorio, Michael Weintraub, Lynette Ong, Gustavo Flores-Macias, and JessicaZarkin and other participants in the 2019 Politics of Policing Virtual Conference for helpful comments.Mildmay Uganda Research Ethics Committee (MUREC), an ethics review committee accredited by theUganda National Council of Science and Technology approved the study (#REC REF 0204-2017) andthe Uganda National Council of Science and Technology (REF SS4302). Additionally, Emory University’sInstitutional Review Board declared the study exempt under 45 CFR 46.101 (b)(2) REF IRB00104491. Thepre-analysis plan is registered with Evidence in Governance and Politics (EGAP) ref: 20180716AA. Fundingfor this research was provided by the National Science Foundation (#1343123). Corresponding author:[email protected].
Introduction
Does repressive action by police increase political dissent? If so, are these effects conditioned
by whether individuals support the regime or identify with dissenters? The relationship
between state repression and political dissent has generated substantial discourse over the
past three decades (Davenport et al. 2019).1 While meant to deter future collective action
(Davenport 2007, Earl, Soule and McCarthy 2003), state repression also sparks dissident be-
havior (Moore 1998, Rozenas and Zhukov 2019), creating divergent expectations regarding its
(in)effectiveness. Repression can reduce incentives for immediate mobilization by dissenters
but also broaden the willingness of sympathizers to protest state actions in the future. As a
result, the use of state repression remains a strategic challenge for leaders (Pierskalla 2010),
and an empirical puzzle for researchers (Davenport et al. 2019, Ritter and Conrad 2016).
Previous work on state repression and collective action has two key limitations. First, the
literature generally assumes repression by governing institutions is binary: either they are
repressing (and viewed illegitimately) or they are not repressing (and viewed legitimately).
This limited view overlooks the dual nature of many state security institutions, especially
in non-democracies. For example, police are both guardians of public safety, providing law
and order for all (including those protesting),2 and instruments of state repression used to
quell political dissent. While police presence at protests, even without further escalation, can
be an expression of state coercion (Earl, Soule and McCarthy 2003), police are responsible
for providing protection – securing public spaces, private property, and physical integrity
rights. Consequently, police can simultaneously facilitate dissent and administer repression.
Efforts to understand police’s role in generating dissent must differentiate between these two
functions of police.
Second, previous work on the effects of repression focuses on those already dissenting,
1See for example, Carey (2006), Davenport (1995, 2007), Henderson (1991), Lichbach (1987), Moore(2000), and Nordas and Davenport (2013).
2As Earl, Soule and McCarthy (2003, 586) note: “police at a protest event have a wide array of policingoptions, ranging from continued presence with no further action to the deployment of escalated force.” Forexample, see McCarthy and McPhail (1998), McPhail, Schweingruber and McCarthy (1998).
1
often at the expense of its broader role in mobilizing public opinion (Lupu and Wallace 2018).
Most studies select on those dissenting (Lawrence 2017, Opp and Roehl 1990), focusing on
the pathway from repression to mobilization through dissent. However, those engaged in
protest have already overcome barriers to mobilization (Kuran 1991, Lohmann 1993, 1994),
whether due to strategic choice (Ritter and Conrad 2016) or familial antecedent (Lawrence
2017). Questions remain regarding repression’s potential for widening the constituency for
dissent, especially among those who identify with the party in power. Government repression
influences the general public’s assessment of human rights within their country (Anderson,
Regan and Ostergard 2002), but little is known whether repression serves to discredit state
institutions (Bratton and Masunungure 2006) or encourages greater willingness to publicly
criticize or protest actions taken by the state (Rasler 1996, Sullivan, Loyle and Davenport
2012).
Following calls to disaggregate the unit of analysis within repression-dissent studies (Dav-
enport 2007, Lawrence 2017), we extend the study of repression by focusing on the effects of
one form of state repression (police using excessive force at a rally) on individuals’ attitudes
and responses to the state. Examining citizen support for police is important because polic-
ing is relational and depends on formal and informal networks, shared norms, and behaviors.
To maintain law and order, police require the public’s consent; they build that consent by
behaving in a trustworthy way during routine interactions with citizens. Citizen compliance
with police and cooperation more broadly is foundational to maintaining social order and de-
terring criminal activity. Yet, police also engage in repressive acts such as targeting minority
groups at disproportional rates, intimidating political opponents through electoral violence,
and violently shutting down collective action by citizens (Arriola 2013, Hassan 2017, Truex
2019).
We argue repressive action by police triggers political backlash generally, decreasing sup-
port for police and increasing willingness for political dissent, including public criticism of
the state security apparatus and future protests. Moreover, we expect these effects to be
2
conditional based on the act of repression. In particular, how police officers use coercion –
whether to ensure law and order or repress collective action – affects how individuals respond
to use of force by police.
In order to test these arguments, we embed an experiment in a nationally representa-
tive survey of 1,920 respondents in 100 districts and 194 parishes in Uganda, an electoral
autocracy.3 Previous work examining the effect of repression on dissent suffers from several
methodological challenges which survey experiments address. First, behaviors are endoge-
nous, as governments and political activists act in expectation of each other’s behavior (Ritter
and Conrad 2016). Second, observational event data are limited in their ability to separate
events where police use appropriate force from those where they use excessive force, making
the counterfactual unclear. Third, variation in police action is not random and likely to suf-
fer from selection bias, making causal identification with these data difficult. We contribute
to this literature by using a nationally representative survey experiment of police-citizen
interactions within a state where political authorities often rely on police to repress political
dissent
We randomly assigned respondents to one of four hypothetical conditions: 1) they observe
a rally where police use force to maintain law and order; 2) they participate in a rally where
police use force to maintain law and order; 3) they observe a rally where police use excessive
force; and 4) they participate in a rally where police use excessive force. We then measure
whether respondents would support, publicly criticize, and/or protest actions taken by police.
Our study provides a unique perspective on police repression within a non-democracy.
Conducted in Uganda from June 28 to July 20, 2018, we completed data collection less than
a month before the arrest and torture of Robert Kyangulany Ssentamu, also known as Bobi
3We sought to address several ethical concerns by working closely with a highly reputable researchfirm. The survey experiment was included in a panel survey round focused on safety, policing, and security.Our study was approved by the Uganda National Council of Science and Technology and Mildmay UgandaResearch Ethics Committee. The survey experiment was included in a panel survey round focused on safety,policing, and security. Study participants were told the topic of the round and participation remainedcompletely voluntary throughout the study. Moreover, one of the authors has experience working in Ugandagoing back to 2007. A year before the study, this author travelled to Uganda to discuss this study and otherprojects with the research firm.
3
Wine, and other opposition politicians during the Arua Municipal by-elections. Suppressive
actions taken by the Uganda Police Force (UPF) and other security sector forces underscore
tensions between safety and repression that civilians face toward police in non-democracies,
as well as other forms of governance. The excessive force used by the UPF increased political
dissent throughout Uganda, providing additional evidence that our results generalize to the
observed repression-dissent dynamics in Uganda.
To preview our results, we find robust evidence of general backlash effects. Respondents
assigned to treatments involving excessive police force expressed less support for police and an
increased willingness to publicly criticize and even protest actions taken by police. Moreover,
viewing repression while engaged in the rally led to an increased willingness to publicly
criticize police and engage in future protests. We further examine the moderating effects of
various demographic factors and individuals’ support for the ruling party. Overall, reactive
police repression, even in a non-democracy like Uganda, violates people’s expectations about
the role of police in society.
Repression and the Police
An extensive literature examines the dynamics between repression and protest (Carey 2006,
Gurr 1986, Lichbach 1995, 1987, Moore 1998, Opp 1994, Rasler 1996, Tilly 1978, Zimmer-
man 1980). As a mechanism of control to raise the cost of collective action (Tilly 1978), the
strategical goal of repression is to reduce the capacity and/or will to challenge the status
quo by deterring future dissent (Galtung 1969, Nordas and Davenport 2013). State repres-
sion includes such strategies as psychological intimidation (stigmatization or increased fear
entering public spaces), infliction of material losses (loss of economic revenue and destruc-
tion of property), or physical rights violations (arrest, torture, disappearance, or death).
This relationship is endogenous, as “governments and dissidents act in expectation of each
other’s behavior” (Ritter and Conrad 2016, 85). Accordingly, many have found that dissent
4
positively increases the likelihood and severity of government repression.4
However, others argue that repression can both spark and deter dissident behavior, de-
pending on government’s repressive tactics (Moore 1998). Targeting clandestine activities
might decrease dissent but using it against overt, collective challenges might escalate dis-
sent (Sullivan 2016). We are focusing on the second type of repression: reactive, public
crackdowns by police of individuals engaged in collective action.5
The literature on state repression and protests often assumes the state is a unitary actor
repressing to protect the status quo (Carey 2006, DeMeritt 2012, Fariss 2014, Henderson
1991, Murdie and Davis 2012, Poe and Tate 1994, Ritter and Conrad 2016). Theoretically,
the logic of repression develops from the interests and preferences of the executive. Em-
pirically, most quantitative studies offer cross-national analysis with the primary unit of
analysis at the country level, i.e., country-year or country-month. Even studies examining
within country variation in repression have typically focused on the interests of the political
authorities. For example, Truex (2019) examines focal points and preemptive repression in
China and Arriola (2014) studies 15,000 protest-related arrests in Ethiopia; both studies
employ variation in the pattern of arrests as a proxy for repression motivated by the central
government. However, the unitary actor assumption potentially biases our understanding
of important sub-state variation in the behavior of and response to the political actors re-
sponsible for most repression: the police. By focusing on the preferences and interests of the
political authorities, interactions between police and citizens have remained under-explored.
Two perspectives within the literature have relaxed the unitary actor assumption to ad-
dress the principal-agent problem leaders have in organizing their policing apparatus. First,
from a policing perspective, law and order and security more broadly are considered pub-
lic goods provided by street-level bureaucrats (Lipsky 1971). Within American Politics,
4The theoretical claim is so consistently expressed and real-life examples of governments using repressionas a mechanism to deter civilian dissent so ubiquitous, human rights scholars have referred to this relationshipas the “Law of Coercive Responsiveness” (Davenport 2007).
5We are interested in examining the effects of observable repression by police of collective action, whichdiffers from studies that, at least theoretically, focus on ex ante preventive repression (Greitens 2016, Ritterand Conrad 2016, Truex 2019).
5
scholars have examined the adverse selection and moral hazard problems associated with
policing because policing requires high levels of discretion (Wilson 1968); results in informa-
tional asymmetries between officers (agents) and policing principals (Goldstein 1960, Wilson
1968); and monitoring and oversight are costly and not always effective (Goldstein 1960, Wil-
son 1968). Much of this literature explores problems principals face when they are concerned
about selecting the wrong officers or ensuring selected officers remain honest.
Second, from a human rights perspective, studies examine how governments structure
their security apparatus to ensure repressive compliance (Hassan 2017), deter threats from
coups (Svolik 2012), and evade responsibility for human rights abuses (Cohen and Nordas
2015, DeMeritt 2012, Mitchell, Carey and Butler 2014). In non-democracies, coercive institu-
tions are “a dictator’s final defense in pursuit of political survival, but also (the government’s)
chief obstacle to achieving that goal” (Greitens 2016). Yet many of these studies focus on
the dynamics between the government and the military, overlooking the role of the police.
Consequently, the literature assumes that police officers are either street-level bureaucrats
or cogs in the state’s repressive apparatus. This is problematic as it either assumes away
the politics of policing or overlooks the front-line role of police as repressive agents in many
countries. In the first case, the prominent assumption is that if principals solve the moral
hazard and adverse selection problems associated with policing, governments will effectively
provide law and order. In the second case, leaders are often motivated by political survival,
often at the cost of violating (or at least failing to protect) physical integrity and property
rights. In many non-democracies, the police are the political authorities’ primary instruments
of repression.
The Dual Role of Police
Police officers around the world from Bolivia, Colombia, Iraq, Hong Kong, Greece, Malawi,
Spain, Tanzania, Uganda, and Zimbabwe have engaged in excessive force violating the phys-
6
ical integrity rights of protesters, journalists, and others. In Colombia and Bolivia, protests
escalated after the police used repressive tactics to crackdown on anti-government protests.
In Iraq, more than 200 people were killed in 2019 by police and other security forces dur-
ing anti-government protests. Rather than quelling dissent, the police violence encouraged
greater turnout in street-level protests against the government actions. Similarly, in Spain,
hundreds of protesters clashed with police in the heart of Barcelona, assembling fiery barri-
cades and throwing rocks at security forces. In Malawi, Tanzania, Uganda, and Zimbabwe,
political authorities rely on the police both for preventative and responsive repression to
deter collective action. Although police officers may act alone using their coercive capacity
in illegitimate ways, these examples highlight that across an array of regime types, political
authorities justify using excessive police force “as legitimate action” to deter protesters and
reestablish rule of law. But how do people view actions taken by the police?
Police have two important roles in society. On one hand, police are agents providing
law and order as one of the most important and basic public goods states provide (Hobbes
1651, Weber 1946). On the other hand, police function as agents of repression ensuring the
survival of political elites and maintaining the political status quo. Existing studies have
considered the role of security forces as instruments of repression.6 However, few examine the
interactive relationship between protesters and police. Despite a robust literature on state
repression and dissent, we do not know whether individuals respond differently to police
officers who use their coercive capacity in a measured way to provide law and order and
safety for civilians compared to those who use excessive violence against protesters.
We argue this is problematic for two reasons: first, civilians’ attitudes and perceptions
toward police likely condition their willingness to cooperate with police (Blair, Karim and
Morse 2019, Curtice 2019, Tyler et al. 2018). Second, police officers are responsible for
6Studies have examined the principal-agent problems associated with repression, including: the rela-tionship between executives and individuals responsible for supervising and interrogating (torturing) stateprisoners (Conrad and Moore 2010); why executives delegate human rights abuses to militias (Cohen andNordas 2015, Mitchell, Carey and Butler 2014); and the moral hazard of authoritarian repression and militaryintervention (Svolik 2013).
7
both maintaining order and repressing threats to the political status quo. This contributes
to potentially opposing views of police: individuals simultaneously resent repression and
demand safety from the same institution. Coercive institutions not only pose a direct threat
to autocrats through coup-like activity, they pose an additional threat by generating political
dissent when they use excessive force.
For civilians, attitudes toward the police condition their responses to police actions.
Particularly, individuals who believe the police provide law and order as a public good will
support actions taken by the police, even if it requires the use of coercion (French and Raven
1959, Hinsch 2008, Tankebe 2009, Tyler 1990). Alternatively, when that coercion is used
to protect the interests of political authorities, upholding the status quo and ensuring the
regime’s political survival, we should expect individuals to oppose police action (Beetham
1991, Jackson and Bradford 2009). Whether citizens support police actions and cooperate
in the co-production of law and order depends on whether they trust that the police are
concerned about their safety and security when interacting with them
Citizens’ beliefs about the ability of police to secure public spaces and expectations about
experiencing repression likely condition whether people dissent from or cooperate with police.
Protesting, for example, involves several possible threats to would-be protesters – repression
from the state, violence from counter-protesters, destruction of property, and violation of
personal integrity rights by fellow protesters. To understand these threats, it is important to
examine the ability of police to provide safety and security and whether they use measured
or excessive force. Considering the conditions that make political dissent more or less likely
requires us to examine how behavior of police at protests shape individuals’ attitudes and
behavior toward the state. When police use repressive force, citizens will be more frustrated
with the status quo. Given police are one of the most visible extensions of the state apparatus,
citizens are likely to blame the state for violations by police.
We argue excessive force by security forces while policing political dissent should trigger
8
expressions of political dissent.7 Excessive police abuses in democracies likely undermines
people’s confidence in the police. However, even in non-democracies, where political author-
ities are not held accountable through elections, individuals can protest government abuses
or engage in other forms of dissent. Although these “backlash” effects from police repres-
sion are likely stronger under democratic governments, the dual role of police suggests these
actions can be viewed as illegitimate even in authoritarian contexts. We expect repression
causes political backlash across the complete spectrum of political dissent. In particular,
compared to appropriate police actions, excessive police force will decrease support for the
police and increase public criticisms and future protests. Importantly, the counterfactual to
our claim is not repressive action by police compared to no police action, as protesters might
select out of situations where security is not provided. Rather we compare the state’s use of
excessive violence at a rally with more conventional norms of “appropriate” force, allowing
us to compare how individuals perceive the dual role of police in autocracies.
The Spectrum of Dissent
Finally, citizens are more likely to engage in dissent against the government when they are
frustrated with the status quo. Dissent might be driven by insecurity, food scarcity, economic
and political inequalities, deprivation, and poor economic conditions.8 Citizens’ frustration
with the status quo might be in absolute terms or relative to other people or communities
(Gurr 1970, Lichbach 1995). There are two important conditions for political dissent: first,
citizens are frustrated with the status quo; and second, citizens blame the government for
their frustration.
Dissent involves a range of attitudes and actions. First, political dissent might involve a
decrease in the expressed level of support for the political status quo. Second, political dissent
7Other have highlighted the inefficiencies of repression to solve “threats from below,” for example, see(Gandhi 2008, Wantchekon 2002).
8See for example: Acemoglu and Robinson (2006), Gurr (1970), Hollyer, Rosendorff and Vreeland (2015),Muller (1985).
9
might involve individuals who are willing to make their opinions or frustrations about the
status quo known by publicly criticizing actions taken by the state. Third, political dissent
might involve collective action such as a protest or riot to challenge the state. While citizens
might be more likely to engage in dissent when they blame the government for treating them
unfairly or for restricting their opportunities, they also recognize the costs associated with
expressing those opinions or acting to challenge them.
When dissent becomes increasingly visible, the incentives for engaging or not vary by
citizens’ ability to free-ride on benefits from collective action and pressures to falsify their
preferences. Knowing they might benefit from any shift in the status quo towards their
ideal point, citizens have strong incentives to stay home and free-ride on others actions to
challenge the status quo (Lichbach 1995, Olson 1965). However, for citizens willing to engage
in collective action, there are costs associated with revealing their preferences and willingness
to challenge the status quo.
Whether these individuals engage in dissent depends on whether they believe they have a
sufficient threshold to effectively mobilize and impose change from below (De Mesquita 2010,
Kuran 1991, Lohmann 1993, Shadmehr and Bernhardt 2011). Given the role of preference
falsification in authoritarian politics (Kuran 1991, Lohmann 1993, 1994), we expect that
citizens who are willing to engage in collective action are likely more willing to engage in
future protests. People who have engaged in previous political actions such as attending or
organizing a rally are more likely to collectively mobilize again relative to individuals who are
opportunistic by-standers hoping to free-ride. Citizens who participate in protests or other
political events will be more likely to express political preferences associated with dissent.
Moreover, people’s attitudes toward police and their willingness to engage in dissent
might depend on two things: first, whether individuals see themselves as engaged (or not) in
collective action; and second, whether police use legitimate or excessive force to provide law
and order. Previous studies examining the effect of repression on dissent focus on those who
are already engaged in collective action. However, these individuals have already overcome
10
the coordination and collective action problems associated with mobilization. Alternatively,
the responses of bystanders play a crucial role in linking political opportunities to mobi-
lization (Braun and Koopmans 2014). Fear might deter individuals, including bystanders,
from engaging in collective action (Young 2019). However, some argue that observing a
protest might increase collective action by consolidating people’s willingness to identify with
protestors or engendering moral outrage and sympathy among bystanders with repressed
groups (Saab et al. 2015). To examine the effects of repression on dissent, we need to
consider potential bystander effects – whether responses of individuals who observe but do
not participate in collective action vary from individuals who identify as participating in a
protest.
Observable Implications
Our theoretical discussion above leads to the following observable implications. Table 4
summarizes our theoretical expectations across the control treatment and the three treatment
groups.
H1a: Assignment to participation in a rally decreases people’s support for police.
H1b: Assignment to participation in a rally increases people’s willingness to publicly criti-
cize the police.
H1c: Assignment to participation in a rally increases people’s willingness to protest.
H2a: Assignment to excessive police force at a rally decreases people’s support for police.
H2b: Assignment to excessive police force at a rally increases people’s willingness to pub-
licly criticize the police.
H2c: Assignment to excessive police force at a rally increases people’s willingness to protest.
H3a: Assignment to participation and excessive police force at a rally decreases people’s
11
support for police.
H3b: Assignment to participation and excessive police force at a rally increases people’s
willingness to publicly criticize the police.
H3c: Assignment to participation and excessive police force at a rally increases people’s
willingness to protest.
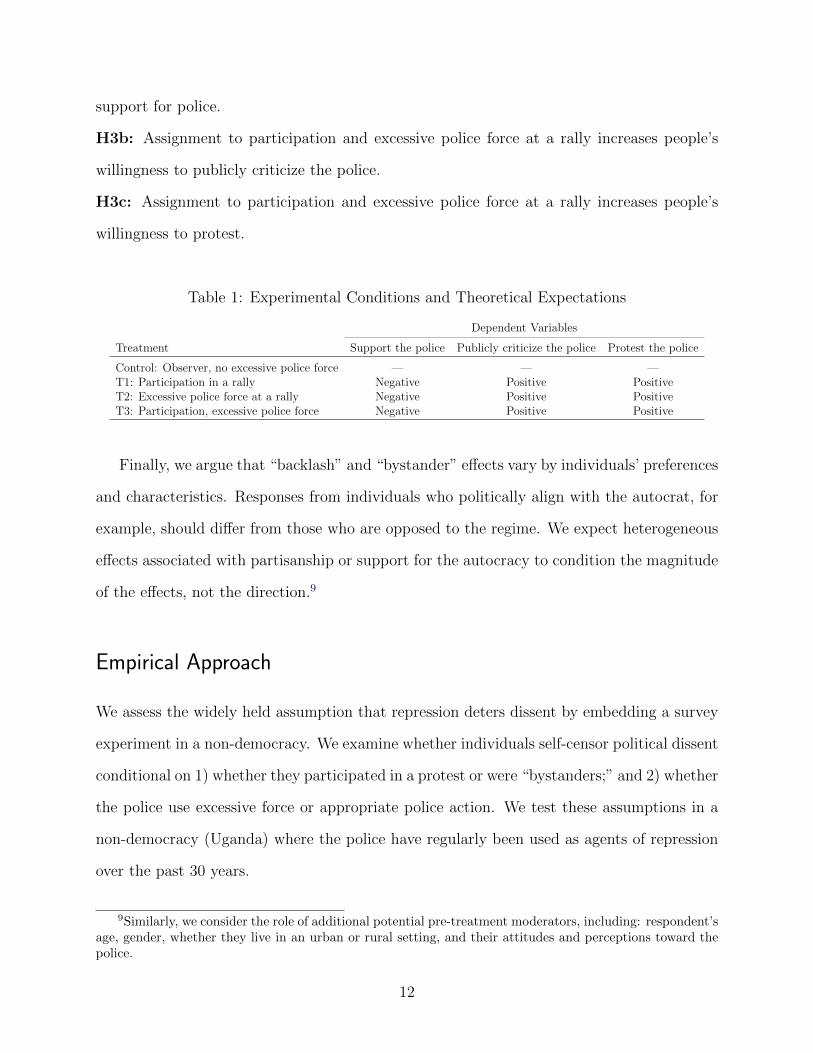
Table 1: Experimental Conditions and Theoretical Expectations
Dependent Variables
Treatment Support the police Publicly criticize the police Protest the police
Control: Observer, no excessive police force — — —T1: Participation in a rally Negative Positive PositiveT2: Excessive police force at a rally Negative Positive PositiveT3: Participation, excessive police force Negative Positive Positive
Finally, we argue that “backlash” and “bystander” effects vary by individuals’ preferences
and characteristics. Responses from individuals who politically align with the autocrat, for
example, should differ from those who are opposed to the regime. We expect heterogeneous
effects associated with partisanship or support for the autocracy to condition the magnitude
of the effects, not the direction.9
Empirical Approach
We assess the widely held assumption that repression deters dissent by embedding a survey
experiment in a non-democracy. We examine whether individuals self-censor political dissent
conditional on 1) whether they participated in a protest or were “bystanders;” and 2) whether
the police use excessive force or appropriate police action. We test these assumptions in a
non-democracy (Uganda) where the police have regularly been used as agents of repression
over the past 30 years.
9Similarly, we consider the role of additional potential pre-treatment moderators, including: respondent’sage, gender, whether they live in an urban or rural setting, and their attitudes and perceptions toward thepolice.
12
As discussed above, the general phenomenon of political backlash against police abuse
should be more likely in democracies than non-democracies. The more democratic the form of
government, the more likely backlash to excessive police abuses or repression should emerge.
In contexts like a closed autocracy, where collective action is effectively banned or repressed,
our theory is least likely. However, if we observe backlash effects in non-democratic countries
reliant on the police for preventative and responsive repression of protestors, then our theory
is plausible for other cases where collective action is limited but available.
Case Selection: Policing Dissent in Uganda
In selecting a case for our study, we focused on an electoral autocracy where threats to the
regime are likely to be repressed but there is still political space to challenge the incumbent
government. To that end, we conduct this experiment in Uganda for three main reasons.
First, Uganda is a non-democracy where Yoweri Museveni has maintained control since
1986.10 Although Museveni won the last three elections with an average vote-share of 60.27%,
elections in Uganda were generally panned by international and domestic observers as lacking
electoral credibility (Abrahamsen and Bareebe 2016). Human rights are severely restricted
and in many cases violated. Political freedoms including electoral democracy, access to
information and justice, and human rights protections remain curtailed or openly violated
by the regime.
Second, high restrictions on free and open political spaces remain as the government
limits political competition and represses dissent.11 Museveni has maintained power with
his ruling coalition by using cooptation and coercion, including gerrymandering districts
to provide political goods to party loyalists and using the internal security apparatus to
repress threats to his political survival. In September 2009, for example, security forces used
10Multiparty elections were first held in 2006 after 92% of voters approved the introduction of a multipartysystem by referendum in July 2005. Only 42% of the electorate voted in the 2005 referendum but those whodid vote wanted a marked departure from the 2000 referendum where 90.7% voters wanted a “Movement”not a “Multiparty” political system.
11Restrictions on opposition parties have plagued each of Uganda’s subsequent elections, including arrestsand beatings of opposition leaders like Kizza Besigye and Robert Kyangulany Ssentamu.
13
live fire to deter protests in Kayunga. Hospitals in the area reported treating more than 88
victims following the violence, the vast majority for gunshot wounds. The official government
statement was that 27 people died resulting from security forces’ “stray bullets” (Barnett
2018), although some estimate more than 40 died. Rather than investigating the excessive
use of force, police targeted protesters, arresting almost 850 suspected of participating in the
unrest (Barnett 2018).
Third, the Uganda Police Force (UPF), led by the Inspector General of Police (IGP), falls
under the direct control of the president. While the Internal Security Organization (ISO), led
by the Security Minister, also contributes to domestic security, the UPF is the primary police
institution in Uganda.12 We focus on the role of UPF, rather than other repressive agents,
because they are the security sector most likely to engage in the daily activity we associate
with repressing dissent. For example, political authorities have increasingly relied on police
to repress political dissent associated with the social media tax protests in July 2018 and the
by-election rallies in August 2018. After violence broke-out during the by-elections in Arua
Municipality, 5 people were killed by security forces, 33 people were charged with treason
and an additional 150 people were held on remand (Monitor 2018).
The UPF’s involvement in state repression is long standing. From January 1997 to
July 2018, data show that the UPDF and UPF were collectively involved in 2,377 events
of political violence and social unrest, with the UPF involved in 30% of them (Raleigh
et al. 2010). Although there are concerns with under-reporting within events data, the
ACLED data show important variation regarding which state agency engages in repression
(see Table 2). While the UPDF conducted more political violence events than the UPF,
nearly all (94.2%) were not common policing operations but rather battle-related or remote
violence events, primarily involving clashes with insurgent groups.13 When we consider those
involving the UPF, a vast majority (87%) are categorized as state repression, including
12The Ugandan security sector also includes the Uganda People’s Defense Force (UPDF) and the ExternalSecurity Organization (ESO).
13For research on insurgencies in Uganda and rebel networks, see Day (2011), Larson and Lewis (2018)and Annan et al. (2011).
14
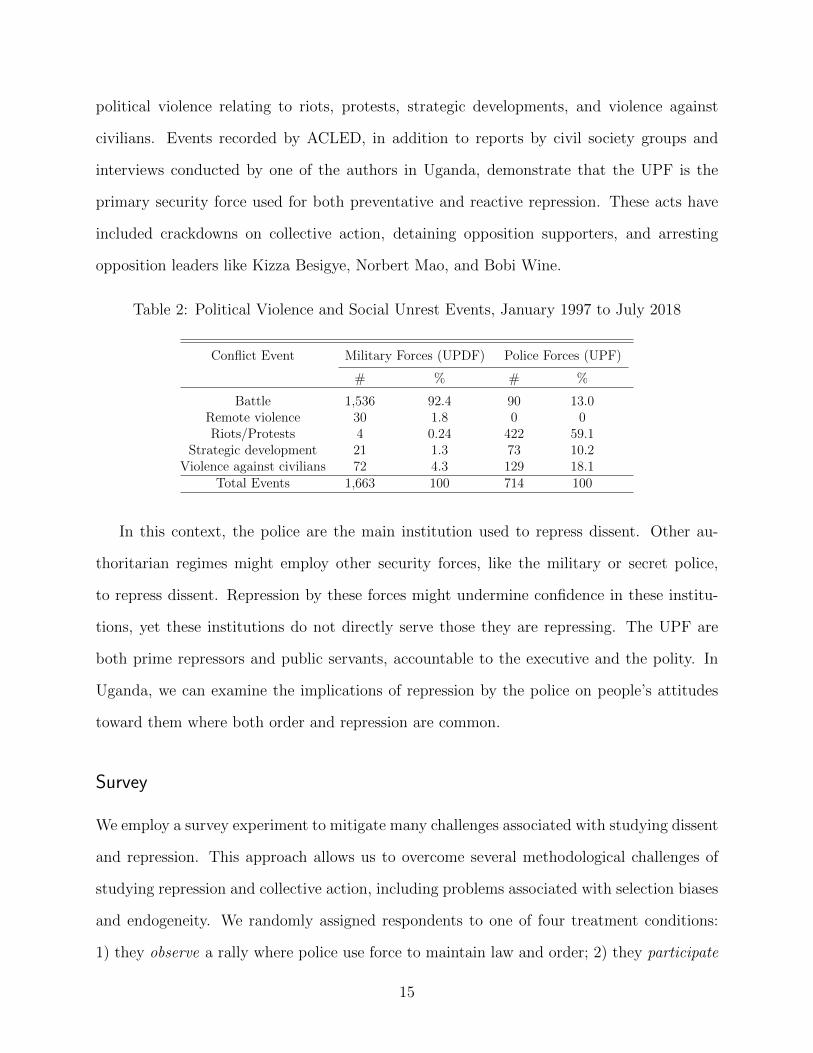
political violence relating to riots, protests, strategic developments, and violence against
civilians. Events recorded by ACLED, in addition to reports by civil society groups and
interviews conducted by one of the authors in Uganda, demonstrate that the UPF is the
primary security force used for both preventative and reactive repression. These acts have
included crackdowns on collective action, detaining opposition supporters, and arresting
opposition leaders like Kizza Besigye, Norbert Mao, and Bobi Wine.
Table 2: Political Violence and Social Unrest Events, January 1997 to July 2018
Conflict Event Military Forces (UPDF) Police Forces (UPF)
# % # %
Battle 1,536 92.4 90 13.0Remote violence 30 1.8 0 0Riots/Protests 4 0.24 422 59.1
Strategic development 21 1.3 73 10.2Violence against civilians 72 4.3 129 18.1
Total Events 1,663 100 714 100
In this context, the police are the main institution used to repress dissent. Other au-
thoritarian regimes might employ other security forces, like the military or secret police,
to repress dissent. Repression by these forces might undermine confidence in these institu-
tions, yet these institutions do not directly serve those they are repressing. The UPF are
both prime repressors and public servants, accountable to the executive and the polity. In
Uganda, we can examine the implications of repression by the police on people’s attitudes
toward them where both order and repression are common.
Survey
We employ a survey experiment to mitigate many challenges associated with studying dissent
and repression. This approach allows us to overcome several methodological challenges of
studying repression and collective action, including problems associated with selection biases
and endogeneity. We randomly assigned respondents to one of four treatment conditions:
1) they observe a rally where police use force to maintain law and order; 2) they participate
15
in a rally where police use force to maintain law and order; 3) they observe a rally where
police use excessive force; and 4) they participate in a rally where police use excessive force.
After reading the assigned treatment prompt, we asked study participants to gauge their
agreement with three related statements along a five-point Likert scale. First, they would
support the actions the police took. Second, they would publicly criticize the actions the
police took. Third, they would protest the actions the police took. Political dissent takes on
many forms and costs associated with collective action vary; however, we designed our study
to capture important variation along the dissent spectrum.14 Treatments were completely
randomized at the respondent level with each participant having an equal probability of
receiving any individual treatment.
Survey Sampling
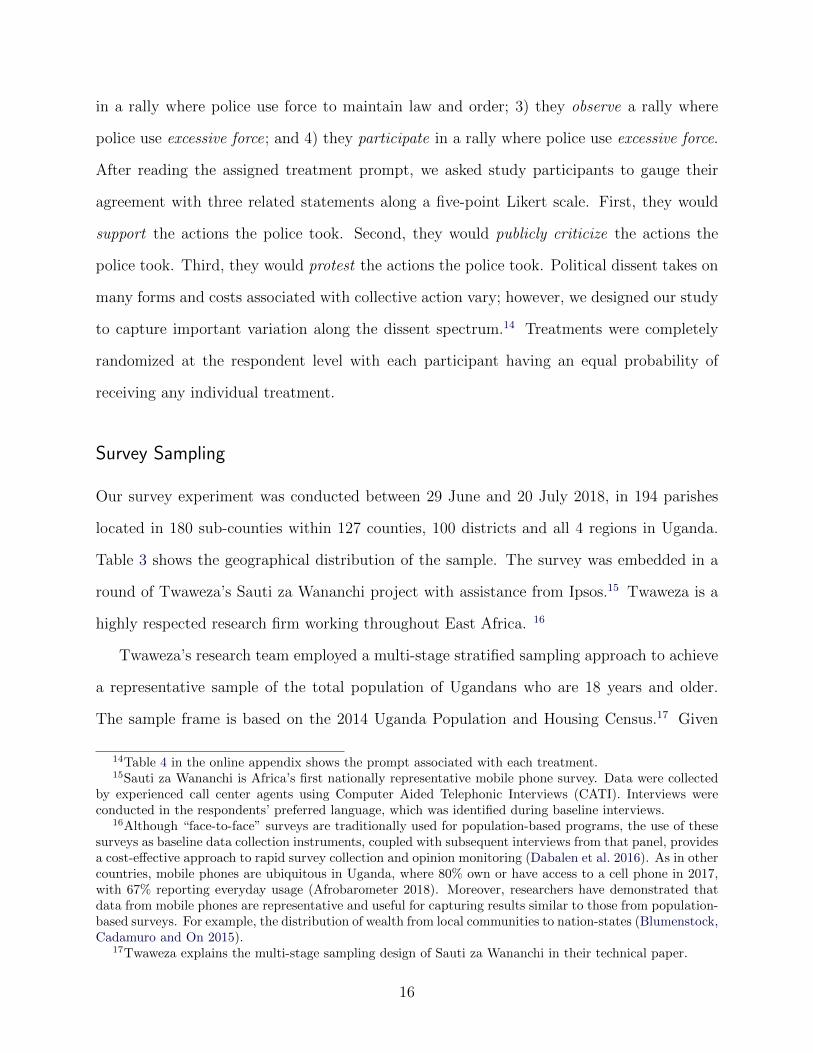
Our survey experiment was conducted between 29 June and 20 July 2018, in 194 parishes
located in 180 sub-counties within 127 counties, 100 districts and all 4 regions in Uganda.
Table 3 shows the geographical distribution of the sample. The survey was embedded in a
round of Twaweza’s Sauti za Wananchi project with assistance from Ipsos.15 Twaweza is a
highly respected research firm working throughout East Africa. 16
Twaweza’s research team employed a multi-stage stratified sampling approach to achieve
a representative sample of the total population of Ugandans who are 18 years and older.
The sample frame is based on the 2014 Uganda Population and Housing Census.17 Given
14Table 4 in the online appendix shows the prompt associated with each treatment.15Sauti za Wananchi is Africa’s first nationally representative mobile phone survey. Data were collected
by experienced call center agents using Computer Aided Telephonic Interviews (CATI). Interviews wereconducted in the respondents’ preferred language, which was identified during baseline interviews.
16Although “face-to-face” surveys are traditionally used for population-based programs, the use of thesesurveys as baseline data collection instruments, coupled with subsequent interviews from that panel, providesa cost-effective approach to rapid survey collection and opinion monitoring (Dabalen et al. 2016). As in othercountries, mobile phones are ubiquitous in Uganda, where 80% own or have access to a cell phone in 2017,with 67% reporting everyday usage (Afrobarometer 2018). Moreover, researchers have demonstrated thatdata from mobile phones are representative and useful for capturing results similar to those from population-based surveys. For example, the distribution of wealth from local communities to nation-states (Blumenstock,Cadamuro and On 2015).
17Twaweza explains the multi-stage sampling design of Sauti za Wananchi in their technical paper.
16
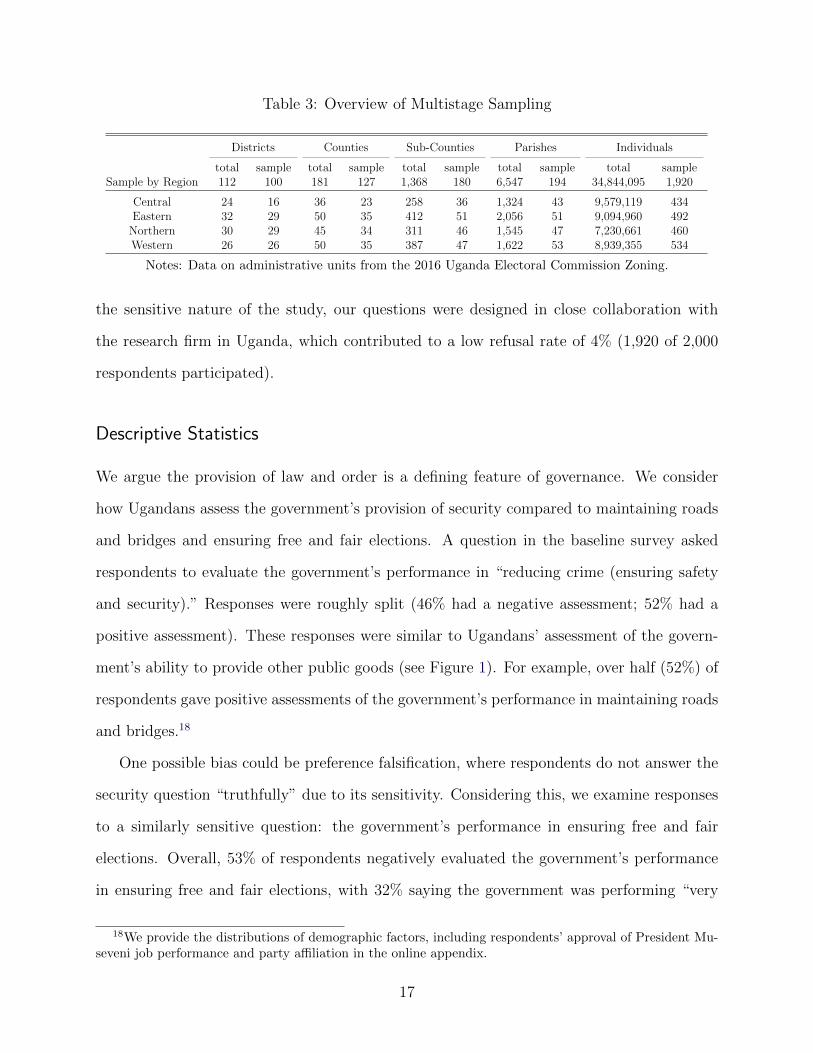
Table 3: Overview of Multistage Sampling
Districts Counties Sub-Counties Parishes Individuals
total sample total sample total sample total sample total sampleSample by Region 112 100 181 127 1,368 180 6,547 194 34,844,095 1,920
Central 24 16 36 23 258 36 1,324 43 9,579,119 434Eastern 32 29 50 35 412 51 2,056 51 9,094,960 492
Northern 30 29 45 34 311 46 1,545 47 7,230,661 460Western 26 26 50 35 387 47 1,622 53 8,939,355 534
Notes: Data on administrative units from the 2016 Uganda Electoral Commission Zoning.
the sensitive nature of the study, our questions were designed in close collaboration with
the research firm in Uganda, which contributed to a low refusal rate of 4% (1,920 of 2,000
respondents participated).
Descriptive Statistics
We argue the provision of law and order is a defining feature of governance. We consider
how Ugandans assess the government’s provision of security compared to maintaining roads
and bridges and ensuring free and fair elections. A question in the baseline survey asked
respondents to evaluate the government’s performance in “reducing crime (ensuring safety
and security).” Responses were roughly split (46% had a negative assessment; 52% had a
positive assessment). These responses were similar to Ugandans’ assessment of the govern-
ment’s ability to provide other public goods (see Figure 1). For example, over half (52%) of
respondents gave positive assessments of the government’s performance in maintaining roads
and bridges.18
One possible bias could be preference falsification, where respondents do not answer the
security question “truthfully” due to its sensitivity. Considering this, we examine responses
to a similarly sensitive question: the government’s performance in ensuring free and fair
elections. Overall, 53% of respondents negatively evaluated the government’s performance
in ensuring free and fair elections, with 32% saying the government was performing “very
18We provide the distributions of demographic factors, including respondents’ approval of President Mu-seveni job performance and party affiliation in the online appendix.
17
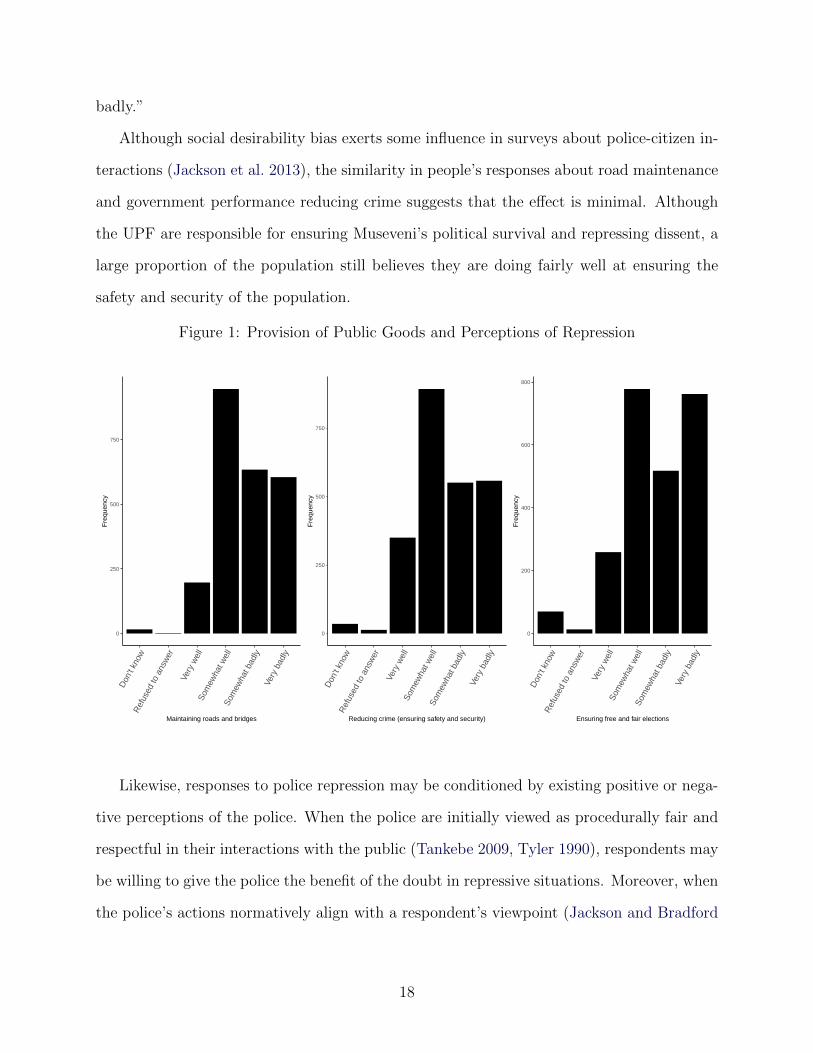
badly.”
Although social desirability bias exerts some influence in surveys about police-citizen in-
teractions (Jackson et al. 2013), the similarity in people’s responses about road maintenance
and government performance reducing crime suggests that the effect is minimal. Although
the UPF are responsible for ensuring Museveni’s political survival and repressing dissent, a
large proportion of the population still believes they are doing fairly well at ensuring the
safety and security of the population.
Figure 1: Provision of Public Goods and Perceptions of Repression
0
250
500
750
Don
't kn
owR
efus
ed to
ans
wer
Very
wel
lSo
mew
hat w
ell
Som
ewha
t bad
lyVe
ry b
adly
Maintaining roads and bridges
Fre
quen
cy
0
250
500
750
Don
't kn
owR
efus
ed to
ans
wer
Very
wel
lSo
mew
hat w
ell
Som
ewha
t bad
lyVe
ry b
adly
Reducing crime (ensuring safety and security)
Fre
quen
cy
0
200
400
600
800
Don
't kn
owR
efus
ed to
ans
wer
Very
wel
lSo
mew
hat w
ell
Som
ewha
t bad
lyVe
ry b
adly
Ensuring free and fair elections
Fre
quen
cy
Likewise, responses to police repression may be conditioned by existing positive or nega-
tive perceptions of the police. When the police are initially viewed as procedurally fair and
respectful in their interactions with the public (Tankebe 2009, Tyler 1990), respondents may
be willing to give the police the benefit of the doubt in repressive situations. Moreover, when
the police’s actions normatively align with a respondent’s viewpoint (Jackson and Bradford
18
2009), repressive actions against protestors may be interpreted as just.19
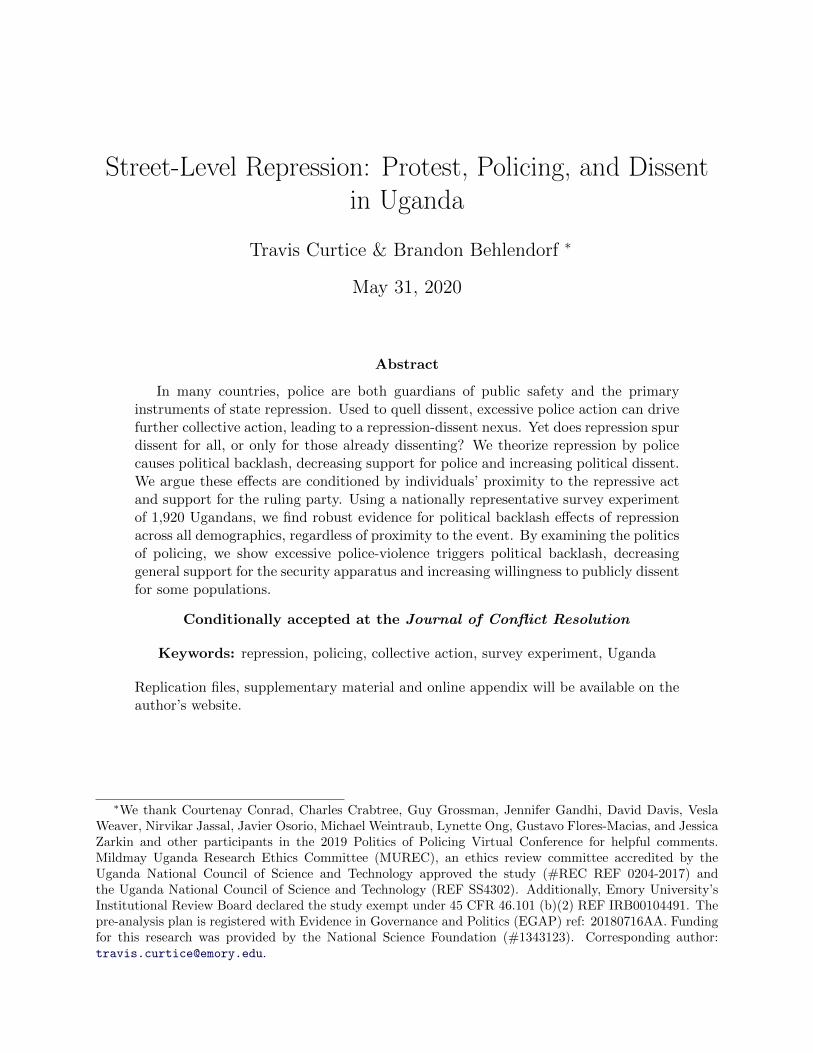
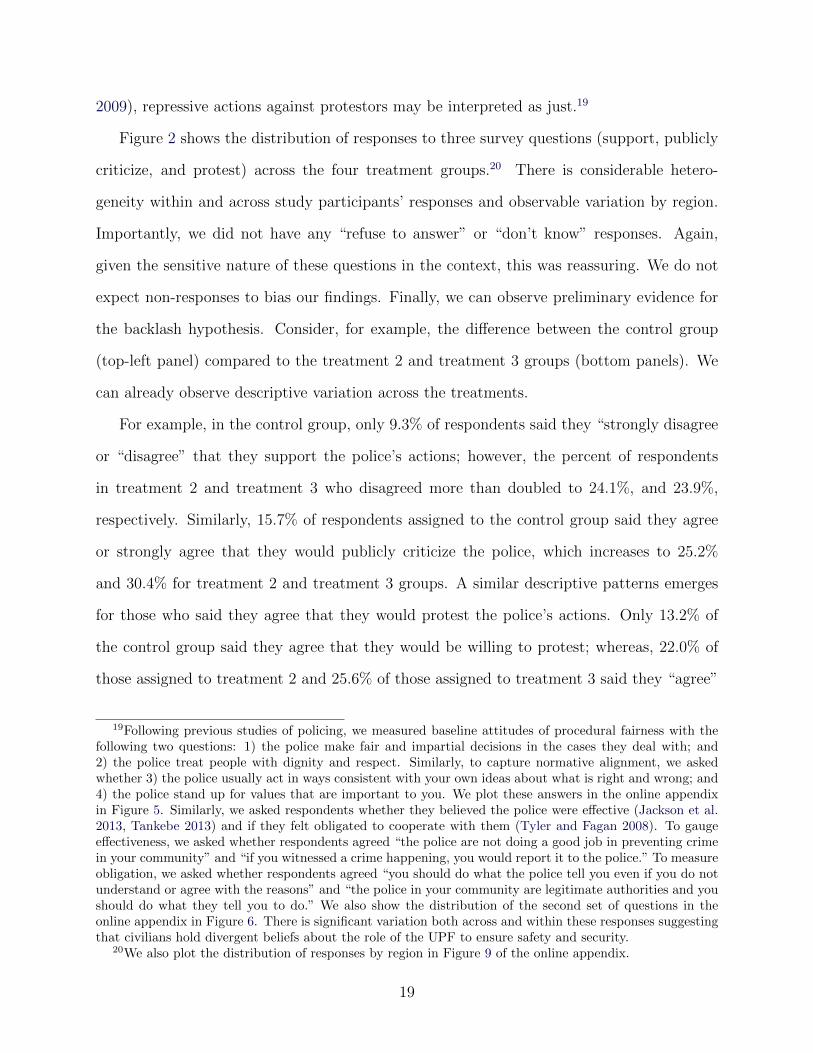
Figure 2 shows the distribution of responses to three survey questions (support, publicly
criticize, and protest) across the four treatment groups.20 There is considerable hetero-
geneity within and across study participants’ responses and observable variation by region.
Importantly, we did not have any “refuse to answer” or “don’t know” responses. Again,
given the sensitive nature of these questions in the context, this was reassuring. We do not
expect non-responses to bias our findings. Finally, we can observe preliminary evidence for
the backlash hypothesis. Consider, for example, the difference between the control group
(top-left panel) compared to the treatment 2 and treatment 3 groups (bottom panels). We
can already observe descriptive variation across the treatments.
For example, in the control group, only 9.3% of respondents said they “strongly disagree
or “disagree” that they support the police’s actions; however, the percent of respondents
in treatment 2 and treatment 3 who disagreed more than doubled to 24.1%, and 23.9%,
respectively. Similarly, 15.7% of respondents assigned to the control group said they agree
or strongly agree that they would publicly criticize the police, which increases to 25.2%
and 30.4% for treatment 2 and treatment 3 groups. A similar descriptive patterns emerges
for those who said they agree that they would protest the police’s actions. Only 13.2% of
the control group said they agree that they would be willing to protest; whereas, 22.0% of
those assigned to treatment 2 and 25.6% of those assigned to treatment 3 said they “agree”
19Following previous studies of policing, we measured baseline attitudes of procedural fairness with thefollowing two questions: 1) the police make fair and impartial decisions in the cases they deal with; and2) the police treat people with dignity and respect. Similarly, to capture normative alignment, we askedwhether 3) the police usually act in ways consistent with your own ideas about what is right and wrong; and4) the police stand up for values that are important to you. We plot these answers in the online appendixin Figure 5. Similarly, we asked respondents whether they believed the police were effective (Jackson et al.2013, Tankebe 2013) and if they felt obligated to cooperate with them (Tyler and Fagan 2008). To gaugeeffectiveness, we asked whether respondents agreed “the police are not doing a good job in preventing crimein your community” and “if you witnessed a crime happening, you would report it to the police.” To measureobligation, we asked whether respondents agreed “you should do what the police tell you even if you do notunderstand or agree with the reasons” and “the police in your community are legitimate authorities and youshould do what they tell you to do.” We also show the distribution of the second set of questions in theonline appendix in Figure 6. There is significant variation both across and within these responses suggestingthat civilians hold divergent beliefs about the role of the UPF to ensure safety and security.
20We also plot the distribution of responses by region in Figure 9 of the online appendix.
19
Figure 2: Distribution of Responses by Treatment Groups
Protest
Publicly Criticize
Support
0.00 0.25 0.50 0.75 1.00Proportion of Responses
Control
0.00 0.25 0.50 0.75 1.00Proportion of Responses
Strongly Disagree
Disagree
Neither Agree nor Disagree
Agree
Strongly agree
T1: Participation
Protest
Publicly Criticize
Support
0.00 0.25 0.50 0.75 1.00Proportion of Responses
T2: Repression
0.00 0.25 0.50 0.75 1.00Proportion of Responses
Strongly Disagree
Disagree
Neither Agree nor Disagree
Agree
Strongly agree
T3: Participation & Repression
Notes: Distribution of responses to three survey questions (support, publicly criticize, and protest) acrossthe four treatment groups: Control (N=491); Treatment 1: Participate Treatment (N=475); Treatment 2:Repression Treatment (N=481); and Treatment 3: Both Participate and Repression Treatments (N=473).
20
or “strongly agree” that they would be willing to protest, respectively. The participation
(treatment 1 group) appears to have less of a backlash effect alone: 7.4% said they ”strongly
disagree” or ”disagree” with the support measure and 18.7% and 18.9% said they “agree”
or ”strongly agree” that they would be willing to publicly criticize or protest the police’s
actions, respectively.
Statistical analyses
We estimate the treatment effects by using the following benchmark Ordinary Least Squares
statistical model. Formally, Yi denotes the response variable for the three outcome measures
of interest: 1) support the police; 2) publicly criticize the police; and 3) willingness to protest
the police. Each outcome variable is modeled by a separate equation, expressed as follows:
Yi = α + β1T1i + β2T2i + β3T3i + εi, (1)
where i indexes respondents, T1i, T2i, and T3i are indicator variables for the respective
randomized “treatment” assignments, which represents the treatment given to i, and εi
captures stochastic error.
We are interested in capturing the effects of the following treatment conditions: 1) i
participated in a rally, 2) whether the police used excessive force; and 3) whether the police
used excessive force when i participated in a rally. These treatment assignments are captured
by the following three parameters: β1, β2, and β3, respectively.21 As a first-cut to examine
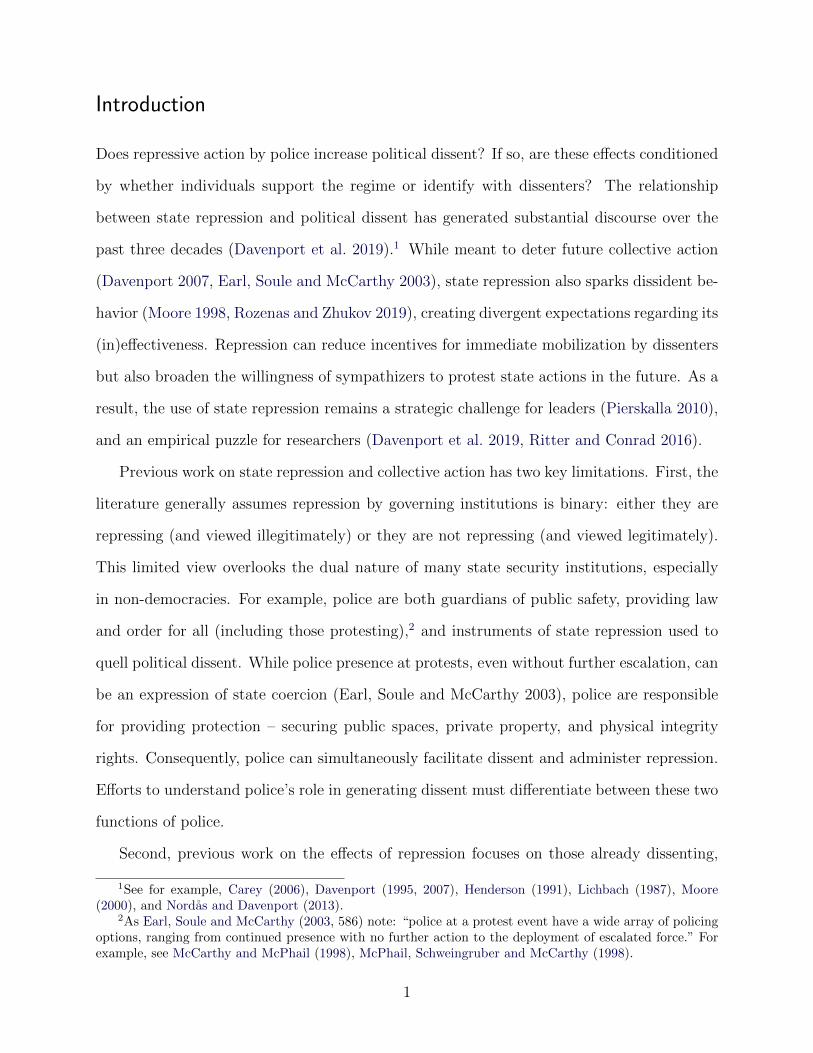
backlash effects, we report coefficient plots from Equation 1 in Figure 3.22
We find robust evidence for the hypothesized “backlash” effect. There is no evidence
that repression deters public criticism or political protests. On the contrary, repression in
the form of excess police violence decreases support for the police and increases respondents’
21Although the outcome measure is ordered, we use OLS models for parsimony in interpretation andbecause coefficient estimates are unbiased if the model is specified correctly. The models are specifiedcorrectly as we only employ dummy variables for the treatment indicators in the model (Wooldridge 2010).To ensure that the results are not model dependent, we also use ordered logistic regression. Results arerobust across the model specifications, reported in Table 6 on page 4 of the Appendix.
22Tabular results reported on page 4 of the Appendix.
21
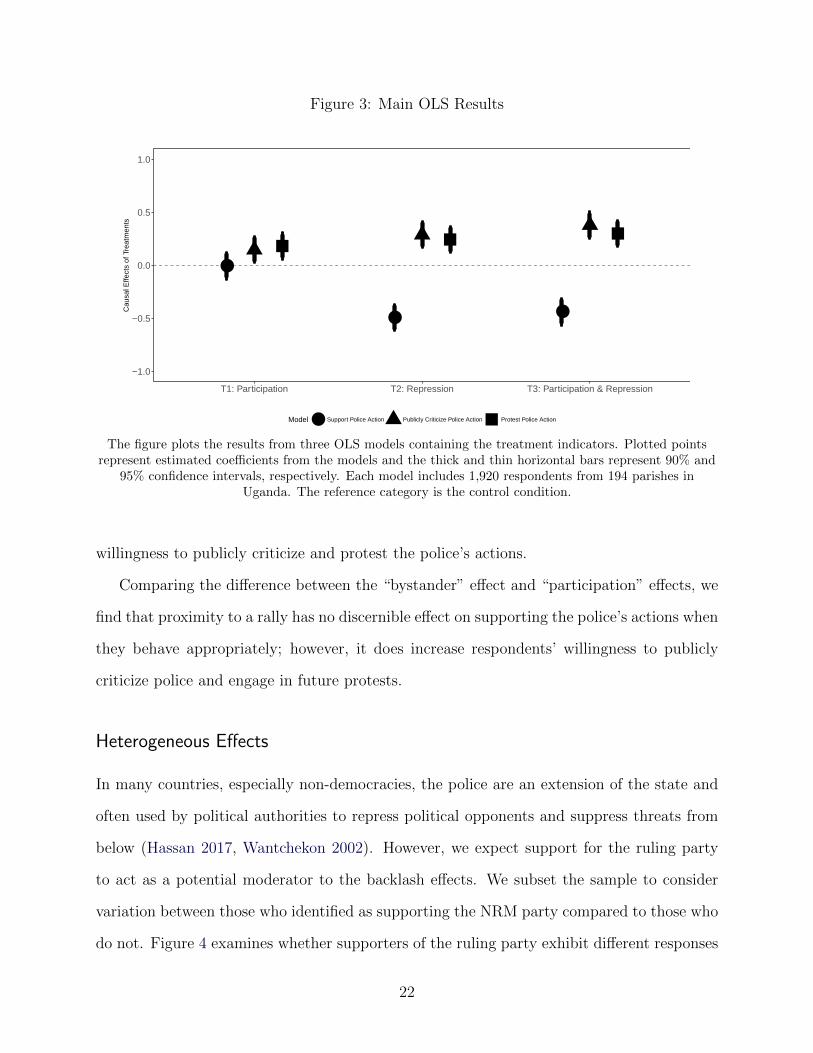
Figure 3: Main OLS Results
●
● ●
−1.0
−0.5
0.0
0.5
1.0
T1: Participation T2: Repression T3: Participation & Repression
Cau
sal E
ffect
s of
Tre
atm
ents
Model ● Support Police Action Publicly Criticize Police Action Protest Police Action
The figure plots the results from three OLS models containing the treatment indicators. Plotted pointsrepresent estimated coefficients from the models and the thick and thin horizontal bars represent 90% and
95% confidence intervals, respectively. Each model includes 1,920 respondents from 194 parishes inUganda. The reference category is the control condition.
willingness to publicly criticize and protest the police’s actions.
Comparing the difference between the “bystander” effect and “participation” effects, we
find that proximity to a rally has no discernible effect on supporting the police’s actions when
they behave appropriately; however, it does increase respondents’ willingness to publicly
criticize police and engage in future protests.
Heterogeneous Effects
In many countries, especially non-democracies, the police are an extension of the state and
often used by political authorities to repress political opponents and suppress threats from
below (Hassan 2017, Wantchekon 2002). However, we expect support for the ruling party
to act as a potential moderator to the backlash effects. We subset the sample to consider
variation between those who identified as supporting the NRM party compared to those who
do not. Figure 4 examines whether supporters of the ruling party exhibit different responses
22
to the treatment conditions.23 As expected, the relationship between repressive action by
the police and dissent seem attenuated by support for the ruling party. Interestingly, the
backlash effect broadly holds for those who identify as NRM supporters. NRM supporters
assigned to the repression treatment were less likely to support the police and more likely
to publicly criticize them. In addition to expressing lower levels of support for the police,
NRM supporters assigned to the participation and repression treatment were more likely to
publicly criticize and protest police actions.
Additional Analyses
Existing work suggests that several demographic factors matter for patterns of repression
and collective action. Nordas and Davenport (2013), for example, hypothesize that political
authorities faced with a youth bulge are more likely to apply repressive measures against their
populations than states with a less threatening population-age structure. Additionally, they
argue governments will focus their attention on “youth bulges because youth are more likely
than other age groups to rebel” (Nordas and Davenport 2013, 937). Similarly, Christensen
(2018) argues the geography of repression matters in Sub Saharan Africa, finding state
repression is more frequent in urban areas, but states are more likely to kill dissidents in
rural areas. Finally, a robust literature suggests that gender matters for patterns of collective
action and violence (Agarwal 2000, Ness 2004).
We explore the role of additional potential pre-treatment moderators, including: respon-
dent’s age, gender, whether they live in an urban or rural setting, and attitudes and percep-
tions toward the police. Considering these demographic factors, we examine the moderating
effects of age, geographic setting, and gender. Although demographics are important, we
might expect heterogeneous effects within these groups to be conditioned by pre-treatment
support for the ruling party. In the online appendix, we report heterogeneous effects on
support for police action (Table 9), willingness to publicly criticize police action (Table 10),
23Tabular results and ordered logistic regressions provided in the Appendix on page 5.
23
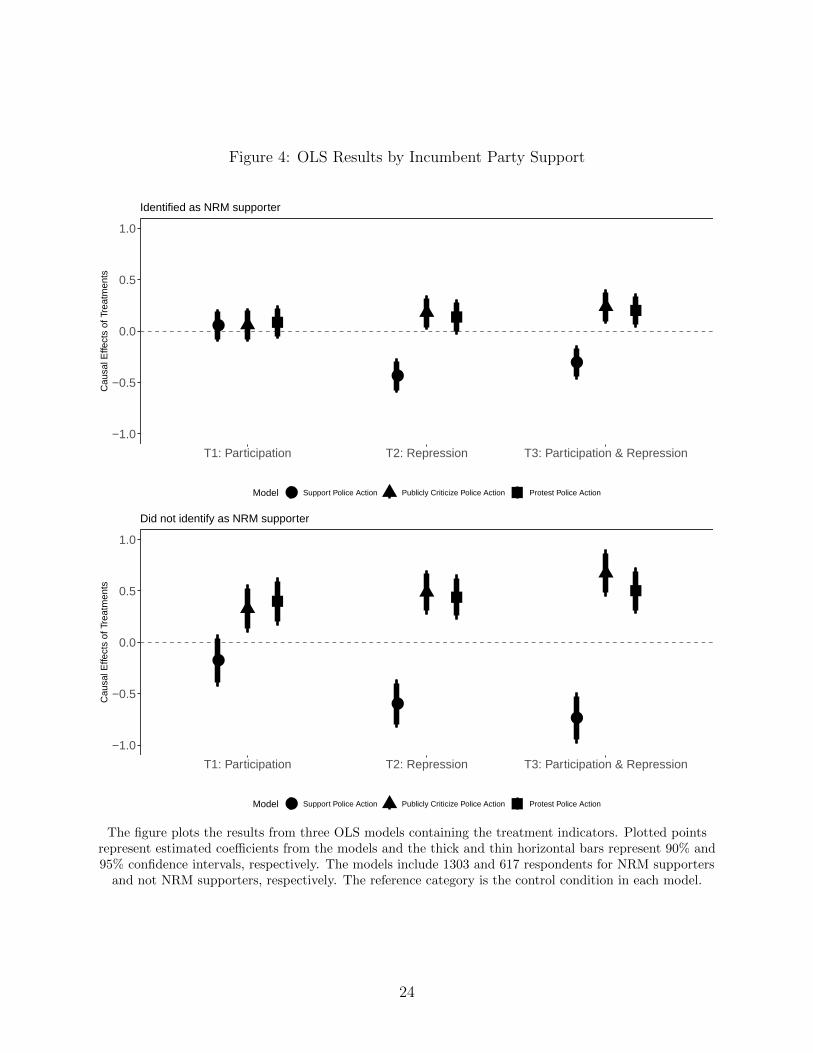
Figure 4: OLS Results by Incumbent Party Support
●
●●
−1.0
−0.5
0.0
0.5
1.0
T1: Participation T2: Repression T3: Participation & Repression
Cau
sal E
ffect
s of
Tre
atm
ents
Model ● Support Police Action Publicly Criticize Police Action Protest Police Action
Identified as NRM supporter
●
●●
−1.0
−0.5
0.0
0.5
1.0
T1: Participation T2: Repression T3: Participation & Repression
Cau
sal E
ffect
s of
Tre
atm
ents
Model ● Support Police Action Publicly Criticize Police Action Protest Police Action
Did not identify as NRM supporter
The figure plots the results from three OLS models containing the treatment indicators. Plotted pointsrepresent estimated coefficients from the models and the thick and thin horizontal bars represent 90% and95% confidence intervals, respectively. The models include 1303 and 617 respondents for NRM supporters
and not NRM supporters, respectively. The reference category is the control condition in each model.
24
or willingness to protest police action (Table 11).24
In general, assignment to the participation treatment has no discernible effect on support
for police action. However, it increases public criticism from female respondents and those
older than 35. Additionally, it increases the probability of future protests against police
actions among female, rural, and older respondents, especially for respondents who do not
support the NRM.
Notably, the repression treatment has a consistent backlash effect on respondents, nega-
tively impacting support for police actions and increasing public criticism and future protests,
except for NRM supporters. Interestingly, relative to those assigned to the control group,
female NRM supporters were more likely to publicly criticize and protest police action after
receiving the repression treatment. Across the various demographic factors, respondents as-
signed to the participation and repression treatment were less likely to support police action
and more likely to publicly criticize and/or protest police action. These results hold even
for NRM supporters, except for male respondents and those under 35. Unsurprisingly, ex-
cessive force by police at a rally strongly influences how members of the opposition respond,
triggering backlash effects. These findings suggest police repression also increases dissent
among women and older respondents – even for those who identify as supporting the ruling
party. 25 Throughout our analyses, there is no evidence that excessive police violence de-
ters respondents’ willingness to publicly criticize or protest police’s actions. However, these
exploratory analyses highlight the need to examine the individual-level characteristics that
shape how people view and respond to repression.
24One limitation of these exploratory analyses is that some of the subgroup differences might be capturingsome other latent subgroup difference. Although outside the scope of this paper, future work could useBayesian additive regression trees (BARTs) to model non-linear relationships and interactions between thesesubgroups and participants’ responses (Green and Kern 2012).
25We also consider whether respondents’ pre-treatment attitudes toward the police affect their responses.Considering the moderating effects of attitudes and beliefs about the role of police as legitimate authoritiesand individuals’ obligation to obey police, willingness to report crimes, and normative alignment conditionstheir level of support and likelihood to publicly criticize and protest police actions. Results are consistent withthe findings discussed here. Treatments 2 and 3 decreased support for police action among all respondentsand increased public criticism and protest among most groups. The only group without a discernible effecton public criticism and protest were those who said they were obligated to obey police. We report theseresults in Table 15, Table 16, and Table 17 on pages 7 and 8 of the online appendix.
25
Discussion and Conclusion
We test the classic assumption that repression deters political dissent. Rather than focusing
on the politics of repression, we argue that we need to compare provisions of security by
police compared to excessive force. Previous studies overlook that police are tasked with
providing law and order in addition to repressing political dissent. For civilians, whether
they believe the police are providing law and order as a public good or repressing political
dissent conditions how they respond to actions taken by the police. Our results question
whether governments should use repression to deter future dissent. We argue repressive
actions taken by the police, and not appropriate police force, should result in powerful
backlash effects decreasing support for police and triggering political dissent. Recognizing
the costs for individuals to engage in political dissent, we also consider the conditioning
relationship of bystanding compared to participating in a rally. Civilians who identify as
participating in a rally might be more likely to express their “true preferences” about future
political engagement or dissent.
Our survey experiment was conducted in the weeks before the arrests, torture, and trial
of several opposition leaders, including Robert Kyangulany Ssentamu. The results of our
nationally representative study demonstrate the limits of repression to deter political dissent.
Beyond our experiment, these results were borne out during political events that unfolded
in Uganda in the months following our survey. Similar to our findings, repressive actions by
Uganda’s security forces, including the army and police forces, sparked additional protests
and political dissent throughout Uganda. Our findings and unfolding political events in
Uganda demonstrate the costs of repression to political authorities. Excessive police violence
decreases support for police, increases public criticism of the police, and lays the foundation
for future political dissent.
We contribute to the existing literature in three ways. First, by employing experimental
evidence from an authoritarian context, we demonstrate the limits of repression in deterring
political dissent. Specifically, we show that repression results in “backlash” effects decreasing
26
support for police and increasing public criticism and willingness to protest. By examining
the politics of policing and repression, we show excessive state-violence triggers political
backlash, increasing expressions of political dissent and decreasing support for the security
apparatus. This is the first study – that we know – that provides nationally representative
micro-level experimental evidence on the protest-repression nexus debate from within an
autocracy. Political authorities, especially within autocracies, are likely to use repression to
deter political opposition. However, our study demonstrates the futility of that action.
Second, we address the endogeneity problem and selection bias by examining whether
“bystander” or “participation” effects condition on civilians’ responses to police action. This
provides the first experimental design meant to address the protest-repression nexus debate.
Our results suggest that previous work that focuses on those already dissenting might under-
estimate the effects of repression on dissent. Excessive police force, at least in this context,
increases political opposition.
Third, we expand the research on the politics of policing arguing that even in authoritar-
ian contexts, we need to focus on the multiple dimensions of policing. Crucially, police are
the actors responsible for implementing repression but they are also the agents responsible
for providing law and order. The existing literature on human rights and state repression has
not addressed that even autocracies must provide law and order and security for civilians,
as a basic expression of governance. Recent work has highlighted the difficulty of restoring
trust in police as an institution in post-conflict and weak states (Blair, Karim and Morse
2019). Others show how militarizing law enforcement, blurring the lines between security
forces and police, undermines citizen security, human rights, police reform, and the legal
order (Flores-Macıas and Zarkin 2019), even though it does not enhance police safety or
reduce crime (Mummolo 2018).
Our findings demonstrate that repression by the police negatively affects public percep-
tions of the police, decreasing civilian support and increasing public dissent. Future work is
needed to understand why, given these negative impacts, some states rely on the military,
27
police, or other security institutions to repress dissent, and what that practice means for
state and political development.
References
Abrahamsen, Rita and Gerald Bareebe. 2016. “Uganda’s 2016 Elections: Not even FakingIt Anymore.” African Affairs 115(461):751–765.
Acemoglu, Daron and James A Robinson. 2006. “Economic Backwardness in Political Per-spective.” American Political Science Review 100(1):115–131.
Agarwal, Bina. 2000. “Conceptualising Environmental Collective Action: Why Gender Mat-ters.” Cambridge Journal of Economics 24(3):283–310.
Anderson, Christopher J, Patrick M Regan and Robert L Ostergard. 2002. “Political Repres-sion and Public Perceptions of Human Rights.” Political Research Quarterly 55(2):439–456.
Annan, Jeannie, Christopher Blattman, Dyan Mazurana and Khristopher Carlson. 2011.“Civil war, Reintegration, and Gender in Northern Uganda.” Journal of Conflict Resolu-tion 55(6):877–908.
Arriola, Leonardo R. 2013. “Protesting and Policing in a Multiethnic Authoritarian State:Evidence from Ethiopia.” Comparative Politics 45(2):147–168.
Arriola, Leonardo R. 2014. “Suppressing Protests During Electoral Crises: The GeographicLogic of Mass Arrests in Ethiopia.”.
Barnett, Maria. 2018. “History of Violence on Repeat in Uganda.”.URL: https://www.hrw.org/news/2018/09/11/history-violence-repeat-uganda
Beetham, David. 1991. The Legitimation of Power. New York, NY: Palgrave Macmillan.
Blair, Robert A., Sabrina M. Karim and Benjamin S. Morse. 2019. “Establishing the Rule ofLaw in Weak and War-torn States: Evidence from a Field Experiment with the LiberianNational Police.” American Political Science Review p. 1–17.
Blumenstock, Joshua, Gabriel Cadamuro and Robert On. 2015. “Predicting Poverty andWealth from Mobile Phone Metadata.” Science 350(6264):1073–1076.
Bratton, Michael and Eldred Masunungure. 2006. “Popular Reactions to State Repression:Operation Murambatsvina in Zimbabwe.” African Affairs 106(422):21–45.
Braun, Robert and Ruud Koopmans. 2014. “Watch the crowd: Bystander responses, trickle-down politics, and xenophobic mobilization.” Comparative Political Studies 47(4):631–658.
28
Carey, Sabine C. 2006. “The Dynamic Relationship between Protest and Repression.” Po-litical Research Quarterly 59(1):1–11.
Christensen, Darin. 2018. “The Geography of Repression in Africa.” Journal of ConflictResolution 62(7):1517–1543.
Cohen, Dara Kay and Ragnhild Nordas. 2015. “Do States Delegate Shameful Violence toMilitias? Patterns of Sexual Violence in Recent Armed Conflicts.” Journal of ConflictResolution 59(5):877–898.
Conrad, Courtenay R and Will H Moore. 2010. “What Stops the Torture?” AmericanJournal of Political Science 54(2):459–476.
Curtice, Travis. 2019. “Police and Co-ethnic Bias in Autocracies: Evidence from a ConjointExperiment in Uganda.”.
Dabalen, Andrew, Alvin Etang, Johannes Hoogeveen, Elvis Mushi, Youdi Schipper andJohannes von Engelhardt. 2016. Mobile Phone Panel Surveys in Developing Countries: APractical Guide for Microdata Collection. The World Bank.
Davenport, Christian. 1995. “Multi-dimensional Threat Perception and State Repression:An Inquiry into Why States Apply Negative Sanctions.” American Journal of PoliticalScience pp. 683–713.
Davenport, Christian. 2007. State Repression and the Domestic Democratic Peace. Cam-bridge University Press.
Davenport, Christian, Havard Mokleiv Nygard, Hanne Fjelde and David Armstrong. 2019.“The Consequences of Contention: Understanding the Aftereffects of Political Conflictand Violence.” Annual Review of Political Science 22(1):361–377.
Day, Christopher R. 2011. “The Fates of Rebels: Insurgencies in Uganda.” ComparativePolitics 43(4):439–458.
De Mesquita, Ethan Bueno. 2010. “Regime Change and Revolutionary Entrepreneurs.”American Political Science Review 104(3):446–466.
DeMeritt, Jacqueline HR. 2012. “International Organizations and Government Killing: DoesNaming and Shaming Save Lives?” International Interactions 38(5):597–621.
Earl, Jennifer, Sarah A Soule and John D McCarthy. 2003. “Protest under Fire? Explainingthe Policing of Protest.” American Sociological Review pp. 581–606.
Fariss, Christopher J. 2014. “Respect for Human Rights has Improved Over Time: Mod-eling the Changing Standard of Accountability.” American Political Science Review108(02):297–318.
Flores-Macıas, Gustavo A and Jessica Zarkin. 2019. “The Militarization of Law Enforcement:Evidence from Latin America.” Perspectives on Politics pp. 1–20.
29
French, J., Jr. and Bertram Raven. 1959. The Bases of Social Power. In Studies in SocialPower, ed. David Cartwright. Oxford, England: University of Michigan pp. 150–167.
Galtung, Johan. 1969. “Violence, Peace, and Peace Research.” Journal of Peace Research6(3):167–191.
Gandhi, Jennifer. 2008. Political Institutions under Dictatorship. Cambridge UniversityPress Cambridge.
Goldstein, Joseph. 1960. “Police Discretion not to Invoke the Criminal Process: Low-visibility Decisions in the Administration of Justice.” The Yale Law Journal 69(4):543–594.
Green, Donald P and Holger L Kern. 2012. “Modeling Heterogeneous Treatment Effects inSurvey Experiments with Bayesian Additive Regression Trees.” Public Opinion Quarterly76(3):491–511.
Greitens, Sheena Chestnut. 2016. Dictators and their Secret Police: Coercive Institutionsand State Violence. Cambridge University Press.
Gurr, Ted Robert. 1970. Why Men Rebel. Princeton, NJ: Princeton University Press.
Gurr, Ted Robert. 1986. “Persisting Patterns of Repression and Rebellion: Foundations fora General Theory of Political Coercion.” Persistent patterns and emergent structures in awaning century pp. 149–68.
Hassan, Mai. 2017. “The Strategic Shuffle: Ethnic Geography, the Internal Security Appa-ratus, and Elections in Kenya.” American Journal of Political Science 61(2):382–395.
Henderson, Conway W. 1991. “Conditions Affecting the Use of Political Repression.” Journalof Conflict Resolution 35(1):120–142.
Hinsch, Wilfried. 2008. Legitimacy and Justice. In Political Legitimization without Morality?Springer pp. 39–52.
Hobbes, Thomas. 1651. Leviathan. Cambridge: Cambridge University Press.
Hollyer, James R, B Peter Rosendorff and James Raymond Vreeland. 2015. “Transparency,Protest, and Autocratic Instability.” American Political Science Review 109(4):764–784.
Jackson, Jonathan, Aziz Z Huq, Ben Bradford and Tom R Tyler. 2013. “MonopolizingForce? Police Legitimacy and Public Attitudes toward the Acceptability of Violence.”Psychology, Public Policy, and Law 19(4):479.
Jackson, Jonathan and Ben Bradford. 2009. “Crime, Policing and Social Order: On theExpressive Nature of Public Confidence in Policing.” The British Journal of Sociology60(3):493–521.
Kuran, Timur. 1991. “Now out of Never: The Element of Surprise in the East EuropeanRevolution of 1989.” World Politics 44(01):7–48.
30
Larson, Jennifer M and Janet I Lewis. 2018. “Rumors, Kinship Networks, and Rebel GroupFormation.” International Organization 72(4):871–903.
Lawrence, Adria K. 2017. “Repression and Activism among the Arab Spring’s First Movers:Evidence from Morocco’s February 20th Movement.” British Journal of Political Science47(3):699–718.
Lichbach, Mark I. 1995. The Rebel’s Dilemma. Ann Arbor: University of Michigan Press.
Lichbach, Mark Irving. 1987. “Deterrence or Escalation? The Puzzle of Aggregate Studiesof Repression and Dissent.” Journal of Conflict Resolution 31(2):266–297.
Lipsky, Michael. 1971. “Street-level Bureaucracy and the Analysis of Urban Reform.” UrbanAffairs Quarterly 6(4):391–409.
Lohmann, Susanne. 1993. “A Signaling Model of Informative and Manipulative PoliticalAction.” American Political Science Review 87(02):319–333.
Lohmann, Susanne. 1994. “The Dynamics of Informational Cascades: The Monday Demon-strations in Leipzig, East Germany, 1989–91.” World Politics 47(01):42–101.
Lupu, Yonatan and Geoffrey PR Wallace. 2018. “Violence, Nonviolence, and the Effects ofInternational Human Rights Law.” American Journal of Political Science .
McCarthy, John D and Clark McPhail. 1998. “The Institutionalization of Protest in theUnited States.” The social movement society: Contentious politics for a new century 1:83–110.
McPhail, Clark, David Schweingruber and John McCarthy. 1998. “Policing Protest in theUnited States: 1960-1995.” Policing protest: The Control of Mass Demonstrations inWestern Democracies 6:49–69.
Mitchell, Neil J, Sabine C Carey and Christopher K Butler. 2014. “The Impact of Pro-government Militias on Human Rights Violations.” International Interactions 40(5):812–836.
Monitor. 2018. “Arua Violence: Counting the Human Cost.”.URL: http://www.monitor.co.ug/SpecialReports/Arua-violence-human-cost-Kassiano-Wadri-NRM-Bobi-Wine/688342-4749276-n82ghf/index.html
Moore, Will H. 1998. “Repression and Dissent: Substitution, Context, and Timing.” Amer-ican Journal of Political Science pp. 851–873.
Moore, Will H. 2000. “The Repression of Dissent a Substitution Model of GovernmentCoercion.” Journal of Conflict Resolution 44(1):107–127.
Muller, Edward N. 1985. “Income Inequality, Regime Repressiveness, and Political Violence.”American Sociological Review 50(1):47–61.
31
Mummolo, Jonathan. 2018. “Militarization Fails to Enhance Police Safety or Reduce Crimebut may Harm Police Reputation.” Proceedings of the National Academy of Sciences115(37):9181–9186.
Murdie, Amanda M and David R Davis. 2012. “Shaming and Blaming: Using Events Data toAssess the Impact of Human Rights INGOs.” International Studies Quarterly 56(1):1–16.
Ness, Cindy D. 2004. “Why Girls Fight: Female Youth Violence in the Inner City.” TheAnnals of the American Academy of Political and Social Science 595(1):32–48.
Nordas, Ragnhild and Christian Davenport. 2013. “Fight the Youth: Youth Bulges andState Repression.” American Journal of Political Science 57(4):926–940.
Olson, Mancur. 1965. The Logic of Collective Action Cambridge. Cambridge UniversityPress.
Opp, Karl-Dieter. 1994. “Repression and Revolutionary Action: East Germany in 1989.”Rationality and Society 6(1):101–138.
Opp, Karl-Dieter and Wolfgang Roehl. 1990. “Repression, Micromobilization, and PoliticalProtest.” Social Forces 69(2):521–547.
Pierskalla, Jan Henryk. 2010. “Protest, Deterrence, and Escalation: The Strategic Calculusof Government Repression.” Journal of Conflict Resolution 54(1):117–145.
Poe, Steven C and C Neal Tate. 1994. “Repression of Human Rights to Personal Integrityin the 1980s: A Global Analysis.” American Political Science Review 88(04):853–872.
Raleigh, Clionadh, Andrew Linke, Havard Hegre and Joakim Karlsen. 2010. “Introduc-ing Acled: An Armed Conflict Location and Event Dataset.” Journal of Peace Research47(5):651–660.
Rasler, Karen. 1996. “Concessions, Repression, and Political Protest in the Iranian revolu-tion.” American Sociological Review pp. 132–152.
Ritter, Emily Hencken and Courtenay R Conrad. 2016. “Preventing and Responding toDissent: The Observational Challenges of Explaining Strategic Repression.” AmericanPolitical Science Review 110(1):85–99.
Rozenas, Arturas and Yuri M Zhukov. 2019. “Mass Repression and Political Loyalty: Evi-dence from Stalin’s ‘Terror by Hunger’.” American Political Science Review pp. 1–15.
Saab, Rim, Nicole Tausch, Russell Spears and Wing-Yee Cheung. 2015. “Acting in solidar-ity: Testing an Extended Dual Pathway Model of Collective Action by Bystander GroupMembers.” British Journal of Social Psychology 54(3):539–560.
Shadmehr, Mehdi and Dan Bernhardt. 2011. “Collective Action with Uncertain Payoffs:Coordination, Public Signals, and Punishment Dilemmas.” American Political ScienceReview 105(4):829–851.
32
Sullivan, Christopher M. 2016. “Political Repression and the Destruction of Dissident Orga-nizations: Evidence from the Archives of the Guatemalan National Police.” World Politics68(4):645–676.
Sullivan, Christopher M, Cyanne E Loyle and Christian Davenport. 2012. “The CoerciveWeight of the Past: Temporal Dependence and the Conflict-Repression Nexus in theNorthern Ireland “Troubles”.” International Interactions 38(4):426–442.
Svolik, Milan W. 2012. The Politics of Authoritarian Rule. Cambridge University Press.
Svolik, Milan W. 2013. “Contracting on Violence The Moral Hazard in Authoritarian Repres-sion and Military Intervention in Politics.” Journal of Conflict Resolution 57(5):765–794.
Tankebe, Justice. 2009. “Public Cooperation with the Police in Ghana: Does ProceduralFairness Matter?” Criminology 47(4):1265–1293.
Tankebe, Justice. 2013. “Viewing Things Differently: The Dimensions of Public Perceptionsof Police Legitimacy.” Criminology 51(1):103–135.
Tilly, Charles. 1978. From Mobilization to Revolution. McGraw-Hill New York.
Truex, Rory. 2019. “Focal Points, Dissident Calendars, and Preemptive Repression.” Journalof Conflict Resolution 63(4):1032–1052.
Tyler, David H, Maya Barak, Edward R Maguire and William Wells. 2018. “The Effectsof Procedural Injustice on the Use of Violence against Police by Occupy Wall StreetProtesters.” Police Practice and Research 19(2):138–152.
Tyler, Tom R. 1990. “Why People Obey the Law.” Princeton, NJ: Princeton UniversityPress .
Tyler, Tom R and Jeffrey Fagan. 2008. “Legitimacy and Cooperation: Why Do People Helpthe Police Fight Crime in their Communities.” Ohio St. J. Crim. L. 6:231.
Wantchekon, Leonard. 2002. “Why Do Resource Dependent Countries Have AuthoritarianGovernments?” Journal of African Finance and Economic Development 2:57–77.
Weber, Max. 1946. Politics as a Vocation. In From Max Weber: Essays in Sociology. Oxford:Oxford University Press.
Wilson, James Q. 1968. “Dilemmas of Police Administration.” Public Administration Review28(5):407–417.
Wooldridge, Jeffrey M. 2010. Econometric Analysis of Cross Section and Panel Data. Mas-sachusetts Institute of Technology Press.
Young, Lauren E. 2019. “The Psychology of State Repression: Fear and Dissent Decisionsin Zimbabwe.” American Political Science Review 113(1):140–155.
Zimmerman, Ekkart. 1980. “Macro-Comparative Research on Political Protest.” Handbookof Political Conflict: Theory and Research pp. 167–237.
33
Online Appendix for Street-Level Repression:Protest, Policing and Dissent in Uganda
Supporting Information not meant for print publication. Online version of appendixavailable at the publisher’s website:
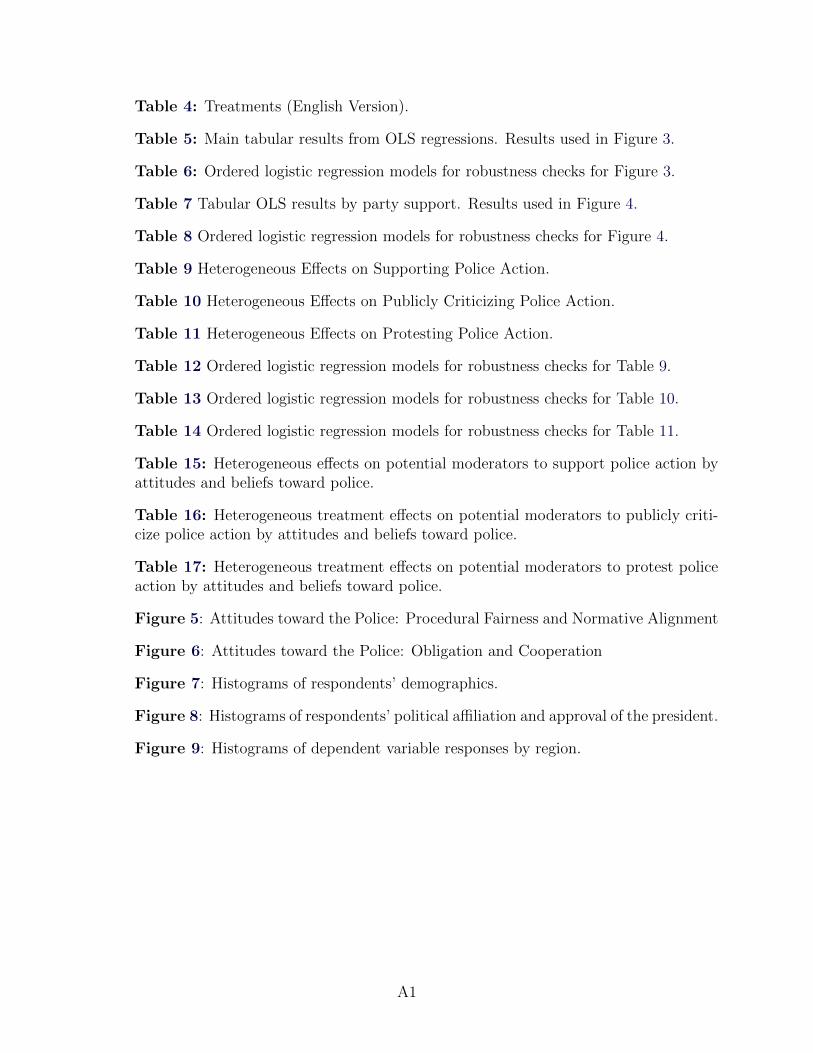
Table 4: Treatments (English Version).
Table 5: Main tabular results from OLS regressions. Results used in Figure 3.
Table 6: Ordered logistic regression models for robustness checks for Figure 3.
Table 7 Tabular OLS results by party support. Results used in Figure 4.
Table 8 Ordered logistic regression models for robustness checks for Figure 4.
Table 9 Heterogeneous Effects on Supporting Police Action.
Table 10 Heterogeneous Effects on Publicly Criticizing Police Action.
Table 11 Heterogeneous Effects on Protesting Police Action.
Table 12 Ordered logistic regression models for robustness checks for Table 9.
Table 13 Ordered logistic regression models for robustness checks for Table 10.
Table 14 Ordered logistic regression models for robustness checks for Table 11.
Table 15: Heterogeneous effects on potential moderators to support police action byattitudes and beliefs toward police.
Table 16: Heterogeneous treatment effects on potential moderators to publicly criti-cize police action by attitudes and beliefs toward police.
Table 17: Heterogeneous treatment effects on potential moderators to protest policeaction by attitudes and beliefs toward police.
Figure 5: Attitudes toward the Police: Procedural Fairness and Normative Alignment
Figure 6: Attitudes toward the Police: Obligation and Cooperation
Figure 7: Histograms of respondents’ demographics.
Figure 8: Histograms of respondents’ political affiliation and approval of the president.
Figure 9: Histograms of dependent variable responses by region.
A1
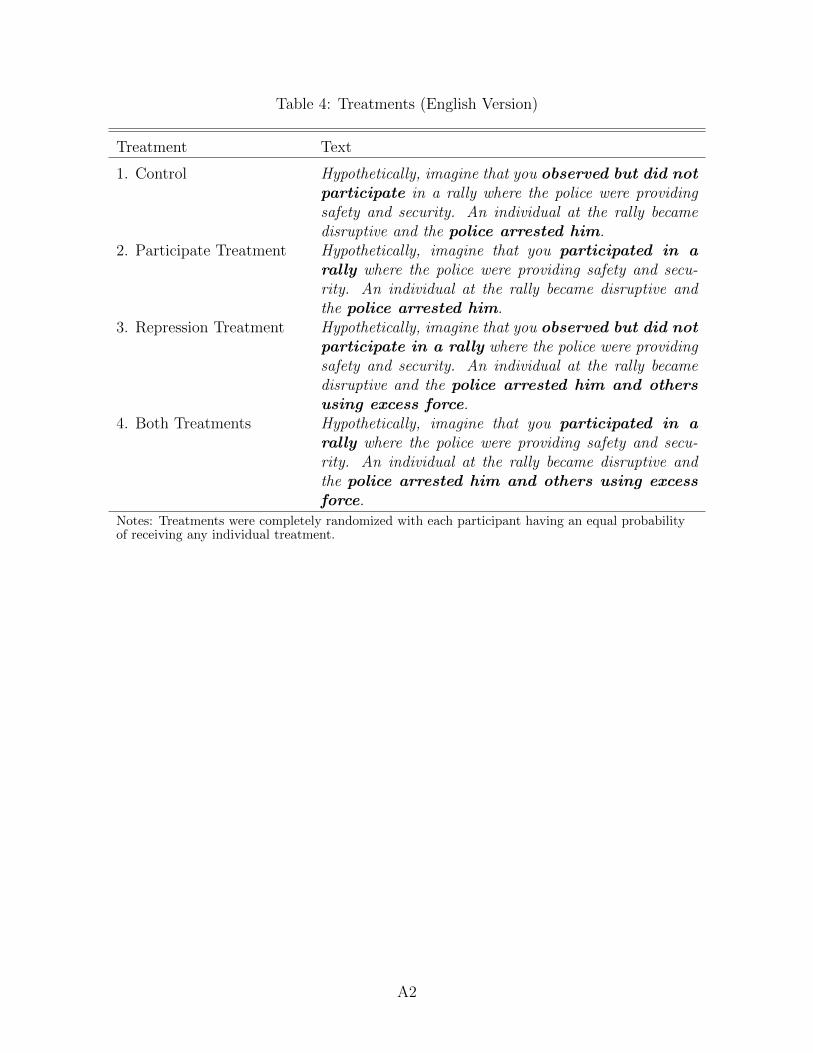
Table 4: Treatments (English Version)
Treatment Text
1. Control Hypothetically, imagine that you observed but did notparticipate in a rally where the police were providingsafety and security. An individual at the rally becamedisruptive and the police arrested him.
2. Participate Treatment Hypothetically, imagine that you participated in arally where the police were providing safety and secu-rity. An individual at the rally became disruptive andthe police arrested him.
3. Repression Treatment Hypothetically, imagine that you observed but did notparticipate in a rally where the police were providingsafety and security. An individual at the rally becamedisruptive and the police arrested him and othersusing excess force.
4. Both Treatments Hypothetically, imagine that you participated in arally where the police were providing safety and secu-rity. An individual at the rally became disruptive andthe police arrested him and others using excessforce.
Notes: Treatments were completely randomized with each participant having an equal probabilityof receiving any individual treatment.
A2
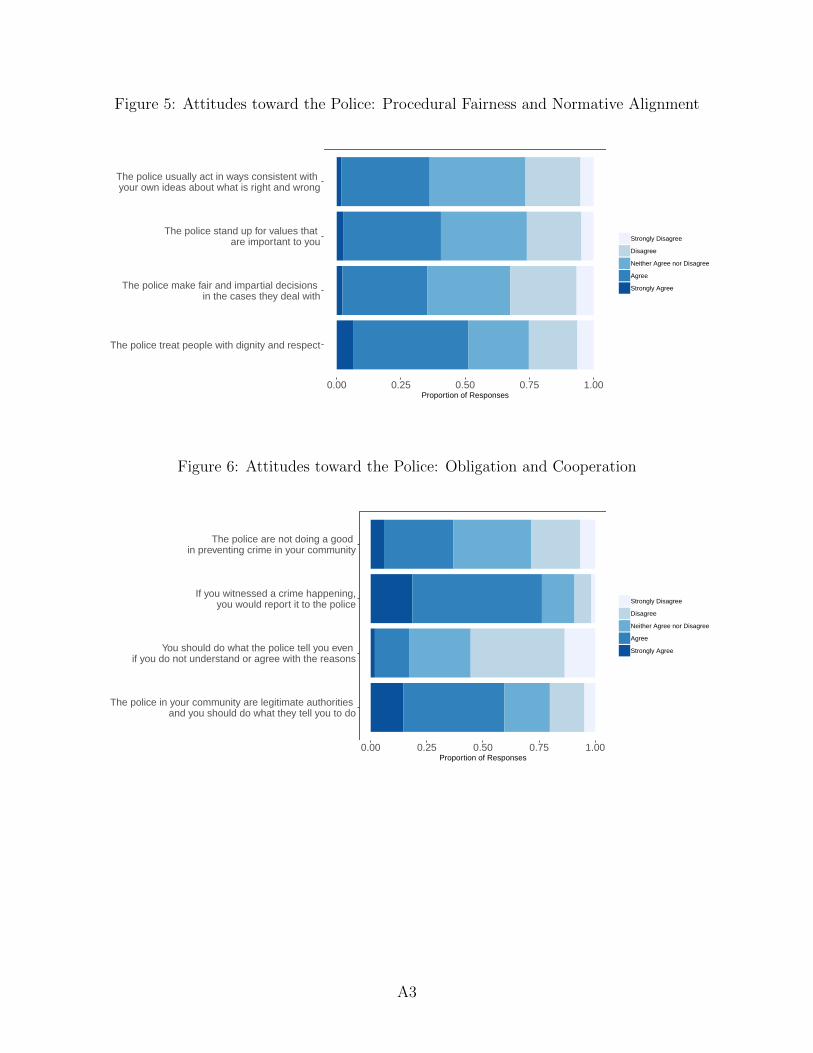
Figure 5: Attitudes toward the Police: Procedural Fairness and Normative Alignment
The police treat people with dignity and respect
The police make fair and impartial decisions in the cases they deal with
The police stand up for values that are important to you
The police usually act in ways consistent with your own ideas about what is right and wrong
0.00 0.25 0.50 0.75 1.00Proportion of Responses
Strongly Disagree
Disagree
Neither Agree nor Disagree
Agree
Strongly Agree
Figure 6: Attitudes toward the Police: Obligation and Cooperation
The police in your community are legitimate authorities and you should do what they tell you to do
You should do what the police tell you even if you do not understand or agree with the reasons
If you witnessed a crime happening, you would report it to the police
The police are not doing a good in preventing crime in your community
0.00 0.25 0.50 0.75 1.00Proportion of Responses
Strongly Disagree
Disagree
Neither Agree nor Disagree
Agree
Strongly Agree
A3
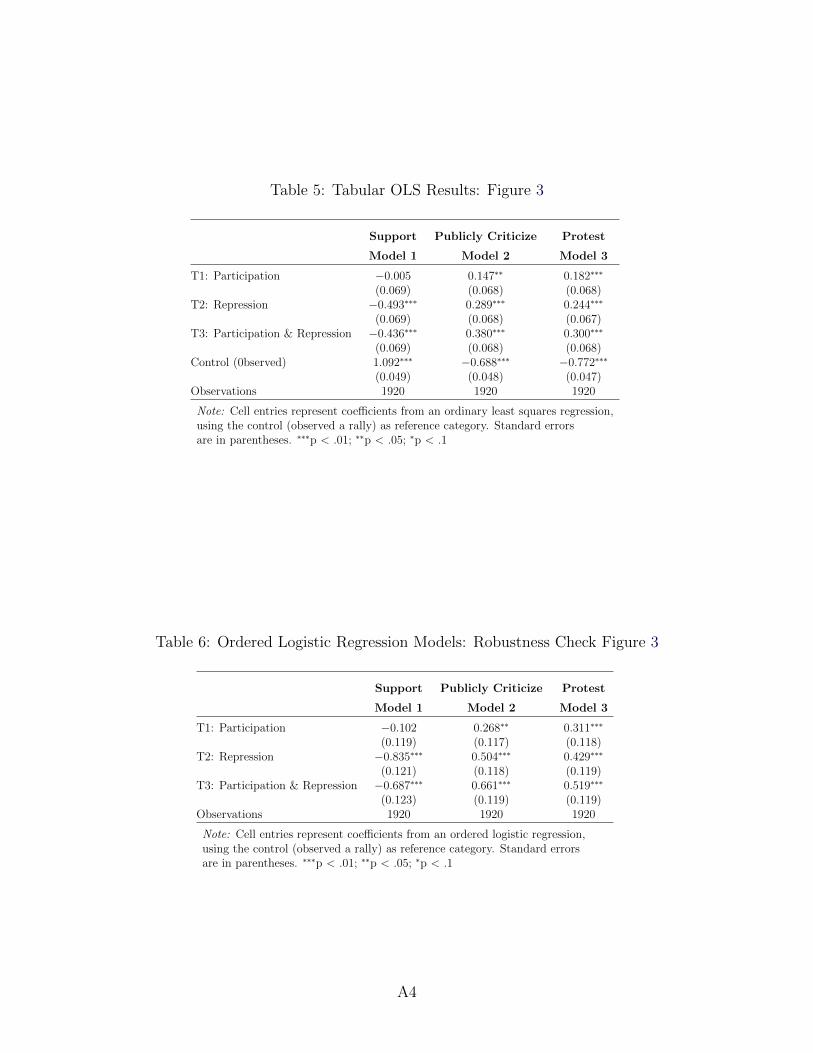
Table 5: Tabular OLS Results: Figure 3
Support Publicly Criticize Protest
Model 1 Model 2 Model 3
T1: Participation −0.005 0.147∗∗ 0.182∗∗∗
(0.069) (0.068) (0.068)T2: Repression −0.493∗∗∗ 0.289∗∗∗ 0.244∗∗∗
(0.069) (0.068) (0.067)T3: Participation & Repression −0.436∗∗∗ 0.380∗∗∗ 0.300∗∗∗
(0.069) (0.068) (0.068)Control (0bserved) 1.092∗∗∗ −0.688∗∗∗ −0.772∗∗∗
(0.049) (0.048) (0.047)Observations 1920 1920 1920
Note: Cell entries represent coefficients from an ordinary least squares regression,using the control (observed a rally) as reference category. Standard errorsare in parentheses. ∗∗∗p < .01; ∗∗p < .05; ∗p < .1
Table 6: Ordered Logistic Regression Models: Robustness Check Figure 3
Support Publicly Criticize Protest
Model 1 Model 2 Model 3
T1: Participation −0.102 0.268∗∗ 0.311∗∗∗
(0.119) (0.117) (0.118)T2: Repression −0.835∗∗∗ 0.504∗∗∗ 0.429∗∗∗
(0.121) (0.118) (0.119)T3: Participation & Repression −0.687∗∗∗ 0.661∗∗∗ 0.519∗∗∗
(0.123) (0.119) (0.119)Observations 1920 1920 1920
Note: Cell entries represent coefficients from an ordered logistic regression,using the control (observed a rally) as reference category. Standard errorsare in parentheses. ∗∗∗p < .01; ∗∗p < .05; ∗p < .1
A4
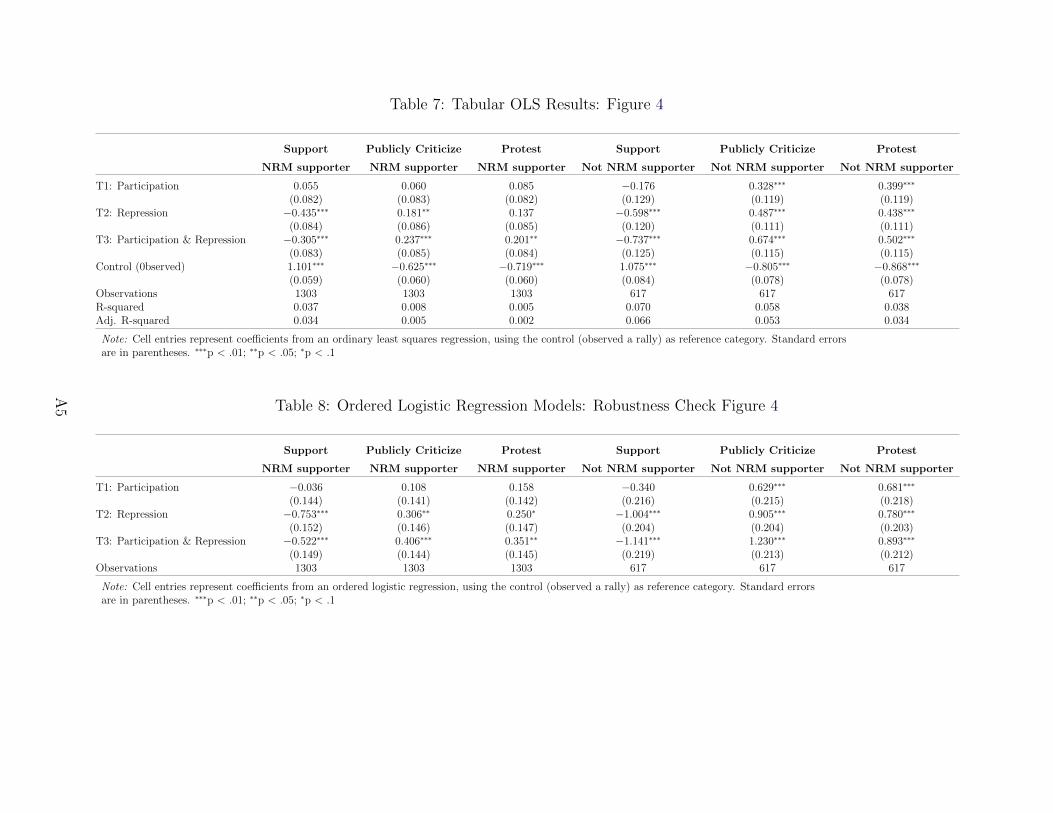
Table 7: Tabular OLS Results: Figure 4
Support Publicly Criticize Protest Support Publicly Criticize Protest
NRM supporter NRM supporter NRM supporter Not NRM supporter Not NRM supporter Not NRM supporter
T1: Participation 0.055 0.060 0.085 −0.176 0.328∗∗∗ 0.399∗∗∗
(0.082) (0.083) (0.082) (0.129) (0.119) (0.119)T2: Repression −0.435∗∗∗ 0.181∗∗ 0.137 −0.598∗∗∗ 0.487∗∗∗ 0.438∗∗∗
(0.084) (0.086) (0.085) (0.120) (0.111) (0.111)T3: Participation & Repression −0.305∗∗∗ 0.237∗∗∗ 0.201∗∗ −0.737∗∗∗ 0.674∗∗∗ 0.502∗∗∗
(0.083) (0.085) (0.084) (0.125) (0.115) (0.115)Control (0bserved) 1.101∗∗∗ −0.625∗∗∗ −0.719∗∗∗ 1.075∗∗∗ −0.805∗∗∗ −0.868∗∗∗
(0.059) (0.060) (0.060) (0.084) (0.078) (0.078)Observations 1303 1303 1303 617 617 617R-squared 0.037 0.008 0.005 0.070 0.058 0.038Adj. R-squared 0.034 0.005 0.002 0.066 0.053 0.034
Note: Cell entries represent coefficients from an ordinary least squares regression, using the control (observed a rally) as reference category. Standard errorsare in parentheses. ∗∗∗p < .01; ∗∗p < .05; ∗p < .1
Table 8: Ordered Logistic Regression Models: Robustness Check Figure 4
Support Publicly Criticize Protest Support Publicly Criticize Protest
NRM supporter NRM supporter NRM supporter Not NRM supporter Not NRM supporter Not NRM supporter
T1: Participation −0.036 0.108 0.158 −0.340 0.629∗∗∗ 0.681∗∗∗
(0.144) (0.141) (0.142) (0.216) (0.215) (0.218)T2: Repression −0.753∗∗∗ 0.306∗∗ 0.250∗ −1.004∗∗∗ 0.905∗∗∗ 0.780∗∗∗
(0.152) (0.146) (0.147) (0.204) (0.204) (0.203)T3: Participation & Repression −0.522∗∗∗ 0.406∗∗∗ 0.351∗∗ −1.141∗∗∗ 1.230∗∗∗ 0.893∗∗∗
(0.149) (0.144) (0.145) (0.219) (0.213) (0.212)Observations 1303 1303 1303 617 617 617
Note: Cell entries represent coefficients from an ordered logistic regression, using the control (observed a rally) as reference category. Standard errorsare in parentheses. ∗∗∗p < .01; ∗∗p < .05; ∗p < .1
A5
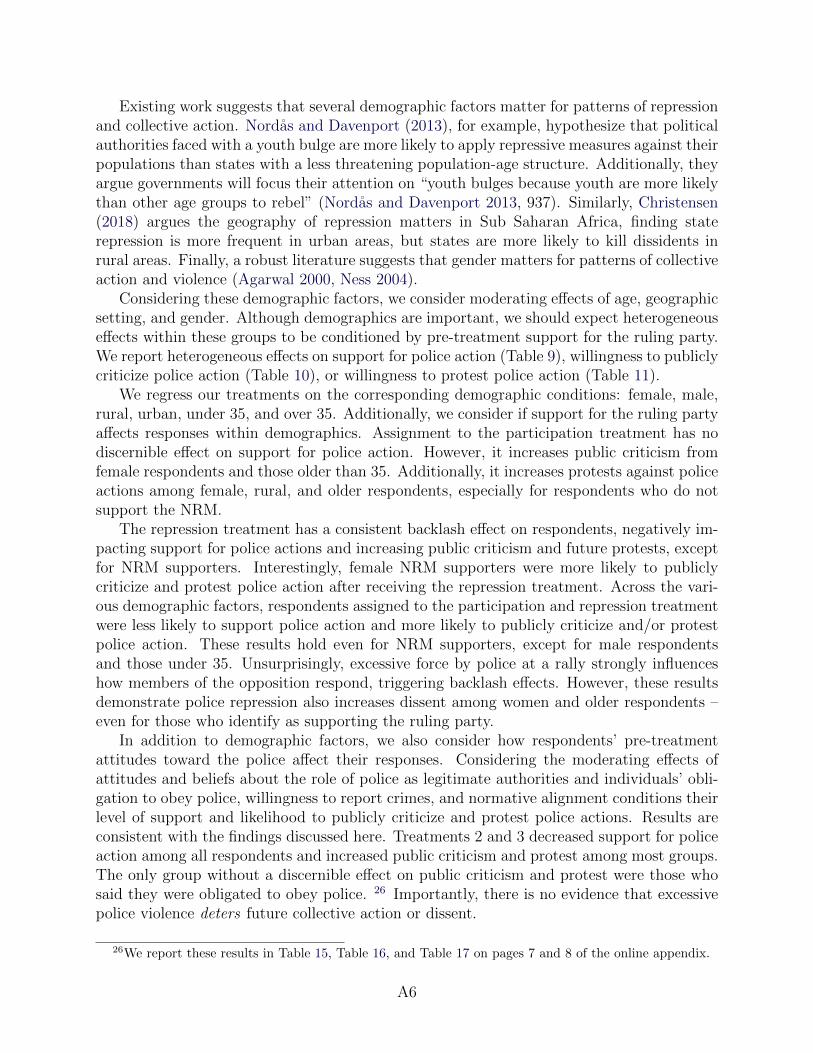
Existing work suggests that several demographic factors matter for patterns of repressionand collective action. Nordas and Davenport (2013), for example, hypothesize that politicalauthorities faced with a youth bulge are more likely to apply repressive measures against theirpopulations than states with a less threatening population-age structure. Additionally, theyargue governments will focus their attention on “youth bulges because youth are more likelythan other age groups to rebel” (Nordas and Davenport 2013, 937). Similarly, Christensen(2018) argues the geography of repression matters in Sub Saharan Africa, finding staterepression is more frequent in urban areas, but states are more likely to kill dissidents inrural areas. Finally, a robust literature suggests that gender matters for patterns of collectiveaction and violence (Agarwal 2000, Ness 2004).
Considering these demographic factors, we consider moderating effects of age, geographicsetting, and gender. Although demographics are important, we should expect heterogeneouseffects within these groups to be conditioned by pre-treatment support for the ruling party.We report heterogeneous effects on support for police action (Table 9), willingness to publiclycriticize police action (Table 10), or willingness to protest police action (Table 11).
We regress our treatments on the corresponding demographic conditions: female, male,rural, urban, under 35, and over 35. Additionally, we consider if support for the ruling partyaffects responses within demographics. Assignment to the participation treatment has nodiscernible effect on support for police action. However, it increases public criticism fromfemale respondents and those older than 35. Additionally, it increases protests against policeactions among female, rural, and older respondents, especially for respondents who do notsupport the NRM.
The repression treatment has a consistent backlash effect on respondents, negatively im-pacting support for police actions and increasing public criticism and future protests, exceptfor NRM supporters. Interestingly, female NRM supporters were more likely to publiclycriticize and protest police action after receiving the repression treatment. Across the vari-ous demographic factors, respondents assigned to the participation and repression treatmentwere less likely to support police action and more likely to publicly criticize and/or protestpolice action. These results hold even for NRM supporters, except for male respondentsand those under 35. Unsurprisingly, excessive force by police at a rally strongly influenceshow members of the opposition respond, triggering backlash effects. However, these resultsdemonstrate police repression also increases dissent among women and older respondents –even for those who identify as supporting the ruling party.
In addition to demographic factors, we also consider how respondents’ pre-treatmentattitudes toward the police affect their responses. Considering the moderating effects ofattitudes and beliefs about the role of police as legitimate authorities and individuals’ obli-gation to obey police, willingness to report crimes, and normative alignment conditions theirlevel of support and likelihood to publicly criticize and protest police actions. Results areconsistent with the findings discussed here. Treatments 2 and 3 decreased support for policeaction among all respondents and increased public criticism and protest among most groups.The only group without a discernible effect on public criticism and protest were those whosaid they were obligated to obey police. 26 Importantly, there is no evidence that excessivepolice violence deters future collective action or dissent.
26We report these results in Table 15, Table 16, and Table 17 on pages 7 and 8 of the online appendix.
A6

Table 9: Heterogeneous Effects on Supporting Police Action
Dependent variable: Support Police Action
Female Male Rural Urban Under 35 35 and older
(1) (2) (3) (4) (5) (6)
All Respondents
T1: Participation −0.093 0.103 0.010 −0.052 −0.012 −0.002(0.090) (0.108) (0.077) (0.153) (0.103) (0.093)
T2: Repression −0.571∗∗∗ −0.399∗∗∗ −0.475∗∗∗ −0.553∗∗∗ −0.579∗∗∗ −0.414∗∗∗
(0.090) (0.106) (0.077) (0.154) (0.102) (0.094)
T3: Participation & Repression −0.460∗∗∗ −0.405∗∗∗ −0.366∗∗∗ −0.755∗∗∗ −0.374∗∗∗ −0.492∗∗∗
(0.092) (0.106) (0.077) (0.159) (0.102) (0.095)
Control (0bserved) 1.145∗∗∗ 1.027∗∗∗ 1.107∗∗∗ 1.022∗∗∗ 1.035∗∗∗ 1.142∗∗∗
(0.064) (0.075) (0.054) (0.111) (0.072) (0.066)
Observations 1,050 870 1,546 374 905 1,015
Self-Identified NRM Supporters
T1: Participation −0.017 0.147 0.058 0.048 0.068 0.041(0.106) (0.127) (0.090) (0.197) (0.122) (0.110)
T2: Repression −0.525∗∗∗ −0.321∗∗ −0.457∗∗∗ −0.318 −0.457∗∗∗ −0.413∗∗∗
(0.109) (0.130) (0.092) (0.200) (0.123) (0.114)
T3: Participation & Repression −0.306∗∗∗ −0.300∗∗ −0.267∗∗∗ −0.555∗∗∗ −0.301∗∗ −0.309∗∗∗
(0.109) (0.127) (0.090) (0.209) (0.122) (0.112)
Control (0bserved) 1.134∗∗∗ 1.058∗∗∗ 1.115∗∗∗ 1.021∗∗∗ 1.047∗∗∗ 1.148∗∗∗
(0.077) (0.092) (0.064) (0.146) (0.087) (0.080)
Observations 724 579 1,099 204 607 696
Did not Self-Identify as NRM Supporter
T1: Participation −0.293∗ −0.046 −0.161 −0.190 −0.225 −0.130(0.168) (0.200) (0.154) (0.238) (0.191) (0.172)
T2: Repression −0.661∗∗∗ −0.532∗∗∗ −0.512∗∗∗ −0.841∗∗∗ −0.810∗∗∗ −0.416∗∗∗
(0.159) (0.182) (0.138) (0.235) (0.178) (0.159)
T3: Participation & Repression −0.811∗∗∗ −0.657∗∗∗ −0.640∗∗∗ −0.974∗∗∗ −0.525∗∗∗ −0.957∗∗∗
(0.165) (0.190) (0.146) (0.239) (0.180) (0.171)
Control (0bserved) 1.167∗∗∗ 0.976∗∗∗ 1.092∗∗∗ 1.023∗∗∗ 1.012∗∗∗ 1.130∗∗∗
(0.112) (0.127) (0.097) (0.167) (0.125) (0.112)
Observations 326 291 447 170 298 319
Note: Cell entries represent coefficients from an ordinary least squares regression of the repressionand participation treatments, using the control (observed a rally) as reference category. Standarderrors are in parentheses. ∗p<0.1; ∗∗p<0.05; ∗∗∗p<0.01.
A7
Table 10: Heterogeneous Effects on Publicly Criticizing Police Action
Dependent variable: Publicly Criticize Police Action
Female Male Rural Urban Under 35 35 and older
(1) (2) (3) (4) (5) (6)
All Respondents
T1: Participation 0.178∗∗ 0.108 0.125 0.222 0.083 0.207∗∗
(0.090) (0.105) (0.077) (0.146) (0.102) (0.091)
T2: Repression 0.292∗∗∗ 0.286∗∗∗ 0.257∗∗∗ 0.408∗∗∗ 0.162 0.401∗∗∗
(0.090) (0.104) (0.076) (0.147) (0.101) (0.092)
T3: Participation & Repression 0.416∗∗∗ 0.338∗∗∗ 0.313∗∗∗ 0.680∗∗∗ 0.291∗∗∗ 0.453∗∗∗
(0.091) (0.103) (0.076) (0.152) (0.101) (0.093)
Control (0bserved) −0.699∗∗∗ −0.676∗∗∗ −0.703∗∗∗ −0.622∗∗∗ −0.535∗∗∗ −0.824∗∗∗
(0.063) (0.073) (0.053) (0.106) (0.071) (0.064)
Observations 1,050 870 1,546 374 905 1,015
Self-Identified as NRM Supporter
T1: Participation 0.129 −0.030 0.076 −0.025 0.011 0.110(0.109) (0.130) (0.092) (0.202) (0.127) (0.110)
T2: Repression 0.257∗∗ 0.083 0.139 0.374∗ 0.043 0.300∗∗∗
(0.112) (0.133) (0.094) (0.206) (0.128) (0.114)
T3: Participation & Repression 0.311∗∗∗ 0.148 0.199∗∗ 0.485∗∗ 0.213∗ 0.258∗∗
(0.112) (0.129) (0.092) (0.215) (0.127) (0.112)
Control (0bserved) −0.659∗∗∗ −0.580∗∗∗ −0.630∗∗∗ −0.596∗∗∗ −0.459∗∗∗ −0.769∗∗∗
(0.079) (0.094) (0.066) (0.150) (0.091) (0.080)
Observations 724 579 1,099 204 607 696
Did not Self-Identify as NRM Supporter
T1: Participation 0.285∗ 0.377∗∗ 0.192 0.556∗∗∗ 0.212 0.431∗∗∗
(0.160) (0.180) (0.143) (0.208) (0.174) (0.164)
T2: Repression 0.362∗∗ 0.623∗∗∗ 0.498∗∗∗ 0.447∗∗ 0.380∗∗ 0.583∗∗∗
(0.150) (0.164) (0.129) (0.205) (0.162) (0.151)
T3: Participation & Repression 0.646∗∗∗ 0.703∗∗∗ 0.576∗∗∗ 0.895∗∗∗ 0.434∗∗∗ 0.909∗∗∗
(0.157) (0.171) (0.136) (0.209) (0.164) (0.163)
Control (0bserved) −0.778∗∗∗ −0.833∗∗∗ −0.855∗∗∗ −0.651∗∗∗ −0.671∗∗∗ −0.924∗∗∗
(0.106) (0.115) (0.090) (0.146) (0.114) (0.106)
Observations 326 291 447 170 298 319
Note: Cell entries represent coefficients from an ordinary least squares regression of the repressionand participation treatments, using the control (observed a rally) as reference category. Standarderrors are in parentheses. ∗p<0.1; ∗∗p<0.05; ∗∗∗p<0.01.
A8
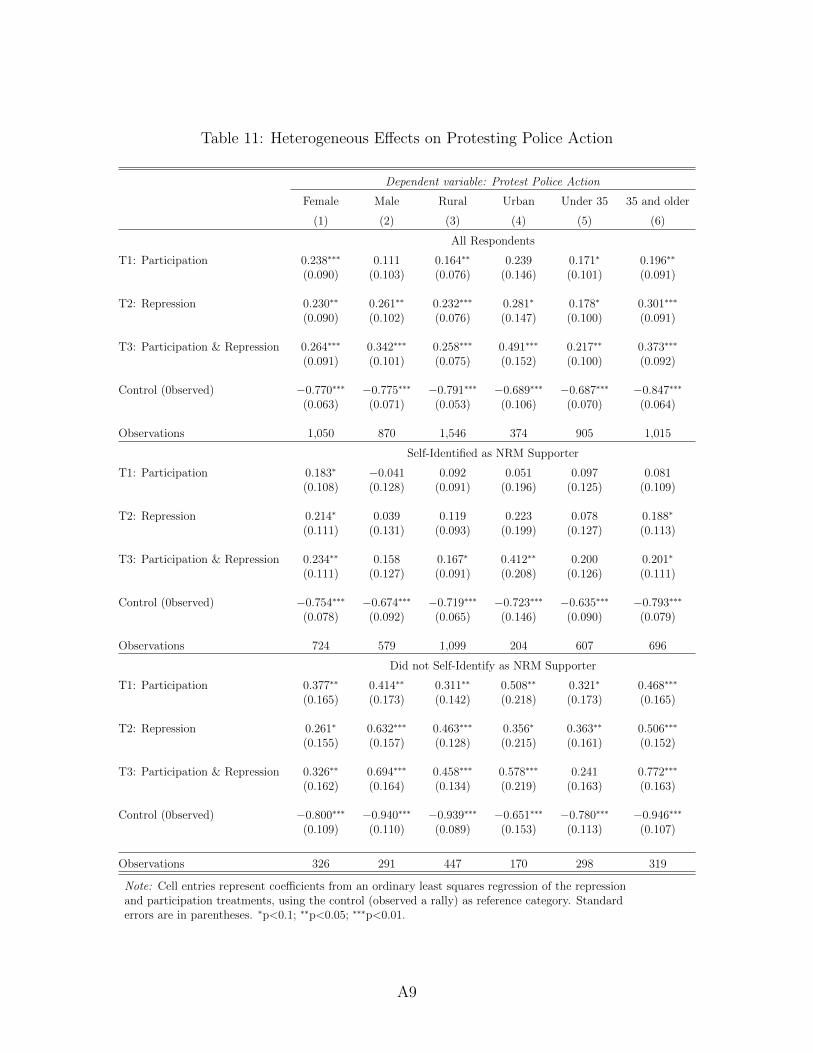
Table 11: Heterogeneous Effects on Protesting Police Action
Dependent variable: Protest Police Action
Female Male Rural Urban Under 35 35 and older
(1) (2) (3) (4) (5) (6)
All Respondents
T1: Participation 0.238∗∗∗ 0.111 0.164∗∗ 0.239 0.171∗ 0.196∗∗
(0.090) (0.103) (0.076) (0.146) (0.101) (0.091)
T2: Repression 0.230∗∗ 0.261∗∗ 0.232∗∗∗ 0.281∗ 0.178∗ 0.301∗∗∗
(0.090) (0.102) (0.076) (0.147) (0.100) (0.091)
T3: Participation & Repression 0.264∗∗∗ 0.342∗∗∗ 0.258∗∗∗ 0.491∗∗∗ 0.217∗∗ 0.373∗∗∗
(0.091) (0.101) (0.075) (0.152) (0.100) (0.092)
Control (0bserved) −0.770∗∗∗ −0.775∗∗∗ −0.791∗∗∗ −0.689∗∗∗ −0.687∗∗∗ −0.847∗∗∗
(0.063) (0.071) (0.053) (0.106) (0.070) (0.064)
Observations 1,050 870 1,546 374 905 1,015
Self-Identified as NRM Supporter
T1: Participation 0.183∗ −0.041 0.092 0.051 0.097 0.081(0.108) (0.128) (0.091) (0.196) (0.125) (0.109)
T2: Repression 0.214∗ 0.039 0.119 0.223 0.078 0.188∗
(0.111) (0.131) (0.093) (0.199) (0.127) (0.113)
T3: Participation & Repression 0.234∗∗ 0.158 0.167∗ 0.412∗∗ 0.200 0.201∗
(0.111) (0.127) (0.091) (0.208) (0.126) (0.111)
Control (0bserved) −0.754∗∗∗ −0.674∗∗∗ −0.719∗∗∗ −0.723∗∗∗ −0.635∗∗∗ −0.793∗∗∗
(0.078) (0.092) (0.065) (0.146) (0.090) (0.079)
Observations 724 579 1,099 204 607 696
Did not Self-Identify as NRM Supporter
T1: Participation 0.377∗∗ 0.414∗∗ 0.311∗∗ 0.508∗∗ 0.321∗ 0.468∗∗∗
(0.165) (0.173) (0.142) (0.218) (0.173) (0.165)
T2: Repression 0.261∗ 0.632∗∗∗ 0.463∗∗∗ 0.356∗ 0.363∗∗ 0.506∗∗∗
(0.155) (0.157) (0.128) (0.215) (0.161) (0.152)
T3: Participation & Repression 0.326∗∗ 0.694∗∗∗ 0.458∗∗∗ 0.578∗∗∗ 0.241 0.772∗∗∗
(0.162) (0.164) (0.134) (0.219) (0.163) (0.163)
Control (0bserved) −0.800∗∗∗ −0.940∗∗∗ −0.939∗∗∗ −0.651∗∗∗ −0.780∗∗∗ −0.946∗∗∗
(0.109) (0.110) (0.089) (0.153) (0.113) (0.107)
Observations 326 291 447 170 298 319
Note: Cell entries represent coefficients from an ordinary least squares regression of the repressionand participation treatments, using the control (observed a rally) as reference category. Standarderrors are in parentheses. ∗p<0.1; ∗∗p<0.05; ∗∗∗p<0.01.
A9
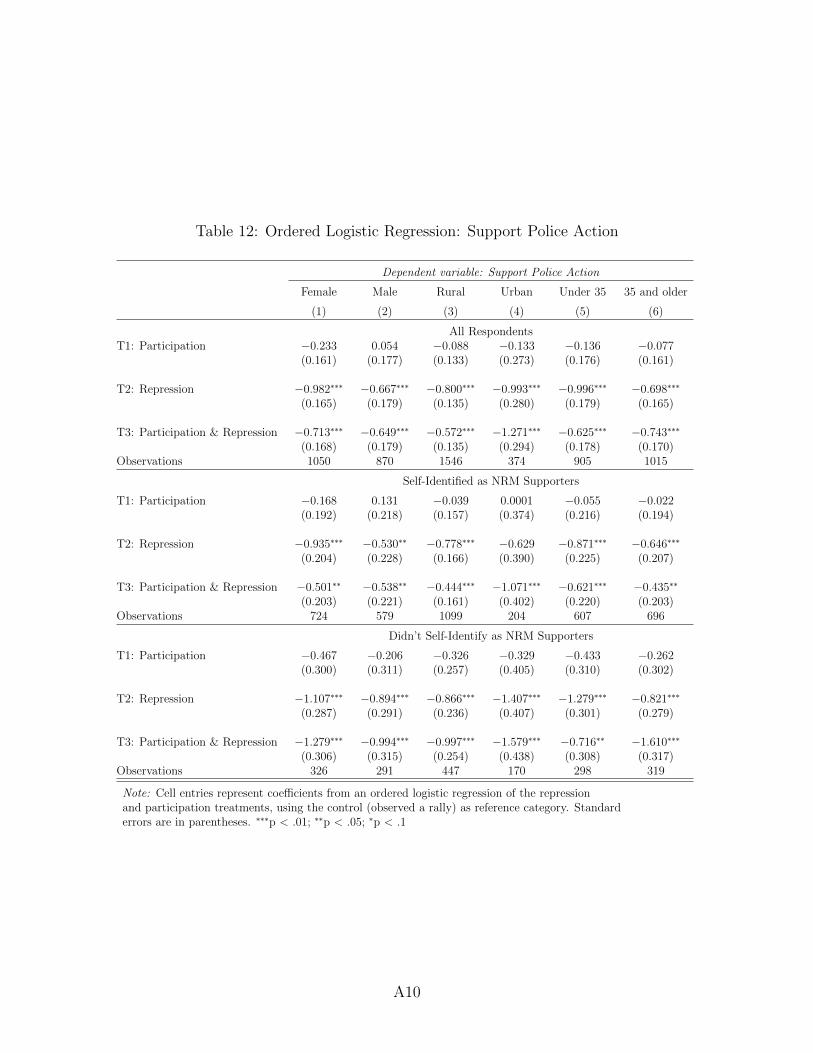
Table 12: Ordered Logistic Regression: Support Police Action
Dependent variable: Support Police Action
Female Male Rural Urban Under 35 35 and older
(1) (2) (3) (4) (5) (6)
All RespondentsT1: Participation −0.233 0.054 −0.088 −0.133 −0.136 −0.077
(0.161) (0.177) (0.133) (0.273) (0.176) (0.161)
T2: Repression −0.982∗∗∗ −0.667∗∗∗ −0.800∗∗∗ −0.993∗∗∗ −0.996∗∗∗ −0.698∗∗∗
(0.165) (0.179) (0.135) (0.280) (0.179) (0.165)
T3: Participation & Repression −0.713∗∗∗ −0.649∗∗∗ −0.572∗∗∗ −1.271∗∗∗ −0.625∗∗∗ −0.743∗∗∗
(0.168) (0.179) (0.135) (0.294) (0.178) (0.170)Observations 1050 870 1546 374 905 1015
Self-Identified as NRM Supporters
T1: Participation −0.168 0.131 −0.039 0.0001 −0.055 −0.022(0.192) (0.218) (0.157) (0.374) (0.216) (0.194)
T2: Repression −0.935∗∗∗ −0.530∗∗ −0.778∗∗∗ −0.629 −0.871∗∗∗ −0.646∗∗∗
(0.204) (0.228) (0.166) (0.390) (0.225) (0.207)
T3: Participation & Repression −0.501∗∗ −0.538∗∗ −0.444∗∗∗ −1.071∗∗∗ −0.621∗∗∗ −0.435∗∗
(0.203) (0.221) (0.161) (0.402) (0.220) (0.203)Observations 724 579 1099 204 607 696
Didn’t Self-Identify as NRM Supporters
T1: Participation −0.467 −0.206 −0.326 −0.329 −0.433 −0.262(0.300) (0.311) (0.257) (0.405) (0.310) (0.302)
T2: Repression −1.107∗∗∗ −0.894∗∗∗ −0.866∗∗∗ −1.407∗∗∗ −1.279∗∗∗ −0.821∗∗∗
(0.287) (0.291) (0.236) (0.407) (0.301) (0.279)
T3: Participation & Repression −1.279∗∗∗ −0.994∗∗∗ −0.997∗∗∗ −1.579∗∗∗ −0.716∗∗ −1.610∗∗∗
(0.306) (0.315) (0.254) (0.438) (0.308) (0.317)Observations 326 291 447 170 298 319
Note: Cell entries represent coefficients from an ordered logistic regression of the repressionand participation treatments, using the control (observed a rally) as reference category. Standarderrors are in parentheses. ∗∗∗p < .01; ∗∗p < .05; ∗p < .1
A10
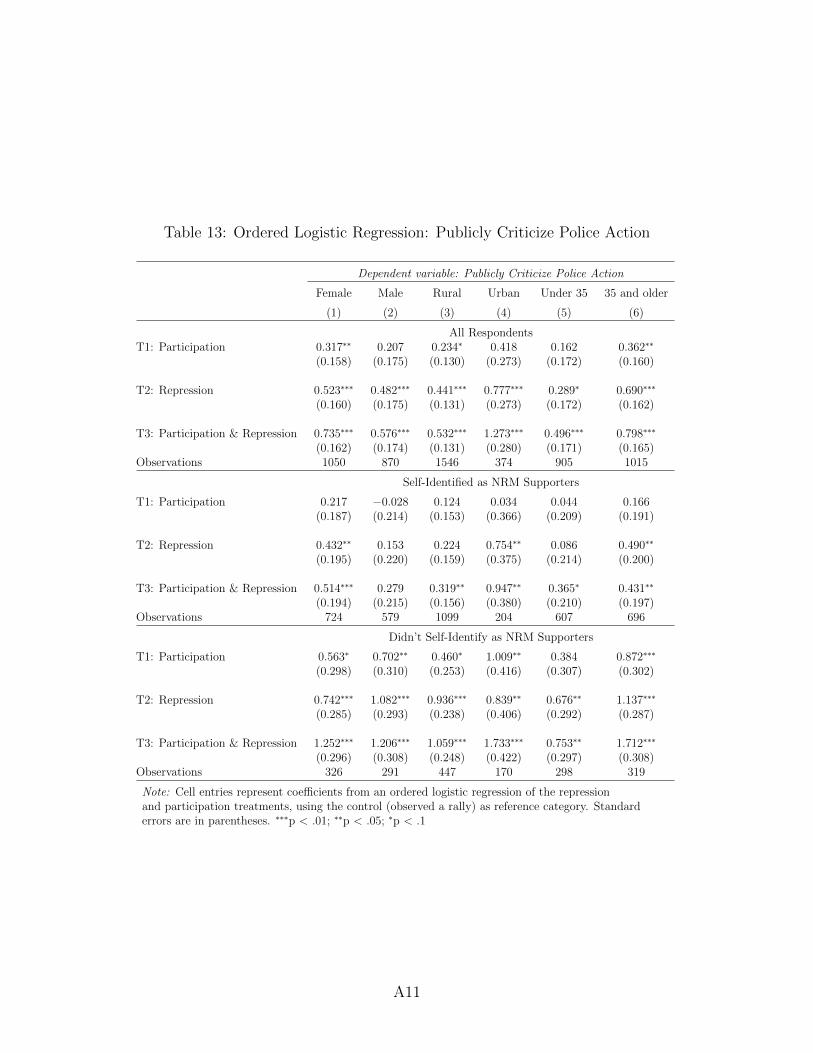
Table 13: Ordered Logistic Regression: Publicly Criticize Police Action
Dependent variable: Publicly Criticize Police Action
Female Male Rural Urban Under 35 35 and older
(1) (2) (3) (4) (5) (6)
All RespondentsT1: Participation 0.317∗∗ 0.207 0.234∗ 0.418 0.162 0.362∗∗
(0.158) (0.175) (0.130) (0.273) (0.172) (0.160)
T2: Repression 0.523∗∗∗ 0.482∗∗∗ 0.441∗∗∗ 0.777∗∗∗ 0.289∗ 0.690∗∗∗
(0.160) (0.175) (0.131) (0.273) (0.172) (0.162)
T3: Participation & Repression 0.735∗∗∗ 0.576∗∗∗ 0.532∗∗∗ 1.273∗∗∗ 0.496∗∗∗ 0.798∗∗∗
(0.162) (0.174) (0.131) (0.280) (0.171) (0.165)Observations 1050 870 1546 374 905 1015
Self-Identified as NRM Supporters
T1: Participation 0.217 −0.028 0.124 0.034 0.044 0.166(0.187) (0.214) (0.153) (0.366) (0.209) (0.191)
T2: Repression 0.432∗∗ 0.153 0.224 0.754∗∗ 0.086 0.490∗∗
(0.195) (0.220) (0.159) (0.375) (0.214) (0.200)
T3: Participation & Repression 0.514∗∗∗ 0.279 0.319∗∗ 0.947∗∗ 0.365∗ 0.431∗∗
(0.194) (0.215) (0.156) (0.380) (0.210) (0.197)Observations 724 579 1099 204 607 696
Didn’t Self-Identify as NRM Supporters
T1: Participation 0.563∗ 0.702∗∗ 0.460∗ 1.009∗∗ 0.384 0.872∗∗∗
(0.298) (0.310) (0.253) (0.416) (0.307) (0.302)
T2: Repression 0.742∗∗∗ 1.082∗∗∗ 0.936∗∗∗ 0.839∗∗ 0.676∗∗ 1.137∗∗∗
(0.285) (0.293) (0.238) (0.406) (0.292) (0.287)
T3: Participation & Repression 1.252∗∗∗ 1.206∗∗∗ 1.059∗∗∗ 1.733∗∗∗ 0.753∗∗ 1.712∗∗∗
(0.296) (0.308) (0.248) (0.422) (0.297) (0.308)Observations 326 291 447 170 298 319
Note: Cell entries represent coefficients from an ordered logistic regression of the repressionand participation treatments, using the control (observed a rally) as reference category. Standarderrors are in parentheses. ∗∗∗p < .01; ∗∗p < .05; ∗p < .1
A11
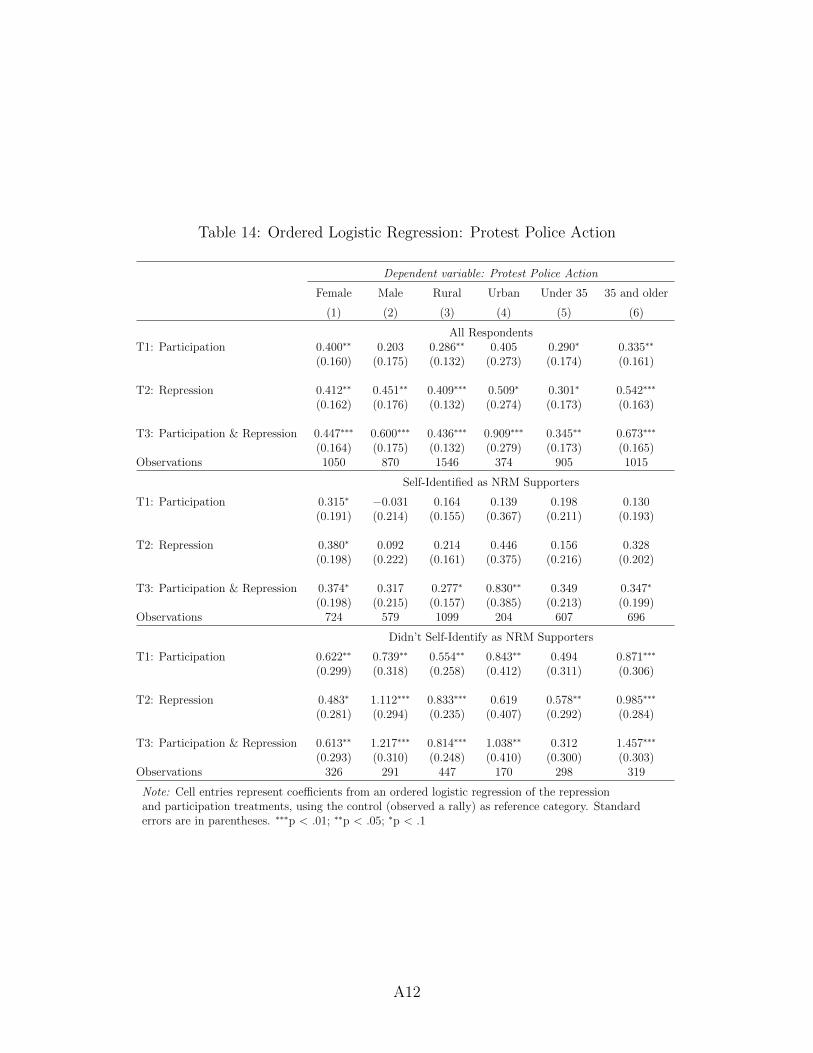
Table 14: Ordered Logistic Regression: Protest Police Action
Dependent variable: Protest Police Action
Female Male Rural Urban Under 35 35 and older
(1) (2) (3) (4) (5) (6)
All RespondentsT1: Participation 0.400∗∗ 0.203 0.286∗∗ 0.405 0.290∗ 0.335∗∗
(0.160) (0.175) (0.132) (0.273) (0.174) (0.161)
T2: Repression 0.412∗∗ 0.451∗∗ 0.409∗∗∗ 0.509∗ 0.301∗ 0.542∗∗∗
(0.162) (0.176) (0.132) (0.274) (0.173) (0.163)
T3: Participation & Repression 0.447∗∗∗ 0.600∗∗∗ 0.436∗∗∗ 0.909∗∗∗ 0.345∗∗ 0.673∗∗∗
(0.164) (0.175) (0.132) (0.279) (0.173) (0.165)Observations 1050 870 1546 374 905 1015
Self-Identified as NRM Supporters
T1: Participation 0.315∗ −0.031 0.164 0.139 0.198 0.130(0.191) (0.214) (0.155) (0.367) (0.211) (0.193)
T2: Repression 0.380∗ 0.092 0.214 0.446 0.156 0.328(0.198) (0.222) (0.161) (0.375) (0.216) (0.202)
T3: Participation & Repression 0.374∗ 0.317 0.277∗ 0.830∗∗ 0.349 0.347∗
(0.198) (0.215) (0.157) (0.385) (0.213) (0.199)Observations 724 579 1099 204 607 696
Didn’t Self-Identify as NRM Supporters
T1: Participation 0.622∗∗ 0.739∗∗ 0.554∗∗ 0.843∗∗ 0.494 0.871∗∗∗
(0.299) (0.318) (0.258) (0.412) (0.311) (0.306)
T2: Repression 0.483∗ 1.112∗∗∗ 0.833∗∗∗ 0.619 0.578∗∗ 0.985∗∗∗
(0.281) (0.294) (0.235) (0.407) (0.292) (0.284)
T3: Participation & Repression 0.613∗∗ 1.217∗∗∗ 0.814∗∗∗ 1.038∗∗ 0.312 1.457∗∗∗
(0.293) (0.310) (0.248) (0.410) (0.300) (0.303)Observations 326 291 447 170 298 319
Note: Cell entries represent coefficients from an ordered logistic regression of the repressionand participation treatments, using the control (observed a rally) as reference category. Standarderrors are in parentheses. ∗∗∗p < .01; ∗∗p < .05; ∗p < .1
A12
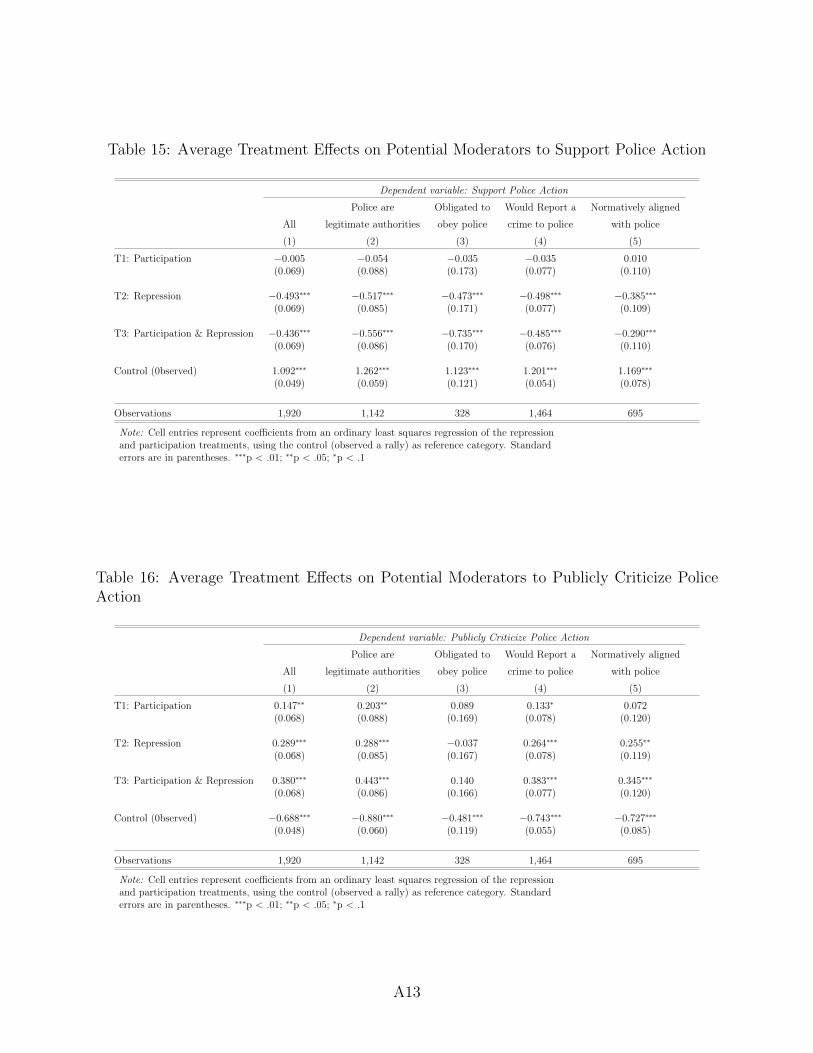
Table 15: Average Treatment Effects on Potential Moderators to Support Police Action
Dependent variable: Support Police Action
Police are Obligated to Would Report a Normatively aligned
All legitimate authorities obey police crime to police with police
(1) (2) (3) (4) (5)
T1: Participation −0.005 −0.054 −0.035 −0.035 0.010(0.069) (0.088) (0.173) (0.077) (0.110)
T2: Repression −0.493∗∗∗ −0.517∗∗∗ −0.473∗∗∗ −0.498∗∗∗ −0.385∗∗∗
(0.069) (0.085) (0.171) (0.077) (0.109)
T3: Participation & Repression −0.436∗∗∗ −0.556∗∗∗ −0.735∗∗∗ −0.485∗∗∗ −0.290∗∗∗
(0.069) (0.086) (0.170) (0.076) (0.110)
Control (0bserved) 1.092∗∗∗ 1.262∗∗∗ 1.123∗∗∗ 1.201∗∗∗ 1.169∗∗∗
(0.049) (0.059) (0.121) (0.054) (0.078)
Observations 1,920 1,142 328 1,464 695
Note: Cell entries represent coefficients from an ordinary least squares regression of the repressionand participation treatments, using the control (observed a rally) as reference category. Standarderrors are in parentheses. ∗∗∗p < .01; ∗∗p < .05; ∗p < .1
Table 16: Average Treatment Effects on Potential Moderators to Publicly Criticize PoliceAction
Dependent variable: Publicly Criticize Police Action
Police are Obligated to Would Report a Normatively aligned
All legitimate authorities obey police crime to police with police
(1) (2) (3) (4) (5)
T1: Participation 0.147∗∗ 0.203∗∗ 0.089 0.133∗ 0.072(0.068) (0.088) (0.169) (0.078) (0.120)
T2: Repression 0.289∗∗∗ 0.288∗∗∗ −0.037 0.264∗∗∗ 0.255∗∗
(0.068) (0.085) (0.167) (0.078) (0.119)
T3: Participation & Repression 0.380∗∗∗ 0.443∗∗∗ 0.140 0.383∗∗∗ 0.345∗∗∗
(0.068) (0.086) (0.166) (0.077) (0.120)
Control (0bserved) −0.688∗∗∗ −0.880∗∗∗ −0.481∗∗∗ −0.743∗∗∗ −0.727∗∗∗
(0.048) (0.060) (0.119) (0.055) (0.085)
Observations 1,920 1,142 328 1,464 695
Note: Cell entries represent coefficients from an ordinary least squares regression of the repressionand participation treatments, using the control (observed a rally) as reference category. Standarderrors are in parentheses. ∗∗∗p < .01; ∗∗p < .05; ∗p < .1
A13
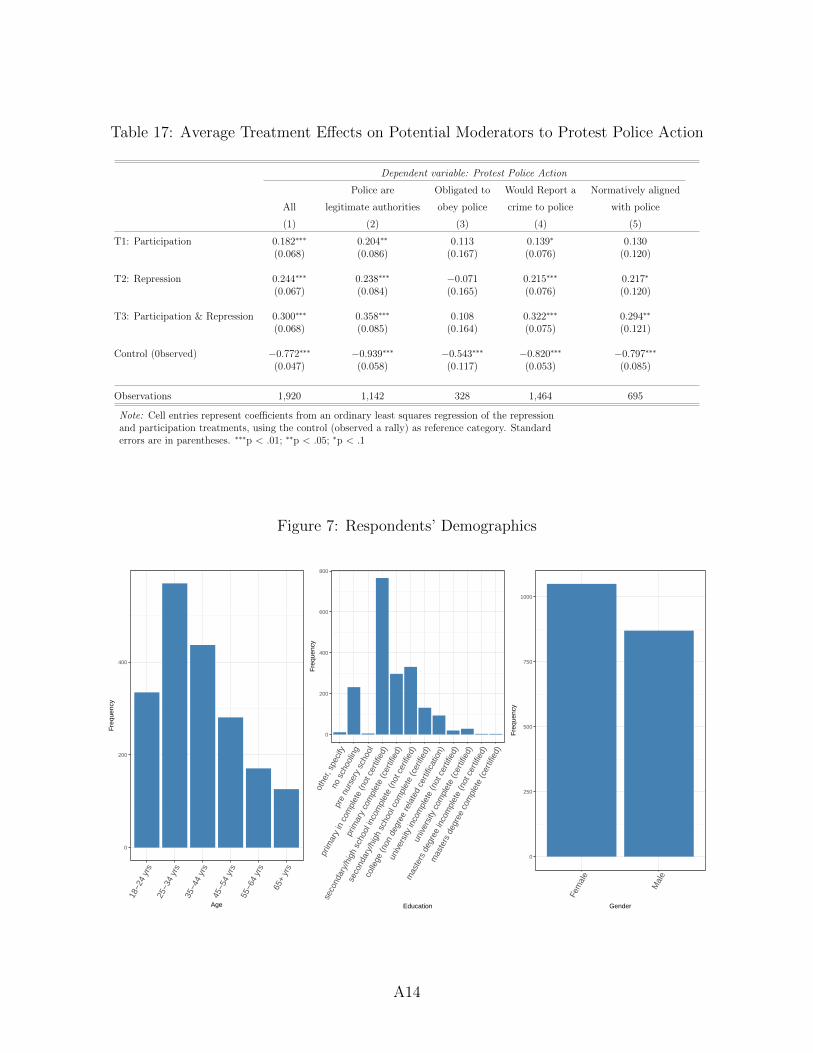
Table 17: Average Treatment Effects on Potential Moderators to Protest Police Action
Dependent variable: Protest Police Action
Police are Obligated to Would Report a Normatively aligned
All legitimate authorities obey police crime to police with police
(1) (2) (3) (4) (5)
T1: Participation 0.182∗∗∗ 0.204∗∗ 0.113 0.139∗ 0.130(0.068) (0.086) (0.167) (0.076) (0.120)
T2: Repression 0.244∗∗∗ 0.238∗∗∗ −0.071 0.215∗∗∗ 0.217∗
(0.067) (0.084) (0.165) (0.076) (0.120)
T3: Participation & Repression 0.300∗∗∗ 0.358∗∗∗ 0.108 0.322∗∗∗ 0.294∗∗
(0.068) (0.085) (0.164) (0.075) (0.121)
Control (0bserved) −0.772∗∗∗ −0.939∗∗∗ −0.543∗∗∗ −0.820∗∗∗ −0.797∗∗∗
(0.047) (0.058) (0.117) (0.053) (0.085)
Observations 1,920 1,142 328 1,464 695
Note: Cell entries represent coefficients from an ordinary least squares regression of the repressionand participation treatments, using the control (observed a rally) as reference category. Standarderrors are in parentheses. ∗∗∗p < .01; ∗∗p < .05; ∗p < .1
Figure 7: Respondents’ Demographics
0
200
400
18−2
4 yr
s25
−34
yrs
35−4
4 yr
s45
−54
yrs
55−6
4 yr
s
65+
yrs
Age
Fre
quen
cy
0
200
400
600
800
othe
r, sp
ecify
no s
choo
ling
pre
nurs
ery
scho
ol
prim
ary
in c
ompl
ete
(not
cer
tifie
d)
prim
ary
com
plet
e (c
ertif
ied)
seco
ndar
y/hi
gh s
choo
l inc
ompl
ete
(not
cer
ified
)
seco
ndar
y/hi
gh s
choo
l com
plet
e (c
erifi
ed)
colle
ge (n
on d
egre
e re
late
d ce
rtific
atio
n)
univ
ersi
ty in
com
plet
e (n
ot c
ertif
ied)
univ
ersi
ty c
ompl
ete
(cer
tifie
d)
mas
ters
deg
ree
inco
mpl
ete
(not
cer
tifie
d)
mas
ters
deg
ree
com
plet
e (c
ertif
ied)
Education
Fre
quen
cy
0
250
500
750
1000
Fem
ale
Mal
e
Gender
Fre
quen
cy
A14
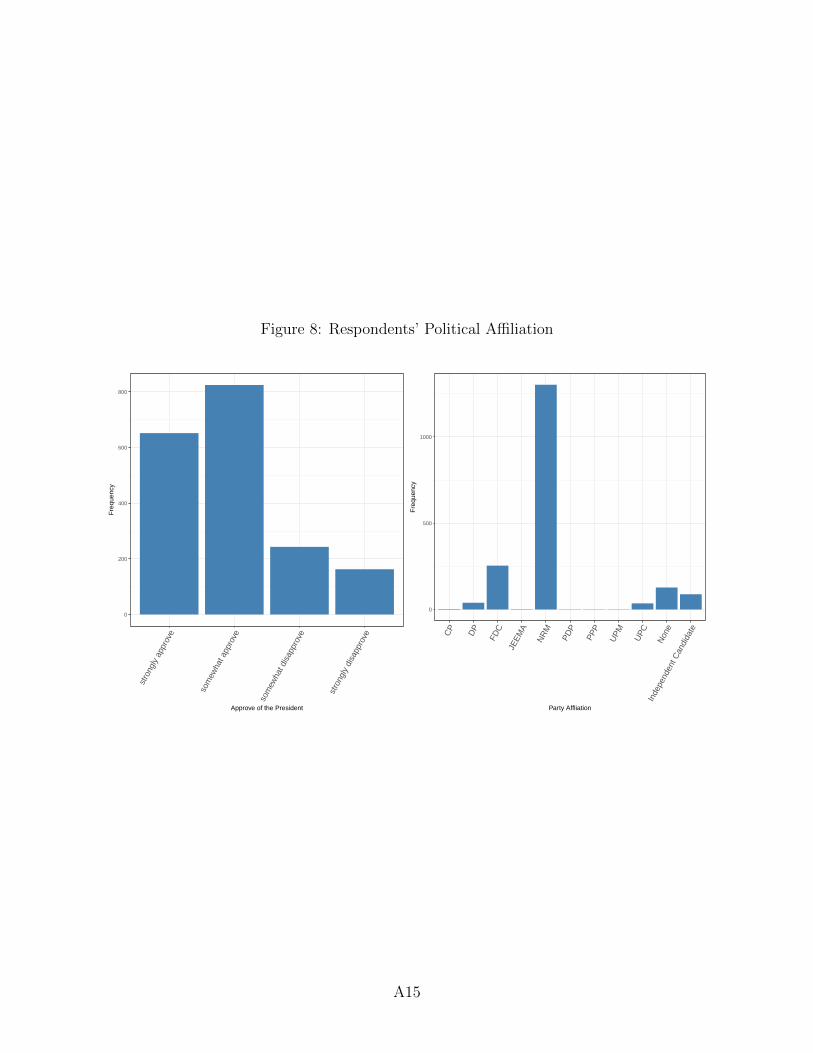
Figure 8: Respondents’ Political Affiliation
0
200
400
600
800
stro
ngly
app
rove
som
ewha
t app
rove
som
ewha
t dis
appr
ove
stro
ngly
dis
appr
ove
Approve of the President
Fre
quen
cy
0
500
1000
CP
DP
FDC
JEEM
A
NR
M
PDP
PPP
UPM UPC
Non
e
Inde
pend
ent C
andi
date
Party Affliation
Fre
quen
cy
A15
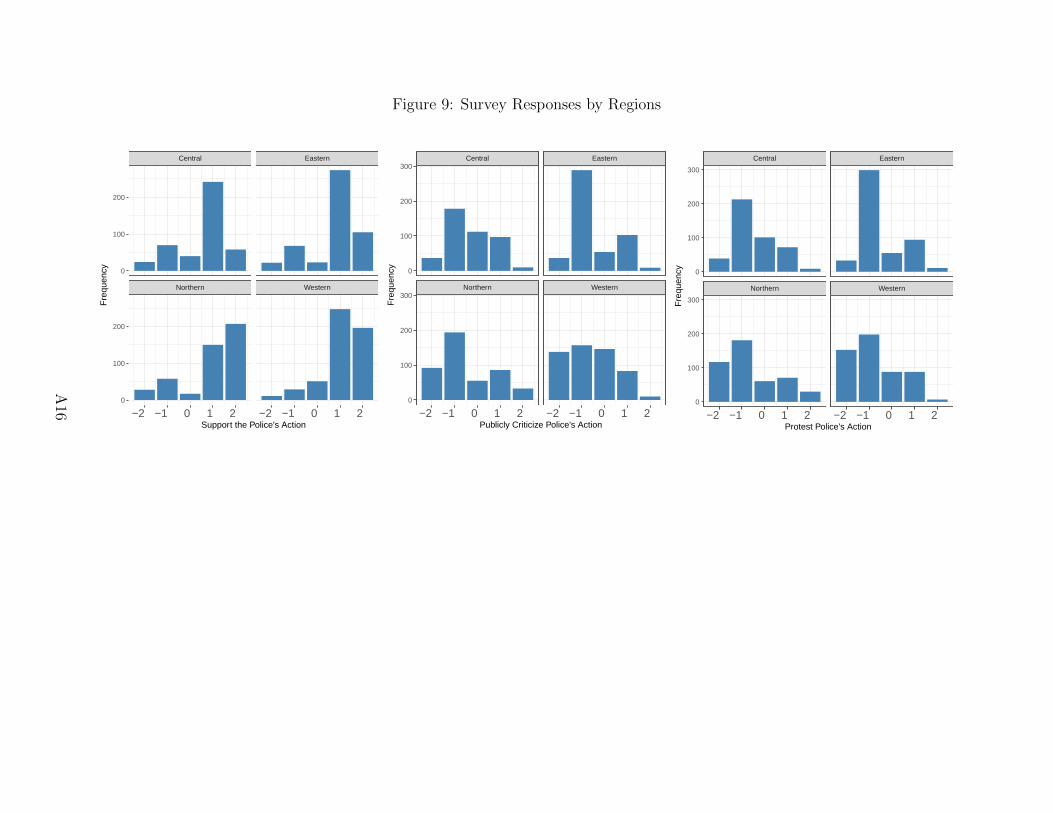
Figure 9: Survey Responses by Regions
Northern Western
Central Eastern
−2 −1 0 1 2 −2 −1 0 1 2
0
100
200
0
100
200
Support the Police's Action
Fre
quen
cy
Northern Western
Central Eastern
−2 −1 0 1 2 −2 −1 0 1 2
0
100
200
300
0
100
200
300
Publicly Criticize Police's Action
Fre
quen
cy
Northern Western
Central Eastern
−2 −1 0 1 2 −2 −1 0 1 2
0
100
200
300
0
100
200
300
Protest Police's Action
Fre
quen
cy
A16