Embed Size (px)
Citation preview

Streamlining the data gathering, processing, and charting
Fabio Sacchetti (PhD)
Hydrographic Team Leader INFOMAR
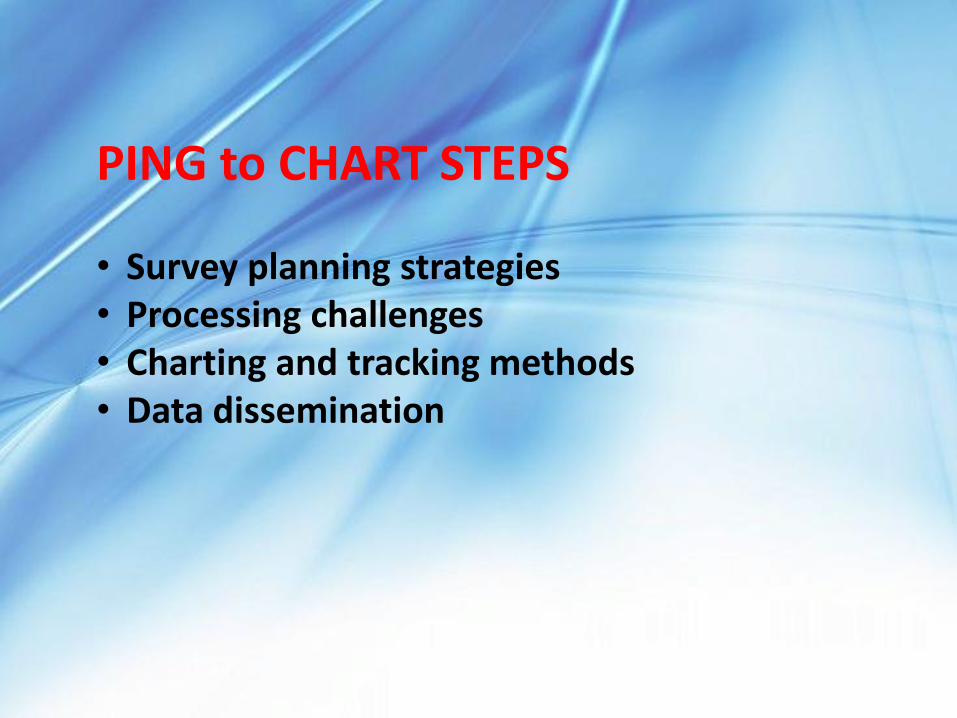
PING to CHART STEPS • Survey planning strategies • Processing challenges • Charting and tracking methods • Data dissemination

FOCUS

Ptolemy World Map – 2nd Century AD Mappa Mundi – 14th Century AD
Piri Reiss Map – 16th Century AD
Charting The Unknown
17th Century AD Accurate!!
Atlantis Map – 19th Century AD
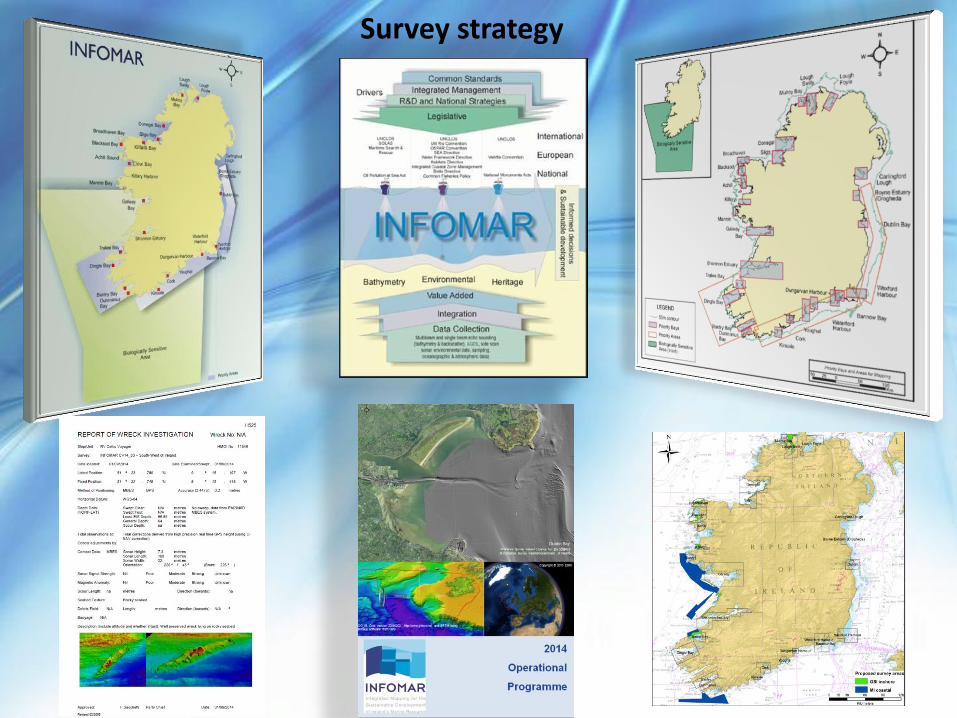
Survey strategy

Data processing consist in a series of data manipulation, data cleaning and quality control necessary to correct these errors and obtain good data quality.
Good data = happy processor
Bad data = grumpy processor
Tiring
Turning some ugly into something beautiful is rewarding

Technology evolution - multibeam

SVP sensors
Tide gauges
GPS and motion sensors
Technology evolution – ancillary sensors

Data processing - charting challenges Datum control
MSL definition Malin Head → MSL2000
LAT model Polpred → VORF
Tidal corrections Tide gauges → GPS tide

Data processing - charting challenges
backscatter
Raw backscatter
Processed backscatter
Fledermaus / QTC)
Processed backscatter
caris
Donegal Bay - 2002 data
Iceberg scours
Offshore Bantry - 2006 data
Mixed seabed
Raw
Backscatt
er
Ge
oco
ded
Backscatt
er
Offshore Bantry - 2006 data
Mixed seabed Donegal Bay - 2002 data
Iceberg scour
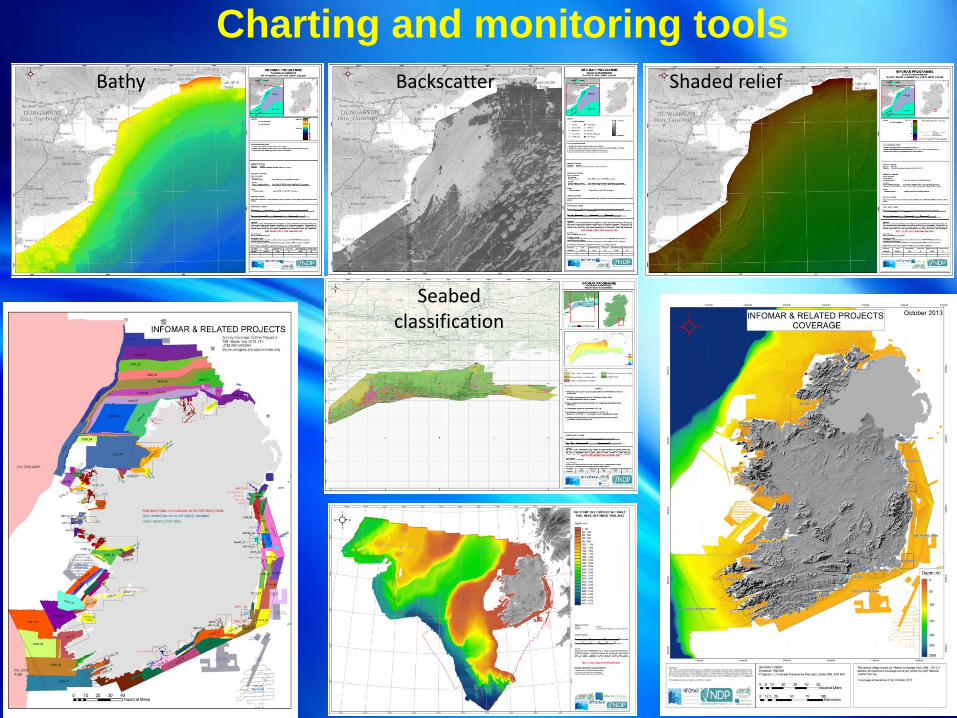
Bathy Shaded relief Backscatter
Seabed classification
Charting and monitoring tools

S-57+Priority areas Locations Data status Datum-level Survey Leg Polygons Outstanding areas
Chart tracking
Charting and monitoring tools

Data access

View datasets in Webmapping Viewers. In both viewers you can then select an area of interest to download data from IWDDS
Download data from Interactive Web Data Delivery System (IWDDS)
View Metadata on datasets available
NOAA’s website
Access Web Map Services (WMS) used in the viewers to display bathymetry backscatter, shaded relief and seabed classification and use with your own data in ArcGIS and ArcExplorer online.
Data access

Data access
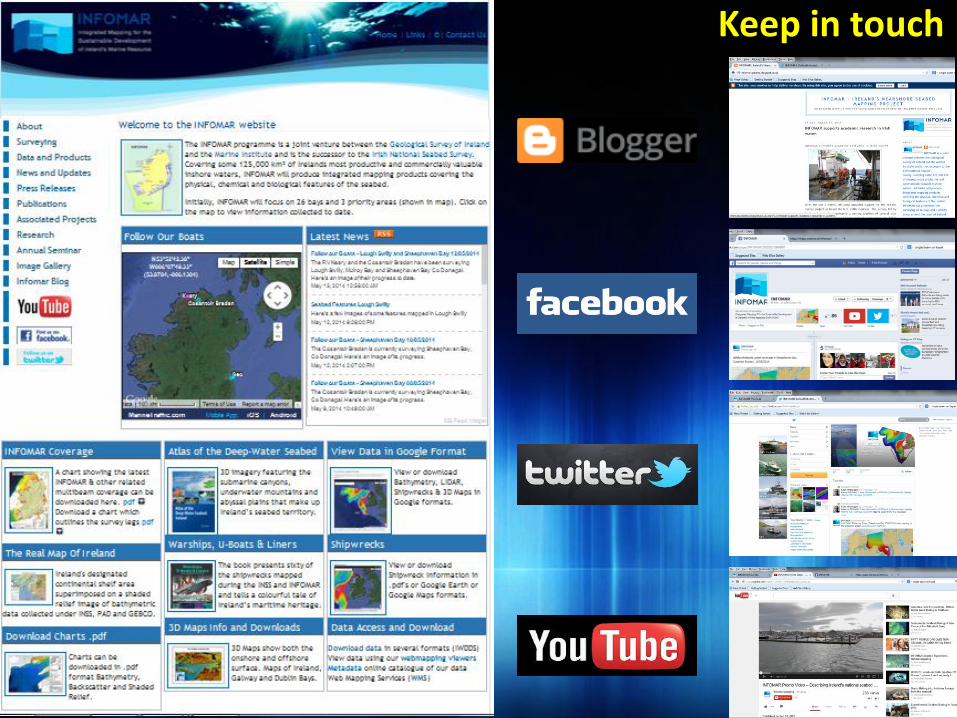
Keep in touch

Sediment samples Lidar
charts Multibeam
Benchmarking
Thanks Questions?