Embed Size (px)
Citation preview

STREAMLINE THE SEARCH ENGINE
MARKETING STRATEGYGenerational Driven Search Behavior on Google
Christa Alanko
Rebecca Nilsson
Business Administration, bachelor's level
2018
Luleå University of Technology
Department of Business Administration, Technology and Social Sciences

BACHELOR THESIS
Christa Alanko
Rebecca Nilsson
Business Administration, bachelor level
2018
Luleå University of Technology Department of Business,Administration
STREAMLINE THE SEARCH ENGINE MARKETING STRATEGY
Generational Driven Search Behavior on Google

Acknowledgement
The bachelor thesis, written in 2018 within the Department of Business, Administration,
Technology and Social Sciences at Luleå University of Technology, is the result of an
investigation of the search behavior of customers using search engines. The purpose of the study
is for companies to determine which Search Engine Marketing Strategy is the most suitable in
different product markets. The investigation has given us a greater understanding of customer
search behavior, as well as the factors affecting purchase decisions.
We would like to express our appreciation to Kerry Chipp, our mentor throughout the process
of compiling the bachelor thesis, for the valuable advices and for the support and guideline.
Additionally, we would like to offer our thanks to all the participants who participated in the
observations performed in the data collection process, which entailed the foundation of the
bachelor thesis.
As the area of search behavior of customers using search engines is relatively scientifically
unexplored, we hope that the thesis will contribute with useful knowledge and be a foundation
for further research.
__________________ __________________
Rebecca Nilsson Christa Alanko

Abstract
The expanded internet usage has resulted in an increased activity at web-based search engines.
Companies are therefore devoting a large portion of their online marketing budget on Search
Engine Marketing (abbreviated SEM) in order to reach potential online consumers searching
for products. SEM comprises Search Engine Advertising (SEA) and Search Engine
Optimization (SEO) which are two dissimilar marketing tools companies can invest in to reach
the desired customer segments. It is therefore of great interest for companies in different product
markets to have knowledge of which SEM strategy to utilize. The statement leads to the purpose
of the thesis which is to investigate which SEM strategy is the most suitable for companies in
different markets, SEA or SEO?. The purpose of the thesis is derived to the research problem:
How does the search behavior of consumers differ between the two SEM tools, SEO and SEA?.
Initially, in order to answer the research problem, a theoretical framework was conducted
consisting of theories from previous research. To collect primary data observations of 60 test
subjects was performed in accordance with the Experimental Vignette Methodology. The
analysis consists of a comparison between the collected data and the theories included in the
frame of reference, to identify similarities and differences. The SPSS analysis of the result
revealed numerous findings such as the two-way interactions of the factors degree of
involvement and the click rate of SEM, as well as the choice of either a head or a tail keyword
and the degree of involvement. The analysis further revealed a three-way interaction which
suggests that the degree of involvement, and the use of either a head or tail keyword affects the
choice of SEM. Additionally, the result shows that customers using brands as keywords are
more likely to click on an organic link rather than on a paid ad. However, when adding the
factor age to the analysis the results turn insignificant. As the area of search behavior of
customers using search engines is relatively scientifically unexplored, the thesis has contributed
with knowledge useful for companies, marketing agencies, among others. However, due to the
ongoing expansion of search engine usage, it is of great interest to conduct further research in
the area to reveal additional findings.
Keywords: Search Engine Marketing, Search Engine Advertising, Search Engine
Optimization, Search Behavior, Generation X, Generation Y

Table of Content 1. Introduction .......................................................................................................................... 1
1.1 Background ....................................................................................................................... 1
1.2 Problem Discussion .......................................................................................................... 2
1.3 Research Purpose and Research Questions ...................................................................... 3
1.4 Delimitations .................................................................................................................... 4
2. Theoretical Review ............................................................................................................... 5
2.1 Search behavior ................................................................................................................ 5
2.2 Search engines .................................................................................................................. 5
2.2.1 Search Engine Users .................................................................................................. 7
2.3 Search Engine Marketing ................................................................................................. 7
2.3.1 Search Engine Optimization ...................................................................................... 7
2.3.2 Search Engine Advertising ........................................................................................ 8
2.4 The Long Tail Phenomenon ............................................................................................. 9
2.5 Frame of Reference ........................................................................................................ 10
3. Methodology ....................................................................................................................... 13
3.1 Research Purpose ............................................................................................................ 13
3.2 Research Approach ......................................................................................................... 13
3.3 Literature Search ............................................................................................................. 14
3.4 Experimental Vignette Methodology ............................................................................. 14
3.4.1 Step 1 – Planning ..................................................................................................... 16
3.4.2 Step 2 – Implementation .......................................................................................... 19
3.4.3 Step 3 – Reporting of Results .................................................................................. 21
3.6 Validity & Reliability ..................................................................................................... 22
3.6.1 Credibility ................................................................................................................ 22
3.1.2 Ethical consideration ................................................................................................ 22
4. Data Result .......................................................................................................................... 24
4.1 Search Behavior .............................................................................................................. 24
4.2 Generational Search Behavior ........................................................................................ 26
4.3 Significance of the data results ....................................................................................... 28
5. Data Analysis ...................................................................................................................... 30
5.1 Search Behavior - Click Rate ......................................................................................... 30
5.1.1 Degree of Product Involvement ............................................................................... 30

5.1.2 Generational Driven Click Rate ............................................................................... 31
5.2 Search Behavior - Keyword Usage ................................................................................ 32
5.2.1 Degree of Product Involvement ............................................................................... 33
5.1.2 Generational Driven Keyword Usage ...................................................................... 34
6. Findings and Conclusions .................................................................................................. 36
6.1 Search Behavior .............................................................................................................. 36
6.2 Generational Search Behavior ........................................................................................ 37
6.3 Implications/Recommendations ..................................................................................... 38
6.3.1 Implications for Practitioners ................................................................................... 39
6.3.2 Implications for Theory ........................................................................................... 40
6.3.3 Implications for Further Research............................................................................ 40
6.4 Limitations ...................................................................................................................... 40
References ................................................................................................................................ 41
Appendix 1: EVM .................................................................................................................... 45
Appendix 2: Multivariate Tests ^a ........................................................................................... 48
Appendix 3: Tests of Within-Subjects Effects ......................................................................... 49
Appendix 4: Tests of Within-Subjects Contrasts ..................................................................... 53
Appendix 5: Tests of Between-Subjects Effects ...................................................................... 55
Appendix 6: Multivariate Tests ^a ........................................................................................... 56
Appendix 7: Data Collected Through Observations ................................................................ 57

Tables of Figures
Figure 1: Google ......................................................................................................................... 6
Figure 2: The Long Tail Phenomenon ....................................................................................... 9
Figure 3: The Frame of Reference - The Degree of Product Involvement .............................. 10
Figure 4: The Frame of Reference - Generation X and Y ........................................................ 11
Figure 5: Summary of The Experimental Vignette Methodology ........................................... 15

Table of Tables
Table 1: Shoes - Low Involvement, Head or Tail Search & SEM ........................................... 24
Table 2: Cars - High Involvement, Head or Tail Search & SEM ............................................ 25
Table 3: Mobile Charger - Low Involvement, Head or Tail Search & SEM ........................... 25
Table 4: Sofa - High Involvement, Head or Tail Search & SEM ............................................ 26
Table 5: Brand or Product & SEM ........................................................................................... 26
Table 6: Generational Search Behavior ................................................................................... 27
Table 7: Significance of The Data Results ............................................................................... 29
Table 8: General Click Rate ..................................................................................................... 30
Table 9: Involvement & SEM .................................................................................................. 31
Table 10: Generational Click Behavior .................................................................................... 31
Table 11: Head or Tail Keyword .............................................................................................. 32
Table 12: Involvement & Head or Tail Keyword .................................................................... 33
Table 13: Involvement - Head or Tail & SEM ......................................................................... 34
Table 14: Age - Head or Tail & Involvement .......................................................................... 35

1
1. Introduction
The introductory chapter presents the background to the thesis and the problem discussion,
followed by the research problem and the derived research questions. The section ends with a
clarification of the delimitations of the study.
1.1 Background
Internet marketing has become more relevant than ever due to expanded internet usage, along
with increased activity at web-based search engines (Internet Live Stats, 2018; Shih, Chen &
Chen, 2013). In April 2018 there were approximately 3,887,000,000 internet users around the
world, which constitutes around 40% of the total population (Internet Live Stats, 2018). The
entrained increased activity at search engines has resulted in that the internet users are accessing
various types of information, leading to different companies having to be available for potential
online customers. There is a large amount of different search engines available online where
millions of searches are made every day (Chris, 2018). The top four search engines in the world
dominate the market with a combined share of astonishing 98,35%, where Google is in the lead
with 73,73% of the total market share. Baidu is the world's second largest search engine
platform with 11,69% of the market, followed by Bing and Yahoo! which comprise 7,82% and
5,11% of the total share respectively. (Net Marketshare, 2018) Therefore, companies are now
devoting a large portion of their online marketing budget on Search Engine Marketing (SEM)
in order to reach the searching consumers (Shih et al., 2013).
SEM comprises Search Engine Advertising (SEA) and Search Engine Optimization (SEO),
which are two dissimilar marketing tools that are being more frequently used by companies to
reach suitable consumers (Shih et al., 2013). SEA includes marketing through ads published at
search engines placed above the organic search result where companies Pay-Per-Click (PPC),
meaning that companies pay for each click on the specific ads. In order to be visible in various
types of searches made by selected customer segments, companies have to select the most
appropriate keywords and bid against competitors in order to be placed high in the search result
(Joshi & Motwani, 2006). The strategy implicate that a well-used keyword is more expensive
per click compared with a rarely used one due to grade of customer exposure. (Skiera, Eckert
& Hinz, 2010)

2
SEO is on the contrary a strategy aimed to improve the natural website ranking, the organic
search result, meaning companies strives to drive traffic to their website by manipulating the
meta tags and content of the sites using different types of keywords (Cheng-Jye, Sheng-An &
Ting-Li, 2016; Shih et al., 2013).
1.2 Problem Discussion
As search engines are used by consumers searching for information, companies and marketing
agencies among others need to be aware of the customers search behavior, thus, their use of
keywords, their click behavior of SEO and SEA, eventual patterns etcetera (Jerath, Ma, & Park,
2014). It is usually difficult for companies to know which type of SEM strategy to use in order
to reach the selected customer segment, due to that there are considerable differences between
the strategies SEA and SEO (Shih et al., 2013; Joshi & Motwani, 2006; Cheng-Jye et al., 2016).
It is challenging for different types of companies to succeed in finding the right keywords
because of the large variation, where companies having the opportunity to either choose popular
keywords which drives a lot of traffic to the company’s websites, or less expensive ones
resulting in less web traffic along with lower SEM costs. (Joshi & Motwani 2006) The less
expensive keywords are included in the long-tail phenomenon, which is, according to Skiera et
al., (2010), defined as the combination of keywords that are not among the most popular.
Additionally, companies must be aware of the behavior of the relevant age segment to reach
the potential customers. As previously mentioned the internet use has expanded all around the
world (Internet Live Stats, 2018), which has resulted in that the internet use among different
age groups are in general the same. In the first quarter of 2017 the younger generation between
the ages 16 to 34 comprises 39% of the share of total internet use, whereas the share of the age
group between 35 to 54 approximately covers 41%. (Statista, 2018) Although the different
generations nowadays comprise similar grade of internet usage, the data does not explain
behavioral differences between the age groups. The gap of knowledge creates the need of an
investigation of eventual behavioral differences between generations, in order for companies to
know which of the two presented strategies, SEA or SEO, is the most suitable in dissimilar
markets.
To be able to investigate eventual differences relevant generations have to be defined. The
definitions of Generation X and Generation Y varies depending on source (Maayan

3
Zhitomirsky-Geffet, 2017; Reisenwitz & Iyer, 2009), resulting in unclear ranges of age.
Therefore, the investigation comprises the definitions of generations according to (Maayan
Zhitomirsky-Geffet, 2017), where Generation X includes those who are born before 1980, and
Generation Y covers those born between 1980 and 1995. According to Reisenwitz & Iyer
(2009) the first generation using technology, such as cellphones, instant messaging etcetera,
since childhood is Generation Y. This has resulted in that Generation Y handles technology
more effectively than Generation X (Reisenwitz & Iyer, 2009), which could mean that the
generations have different search behavior. The presented information clarifies the gap of
knowledge, whether generational behavior differences do affect the choice of SEM-strategy,
due to the unequal degree of technology skills.
The thesis comprises an investigation of how companies can streamline the search engine
marketing strategy in different markets. The dissimilar markets are divided after specific goods
which are categorized as high and low involvement products. A high involvement buying
decision refers to complex, high price purchases of products where the buyer requires relevant
information, whereas a low involvement buying decision refers to purchases of products which
are less-expensive nor complex. Despite that the level of involvement is dependent on the
individual buyer, the thesis includes typical high and low involvement products. (University of
Minnesota, 2015)
1.3 Research Purpose and Research Questions
Due to the expanded customer use of different search engines, the purpose of the report is to
investigate which SEM strategy is the most suitable for companies in different markets, SEA
or SEO? The purpose leads to the research problem (RP): How does the search behavior of
consumers differ between the two SEM tools, SEO and SEA?, which derives to the research
questions presented below.
RQ1: How does the click rate differ in searches of high and low involvement products?
RQ2: How does the click rate differ between the two age groups, Generation X and Generation
Y?
RQ3: Which types of keywords are used in searches of high and low involvement products?

4
RQ4: Which types of keywords are used by Generation X and Generation Y when searching for
different products on search engines?
1.4 Delimitations
Although there are several search engines available for the internet users, the investigation is
limited to the search engine Google due to its dominant market position. Due to that the
collection of data will be performed through observations and interviews, the study comprises
potential online customers based in Norrbotten County, Sweden.
5
2. Theoretical Review
The Theoretical Review chapter presents the relevant theories that are used to answer the
research questions of the thesis. Initially, the term search behavior is explained. Followed by a
presentation of search engines, search engine users and search engine marketing including
search engine optimization and search engine advertising. Henceforth, the chapter comprises
a description of the long tail phenomenon. The chapter is concluded by a presentation of the
frame of reference.
2.1 Search behavior
To better understand human information behavior four definitions are needed. Information
Behavior comprises the entire spectrum of human behavior towards information while
Information Seeking Behavior is the sequence of the need in finding specific information
(Wilson, 2000). Information Searching Behavior, on the other hand, includes all the individual
interactions with various types of information systems, both intellectual and psychical, whilst
Information Use Behavior is the individual capabilities to incorporate new information (Wilson,
2000). According to Kuhlthau (1991) information seeking is “viewed as a process of sense-
making in which a person is forming a personal point of view” (p.361), meaning that the process
is dependent on both cognitive and physical aspects.
The technology development, and the introduction of online search engines, has resulted in new
patterns of information seeking behavior in different generations. The phenomenon clarifies the
gap of knowledge within the area as need of knowledge of the search engines, as well as the
people using them, has increased. As the thesis includes the search behavior on search engines,
the chapter hereinafter presents theory of search behavior connected to search engines.
2.2 Search engines
According to Gandal (2001) societies are deeply changed due to the development of the internet
and the huge amount of information which is available on the internet. Because the large amount
of information, search engines facilitates the internet users by sorting all the information and
making it easily available (Gandal, 2001). Search engine is according to Berman & Katona
(2013) “a website that provides searching results as a service to its visitors: they enter queries
(search phrases) into a search form and the SE returns a k number of results for this query
displaying them in an ordered list” (p.8). According to Bump (December 15, 2014), for example

6
Google and Yahoo have been top 5 most used websites since 2002, which means that people
use a significant amount of time finding information through search engines. In addition to the
large amount of time spent on search engine usage, Jansen & Molina (2006) suggests that the
amount of internet users who use different search engines as a starting point is over 80%.
Because the Ecommerce is growing, being available on online channels can be essential for
commercial organization´s success (Jansen & Molina, 2006). The popularity of using search
engines, and the growing Ecommerce, indicates that it is important to invest in search engine
marketing to “stand out”, referred to Spiteri (2000) which suggests that “The success of online
shopping sites, however, is dependent upon a more basic assumption; namely, that consumers
can actually find relevant sites on the Web” (p.173). Because the study is limited to Google,
figure 1 presented below demonstrates the layout of the search engine Google.
Figure 1: Google
Source: https://www.google.se
Search engines give the users two types of result when searching with keyword, these two are
the “organic” result and “sponsored” result (Berman & Katona 2013; Ghose & Yang, 2009;
Jerath, Ma & Park, 2014). Organic result are the links below adds. Google has further divided
the sponsored links into two categories, which are called sponsored ads and Google Adwords
(Google support, 2018). Sponsored ads are ads of products based on the current search word
7
and the visit on other webpages (Google support, 2018). Google Adwords are Google’s tool to
advertise with sponsored links, these links appear at the top of the page with little add symbol
(Mediaplanering i Sverige AB, 2018). Marketing tools which affect these lists is further
discussed in sections 2.3.1 Search engine optimization and 2.3.2 Search engine advertising.
2.2.1 Search Engine Users
According to Jerath et al., (2014) there are two types of search engine users, high-involvement
and low-involvement buyers, which rely on different searches. The buyers who are high-
involved seems to use less popular keywords and have a greater percentage of clicks than the
low-involvement buyers, who performs less clicks but uses popular keywords (Jerath et al.,
2014). The keyword-type appears to affect the consumer search behavior as the search engine
users who use the more popular keywords are more eager to click on a link from the organic
search result. The less popular keyword-users, on the other hand, seems to click on the ads
(Jerath et al., 2014). Baye, De los Santos & Wildenbeest (2016) further indicates that wealthy
or old consumers clicks on a link from the organic result rather on a paid ad. Additionally, the
searching consumers which are using less words, as well as brand names in their searches also
click on an organic link. (Baye et al., 2016)
2.3 Search Engine Marketing
Due to that finding information from internet has become most popular through search engines,
Search Engine Marketing (abbreviated SEM), has become the dominated online advertising
form (Berman & Katona, 2013). According to Sen (2015) marketing on search engines can be
performed with different tools such as banner advertisement related to used keywords, paid
submission for regular updates, search engine optimization and paid placements (sponsored
search). As already discussed in chapter 1, the thesis focuses on marketing through search
engine optimization, SEO and search engine advertising, SEA, which are further explained in
the sections below.
2.3.1 Search Engine Optimization
SEO is a tool companies can use to improve their websites positions on the organic list by
improving the matching for the consumers and trying to affect the search engine’s quality
ranking process. The organic list ranks the different web pages based on their relevance to
search query (Berman & Katona 2013). According to Cheng-Jye et al., (2016) it is crucial to

8
place high on the ranking list to attract internet users to a website. The reason for this is that
several studies show that the majority of search engine users click on the first page websites
and the number of users clicking websites placed on fourth page or beyond that decreases
rapidly (Cheng-Jye et al., 2016). Consumers are more likely to click on a link from the organic
search rather than on a paid ad (Jerath et al., 2014; Baye et al., 2016), which may, according to
Berman & Katona (2013), depend on that consumers considers the organic links to be more
trustworthy. SEO contain according to Cheng-Jye et al., (2016) two different techniques: on-
page optimization and off-page optimization. On-page optimization include the web page
optimization by using keywords in the title, URL and snippets when off-page optimization
requires “building backlinks on other well-reputed websites and thus boosting domain-level
and page-level authority” (Cheng-Jye et al., 2016, p.240).
2.3.2 Search Engine Advertising
SEA is becoming the largest source of revenue for the company Google. SEA, also called
sponsored search advertising, is a promotion tool where the companies and organizations ad is
displayed on the search engines for a fee (Ghose & Yang, 2009). When companies want to
promote their products or services through search engine advertising, list of relevant keywords,
that the company want to bid, need to submit to the search engine. Every time when internet
user performs a search on search engine, firms which are competing with that specific keyword
make a bid (Ghose & Yang, 2009). The company with the highest bid value is placed at the top
of the list. The keywords themselves and the bidding doesn’t cost anything for the company if
no one clicks the link. Only when the user clicks the link and visit the website, the advertiser
will pay the assigned price (Ghose & Yang, 2009). Like mention in chapter 1 this pricing
method is called pay-per-click (PPC) or cost-per-click (CPC) (Ghose & Yang, 2009; Joshi &
Motwani 2006). Due to that the ad will be shown only when the right keywords are search, the
advertiser will reach a more targeted audience instead of the whole mass (Ghose & Yang, 2009).
As mentioned earlier, Google AdWords is Google’s tool to handle advertisements on Google.
Google AdWords works with the same principle as described above. Advertiser creates an ad,
select the wanted keywords, set a budget and pay only when someone clicks the ad. The most
bidding ads will be displayed above the organic search result (Google AdWords, 2018). The
thesis will assess Google Adwords and the sponsored links equivalent. Because advertisers of
companies select the relevant keywords, it is crucial to be aware of the cost, and therefore,
important to know of the long tail phenomenon.
9
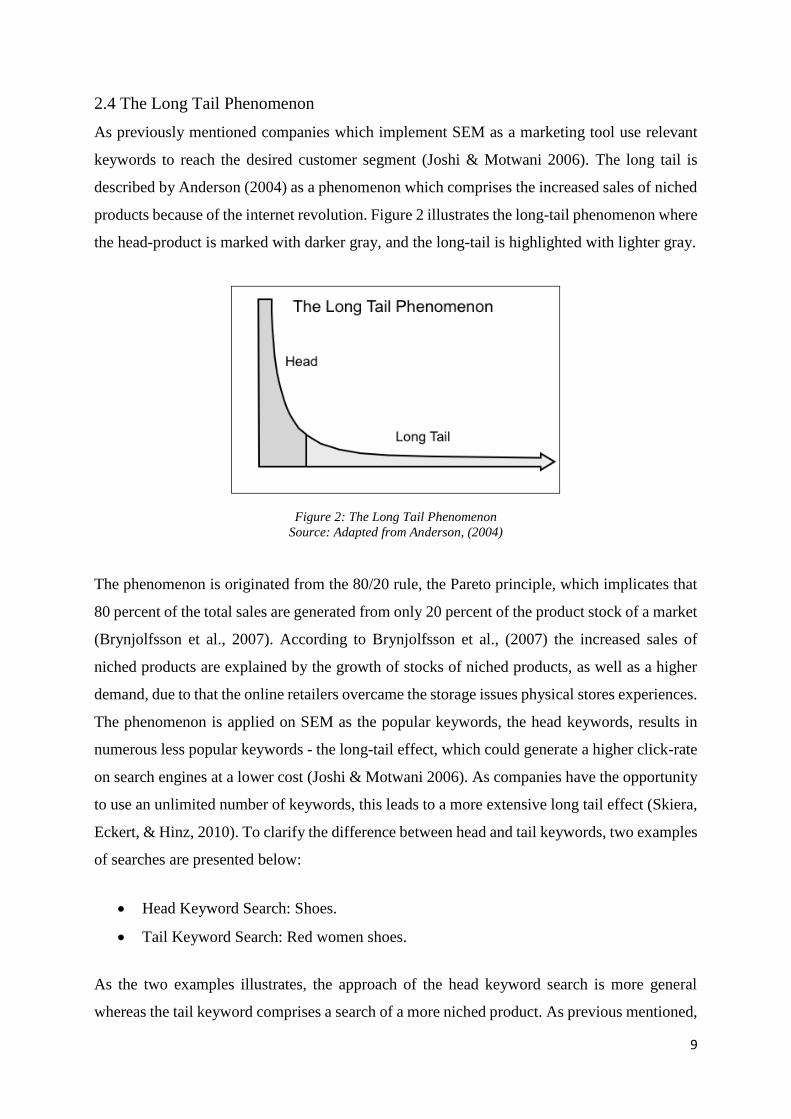
2.4 The Long Tail Phenomenon
As previously mentioned companies which implement SEM as a marketing tool use relevant
keywords to reach the desired customer segment (Joshi & Motwani 2006). The long tail is
described by Anderson (2004) as a phenomenon which comprises the increased sales of niched
products because of the internet revolution. Figure 2 illustrates the long-tail phenomenon where
the head-product is marked with darker gray, and the long-tail is highlighted with lighter gray.
Figure 2: The Long Tail Phenomenon
Source: Adapted from Anderson, (2004)
The phenomenon is originated from the 80/20 rule, the Pareto principle, which implicates that
80 percent of the total sales are generated from only 20 percent of the product stock of a market
(Brynjolfsson et al., 2007). According to Brynjolfsson et al., (2007) the increased sales of
niched products are explained by the growth of stocks of niched products, as well as a higher
demand, due to that the online retailers overcame the storage issues physical stores experiences.
The phenomenon is applied on SEM as the popular keywords, the head keywords, results in
numerous less popular keywords - the long-tail effect, which could generate a higher click-rate
on search engines at a lower cost (Joshi & Motwani 2006). As companies have the opportunity
to use an unlimited number of keywords, this leads to a more extensive long tail effect (Skiera,
Eckert, & Hinz, 2010). To clarify the difference between head and tail keywords, two examples
of searches are presented below:
• Head Keyword Search: Shoes.
• Tail Keyword Search: Red women shoes.
As the two examples illustrates, the approach of the head keyword search is more general
whereas the tail keyword comprises a search of a more niched product. As previous mentioned,

10
different keywords are used in both SEA and SEO, where the head keywords are more
expensive than the tail keywords, making it crucial for companies to contemplate which type
of keywords to use when designing the SEM strategy (Joshi & Motwani 2006).
2.5 Frame of Reference
The main theories presented in the introduction and theory sections are used to answer the
research problem; How does the search behavior differs between the two SEM tools, SEO and
SEA? The research problem is thereafter derived to the research questions of the thesis,
presented below:
RQ1: How does the click rate differ in searches of high and low involvement products?
RQ2: How does the click rate differ between the two age groups, Generation X and Generation
Y?
RQ3: Which types of keywords are used in searches of high and low involvement products?
RQ4: Which types of keywords are used by Generation X and Generation Y when searching for
different products on search engines?
Figures 3 and 4 illustrates the frame of reference which is conducted in the process of the thesis.
The frame of reference is divided into two figures in order to clarify the investigation of search
behavior depending on the degree of product involvement, as well as the generational
differences.
Figure 3: The Frame of Reference – The Degree of Product Involvement

11
Figure 4: The Frame of Reference - Generation X and Y
As previously discussed, due to that finding information from the internet has become most
popular through search engines, SEM has become the dominant advertising form (Berman &
Katona, 2013). Companies are now devoting a large portion of their online marketing budget
on SEM in order to reach the consumers using search engines (Shih et al., 2013). To reach the
potential customers, companies and marketing agencies among others need to be aware of the
customer’s search behavior, thus, their use of keywords, their click behavior of SEO and SEA,
eventual patterns etcetera (Jerath, Ma, & Park, 2014). The lack of numerous studies of eventual
differences in the search behavior between the two types of SEM-strategies, resulting in the
presented research problem (RP).
SEM comprises SEA and SEO, which are two dissimilar marketing tools that are being more
frequently used by companies in order to reach suitable consumers (Shih et al., 2013). These
tools are used to improve the positioning in the two results, organic and sponsored results
(Berman & Katona 2013; Ghose & Yang, 2009; Jerath, Ma & Park, 2014). The reason for
improving the positioning is that several studies show that the majority of search engine users
click on the first page websites, and the number of users clicking on websites placed on the
fourth page or beyond decreases rapidly (Cheng-Jye et al., 2016). In order to be placed as high
as possible after a search, companies need to choose the right keywords (Joshi & Motwani,
2006). To manage to choose the most appropriate keywords, companies can take advantage of
the long-tail phenomenon, which, when applied to SEM, refers to the effect of popular

12
keywords and linked less popular keywords which could generate higher click rate at a lower
cost (Joshi & Motwani 2006).
In order to answer if the degree of product involvement affects the search behavior, the degree
of product involvement needs to be defined. As previously presented, there are two types of
search engine users, high-involvement and low-involvement buyers, which display different
search behaviors (Jerath et al., 2014). According to Jerath et al., (2014) the buyers who are
high-involved seems to use less popular keywords and click on the ads whereas the low-
involvement buyers seems to use popular key and are more eager to click on a link from the
organic search result. The thesis covers if the statement is in accordance with the search
behavior in Norrbotten, Sweden and therefore leads to the first and third research questions
(RQ1 & RQ3).
In addition to the degree of product involvement, the next studied factor within the thesis is
generation. The generations included in the thesis are Generation X and Generation Y.
According to Statista (2018) the internet use among a younger generation and an older
generation is almost the same. Even if the amount of usage is almost the same, Reisenwitz &
Iyer (2009) suggests that Generation Y handles technology more effectively than Generation
X due to that they are the first generation using technology since childhood. However, the
data does not explain behavioral differences between the age groups. The gap of knowledge
creates the need of an investigation of eventual behavioral differences between generations, in
order for companies to know which of the two presented strategies, SEA or SEO, is the most
suitable. The lack of knowledge leads to the second research question (RQ2). Baye et al.,
(2016) indicates that old consumers click on links from the organic result rather on a paid ad.
However, valid information regarding the use of different keywords within the different
generations is also missing. This leads to a gap of knowledge of which keywords are the best
to use in different areas of business, resulting in the fourth research question (RQ4).

13
3. Methodology
The chapter presents the choice of method which were used to answer the research questions.
Initially, the purpose and the approach of the research are presented. Followed by the literature
search, the explanation of the experimental vignette methodology and Its ten steps. The chapter
ends with the analysis of the validity and reliability of the thesis.
3.1 Research Purpose
There are three different types of research: Explanatory, descriptive and exploratory which is
defined by the purpose of the research. An explanatory research is applicable when the purpose
of the study is to analyze complex causal relationships, whilst a descriptive research comprises
the description of a phenomenon or situation. The exploratory type of research is performed
when the outcome of the study is unclear. (Yin, 2003) The purpose of the research is both
explanatory and descriptive. Explanatory due to that the purpose of the thesis is to study
potential causal relationships between the generations and search engine marketing.
Additionally, the thesis is explanatory due to the use of the experimental vignette methodology.
The study is descriptive due to that the study will describe relevant phenomenon within the
subject.
3.2 Research Approach
There are two research approaches available, qualitative and quantitative. A qualitative research
approach is suitable when the collected data is non-numeric and when a deeper understanding
of the investigated phenomenon is requested. The research approach is often covered by in-
depth interviews of chosen interviewees. A quantitative research approach is, on the other hand,
advantageously used when the data are numeric and when the data is to be compared between
different groups. (David & Sutton, 2016)
As previously described the purpose of the thesis is to investigate which SEM strategy is the
most suitable for companies in different markets. To be able to answer the derived research
questions a quantitative approach is appropriate, due to the need of numeric data of for example
the click rates between SEO and SEA. The gathered data is additionally qualitative due to the
capture observed search of the use of keywords (head/long tail) which the test subjects uses
when searching for different products at Google.
14
3.3 Literature Search
All the presented theories and the data included in the introduction and the theoretical review
are secondary data. Secondary data is data which someone else has originally gathered but that
is later reused for another purpose (Hox & Boeije, 2005). The theories and data are gathered
from different scientific articles and literatures, and to collect relevant theories, Google Scholar
and Business Source Premier (LTU) is the most widely used database. To be able to find
relevant articles and theories following keywords are used:
- Search Engines
- Search Engine Marketing (SEM)
- Search Engine Advertising (SEA)
- Search Engine Optimization (SEO)
- Generation Y and X
- Search Behavior
- Long-tail Keywords
3.4 Experimental Vignette Methodology
Primary data are original data collected for a specific purpose (Hox & Boeije, 2005). To answer
the presented research questions primary data must be collected. The Experimental Vignette
Methodology (abbreviated EVM), is a method to gather the data. According to Aguinis &
Bradley (2014) in EVM studies, the participants will receive and perform carefully formulated,
realistic scenarios in order for the researcher to assess different variables such as behavior,
intention and attitude. When planning and using the EVM method the researcher has to go
through three steps, illustrated in figure 5. These three steps also include ten different decisions,
which are presented in figure 5 below (Aguinis & Bradley, 2014).

15
Figure 5: Summary of The Experimental Vignette Methodology
Source: Aguinis & Bradley, (2014)
Step 1 consist of the planning of the study to maximize internal and external validity and
includes the decision points 1-6.
1. Deciding whether EVM is a suitable approach.
2. Choosing the type of EVM.
3. Choosing the type of research design.
4. Choosing the level of immersion.
5. Specifying the number and levels of the manipulated factors.
6. Choosing the number of vignettes.
Step 2, implementation consist of determine how, where and when the data will be gathered
and includes the decision points 7-9.
7. Specifying the sample and number of participants.
8. Choosing the setting and timing for administration.

16
9. Choosing the best method for analyzing the data.
The last step and decision point is about reporting the result.
10. Choosing how transparent to be in the final presentation of results and methodology.
(Aguinis & Bradley, 2014)
3.4.1 Step 1 – Planning
Decision 1, Deciding whether EVM is a suitable approach:
The decision to choose the EVM method is done due to that the participants are asked
individually to perform searches for the purchase of different types of products on Google. The
EVM is also chosen due to the opportunity for the researchers to have more control over the
study by being able to include the relevant factors and exclude the factors that might distract
the result (Aguinis & Bradley, 2014).
Decision 2, Choosing the type of EVM:
According to Aguinis & Bradley, (2014) there are two different types of EVM which are Paper
people studies and Policy capturing and conjoint analysis studies. A study which comprises an
investigation of the outcomes of hypothetical scenarios is called a paper people study and is
well-used in different areas of research. A policy capturing and conjoint analysis study, on the
other hand, includes an analysis of a set of decisions of hypothetical scenarios. Thus, the
participants must choose one alternative among different variables. (Aguinis & Bradley, 2014)
As the thesis comprises the investigation where the test subjects are asked to respond to a set
of hypotheses, a paper people study is accurate. The method contributes to an explicit result
where generational search behaviors can be studied and analyzed.
Below, the structure of the observations of the test subjects is presented in order for others to
conduct further research based on the applied method. Before the observations are initiated
following markings has been noticed.
• Material: Laptop - Chrome (Incognito) - Google (Unused)
• Data Collection: Observation - Notes

17
• Language: Swedish - Translated to English
• Individual observations to reduce the risk of impact.
The conducted observations are commenced by the noting of the test age group inherence and
gender of the test subject.
1. Age group (X/Y)
2. Gender
Followed by the registrations of age group inherence and gender the researcher reads the
instructions of the observation presented below.
Instructions read to the test subjects:
"You will get a total of four different purchase scenarios by me. The purpose of these is that
you, by the use of the search engine Google, search for the desired product and follow the link
you consider delivering the best. Be careful in your choices as the choices you make are
registered and cannot be changed."
Thereafter, the researcher reads the four vignettes, one by one, in dissimilar order to avoid
sequence bias. All four vignettes are structured the same except the changing factors – shoes,
car, mobile charger, sofa, in order for the results to be analyzed correctly.
Vignette/scenario presented to the test subjects:
“You have just received your salary and feels that you want to treat yourself. During a long
period, you have noticed that you need a (changing factor), and since you now have the
economic opportunity, you start the process of finding the product you are looking for.”
All keyword used in the searches for different products are noted and recorded, as well as the
choice to either click on a paid ad (SEA) or on a link from the organic search result (SEO).
Additionally, the researchers note from which page number the test subjects chose the links.
The observation of the search behavior of the test subject is completed after all of the four
vignettes are accomplished and registered.

18
Decision 3, Choosing the type of research design:
According to Atzmüller & Steiner, (2010) there are three different design types to choose from,
which are 1) within-person, 2) between-person and 3) mixed research design. The meaning of
the study determines the research design (Aguinis & Bradley, 2014; Atzmüller & Steiner,
2010). In order to compare the different vignettes within one person, within-person design is
most appropriate. Within-person design means that all the participants respond to the same
vignettes. When the researcher wants to compare the different respondents, between-person
design is most useful due to that every participant responds only one vignette. The last design,
mixed research consists of participants divided to different groups where each group respond
to different vignettes. (Atzmüller & Steiner, 2010) However, due to that participants within
each group respond to the same vignettes, researchers can also compare the results between the
participants (Aguinis & Bradley, 2014).
The thesis includes a within-person and a between-person design. The study consists of within-
person design in the data-collection process due to that each of the sixty participants receives
the same vignettes to respond to. This in order to be able to compare how the search behavior
differ among the different vignettes (high-involvement and low-involvement products). But, to
be able to compare the different participants (Generation X and Generation Y) the thesis
additionally consists of the between-person design in the data-analysis process. Despite that the
theory, according to Atzmüller & Steiner (2010), indicates that a between-person design only
includes one vignette, it can be applicable if the entire search behavior generally is assumed to
be the vignette.
Decision 4, Choosing the level of immersion:
The forth decision includes the study´s level of immersion, which comprises the improving of
the validity by include more realism in the introductory part of the observation. Researchers
can manage this by arranging the setting as natural as possible by for example implementing
digital tools such as video, audio, pictures among other things. (Aguinis & Bradley, 2014)
According to Aguinis & Bradley, (2014) the use of video vignettes is beneficial in several
aspects but are only included in less than 6 percent of all studies. Benefits gained are, for
example, enhanced realism and thereafter an increased validity of the study. (Aguinis &
Bradley, 2014)

19
As the investigation of the thesis is conducted by a restricted time limit, as well as a tight budget,
the study only includes a written and spoken vignette. Despite that there is a lack of a lavish
vignette the study took place in natural settings due to that the test subjects used a laptop and
the search engine Google, which are a common and natural situation.
Decision 5, Specifying the number and levels of the manipulated factors:
When planning an EVM study, the theory determines the factors that are relevant to the research
problem and for each manipulated variable the amount of needed levels. Especially when the
study is complex, there is a risk of excluding important variables, due to that the EVM requires
that variables and levels are prespecified. (Aguinis & Bradley, 2014) The attribute-driven
design and the “actual derived cases”-approach are two different ways in selecting the variables.
The attribute-driven design is effective when researchers investigates the effects of different
factors as the included factors have a similar approach, whereas the “actual derived cases”-
approach are used in order to gain generalized result by the use of variables which are
representing real-life settings.
The thesis includes the attribute-driven design due to that the four different tasks performed by
the test subjects are formulated and designed similar, but all include one dissimilar and
manipulated factor.
Decision 6, Choosing the number of vignettes:
It is important that the study includes enough of vignettes in order to create a proper balance of
information sharing (Weber, 1992). According to Aguinis & Bradley, (2014) a collection of
vignettes should initially be created, followed by the selection of the correct number of
vignettes. The thesis comprises four different vignettes with similar design and approach. The
vignettes include dissimilar factors; the purchase of a pair of shoes, the purchase of a car, the
purchase of a mobile charger and the purchase of a sofa.
3.4.2 Step 2 – Implementation
Decision 7, Specifying the sample and number of participants:
When choosing the sample and the number of participants responding to the study, it is
important that the sample is big enough to be able to generalize the outcome to a larger
population. Additionally, for the respondents to not be artificial, the respondents should be
familiar with the presented situation. (Aguinis & Bradley, 2014) Due to the time limit, the
20
scenarios are performed by the selection of 30 test subjects included in Generation X and 30
test subjects of Generation Y. Followed by the selection of the test group, the test subjects
obtained four scenarios/tasks which were accomplished by using a computer and Google. In
order to reduce the possibility that the respondents would be artificial, the chosen test subjects
had to be familiar with the search engine Google. During the observations, the observer wrote
down the result, which afterwards were collected and analyzed.
There are several options available to determine the population of the thesis. It is the purpose
of the study which determines the definition of the population, and whether there is a need for
a sample, a test group (David & Sutton, 2016). The population of the thesis includes the
inhabitants of Norrbotten County included in Generation X and Generation Y. Due to the
extensive population, there is appropriate to select a proper sample. When selecting the sample,
it is important to avoid that the test group is distorted, an avoidance of that different groups in
the sample are not under- or overrepresented. (David & Sutton, 2016) Therefore, the gender
distribution in the test group is evenly distributed. The widely spread population, all internet
users in Norrbotten County included in Generation X and Generation Y, as well as the time
restrictions made it appropriate to determine a non-probability sample using a convenience
sampling method. According to Marshall, (1996) convenience sample is the least time and
money consuming sampling method due to that it includes selecting test subjects who are most
accessible.
Decision 8, Choosing the setting and timing for administration:
To increase the validity, researchers need to ensure that the results are not affected by the
conditions participants have when responding (Aguinis & Bradley, 2014). According to
Aguinis & Bradley, (2014) it is important that the respondents performs the experiment in their
natural settings such as environment, otherwise the EVM study might not be realistic. In
addition to environment, timing is important. Each participant should respond to the vignettes
in one session to reduce the possibility that the results will be affected by, for example, search
history (Aguinis & Bradley, 2014). Because the respondents only needed a computer to
complete the four tasks, the researchers considered that the location is not an important factor.
However, the test objects were observed individually, and all the four tasks were performed in
one session in order to reduce the ability that the clicking decision of the test subjects would be
affected by others. Additionally, to reduce the risk of the participants being affected by the
search history all the searches made at Google were performed incognito.
21
Decision 9, Choosing the best method for analyzing the data:
Followed by the collection of relevant information, an analysis of the data is required. (David
& Sutton, 2016) According to Aguinis & Bradley, (2014) there are different methods in order
to analyze the data. The choice of method depends on the design of the study. When a between-
person design is conducted when analyzing the data, the MANOVA, ANOVA and ANCOVA
techniques are the most suitable to apply. When analyzing the collected data of the thesis, the
ANOVA technique was used.
Due to that the thesis includes both qualitative data and quantitative data there are different
approaches of analysis. According to Miles and Huberman (1994) a qualitative data analysis
consists of three steps - data reduction, data display and conclusion drawing. The data reduction
comprises the transcription of the collected data which simplifies the following data analysis
process. The data display includes the organization of the data making the determination of
conclusions easier. The final step covers the conclusion drawings where the eventual patterns,
differences, among other things, are determined (Miles and Huberman, 1994).
The gathered qualitative data was initially transcribed in two different ways. The qualitative
data, which is the keywords used in the searches, were categorized both as head or tail keywords
and as product or brand keywords. Followed by the categorization of each keyword, these were
transformed from qualitative data to quantitative data based on the category. In order to easier
draw conclusions, each keyword was assigned a value of 0 or 1 depending which category it
belonged to. Lastly eventual patterns, similarities and differences were defined in order to make
the conclusions.
Followed by the transcription of the qualitative data the collected quantitative data was added
to be able to initiate the data analysis. The data analysis was performed by the use of the
statistical software SPSS where the ANOVA technique is available. By the use of repeated
measures ANOVA different relations and the statistical significance of the data were analyzed,
resulting in the knowledge of whether the results occurred by coincidence or not.
3.4.3 Step 3 – Reporting of Results
Decision 10, Choosing how transparent to be in the final presentation of results and
methodology:

22
In order for others to be able to contribute with further research in the same area, it is important
that the researchers explain the vignettes used in the study, as precisely as possible. By having
the used vignettes available, future researchers have a source they can exploit when expanding
the theory. The used vignettes turn also more validated by providing further data. (Aguinis &
Bradley, 2014) In order for other researchers to benefit from the thesis when conducting further
research, the model of how the observed scenarios is performed, the results and the result of the
analysis, is included in the appendix. In the following section a framework of the structure of
the observations is presented.
3.6 Validity & Reliability
Validity and reliability comprises if the collected data is trustworthy or not. (David & Sutton,
2016). The sections below include the descriptions important factors which all results in the
improvement of the validity and reliability of the thesis.
3.6.1 Credibility
Aguinis & Bradley, (2014) discusses in the article different ways to improve internal and
external validity when using experimental vignette methodology. Due to that experimental
vignette methodology enable researchers to control and manipulate the variables and improve
experimental realism, increase it both external and internal validity (Aguinis & Bradley, 2014).
To increase validity even more Aguinis & Bradley, (2014) indicates that improving the level of
realism in the scenarios, external validity will enhance. To increase the validity in the thesis,
four regular products has been chosen, in order to make the scenarios as realistic as possible.
Aguinis & Bradley, (2014) also discusses that vignettes should be done in one session in order
to increase the validity, due to that the validity may be negatively affected if multiple sessions
is used. Sessions may be affected for example by history if multiple sessions are required, which
can decrease the validity (Aguinis & Bradley, 2014). The researchers have taken into account
this and all test subjects have responded to vignettes in one session.
3.1.2 Ethical consideration
According to David & Sutton (2016) it is crucial to have an ethical approach when conducting
research with people involved. An ethical approach includes the counteract of plagiarism,
forgery, fabrication, among other things, which includes fraud of the origin of the data, as well
as, manipulation of data. The ethical approach also includes anonymity, confidentiality and

23
integrity protection of the participated test subjects. (David & Sutton, 2016) When conducting
the thesis all the factors mentioned above are considered. In order to, for example, counteract
against plagiarism appropriate references according to the APA-guidelines are used. Another
act to apply an ethical approach is the anonymity of all the test subjects, as well as the valuation
of protecting their integrity.

24
4. Data Result
The chapter includes a presentation of the data gathered through the observations. The first
section presents the data results of search behavior, followed by the generational search
behavior. The chapter is concluded with an explication of the significance level of the data
results.
4.1 Search Behavior
The result of the data collection, whether the test subject choose sponsored (SEA) or organic
(SEO) links depending on the used keyword during the four different purchase scenarios, is
presented on tables 1, 2, 3 and 4 below. In order to analyze the collected data each choice of
SEA is coded as 0, while each choice of SEO is coded as 1. As previously mentioned in the
methodology chapter, in order to transform the qualitative data to quantitative data, all the used
keywords were categorized either as a head or tail before the analysis. Words in the head
category consists of words which are general in the specific areas such as shoes, car, mobile
charger and sofa, and are coded as the value of 1 when conducting the data analysis. The tail
keywords are searches of niched products or brand names such as Care of Carl men’s shoes,
buy new car, mobile charger iPhone 6 and sofa Andrew velvet, and are coded as the value of 0
in the data analysis. The results in tables 1, 2, 3 and 4 are all statically significant according to
table 7. The result of the scenario 1 is presented in table 1.
Table 1: Shoes - Low Involvement, Head or Tail Search & SEM
The table indicates that tail keywords were in total used by 51 test subjects while head keywords
were used by 9 test subjects. The result further shows that the test subjects who used tail
keyword in their searches clicked 18 times on the sponsored links, and 33 clicked on the organic
links. The test subjects who used head keywords in their searches, on the other hand, performed

25
4 respectively 5 clicks on the sponsored and organic links. Table 2 presents the result of scenario
2.
Table 2: Cars - High Involvement, Head or Tail Search & SEM
As shown in the table, during the scenario only 3 out of 60 test subjects used head keywords.
The result of the gathered data also indicates that all of the test subjects who used head keywords
chose the organic links, and of those who used tail keywords 48 chose the organic links whereas
only 9 chose the sponsored links. The result of scenario 3 is illustrated in table 3.
Table 3: Mobile Charger - Low Involvement, Head or Tail Search & SEM
As the table indicates, 50 test subjects searched with tail keywords and 10 test subjects searched
with head keywords. The result also shows that the test subjects who used tail keywords 20
chose the sponsored links and 30 chose the organic links while the test subjects who used head
keywords 3 chose the sponsored links and 7 chose the organic links. Table 4 present the result
of the scenario 4.

26
Table 4: Sofa - High Involvement, Head or Tail Search & SEM
As shown in the table, of the 60 test subjects, 47 used tail keywords and 13 head keywords. The
result also indicates that those who searched with tail keywords, 15 chose the sponsored and 32
chose the organic links. The test subjects who searched with head keywords, 5 respectively 8
chose the sponsored and the organic links.
The collected data presented in table 5 indicates that it is in general more common for the
potential online consumers to use keywords which are connected to a brand instead of a specific
product. When conducting the data analysis included in table 5 all keywords categorized as
brands are coded as 1, whilst keywords that are not connected to specific brands are coded as
the value of 0. In total, customers use brands as keywords 142 times of all the searches, whereas
they only use product related keywords in 98 searches. The result further shows that when
customers use brands as keywords links from the organic results are chosen before paid ads,
whereas when customers use product keywords the choice of SEM is evenly distributed.
Table 5: Brand or Product & SEM
4.2 Generational Search Behavior
The result of the collected data, illustrated in table 6, indicates that there are some generational
differences in the use of keywords when searching for high and low involvement products.

27
However, as shown in table 7, the results are statically insignificant meaning the result may
have occurred by coincidence.
Table 6: Generational Search Behavior
Scenario 1 which comprises the task of searching for shoes, a low involvement product, shows
that Generation X only uses head keywords 10 percent of all searches whereas the members of
Generation Y uses head keywords 20 percent. The result of Scenario 2, on the other hand, which
covers the search of a high involvement product, a car, indicates that only 3 percent of all
searches made by Generation X includes head keywords. Generation Y only uses head
keywords 7 percent of all searches of a car. Scenario 3, including the investigation of searches
made for a mobile charger, a low involvement product, shows that Generation X uses head
keywords 23 percent of all searches whereas the members of Generation Y only uses head
keywords 10 percent when searching of a mobile charger. The result of scenario 4 which
comprises the task of searching for a sofa, a high involvement product, indicates that head
keywords are used 17 percent of all searches by Generation X. Generation Y, on the contrary,
uses head keywords 27 percent of all searches of a sofa.
This means that Generation X uses tail keywords 90 percent of all searches whereas the
members of Generation Y use tail keywords 80 percent in Scenario 1. The result of Scenario 2,
on the other hand, indicates that 97 percent of all searches made by Generation X includes tail
keywords. Generation Y uses tail keywords 93 percent of all searches of a car. The result of
Scenario 3 shows that Generation X uses tail keywords 77 percent of all searches whereas the
members of Generation Y uses tail keywords 90 percent when searching of a mobile charger.
The result of Scenario 4 indicates that tail keywords are used 83 percent of all searches by
Generation X. Generation Y, on the contrary, uses tail keywords 73 percent of all searches of a
sofa.
28
Table 6 further presents the statically insignificant result of generational differences in click
behavior when searching for high and low involvement products. The result of Scenario 1
shows that Generation Y clicks on links of the organic search result 73 percent of all searches,
whereas only 53 percent of the members of Generation X clicks on the organic result. Minimal
generational differences are shown in Scenario 2 as the click rate of the organic result among
Generation Y is 87 percent and the click rate of Generation X is 83 percent. Scenario 3
additionally indicates some generational differences as Generation Y and Generation X clicks
on the organic result 67 percent and 57 percent respectively. Similar results as in Scenario 2 are
shown in Scenario 4 where the click rate of Generation Y is 70 percent and the click rate among
Generation X is resembling 63 percent.
This means that Generation Y clicks on paid ads 27 percent of all searches, whereas 47 percent
of the members of Generation X clicks on paid ads in Scenario 1. Minimal generational
differences are shown in Scenario 2 as the click rate of sponsored links among Generation Y is
13 percent and the click rate of Generation X is 17 percent. Scenario 3 additionally indicates
some generational differences as Generation Y and Generation X clicks on paid ads 33 percent
and 43 percent respectively. Similar results as in Scenario 2 are shown in Scenario 4 where the
click rate of Generation Y is 30 percent and the click rate among Generation X is resembling
37 percent.
4.3 Significance of the data results
The previous sections of data results show the search behavior of the test subjects participated
in the thesis. In order for the test results to be reliable, the significance of the collected data has
been analyzed by a set of methods. Table 7 illustrates the summary of the significance of
different variables, and combinations of variables measured by multivariate tests, tests of
within-subjects effects, tests of within-subjects contrasts and tests of between-subjects effects.
The complete test results are available in Appendix 2, 3, 4 and 5.

29
Table 7: Significance of The Data Results
The different variables, and combinations of variables are significant if the value indicates 0,05
or less. In table 7 above, the significant values are colored red and circled. As the value of
Involvement is 0,000 the result is classified as significant, while the combination of
Involvement and Age indicates an insignificant outcome due to the value of 0,447. The results
of the variables Head_or_tail and SE, as well as the combinations of Head_or_tail and Age, and
SE and Age, shows insignificance results as the values exceeds 0,05. However, the tests of the
mix of the factors Involvement and Head_or_tail comprises significant results due to the value
of 0,003, meaning there is a two-way interaction between the two factors. The significant results
are transformed into insignificant ones (0,729), when adding the factor Age to the mix.
Additionally, the combination of Involvement and SE shows a significant value, 0,010,
resulting in a two-way interaction. Followed by the significant result, an insignificant value
occurs as a result of the addition of the factor Age. Table 7 further illustrates insignificant results
when combining the factors of Head_or_tail and SE, as well as, Head_or_tail, SE and Age due
to the excessing values. The mix of Involvement, Head_or_tail and SE, on the other hand,
comprises the value of 0,026 resulting in a significant outcome which indicates that it is a three-
way interaction between the three factors. As in previous combinations, the addition of the
variable Age implies an insignificant result due to that the value increases to 0,549. In Appendix
6 the statistically significance of the factor brand is presented.

30
5. Data Analysis
The chapter consists of an analysis and discussion of the presented theory and the collected
data. The initiating section includes the general click behavior of online customers, followed
by subsections of the click rate depending on degree on product involvement and age.
Thereafter, the general keyword usage among potential customers are presented, followed by
the subsections of keyword usage depending on degree of product involvement and age.
5.1 Search Behavior - Click Rate
Several studies show that the majority of search engine users click on websites presented on the
first page (Cheng-Jye et al., 2016). The statement is in accordance with the result of the
collected data which indicates that less than 1 percent of all online consumers using Google
clicks on other pages than the first. As previously mentioned consumers are more likely to click
on a link from the organic search result rather than on a paid ad (Jerath et al., 2014; Baye et al.,
2016). The phenomenon is in accordance with the thesis as the data result, illustrated in table
8, implies that potential online consumers in general clicks on organic links in a higher degree.
Table 8: General Click Rate
5.1.1 Degree of Product Involvement
In order to answer RQ1: How does the click rate differ in searches of high and low
involvement products?, the gathered data is analyzed by a comparison with previous studies
and theories.
As the investigation comprises the analysis of search behavior in different types of markets,
the dissimilar markets are divided after specific goods which are categorized as high and low
involvement products. Table 9 illustrates the relationship between degree of involvement and
the click rate of SEM.

31
Table 9: Involvement & SEM
The table shows the statistically significant result which indicates that potential online
consumers clicks on paid ads more frequently when the product involvement is low rather than
if they search for a high-involvement product. The meaning of the two-way interaction is that
the factors has a mutual influence – if one of the factors changes, the other is affected.
5.1.2 Generational Driven Click Rate
To be able to answer RQ2: How does the click rate differ between the two age groups,
Generation X and Generation Y?, the gathered data is analyzed by a comparison with previous
theories and studies.
According to Baye et al., (2016) patterns exist which indicates that there are differences
between generations where the older consumers choses links from the organic search result in
a greater occurrence than the younger generation. The statement does not correspond with the
result of the gathered data, presented in table 10, which suggests the contrary.
Table 10: Generational Click Behavior
However, due to that the generational data of the thesis illustrated in table 10, as well as analyses
of certain age groups made by Baye et al., (2016) are not continuously statistically significant,
the actual outcome is unclear. The opposite results might depend on diverse age ranges within
the two different studies. As previously stated, the result of the collected data of generational
click behavior is not statistically significant, meaning the result may be occurred by
coincidence. The result may have been significant with other definitions of Generation X and
Generation Y.

32
Additionally, the statistically significant result of the relationship between degree of
involvement and the click rate of SEM, presented in table 9, turn insignificant when the factor
age is added to the analysis. This means that generational differences between Generation X
and Generation Y cannot be validated.
Nevertheless, Reisenwitz & Iyer (2009) implies that the different generations handle
technology with different efficiency due to that Generation Y, unlike Generation X, grew-up
with technology. However, the statement does not explain if there are generational differences
in search behavior which enables that there are other factors that could affect the click behavior
of potential consumers, such as by the choice of keywords.
5.2 Search Behavior - Keyword Usage
The long-tail phenomenon applied on SEM results in that the main keywords, the head-
keywords, results in numerous more niched keywords - the long-tail effect (Joshi & Motwani
2006). As the phenomenon creates an opportunity for companies to choose relevant keywords
used in the SEM strategy it is crucial to be aware of to what extend consumers uses head and
tail keywords. Table 11 illustrates the result of the general use of either head or tail keywords.
Table 11: Head or Tail Keyword
The result indicates that tail keywords are applied in a greater extent than head keywords,
meaning that potential consumers are more likely to search for niched products. But, the
phenomenon may have occurred by coincidence because, as table 7 presents, the factor Head
or Tail is statically insignificant.
Baye et al., (2016) states that searching consumers using brand names in their searches, clicks
at organic links. Table 5, presented in the previous chapter, illustrates the extended use of brands
as keywords, which is in accordance with the theory due to that the data shows a distinct trend
of the SEO click behavior. The result indicates that the potential online customers in Norrbotten
County in a high degree searches for specific brands when searching for different types of
products. A reason for the high frequency of clicks on organic links is that companies usually

33
do not demand certain keywords which are linked to specific brands, such as Blocket and MIO.
The phenomenon results in that companies usually do not invest in SEA linked to keywords
connected to brands, leading to a solely organic search result. This in return leads to that
potential online customers are forced to choose organic links even though the natural choice
could have been a paid ad.
5.2.1 Degree of Product Involvement
In order to answer RQ3: Which types of keywords are used in searches of high and low
involvement products?, the gathered data is analyzed by a comparison with previous studies
and theories and is presented below.
As the click behavior of customers may be affected by other factors, the investigation comprises
the study of behavioral differences of purchases categorized as high and low involvement
products. According to Jerath et al., (2014) the buyers who are high-involved seems to use tail
keywords more often than the low-involvement buyers, who mainly uses head keywords. Table
12 illustrates the statistically significant relationship between the choice of either a head or a
tail keyword and the degree of involvement of the products.
Table 12: Involvement & Head or Tail Keyword
The presented result suggests that the high-involved buyers are slightly more eager to use tail
keywords than the buyers which are low-involved. The theory further implies that the low-
involvement buyers mainly uses head keywords which contradicts the collected data. However,
the data suggests that the buyers which are low-involved uses head keywords more frequently
than the high-involvement consumers which is in accordance with previous research. As the
data is statistically significant there is a two-way interaction of the relationship between the
choice of either a head or a tail keyword and the degree of involvement of the products. This
suggests that if one of the factors changes, the other is affected.
Furthermore, Jerath et al., (2014) states that the keyword-type appears to affect the consumer
search behavior as the search engine users who use the head keywords are more eager to click

34
on a link from the organic search result. The tail keyword-users, on the other hand, seem to
click on the paid ads. Table 13 illustrates a combination of the results presented in chapter 4,
tables 1-4.
Table 13: Involvement - Head or Tail & SEM
The results are partly in accordance with the previous theory as the collected data shows that
the potential online customers who uses head keywords are more frequently clicks on a link
from the organic search result. The customers who, on the other hand, use tail keywords are not
more likely to click on a paid ad as the theory suggests. However, the result indicates that
customers using tail keywords does click on paid ads in a higher frequency than head keyword
users. The presented and analyzed three-way interaction between the factors are statistically
significant, meaning the trends does not occur by coincidence. Thus, the three-way interaction
implies that the degree of involvement and the use of either a head or tail keyword affects the
choice of SEM.
5.1.2 Generational Driven Keyword Usage
To be able to answer RQ4: Which types of keywords are used by Generation X and Generation
Y when searching for different products on search engines?, the gathered data is analyzed by a
comparison with previous studies and theories and is presented below.
Table 14 presents the result when adding the factor age, Generation X and Generation Y, into
the analysis of the factors degree of product involvement and head or tail keywords.

35
Table 14: Age - Head or Tail & Involvement
The statistically insignificant result indicates that there are no consistent patterns which
suggests that there are generational differences in the choice of either head or tail keywords
depending on degree of involvement.
Additionally, the three-way interaction which implies that the degree of involvement and the
use of either a head or tail keyword affects the choice of SEM (presented in table 13), turn
insignificant as the Generations X and Y are added to the analysis. This, as explained in the
previous paragraph, means that there are no generational differences between Generation X and
Generation Y which can be validated.

36
6. Findings and Conclusions
The chapter comprises the findings and conclusions of the thesis. The chapter includes the
conclusions of search behavior, generational search behavior and implications, as well as the
recommendations for practitioners, theory and further research. The chapter ends with a
presentation of the limitations of the thesis.
6.1 Search Behavior
Referred to the chapters comprising the data result and data analysis the research questions,
RQ1: How does the click rate differ in searches of high and low involvement products? and
RQ3: Which types of keywords are used in searches of high and low involvement products?,
are answered.
The thesis initially confirms the theory which implies that most of all customers using search
engines, just over 99 percent, clicks on the first page of Google. Additionally, the result of the
thesis is in accordance with the theory as potential online consumers in general clicks on organic
links in a higher degree than on paid ads. Furthermore, the study indicates that potential online
consumers clicks on paid ads more frequently when the product involvement is low rather than
if the search comprises a high-involvement product.
The result of the thesis further shows that tail keywords are applied in a greater extent than head
keywords, meaning that potential consumers are more likely to search for niched products.
Furthermore, the analysis indicates that the high-involved buyers are slightly more eager to use
tail keywords than the buyers which are low-involved. The data further suggests that the buyers
which are low-involved uses head keywords more frequently than the high-involvement
consumers which is in accordance with previous research. Moreover, the collected data shows
that the potential online customers who use head keywords more frequently, click on a link
from the organic search result, and that customers using tail keywords do click on paid ads in
higher frequency than head keyword users. The finding is a three-way interaction which implies
that the degree of involvement and the use of either a head or tail keyword affects the choice of
SEM.
Additionally, the data result indicates that the potential online customers in Norrbotten County
use brands as keywords more frequently than keywords linked to specific products. The finding

37
suggests that the customers in general searches for known brands when purchasing products
online and does already know where to find the demanded goods. The data further implies that
the customers using brands as keywords are more likely to click on an organic link, which is in
accordance with Baye et al., (2016). As discussed in chapter 5 the phenomenon may occur due
that companies usually do not demand certain keywords which are linked to specific brands of
competitors. Likewise, companies do not bid on keywords directly connected to their own brand
because the companies know that the customers who searches for a specific brand already
demands the products of the brand. Therefore, in searches including brands as keywords the
search result often lacks paid ads, which in return increases the customer click rate of SEO. The
thesis further suggests that less known brands are in more need of comprehensive SEM
strategies than the well-established, and strong brands whose products already are demanded
by online customer.
The result may have been affected by the categorization of head and tail keywords as the brands
used by the test subjects are categorized as tail keywords. The brands are categorized as tail
keywords due to that the searches are estimated as searches for niched products. However,
because the categorization is an interpretation another definition may have shown different data
results.
6.2 Generational Search Behavior
Referred to the chapters comprising the data result and data analysis the research questions,
RQ2: How does the click rate differ between the two age groups, Generation X and Generation
Y? and RQ4: Which types of keywords are used by Generation X and Generation Y when
searching for different products on search engines?, are answered.
As the factor age is added to the different analyses presented above, to investigate whether there
are any generational differences between Generation X and Generation Y, the results turn
statistically insignificant. Thus, despite that the thesis identifies some generational trends in the
click rate and keyword usage between Generation X and Generation Y, the result cannot be
guaranteed. The insignificant results may be affected by several factors presented below:
1. The large number of clicks on links from the organic search results are affected by the
fact that many of the potential online customers using specific brand as keywords when

38
searching for a certain product. As previous mentioned Baye et al., (2016) states that
the customers searching for brands are more likely to click on organic links. The number
of clicks at organic links increases due to that companies usually do not publish paid
ads on keywords connected directly to it as the customers already are searching and
demanding the products of the specific companies.
2. The result may also have been affected by the categorization of head and tail keywords
as the brands used by the test subjects are categorized as tail keywords. The
categorization is an interpretation which may be incorrect resulting in insignificant data
analyzes when adding the factor age.
3. The definitions of Generation X and Generation Y may have been an essential factor
which have distort the result of the thesis. As the generational differences in click
behavior are statically insignificant, the result may be occurred by coincidence. The
statistically insignificant result may depend on that Generation X is defined as those
who are born before 1980 and, Generation Y covers those born between 1980 and 1995.
Other, broader, definitions could have shown significant results of differences between
the two generations.
4. The sample size of the investigation of the thesis may have affected the result. When
conducting research, it is difficult to, in advance, predict a correct number of
participants. Therefore, a larger sample size could entail generational results which are
statistically significant.
5. Additionally, the definitions of the high and low involvement products used in the
observations of the thesis may have influenced the investigation. The result may have
been influenced because the thesis defines the low involvement products as shoes and a
mobile charger, and the high involvement products as a car and a sofa despite that the
that the level of involvement is dependent on the individual buyer. Other definitions of
the products could have resulted in statistically significant results of generational
differences.
6.3 Implications/Recommendations
The thesis comprises the investigation of search behavior at Google. The conclusions of the
study have resulted in implications and recommendations for practitioners, theory and further
research which are presented below. Note that these implications and recommendations are

39
based on the result of the study which may be inaccurate due to previous presented potential
errors.
6.3.1 Implications for Practitioners
The collected data and the associated analyses forms a statement of how marketing agencies
and companies can, in order to reach the desired customer segments, form the SEM-strategies.
The list below contains several implications and recommendations for practitioners.
• In order for potential online customers to find a specific company, the company should
make sure that it is visible at the first page of the Google search result as more than 99
percent of all customers clicks at links from the first page.
• Another implication and recommendation are that companies may prioritize to invest in
SEO instead of SEA as customers in general clicks at organic links in a higher degree
than on paid ads.
• Marketing agencies and companies should take in to consideration if the offered
products are classified as a high or a low involvement product. This because the study
indicates that consumers clicks at paid ads more frequently when the product
involvement is low, and that customers rather click on the organic result when the
product involvement is high.
• Marketing agencies and companies should in general select tail keywords when
composing the SEM-strategy. However, tail keywords are more effective when the
product is of high-involvement, and the other way around.
• Another implication and recommendation for practitioners is to not restructure the
SEM-strategy depending on generation because the thesis does not include any
statistically significant generational differences in search behavior.
• Marketing agencies and companies should further take in to consideration that less
known brands are in more need of comprehensive SEM strategies than the well-
established, and strong brands. Thus, companies which lacks brand awareness among
customers should invest in marketing efforts which enhances brand knowledge. This
because customers often search for specific brands when purchasing products online.
• The implication presented above further suggests that companies that are well known
and established in different markets are not in need of comprehensive SEM strategies
due to that potential online customers already demands the products of the brands.

40
6.3.2 Implications for Theory
The intention of the final thesis was to investigate search behavior, as well as eventual
generational differences at the search engine Google, in Norrbotten County, Sweden. The
number of researches within the area of search behavior, and generational differences on search
engines are limited. Therefore, the thesis contributes with increased knowledge, and data to the
area of SEM referred to the presented finding when conducting the data analysis. The results
show the importance of that companies should customize the SEM strategies depending on the
degree of product involvement and the brand knowledge. The results further show insignificant
results when implementing the factor age into the analyzes meaning the eventual generational
differences cannot be validated. As previously discussed there are several factors which may
be taken into consideration when interpret the data as those may have led to inaccurate data
results.
6.3.3 Implications for Further Research
It is of great interest to further investigate in the area due to the ongoing expansion of search
engine usage, in order to verify if the findings of the thesis are accurate. The following markings
are implications for further research.
• Arrange a similar investigation but adjust the definitions of Generation X and
Generation Y, alternatively investigate eventual differences in other age groups.
• Arrange a similar investigation but include other definitions of the high and low
involvement products.
• Arrange the same investigation but categorize brands as head keywords instead of tail
keywords.
• Arrange the same investigation but categorize the choices of brands as an own factor so
that the choice of either SEO and SEA is measured accurate.
• Arrange the same investigation but include a larger sample size.
6.4 Limitations
The limitations of the thesis are in a high degree connected to limitations in time and
monetary resources. Therefore, the test subjects participated in the observations are chosen
according to the convenience sampling method resulting in the observations are performed by
selecting easily available test subjects. Additionally, the sample size of the thesis is 60
participants, 30 test subjects included in Generation X and 30 test subjects of Generation Y.

41
References
Aguinis, H., & Bradley, K. J. (2014). Best practice recommendations for designing and
implementing experimental vignette methodology studies. Organizational Research Methods,
17(4), 351-371. Doi: 10.1177/1094428114547952
Anderson, C. (2004). The Long Tail. Wired Magazine, 10(12), 170–177.
Andreas, M. R. (2003). Validity and reliability tests in case study research: a literature review
with “hands-on” applications for each research phase. Qualitative Market Research: An
International Journal, 6(2), 75-86. Doi: 10.1108/13522750310470055
Atzmüller, C., & Steiner, P. M. (2010). Experimental vignette studies in survey research.
Methodology: European Journal of Research Methods for the Behavioral and Social
Sciences, 6(3), 128-138. Doi: 10.1027/1614-2241/a000014
Baye, M. R., De los Santos, B., & Wildenbeest, M. R. (2016). Search engine optimization:
What drives organic traffic to retail sites?. Journal of Economics & Management Strategy,
25(1), 6-31. Doi: 10.1111/jems.12141
Berman, R., & Katona, Z. (2013). The role of search engine optimization in search marketing.
Marketing Science, 32(4), 644-651. Doi: 10.1287/mksc.2013.0783
Brynjolfsson, E., Hu, Y., & Simester, D. (2011). Goodbye pareto principle, hello long tail:
The effect of search costs on the concentration of product sales. Management Science, 57(8),
1373-1386. Doi: 10.1287/mnsc.1110.1371
Bump, P. (2014, 15 December). From Lycos to Ask Jeeves to Facebook: Tracking the 20
most popular websites every year since 1996. The Washington Post. Accessed 3 April, 2018,
from https://www.washingtonpost.com/news/the-intersect/wp/2014/12/15/from-lycos-to-ask-
jeeves-to-facebook-tracking-the-20-most-popular-web-sites-every-year-since-1996
Cheng-Jye, L., Sheng-An, Y., & Ting-Li, D. H. (2016). Estimating Google’s search engine
ranking function from a search engine optimization perspective. Online Information Review,
40(2), 239-255. Doi: 10.1108/OIR-04-2015-0112
Chitica. (2013). The Value of Google Result Positioning. Accessed 13 April, 2018, from
https://chitika.com/2013/06/07/the-value-of-google-result-positioning-2/

42
Chris, A. (Updated 2018). Top 10 Search Engines In The World. Accessed 3 April, 2018,
from Reliablesoft.net https://www.reliablesoft.net/top-10-search-engines-in-the-world/
David, M., & Sutton, D C. (2016). Samhällsvetenskaplig Metod. Lund: Studentlitteratur AB.
Gandal, N. (2001). The dynamics of competition in the internet search engine market.
International Journal of Industrial Organization, 19(7), 1103-1117. Doi: 10.1016/S0167-
7187(01)00065-0
Ghose, A., & Yang, S. (2009). An empirical analysis of search engine advertising: Sponsored
search in electronic markets. Management Science, 55(10), 1605-1622. Doi:
10.1287/mnsc.1090.1054
Google. (2018). Accessed 12 April, 2018, from https://www.google.se
Google Adwords. (2018). Accessed 15 April, 2018, from
https://adwords.google.com/home/how-it-works/
Google Support. (2018). Accessed 12 April, 2018, from
https://support.google.com/ads/answer/1697735
Hox, J. J., & Boeije, H. R. (2005). Data collection, primary versus secondary. Encyclopedia of
Social Measurement. 1, 593-599.
Internet Live Stats. (2018). Accessed 3 April, 2018, from http://www.internetlivestats.com
Jansen, B. J., & Molina, P. R. (2006). The effectiveness of Web search engines for retrieving
relevant ecommerce links. Information Processing & Management, 42(4), 1075-1098. Doi:
10.1016/j.ipm.2005.09.003
Jerath, K., Ma, L., & Park, Y. H. (2014). Consumer click behavior at a search engine: The
role of keyword popularity. Journal of Marketing Research, 51(4), 480-486. Doi:
10.1509/jmr.13.0099
Joshi, A., & Motwani, R. (2006). Keyword Generation for Search Engine Advertising. In
Proc. of the 6th IEEE International Conference on Data Mining, 490–498. Doi:
10.1109/ICDMW.2006.104

43
Kuhlthau, C. C. (1991). Inside the search process: information seeking from the user’s
perspective. Journal of the American Society for Information Science, 42(5), 361-375.
Marshall, M. N. (1996). Sampling for qualitative research. Family practice, 13(6), 522-526.
Doi: 10.1093/fampra/13.6.522
Mediaplanering i Sverige AB. (2018). AdWords - Sponsrade länkar. Accessed 12 April, 2018,
from https://www.mediaplanering.se/sponsrade-
lankar/https://www.mediaplanering.se/sponsrade-lankar/
Miles, M. B., & Huberman, M. A. (1994). An Expanded sourcebook: Qualitative Data
analysis
(2nd ed). Thousand Oaks: Sage Publications Inc.
Net Marketshare. (2018). Search Engine Market Share from 2017-04 to 2018-03. Accessed 3
April, 2018, from https://netmarketshare.com/search-engine-market-share
Reisenwitz, H. T., & Iyer, R. (2009). Differences in Generation X and Generation Y:
Implications for the organization and marketers. Marketing Management Journal, 19(2), 91-
103.
Sen, R. (2005). Optimal search engine marketing strategy. International Journal of Electronic
Commerce, 10(1), 9-25.
Shih, B. Y., Chen, C. Y., & Chen, Z. S. (2013). Retracted: an empirical study of an internet
marketing strategy for search engine optimization. Human Factors and Ergonomics in
Manufacturing & Service Industries, 23(6), 528-540. Doi: 10.1002/hfm.20348
Skiera, B., Eckert, J., Hinz, O. (2010). An analysis of the importance of the long tail in search
engine marketing. Electronic Commerce Research and Applications, 9(6), 488-494. Doi:
10.1016/j.elerap.2010.05.001
Sorce, P., Perotti, V., & Widrick, S. (2005). Attitude and age differences in online buying.
International Journal of Retail & Distribution Management, 33(2), 122-132. Doi:
10.1108/09590550510581458

44
Spiteri, L. F. (2000). Access to electronic commerce sites on the World Wide Web: an
analysis of the effectiveness of six Internet search engines. Journal of information science,
26(3), 173-183. Doi: 10.1177/016555150002600307
Statista. (2018). Age distribution of internet users worldwide 2017. Accessed 3 April, 2018,
from https://www.statista.com/statistics/272365/age-distribution-of-internet-users-worldwide/
University of Minnesota. (2015). Principles of Marketing. University of Minnesota Libraries
Publishing edition.
Weber, J. (1992). Scenarios in business ethics research: A review, critical assessment, and
recommendations. Business Ethics Quarterly, 77, 137-160. Doi: 10.2307/3857568
Wilson, T. D. (2000). Human information behavior. Informing Science, 3(2), 49-56.
Yin, R. K. (2003). Case study research: Design and methods (3rd ed.). Thousand Oaks, CA:
Sage.
Zhitomirsky-Geffet, M., & Blau, M. (2017). Cross-generational analysis of information
seeking behavior of smartphone users. Aslib Journal of Information Management, 69(6), 721-
739. Doi: 10.1108/AJIM-04-2017-0083

45
Appendix 1: EVM
Experimentell Vinjett Metod (svensk version)
Material: Laptop - Google (oanvänd) - Chrome (Inkognito)
Datainsamling: Observation - Anteckningar
Språk: Svenska - Översatt till Engelska
Individuella observationer för att minska risk för påverkan.
1. Åldersgrupp (X/Y)
2. Kön
“Du kommer att få totalt fyra olika köpscenarion av mig. Syftet med dessa är att du ska genom
sökmotorn Google leta efter den önskade produkten och följa den länk du anser leverera bäst.
Var noggrann i dina val då det val du gör registreras och går ej att ändra.”
Vinjett/scenario (1): Du har precis fått lön och känner att du vill unna dig. Du har under en
längre period märkt att du är i behov av att köpa ett par skor, och eftersom du nu har ekonomisk
möjlighet inleder du processen med att hitta den produkt du söker.
Vinjett/scenario (2): Du har precis fått lön och känner att du vill unna dig. Du har under en
längre period märkt att du är i behov av att köpa en bil, och eftersom du nu har ekonomisk
möjlighet inleder du processen med att hitta den produkt du söker.
Vinjett/scenario (3): Du har precis fått lön och känner att du vill unna dig. Du har under en
längre period märkt att du är i behov av att köpa en mobil laddare, och eftersom du nu har
ekonomisk möjlighet inleder du processen med att hitta den produkt du söker.
Vinjett/scenario (4): Du har precis fått lön och känner att du vill unna dig. Du har under en
längre period märkt att du är i behov av att köpa en soffa, och eftersom du nu har ekonomisk
möjlighet inleder du processen med att hitta den produkt du söker.
1. Keywords
2. Adwords/SEO
3. Ranking (Adwords/SEO)

46
OBS! Kom ihåg att ställa frågorna slumpmässigt.
Experimental vignette methodology (English version)
Material: Laptop - Google (Unused) - Chrome (Inkognito)
Data Collection: Observation - Notes
Language: Swedish - Translated to English
Individual observations to reduce the risk of impact.
1. Age group (X/Y)
2. Gender
"You will get a total of four different purchase scenarios by me. The purpose of these is that
you, by the use of the search engine Google, search for the desired product and follow the link
you consider delivering the best. Be careful in your choices as the choices you make are
registered and cannot be changed."
Vignette/scenario (1): You have just received your salary and feels that you want to treat
yourself. During a long period, you have noticed that you need a pair of shoes, and since you
now have the economic opportunity, you start the process of finding the product you are looking
for.
Vignette/scenario (2): You have just received your salary and feels that you want to treat
yourself. During a long period, you have noticed that you need a car, and since you now have
the economic opportunity, you start the process of finding the product you are looking for.
Vignette/scenario (3): You have just received your salary and feels that you want to treat
yourself. During a long period, you have noticed that you need a mobile charger, and since you
now have the economic opportunity, you start the process of finding the product you are looking
for.

47
Vignette/scenario (4): You have just received your salary and feels that you want to treat
yourself. During a long period, you have noticed that you need a sofa, and since you now have
the economic opportunity, you start the process of finding the product you are looking for.
1. Keywords
2. Adwords/SEO
3. Ranking (Adwords/SEO)
NOTE! Remember to ask the questions randomly.

48
Appendix 2: Multivariate Tests ^a

49
Appendix 3: Tests of Within-Subjects Effects

50

51

52

53
Appendix 4: Tests of Within-Subjects Contrasts

54

55
Appendix 5: Tests of Between-Subjects Effects

56
Appendix 6: Multivariate Tests ^a

57
Appendix 7: Data Collected Through Observations
Age: 1-Generation X, 0-Generation Y
Keyword: 1-Head, 0-Tail – 1-Brand, 0-Product
SEM: 1-SEO, 0-SEA

58