Embed Size (px)
Citation preview
Cisco Internet Business Solutions Group (IBSG) Cisco IBSG © 2012 Cisco and/or its affiliates. All rights reserved. 12/12
White Paper
Streaming Under the Clouds Solutions for Multiscreen Video Delivery
Authors David Parsons Christopher Reberger Thomas Renger William Gerhardt
December 2012

Cisco IBSG © 2012 Cisco and/or its affiliates. All rights reserved. Page 2
White Paper
Streaming Under the Clouds Solutions for Multiscreen Video Delivery
Introduction In summer 2012, a record 4.8 billion people1 watched at least part of the London Olympics, and many of them maintained a round-the-clock video vigil. Unshackled from the broadcast TV schedule, viewers tuned in using a wide variety of devices—anywhere and anytime—for up-to-the-minute results as their national athletes competed with the world’s best. It is prob-ably no coincidence that 2012 also marked the first time that online viewing surpassed traditional viewing. This was part of an overall shift toward connected devices, with the fastest-growing category being smartphones and tablets.
These developments underscore how online video is growing at a rapid—if not explosive—pace, with innovation and disruption spreading across all areas of the value chain, More-over, some of the greatest innovation is currently occurring around multiscreen delivery and related services. This is being driven by strong consumer demand and a big push from content owners, content aggregators, service providers, broadcasters, and consumer-electronics manufacturers.
Solutions for multiscreen video, however, remain extremely disparate. This is related to quickly changing consumer behavior, fragmented market structures, and the existing asset base of service providers. As a result, video solutions range across a variety of consumption devices, and further vary according to region, operating company, and market.
The challenge lies in creating compelling and efficient multiscreen offers, especially consid-ering the many combinations of devices, networks, service platforms, and content offers both inside and outside consumers’ homes. This drives an important question for each player in the video ecosystem: Which control points or solution elements of the customer experience must be owned by the solution provider, and which must be provided by others?
This paper will identify the key service control points and compare options for acquiring them, particularly home-screen and mobile-analytics integration. It will also show whether the requirements—and therefore the underlying video solutions—are homogeneous (common among markets) or heterogeneous (differing among markets); see Figure 1.
Another key goal is to explain how an underlying cloud architecture can provide both increased economies of scale for homogeneous environments (through centralization based on “cloudification”), as well as access to scale economies and related volume discounts in heterogeneous environments. In these cases, the advantages can be significant, not only in terms of indirect benefits such as improved business agility and accelerated service creation cycles, but also through direct benefits. These could include 1 BBC, 2012, http://www.statista.com/statistics/236692/total-number-of-tv-viewers-of-olympic-summer-games-worldwide/

Cisco IBSG © 2012 Cisco and/or its affiliates. All rights reserved. Page 3
White Paper
potential cost reductions of 13 percent to 36 percent when compared with traditional video architectures and deployment models.
Many of the insights in this paper are based on the findings of a survey conducted by the Cisco® Internet Business Solutions Group (IBSG) in March 2012. Cisco IBSG surveyed 1,152 U.S. broadband consumers between the ages of 13 and 75+ to gain a better understanding of how they watch video: their habits, preferences, and the devices they use.2
Figure 1. Market and Video Solution Variants.
Source: Cisco IBSG, 2012
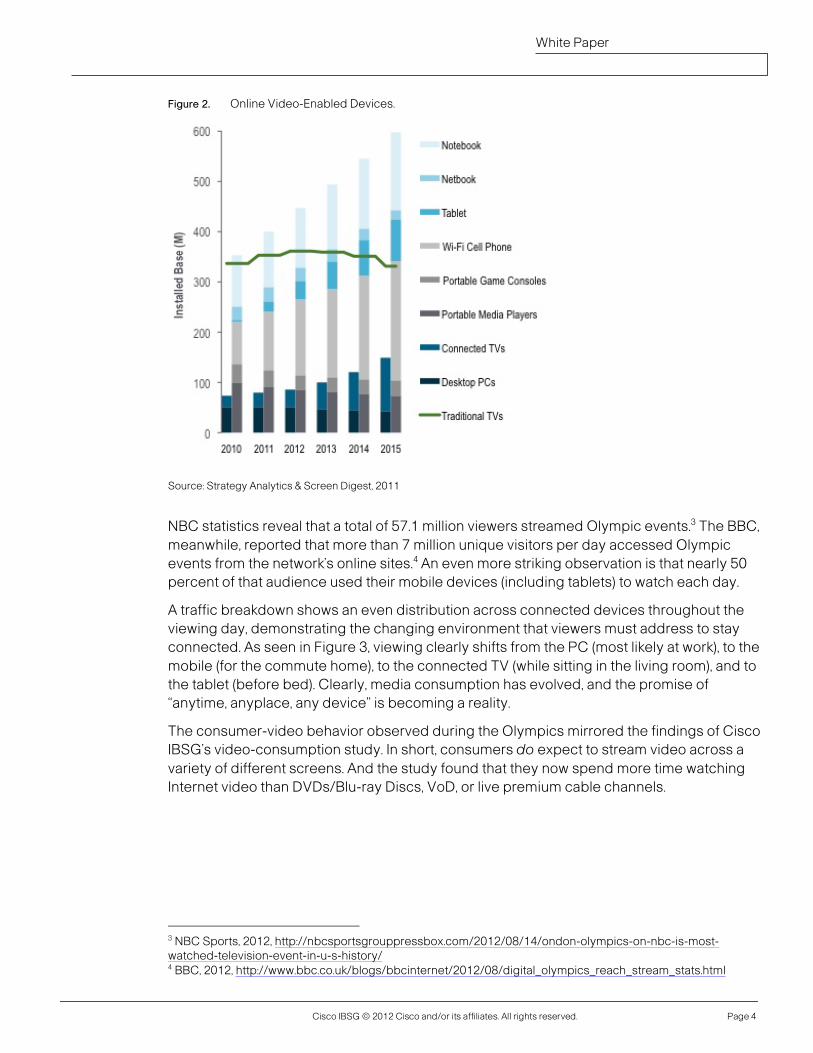
Growing Multiscreen Demand There has been considerable media interest around the growth of multiscreen, particularly considering the forecast for an explosive proliferation of video-capable devices. Recent reports emphasize that across Western Europe, significant growth is expected for both fixed-line connected devices (connected TVs, game consoles, PCs) and portable devices (such as smartphones, tablets, portable games, and consoles); see Figure 2.
This is notable, but to get a true gauge of the interest in multiscreen, service providers need to understand the extent to which people are using these devices to consume, for example, streaming video. One good place to start is the aforementioned 2012 Olympics. Consumer behavior during that event, as underscored by Cisco’s primary research and third-party analysis, strongly indicated the importance of streaming video.
2 “It Came to Me in a Stream: The Upward Arc of Online Video, Driven by Consumers,” Cisco IBSG, 2012.
Cisco IBSG © 2012 Cisco and/or its affiliates. All rights reserved. Page 4
White Paper
Figure 2. Online Video-Enabled Devices.
Source: Strategy Analytics & Screen Digest, 2011
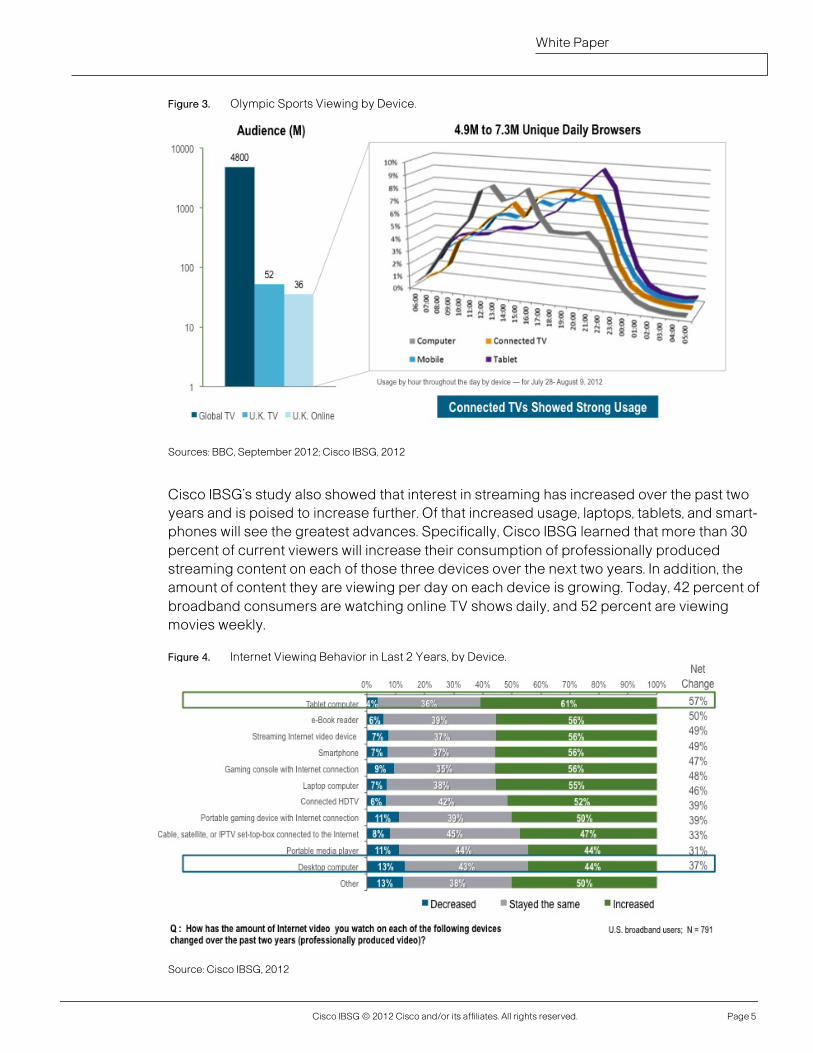
NBC statistics reveal that a total of 57.1 million viewers streamed Olympic events.3 The BBC, meanwhile, reported that more than 7 million unique visitors per day accessed Olympic events from the network’s online sites.4 An even more striking observation is that nearly 50 percent of that audience used their mobile devices (including tablets) to watch each day.
A traffic breakdown shows an even distribution across connected devices throughout the viewing day, demonstrating the changing environment that viewers must address to stay connected. As seen in Figure 3, viewing clearly shifts from the PC (most likely at work), to the mobile (for the commute home), to the connected TV (while sitting in the living room), and to the tablet (before bed). Clearly, media consumption has evolved, and the promise of “anytime, anyplace, any device” is becoming a reality.
The consumer-video behavior observed during the Olympics mirrored the findings of Cisco IBSG’s video-consumption study. In short, consumers do expect to stream video across a variety of different screens. And the study found that they now spend more time watching Internet video than DVDs/Blu-ray Discs, VoD, or live premium cable channels.
3 NBC Sports, 2012, http://nbcsportsgrouppressbox.com/2012/08/14/ondon-olympics-on-nbc-is-most-watched-television-event-in-u-s-history/ 4 BBC, 2012, http://www.bbc.co.uk/blogs/bbcinternet/2012/08/digital_olympics_reach_stream_stats.html
Cisco IBSG © 2012 Cisco and/or its affiliates. All rights reserved. Page 5
White Paper
Figure 3. Olympic Sports Viewing by Device.
Sources: BBC, September 2012; Cisco IBSG, 2012
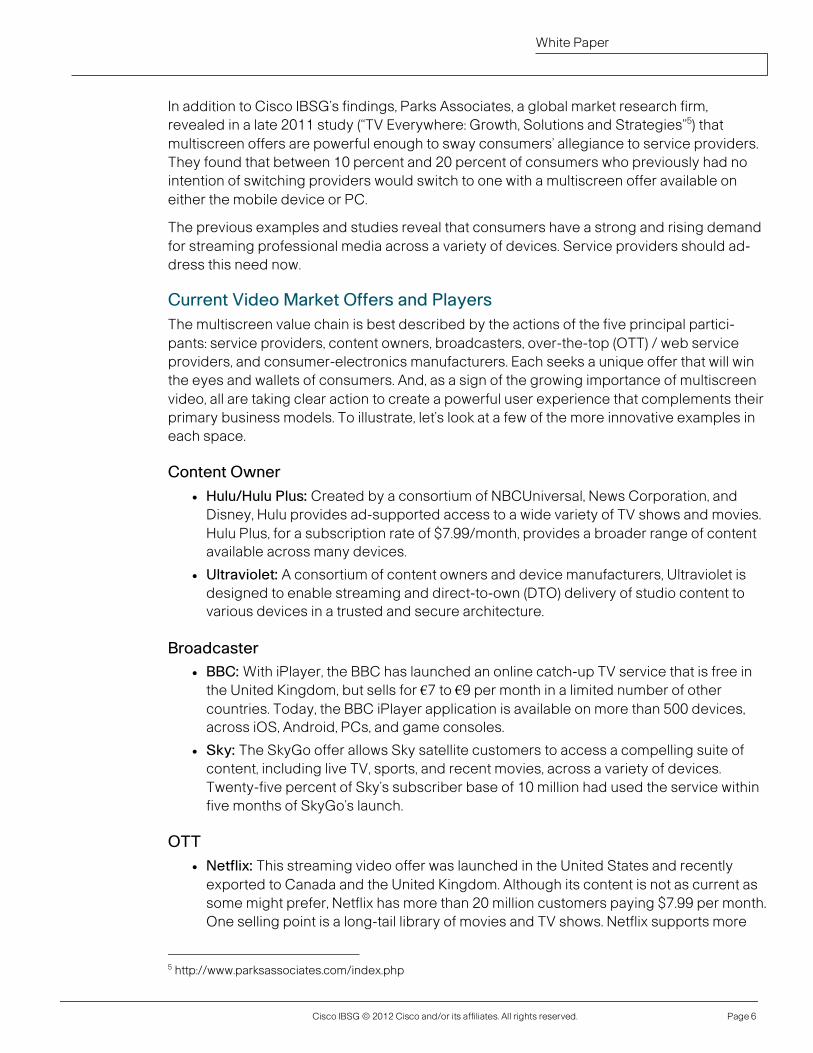
Cisco IBSG’s study also showed that interest in streaming has increased over the past two years and is poised to increase further. Of that increased usage, laptops, tablets, and smart-phones will see the greatest advances. Specifically, Cisco IBSG learned that more than 30 percent of current viewers will increase their consumption of professionally produced streaming content on each of those three devices over the next two years. In addition, the amount of content they are viewing per day on each device is growing. Today, 42 percent of broadband consumers are watching online TV shows daily, and 52 percent are viewing movies weekly.
Figure 4. Internet Viewing Behavior in Last 2 Years, by Device.
Source: Cisco IBSG, 2012
Cisco IBSG © 2012 Cisco and/or its affiliates. All rights reserved. Page 6
White Paper
In addition to Cisco IBSG’s findings, Parks Associates, a global market research firm, revealed in a late 2011 study (“TV Everywhere: Growth, Solutions and Strategies”5) that multiscreen offers are powerful enough to sway consumers’ allegiance to service providers. They found that between 10 percent and 20 percent of consumers who previously had no intention of switching providers would switch to one with a multiscreen offer available on either the mobile device or PC.
The previous examples and studies reveal that consumers have a strong and rising demand for streaming professional media across a variety of devices. Service providers should ad-dress this need now.
Current Video Market Offers and Players The multiscreen value chain is best described by the actions of the five principal partici-pants: service providers, content owners, broadcasters, over-the-top (OTT) / web service providers, and consumer-electronics manufacturers. Each seeks a unique offer that will win the eyes and wallets of consumers. And, as a sign of the growing importance of multiscreen video, all are taking clear action to create a powerful user experience that complements their primary business models. To illustrate, let’s look at a few of the more innovative examples in each space.
Content Owner ● Hulu/Hulu Plus: Created by a consortium of NBCUniversal, News Corporation, and
Disney, Hulu provides ad-supported access to a wide variety of TV shows and movies. Hulu Plus, for a subscription rate of $7.99/month, provides a broader range of content available across many devices.
● Ultraviolet: A consortium of content owners and device manufacturers, Ultraviolet is designed to enable streaming and direct-to-own (DTO) delivery of studio content to various devices in a trusted and secure architecture.
Broadcaster ● BBC: With iPlayer, the BBC has launched an online catch-up TV service that is free in
the United Kingdom, but sells for €7 to €9 per month in a limited number of other countries. Today, the BBC iPlayer application is available on more than 500 devices, across iOS, Android, PCs, and game consoles.
● Sky: The SkyGo offer allows Sky satellite customers to access a compelling suite of content, including live TV, sports, and recent movies, across a variety of devices. Twenty-five percent of Sky’s subscriber base of 10 million had used the service within five months of SkyGo’s launch.
OTT ● Netflix: This streaming video offer was launched in the United States and recently
exported to Canada and the United Kingdom. Although its content is not as current as some might prefer, Netflix has more than 20 million customers paying $7.99 per month. One selling point is a long-tail library of movies and TV shows. Netflix supports more
5 http://www.parksassociates.com/index.php
Cisco IBSG © 2012 Cisco and/or its affiliates. All rights reserved. Page 7
White Paper
than 450 devices, and its streaming service accounts for 22 percent of peak-time Internet traffic in the United States.
● iTunes: Using a transactional video-on-demand (TVoD) model, Apple customers can access more than 8,000 movies and 20,000 TV titles using either a PC, smartphone, tablet, or connected TV.
● Zeebox: This social companion-device app integrates with U.K. broadcast TV, and also provides Twitter and Facebook integration as well as smart tags. In addition, for people with connected TVs, Virgin Media TiVo, and Sky set-top boxes, the Zeebox app lets them change the channel on these devices. Sky made a 10 percent investment and has platform rights to enhance its own content, such as reality TV shows. Recently, the service was launched in the United States with Comcast, NBCUniversal, and HBO, all of which have invested in Zeebox.
Consumer Electronics ● Sony: Using its Bravia line of connected TVs, PS3 gaming console, and PSP portable
gaming station, Sony can offer easy access to on-demand and catch-up TV content from various providers, including broadcasters, Netflix, Amazon Lovefilm, and others.
● Microsoft: The software/services giant is entering the market through two main channels: its Xbox game console and the Windows Mobile operating system. Micro-soft has signed agreements with approximately 30 partners, some of which will use the Xbox as a secondary set-top box. Overall, Microsoft is moving the Xbox from a game console to an entertainment hub.
Service Provider ● Comcast/TWC: Comcast and Time Warner initiated TV Everywhere as a verification
system. It allows television service providers to authenticate satellite or cable sub-scription customers who also wish to use their IPTV/video on-demand/Internet television services.
Critical Success Factors After examining the successful offers above, several themes appear:
● “Multiscreen support” typically means the more devices that are supported, the better. Tablets, smartphones, gaming consoles, and connected TVs are all used extensively. According to the Cisco IBSG survey, at least 30 percent of online video viewers use one of these devices more than 30 minutes each week to watch Internet video.
● A consistent user interface across devices makes it easier for consumers to find and watch content. Comcast’s Xfinity service is driving 400 million VoD views per month, or 20 per subscriber.
● Being access agnostic allows consumers to watch when and where they choose. It also enables the seller to market outside the traditional footprint.
● Network control ensures quality broadband connections and the ability to vary the charging principles for various business models. For example, there are ways to lower the cost of multiscreen access in off-peak hours or to provide turbo-boost features
Cisco IBSG © 2012 Cisco and/or its affiliates. All rights reserved. Page 8
White Paper
(temporary bandwidth increase) to consumers willing to pay for a premium experience.
● Finally, each of these solutions takes advantage of a strong living-room experience to complement its multiscreen flexibility. Cisco IBSG’s survey noted that 21 percent of respondents mentioned the ability to watch Internet video on a large screen as a motivator to view more professionally produced content over the Internet. Moreover, among those who regularly watch Internet video, consumers who view premium Internet video on the connected TV had the greatest level of consumption.
Control Points: Mobility and Video Position Given the previously discussed aspects, it is essential to consider the opportunities for service providers to enter the space and successfully compete, based on their own specific control points. The ability of each SP to work from its strengths and invest in its weaknesses is also a function of its investment capacity and tolerance for risk. To this end, Cisco IBSG believes that service providers’ control points can be described by two simple questions: What is their video position, and what is their mobility position?
Mobile Position A service provider’s mobile position can vary based on several factors:
● Whether or not it owns a mobile network or has adopted a mobile-virtual-network-operator (MVNO) model
● The type of technology it has deployed, and how much spectrum it has
● The service provider’s geographic coverage and overlap of the SP’s mobile properties with other lines of its business
For example, service providers with a strong mobile position would likely own and operate their own mobile broadband network, have implemented an efficient and agile operations model, and have broad geographic reach in the local markets in which they do business.
By comparison, service providers with an average mobile position may not have deployed LTE or may be constrained by spectrum. They may have limited operational flexibility and be incapable of architecting network optimization solutions or integration with emerging wireless access technologies such as Wi-Fi. Moreover, they may not have built a strong brand, possibly due to a lack of company investments in other marketable lines of business.
Some service providers either have no mobile assets or are forced to resell the services of others. In these cases, there is little that these SPs can control within the network, leaving them in a limited position vis-à-vis the others.
The final consideration around strength of mobile position is the availability and use of mobile analytics. This enables an operator to gain both historical and, in the best situation, real-time data about the activities and usage of an individual customer. Real-time analytics would enable an operator to react to what a customer is doing at a specific point in time, and to offer a superior set of choices and capabilities that will optimize the mobile video experience.
Cisco IBSG © 2012 Cisco and/or its affiliates. All rights reserved. Page 9
White Paper
Video Position Again, a service provider’s video position is based on a combination of technology and business attributes. In particular, it is important to look at the quality of the SP’s user interface; the innovation of the SP’s service features and the related offer differentiation; the quality of the video delivery solution; and the attractiveness of the SP’s content.
An example of a service provider with a strong video position would be one with an easily navigable electronic programming guide (EPG); the availability of innovative features such as multiroom DVR support; the ability to deliver a large number of high-definition channels; and a deep library of video-on-demand and catch-up TV titles.
A moderate provider might have an EPG that is grid-based and difficult to navigate. It may also have some limitation on the quality of its distribution or the geographic reach within its serving area. Lastly, the provider may either be lacking a VoD solution or the titles may be dated.
Here, too, there may be some providers that either don’t have any video assets or are reselling another provider’s solution. In such cases, these providers would be considered to have a low position in the video value chain.
A further consideration for defining the relative video position is the availability of content rights across multiple screens and business models. No access to rights on multiple screens is the weakest position. Players in a moderate position would have rights to some screens, perhaps in limited locations or only for paid but not free-to-air content. Players in a strong video position would be able to deliver content to any screen, in any geographic location, and across a variety of free-to-air and pay models for both linear and on-demand content.
Multiscreen Platforms: Four Prevailing Solution Architectures Service providers are considering different solution architectures that will help them enter or expand their position in the multiscreen video delivery markets and to compete aggressively with established players in the value chain. Taking into account the identified control points, the following video solution architectures can be distinguished:
Partner TV For service providers that typically have mobile-only assets, a conservative approach to multiscreen market entry would involve supplying other video-solution providers with mobile capabilities. This could include making the real estate on their phone’s landing page avail-able or becoming a local extension of a global content delivery network. One of the main differences between Partner TV models and the others is that Partner TV doesn’t rely on directly acquiring content rights.
OTT TV With the acquisition of content rights, new opportunities become available. Service pro-viders can move to an OTT delivery offer by creating a multiscreen service that can be consumed on a variety of devices without requiring any specific solution-provider investment in video-rendering functionality at home, such as a set-top box. A big advantage here is the lower capital investment required, but it comes at the cost of not having a true home control point for the living room.
Cisco IBSG © 2012 Cisco and/or its affiliates. All rights reserved. Page 10
White Paper
Hybrid TV With the inclusion of a set-top box in the offer, a service provider can create a light version of a more traditional IPTV offer. Here, the solution would include a home control point and many of the other features of an IPTV solution. But it lacks the network control that otherwise would have been created. This could be an attractive option for an operator that has true IPTV in some markets, but does not own the required broadband assets in others.
IPTV To provide the most robust solution and the optimal customer experience for consumers, an IPTV solution is typically required. Assuming the SP either owns or partners to gain access to a broadband network, a portion of the available bandwidth can be carved out to transport video channels without fear of capacity-driven service degradation. For many, IPTV provides cost-effective, feature-rich entry into the market when compared with traditional cable and satellite-based solutions.
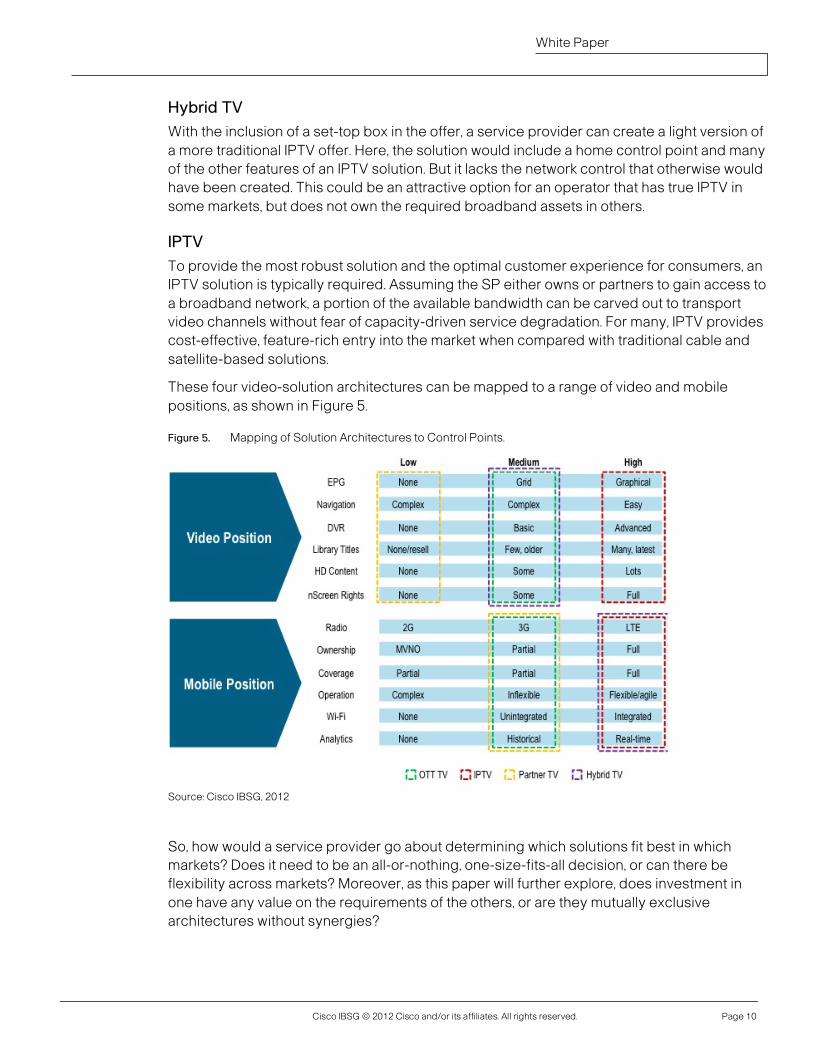
These four video-solution architectures can be mapped to a range of video and mobile positions, as shown in Figure 5.
Figure 5. Mapping of Solution Architectures to Control Points.
Source: Cisco IBSG, 2012
So, how would a service provider go about determining which solutions fit best in which markets? Does it need to be an all-or-nothing, one-size-fits-all decision, or can there be flexibility across markets? Moreover, as this paper will further explore, does investment in one have any value on the requirements of the others, or are they mutually exclusive architectures without synergies?

Cisco IBSG © 2012 Cisco and/or its affiliates. All rights reserved. Page 11
White Paper
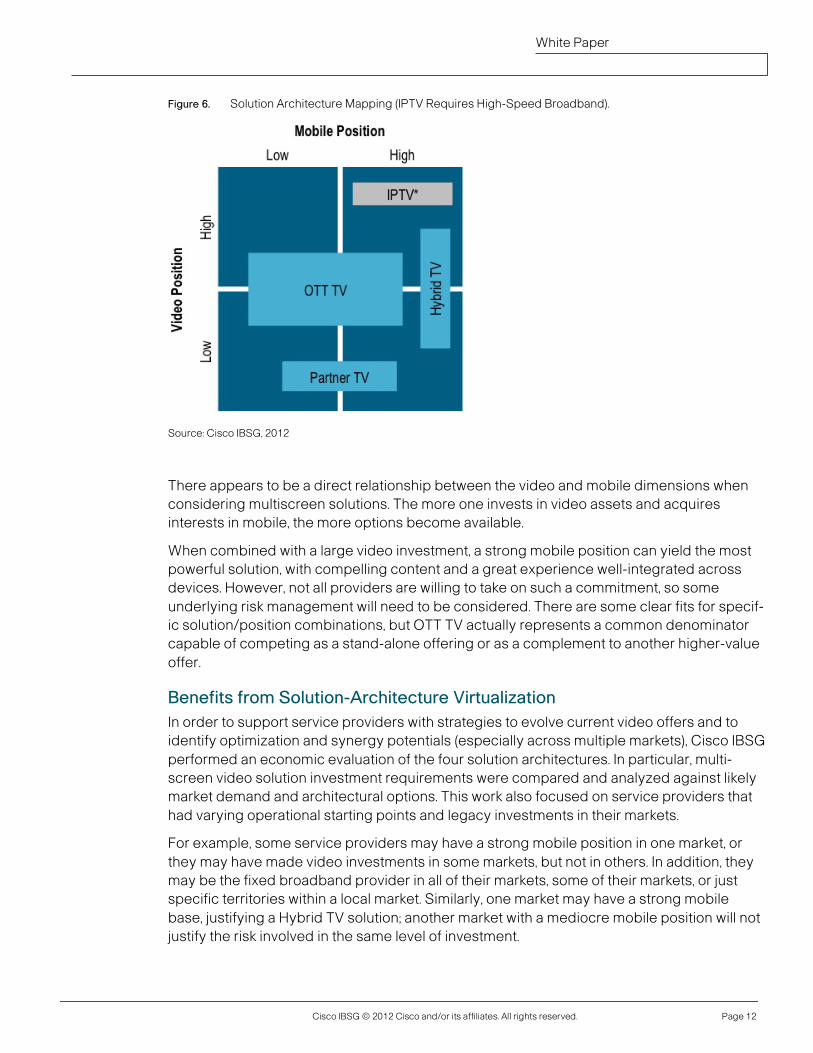
Solution Prioritization: One Size Does Not Fit All In Figure 6, these four solutions are plotted against the previously defined drivers of the mobile and video positions in a given market to determine the best options for delivering multiscreen video.
1. IPTV: Requires a significant investment in content, infrastructure, and a broadband transport network. This is the only solution where the SP will need to have fixed broadband transport in place, either through ownership or strong partnership. Because IPTV is being positioned as a primary video solution, the video quality must be highly competitive to win the home control point. Moreover, the mobility dimension is also high because of the need to differentiate the multiscreen experience through mobile functionality, with elements such as quality of service (QoS) and analytics. The offer is limited to the combined customer base in fixed and mobile, so market share will be critical to reach scale.
2. Hybrid TV: Works best where the video position is at least average, but the mobile position is high. This can be attributed to the relatively high cost of investment in a set-top box. Although investment is high compared with other pay services, the content and picture quality will likely be perceived as less robust. Therefore, there is an implied risk in adoption. Once a high mobile dimension enters the equation, the provider can emphasize the solution’s multiscreen differentiation attributes to com-pete more effectively. Here, the solution is delivered over the top of broadband networks, so ownership of that element is not required. The offer will be provided to the mobile customer base.
3. OTT TV: Requires no initial investment in set-top box or broadband, which makes it particularly attractive from a required-capital perspective. This lower barrier to entry can enable viability with a mediocre position in either video or mobile, and can therefore be used in many market scenarios. As a result, this solution acts as a good complement to other strategies and can help create a uniform experience across regions and operating companies. The mobility dimension, however, requires a stronger position because of the desire to cross-sell to the mobile base, where the most likely demographic of interest lies. In this case, it is less of a technical need than a market success factor.
4. Partner TV: For service providers that have a reasonable mobile position but lack serious investments in video or broadband, the Partner TV multiscreen strategy may be a viable option. Here, because of the reality of not being able to create a unique video proposition, SPs may be better served by enabling other content/media com-panies that are better positioned in this space. These types of services will not likely require a broadband investment.
Cisco IBSG © 2012 Cisco and/or its affiliates. All rights reserved. Page 12
White Paper
Figure 6. Solution Architecture Mapping (IPTV Requires High-Speed Broadband).
Source: Cisco IBSG, 2012
There appears to be a direct relationship between the video and mobile dimensions when considering multiscreen solutions. The more one invests in video assets and acquires interests in mobile, the more options become available.
When combined with a large video investment, a strong mobile position can yield the most powerful solution, with compelling content and a great experience well-integrated across devices. However, not all providers are willing to take on such a commitment, so some underlying risk management will need to be considered. There are some clear fits for specif-ic solution/position combinations, but OTT TV actually represents a common denominator capable of competing as a stand-alone offering or as a complement to another higher-value offer.
Benefits from Solution-Architecture Virtualization In order to support service providers with strategies to evolve current video offers and to identify optimization and synergy potentials (especially across multiple markets), Cisco IBSG performed an economic evaluation of the four solution architectures. In particular, multi-screen video solution investment requirements were compared and analyzed against likely market demand and architectural options. This work also focused on service providers that had varying operational starting points and legacy investments in their markets.
For example, some service providers may have a strong mobile position in one market, or they may have made video investments in some markets, but not in others. In addition, they may be the fixed broadband provider in all of their markets, some of their markets, or just specific territories within a local market. Similarly, one market may have a strong mobile base, justifying a Hybrid TV solution; another market with a mediocre mobile position will not justify the risk involved in the same level of investment.
Cisco IBSG © 2012 Cisco and/or its affiliates. All rights reserved. Page 13
White Paper
A multiscreen platform is needed that can support a common portion of the investment in each solution architecture without having to completely reinvest or rebuild each time. This requires a platform that can scale with growing demand, without the need of a significant up-front investment in high-risk capabilities. SPs can achieve this by harnessing economies of scale through reuse across homogeneous markets, and by harnessing economies of scope through reuse across heterogeneous markets. The solution requires a modular technical architecture and operational model that allow for quick changes/additions of specific plat-form and network capabilities, variations in business models, and, finally, expansion into new geographies/markets.
Cloud as a Platform By taking advantage of established principles coming from the software-as-a-service (SaaS), infrastructure-as-a-service (IaaS), and platform-as-a-service (PaaS) architectures and related operational models, greater flexibility can be achieved at a lower cost. In addition, a cloud-based solution is more modular and a natural choice for the required software architecture. It can support a number of market implementations, while keeping customer data segregated and allowing for service customization by market. As a result, the value of this approach is that it will reduce CapEx/OpEx, while also allowing for faster reaction to market changes.
Cost Elements As Cisco IBSG compared the cost per subscriber across the four video solution architec-tures of IPTV, OTT TV, Hybrid TV, and Partner TV, economies of scale in delivering the same solution to more than one market became apparent—as did economies of scope when solution elements are common to different solution types. For example, the same content management system could support an IPTV solution in one country and an OTT TV solution in another.
More specifically, the study identified 20 main elements (excluding content) that constitute a typical video solution and explored how their specific costs would be affected by imple-menting them on a cloud platform (“cloudification” of solution elements). For simplification, these were grouped into the following four main cost categories:
1. Video operations & distribution: Consisting of network costs, marketing, personnel (directly related to video operations), data center, labs, and systems integration
2. Content management: Content management platform, DRM, encoding and transcoding, advertising, distribution, and management and reporting needed for commercial purposes
3. User interface: Multiscreen portal, the electronic programming guide, and any set-top boxes/media adapters required
4. OSS/BSS: Billing and customer care as well as other IT integration requirements
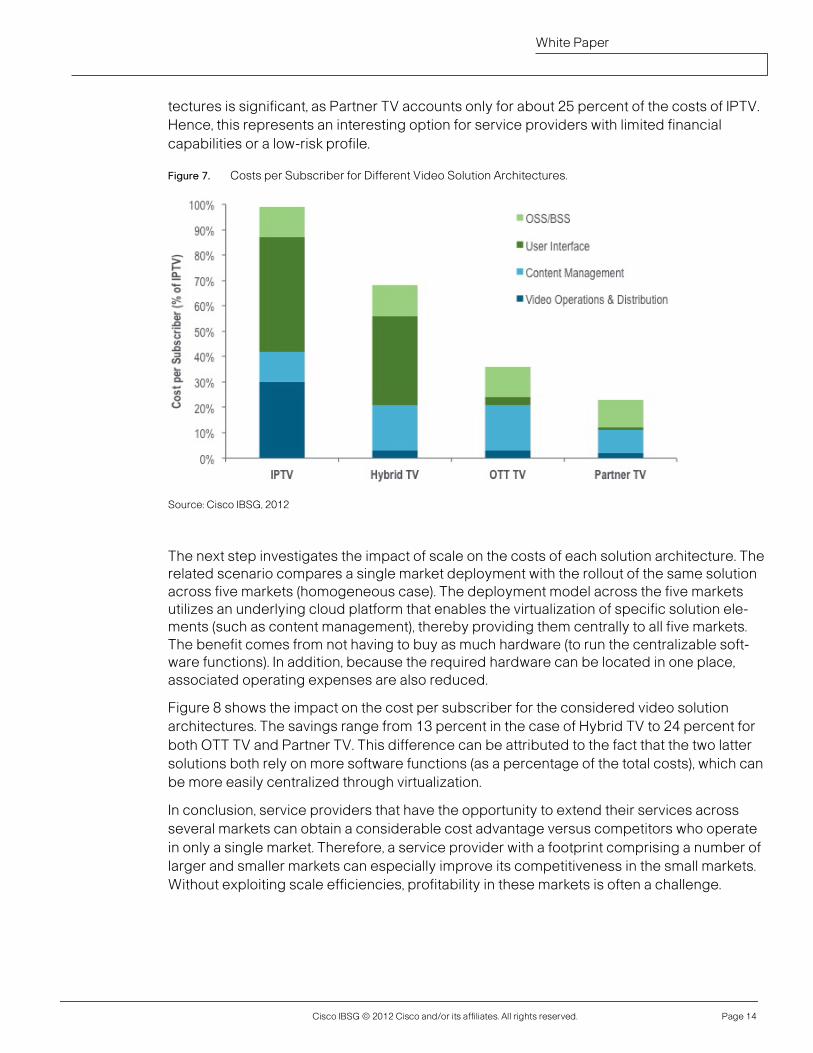
In a first scenario, the cost structures of the four different video solution architectures are compared, assuming a single market deployment. Figure 7 shows the costs per subscriber normalized to the IPTV total costs. As expected, IPTV shows by far the highest overall costs, mainly due to the included network costs. The other significant difference among the four solutions is related to the user interface in IPTV and Hybrid TV, which is caused by the set-top-boxes involved in both of these architectures. Overall, differentiation among the archi-
Cisco IBSG © 2012 Cisco and/or its affiliates. All rights reserved. Page 14
White Paper
tectures is significant, as Partner TV accounts only for about 25 percent of the costs of IPTV. Hence, this represents an interesting option for service providers with limited financial capabilities or a low-risk profile.
Figure 7. Costs per Subscriber for Different Video Solution Architectures.
Source: Cisco IBSG, 2012
The next step investigates the impact of scale on the costs of each solution architecture. The related scenario compares a single market deployment with the rollout of the same solution across five markets (homogeneous case). The deployment model across the five markets utilizes an underlying cloud platform that enables the virtualization of specific solution ele-ments (such as content management), thereby providing them centrally to all five markets. The benefit comes from not having to buy as much hardware (to run the centralizable soft-ware functions). In addition, because the required hardware can be located in one place, associated operating expenses are also reduced.
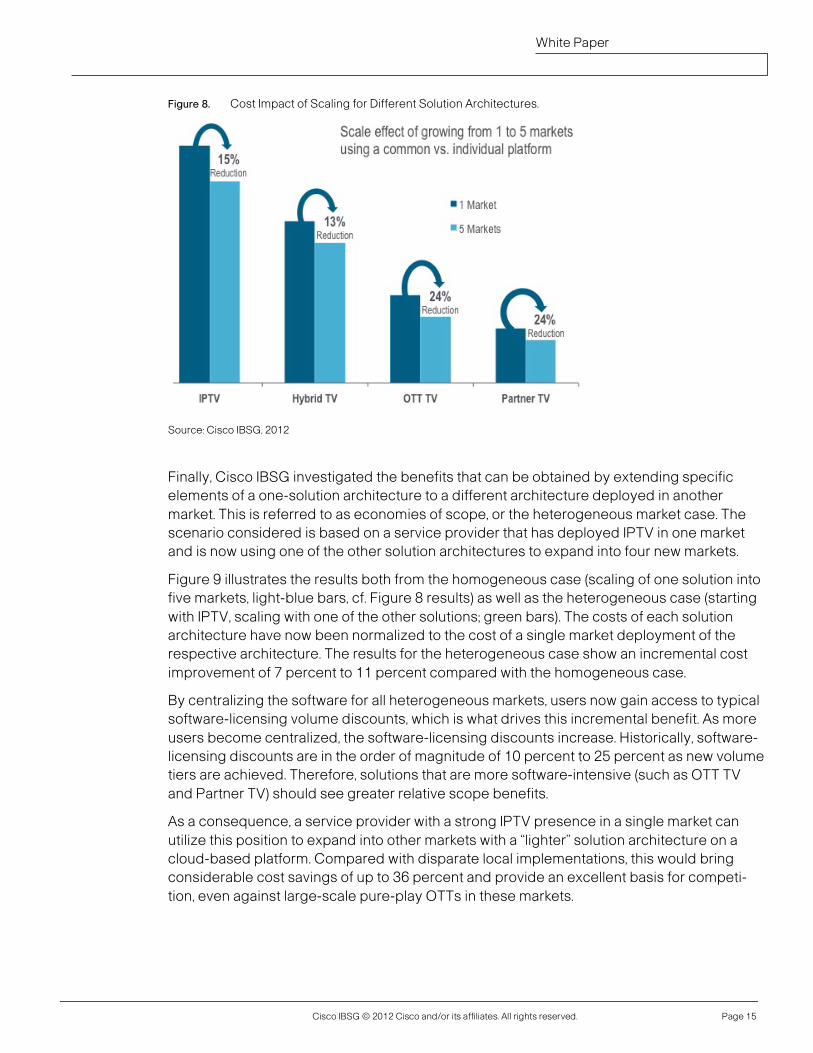
Figure 8 shows the impact on the cost per subscriber for the considered video solution architectures. The savings range from 13 percent in the case of Hybrid TV to 24 percent for both OTT TV and Partner TV. This difference can be attributed to the fact that the two latter solutions both rely on more software functions (as a percentage of the total costs), which can be more easily centralized through virtualization.
In conclusion, service providers that have the opportunity to extend their services across several markets can obtain a considerable cost advantage versus competitors who operate in only a single market. Therefore, a service provider with a footprint comprising a number of larger and smaller markets can especially improve its competitiveness in the small markets. Without exploiting scale efficiencies, profitability in these markets is often a challenge.
Cisco IBSG © 2012 Cisco and/or its affiliates. All rights reserved. Page 15
White Paper
Figure 8. Cost Impact of Scaling for Different Solution Architectures.
Source: Cisco IBSG, 2012
Finally, Cisco IBSG investigated the benefits that can be obtained by extending specific elements of a one-solution architecture to a different architecture deployed in another market. This is referred to as economies of scope, or the heterogeneous market case. The scenario considered is based on a service provider that has deployed IPTV in one market and is now using one of the other solution architectures to expand into four new markets.
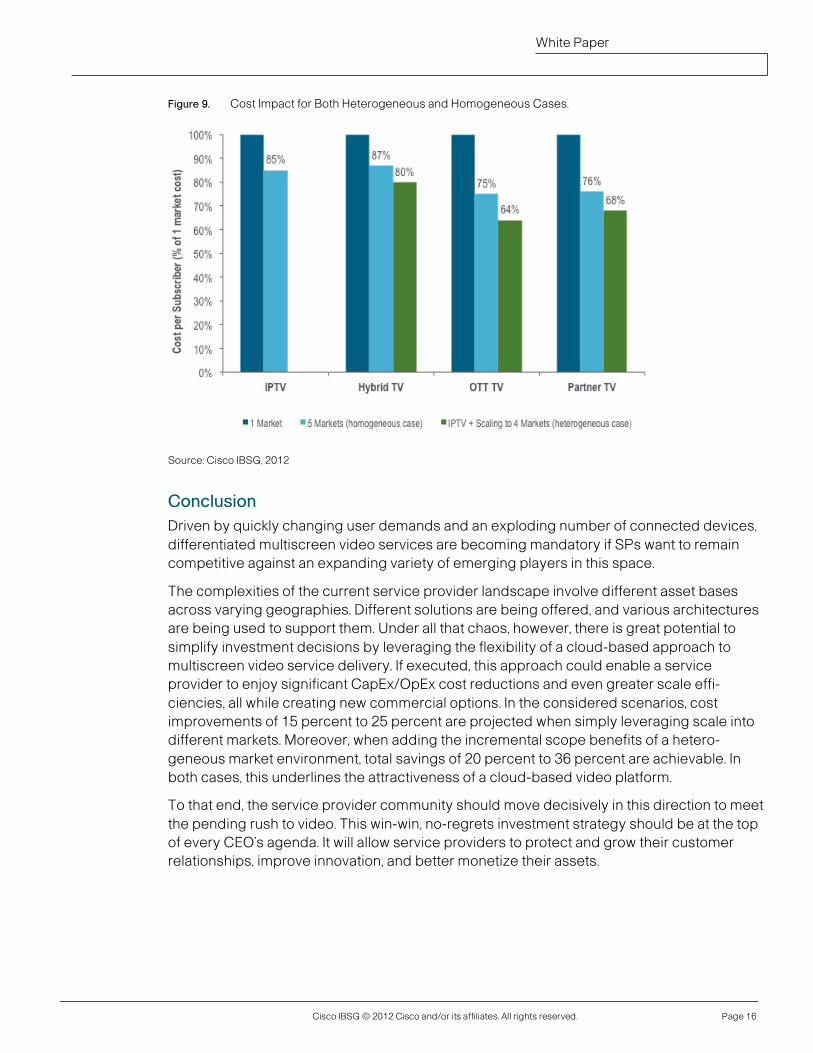
Figure 9 illustrates the results both from the homogeneous case (scaling of one solution into five markets, light-blue bars, cf. Figure 8 results) as well as the heterogeneous case (starting with IPTV, scaling with one of the other solutions; green bars). The costs of each solution architecture have now been normalized to the cost of a single market deployment of the respective architecture. The results for the heterogeneous case show an incremental cost improvement of 7 percent to 11 percent compared with the homogeneous case.
By centralizing the software for all heterogeneous markets, users now gain access to typical software-licensing volume discounts, which is what drives this incremental benefit. As more users become centralized, the software-licensing discounts increase. Historically, software-licensing discounts are in the order of magnitude of 10 percent to 25 percent as new volume tiers are achieved. Therefore, solutions that are more software-intensive (such as OTT TV and Partner TV) should see greater relative scope benefits.
As a consequence, a service provider with a strong IPTV presence in a single market can utilize this position to expand into other markets with a “lighter” solution architecture on a cloud-based platform. Compared with disparate local implementations, this would bring considerable cost savings of up to 36 percent and provide an excellent basis for competi-tion, even against large-scale pure-play OTTs in these markets.
Cisco IBSG © 2012 Cisco and/or its affiliates. All rights reserved. Page 16
White Paper
Figure 9. Cost Impact for Both Heterogeneous and Homogeneous Cases.
Source: Cisco IBSG, 2012
Conclusion Driven by quickly changing user demands and an exploding number of connected devices, differentiated multiscreen video services are becoming mandatory if SPs want to remain competitive against an expanding variety of emerging players in this space.
The complexities of the current service provider landscape involve different asset bases across varying geographies. Different solutions are being offered, and various architectures are being used to support them. Under all that chaos, however, there is great potential to simplify investment decisions by leveraging the flexibility of a cloud-based approach to multiscreen video service delivery. If executed, this approach could enable a service provider to enjoy significant CapEx/OpEx cost reductions and even greater scale effi-ciencies, all while creating new commercial options. In the considered scenarios, cost improvements of 15 percent to 25 percent are projected when simply leveraging scale into different markets. Moreover, when adding the incremental scope benefits of a hetero-geneous market environment, total savings of 20 percent to 36 percent are achievable. In both cases, this underlines the attractiveness of a cloud-based video platform.
To that end, the service provider community should move decisively in this direction to meet the pending rush to video. This win-win, no-regrets investment strategy should be at the top of every CEO’s agenda. It will allow service providers to protect and grow their customer relationships, improve innovation, and better monetize their assets.

Cisco IBSG © 2012 Cisco and/or its affiliates. All rights reserved. Page 17
White Paper