Embed Size (px)
Citation preview
Streaming Telemetry:Considerations & Challenges Mike Korshunov, TME @ [email protected]

Agenda1
2
3
4
Brief Telemetry Overview
Closer Look at Telemetry Components
The Progress So Far
Final Thoughts
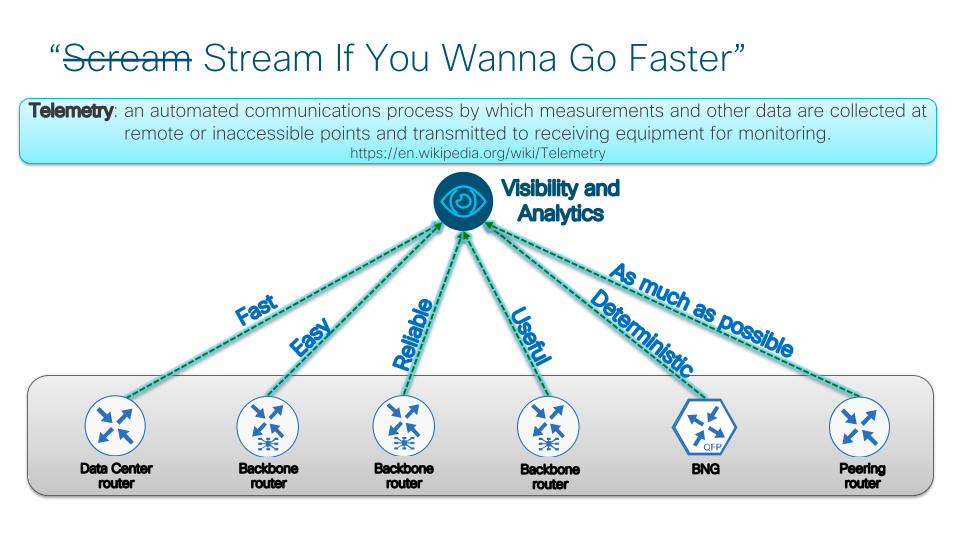
“Scream Stream If You Wanna Go Faster”
Data Centerrouter
Telemetry: an automated communications process by which measurements and other data are collected at remote or inaccessible points and transmitted to receiving equipment for monitoring.
https://en.wikipedia.org/wiki/Telemetry
Visibility and Analytics
Backbonerouter
Backbonerouter
Backbonerouter
BNG Peeringrouter
Fast
Easy
Relia
ble
As much as possible
Useful
Deterministic
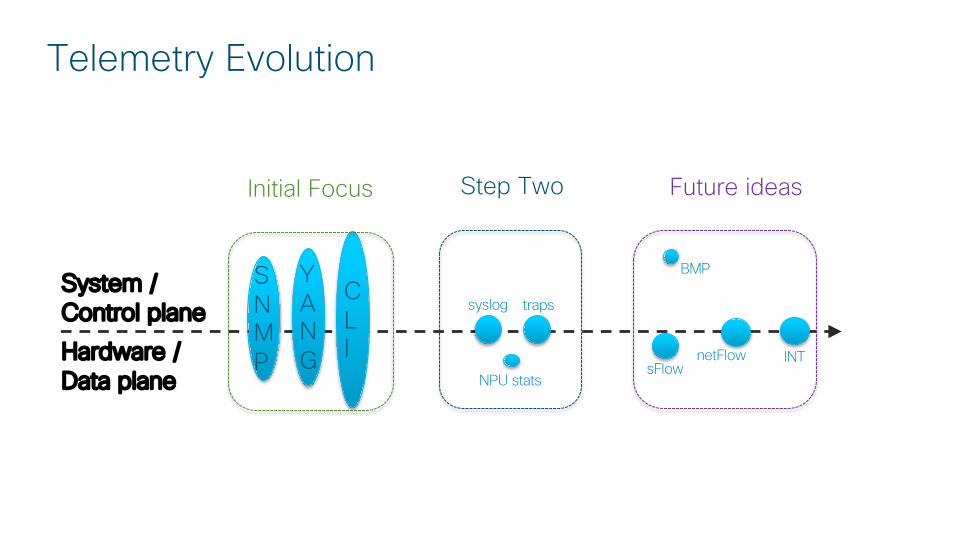
System / Control planeHardware / Data plane
Telemetry Evolution
CLI
YANG
SNMP
Initial Focus
syslog
NPU stats
traps
Step Two
BMP
netFlowsFlow
Future ideas
INT

Agenda1
2
3
4
Brief Telemetry Overview
Closer Look at Telemetry Components
The Progress So Far
Final Thoughts
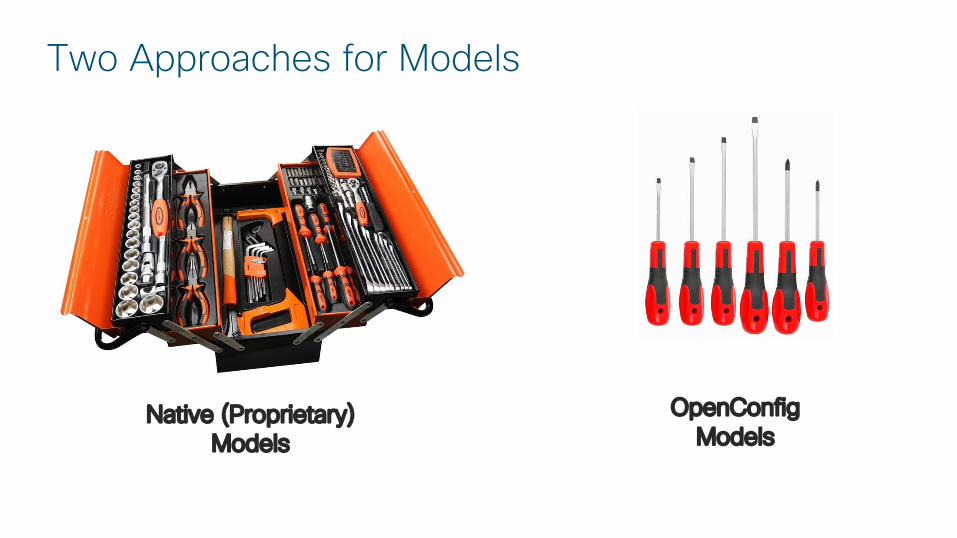
Two Approaches for Models
Native (Proprietary) Models
OpenConfigModels
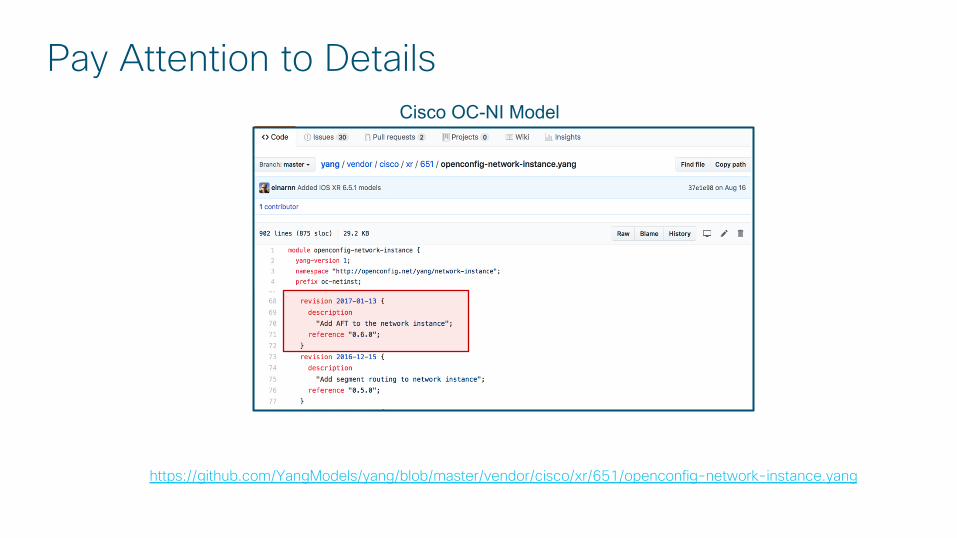
Pay Attention to Details
https://github.com/YangModels/yang/blob/master/vendor/cisco/xr/651/openconfig-network-instance.yang
Cisco OC-NI Model
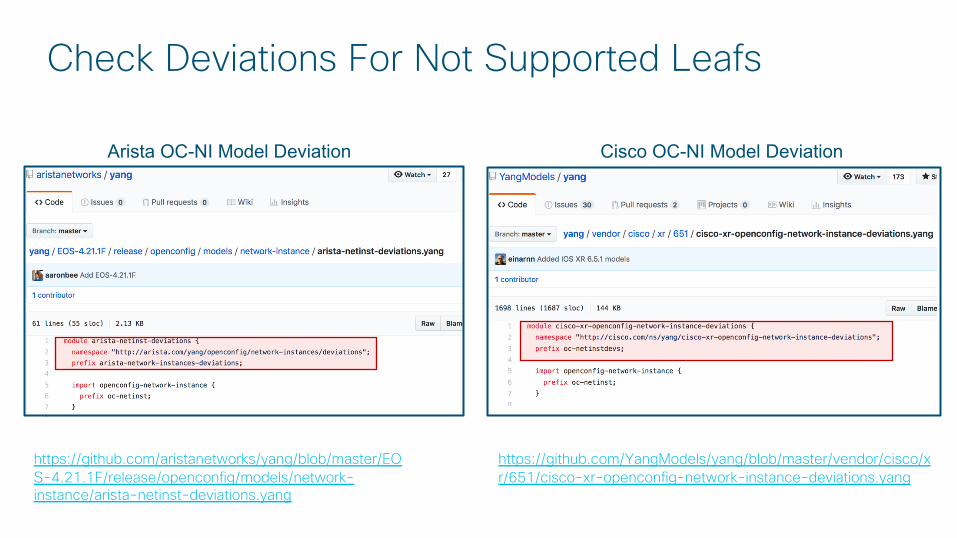
Check Deviations For Not Supported Leafs
https://github.com/YangModels/yang/blob/master/vendor/cisco/xr/651/cisco-xr-openconfig-network-instance-deviations.yang
https://github.com/aristanetworks/yang/blob/master/EOS-4.21.1F/release/openconfig/models/network-instance/arista-netinst-deviations.yang
Arista OC-NI Model Deviation Cisco OC-NI Model Deviation
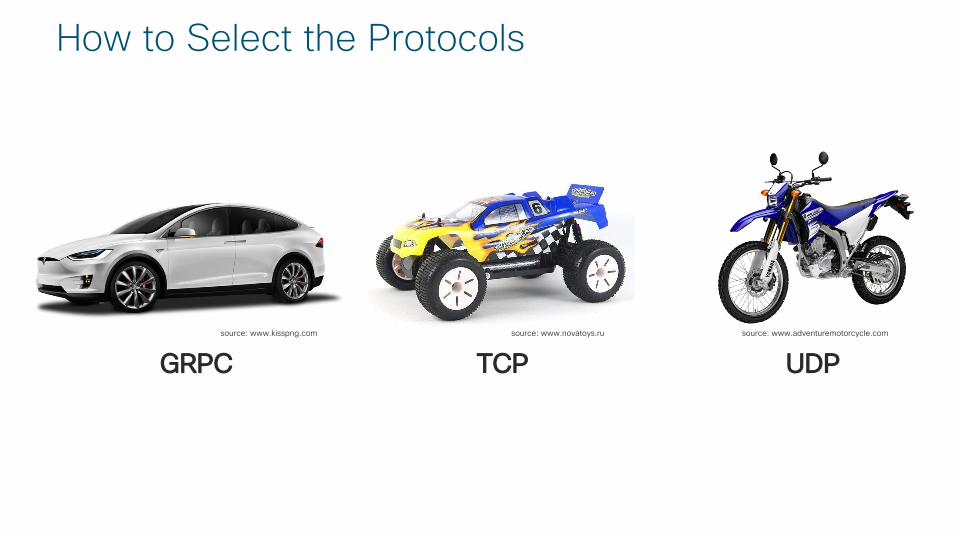
How to Select the Protocols
UDPsource: www.adventuremotorcycle.comsource: www.novatoys.ru
TCPsource: www.kisspng.com
GRPC
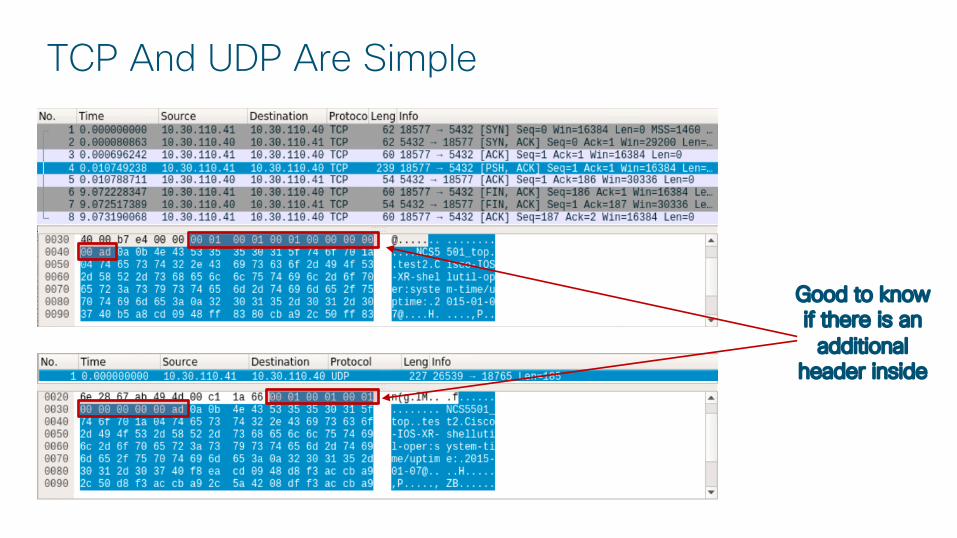
TCP And UDP Are Simple
Good to know if there is an
additional header inside
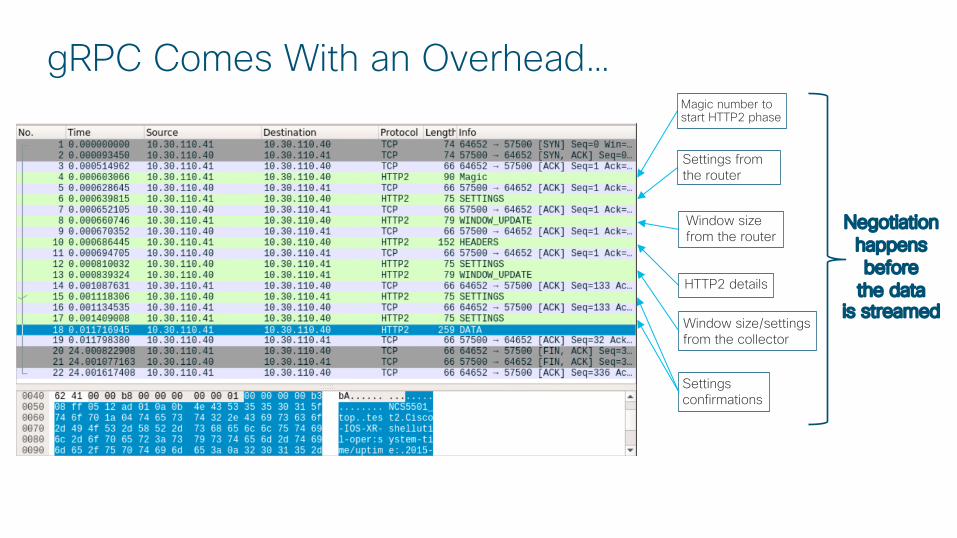
gRPC Comes With an Overhead…Magic number to start HTTP2 phase
Settings from the router
HTTP2 details
Settings confirmations
Negotiation happens before
the data is streamed
Window size from the router
Window size/settings from the collector
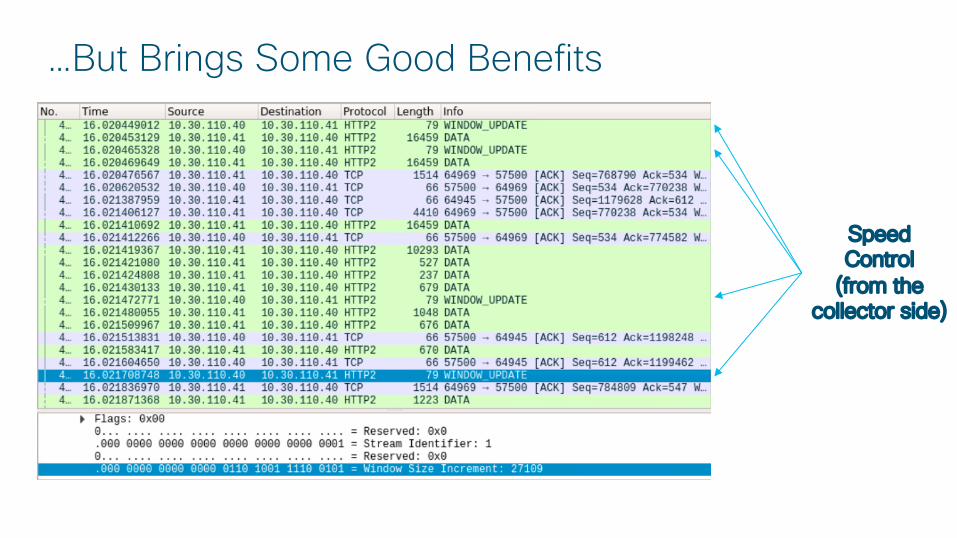
…But Brings Some Good Benefits
Speed Control
(from the collector side)
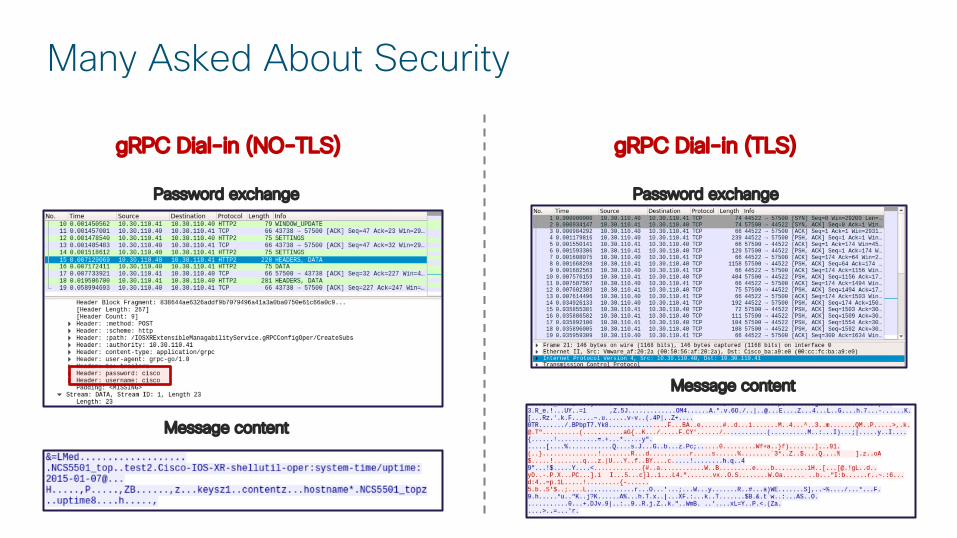
Many Asked About Security
gRPC Dial-in (NO-TLS)
Message content
Message content
Password exchange Password exchange
gRPC Dial-in (TLS)
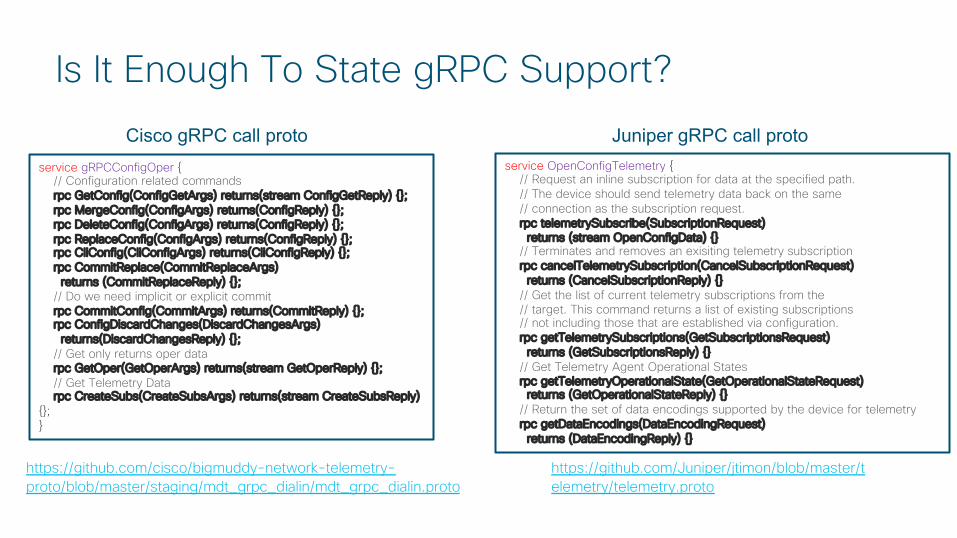
Is It Enough To State gRPC Support?
https://github.com/cisco/bigmuddy-network-telemetry-proto/blob/master/staging/mdt_grpc_dialin/mdt_grpc_dialin.proto
Cisco gRPC call proto Juniper gRPC call proto
https://github.com/Juniper/jtimon/blob/master/telemetry/telemetry.proto
service gRPCConfigOper {// Configuration related commandsrpc GetConfig(ConfigGetArgs) returns(stream ConfigGetReply) {};rpc MergeConfig(ConfigArgs) returns(ConfigReply) {};rpc DeleteConfig(ConfigArgs) returns(ConfigReply) {};rpc ReplaceConfig(ConfigArgs) returns(ConfigReply) {};rpc CliConfig(CliConfigArgs) returns(CliConfigReply) {};rpc CommitReplace(CommitReplaceArgs)
returns (CommitReplaceReply) {};// Do we need implicit or explicit commitrpc CommitConfig(CommitArgs) returns(CommitReply) {};rpc ConfigDiscardChanges(DiscardChangesArgs)
returns(DiscardChangesReply) {};// Get only returns oper datarpc GetOper(GetOperArgs) returns(stream GetOperReply) {};// Get Telemetry Datarpc CreateSubs(CreateSubsArgs) returns(stream CreateSubsReply)
{};}
service OpenConfigTelemetry {// Request an inline subscription for data at the specified path.// The device should send telemetry data back on the same// connection as the subscription request.rpc telemetrySubscribe(SubscriptionRequest)
returns (stream OpenConfigData) {}// Terminates and removes an exisiting telemetry subscriptionrpc cancelTelemetrySubscription(CancelSubscriptionRequest)
returns (CancelSubscriptionReply) {}// Get the list of current telemetry subscriptions from the// target. This command returns a list of existing subscriptions// not including those that are established via configuration.rpc getTelemetrySubscriptions(GetSubscriptionsRequest)
returns (GetSubscriptionsReply) {}// Get Telemetry Agent Operational Statesrpc getTelemetryOperationalState(GetOperationalStateRequest)
returns (GetOperationalStateReply) {}// Return the set of data encodings supported by the device for telemetry rpc getDataEncodings(DataEncodingRequest)
returns (DataEncodingReply) {}
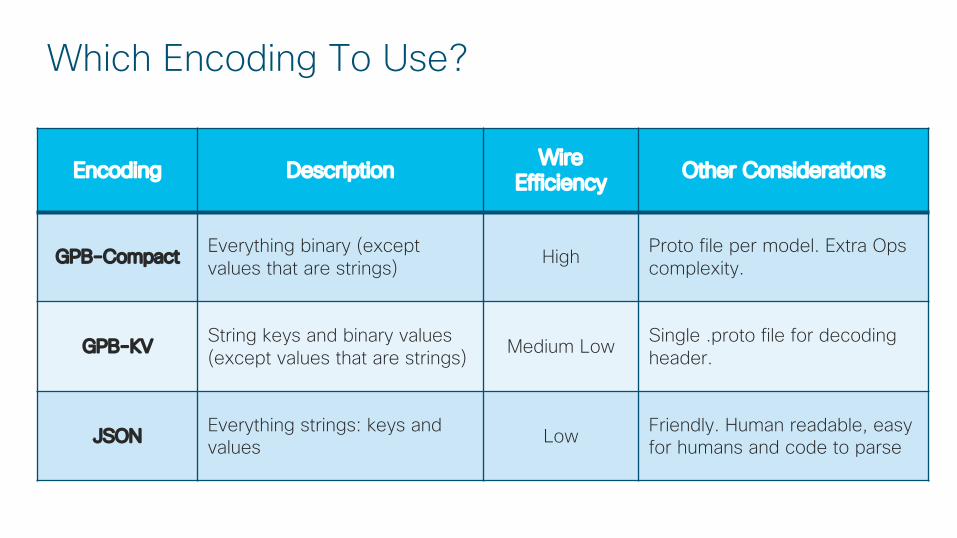
Which Encoding To Use?
Encoding Description WireEfficiency Other Considerations
GPB-Compact Everything binary (except values that are strings) High Proto file per model. Extra Ops
complexity.
GPB-KV String keys and binary values (except values that are strings) Medium Low Single .proto file for decoding
header.
JSON Everything strings: keys and values Low Friendly. Human readable, easy
for humans and code to parse
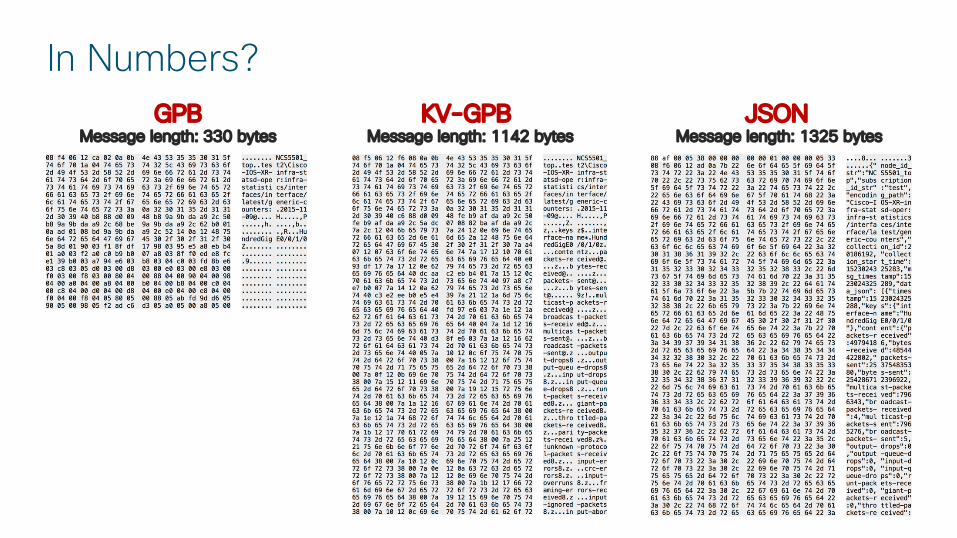
In Numbers?
Message length: 1142 bytesMessage length: 330 bytes Message length: 1325 bytesGPB KV-GPB JSON

Agenda1
2
3
4
Brief Telemetry Overview
Closer Look at Telemetry Components
The Progress So Far
Final Thoughts
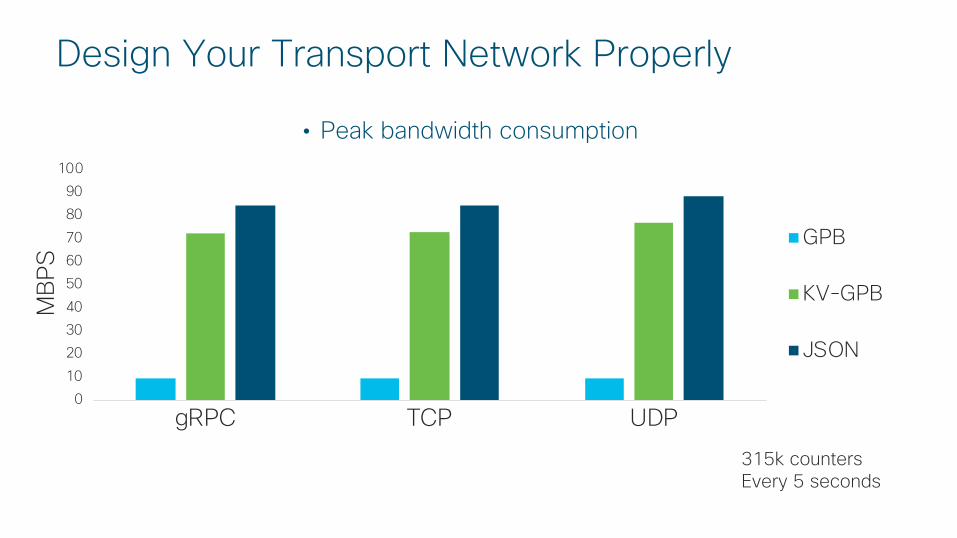
Design Your Transport Network Properly
315k countersEvery 5 seconds
0102030405060708090
100
gRPC TCP UDP
GPB
KV-GPB
JSON
• Peak bandwidth consumption
MBP
S
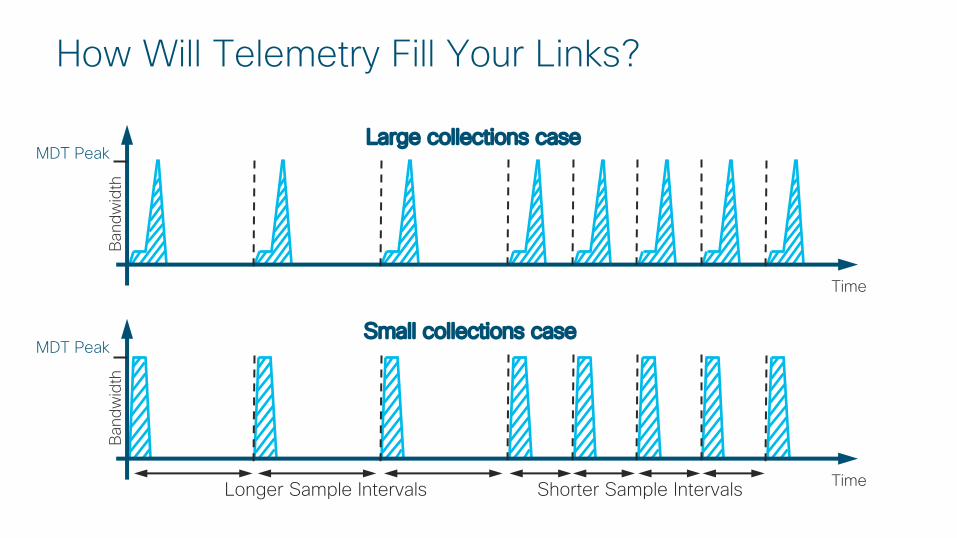
How Will Telemetry Fill Your Links?
MDT Peak
Band
wid
th
Time
Longer Sample Intervals
Band
wid
th
Time
Large collections case
Small collections case
Shorter Sample Intervals
MDT Peak
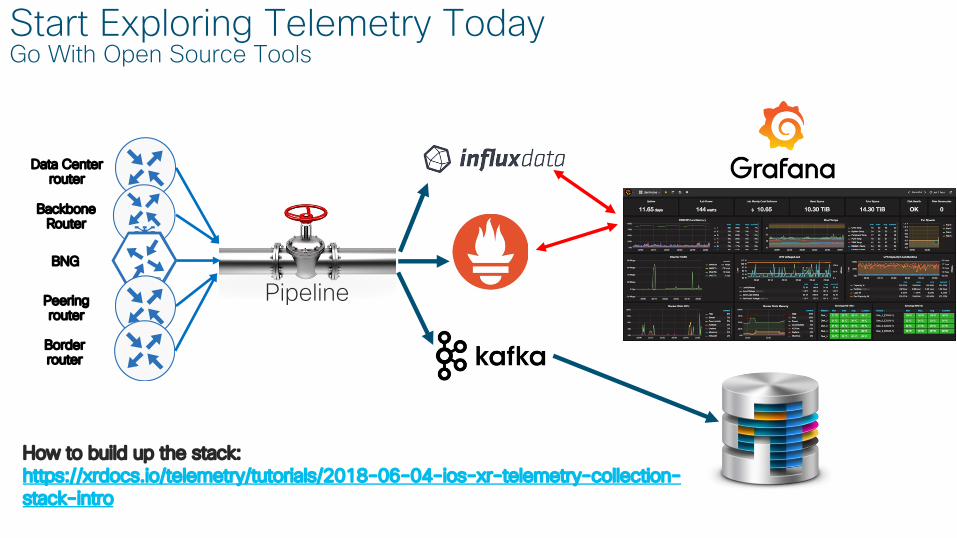
Start Exploring Telemetry TodayGo With Open Source Tools
Data Centerrouter
BackboneRouter
BNG
Peeringrouter
Borderrouter
Pipeline
How to build up the stack: https://xrdocs.io/telemetry/tutorials/2018-06-04-ios-xr-telemetry-collection-stack-intro
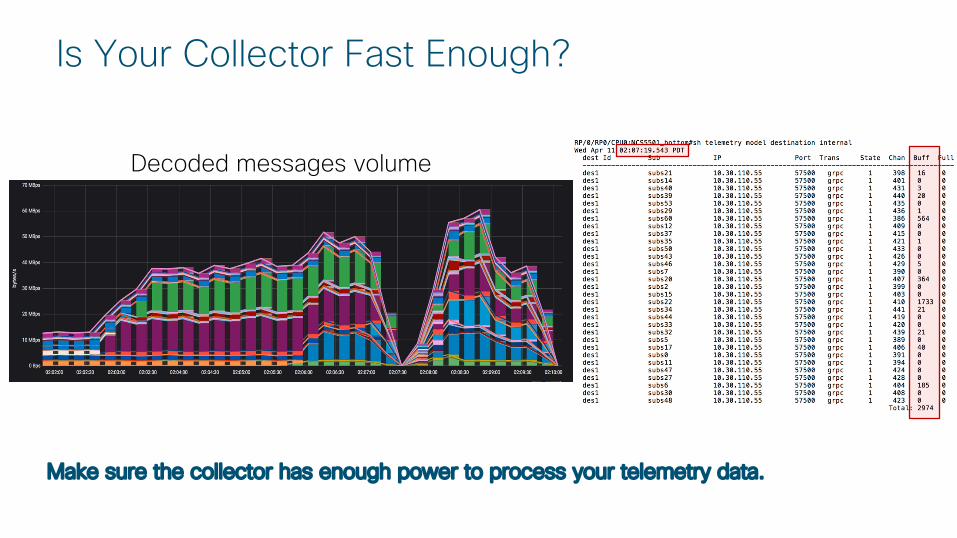
Is Your Collector Fast Enough?
Make sure the collector has enough power to process your telemetry data.
Decoded messages volume
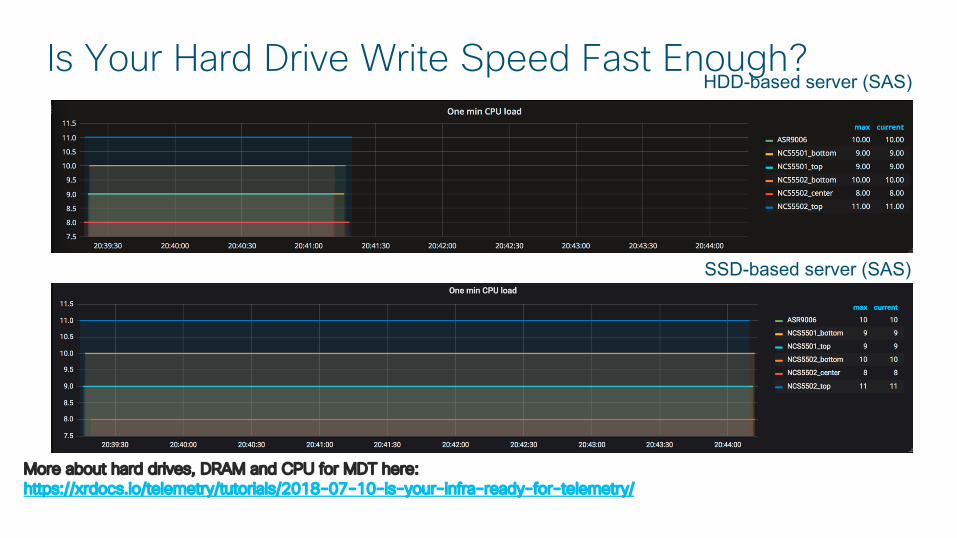
Is Your Hard Drive Write Speed Fast Enough?HDD-based server (SAS)
SSD-based server (SAS)
More about hard drives, DRAM and CPU for MDT here: https://xrdocs.io/telemetry/tutorials/2018-07-10-is-your-infra-ready-for-telemetry/
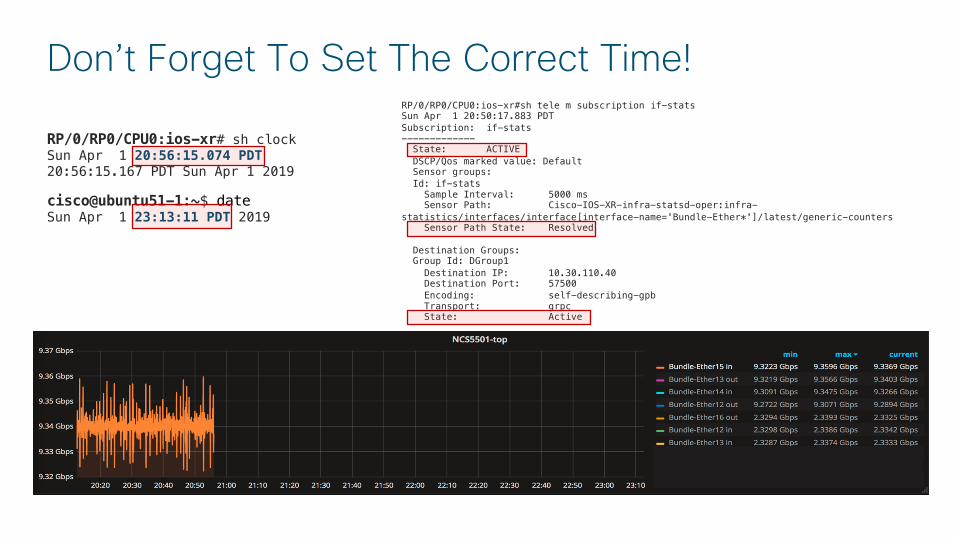
RP/0/RP0/CPU0:ios-xr# sh clockSun Apr 1 20:56:15.074 PDT20:56:15.167 PDT Sun Apr 1 2019
cisco@ubuntu51-1:~$ dateSun Apr 1 23:13:11 PDT 2019
RP/0/RP0/CPU0:ios-xr#sh tele m subscription if-stats Sun Apr 1 20:50:17.883 PDTSubscription: if-stats-------------
State: ACTIVEDSCP/Qos marked value: DefaultSensor groups:Id: if-stats
Sample Interval: 5000 msSensor Path: Cisco-IOS-XR-infra-statsd-oper:infra-
statistics/interfaces/interface[interface-name='Bundle-Ether*']/latest/generic-countersSensor Path State: Resolved
Destination Groups:Group Id: DGroup1
Destination IP: 10.30.110.40Destination Port: 57500Encoding: self-describing-gpbTransport: grpcState: Active
Don’t Forget To Set The Correct Time!
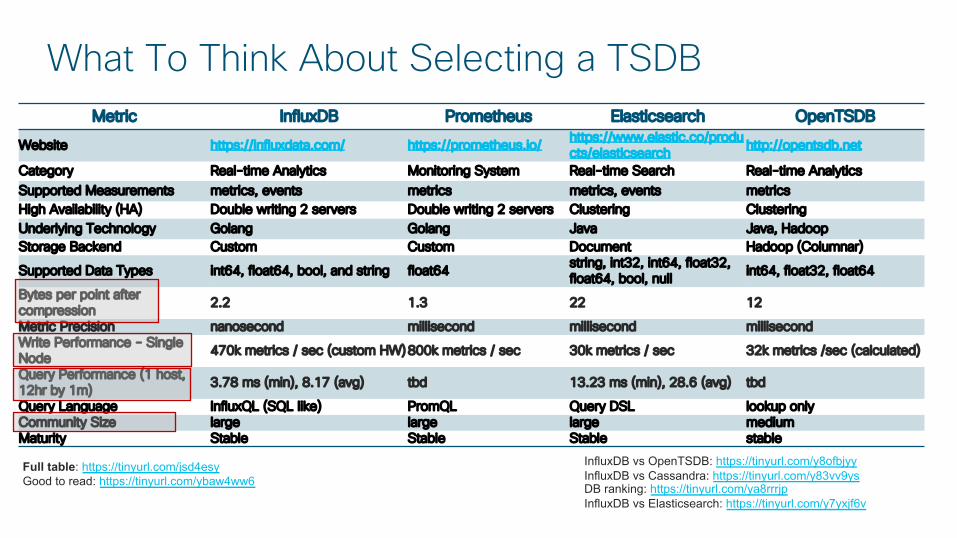
What To Think About Selecting a TSDBMetric InfluxDB Prometheus Elasticsearch OpenTSDB
Website https://influxdata.com/ https://prometheus.io/ https://www.elastic.co/products/elasticsearch http://opentsdb.net
Category Real-time Analytics Monitoring System Real-time Search Real-time AnalyticsSupported Measurements metrics, events metrics metrics, events metricsHigh Availability (HA) Double writing 2 servers Double writing 2 servers Clustering ClusteringUnderlying Technology Golang Golang Java Java, HadoopStorage Backend Custom Custom Document Hadoop (Columnar)
Supported Data Types int64, float64, bool, and string float64 string, int32, int64, float32, float64, bool, null int64, float32, float64
Bytes per point after compression 2.2 1.3 22 12
Metric Precision nanosecond millisecond millisecond millisecondWrite Performance - Single Node 470k metrics / sec (custom HW)800k metrics / sec 30k metrics / sec 32k metrics /sec (calculated)
Query Performance (1 host, 12hr by 1m) 3.78 ms (min), 8.17 (avg) tbd 13.23 ms (min), 28.6 (avg) tbd
Query Language InfluxQL (SQL like) PromQL Query DSL lookup onlyCommunity Size large large large mediumMaturity Stable Stable Stable stable
Full table: https://tinyurl.com/jsd4esyGood to read: https://tinyurl.com/ybaw4ww6
InfluxDB vs OpenTSDB: https://tinyurl.com/y8ofbjyyInfluxDB vs Cassandra: https://tinyurl.com/y83vv9ysDB ranking: https://tinyurl.com/ya8rrrjpInfluxDB vs Elasticsearch: https://tinyurl.com/y7yxjf6v
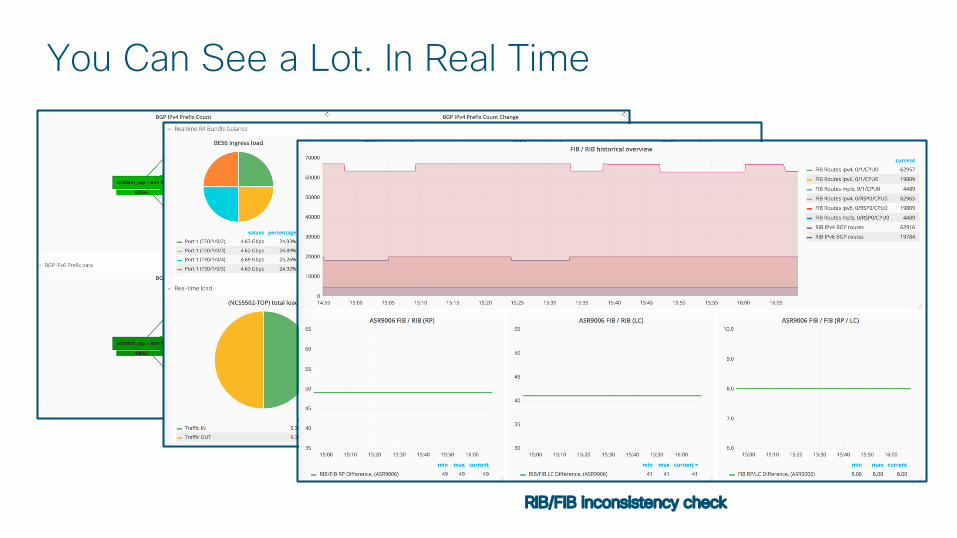
Real-time BGP map
Real-time traffic load
RIB/FIB inconsistency check
You Can See a Lot. In Real Time
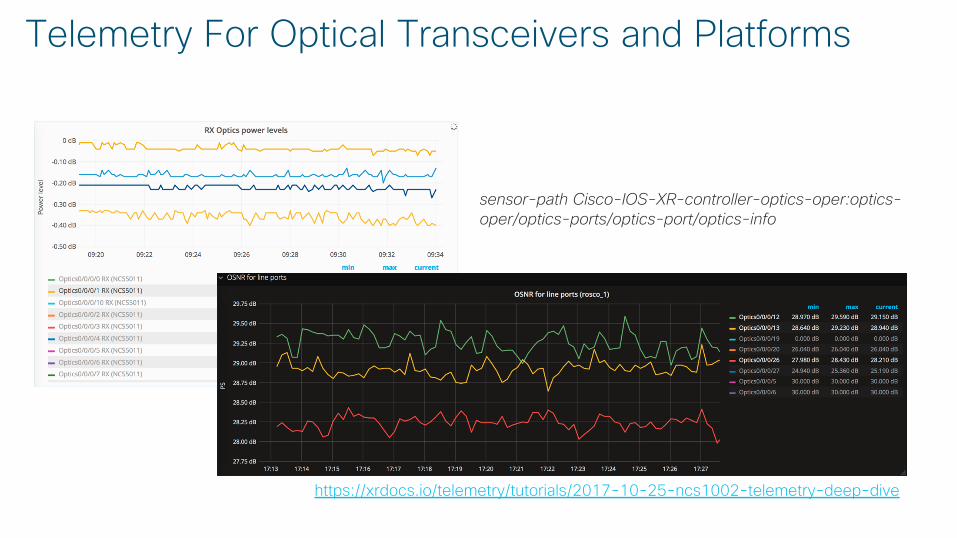
Telemetry For Optical Transceivers and Platformss
https://xrdocs.io/telemetry/tutorials/2017-10-25-ncs1002-telemetry-deep-dive
sensor-path Cisco-IOS-XR-controller-optics-oper:optics-oper/optics-ports/optics-port/optics-info
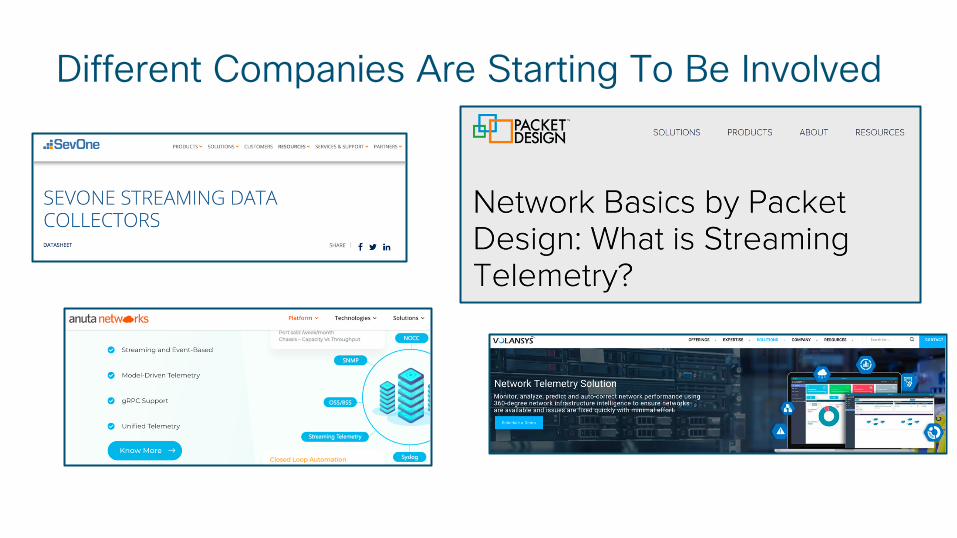
Different Companies Are Starting To Be Involved
gNMI part of the Solution
• Network management interface defined by OpenConfig (mostly lead by Google)
• Configuration management and streaming telemetry in a single protocol
• Data model independent
• Based on Google RPC framework and HTTP/2
The main goal for Telemetry is to provide a “standard” approach for encoding and transport protocols support across different vendors.
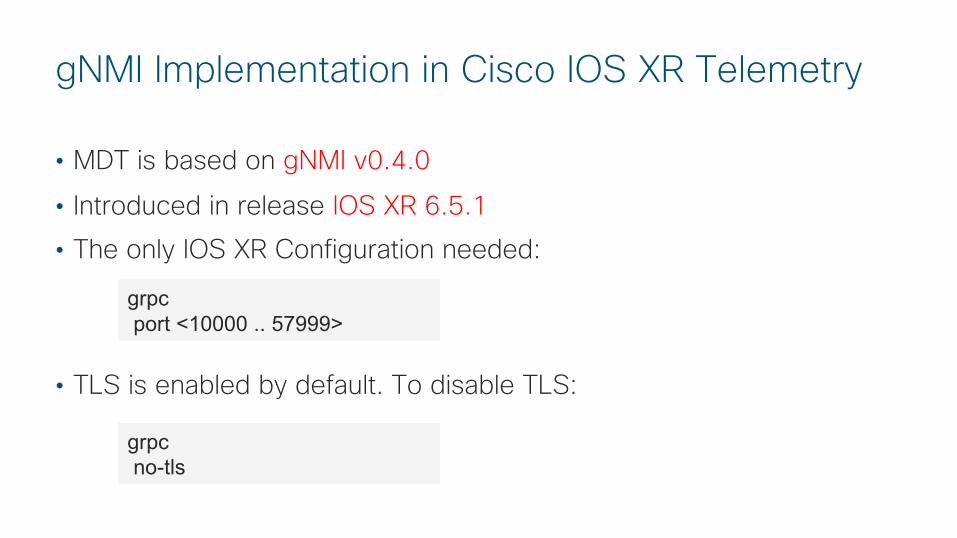
gNMI Implementation in Cisco IOS XR Telemetry
• MDT is based on gNMI v0.4.0
• Introduced in release IOS XR 6.5.1• The only IOS XR Configuration needed:
• TLS is enabled by default. To disable TLS:
grpcno-tls
grpcport <10000 .. 57999>

Agenda1
2
3
4
Brief Telemetry Overview
Closer Look at Router
The Progress So far
Final Thoughts
Key Messages
• Streaming Telemetry is here for you.Start to receive benefits from it today!
• Select encoding and transport wisely. Good startfor beginners with Key-Value GPB & gRPC.
• It’s easy to explore. Scripts to bring up stackavailable. Should take less than 15 mins toprovision.
• Read for more materials: https://xrdocs.io/telemetry/
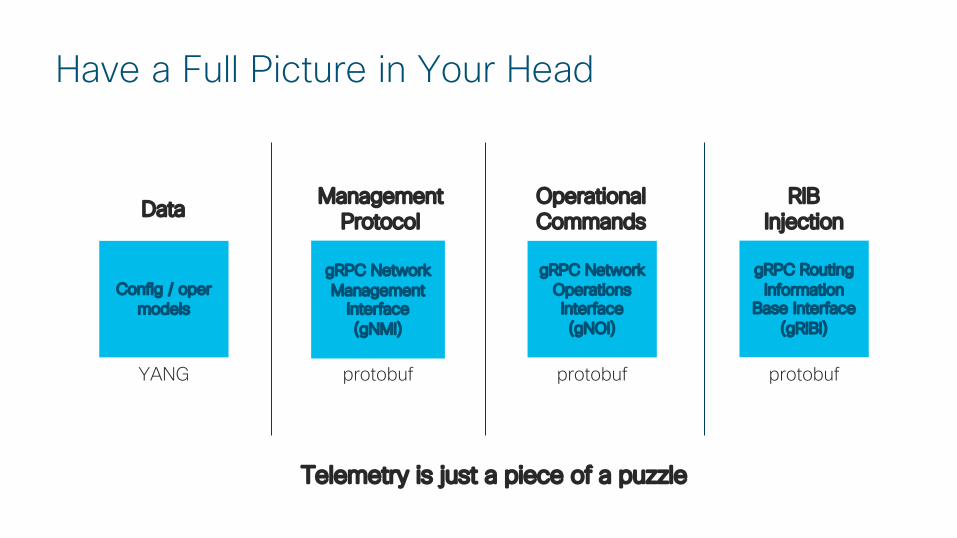
Have a Full Picture in Your Head
Config / opermodels
YANG
gRPC Network Management
Interface (gNMI)
protobuf
gRPC Network Operations Interface (gNOI)
protobuf
Data Management Protocol
Operational Commands
gRPC Routing Information
Base Interface (gRIBI)
RIB Injection
protobuf
Telemetry is just a piece of a puzzle