Embed Size (px)
Citation preview
1
STREAM INVERTEBRATES Draft – April 2017
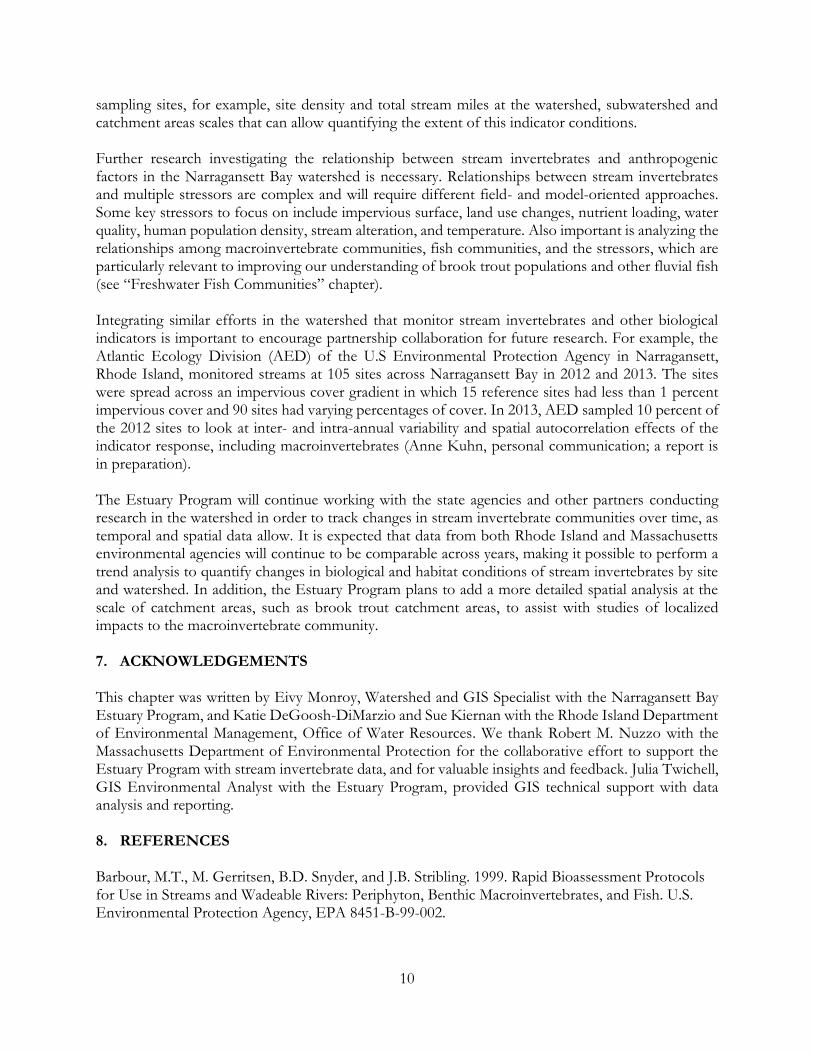
1. OVERVIEW Freshwater stream invertebrates are excellent indicators of water quality conditions. Stream invertebrates rely on intact habitat and clean water, and state agencies monitor these invertebrates in wadeable streams throughout the Narragansett Bay watershed. Of the 78 assessed sites for stream invertebrates, 79 percent were classified as having good stream condition, meaning both invertebrate health and habitat quality were good. In contrast, 19 percent were classified as poor stream condition because of poor invertebrate health despite good habitat quality. A single site, representing 2 percent of all sites, was classified as poor stream condition with both poor invertebrate health and poor habitat quality. The assemblage of stream invertebrates reflects the effects of both short-term and cumulative stressors such as storm water discharges, increased water temperatures, excess nutrients, sedimentation and other physical alteration of stream habitat, all driven by changes in climate and the landscape. 2. INTRODUCTION Stream invertebrates are a large group of animals (insects, worms, snails, mussels, and crayfish) that dwell in fresh water. In a comprehensive review, Wallace and Webster (1996) reported that stream invertebrates serve as prey for fish, amphibians, mammals, birds, waterfowl, and other wildlife; influence nutrient cycles, primary productivity, and decomposition of organic matter (e.g., falling leaves); and serve as important indicators of stream degradation. Some freshwater invertebrates such as crayfish, mussels, worms, and snails spend their entire life in the water, while insects such as dragonflies, damselflies, mayflies, and beetles spend only their early life stages in streams before emerging from the water to fly. Invertebrates depend on healthy stream habitats, sufficient amounts of water, and adequate water quality. When stream habitat, water quality, or water quantity begins to degrade, the invertebrate community is affected. Accordingly, invertebrates in freshwater streams are monitored to indicate ecological condition. Stream invertebrates are threatened by stormwater runoff, water pollution, changes in water temperature and flow, erosion, sedimentation, and habitat degradation (Thorp and Covich 1991). Landscape stressors that influence the status of stream invertebrates include increased impervious cover (Morse 2003), land use (Moore and Palmer 2005), and nutrient loading (Yuan 2010). Climate change affects stream invertebrates through changes in precipitation patterns and rising temperatures (Fengqing 2013 et al., Poff et al. 2010). An analysis of the relationship between stream invertebrates and impervious cover in Maine streams found that a relatively low percentage of impervious cover (less than 6 percent) was related to a decline in the taxonomic richness of the stream insect community (Morse et al. 2003). Since invertebrate communities live months and even years in a stream, they encounter a wide range of stressors throughout the seasons. The invertebrate communities assimilate the effects of different pollution sources over time, providing an aggregate or cumulative measure of stressors (Plafkin et al. 1989). If a stream invertebrate community lacks pollution-sensitive species or is dominated by pollution-tolerant species, it is generally indicative of impacted waters. Invertebrate communities sampled from impacted waters usually have low species richness and abundance. Therefore, sampling the resident communities provides a stable representation of constantly fluctuating environmental

2
conditions (Rosenberg and Resh 1996). Quantifying invertebrate diversity and abundance can serve as a proxy indicator to characterize the general conditions of a watershed. An example of different macroinvertebrates communities indicating various stream conditions is shown in Figure 1.
Class A Stream indicates an intact watershed. Invertebrate communities in blue circles are sensitive to disturbance/pollution. Non-Attainment Stream indicates a disturbed watershed. Invertebrate communities in red circles are more tolerant to disturbance/pollution.
Not at scale.
Figure 1. Example of stream invertebrate communities as indicators of water quality conditions and stream habitat disturbance. Credit: Tom Danielson, Maine DEP. Because invertebrate communities reflect water quality over time and are relatively easy to collect and identify, biomonitoring is a cost-effective screening tool to monitor for general stressors (Barbour et al. 1999). In fact, stream invertebrates are the most widely used biological assemblage in monitoring carried out by state water resource agencies (USEPA). In New England, state agencies have used various methods of biomonitoring to evaluate rivers and streams (Shelton and Blocksom 2004). The Massachusetts Department of Environmental Protection (MADEP) began collecting invertebrate, habitat, and physical-chemical data from wadeable streams (streams shallow enough for the analyst to safely walk into with chest waders) beginning in 1983, while the Rhode Island Department of Environmental Management (RIDEM) began a wadeable stream invertebrate sampling program in 1991 in cooperation with Roger Williams University (RIDEM 2005).

3
Sampling protocols have evolved over the years, but wadeable stream methodologies are generally based on the EPA’s Rapid Bioassessment Protocols (Barbour et al. 1999) to measure local habitat features (e.g., physical structure, flow regime), water quality parameters, and invertebrate communities (ESS 2014). The quality of in-stream habitat and surrounding buffer habitats are major factors influencing the health and diversity of stream invertebrates (Plafkin et al. 1989). Each state agency’s quality assurance and quality control documents describe their specific methods, as does the Consolidated Assessment and Listing Methodology for the Preparation of the Integrated Water Quality Monitoring and Assessment report (MADEP 2012, RIDEM 2014). However, methods for assessing stream invertebrates in Rhode Island are not applied to many of the coastal streams, as they do not present the appropriate conditions for sampling, such as free flowing water, considering sampling occurs when base flows are at their lowest in riffle habitat. 3. METHODS Habitat and invertebrate data are collected from streams and used by both Massachusetts and Rhode Island to assess the relationship between water quality and stream ecological function. Invertebrate samples are collected from stream sites and then brought to the lab for taxonomic identification and enumeration. Habitat quality is evaluated visually following the Rapid Bioassessment Protocol, including 10 parameters that describe in-stream habitats, stream channel morphology (shape), and structure of the stream banks and buffers (Barbour et al. 1999). This information is supplemented with additional physical site characteristics: surrounding land use; presence or absence of dams; local water erosion; potential non-point source pollution; stream width, depth and flow; inorganic and organic substrate types; and presence of odors, oils and deposits (Plafkin et al. 1989). The states calculate stream invertebrate health (via each state’s Index of Biotic Integrity data) and habitat quality (via state scores), and results are published as part of each state’s Integrated Water Quality Monitoring and Assessment Report. The Narragansett Bay Estuary Program summarized the data from state agencies to categorize stream invertebrate health and habitat quality.
i. Stream Invertebrate Health In the state monitoring programs, field researchers collect invertebrate samples using a net, identify and count the organisms from each sample, and quantify the sample using several metrics. These metrics are combined to calculate an Index of Biotic Integrity (IBI). Although Rhode Island and Massachusetts use differing metrics and equations, both states have threshold values that they use to classify the invertebrate sample into a category. Rhode Island uses a Biological Condition Category, and Massachusetts uses a Rapid Bioassessment Protocol Status. The Estuary Program combined the state data using thresholds for stream invertebrate health (Table 1). Table 1. The Narragansett Bay Estuary Program’s categories of Good and Poor Invertebrate Health, derived from and reconciled with each state’s categories. Invertebrate Health Level MADEP Rapid Bioassessment
Protocol Status RIDEM IBI Thresholds
Good Invertebrate Health Not Impacted >85 Slightly Impacted 56-85
Poor Invertebrate Heath Moderately Impacted 36-55 Severely Impacted <35

4
Stream invertebrate data available for this indicator were collected from 2002 to 2015 in Rhode Island and from 2006 to 2009 in Massachusetts. Both state agencies monitor different basins each year to systematically and intensively collect samples with robust spatial coverage. Between 2002 and 2004, RIDEM expanded the biological monitoring program to collect data using EPA’s Rapid Bioassessment Protocol identifying macroinvertebrates at a higher taxonomic resolution (ESS 2014). In 2004, the monitoring station selection process was expanded to incorporate a rotating basin approach; more recently, RIDEM began moving toward development of a new assessment method using a biotic index to compare stations against a reference condition model, known as Multi-Metric Biological Condition Index (abbreviated as MBCI in tables), which is a tool to classify stream health relative to the reference condition for stations located in the Southern New England Coastal Plains and Hills ecoregion (Griffith et al. 2009, Figure 2). In Massachusetts, MADEP shifted in 2010 from targeted sampling in each watershed (each with its own reference, or “least disturbed”, site) to a probabilistic approach. In conjunction with that approach, the agency in 2011 developed a Reference Site Network using a state-wide probabilistic sampling on a rotating basin approach (Nuzzo, personal correspondence). The Massachusetts probabilistic monitoring and assessment program uses data from randomly selected sites to generate an unbiased assessment of water quality conditions throughout Massachusetts (MAP2 2016). From these data, the agency intends to develop metrics to distinguish between healthy and unhealthy aquatic ecosystems, rather than selecting a reference site for each watershed each time sampling is conducted. However, the most recent data from the five-year cycle of probabilistic analysis between 2010 and 2015 were not available at the time this chapter was written.
ii. Habitat Quality Both state agencies use a habitat assessment protocol to observe and quantify each of the 10 habitat parameters at each site to report a total habitat score (Nuzzo 2003, ESS 2014). These scores can be grouped into four categories to describe the general habitat conditions at a sampling station. Using those scores, the Estuary Program categorized habitat quality as Good or Poor (Table 2). Table 2. The Narragansett Bay Estuary Program’s categories of Good and Poor Habitat Quality, derived from the Rapid Bioassessment Protocol (USEPA). Habitat Quality Levels State Habitat Condition
Categories State Habitat Score Thresholds
Good Habitat Quality Optimal Habitat >150 Sub-optimal Habitat 101-150
Poor Habitat Quality Marginal Habitat 51-100 Poor Habitat <50
iii. Stream Condition Level Combining Invertebrate Health and Habitat Quality
The Estuary Program simplified the state categories for invertebrate health and habitat quality (Tables 1 and 2) and then combined invertebrate health and habitat quality into a general indicator of stream condition in the watershed (Table 3). The indicator has one Good stream condition level and two Poor condition levels. The combination of Poor Invertebrate Health and Good Habitat Quality was defined as Poor Stream Condition (Table 3) because poor water quality likely influences the site.

5
Table 3. Stream condition levels used by the Narragansett Bay Estuary Program.1
Good Stream Condition Good Invertebrate Health and Good Habitat Quality
Poor Stream Condition Poor Invertebrate Health and Good Habitat Quality Poor Invertebrate Health and Poor Habitat Quality
1 The combination of poor habitat and good invertebrate health is generally not encountered and therefore is not included in the table.
The latitude and longitude reported by the states for each sample site were used to associate the site with the Narragansett Bay basins and HUC10 watersheds. The stream invertebrate data were collected from 2002 to 2014 in Rhode Island and from 2006 to 2009 in Massachusetts. As the data cover a period of twelve years and many streams were sampled five to ten years ago, the results should be considered as a snapshot of stream invertebrate conditions over that timeframe. The majority of the sampling sites have not been monitored more than once, and thus a trend analysis was not possible due to lack of temporal data for all sites. Accordingly, the results only represent a general characterization of stream conditions in the Narragansett Bay watershed. The total stream miles were calculated to determine the density of sites per stream mile within each basin. The density of sites within the basins ranged from 0.01 to 0.05 per stream mile (Table 4).
Table 4. Number and density of sites and total stream miles in the basins of the Narragansett Bay
watershed.
Basins Number of sites (at riffle areas in
wadeable streams )
Total stream1 length in basin
(miles) Basin size
(square miles)
Density of sites in the basin
(sites per mile)
Narragansett Bay Watershed 78 3,578.3 1,704.9 0.02
Blackstone River Basin 30 1,137.0 474.6 0.03
Coastal Narragansett Bay Basin
15 827.4 468.9 0.02
Pawtuxet River Basin 21 443.6 231.9 0.05
Taunton River Basin 12 1,170.2 529.5 0.01 1 National Hydrography Dataset
4. STATUS Table 4 and Figure 2 show the number and percentage of sites that were categorized into the three stream condition levels for invertebrates in the Narragansett Bay watershed. Of the 78 stream sites, 62 were classified as having Good Invertebrate Health and Good Habitat Quality (79 percent), and 15 sites (19 percent) had Poor Invertebrate Health and Good Habitat Quality (Table 4; Figure 2). Only one site in the watershed, in the Taunton River Basin, had Poor Habitat Quality and Poor Invertebrate Heath (Figure 2, partially obscured near Brockton). There are no sampling sites in the Middle Taunton River watershed (Figure 2) – HUC10 (0109000402).

6
Table 4. Percentage of sites in each stream condition level by basin and HUC10 watershed.
Basin Stream Condition Level
HUC10 Watershed (Code)
Good Invertebrate Health and Good Habitat Quality
Poor Invertebrate Heath and Good Habitat Quality
Poor Invertebrate Health and Poor Habitat Quality
Total Number of Sites
Blackstone River Basin 80% (24 sites) 20% (6 sites) 30
Upper Blackstone River (0109000301)
8 2 10
Lower Blackstone River (0109000302)
16 4 20
Coastal Narragansett Bay Basin
73% (11 sites) 27% (4 sites) 15
Ten Mile River (0109000404)
5 1 6
Palmer River (0109000407)
2 2
Narragansett Bay (0109000409)
1 1
Woonasquatucket & Moshassuck Rivers (0109000405)
3 3 6
Pawtuxet River Basin 90% (19 sites) 10% (2 sites) 21
Pawtuxet River (0109000406)
19 2 21
Taunton River Basin 67% (8 sites) 25% (3 sites) 8% (1 site) 12
Upper Taunton River (0109000401)
3 3 1 7
Lower Taunton & Frontal Mt. Hope Bay (0109000408)
1 1
Three Mile River (0109000403)
4 4
Total Narragansett Bay Watershed
79% (62 sites) 19% (15 sites) 2% (1 site) 78

7
Figure 2. Stream condition levels in the Narragansett Bay watershed.

8
5. DISCUSSION While stream condition levels in the Narragansett Bay watershed reflect a positive finding in that a majority of the streams sampled, including many headwater streams, indicated good ecological conditions for macroinvertebrates, the results need further analysis to determine if the characterization of conditions can be extrapolated to all wadeable streams. The results are reflective of the type of small, shallow streams that were sampled in the watershed. Generally, streams become larger and wider lower in the watershed, making it impossible to use the wadeable stream method. Given land use patterns in the watershed, sampling locations in upstream parts of the watershed would in general be expected to be located in less-developed areas and to report better habitat and water quality. However, 19 percent of stream sites had good habitat quality but poor invertebrate health. As previously noted, this may indicate water quality problems such as nutrient enrichment or other pollution (Plafkin et al. 1989). In the Pawtuxet River Basin, 90 percent of stream sites sampled were classified as Good Habitat Quality and Good Invertebrate Health. This result likely reflects the less-dense land use patterns and long record of watershed protection actions, including land conservation, around the Scituate Reservoir in the upper portion of the Pawtuxwet River Basin. In the Blackstone River Basin, 80 percent of the sites were classified as Good Habitat Quality and Invertebrate Health. Localized areas in the watershed where stream invertebrate condition levels are good should be prioritized for protection purposes, as increased urbanization drives stressors such as increased impervious cover and decreased water quality, both contributing to degraded invertebrate populations (see “Open Space” chapter). These intact habitats, which provide optimal conditions for macroinvertebrate communities, are sensitive to pollution and changes in habitat quality, and it important to track them. Conversely, 25 percent of the sites in the coastal Narragansett Bay Basin and the Taunton River Basin were characterized as Good Habitat Quality and Poor Invertebrate Health. The reasons for these findings require additional investigation. Poor findings for invertebrate health could reflect degradation of water quality but may also be attributable to the fewer number of streams in the Lowland Ecoregion (Figure 2, areas below the Southern New England Coastal Plains and Hills). RIDEM and MADEP have found that stream degradation is more likely to be occurring in the densely developed watersheds. Results from landscape stressor indicators developed by the Estuary Program show that watersheds and subwatersheds (HUC10 and HUC12 respectively) within the Coastal Narragansett Bay Basin are highly populated (see “Population” chapter) and intensively urbanized (see “Land Use” chapter) with the highest percent of impervious cover (see “Impervious Cover” chapter). Urbanization adversely affects stream ecosystems, and evidence is mounting that even low levels of urbanization can cause significant changes in stream biology, physical habitat, and chemistry (Coles et al. 2014, Morse et al. 2003, Yuan 2010). Large increases in impervious cover, together with increases in storm drains and channelization, can result in increases in the speed and amount of water flowing to streams. This change, combined with pollutants such as sediment, nutrients from fertilizers, and other contaminants, has been linked to numerous types of changes in streams, such as (1) hydrology, including the amount, movement, and distribution of water, (2) physical habitat, the actual structure of the stream that is home for organisms (biota), such as invertebrates and fish, and (3) chemistry. While the mechanisms for these effects are understood, the response of streams to the multiple stressors associated with urbanization are complex. To date, no studies have been conducted to correlate the effect of landscape stressors with the stream condition levels for invertebrate communities or other biological indicators in Narragansett Bay watershed. To support management, further investigation and analysis are needed to better characterize the effects of various stressors on

9
stream conditions and to better understand the range of response in wadeable streams to urbanization in the Narragansett Bay watershed (Coles et al. 2014, USGS 2004). However, the data do not cover many coastal areas of Narragansett Bay because the data collection methods are not suitable for the types of streams there. These coastal streams tend to have lower gradients, slow-moving water, less riffle habitat, and silty bottoms. Because many of these lowland streams lack the appropriate riffle habitat required for using the invertebrate collection methods of the Rhode Island Rapid Bioassessment Protocol, the coastal streams are not sampled for invertebrates. Consequently, there are few, if any, data available on stream invertebrates in many of these watersheds. The findings of this indicator therefore do not necessarily apply to all wadeable streams in the Narragansett Bay watershed. Lastly, it is important to note that across the watershed, density of sampling sites differs among basins (Table 4). The Pawtuxet River Basin has the highest density at 0.05 sites per mile (or 1 site for every 20 stream miles), and the Taunton River Basin has the lowest density at 0.01 site per mile (or 1 site for every 100 miles). The standardization of stream sites represents sampling effort accounting for all the streams and rivers within each basin, but it does not distinguish sampling effort for streams that are suitable for invertebrate assessments using the states’ protocols. 6. DATA GAPS AND RESEARCH NEEDS For those streams that can be sampled with the rapid bioassessment protocol in the subwatersheds of the lowland ecoregion in Rhode Island and Massachusetts, additional sampling to provide more adequate spatial coverage is needed. Given the small proportion of land area in Rhode Island accounted for as lowland, it may be necessary to cooperate with neighboring states with lowland areas to locate a statistically significant number of calibration stations (representing a range of reference and stressed conditions) with adequate riffles for the method—or to employ a more suitable invertebrate collection method—to develop a robust biotic index for use in the lowland ecoregions. Fulfilling this research need would allow data to be collected at more locations throughout Narragansett Bay, enabling a more reliable characterization of invertebrate conditions. In addition, work is needed to develop methods for sampling and interpreting stream invertebrate data from streams in the lowland ecoregion streams for which the current rapid bioassessment protocol is not appropriate. There is precedent for addressing this issue in the mid-Atlantic region. A multi-year effort of data collection and evaluation would be needed and would best be conducted at a regional scale in order to sample a sufficient number of locations. A comprehensive review of the current sampling designs is required to determine if the number of sampling stations is adequate and to determine the appropriate sampling frequency. Both of those factors are essential for improving the statistical analysis capabilities of the protocols. A review of the current sampling designs and capacities in both state agencies could lead to a more specific estimate of the resources needed to address these data gaps and limitations. Refinements of the bioassessment protocols are recommended to increase the precision, accuracy, and power of the models. The refinements may include reclassification of sites based on increased scrutiny of station characteristics, ecoregional borders, elevation, or stream gradients. Likewise, there is a need to determine stream segments that reflect the site conditions of stream invertebrates at the
10
sampling sites, for example, site density and total stream miles at the watershed, subwatershed and catchment areas scales that can allow quantifying the extent of this indicator conditions. Further research investigating the relationship between stream invertebrates and anthropogenic factors in the Narragansett Bay watershed is necessary. Relationships between stream invertebrates and multiple stressors are complex and will require different field- and model-oriented approaches. Some key stressors to focus on include impervious surface, land use changes, nutrient loading, water quality, human population density, stream alteration, and temperature. Also important is analyzing the relationships among macroinvertebrate communities, fish communities, and the stressors, which are particularly relevant to improving our understanding of brook trout populations and other fluvial fish (see “Freshwater Fish Communities” chapter). Integrating similar efforts in the watershed that monitor stream invertebrates and other biological indicators is important to encourage partnership collaboration for future research. For example, the Atlantic Ecology Division (AED) of the U.S Environmental Protection Agency in Narragansett, Rhode Island, monitored streams at 105 sites across Narragansett Bay in 2012 and 2013. The sites were spread across an impervious cover gradient in which 15 reference sites had less than 1 percent impervious cover and 90 sites had varying percentages of cover. In 2013, AED sampled 10 percent of the 2012 sites to look at inter- and intra-annual variability and spatial autocorrelation effects of the indicator response, including macroinvertebrates (Anne Kuhn, personal communication; a report is in preparation). The Estuary Program will continue working with the state agencies and other partners conducting research in the watershed in order to track changes in stream invertebrate communities over time, as temporal and spatial data allow. It is expected that data from both Rhode Island and Massachusetts environmental agencies will continue to be comparable across years, making it possible to perform a trend analysis to quantify changes in biological and habitat conditions of stream invertebrates by site and watershed. In addition, the Estuary Program plans to add a more detailed spatial analysis at the scale of catchment areas, such as brook trout catchment areas, to assist with studies of localized impacts to the macroinvertebrate community. 7. ACKNOWLEDGEMENTS This chapter was written by Eivy Monroy, Watershed and GIS Specialist with the Narragansett Bay Estuary Program, and Katie DeGoosh-DiMarzio and Sue Kiernan with the Rhode Island Department of Environmental Management, Office of Water Resources. We thank Robert M. Nuzzo with the Massachusetts Department of Environmental Protection for the collaborative effort to support the Estuary Program with stream invertebrate data, and for valuable insights and feedback. Julia Twichell, GIS Environmental Analyst with the Estuary Program, provided GIS technical support with data analysis and reporting. 8. REFERENCES Barbour, M.T., M. Gerritsen, B.D. Snyder, and J.B. Stribling. 1999. Rapid Bioassessment Protocols for Use in Streams and Wadeable Rivers: Periphyton, Benthic Macroinvertebrates, and Fish. U.S. Environmental Protection Agency, EPA 8451-B-99-002.

11
Coles, J.F., T.F. Cuffney, G. McMahon, and K.M. Beaulieu. 2004. The effects of urbanization on the biological, physical, and chemical characteristics of coastal New England streams. U.S. Geological Survey Professional Paper 1695. 47 pp. ESS. 2014. Quality Assurance Project Plan Rhode Island Wadeable Streams Biomonitoring and Habitat Assessment. ESS Group, Inc. Retrieved from: www.dem.ri.gov/pubs/qapp/wadestea.pdf Fengqing, L., C. Qinghua, J. Wanxiang, and Q. Xiaodong. 2012. Macroinvertebrate relationships with water temperature and water flow in subtropical monsoon streams of Central China: Implications for climate change. Fundamental Applied Limnology 180(3):221–231. doi: 10.1127/1863-9135/2012/0220. Griffith, G.E., J.M. Omernik, S.A. Bryce, J. Royte, W.D. Hoar, J. Homer, D. Keirstead, K.J. Metzler, G.M. Hellyer. 2009. Ecoregions of New England. U.S. Geological Survey. Reston, VA Massachusetts Department of Environmental Protection (MADEP). 2012. Massachusetts Consolidated Assessment and Listing Methodology (CALM) Guidance Manual. Massachusetts Department of Environmental Protection, Division of Watershed Management. Worcester, MA. Morse, C.C., A.D. Huryn, and C. Cronan. 2003. Impervious surface area as a predictor of the effects of urbanization on stream insect communities in Maine, USA. Environmental Monitoring and Assessment 89(1):95–127. Moore, A.A., and M.A. Palmer. 2005. Invertebrate Biodiversity in Agricultural and Urban Headwater Streams: Implications for Conservation and Management. Ecological Applications 15(4):1169–1177. Nuzzo, R.M. 2003. Standard Operating Procedures. Water Quality Monitoring in Streams Using Aquatic Macroinvertebrates. Massachusetts Department of Environmental Protection, Division of Watershed Management, Worcester, MA. Plafkin, J.L., M.T. Barbour, K.D. Porter, S.K. Gross, and R.M. Hughes. 1989. Rapid Bioassessment Protocols for Use in Streams and Rivers: Benthic Macroinvertebrates and Fish. U.S. Environmental Protection Agency, EPA 444/4-89-001. Poff, N.L., M.I. Pyne, B.P. Bledsoe, C.C. Cuhaciyan, and D.M. Carlisle. 2010. Developing linkages between species traits and multiscaled environmental variation to explore vulnerability of stream benthic communities to climate change. Journal of the North American Benthological Society 29(4):1441–1458. dx.doi.org/10.1899/10-030.1. Rhode Island Department of Environmental Management (RIDEM). 2005. State of Rhode Island and Providence Plantations Water Monitoring Strategy. Rhode Island Department of Environmental Management, Office of Water Resources. Retrieved from: http://www.dem.ri.gov/bayteam/documents/DEM%20Water%20Monitoring%20Strategy%202005-2010.pdf RIDEM. 2014. Consolidated Listing and Assessment Methodology. Rhode Island Department of Environmental Management, Office of Water Resources.

12
Rosenberg, D.M., and V.H. Resh. 1996. Use of Aquatic Insects in Biomonitoring. In: Merritt, R.W., and K.W. Cummins (Eds.), An Introduction to the Aquatic Insects of North America. Dubuque, Iowa, pp. 87–97. State of Connecticut Department of Energy and Environmental Protection Bureau of Water Protection and Land Reuse, Planning and Standards Division (CT DEEP). Undated. Physical, Chemical & Biological Attributes of Streams vs. Amount of Upstream Impervious Land Cover. Retrieved from: http://www.ct.gov/deep/lib/deep/water/water_quality_management/ic_studies/ic_facts.pdf Shelton, A.D., and K.A. Blocksom. 2004. A Review of Biological Assessment Tools and Biocriteria for Streams and Rivers in New England States. U.S. Environmental Protection Agency. Cincinnati, OH. EPA/600/R-04/168. Thorp, J.H., and A. P. Covich. 1991. An Overview of Freshwater Habitats. In: Thorp. J.H., and A.P. Covich (Eds.), Ecology and Classification of North American Freshwater Invertebrates. Boston, MA, pp. 17–36. U.S. Environmental Protection Agency (EPA). Undated. Rapid Biological Assessment Protocols: An Introduction. Watershed Academy Web. Retrieved from: https://cfpub.epa.gov/watertrain/pdf/modules/rapbioassess.pdf U.S. Geological Survey (USGS). 2014. Effects of Urbanization on Stream Ecosystems: Frequently Asked Questions. Retrieved from: https://water.usgs.gov/nawqa/urban/html/faq.html#findings Wallace, J.B., and J.R. Webster. 1996. The role of macroinvertebrates in stream ecosystem function. Annual Review of Entomology 41:115–139. Yuan, L.L. 2010. Estimating the effects of excess nutrients on stream invertebrates from observational data. Ecological Applications 20:110–125. doi:10.1890/08-1750.1.