Embed Size (px)
Citation preview
) I tcror~
7.0 9.0 9.0 t0.0 u . o tz 14 [e 1.010 ~ I I i I i 1 I I
I° nfl~ m
R 0 . 9 9 0 _ _
( !
F 0 . 9 8 0 _ _
1
G 0.970 _
C
t 0.9eo _
o
I3 0.95Q ~
C Q Q. 940 _
0 , 9 3 0 _ _
0,920 __
0, 910
29
l ' ' ' I ' ' ' I ' l ' I ' ' ' I ' 1400 I ~ I nnn 80O
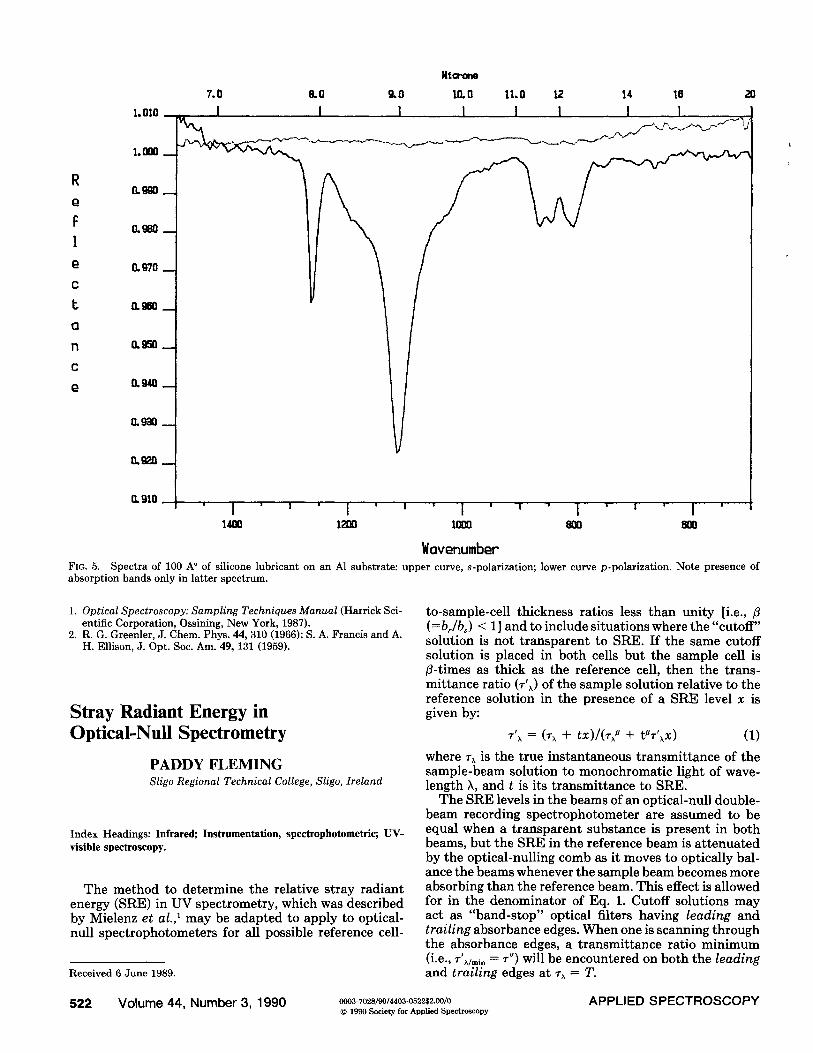
Wavenumber FIG. 5. Spectra of 100 A ° of silicone lubricant on an A1 substrate: upper curve, s-polarization; lower curve p-polarization. Note presence of absorption bands only in latter spectrum.
1. Optical Spectroscopy: Sampling Techniques Manual (Harrick Sci- entific Corporation, Ossining, New York, 1987).
2. R. G. Greenler, J. Chem. Phys. 44, 310 (1966); S. A. Francis and A. H. Ellison, J. Opt. Soc. Am. 49, 131 (1959).
S t r a y R a d i a n t E n e r g y i n
O p t i c a l - N u l l S p e c t r o m e t r y
P A D D Y F L E M I N G Sligo Regional Technical College, Sligo, Ireland
Index Headings: Infrared; Instrumentation, spectrophotometric; UV- visible spectroscopy.
The method to de termine the relative stray radiant energy (SRE) in UV spectrometry, which was described by Mielenz et al., 1 may be adapted to apply to optical- null spec t rophotometers for all possible reference cell-
R e c e i v e d 6 J u n e 1989.
to-sample-cell thickness ratios less t han uni ty [i.e., (=br/bs) < 1] and to include si tuations where the " c u t o f f ' solution is not t r ansparen t to SRE. I f the same cutoff solution is placed in bo th cells bu t the sample cell is fi-times as thick as the reference cell, then the trans- mi t tance ratio (r'x) of the sample solution relative to the reference solution in the presence of a SRE level x is given by:
~'~ = (~ + t x ) / ( r / + t~ '~x) (1)
where ~x is the t rue ins tantaneous t ransmi t tance of the sample-beam solution to monochromat ic light of wave- length ~, and t is its t ransmi t tance to SRE.
The SRE levels in the beams of an optical-null double- beam recording spec t rophotometer are assumed to be equal when a t r ansparen t substance is present in bo th beams, but the SRE in the reference beam is a t t enua ted by the optical-nulling comb as it moves to optically bal- ance the beams whenever the sample beam becomes more absorbing than the reference beam. This effect is allowed for in the denominator of Eq. 1. Cutoff solutions may act as "band-s top" optical filters having leading and trailing absorbance edges. When one is scanning through the absorbance edges, a t ransmi t tance ratio min imum (i.e., r'~/mi, = r") will be encountered on both the leading and trailing edges at 7x = T.
522 Volume 44, Number 3, 1990 oo0~-7o2s/9o/44o3-o52252.oo/o APPLIED S P E C T R O S C O P Y © 1990 Society for Applied Spectroscopy
Using the derivative method, i.e., by setting dr '~/drx equal to zero at r~ = T, gives
T~ + t~r"x = ( T + t x ) f l T ~-1. (2)
Solving for x in Eq. 2 gives
x = (1 - 13)T~/(t l3T ' -1 - t~T"). (3)
However, the spectrophotometric observable in this in- strumental exercise is not T but r". If the expression for x given by Eq. 3 is substituted into Eq. 1, simplified, and rearranged, then the following ensues:
T = (~T") 1/(1-/~). (4)
Substitute Eq. 4 into Eq. 3 to yield:
x = ((1//5 - 1)/(t - t4r"2))(f lr") 1/(1-~l. (5)
Equation 5 is an exact general expression which relates the SRE level to the observed transmittance ratio min- imum, to the transmittance of the sample solution to SRE, and to the reference cell-to-sample-cell thickness ratio. However, the transmittance of the sample solution to SRE is an elusive quantity. If the cutoff sample is assumed to be transparent to SRE (i.e., t = 1), then Eq. 5 becomes
x ' = ((1//~ - 1)/(1 - 1""2))(flI"")1/(1-~). (6)
The relative SRE level x' given by Eq. 6 will be less than the true relative SRE level given by Eq. 5 as follows for v" < 1.
x = ((1 - ~"2)/(t - t~r"2))x ' = x ' / t . (7)
Transmittance readings in optical-null spectrometry are unreliable if they are less than 5%. The recom- mended SRE test method to date involved placing a filter in the sample beam, which was opaque to the primary radiation but transparent to SRE. The resulting trans- mittance reading was then ascribed to SRE. However, this latter reading, being less than 5%, is a doubtful measure of SRE. The method described in this paper gives transmittance-ratio minima readings greater than 5%; e.g., i fx ' = 0.005 and/~ = 0.5, then r" = 0.14 (14%).
1. K. D. Mielenz, V. R. Weidner, and R. W. Burke, Appl. Opt. 21, 3354 (1982).
Raman Studies of Model Vesicle Systems
J A N E A N A S T A S S O P O U L O U and T H E O P H I L E T H E O P H A N I D E S * National Technical University of Athens, Chemical Engineering, Laboratory of Physical Chemistry, Ra- diation Chemistry and Biospectroscopy, Zografou Campus, Athens, Greece
Index Headings: Raman Spectroscopy; Vesicles; Surfactants.
INTRODUCTION
Raman spectroscopy has been used to study the par- affin-like side chain of lipids. 1'2 Model molecules have been employed to study the interactions defining bilayer or vesicle reorganization as a function of concentration or vesicle temperature. It is known that vesicle structural and functional properties may be altered by lipid-lipid reorganization and single-compartment or multicom- partment vesicle formation. The synthetic vesicles stud- ied here are defined as smectic mesophases of completely synthetic surfactant bilayers containing entrapped water2 Although many publications 3-5 have documented the uti- lization of monolayers and bilayers, we believe that ves- icle reorganization phenomena during polymerization of vesicles form an interesting process that deserves more study. Two synthetic vesicles--didodecyldimethylam- monium bromide (DDAB), positively charged, and di- hexadecylphosphate (DHP), negatively charged--both have a long chain of -CH2- groups extended from one end to the other in the multicompartment vesicle. DDAB is a quaternary ammonium salt of bromide with one end hydrophobic [{-(CH2)tt-CH3}2] and the other end hy- drophilic (-N+(CH3)2-), and DHP is a phosphate salt with
Received 4 August 1989. * Author to whom correspondence should be sent.
Cl
18(30' ' 160C~ ' 1 4 0 0 ' ' 1200 ' ' 1QO0' ' S u O c m 4
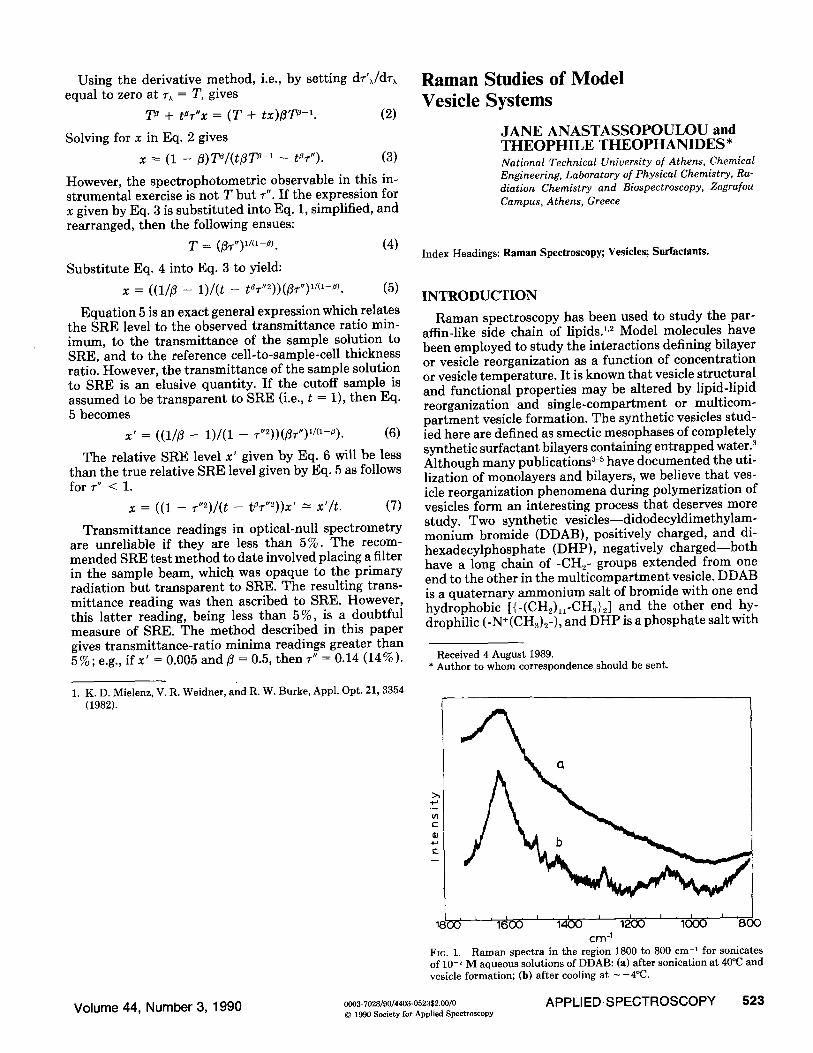
FIG. 1. Raman spectra in the region 1800 to 800 cm- ' for sonicates of 10 -2 M aqueous solutions of DDAB: (a) after sonication at 40°C and vesicle formation; (b) after cooling at - - 4 ° C .
Volume 44, Number 3, 1990 0003-7028/90/4403-052352.00/0 APPLIED. SPECTROSCOPY 523 © 1990 Society for Applied Spectroscopy