Embed Size (px)
Citation preview

YEAR 1 (2012/2013)
MONITORING RESULTS
STRAWBERRY PLANT PARK AND
PRITCHARD PARK EAST BLUFF
RESTORATION PROJECTS
Bainbridge Island, Washington
Prepared for the
City of Bainbridge Island
Prepared by
RIDOLFI Inc.
May 2013

Year 1 (2012/2013) Monitoring Results
Strawberry Plant Park and Pritchard Park East Bluff
Restoration Projects
Bainbridge Island, Washington
Prepared for
City of Bainbridge Island
Prepared by
RIDOLFI Inc.
May 2013

Year 1 (2012/2013) Monitoring Results
Strawberry Plant Park and Pritchard Park East Bluff Restoration Projects
330A_Bainbridge Mon Results_130327.docx May 2013 Page i
EXECUTIVE SUMMARY
The Strawberry Plant Park and Pritchard Park East Bluff Restoration Project sites, managed by
the City of Bainbridge Island, were identified for habitat restoration efforts by the Elliott Bay
Trustee Council (Trustees). The Trustees received funds for the projects to restore natural
resources injured by hazardous substances released from the Wyckoff facility in Eagle Harbor.
The restoration projects were designed to restore key habitats at the Sites including riparian,
marsh, intertidal flats, and forage fish spawning beaches. These restored habitats are intended
to support a variety of plants and animals, and in particular to provide beneficial habitat for
juvenile salmonids, forage fish and other migratory and resident fish species, as well as shore
birds and other wildlife.
Restoration activities were completed at the Sites in 2011, and the City, in collaboration with the
Trustees, developed a long-term monitoring program to guide monitoring activities to evaluate
the Sites and to inform adaptive management efforts at the Sites. Specific objectives of the
program are presented here and are the basis for the monitoring plan for the Site:
Measure the success of the restoration efforts
Identify adaptive management measures that may be beneficial at the Sites
Address monitoring requirements specified by permitting agencies
Serve as an outreach tool to disseminate project information to stakeholders
To meet these objectives, this monitoring report describes the Year 1 (2012/2013) monitoring
activities and field work, assesses progress toward meeting the success criteria, and
recommends adjustments (adaptive management) for future monitoring years.
The monitoring results were analyzed to evaluate whether the Sites are meeting performance
objectives. Based on these analyses, the performance objectives for the riparian vegetation are
not being met at the Sites. The performance objectives for marsh vegetation at Strawberry Plant
Park is being met and the marsh area is quite robust and healthy. However, whether the
percent cover of riparian and marsh vegetation is remaining stable or increasing over time
cannot be assessed based on a single year of monitoring.
Forage fish eggs were not observed in beach substrates at the Pritchard Park East Bluff site.
While a portion of the sampled beach substrates may be the appropriate size and at the
appropriate tidal elevations to support surf smelt (Hypomesus pretiosus) spawning, they were
not of appropriate size and elevations for Pacific sand lance (Ammodytes hexapterus).
Adaptive Management Recommendations
Based on the Year 1 (2012/2013) monitoring results presented in this report, we have the
following recommendations:

Year 1 (2012/2013) Monitoring Results
Strawberry Plant Park and Pritchard Park East Bluff Restoration Projects
330A_Bainbridge Mon Results_130327.docx May 2013 Page ii
Strawberry Plant Park
Continue planned monitoring efforts in Year 2 (2013/2014).
Determine if the irrigation system is functioning and determine the schedule for irrigation.
Remove non-native or invasive species such as Scot’s broom, Himalayan blackberry,
white sweet-clover, field bindweed, butterfly bush, pea vine, Canada thistle, curly dock,
prickly lettuce, Queen Anne’s lace, and black locust tree seedlings.
Remove invasive species in the western portion of the site not reached in the September
event, and in previously worked areas where they were missed or may have
reestablished.
Target weeding around the plantings throughout site to create a buffer and encourage
growth.
Apply mulch to the newly weeded areas around the native plants to suppress weeds and
retain moisture.
Conduct supplemental planting in areas where high mortality has occurred.
Continue to mow the meadow area to control Scot’s broom seed source.
Pritchard Park East Bluff
Continue planned monitoring efforts in Year 2 (2013/2014).
Determine if the irrigation system is functioning and determine the schedule for irrigation.
Remove non-native or invasive species such as Scot’s broom, Himalayan blackberry,
white sweet-clover, field bindweed, butterfly bush, pea vine, Canada thistle, curly dock,
prickly lettuce, Queen Anne’s lace, and English ivy.
Target weeding around the plantings throughout the site to create a buffer and
encourage growth.
Apply mulch to the newly weeded areas around the native plants to suppress weeds and
retain moisture. This work could be postponed until spring 2014 if budget and time
constraints occur.
Monitor erosion along riparian area bordering the beach.
Monitor grainsize of substrates in the pocket beach that was created to support forage
fish spawning habitat.

Year 1 (2012/2013) Monitoring Results
Strawberry Plant Park and Pritchard Park East Bluff Restoration Projects
330A_Bainbridge Mon Results_130327.docx May 2013 Page iii
TABLE OF CONTENTS
EXECUTIVE SUMMARY ........................................................................................ i
1.0 INTRODUCTION ..........................................................................................1
1.1 Project Objectives ......................................................................................... 1 1.2 Background Information on the Sites ............................................................ 2
1.2.1 Strawberry Plant Park ..................................................................... 2 1.2.2 Pritchard Park East Bluff ................................................................. 2
2.0 METHODS ....................................................................................................4
2.1 Biological Success Criteria ........................................................................... 4
2.1.1 Riparian Vegetation Percent Coverage ........................................... 4 2.1.2 Data Analysis .................................................................................. 7 2.1.3 Marsh Development/Percent Coverage .......................................... 8 2.1.4 Data Analysis .................................................................................. 8 2.1.5 Forage Fish Access/Presence ........................................................ 9
2.2 Physical Success Criteria ........................................................................... 10
2.2.1 Elevation and Morphology ............................................................ 10 2.2.2 Photo Point Monitoring and Visual Inspections ............................. 10
3.0 MONITORING RESULTS ........................................................................... 12
3.1 Riparian Vegetation Percent Coverage ....................................................... 12
3.1.1 Strawberry Plant Park Site ............................................................ 12 3.1.2 Pritchard Park East Bluff site ........................................................ 14
3.2 Marsh Development/Percent Coverage ...................................................... 15
3.2.1 Marsh Success Evaluation ............................................................ 15
3.3 Forage Fish Access/Presence .................................................................... 16 3.4 Topographic Survey ................................................................................... 17 3.5 Photo Point Monitoring and Visual Inspection ............................................. 17
4.0 ADAPTIVE MANAGEMENT RECOMMENDATIONS ................................. 18
4.1 Adaptive Management Recommendations ................................................. 18
4.1.1 Strawberry Plant Park ................................................................... 18 4.1.2 Pritchard Park East Bluff ............................................................... 18
5.0 REFERENCES ........................................................................................... 19
Year 1 (2012/2013) Monitoring Results
Strawberry Plant Park and Pritchard Park East Bluff Restoration Projects
330A_Bainbridge Mon Results_130327.docx May 2013 Page iv
LIST OF FIGURES
Figure 1. Site Locations
Figure 2. Strawberry Plant Park Riparian Baselines and Transects, Marsh Quadrats, and
Photo Point Locations
Figure 3. Pritchard Park East Bluff Riparian Baseline and Transects, Forage Fish Survey
Transects, and Photo Point Locations
Figure 4. Transect 1 (7-9 ft MLLW) Grainsize Distribution Curve – December 2012
Figure 5. Transect 2 (7-9 ft MLLW) Grainsize Distribution Curve – December 2012
Figure 6. Transect 1 (7-9 ft MLLW) Grainsize Distribution Curve – January 2013
Figure 7. Transect 2 (7-9 ft MLLW) Grainsize Distribution Curve – January 2013
LIST OF TABLES
Table 1. Strawberry Plant Park Crown Cover on Riparian Transects
Table 2. Strawberry Plant Park Groundcover on Riparian Transects
Table 3. Pritchard Park Canopy Cover on Riparian Transects
Table 4. Pritchard Park Groundcover on Riparian Transects
Table 5. Strawberry Plant Park Percent Coverage on Marsh Quadrats
LIST OF APPENDICES
Appendices are provided on CD, located at the inside back cover of this report.
Appendix A. Riparian Information
Appendix B. Marsh Information
Appendix C. Forage Fish Information
Appendix D. Photo Point Information
Year 1 (2012/2013) Monitoring Results
Strawberry Plant Park and Pritchard Park East Bluff Restoration Projects
330A_Bainbridge Mon Results_130327.docx May 2013 Page v
ACRONYMS AND ABBREVIATIONS
City City of Bainbridge Island
GPS Global Positioning System
Ridolfi RIDOLFI Inc.
monitoring program City of Bainbridge Island Shoreline Restoration Monitoring Program
MLLW Mean Lower Low Water
NRDA Natural Resource Damage Assessment
PVC polyvinyl chloride
Sites Strawberry Plant Park and Pritchard Park East Bluff Restoration
Projects
Trustees Elliott Bay Trustee Council
WDFW Washington State Department of Fish and Wildlife
Year 1 (2012/2013) Monitoring Results
Strawberry Plant Park and Pritchard Park East Bluff Restoration Projects
330A_Bainbridge Mon Results_130327.docx May 2013 Page 1
1.0 INTRODUCTION
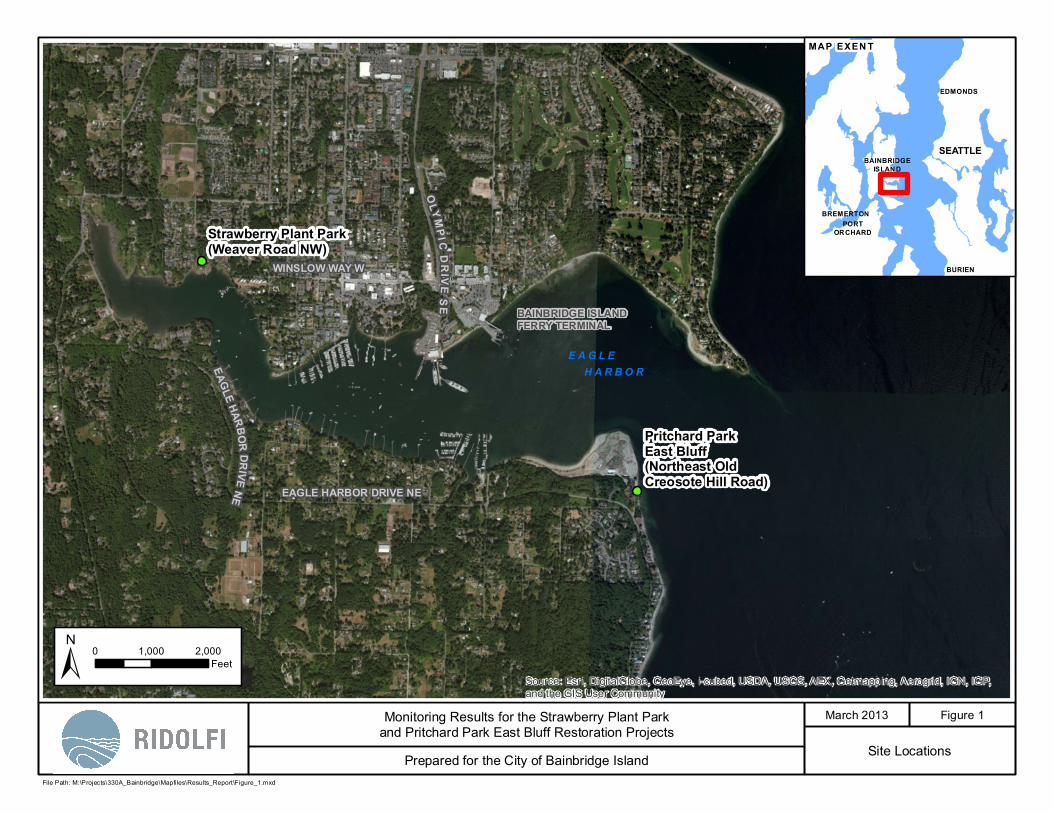
This monitoring results report has been prepared on behalf of the City of Bainbridge Island (the
City) to provide a summary of the results of Year 1 (2012/2013) monitoring at the Strawberry
Plant Park and Pritchard Park East Bluff Restoration Project sites [Figure 1; (the Sites)]. The
Sites, managed by the City, were identified for habitat restoration efforts by the Elliott Bay
Trustee Council (Trustees)1. The Trustees received funds for the projects to restore natural
resources injured by hazardous substances released from the Wyckoff facility in Eagle Harbor.
The restoration projects were designed to restore key habitats at the Sites including riparian,
marsh, intertidal flats, and forage fish spawning beaches. These restored habitats are intended
to support a variety of plants and animals, and in particular to provide beneficial habitat for
juvenile salmonids, forage fish and other migratory and resident fish species, as well as shore
birds and other wildlife. Restoration activities were completed at the Sites in 2011, and the City,
in collaboration with the Trustees, developed a long-term monitoring program to guide
monitoring activities to evaluate the Sites and to inform adaptive management efforts at the
Sites.
The long-term monitoring program will occur over a ten year period with monitoring events
scheduled for Years 1,2,3,5, 7, and 10. Year 1 monitoring results serve as the baseline against
which all other monitoring events conducted over the 10-year program will be compared. Based
on the results of Years 1, 2, and 3, monitoring activities for Years 5, 7, and 10 may be modified.
This Year 1 monitoring results report presents findings for the first year of monitoring and the
resulting adaptive management recommendations.
1.1 Project Objectives
The purpose of this monitoring effort was to satisfy the objectives of the long-term monitoring
program for the Strawberry Plant Park and the Pritchard Park East Bluff shoreline restoration
projects. The long-term monitoring program includes physical and biological monitoring to
evaluate site conditions and effectiveness of those conditions in meeting the original intent of
restoration objectives for the Sites. The objectives of the monitoring efforts described in the
monitoring plan were developed in part by referencing the Commencement Bay Natural
Resource Damage Assessment (NRDA) Monitoring Program (CB Trustees, 2000). Those
objectives are presented here and are the basis for the monitoring plan for the Sites:
1 The Elliott Bay Trustee Council (Trustees) includes the National Oceanic and Atmospheric
Administration (NOAA), the U.S. Department of the Interior (U.S. Fish and Wildlife Service), the
Suquamish Tribe, and the Muckleshoot Indian Tribe.

Year 1 (2012/2013) Monitoring Results
Strawberry Plant Park and Pritchard Park East Bluff Restoration Projects
330A_Bainbridge Mon Results_130327.docx May 2013 Page 2
Measure the success of the restoration efforts
Identify adaptive management measures that may be beneficial at the Sites
Address monitoring requirements specified by permitting agencies
Serve as an outreach tool to disseminate project information to stakeholders
To meet these objectives, this monitoring report describes the Year 1 (2012/2013) monitoring
activities and field work, assesses progress toward meeting the success criteria, and
recommends adjustments (adaptive management) for future monitoring years.
1.2 Background Information on the Sites
1.2.1 Strawberry Plant Park
The Strawberry Plant Park site is in the southern portion of Section 27, Township 25 North,
Range 2 East (Figure 1). The Strawberry Plant Park site is located at 240 Weaver Road,
Bainbridge Island, WA 98110. The Strawberry Plant Park site is situated on the northern shore
of Eagle Harbor, on a parcel owned by the City of Bainbridge Island, with a parcel ID number of
27250240062000. The parcel size totals 3.9 acres.
The Strawberry Plant Park Restoration Project is intended to create salt marsh habitat from
approximately +10 to +13 feet mean lower low water (MLLW) and riparian buffer habitat from
approximately +13 feet and greater MLLW to benefit juvenile salmonids and other species
(Figure 2).
The project will improve habitat for juvenile salmonids and forage fish by increasing areas for
rearing and foraging, as well as by enhancing conditions for important prey resources, such as
resident fish and terrestrial insects. Revegetation of the area with native plants will provide
wildlife habitat for insects, small mammals, and migratory waterfowl and shorebirds. The
proposed project will also provide a link between other restoration projects in the Eagle Harbor
area.
1.2.2 Pritchard Park East Bluff
The Pritchard Park East Bluff site is located in the eastern region of Section 36, Township 25
North, Range 2 East (Figure 1). The Pritchard Park East Bluff site is located at 5300 Creosote
Place N.E., Bainbridge Island, WA 98110. The Pritchard Park East Bluff site is situated on
shore of the Puget Sound, and appears to include portions of several tax parcels. The majority
of the Pritchard Park East Bluff site is encompassed by parcel ID 35250210342002, owned by
the City of Bainbridge Island. This parcel has a total acreage of 22.96 acres, although the
restored portion of the Pritchard Park East Bluff site itself is approximately 2.2 acres in size.

Year 1 (2012/2013) Monitoring Results
Strawberry Plant Park and Pritchard Park East Bluff Restoration Projects
330A_Bainbridge Mon Results_130327.docx May 2013 Page 3
The Pritchard Park East Bluff Restoration Project is intended to create riparian buffer habitat
from approximately +13 to +18 feet MLLW including the upland areas of the property to benefit
juvenile salmonids, forage fish and other species (Figure 3).
Below +13 MLLW, a pocket beach was created to provide intertidal habitat for salmonids and
spawning areas for forage fish. The project will improve habitat for juvenile salmonids and
forage fish by increasing areas for rearing and foraging, as well as by enhancing conditions for
important prey resources, such as resident fish and terrestrial insects. Revegetation of the area
with native plants will provide wildlife habitat for insects, small mammals, and migratory
waterfowl and shorebirds. The proposed project will also provide a link between other
restoration projects in the Eagle Harbor area.

Year 1 (2012/2013) Monitoring Results
Strawberry Plant Park and Pritchard Park East Bluff Restoration Projects
330A_Bainbridge Mon Results_130327.docx May 2013 Page 4
2.0 METHODS
This section describes the methods that were used to monitor the physical and biological
success of the restoration sites. A summary of the primary objectives and methods for each of
the monitoring tasks is provided in the following sections of this results report. The primary
objectives were developed in part by referencing the Commencement Bay NRDA Restoration
Monitoring Program (CB Trustees, 2000). More specific information on monitoring methods is
provided in the monitoring plan developed for the Sites (Ridolfi, 2012).
Year 1 monitoring results serve as the baseline against which all other monitoring events
conducted over the 10-year monitoring program will be compared. The monitoring plan was
developed to include the first three years of monitoring. This annual monitoring report is the first
of three that will be produced for each monitoring year. The Year 3 monitoring report will
include a recommendation for continued monitoring based on progress toward the Year 10
goals as outlined in this monitoring plan. Based on the results of Years 1, 2, and 3, monitoring
activities in Years 5, 7, and 10 may be modified.
Vegetation monitoring was conducted in late summer/early fall 2012. Topographic surveys
were conducted by the City in late summer/early fall 2012. Forage fish beach surveys were
conducted between the months of November and January at the appropriate tide. Photo point
monitoring and visual observations were conducted d in late summer/early fall in conjunction
with the vegetation monitoring, and were repeated in late January 2013.
2.1 Biological Success Criteria
2.1.1 Riparian Vegetation Percent Coverage
Primary objective: Percent cover of native trees, shrubs, herbs, and other riparian
vegetation should be stable or increasing over time, and cover not less than 90 percent
of the upland vegetated area of the project after 10 years. Invasive plant coverage
should be minimal; species of special concern include Rubus procerus (Himalayan
blackberry), Cystisus scoparius (Scot’s broom), Polygonum cuspidatum (Japanese
knotweed), and Lepidium latifolium (perennial pepperweed) (CB Trustees, 2000).
In this task, the percent cover of riparian vegetation was measured at both Sites in early
October. This was done using the line intercept sampling method to measure crown cover,
species dominance, and canopy structure. Groundcover was estimated using mean visual
estimates from two quadrats (Elzinga et al., 1998).
Year 1 (2012/2013) Monitoring Results
Strawberry Plant Park and Pritchard Park East Bluff Restoration Projects
330A_Bainbridge Mon Results_130327.docx May 2013 Page 5
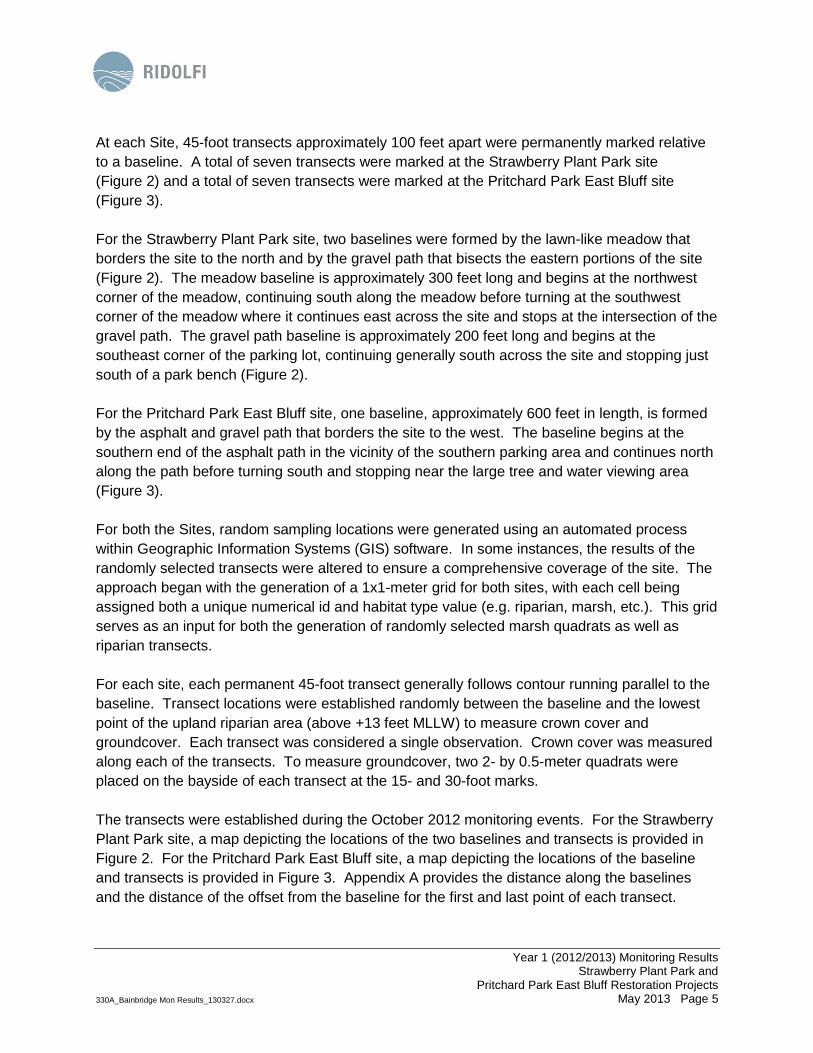
At each Site, 45-foot transects approximately 100 feet apart were permanently marked relative
to a baseline. A total of seven transects were marked at the Strawberry Plant Park site
(Figure 2) and a total of seven transects were marked at the Pritchard Park East Bluff site
(Figure 3).
For the Strawberry Plant Park site, two baselines were formed by the lawn-like meadow that
borders the site to the north and by the gravel path that bisects the eastern portions of the site
(Figure 2). The meadow baseline is approximately 300 feet long and begins at the northwest
corner of the meadow, continuing south along the meadow before turning at the southwest
corner of the meadow where it continues east across the site and stops at the intersection of the
gravel path. The gravel path baseline is approximately 200 feet long and begins at the
southeast corner of the parking lot, continuing generally south across the site and stopping just
south of a park bench (Figure 2).
For the Pritchard Park East Bluff site, one baseline, approximately 600 feet in length, is formed
by the asphalt and gravel path that borders the site to the west. The baseline begins at the
southern end of the asphalt path in the vicinity of the southern parking area and continues north
along the path before turning south and stopping near the large tree and water viewing area
(Figure 3).
For both the Sites, random sampling locations were generated using an automated process
within Geographic Information Systems (GIS) software. In some instances, the results of the
randomly selected transects were altered to ensure a comprehensive coverage of the site. The
approach began with the generation of a 1x1-meter grid for both sites, with each cell being
assigned both a unique numerical id and habitat type value (e.g. riparian, marsh, etc.). This grid
serves as an input for both the generation of randomly selected marsh quadrats as well as
riparian transects.
For each site, each permanent 45-foot transect generally follows contour running parallel to the
baseline. Transect locations were established randomly between the baseline and the lowest
point of the upland riparian area (above +13 feet MLLW) to measure crown cover and
groundcover. Each transect was considered a single observation. Crown cover was measured
along each of the transects. To measure groundcover, two 2- by 0.5-meter quadrats were
placed on the bayside of each transect at the 15- and 30-foot marks.
The transects were established during the October 2012 monitoring events. For the Strawberry
Plant Park site, a map depicting the locations of the two baselines and transects is provided in
Figure 2. For the Pritchard Park East Bluff site, a map depicting the locations of the baseline
and transects is provided in Figure 3. Appendix A provides the distance along the baselines
and the distance of the offset from the baseline for the first and last point of each transect.

Year 1 (2012/2013) Monitoring Results
Strawberry Plant Park and Pritchard Park East Bluff Restoration Projects
330A_Bainbridge Mon Results_130327.docx May 2013 Page 6
A GPS unit and a measuring tape were used to set the transects. Plastic stakes were inserted
along the baselines to permanently mark the 100 foot offset transects. Once the baseline and
100 foot marks along the baseline were established, a measuring tape was used to set the 45
foot transects. Each 45 foot transect was permanently marked at the beginning and end with
wooden stakes and flagging. The wooden stake marking the beginning was painted blue and
the wooden stake marking the end was painted red. A permanent marker was used to label
flagging with an identification number at each beginning point (e.g., Transect 1 = T-1). The
hand-measured distances and recorded survey points were used to create a map for this
monitoring event and to use as an aid for locating transects during subsequent monitoring
events (Figures 2 and 3; Appendix A).
2.1.1.1 Crown Cover
The line intercept sampling method was used to measure percent crown cover of woody
species (Ridolfi, 2012). Crown cover was measured along each transect using a measuring
tape. Only the canopy of woody species was measured. A measuring tape was extended 45
feet along contour from the first rebar of the transect to the end rebar of the transect. A field
team member walked along the landward side of the tape until coming to a woody species.
Each woody species that was encountered along the transect had its canopy measured at the
start point and the end point of where its dripline or overhang intersected the transect. If two or
more woody species overlapped along the transect, they were measured as one unit. Each
woody species encountered along the transect was identified to species. To estimate the
percent canopy cover for each transect, the lengths of the individual canopy intercepts were
added and then divided by 45 feet. The percent canopy cover was calculated by averaging the
canopy cover measured for each transect.
2.1.1.2 Groundcover
Percent groundcover was visually estimated from two quadrats placed at the 15- and 30-foot
mark of each transect (Ridolfi, 2012). A measuring tape was used to find the appropriate
sample points. Measurements started at the first rebar marker of each transect. A quadrat
template constructed with polyvinyl chloride (PVC) pipe measuring 2 meters long by 0.5 meter
wide was placed on the bayside of each transect at the 15- and 30-foot mark. Each quadrat
was situated so that the corner of the quadrat closest to the first rebar marker was touching the
sample point with the remainder of the quadrat extended towards the end point of the transect.
Each quadrat was subdivided into four grids measuring 0.5 meter by 0.5 meter. Percent
coverage of living and non-living groundcover plants present within the grids was visually
estimated along with the percent of non-plant cover (leaf litter, moss, mulch, large wood, and
detritus) and bare ground to determine the percent cover for each quadrat. Woody, native, and
invasives were identified to species. Estimations for each of the three classes (plant, non-plant,
and bare ground) were totaled and averaged to determine percent groundcover.
Year 1 (2012/2013) Monitoring Results
Strawberry Plant Park and Pritchard Park East Bluff Restoration Projects
330A_Bainbridge Mon Results_130327.docx May 2013 Page 7
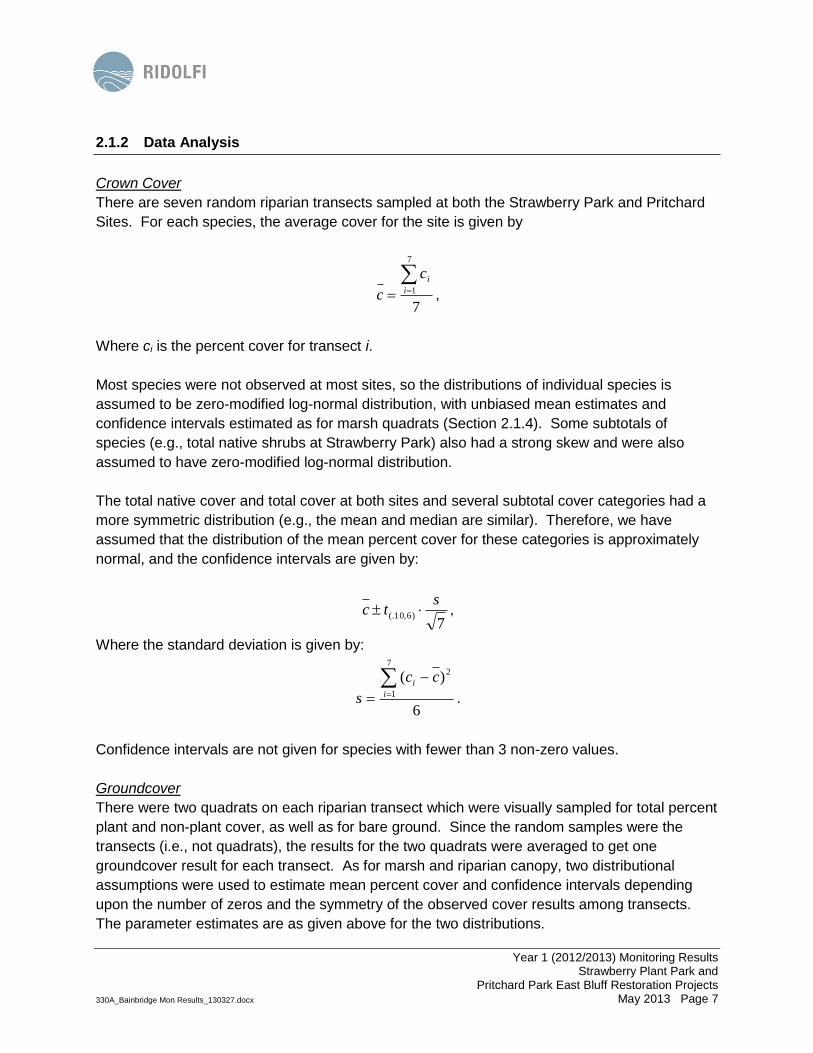
2.1.2 Data Analysis
Crown Cover
There are seven random riparian transects sampled at both the Strawberry Park and Pritchard
Sites. For each species, the average cover for the site is given by
7
7
1
i
ic
c ,
Where ci is the percent cover for transect i.
Most species were not observed at most sites, so the distributions of individual species is
assumed to be zero-modified log-normal distribution, with unbiased mean estimates and
confidence intervals estimated as for marsh quadrats (Section 2.1.4). Some subtotals of
species (e.g., total native shrubs at Strawberry Park) also had a strong skew and were also
assumed to have zero-modified log-normal distribution.
The total native cover and total cover at both sites and several subtotal cover categories had a
more symmetric distribution (e.g., the mean and median are similar). Therefore, we have
assumed that the distribution of the mean percent cover for these categories is approximately
normal, and the confidence intervals are given by:
7)6,10(.
stc ,
Where the standard deviation is given by:
6
)(2
7
1
i
i cc
s .
Confidence intervals are not given for species with fewer than 3 non-zero values.
Groundcover
There were two quadrats on each riparian transect which were visually sampled for total percent
plant and non-plant cover, as well as for bare ground. Since the random samples were the
transects (i.e., not quadrats), the results for the two quadrats were averaged to get one
groundcover result for each transect. As for marsh and riparian canopy, two distributional
assumptions were used to estimate mean percent cover and confidence intervals depending
upon the number of zeros and the symmetry of the observed cover results among transects.
The parameter estimates are as given above for the two distributions.
Year 1 (2012/2013) Monitoring Results
Strawberry Plant Park and Pritchard Park East Bluff Restoration Projects
330A_Bainbridge Mon Results_130327.docx May 2013 Page 8
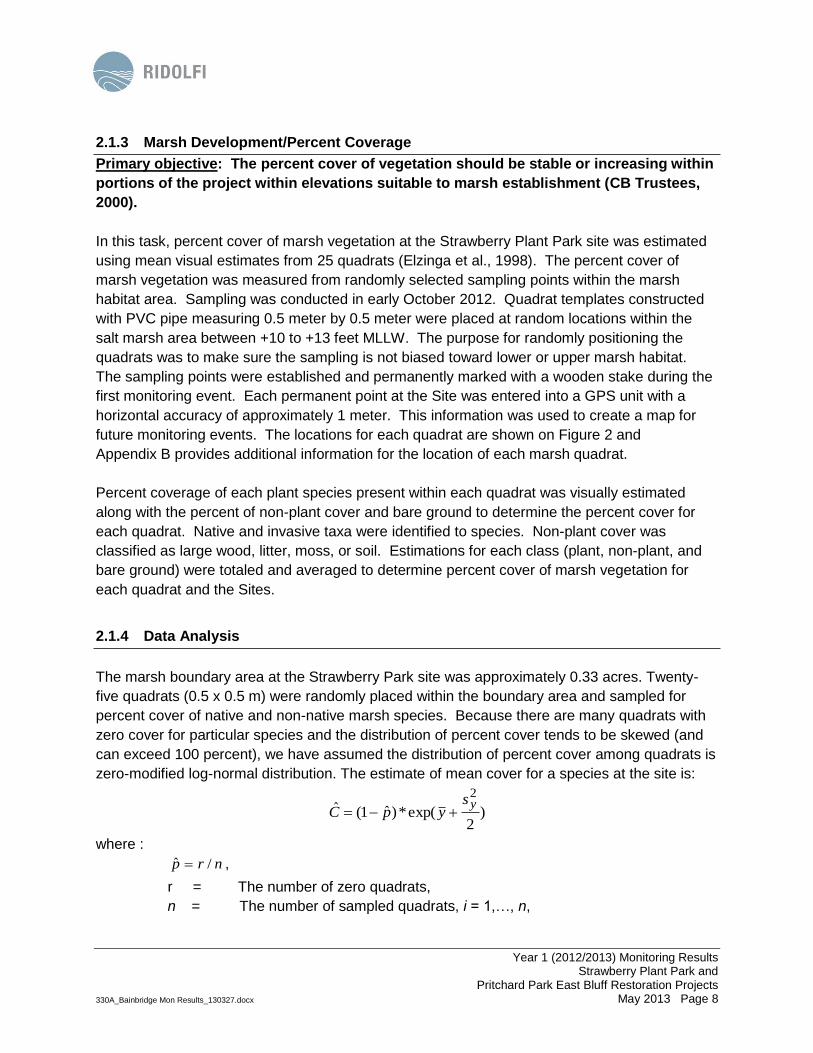
2.1.3 Marsh Development/Percent Coverage
Primary objective: The percent cover of vegetation should be stable or increasing within
portions of the project within elevations suitable to marsh establishment (CB Trustees,
2000).
In this task, percent cover of marsh vegetation at the Strawberry Plant Park site was estimated
using mean visual estimates from 25 quadrats (Elzinga et al., 1998). The percent cover of
marsh vegetation was measured from randomly selected sampling points within the marsh
habitat area. Sampling was conducted in early October 2012. Quadrat templates constructed
with PVC pipe measuring 0.5 meter by 0.5 meter were placed at random locations within the
salt marsh area between +10 to +13 feet MLLW. The purpose for randomly positioning the
quadrats was to make sure the sampling is not biased toward lower or upper marsh habitat.
The sampling points were established and permanently marked with a wooden stake during the
first monitoring event. Each permanent point at the Site was entered into a GPS unit with a
horizontal accuracy of approximately 1 meter. This information was used to create a map for
future monitoring events. The locations for each quadrat are shown on Figure 2 and
Appendix B provides additional information for the location of each marsh quadrat.
Percent coverage of each plant species present within each quadrat was visually estimated
along with the percent of non-plant cover and bare ground to determine the percent cover for
each quadrat. Native and invasive taxa were identified to species. Non-plant cover was
classified as large wood, litter, moss, or soil. Estimations for each class (plant, non-plant, and
bare ground) were totaled and averaged to determine percent cover of marsh vegetation for
each quadrat and the Sites.
2.1.4 Data Analysis
The marsh boundary area at the Strawberry Park site was approximately 0.33 acres. Twenty-
five quadrats (0.5 x 0.5 m) were randomly placed within the boundary area and sampled for
percent cover of native and non-native marsh species. Because there are many quadrats with
zero cover for particular species and the distribution of percent cover tends to be skewed (and
can exceed 100 percent), we have assumed the distribution of percent cover among quadrats is
zero-modified log-normal distribution. The estimate of mean cover for a species at the site is:
)2
exp(*)ˆ1(ˆ2ys
ypC
where :
nrp /ˆ ,
r = The number of zero quadrats,
n = The number of sampled quadrats, i = 1,…, n,

Year 1 (2012/2013) Monitoring Results
Strawberry Plant Park and Pritchard Park East Bluff Restoration Projects
330A_Bainbridge Mon Results_130327.docx May 2013 Page 9
)/(1
rnyyrn
i
i
,
)ln( ii cy ,
ci = total percent cover for quadrat i
)1(
)(1
2
2
rn
yy
s
rn
i
i
y .
Note that y and 2
ys are the sample mean and variance of the non-zero quadrat cover estimates.
An approximate 90 percent confidence interval is given by:
)ˆr(av*ˆ)2(),2(10. CtC n ,
where:
2
2)1()2exp(
1)ˆr(av
422 yyy
ssppsy
nC ,
the asymptotic variance estimate (Owen and DeRouen, 1980).
2.1.5 Forage Fish Access/Presence
Primary objective; Forage fish will access the project with increasing utilization for
spawning. Forage fish egg presence within the project should be comparable to that of
appropriate reference sites at the end of 10 years (adapted from CB Trustees, 2000).
This task was performed at the Pritchard Park East Bluff site. For Year 1, the surveys occurred
during an event in November 2012 and another in January 2013 at the appropriate tide. Survey
crews followed the protocols outlined by the Washington State Department of Fish and Wildlife
(WDFW), provided in the monitoring plan (Ridolfi, 2012).
During each event, two 100-foot transects were surveyed for forage fish (Figure 3). One
transect, designated for the identification of surf smelt (Hypomesus pretiosus), occurred
between +7 and +9 feet above the MLLW mark. A second transect, designated for the
identification of Pacific sand lance (Ammodytes hexapterus), occurred between +5 and +8 feet
MLLW. A map depicting the locations of the transects is provided in Figure 3. Appendix C
provides additional information for the location of each transect.

Year 1 (2012/2013) Monitoring Results
Strawberry Plant Park and Pritchard Park East Bluff Restoration Projects
330A_Bainbridge Mon Results_130327.docx May 2013 Page 10
Samples were collected every 25 feet along each transect for a total of four samples per
transect. Sediment was surveyed and analyzed for grain size using standard stacked sieves.
The presence of sand lance and surf smelt eggs was evaluated by viewing the sediment
samples through a dissecting scope. Egg samples were sent to WDFW for quality
control/quality assurance of species identification. The survey work was done under a Scientific
Collection Permit that is obtained annually, prior to each year’s first monitoring event.
2.2 Physical Success Criteria
2.2.1 Elevation and Morphology
Primary objective: No evidence of erosion that threatens restoration project goals,
property, infrastructure, or is otherwise unacceptable is observed after a period of initial
site stabilization (CB Trustees, 2000).
The City performed topographic surveying at each site based on guidance provided by Ridolfi.
At each site, the surveyor established five to eight transects by installing stakes in the riparian
zone. They then shot profiles perpendicular to the shoreline from each stake, measuring
elevations at approximately 10-foot intervals or where there was a noticeable break in slope.
The survey was conducted so that horizontal accuracy was +/- 0.1 feet, and vertical accuracy
was +/- 0.05 feet. To evaluate elevations and morphology in subsequent years, the transects
will be reoccupied beginning at the stakes installed this year. The deliverable for this task will
be cross-section plots showing elevation profiles for the different monitoring events. The
deliverable will be provided to support evaluation of both Sites’ physical structure for
subsequent Annual Monitoring reports.
2.2.2 Photo Point Monitoring and Visual Inspections
Primary objective: Photo point monitoring will be conducted to monitor changes in plant
cover, invasives, species composition, and disturbances in the riparian and salt marsh
vegetation habitat at the Site (CB Trustees, 2000).
Photo point monitoring was conducted at both Sites in conjunction with the vegetation
monitoring, and a second event occurred in conjunction with forage fish surveys. For the
Strawberry Park Plant site, six photo points were established at approximately +13 feet MLLW
in the riparian and salt marsh habitat transition zone (Figure 2). For the Pritchard Park East
Bluff site, five photo points were established along the asphalt and gravel path and at
approximately +13 feet MLLW in the riparian and forage fish beach habitat transition zone
(Figure 3). Placing the photo points in front of the riparian zone ensured that photographs were
not blocked by foliage in the later years of the monitoring program. Photo point locations were
established during the first scheduled monitoring event and were permanently marked with a
wooden stake. Each permanent photo point was entered into a GPS unit with a horizontal

Year 1 (2012/2013) Monitoring Results
Strawberry Plant Park and Pritchard Park East Bluff Restoration Projects
330A_Bainbridge Mon Results_130327.docx May 2013 Page 11
accuracy of one meter or better. This information was used to create a map showing the photo
point locations for future monitoring events. Appendix D provides additional information for the
location of each photo point.
At each photo point, a field team member took a series of photographs in a full circle so that the
entire site was represented. A digital camera with a minimum resolution of 2200 x 1704 pixels
or 4 megapixels was used for the photography. Photographs were taken at the highest
resolution. A photo log was filled out for each monitoring event. Data recorded included names
of field personnel, date, weather, camera make and model. For each photograph taken, the
following information was recorded: photo point identification number, orientation, and a caption
describing the picture.
Monitoring staff also made observations regarding general site conditions. These observations
included presence of erosional features, prevalence of dead or dying plants, accumulation of
trash or flotsam, indications of vandalism, or signs of animal use or grazing of vegetation.
Year 1 (2012/2013) Monitoring Results
Strawberry Plant Park and Pritchard Park East Bluff Restoration Projects
330A_Bainbridge Mon Results_130327.docx May 2013 Page 12
3.0 MONITORING RESULTS
This section describes monitoring results for Year 1 (2012/2013). Ridolfi performed riparian and
marsh vegetation monitoring, forage fish spawning surveys, and photo point monitoring at the
Site. Statistical analysis for riparian and marsh vegetation was performed by R2 Resource
Consultants, Inc. The City performed topographical surveys at the Sites. Biological and
physical observations were recorded on data forms in the field and then entered into a database
developed for the project. Ridolfi personnel performed the data entry and spot-checked entries
for quality control. The database was queried to generate the site-specific summary tables
discussed in this section. Year 1 (2012/2013) was the first year that the newly constructed Sites
were sampled. The results from Year 1 will serve as baseline information for the Sites.
The sampling methods functioned as intended and were conducted as described in Section 2.0.
Statistical analyses were conducted as described in Sections 2.1.2 and 2.1.4. Figures 2 and 3
shows the points of interest at both Sites including the riparian baselines, riparian transects,
marsh quadrats, forage fish survey transects, and photo point monitoring locations. Appendix A
through D provides additional information for the riparian, marsh, forage fish survey, and photo
point monitoring activities, respectively.
3.1 Riparian Vegetation Percent Coverage
The Sites were sampled for riparian vegetation and areal coverage in early October 2012.
Percent cover of tree and shrub species and of non-native or invasive (NNI) vegetation were
measured from seven line intercept transects located within the riparian area of both Sites
(Figure 2 and 3). Additionally, groundcover was evaluated at two points along each of the
riparian transects to measure native and NNI species, bare ground, and non-plant matter.
Table 1 shows the results for the Strawberry Plant Park Site for the riparian crown cover
including the number of transects with non-cover, average percent cover, and 90 percent
confidence intervals calculated by species from the data. Table 2 shows the results for the
Strawberry Plant Park for the riparian groundcover including number of transects with plants
observed, the average percent cover, and the 90CIs calculated by plant species and other non-
plant matter from the data. Tables 3 and 4 show results for the parameters above for the
Pritchard Park East Bluff Park Site. Appendix B provides the raw data for riparian crown cover
and riparian groundcover for both Sites.
3.1.1 Strawberry Plant Park Site
Crown Cover
Using the statistical methods described in Section 2.1.2, the riparian data for the Site were
tabulated and evaluated as shown in Table 1. Statistical analysis indicates a mean crown cover
Year 1 (2012/2013) Monitoring Results
Strawberry Plant Park and Pritchard Park East Bluff Restoration Projects
330A_Bainbridge Mon Results_130327.docx May 2013 Page 13
of 11 percent native shrubs, 17 percent native trees, and 0 percent NNI species. A total of 13
native plants were observed along the seven transects; five shrub species and eight tree
species. The dominant native tree and native shrub species were red alder and Nootka rose,
respectively. However, all species were sparse and many had died primarily due to lack of
water.
Groundcover
Using the statistical methods described in Section 2.1.4, groundcover data for the Site were
tabulated and evaluated at two points along each of the riparian transects. The groundcover
results are shown in Table 2. Statistical analysis indicates a mean groundcover of 21 percent
plant species (native and NNI), 7.5 percent non-plant matter, and 13 percent bareground. A mix
of herbaceous, shrub, and graminoid or grass species were observed along the transects; five
native species, and seven NNI species. Native species included willowherb, kinnikinnick,
Oregon grape, common snowberry, and common rush. NNI species included aster,
broadleaved pepperweed, common St. John’s wort, Queen Anne’s lace, white clover,
Himalayan blackberry, and unclassified grasses. Non-plant matter included a log and rocks and
cobble.
3.1.1.1 Riparian Success Evaluation
Under the primary objective for riparian vegetation, restoration of the riparian zone is considered
successful if the percent cover of shrubs and trees is stable or increasing over time.
Additionally by Year 5, the shrub and tree areal cover should exceed 50 percent and 40 percent,
respectively; and the bare ground and NNI cover should be less than 10 percent and 5 percent,
respectively.
The analysis shows that the shrub and tree cover criterion is not being met at the Site (Table 1).
For crown canopy there were no NNI sampled. However, NNI species were observed in the
groundcover quadrats along the transects; therefore the NNI criterion for the Site is partially
met. The majority of the ground surface in the upland areas is covered with native and NNI
plants or non-plant matter (Table 2). Because the Site was only restored one year prior to
monitoring, a large amount of mulch is still present and the bare ground criterion is not being
met.
The irrigation system at the Site appears to not be used on a regular basis or is not working,
resulting in many plants dying due to lack of water. Additionally, the Site was thick with
willowherb, unclassified grasses, and Scot’s broom, which were covering and crowding out the
newly planted native plants. In early winter, after the monitoring event, the Site was weeded
and mulched and several new native plants were planted in areas throughout the Site. Similar
maintenance efforts will be conducted over the next few winters.
Year 1 (2012/2013) Monitoring Results
Strawberry Plant Park and Pritchard Park East Bluff Restoration Projects
330A_Bainbridge Mon Results_130327.docx May 2013 Page 14
In summary, the performance of the riparian vegetation as defined in Section 2.0 is not being
met at the Site. However, whether the percent cover of riparian vegetation is remaining stable
or increasing over time cannot be assessed based on a single year of monitoring.
3.1.2 Pritchard Park East Bluff site
Crown Cover
Using the statistical methods described in Section 2.1.2, the riparian data for the Site were
tabulated and evaluated as shown in Table 3. Statistical analysis indicates a mean crown cover
of 6.9 percent native shrubs, 2.7 percent native trees, and 0 percent NNI species. A total of 13
native plants were observed along the seven transects; seven shrub species and six tree
species. The dominant native shrub species were snowberry and oceanspray. The dominant
tree species was red alder. However, all species were sparse and many had died primarily due
to lack of water.
Groundcover
Using the statistical methods described in Section 2.1.4, groundcover data for the Site were
tabulated and evaluated at two points along each of the riparian transects. The groundcover
results are shown in Table 4. Statistical analysis indicates a mean groundcover of 17 percent
plant species (native and NNI), 0 percent non-plant matter, and 40 percent bareground. A mix
of herbaceous, shrub, and graminoid or grass species were observed along the transects; two
native species and nine NNI species. Native species included willowherb and a few big leaf
maple seedlings. NNI species included butterfly bush, English ivy, broadleaved pepperweed,
Canadian thistle, vetch, foxglove, white clover, common plantain, Himalayan blackberry, and
unclassified grasses. Bare ground was generally covered in mulch or detrital plant matter.
3.1.2.1 Riparian Success Evaluation
Under the primary objective for riparian vegetation, restoration of the riparian zone is considered
successful if the percent cover of shrubs and trees is stable or increasing over time. Additionally
by Year 5, the shrub and tree areal cover should exceed 50 percent and 40 percent,
respectively; and the bare ground and NNI cover should be less than 10 percent and 5 percent,
respectively.
The analysis shows that the shrub and tree cover criterion is not being met at the Site (Table 3).
For crown canopy there were no NNI sampled. However, numerous NNI species were
observed in the groundcover quadrats along the transects; therefore the NNI criterion for the
Site is partially met. The majority of the ground surface in the upland areas is covered with
native and NNI plants (Table 4). Because of the newness of the Site, a large amount of mulch
is still present and the bare ground criterion is not being met.

Year 1 (2012/2013) Monitoring Results
Strawberry Plant Park and Pritchard Park East Bluff Restoration Projects
330A_Bainbridge Mon Results_130327.docx May 2013 Page 15
The irrigation system at the Site has been severally damaged due to erosion and wave action,
resulting in many plants dying due to lack of water. Additionally, the Site was thick with
willowherb, unclassified grasses, and Scot’s broom and other NNI species mentioned above,
which were covering and crowding out the newly planted native plants. In late winter, after the
monitoring event, the Site was weeded and mulched and several new native plants were
planted in areas throughout the Site. Similar maintenance efforts will be conducted over the
next few winters.
In summary, the performance of the riparian vegetation as defined in Section 2.0 is not being
met at the Site. However, whether the percent cover of riparian vegetation is remaining stable
or increasing over time cannot be assessed based on a single year of monitoring.
3.2 Marsh Development/Percent Coverage
The Site was successfully sampled for marsh plant development and species composition.
Sampling occurred in early October 2012 during low tide. A total of 25 quadrats were sampled.
Marsh quadrat locations are shown on Figure 2. Table 5 provides a summary of monitoring
results for each quadrat. Appendix B provides the raw data and photos of each sampled
quadrat to use for comparison to future monitoring events.
Of the 25 marsh quadrats sampled at the Site, only two quadrats were void of vegetation in
Year 1. Eight native plant species were identified. Three NNI species were observed in four of
the quadrats. Native species represented approximately 75 percent average cover in Year 1,
while NNI species represented 11 percent cover and the remainder of the ground was bare.
The most prevalent native species observed, based on the average unbiased cover estimate,
was pickleweed at 28 percent (Table 5). Pickleweed was thick and robust throughout the marsh
area. The next two most frequently observed species were fat-hen saltbush and fleshy jaumea.
3.2.1 Marsh Success Evaluation
According to the primary objective for marsh plant development and species composition,
success at the Site is evaluated by percent cover of native marsh plant species that remains
stable or increases over time and whether percent cover of NNI species is less than 5 percent.
Based on the Year 1 monitoring, marsh development for percent cover of native plant species is
being met, primarily due the robust presence of pickleweed and seven other marsh vegetation
over the majority of the Site. The percent cover for NNI species was 11 percent, above the
target of 5 percent. The NNI species were observed in 4 out of 25 quadrats and consisted of
white clover, broadleaf pepperweed, and unclassified grasses (Table 5). However, whether the
percent cover of native marsh plant species is remaining stable or increasing over time cannot
be assessed based on a single year of monitoring.

Year 1 (2012/2013) Monitoring Results
Strawberry Plant Park and Pritchard Park East Bluff Restoration Projects
330A_Bainbridge Mon Results_130327.docx May 2013 Page 16
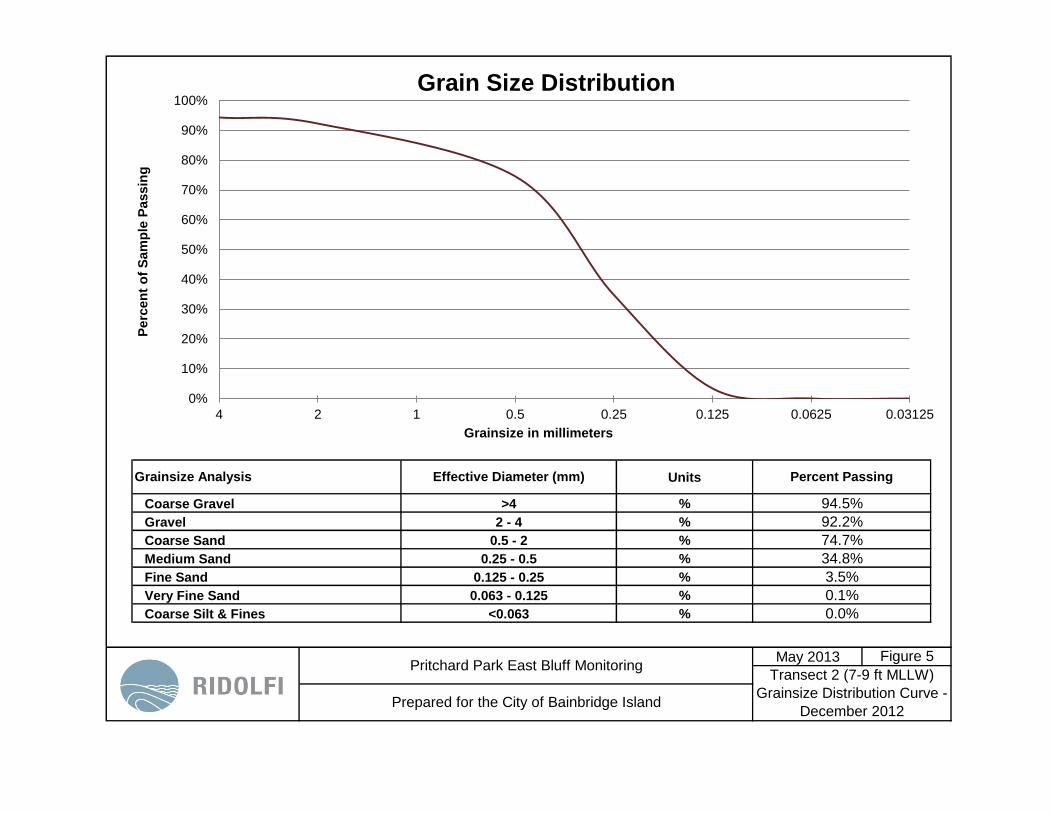
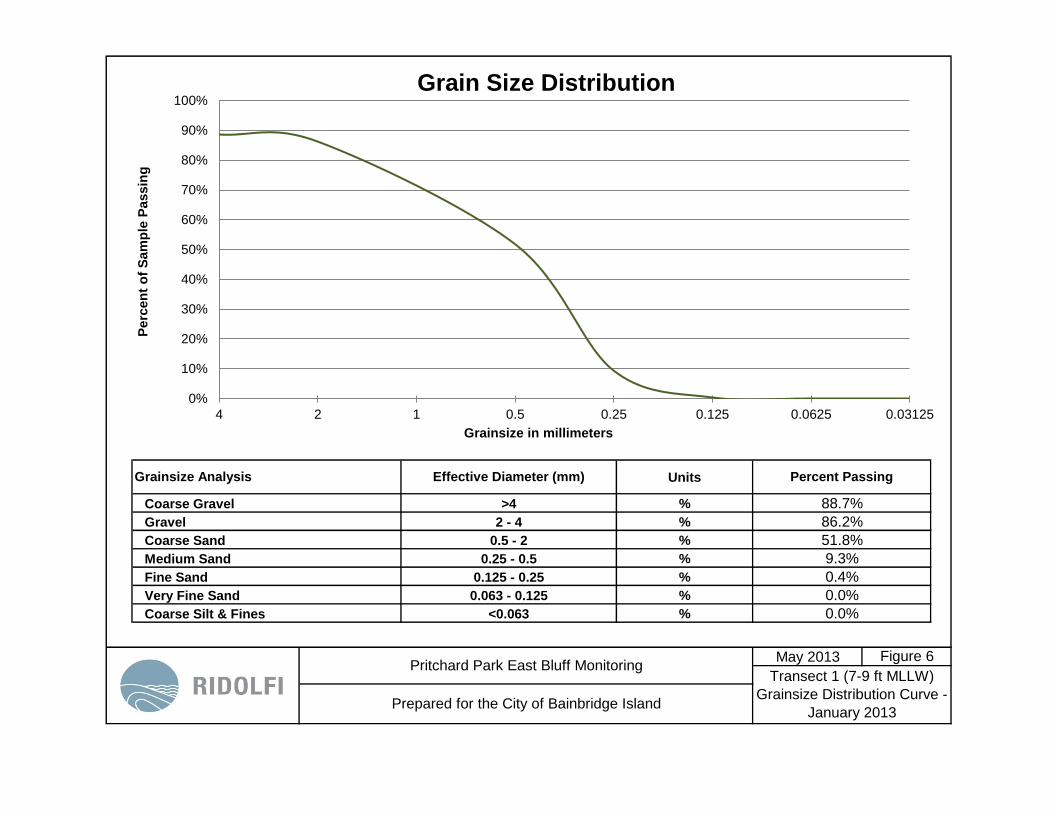
3.3 Forage Fish Access/Presence
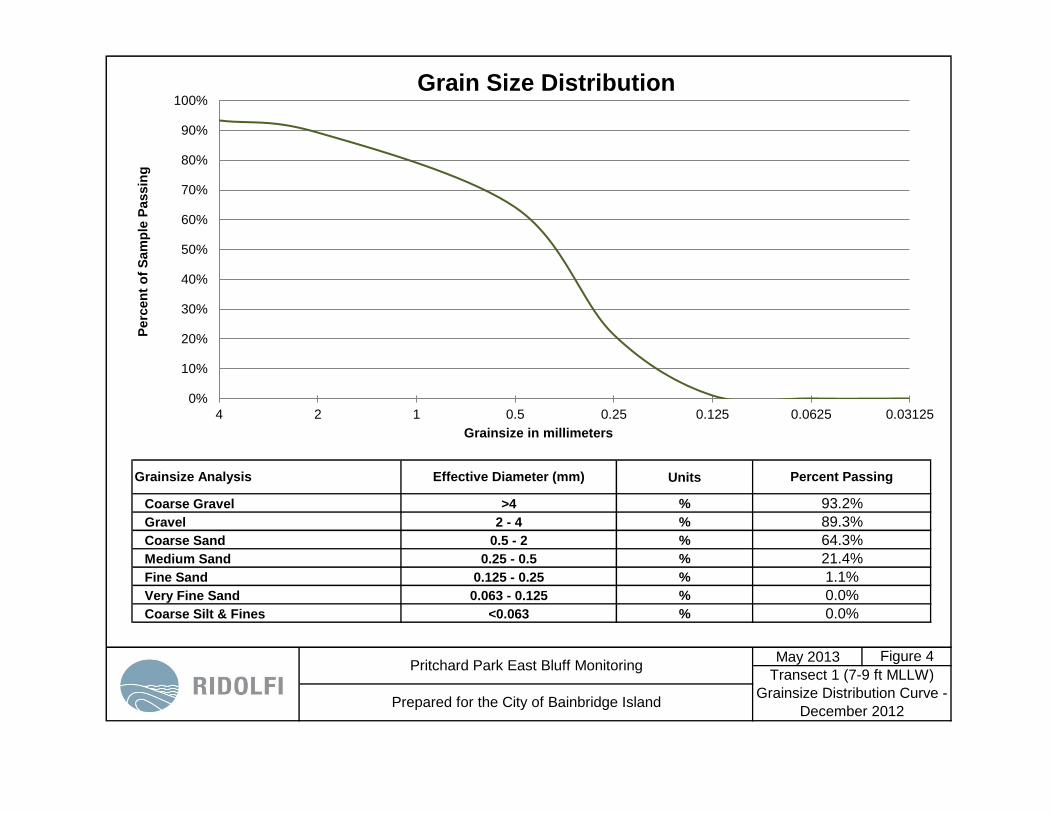
Grain size analysis using standard stacked sieves was performed on beach substrate collected
from two transects at Pritchard Park East Bluff between +7 and +9 feet above the MLLW
elevation in December 2012 and January 2013. Grain size analysis of the four samples found
the following:
Sand, ranging in size from 0.125 millimeters (mm) to 2 mm, made up between
approximately 85 and 88 percent of the first 3 samples by mass. The final transect
sample collected in January 2013 had only 66 percent sand by mass.
Virtually no silt-sized or finer material was present in any sample.
Gravel, ranging from 2 mm to 4 mm or larger in diameter made up between
approximately 7 and 13 percent in the first 3 samples by mass. The final transect
sample collected in January 2013 had a greater percentage of coarse gravel (>4 mm)
than previous samples.
In general, the distribution of sand-sized material was very uniform for both samples
collected in December 2012. Samples collected in January 2013 had less fine sand
than their December counterparts.
Grain size distribution curves for each transect in the +7 to +9 feet elevation range are
presented in Figures 4 through 7. Grain size distributions for surf smelt (Hypomesus pretiosus)
fall almost exclusively within the range of 1 to 10 mm in diameter (95 percent of samples by
weight). Samples from the Site in the target tidal range contain between approximately 66 and
88 percent material in the 0.125 mm to 2 mm size range and between 7 and 33 percent material
coarser than 2 mm. These distributions generally indicate that the beach substrate at the Site is
finer than is optimum for surf smelt spawning.
Pacific sand lance (Ammodytes hexapterus) grain size distributions identified by Pentilla (2012)
included 67 percent of sampled material falling between 0.2 mm to 0.4 mm diameter, and 25
percent of sampled material falling between 1 and 7 mm diameter. Observation of the sand
lance spawning elevations between +5 and +8 feet above MLLW at Prichard Park found that
this elevation range was populated with material that was generally much coarser than the
7 mm upper limit identified by Pentilla, forming a layer of armor over the lower beach
(Appendix C). The observed material was sufficiently coarse that it did not appear possible for
sand lance to spawn within this elevation range.
These results indicate that it may be possible for surf smelt to spawn in the +7 to +9 feet
elevation range, but that the current substrate does not match preferred spawning conditions for
sand lance in the +5 to +8 feet elevation range.

Year 1 (2012/2013) Monitoring Results
Strawberry Plant Park and Pritchard Park East Bluff Restoration Projects
330A_Bainbridge Mon Results_130327.docx May 2013 Page 17
3.4 Topographic Survey
The City performed a topographic survey of the Site in conjunction with the riparian and marsh
vegetation monitoring in early October 2012. The results of the survey are still pending and will
be compared with the design configuration or as-built drawings for each Site at a later date.
The results from the Year 1 survey will also serve as the baseline for comparison to all future
surveys.
3.5 Photo Point Monitoring and Visual Inspection
Photo point monitoring was conducted in early October 2012 in conjunction with the riparian and
marsh vegetation monitoring and again in January. Six photo points at Strawberry Plant Park
site and five photo points were established at the Pritchard Park East Bluff site. Locations for
the photo points are shown in Figures 2 and 3. The photo points were placed in front of the
riparian zone to ensure that photos will not be blocked by foliage in the later years of the
monitoring program. The photo points established in this Year 1 will serve as the baseline for all
future monitoring. Appendix D includes the photos and photo log from this Year 1 event.
Monitoring personnel also made observations regarding general conditions at both Sites. As
stated above, both Sites are dry with several dying or dead plants. It is unclear if the irrigation
system at Strawberry Plant Park is in disrepair or is just not used. The irrigation system at
Pritchard Park East Bluff is severely damaged due to erosion and wave action.
Both Sites are also heavily infested with willowherb, unclassified grasses, and several NNI
species, which are crowding out young native plants planted during restoration activities.
However, a Volunteer Maintenance Day was held in early winter 2013 at Strawberry Plant Park
site and in late winter at the Pritchard Park East Bluff site. The work efforts at both sites focused
on general cleanup, weeding, planting, and mulching.
The marsh area ringing the Strawberry Plant Park site is quite robust and healthy. However, the
goose exclusion fencing appeared to be hampering the growth of marsh vegetation outside of
the fence line and was subsequently removed during the Volunteer Maintenance Day. Litter at
both Sites was minimal and was generally found in the tidal wrack-line.
The lower elevations of the Pritchard Park East Bluff site are dominated with large cobbles. It
appears that the finer-grained (sand and gravel) beach substrate placed in the lower elevations
at the Pritchard Park East Bluff site to support sand lance spawning habitat has been
transported off site due to erosion and wave action. Further analyses of the topographical
survey and photos taken during construction are needed to determine if this has occurred. In
addition the riparian bank that originally sloped to the beach has been eroded and damaged due
to wave action which appears to have been quite significant during the winter months.
Year 1 (2012/2013) Monitoring Results
Strawberry Plant Park and Pritchard Park East Bluff Restoration Projects
330A_Bainbridge Mon Results_130327.docx May 2013 Page 18
4.0 ADAPTIVE MANAGEMENT RECOMMENDATIONS
4.1 Adaptive Management Recommendations
Based on the Year 1 monitoring results presented in this report, we have the following
recommendations:
4.1.1 Strawberry Plant Park
Continue planned monitoring efforts in Year 2 (2013/2014).
Determine if the irrigation system is functioning and determine the schedule for irrigation.
Remove non-native or invasive species such as Scot’s broom, Himalayan blackberry,
white sweet-clover, field bindweed, butterfly bush, pea vine, Canada thistle, curly dock,
prickly lettuce, Queen Anne’s lace, and black locust tree seedlings.
Remove invasive species in the western portion of the site not reached in the September
event, and in previously worked areas where they were missed or may have
reestablished.
Target weeding around the plantings throughout site to create a buffer and encourage
growth.
Apply mulch to the newly weeded areas around the native plants to suppress weeds and
retain moisture.
Conduct supplemental planting in areas where high mortality has occurred.
Continue to mow the meadow area to control Scot’s broom seed source.
4.1.2 Pritchard Park East Bluff
Continue planned monitoring efforts in Year 2 (2013/2014).
Determine if the irrigation system is functioning and determine the schedule for irrigation.
Remove non-native or invasive species such as Scot’s broom, Himalayan blackberry,
white sweet-clover, field bindweed, butterfly bush, pea vine, Canada thistle, curly dock,
prickly lettuce, Queen Anne’s lace, and English ivy.
Target weeding around the plantings throughout the site to create a buffer and
encourage growth.
Apply mulch to the newly weeded areas around the native plants to suppress weeds and
retain moisture. This work could be postponed until spring if budget and time constraints
occur.
Monitor erosion along riparian area bordering the beach.
Monitor grainsize of substrates in the pocket beach that was created to support forage
fish spawning habitat.
Year 1 (2012/2013) Monitoring Results
Strawberry Plant Park and Pritchard Park East Bluff Restoration Projects
330A_Bainbridge Mon Results_130327.docx May 2013 Page 19
5.0 REFERENCES
Commencement Bay Natural Resource Trustees (Trustees). 2000. Commencement Bay
Natural Resource Damage Assessment Restoration Monitoring Plan. Prepared by the
National Oceanic and Atmospheric Administration, the U.S. Department of Interior and
the State of Washington.
Elzinga, C.L., D.W. Salzer, J.W. Willoughby. 1998. Measuring and Monitoring Plant
Populations. U.S. Department of the Interior. July.
Pentilla, D. 2012. Forage Fish Spawning Substrate Sediment Grain-size Data for Cornet Bay
Beach Restoration Project. September 6 memorandum to Colin Wagoner.
RIDOLFI Inc. (Ridolfi). 2012. Monitoring Plan for the Strawberry Plant park and Pritchard Park
East Bluff Restoration Projects, Bainbridge Island, Washington. Prepared for the City of
Bainbridge. August.

FIGURES
Monitoring Results for the Strawberry Plant Parkand Pritchard Park East Bluff Restoration Projects
Prepared for the City of Bainbridge Island
Figure 1March 2013
Site Locations
Strawberry Plant Park(Weaver Road NW)
Pritchard ParkEast Bluff(Northeast OldCreosote Hill Road)
E A G L EH A R B O R
OLYMPI CD RIVE
SE
EAGLE HARBORDRIVE
NE EAGLE HARBOR DRIVE NE
WINSLOW WAY W
BAINBRIDGE ISLANDFERRY TERMINAL
Source: Esri, DigitalGlobe, GeoEye, i-cubed, USDA, USGS, AEX, Getmapping, Aerogrid, IGN, IGP,and the GIS User Community
File Path: M:\Projects\330A_Bainbridge\Mapfiles\Results_Report\Figure_1.mxd
SEATTLEBAINBRIDGE
ISLAND
PORTORCHARD
BREMERTON
EDMONDS
BURIEN
MAP EXEN T
± 0 1,000 2,000Feet

Figure 2March 2013Strawberry Plant Park
Riparian Baselines and Transects,Marsh Quadrats, and Photo Point Locations
!(
!(
!(
!(
!(
!(
!(
!(
!(
!(
!(!(
!(!(
!(
!(
!(
!(!(
!(!(
!(
!( !( !(!(
!(!(
!(
!(
!(
RIPARIANBASELINE
START
RIPARIANBASELINE
END
RIPARIANBASELINESTART
RIPARIANBASELINE
END
0'
100'200'
0'
100'
205'
294'
T-03 RB-02T-03 RB-01
T-02 RB-02
T-04 RB-01
T-02 R
B-01
T-01 RB-02
T-01 R
B-01
RB-02
RB-01
PP-03
PP-04
PP-05
PP-02
PP-01
PP-06
M-22
M-23
M-24
M-10
M-11M-15
M-13M-09M-02
M-16
M-08
M-07 M-06M-05
M-01
M-12
M-03 M-04
M-18M-17
M-20M-19M-14
M-21
M-25
File Path: M:\Projects\330A_Bainbridge\Mapfiles\Results_Report\Figure_2_Strawberry_Park.mxd
Monitoring Results for the Strawberry Plant Parkand Pritchard Park East Bluff Restoration Projects
Prepared for the City of Bainbridge Island
Legend!( Marsh Quadrats
!( Photo PointsRiparian BaselineRiparian Transects ± 0 20 40
Feet
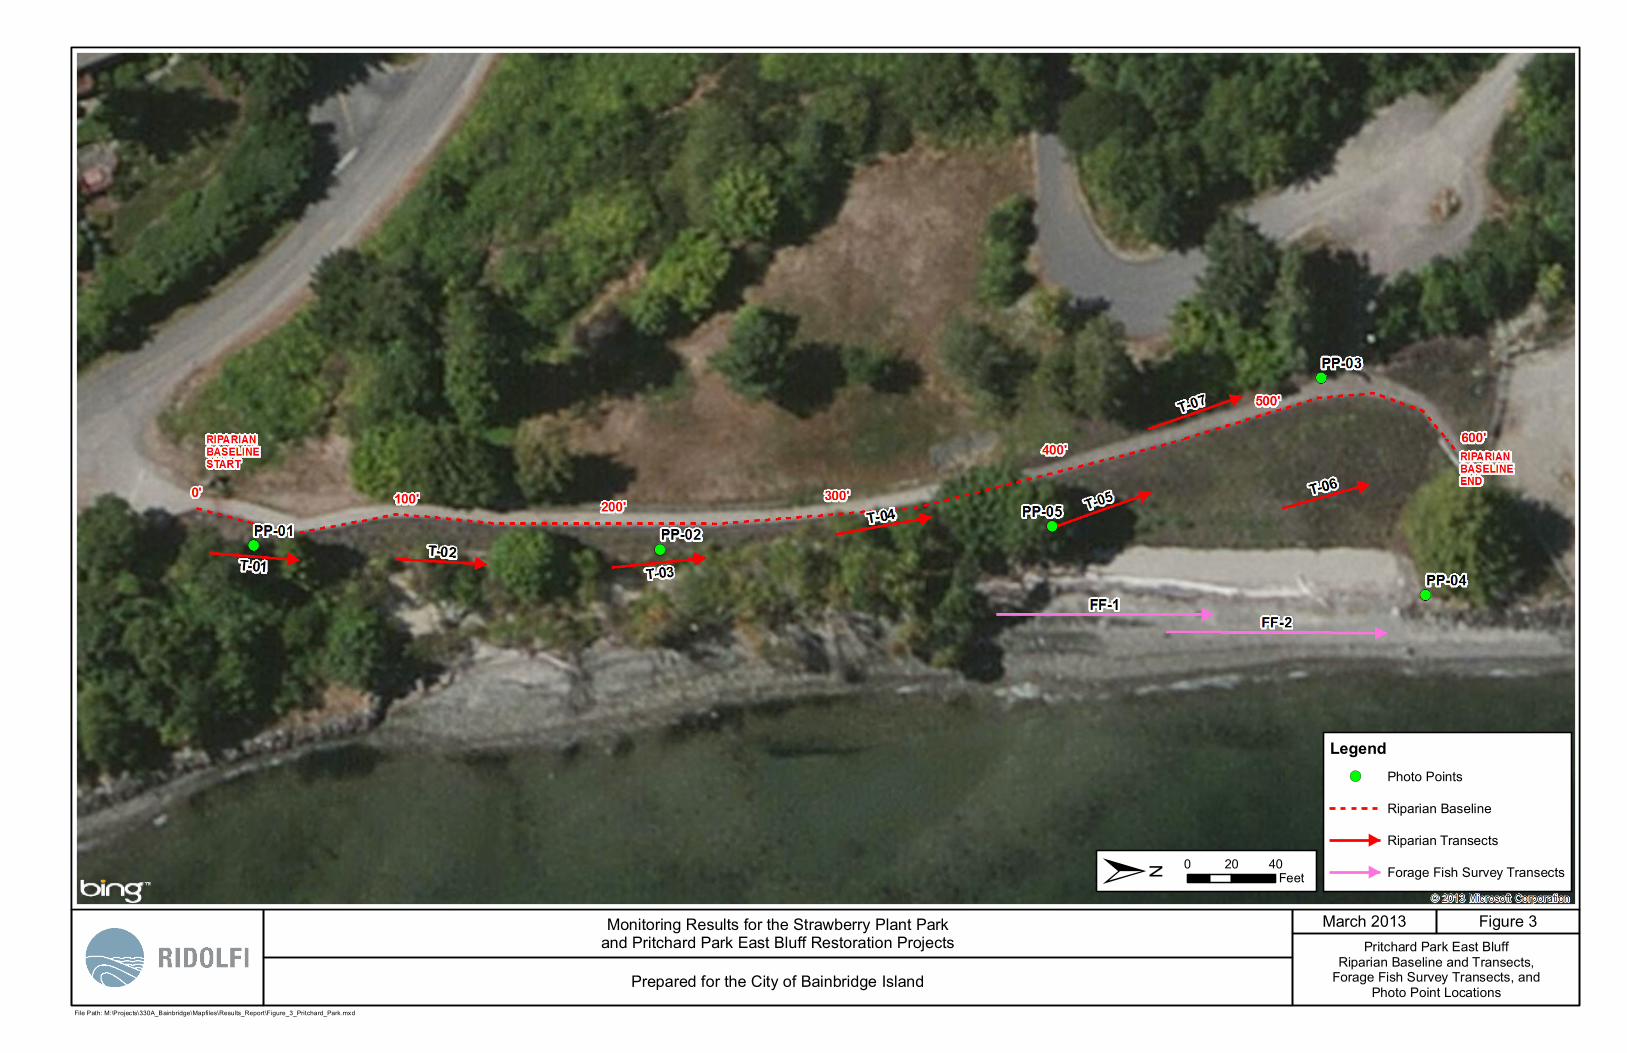
Figure 3March 2013Pritchard Park East Bluff
Riparian Baseline and Transects,Forage Fish Survey Transects, and
Photo Point LocationsFile Path: M:\Projects\330A_Bainbridge\Mapfiles\Results_Report\Figure_3_Pritchard_Park.mxd
Legend!( Photo Points
Riparian BaselineRiparian TransectsForage Fish Survey Transects
Monitoring Results for the Strawberry Plant Parkand Pritchard Park East Bluff Restoration Projects
Prepared for the City of Bainbridge Island
± 0 20 40Feet
Units
%
%
%
%
%
%
%
May 2013Pritchard Park East Bluff Monitoring
Figure 4
Transect 1 (7-9 ft MLLW)
Grainsize Distribution Curve -
December 2012Prepared for the City of Bainbridge Island
Very Fine Sand 0.063 - 0.125 0.0%
Coarse Silt & Fines <0.063 0.0%
Medium Sand 0.25 - 0.5 21.4%
Fine Sand 0.125 - 0.25 1.1%
Gravel 2 - 4 89.3%
Coarse Sand 0.5 - 2 64.3%
Grainsize Analysis Effective Diameter (mm) Percent Passing
Coarse Gravel >4 93.2%
0%
10%
20%
30%
40%
50%
60%
70%
80%
90%
100%
0.031250.06250.1250.250.5124
Perc
en
t o
f S
am
ple
Passin
g
Grainsize in millimeters
Grain Size Distribution
Units
%
%
%
%
%
%
%
May 2013
Transect 2 (7-9 ft MLLW)
Grainsize Distribution Curve -
December 2012
Figure 5
0.0%
Pritchard Park East Bluff Monitoring
Prepared for the City of Bainbridge Island
Grainsize Analysis
Coarse Gravel
Gravel
Coarse Sand
Medium Sand
Fine Sand
Very Fine Sand
Coarse Silt & Fines
0.125 - 0.25
0.063 - 0.125
<0.063
3.5%
0.1%
Effective Diameter (mm)
>4
2 - 4
0.5 - 2
0.25 - 0.5
Percent Passing
94.5%
92.2%
74.7%
34.8%
0%
10%
20%
30%
40%
50%
60%
70%
80%
90%
100%
0.031250.06250.1250.250.5124
Perc
en
t o
f S
am
ple
Passin
g
Grainsize in millimeters
Grain Size Distribution
Units
%
%
%
%
%
%
%
May 2013
Grainsize Analysis Effective Diameter (mm) Percent Passing
Coarse Gravel >4 88.7%
Gravel 2 - 4 86.2%
Coarse Sand 0.5 - 2 51.8%
Medium Sand 0.25 - 0.5 9.3%
Fine Sand 0.125 - 0.25 0.4%
Very Fine Sand 0.063 - 0.125 0.0%
Coarse Silt & Fines <0.063 0.0%
Pritchard Park East Bluff MonitoringFigure 6
Transect 1 (7-9 ft MLLW)
Grainsize Distribution Curve -
January 2013Prepared for the City of Bainbridge Island
0%
10%
20%
30%
40%
50%
60%
70%
80%
90%
100%
0.031250.06250.1250.250.5124
Perc
en
t o
f S
am
ple
Passin
g
Grainsize in millimeters
Grain Size Distribution

Units
%
%
%
%
%
%
%
May 2013
Grainsize Analysis Effective Diameter (mm) Percent Passing
Coarse Gravel >4 77.1%
Gravel 2 - 4 66.8%
Coarse Sand 0.5 - 2 37.9%
Medium Sand 0.25 - 0.5 9.2%
Fine Sand 0.125 - 0.25 0.2%
Very Fine Sand 0.063 - 0.125 0.0%
Coarse Silt & Fines <0.063 0.0%
Pritchard Park East Bluff MonitoringFigure 7
Transect 1 (7-9 ft MLLW)
Grainsize Distribution Curve -
January 2013Prepared for the City of Bainbridge Island
0%
10%
20%
30%
40%
50%
60%
70%
80%
90%
100%
0.031250.06250.1250.250.5124
Perc
en
t o
f S
am
ple
Passin
g
Grainsize in millimeters
Grain Size Distribution

TABLES

Table 1. Strawberry Plant Park Crown Cover on Riparian Transects
Cover
Class Common Name
Plant
Scientific Name
Number of
Transects
with non-
zero cover
(out of 7)
Average
% Cover
Median %
Cover
Distributional
Assumption for
Estimating
Mean
Unbiased
Mean
Estimate
% Cover
Lower
90% CL
Upper
90% CL
Native
kinnikinnick Arctostaphylos uva-ursi 1 2.0 0 n/a n/a n/a n/a
lupine Lupinus sp. 1 0.032 0 n/a n/a n/a n/a
tall Oregon grape Mahonia aquifolium 1 0.010 0 n/a n/a n/a n/a
Nootka rose Rosa nutkana 3 1.8 0 ZMLN 2.9 0 11
red elderberry Sambucus racemosa 1 0.16 0 n/a n/a n/a n/a
Total Native Shrubs 6 3.9 1.2 ZMLN 11 0 35
red alder Alnus rubra 4 2.5 0.15 ZMLN 4.2 0 19
madrone Arbutus menziesii 1 0.17 0 n/a n/a n/a n/a
red-osier dogwood Cornus stolonifera 1 0.43 0 n/a n/a n/a n/a
Douglas fir Pseudotsuga menziesii 1 1.1 0 n/a n/a n/a n/a
cascara Rhamnus purshiana 1 0.36 0 n/a n/a n/a n/a
Pacific willow Salix lasiandra 1 0.08 0 n/a n/a n/a n/a
Scouler's willow Salix scouleriana 2 0.39 0 n/a n/a n/a n/a
Western red cedar Thuja plicata 2 0.22 0 n/a n/a n/a n/a
Total Native Trees 5 5.3 0.54 ZMLN 17 0 74
Total Native Species 7 9.2 9.6 N 9.2 2.4 16
Total All Species 7 9.2 9.6 N 9.2 2.4 16
Notes:
ZMLN=Zero-modified lognormal distribution; N=normal distribution
n/a=not available
Shrubs
Trees
Tables.xlsx
Year 1 (2012/2013) Monitoring Results
Strawberry Plant Park and
Pritchard Park East Bluff Restoration Projects
May 2013 Page 1 of 5

Table 2. Strawberry Plant Park Groundcover on Riparian Transects
Type of
Species Cover Class Common Name Scientific Name
Number of
Transects
(out of 7) with
Species
Observed
Number of
Transects with
Non-Zero Cover
Distributional
Assumption for
Mean % Cover
Average
Percent
Cover
90%
Lower CL
90%
Upper CL
kinnikinnick Arctostaphylos uva-ursi 1
willowherb Epilobium sp. 7
common snowberry Symphoricarpos albus 1
tall Oregon grape Mahonia aquifolium 1
Gram common rush Trifolium repens 1
aster Aster sp. 2
broadleaved pepperweed Lepidium latifolium 3
common St. John's-wort Hypericum perforatum 1
Queen Anne's lace Daucus carota 1
white clover Trifolium repens 6
Shrub Himalayan blackberry Rubus discolor 2
Unclassified Gram Unclassified-grass 5
Log 1
Rock/Cobble 1
Bare Ground 4 ZMLN 13% 0% 40%
Note:
n/a=not available
ZMLN=Zero-modified lognormal distribution; N=normal distribution
n/a
12% 31%
Shrub
InvasiveHerb
21%
Non-Plant Cover 2 n/a 7.5% n/a
Plant Cover
Native
Herb
7 N
Tables.xlsx
Year 1 (2012/2013) Monitoring Results
Strawberry Plant Park and
Pritchard Park East Bluff Restoration Projects
May 2013 Page 2 of 5
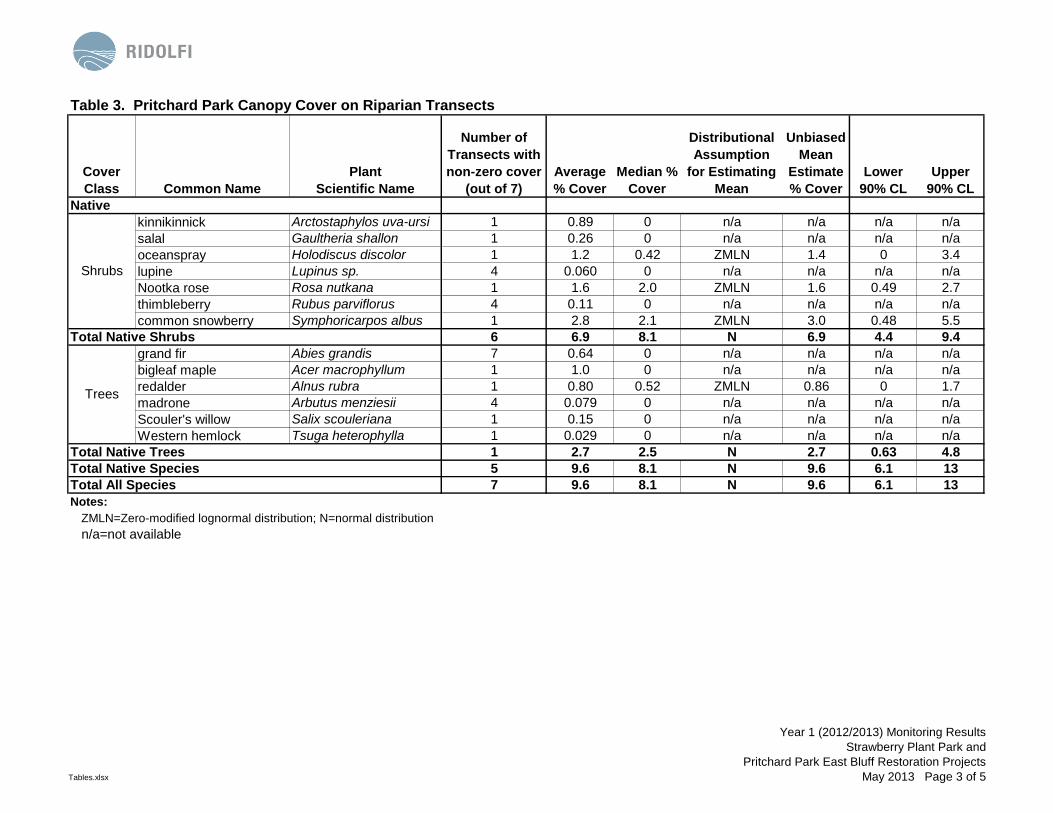
Table 3. Pritchard Park Canopy Cover on Riparian Transects
Cover
Class Common Name
Plant
Scientific Name
Number of
Transects with
non-zero cover
(out of 7)
Average
% Cover
Median %
Cover
Distributional
Assumption
for Estimating
Mean
Unbiased
Mean
Estimate
% Cover
Lower
90% CL
Upper
90% CL
Native
kinnikinnick Arctostaphylos uva-ursi 1 0.89 0 n/a n/a n/a n/a
salal Gaultheria shallon 1 0.26 0 n/a n/a n/a n/a
oceanspray Holodiscus discolor 1 1.2 0.42 ZMLN 1.4 0 3.4
lupine Lupinus sp. 4 0.060 0 n/a n/a n/a n/a
Nootka rose Rosa nutkana 1 1.6 2.0 ZMLN 1.6 0.49 2.7
thimbleberry Rubus parviflorus 4 0.11 0 n/a n/a n/a n/a
common snowberry Symphoricarpos albus 1 2.8 2.1 ZMLN 3.0 0.48 5.5
Total Native Shrubs 6 6.9 8.1 N 6.9 4.4 9.4
grand fir Abies grandis 7 0.64 0 n/a n/a n/a n/a
bigleaf maple Acer macrophyllum 1 1.0 0 n/a n/a n/a n/a
redalder Alnus rubra 1 0.80 0.52 ZMLN 0.86 0 1.7
madrone Arbutus menziesii 4 0.079 0 n/a n/a n/a n/a
Scouler's willow Salix scouleriana 1 0.15 0 n/a n/a n/a n/a
Western hemlock Tsuga heterophylla 1 0.029 0 n/a n/a n/a n/a
Total Native Trees 1 2.7 2.5 N 2.7 0.63 4.8
Total Native Species 5 9.6 8.1 N 9.6 6.1 13
Total All Species 7 9.6 8.1 N 9.6 6.1 13
Notes:
ZMLN=Zero-modified lognormal distribution; N=normal distribution
n/a=not available
Shrubs
Trees
Tables.xlsx
Year 1 (2012/2013) Monitoring Results
Strawberry Plant Park and
Pritchard Park East Bluff Restoration Projects
May 2013 Page 3 of 5
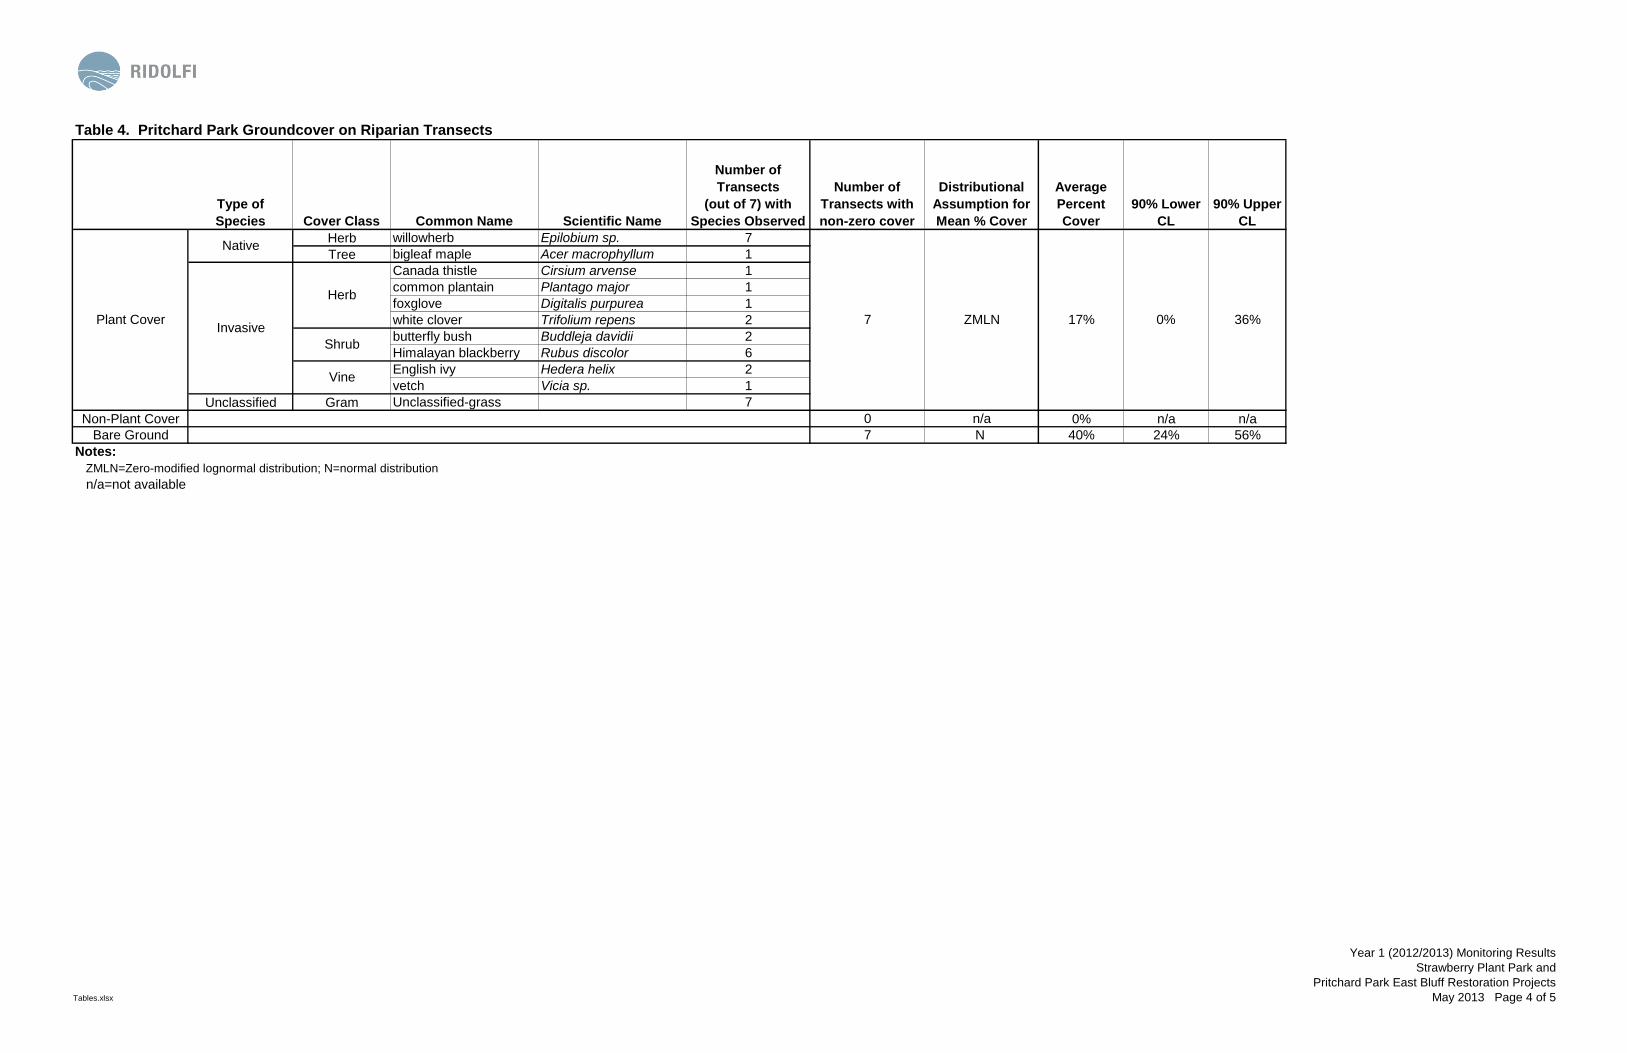
Table 4. Pritchard Park Groundcover on Riparian Transects
Type of
Species Cover Class Common Name Scientific Name
Number of
Transects
(out of 7) with
Species Observed
Number of
Transects with
non-zero cover
Distributional
Assumption for
Mean % Cover
Average
Percent
Cover
90% Lower
CL
90% Upper
CL
Herb willowherb Epilobium sp. 7
Tree bigleaf maple Acer macrophyllum 1
Canada thistle Cirsium arvense 1
common plantain Plantago major 1
foxglove Digitalis purpurea 1
white clover Trifolium repens 2
butterfly bush Buddleja davidii 2
Himalayan blackberry Rubus discolor 6
English ivy Hedera helix 2
vetch Vicia sp. 1
Unclassified Gram Unclassified-grass 7
Non-Plant Cover 0 n/a 0% n/a n/a
Bare Ground 7 N 40% 24% 56%
Notes:
ZMLN=Zero-modified lognormal distribution; N=normal distribution
n/a=not available
36%Invasive
Herb
Shrub
Vine
0%Plant Cover
Native
7 ZMLN 17%
Tables.xlsx
Year 1 (2012/2013) Monitoring Results
Strawberry Plant Park and
Pritchard Park East Bluff Restoration Projects
May 2013 Page 4 of 5
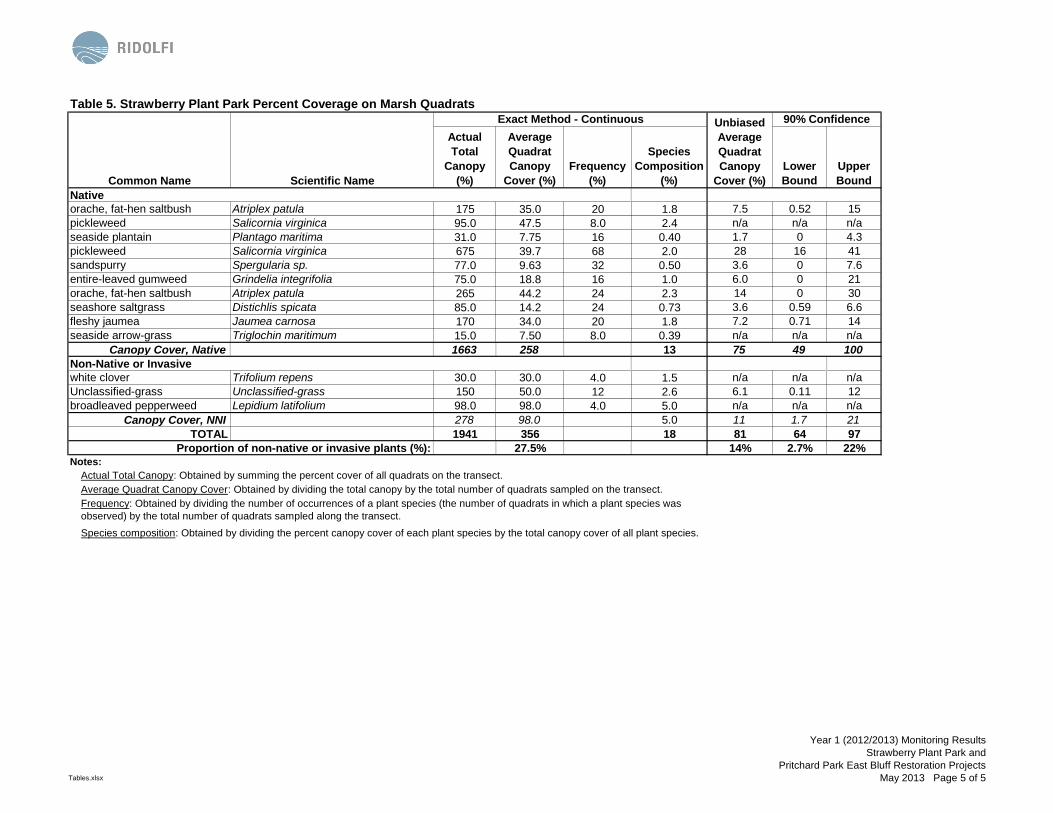
Table 5. Strawberry Plant Park Percent Coverage on Marsh Quadrats
Actual
Total
Canopy
(%)
Average
Quadrat
Canopy
Cover (%)
Frequency
(%)
Species
Composition
(%)
Lower
Bound
Upper
Bound
orache, fat-hen saltbush Atriplex patula 175 35.0 20 1.8 7.5 0.52 15
pickleweed Salicornia virginica 95.0 47.5 8.0 2.4 n/a n/a n/a
seaside plantain Plantago maritima 31.0 7.75 16 0.40 1.7 0 4.3
pickleweed Salicornia virginica 675 39.7 68 2.0 28 16 41
sandspurry Spergularia sp. 77.0 9.63 32 0.50 3.6 0 7.6
entire-leaved gumweed Grindelia integrifolia 75.0 18.8 16 1.0 6.0 0 21
orache, fat-hen saltbush Atriplex patula 265 44.2 24 2.3 14 0 30
seashore saltgrass Distichlis spicata 85.0 14.2 24 0.73 3.6 0.59 6.6
fleshy jaumea Jaumea carnosa 170 34.0 20 1.8 7.2 0.71 14
seaside arrow-grass Triglochin maritimum 15.0 7.50 8.0 0.39 n/a n/a n/a
Canopy Cover, Native 1663 258 13 75 49 100
white clover Trifolium repens 30.0 30.0 4.0 1.5 n/a n/a n/a
Unclassified-grass Unclassified-grass 150 50.0 12 2.6 6.1 0.11 12
broadleaved pepperweed Lepidium latifolium 98.0 98.0 4.0 5.0 n/a n/a n/a
Canopy Cover, NNI 278 98.0 5.0 11 1.7 21
TOTAL 1941 356 18 81 64 97
Proportion of non-native or invasive plants (%): 27.5% 14% 2.7% 22%Notes:
Species composition: Obtained by dividing the percent canopy cover of each plant species by the total canopy cover of all plant species.
90% Confidence
Non-Native or Invasive
Actual Total Canopy: Obtained by summing the percent cover of all quadrats on the transect.
Average Quadrat Canopy Cover: Obtained by dividing the total canopy by the total number of quadrats sampled on the transect.
Frequency: Obtained by dividing the number of occurrences of a plant species (the number of quadrats in which a plant species was
observed) by the total number of quadrats sampled along the transect.
Native
Common Name Scientific Name
Exact Method - Continuous Unbiased
Average
Quadrat
Canopy
Cover (%)
Tables.xlsx
Year 1 (2012/2013) Monitoring Results
Strawberry Plant Park and
Pritchard Park East Bluff Restoration Projects
May 2013 Page 5 of 5