Embed Size (px)
Citation preview
AUTHORS
Andrew S. Madof � Department of Earthand Environmental Sciences and Lamont-Doherty Earth Observatory of Columbia Uni-versity, Palisades, New York 10964;[email protected]
Andrew S. Madof is a Ph.D. candidate at Co-lumbia University’s Lamont-Doherty Earth Ob-servatory. He received his B.A. degree fromOberlin College in 2000, his M.S. degree from theUniversity of Kansas in 2006, and his M.Phil.degree from Columbia University in 2008. Hisresearch focuses on the noneustatic controlson both shallow-marine and deep-water sys-tems and particularly on the role of deformation
Stratigraphic controls on asalt-withdrawal intraslopeminibasin, north-central GreenCanyon, Gulf of Mexico:Implications for misinterpretingsea level changeAndrew S. Madof, Nicholas Christie-Blick,and Mark H. Anders
in modulating accommodation.
Nicholas Christie-Blick � Department ofEarth and Environmental Sciences and Lamont-Doherty Earth Observatory of Columbia Uni-versity, Palisades, New York 10964
Nicholas Christie-Blick is a professor of earthand environmental sciences at Columbia Uni-versity’s Lamont-Doherty Earth Observatory. Hecompleted his Ph.D. at the University of Cali-fornia, Santa Barbara, in 1979, and was a researchscientist at Exxon Production Research Companyin Houston for three years in the early 1980s.Christie-Blick’s research and publications dealwith such varied topics as sedimentation pro-cesses, crustal deformation, and deep-time Earthhistory, with emphasis on challenging con-ventional thinking and resolving outstandingdisagreements.
Mark H. Anders � Department of Earth andEnvironmental Sciences and Lamont-DohertyEarth Observatory of Columbia University,Palisades, New York 10964
Mark H. Anders is an associate professor ofearth and environmental sciences at ColumbiaUniversity’s Lamont-Doherty Earth Observatory.He received his Ph.D. from the University ofCalifornia at Berkeley in 1989 working withWalter Alvarez, and joined the Columbia faculty
ABSTRACT
Three-dimensional seismic data from the Fuji basin, a salt-controlled intraslope minibasin in north-central Green Can-yon, Gulf of Mexico, reveal complex interactions betweengravity- and suspension-driven sedimentation. Seismic vol-umes for late Pleistocene (∼470 ka) to Holocene fill withinthe Fuji basin consist of approximately 45% mass transportcomplexes (MTCs), 5% channelized sandy turbidites, and50% hemipelagites and muddy turbidites. At least ten MTCswithin the Fuji basin flowed radially toward its depocenter, ei-ther from basin flanks (i.e., intrabasinal) or as a result of larger-scale salt motion (i.e., extrabasinal). Sediment transport direc-tions are inferred on the basis of elongate basal incisions andsmaller-scale scours, head scarps, fold orientation within thecomplexes, and stratigraphic thinning trends at downdip mar-gins. An amalgamated set of three channelized sandy turbiditecomplexes less than 350 m (1148 ft) thick and 3 km (1.8 mi)across represents themain sand delivery pathway into the Fujibasin. These deposits are thought to be due to shelf bypass,and possibly, to proximity to the Pleistocene shoreline. Hemi-pelagites and muddy turbidites are homogeneous, and theirthickness is relatively consistent at basin scale. This facies rep-resents background sedimentation.
that year. He and his students work on a widerange of topics related to faults and the faultingprocess, including fault growth, the effects ofmagmatism on extension, and more recently, themechanics of large block slides.
Copyright ©2009. The American Association of Petroleum Geologists. All rights reserved.
Manuscript received June 16, 2008; provisional acceptance August 5, 2008; revised manuscript receivedOctober 31, 2008; final acceptance December 22, 2008.DOI:10.1306/12220808082
AAPG Bulletin, v. 93, no. 4 (April 2009), pp. 535–561 535

ACKNOWLEDGEMENTS
The authors acknowledge Chevron for summerinternships (Madof) and for access to proprie-tary biostratigraphic data, Compagnie Généralede Géophysique-Veritas for the loan of 3-Dseismic reflection data, Paradigm for providingaccess to VoxelGeo commercial interpretationsoftware, and National Science Foundation grantOCE 01-19019 for the recent support of oursequence-stratigraphic studies (Christie-Blick).We are especially grateful to Jason R. Cansler,Tom L. Elliott, Barney Issen, David C. Lentrichia,Ivan D. Marroquin, Martin A. Perlmutter, SergeSauvagnac, Luc Schlumberger, and Nat G. Smithfor making it possible to undertake this project.We thank Frank D. Bilotti, Walter C. Pitman III,William B.F. Ryan, Michael S. Steckler, andCharles Stelting for engaging discussions about theemerging interpretation, and Janok P. Bhatta-charya, D. Bradford Macurda Jr., Zoltan Sylvester,and AAPG editor Gretchen Gillis for helpful re-views. Lamont-Doherty Earth Observatory con-tribution number 7215.
536 Stratigraphic Controls on a Salt-Withdrawal
A process-driven model has been developed involvinghalokinetic autocyclicity as the primary control on sedimenta-tion in the Fuji basin. Passive salt motion accounts better forboth the directions of sediment transport and the frequency oflate Pleistocene–Holocene MTCs than currently popular eu-static and steady-state bathymetric models. The conclusion issignificant in casting doubt on the generally assumed impor-tance of eustasy in controlling off-shelf lowstand sedimenta-tion and in implying marked variations in stratigraphicdetails at length scales of less than 10 km (6.2 mi).
INTRODUCTION
Conventional wisdom suggests that sedimentation in intra-slope deep-water depositional systems is governed by eithereustasy or steady-state bathymetry. The eustatic model assertsa correlation between sea level and facies assemblages (Weimer,1990; Posamentier and Kolla, 2003), where sediment is derivedprimarily from the shelf and at time scales that relate to the fre-quency of eustatic cycles. The bathymetric model proposes anassociation between antecedent physiography in salt-withdrawalminibasins and instantaneous patterns of sedimentation (Pratheret al., 1998; Winker and Booth, 2000).
According to the eustaticmodel, at high stands of sea level,deposition of coarse-grained sediments occurs preferentially inshallow-marine environments. Deep-water settings are char-acterizedmainly by background (hemipelagic) sedimentation.At falls in sea level, low permeability leads to an increase inpore-fluid pressure relative to the ambient confining pressure.Overpressure produced in this way contributes to slope failureand the initiation ofmass transport complexes (MTCs), whichare for this reason widely regarded as proxies for falling sea levelin deep-water regimes (Weimer, 1990; Posamentier andKolla,2003). At eustatic low stands, sediment delivered to the slopeis thought to bypass the shelf via incised valleys. Subsequentrapid rises of sea level can produce slope instabilities throughwater and sediment loading, which in some cases may lead to asecond generation of MTCs (Posamentier and Kolla, 2003).
According to the bathymetric model, coarse-grained sed-iment is able to pond at depths greater than basin spill pointsbut is assumed to bypass whenever basins become overfilled(Winker and Booth, 2000; Mallarino et al., 2006). The pres-ervation potential of such sediment can therefore be inferredfrom a comparison of local slope profiles with regional pro-files. Hemipelagic sediments drape the bathymetry, and theirdistribution is not influenced by such considerations.
Intraslope Minibasin in the Gulf of Mexico
This study makes use of commercial three-dimensional (3-D) seismic reflection data fromthe Fuji basin, a salt-withdrawal intraslope mini-basin located in north-central Green Canyon, Gulfof Mexico, to evaluate these competing ideas. Lit-tle has been published on the Fuji basin (Acosta,1994; McBride, 1997; Soto, 1997) because of theproprietary nature of much of the seismic-reflectionand well data. The present study provides the firstpublicly available 3-D interpretation of seismic fa-cies and architecture for the basin.
STRATIGRAPHIC AND TECTONIC SETTING
The Fuji basin, an upper Pliocene to Holocenesalt-withdrawal structure associated with sedi-ment loading (McBride, 1997), is located withinthe Middle Jurassic to Holocene-aged Gulf ofMexico passive margin (Figures 1, 2). The basin ispart of a much broader province of salt-withdrawal
intraslope minibasins with comparable physiog-raphy. The Fuji basin is approximately 30 km(18.6 mi) long and 15 km (9.3 mi) wide and ori-ented north–south. The floor of the basin is cur-rently 1.3 km (4200 ft) below the sea surfaceand as much as 0.5 km (1700 ft) below the crestsof flanking salt-cored highs. The northern marginis delineated by the Nagano fault, a growth faultrelated to salt withdrawal (McBride, 1997).
TheGulf ofMexico passivemargin formed as aresult of the breakup of Pangea (Buffler and Sawyer,1985; Salvador, 1987, 1991; Feng et al., 1994; Birdet al., 2005). The Gulf is underlain primarily byoceanic crust and rimmed by transitional to conti-nental crust (Bird et al., 2005). During the Middleto Late Jurassic, up to several kilometers of saltwere deposited as a result of the evaporation ofsea water in restricted embayments (Diegel et al.,1995). The accumulation of thick Mesozoic andCenozoic sediments subsequently mobilized thesalt, which became generally allochthonous during
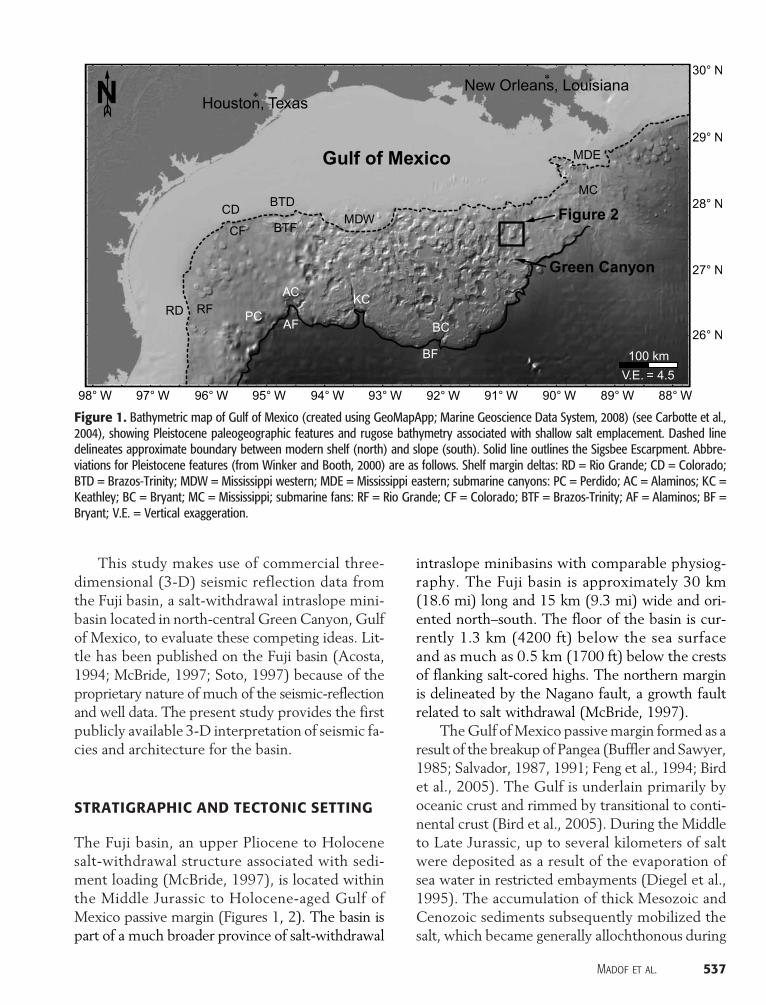
Figure 1. Bathymetric map of Gulf of Mexico (created using GeoMapApp; Marine Geoscience Data System, 2008) (see Carbotte et al.,2004), showing Pleistocene paleogeographic features and rugose bathymetry associated with shallow salt emplacement. Dashed linedelineates approximate boundary between modern shelf (north) and slope (south). Solid line outlines the Sigsbee Escarpment. Abbre-viations for Pleistocene features (from Winker and Booth, 2000) are as follows. Shelf margin deltas: RD = Rio Grande; CD = Colorado;BTD = Brazos-Trinity; MDW = Mississippi western; MDE = Mississippi eastern; submarine canyons: PC = Perdido; AC = Alaminos; KC =Keathley; BC = Bryant; MC = Mississippi; submarine fans: RF = Rio Grande; CF = Colorado; BTF = Brazos-Trinity; AF = Alaminos; BF =Bryant; V.E. = Vertical exaggeration.
Madof et al. 537
the Oligocene to Miocene (Diegel et al., 1995).Contemporary progradation and loading by deep-water sediments (Prather et al., 1998) are respon-sible for the present-day rugose bathymetry.
Sedimentation above a mobile salt substratehas been the primary control on the stratigraphicevolution of theGulf ofMexico since theMiocene.At that time, the Mississippi River depocenter waslocated in the eastern Gulf. Sediment overfilledshallow bathymetric depressions (minibasins), in-ducing bypass to the abyssal plain (Winker andBooth, 2000). By the late Pliocene to early Pleisto-cene, the depocenter had migrated westward as a re-
538 Stratigraphic Controls on a Salt-Withdrawal Intraslope Mini
sult of the reorganization of the Mississippi Riverdrainage (Prather et al., 1998; Winker and Booth,2000). Intraslope minibasins became well devel-oped during the late Pleistocene, with bypass viasubmarine canyons to the Mississippi Fan and, toa lesser degree, the Bryant and Alaminos fans(Winker and Booth, 2000).
In the vicinity of the Fuji basin, pre-Pliocenestratigraphy consists primarily of deep-water depos-its influenced by shallow (allochthonous) salt mo-bility. More than 6.0 km (20,000 ft) of deep-watersediment accumulated in the Fuji basin during thePliocene and Pleistocene (Soto, 1997). McBride
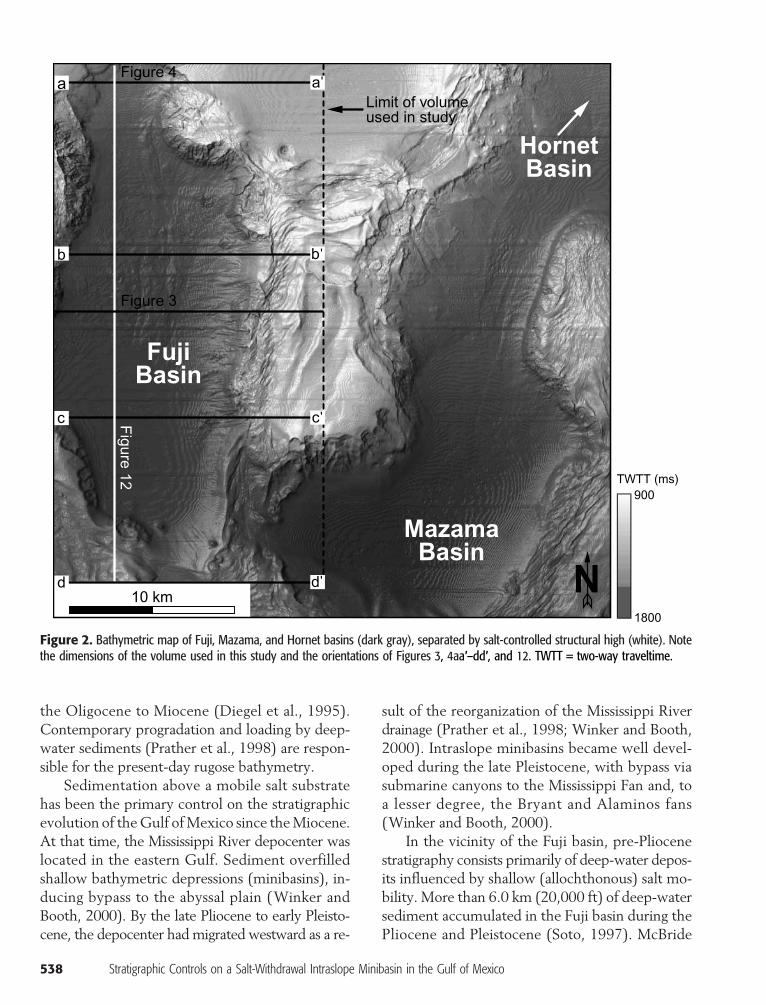
Figure 2. Bathymetric map of Fuji, Mazama, and Hornet basins (dark gray), separated by salt-controlled structural high (white). Notethe dimensions of the volume used in this study and the orientations of Figures 3, 4aa′–dd′, and 12. TWTT = two-way traveltime.
basin in the Gulf of Mexico

(1997) showed that the salt canopy was fed from adeeper salt source until 3.8 Ma, when that sourcebecame exhausted. The flow of shallow salt to theeast, west, and south is responsible for the modernbathymetry. Salt was completely evacuated frombeneath the Fuji basin by 0.2 Ma, permitting theminibasin fill to rest directly on subsalt stratigra-phy and form a salt weld within the Pliocene some7.6 km (25,000 ft) below sea level.
DATA AND METHODOLOGY
The 3-D seismic reflection data used for thisstudy cover 18 blocks of the outer continental shelf(Figure 2) and encompass an area of 420 km2
(162 mi2) to a depth of 4000 ms (1.8 km/5900 ft).The data were acquired during 1999–2000 and re-processed in 2001 using a modeled signature toapproximate zero phase. Prestack time-migratedvolume has a frequency of 50–60 Hz and a binspacing of 20 × 12.5 m (66 × 41 ft), with a verticalsampling rate of 4 ms. The vertical resolution ofthe data is approximately 10 ms (7.5 m/25 ft).Sediment velocities were estimated to be roughly1500 m/s based on previous studies in the Gulf ofMexico (Winn et al., 1998; Bevc et al., 2003;McDonnell et al., 2008). This figure is used for alldepths in the Fuji basin because a velocity model isnot available.
Nineteen seismic surfaces (Figure 3) were pickedand used to interpret the Fuji basin’s stratigraphyat high resolution and in three dimensions. Sur-faces were chosen for both stratigraphic and prac-tical reasons, for example, where high-amplitudereflections are present directly above or below cha-otic intervals and at other levels characterized bylateral continuity. Each surface is associated witha characteristic amplitude: peak, trough, or zerocrossing (a change from peak to trough or viceversa). After a reflection was selected, the 3-Dpropagator algorithm was used to cross-correlatenearest-neighbor seismic traces to within a definedconfidence interval. This workflow created 3-Dseismic surfaces, which were subsequently in-spected by panning through each trace for everysurface. Where the propagator algorithm miscor-
related, surfaces were manually adjusted to thecorrect reflection.
Discontinuities arise within reflections as arti-facts of the propagator algorithm (e.g., where re-flection amplitude is less than the predeterminedthreshold), and as a result of reflection geometry(e.g., where reflecting interfaces are too steep,andwhere one reflection terminates against anotherby baselap, truncation, stratigraphic thinning orfaulting). Locally steep interfaces associated withrugose bathymetry are particularly problematicin the Fuji basin. Physical surfaces, therefore, aremore continuous thanmight be inferred from initialuse of the propagator (e.g., seismic surface no. 15,Figure 3B).
FACIES ASSEMBLAGES
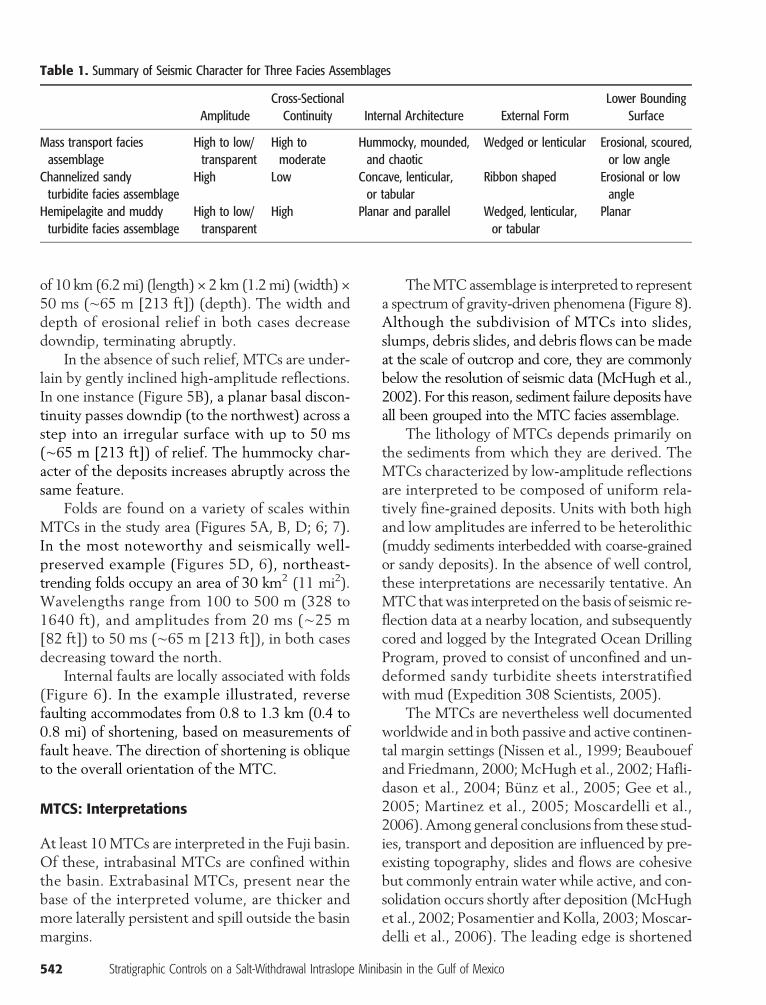
Three seismic facies assemblages compose the ba-sin fill above 4000 ms (Figure 4): the MTC facies(∼45% of the total), the channelized sandy turbi-dite facies (∼5%), and the hemipelagite and mud-dy turbidite facies (∼50%). Facies assemblages areidentified and delineated on the basis of ampli-tude, cross-sectional continuity, internal architec-ture, external form, and lower bounding surfaces(Table 1). Interpretations of lithology are basedsolely on these criteria, as the authors did not haveaccess to proprietary well data and core in thestudy area. However, the authors were granted ac-cess to biostratigraphic data (discussed in the AgeControl section).
TheMTCs are characterized by hummocky tomounded, high- to low-amplitude reflections.These deposits, which vary greatly in both expres-sion and volume of individual units, are found pref-erentially in the depocenter of the Fuji basin,becoming more abundant and increasingly amal-gamated up section. Channelized sandy turbidites,the least voluminous assemblage, are identified onthe basis of low cross-sectional continuity and high-amplitude reflections. This assemblage is character-ized by relatively low spatial variability, and it con-tinues to the south and southeast beyond the edgeof the seismic volume. Hemipelagite and muddyturbidites, the most voluminous assemblage,
Madof et al. 539

correspond with low-amplitude reflections of rela-tively nondescript and homogeneous characterand with intervals of roughly uniform thickness.
MTCs: Observations
The MTCs constitute the most variable assem-blage and consist of hummocky, mounded, andchaotic, high- to low-amplitude reflections, exhib-iting a wedge-shaped or lenticular external form(Table 1). Units have an erosional, scoured, or low-angle basal surface. The facies is characterized byhigh to moderate cross-sectional continuity, witha locally folded or faulted internal architecture.
540 Stratigraphic Controls on a Salt-Withdrawal Intraslope Mini
Units composing theMTC facies range in thick-ness from less than 50ms (∼65m [213 ft]) tomorethan200ms (∼265m[869 ft]) and in area froma fewsquare kilometers tomore than 300 km2 (116mi2).Individual deposits thin toward the basin marginsand decrease in volume and areal extent up section.
The MTCs exhibit a wide variety of basal ero-sional features (Figure 5A–C). Of these, the twomost common are large-scale basal incision andsmall-scale scour, which remove from more than50 km2 (19 mi2) to less than 1 km2 (0.3 mi2), re-spectively, of the underlying deposits. Basal inci-sion exhibits up to 100 ms (∼133 m [436 ft]) ofrelief, whereas scours have maximum dimensions
Figure 3. East-west–oriented seismic profile:(A) uninterpreted and(B) interpreted. Interpretedprofile shows 19 pickedseismic surfaces: S-01 de-notes seismic surface no. 1.The scale is the same inboth panels. See Figure 2for the orientation of pro-file. TWTT = two-waytraveltime.
basin in the Gulf of Mexico
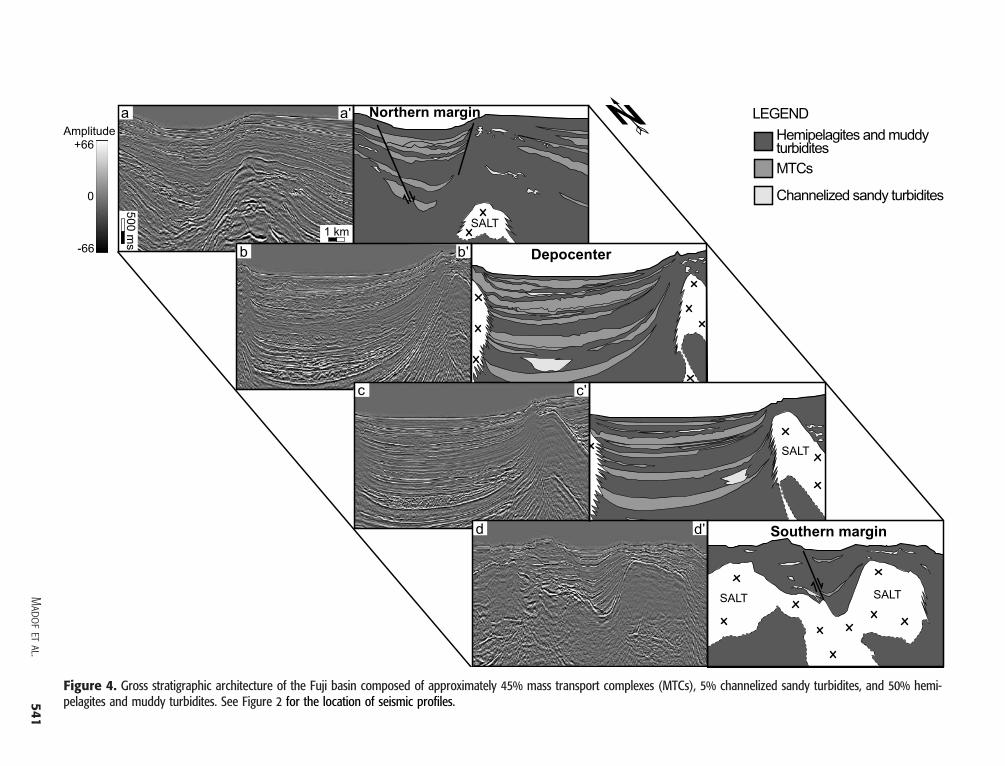
Figure 4. Gross stratigraphic architecture of the Fuji basin composed of approximately 45% mass transport complexes (MTCs), 5% channelized sandy turbidites, and 50% hemi-pelagites and muddy turbidites. See Figure 2 for the location of seismic profiles.
Madof
etal.
541
of 10 km (6.2mi) (length) × 2 km (1.2mi) (width) ×50 ms (∼65 m [213 ft]) (depth). The width anddepth of erosional relief in both cases decreasedowndip, terminating abruptly.
In the absence of such relief, MTCs are under-lain by gently inclined high-amplitude reflections.In one instance (Figure 5B), a planar basal discon-tinuity passes downdip (to the northwest) across astep into an irregular surface with up to 50 ms(∼65 m [213 ft]) of relief. The hummocky char-acter of the deposits increases abruptly across thesame feature.
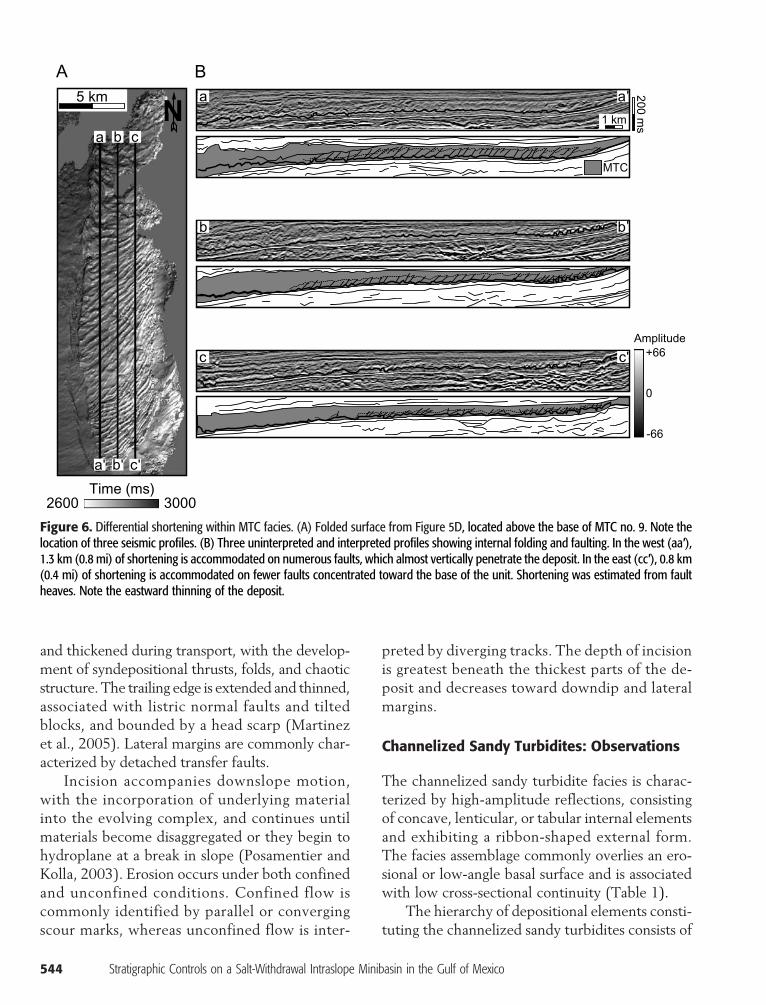
Folds are found on a variety of scales withinMTCs in the study area (Figures 5A, B, D; 6; 7).In the most noteworthy and seismically well-preserved example (Figures 5D, 6), northeast-trending folds occupy an area of 30 km2 (11 mi2).Wavelengths range from 100 to 500 m (328 to1640 ft), and amplitudes from 20 ms (∼25 m[82 ft]) to 50 ms (∼65 m [213 ft]), in both casesdecreasing toward the north.
Internal faults are locally associated with folds(Figure 6). In the example illustrated, reversefaulting accommodates from 0.8 to 1.3 km (0.4 to0.8 mi) of shortening, based on measurements offault heave. The direction of shortening is obliqueto the overall orientation of the MTC.
MTCS: Interpretations
At least 10MTCs are interpreted in the Fuji basin.Of these, intrabasinal MTCs are confined withinthe basin. Extrabasinal MTCs, present near thebase of the interpreted volume, are thicker andmore laterally persistent and spill outside the basinmargins.
542 Stratigraphic Controls on a Salt-Withdrawal Intraslope Mini
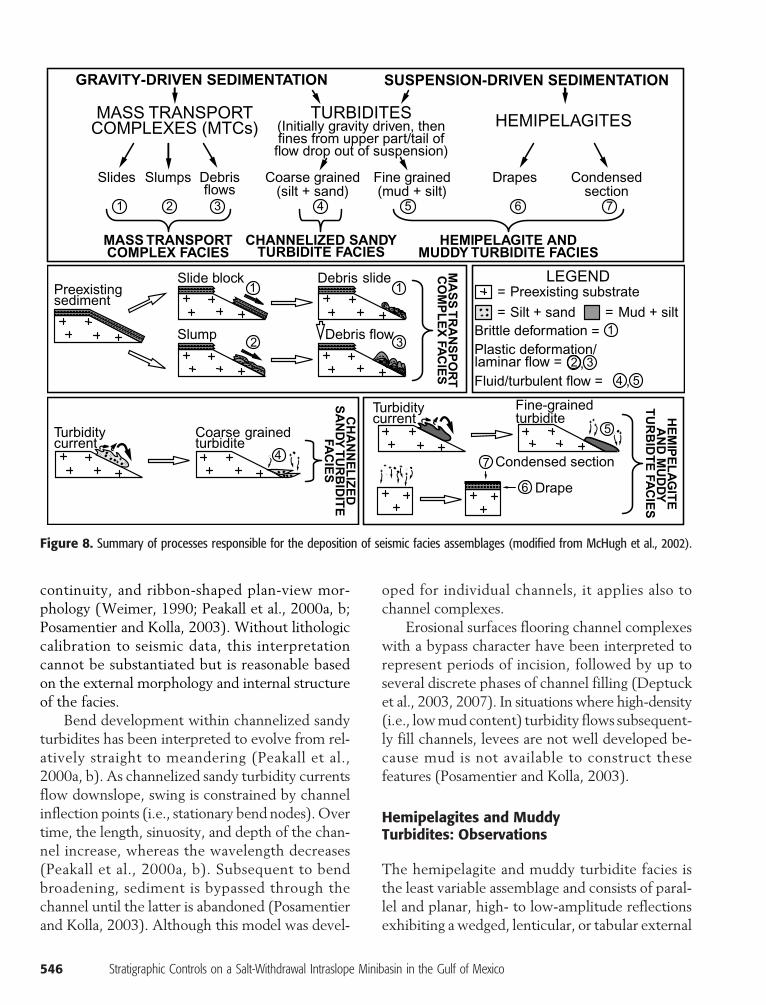
TheMTCassemblage is interpreted to representa spectrum of gravity-driven phenomena (Figure 8).Although the subdivision of MTCs into slides,slumps, debris slides, and debris flows can bemadeat the scale of outcrop and core, they are commonlybelow the resolution of seismic data (McHugh et al.,2002). For this reason, sediment failure deposits haveall been grouped into the MTC facies assemblage.
The lithology of MTCs depends primarily onthe sediments from which they are derived. TheMTCs characterized by low-amplitude reflectionsare interpreted to be composed of uniform rela-tively fine-grained deposits. Units with both highand low amplitudes are inferred to be heterolithic(muddy sediments interbedded with coarse-grainedor sandy deposits). In the absence of well control,these interpretations are necessarily tentative. AnMTC thatwas interpreted on the basis of seismic re-flection data at a nearby location, and subsequentlycored and logged by the Integrated Ocean DrillingProgram, proved to consist of unconfined and un-deformed sandy turbidite sheets interstratifiedwith mud (Expedition 308 Scientists, 2005).
The MTCs are nevertheless well documentedworldwide and in both passive and active continen-tal margin settings (Nissen et al., 1999; Beaubouefand Friedmann, 2000; McHugh et al., 2002; Hafli-dason et al., 2004; Bünz et al., 2005; Gee et al.,2005; Martinez et al., 2005; Moscardelli et al.,2006).Among general conclusions from these stud-ies, transport and deposition are influenced by pre-existing topography, slides and flows are cohesivebut commonly entrain water while active, and con-solidation occurs shortly after deposition (McHughet al., 2002; Posamentier and Kolla, 2003; Moscar-delli et al., 2006). The leading edge is shortened
Table 1. Summary of Seismic Character for Three Facies Assemblages
Amplitude
Cross-SectionalContinuity Internal Architecturebasin in the Gulf of M
External Form
exico
Lower BoundingSurface
Mass transport faciesassemblage
High to low/transparent
High tomoderate
Hummocky, mounded,and chaotic
Wedged or lenticular
Erosional, scoured,or low angleChannelized sandyturbidite facies assemblage
High
Low Concave, lenticular,or tabularRibbon shaped
Erosional or lowangleHemipelagite and muddyturbidite facies assemblage
High to low/transparent
High
Planar and parallel Wedged, lenticular,or tabularPlanar
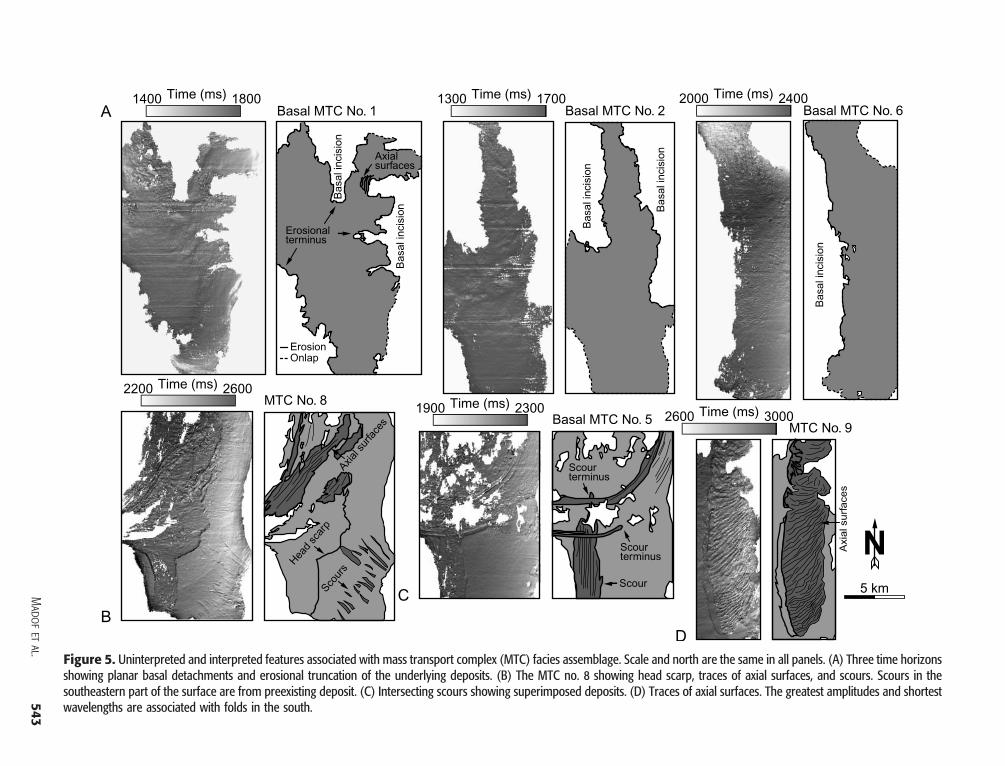
Figure 5. Uninterpreted and interpreted features associated with mass transport complex (MTC) facies assemblage. Scale and north are the same in all panels. (A) Three time horizonsshowing planar basal detachments and erosional truncation of the underlying deposits. (B) The MTC no. 8 showing head scarp, traces of axial surfaces, and scours. Scours in thesoutheastern part of the surface are from preexisting deposit. (C) Intersecting scours showing superimposed deposits. (D) Traces of axial surfaces. The greatest amplitudes and shortestwavelengths are associated with folds in the south.
Madof
etal.
543
and thickened during transport, with the develop-ment of syndepositional thrusts, folds, and chaoticstructure. The trailing edge is extended and thinned,associated with listric normal faults and tiltedblocks, and bounded by a head scarp (Martinezet al., 2005). Lateral margins are commonly char-acterized by detached transfer faults.
Incision accompanies downslope motion,with the incorporation of underlying materialinto the evolving complex, and continues untilmaterials become disaggregated or they begin tohydroplane at a break in slope (Posamentier andKolla, 2003). Erosion occurs under both confinedand unconfined conditions. Confined flow iscommonly identified by parallel or convergingscour marks, whereas unconfined flow is inter-
544 Stratigraphic Controls on a Salt-Withdrawal Intraslope Mini
preted by diverging tracks. The depth of incisionis greatest beneath the thickest parts of the de-posit and decreases toward downdip and lateralmargins.
Channelized Sandy Turbidites: Observations
The channelized sandy turbidite facies is charac-terized by high-amplitude reflections, consistingof concave, lenticular, or tabular internal elementsand exhibiting a ribbon-shaped external form.The facies assemblage commonly overlies an ero-sional or low-angle basal surface and is associatedwith low cross-sectional continuity (Table 1).
The hierarchy of depositional elements consti-tuting the channelized sandy turbidites consists of
Figure 6. Differential shortening within MTC facies. (A) Folded surface from Figure 5D, located above the base of MTC no. 9. Note thelocation of three seismic profiles. (B) Three uninterpreted and interpreted profiles showing internal folding and faulting. In the west (aa′),1.3 km (0.8 mi) of shortening is accommodated on numerous faults, which almost vertically penetrate the deposit. In the east (cc′), 0.8 km(0.4 mi) of shortening is accommodated on fewer faults concentrated toward the base of the unit. Shortening was estimated from faultheaves. Note the eastward thinning of the deposit.
basin in the Gulf of Mexico

meandering ribbon-shaped channels (Figure 9),laterally and vertically arranged into channel com-plexes (Figure 10). These complexes are flooredby a master erosional surface and capped by a pla-nar upper boundary.
The individual channel is the most fundamen-tal unit of the facies, with dimensions of more than30 km (18.6 mi) (length) × 0.1 km (0.06 mi)(width) ×25ms (∼33m[108 ft]) (depth).Channelsexhibit high to moderate sinuosity and increasein length and lateral expansion (i.e., swing) up sec-tion. In one example, levees appear to be presentat the southern end of a channel (Figure 11B). Le-vees, lateral accretion, and down-system meander-loop migration (i.e., sweep) are otherwise notreadily observed in channels within the study area.
Channel complexes comprise variably stacked,laterally and vertically amalgamated channels.Complexes have a bypass character with dimen-sions of greater than 30 km (18.6 mi) (length) ×1.5 km (0.9mi) (width) and are floored by amaster
erosional surface displaying up to 200ms (∼266m[873 ft]) of relief (Figure 10). None of these de-posits displays a distributary morphology. Com-plexes, as with component channels, increase inlength and lateral expansion up section, and theyare oriented north–south to northwest–southeast(Figure 11). Sediment transport directions forthese deposits are assumed to be southward. Thelargest unit of this facies, illustrated in Figures 10and 11, consists of a single example of a set ofchannel complexes, with dimensions exceeding30 km (18.6 mi) (length) × 3 km (1.8 mi) (width)× 250 ms (∼333 m [1092 ft]) (depth). Taken to-gether, this interval displays an up-section in-crease in length, swing, and width.
Channelized Sandy Turbidites: Interpretations
Gravity-driven channelized sandy turbidites (Figure 8)are conventionally identified on the basis of theirhigh-amplitude character, lack of cross-sectional
Figure 7. The MTC no. 10 showing the internal disorganization of the deposit. (A) Horizon slice (plan view) showing radially orientedaxial surfaces, delineated by a black polygon. (B) Three seismic profiles oriented perpendicular to the trace of axial surfaces, showing theinternal structure. Note the lateral change from faulting (northeast) to minimal deformation (southeast).
Madof et al. 545
continuity, and ribbon-shaped plan-view mor-phology (Weimer, 1990; Peakall et al., 2000a, b;Posamentier and Kolla, 2003). Without lithologiccalibration to seismic data, this interpretationcannot be substantiated but is reasonable basedon the external morphology and internal structureof the facies.
Bend development within channelized sandyturbidites has been interpreted to evolve from rel-atively straight to meandering (Peakall et al.,2000a, b). As channelized sandy turbidity currentsflow downslope, swing is constrained by channelinflection points (i.e., stationary bend nodes).Overtime, the length, sinuosity, and depth of the chan-nel increase, whereas the wavelength decreases(Peakall et al., 2000a, b). Subsequent to bendbroadening, sediment is bypassed through thechannel until the latter is abandoned (Posamentierand Kolla, 2003). Although this model was devel-
546 Stratigraphic Controls on a Salt-Withdrawal Intraslope Mini
oped for individual channels, it applies also tochannel complexes.
Erosional surfaces flooring channel complexeswith a bypass character have been interpreted torepresent periods of incision, followed by up toseveral discrete phases of channel filling (Deptucket al., 2003, 2007). In situations where high-density(i.e., lowmud content) turbidity flows subsequent-ly fill channels, levees are not well developed be-cause mud is not available to construct thesefeatures (Posamentier and Kolla, 2003).
Hemipelagites and MuddyTurbidites: Observations
The hemipelagite and muddy turbidite facies isthe least variable assemblage and consists of paral-lel and planar, high- to low-amplitude reflectionsexhibiting a wedged, lenticular, or tabular external
Figure 8. Summary of processes responsible for the deposition of seismic facies assemblages (modified from McHugh et al., 2002).
basin in the Gulf of Mexico
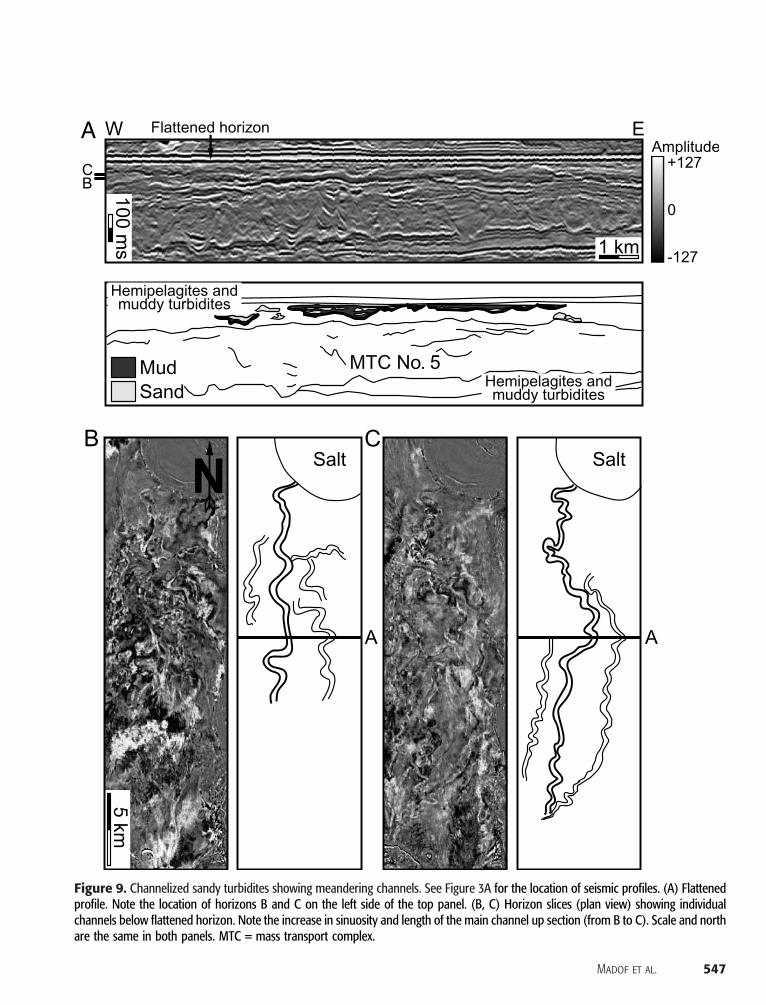
Figure 9. Channelized sandy turbidites showing meandering channels. See Figure 3A for the location of seismic profiles. (A) Flattenedprofile. Note the location of horizons B and C on the left side of the top panel. (B, C) Horizon slices (plan view) showing individualchannels below flattened horizon. Note the increase in sinuosity and length of the main channel up section (from B to C). Scale and northare the same in both panels. MTC = mass transport complex.
Madof et al. 547
form (see hemipelagites and muddy turbidites inFigure 12). This facies assemblage is characterizedby a planar basal surface and high cross-sectionalcontinuity (Table 1).
Successions composing the facies range in thick-ness from less than 50 ms (∼65 m [213 ft]) to morethan 500 ms (∼665 m [2182 ft]) and in area froma few square kilometers to more than 300 km2
(116 mi2). Generally, the assemblage drapes theentire surface area of the basin and thins toward itsmargins. This facies is nonerosive and exhibits highlateral homogeneity.
Hemipelagites and MuddyTurbidites: Interpretations
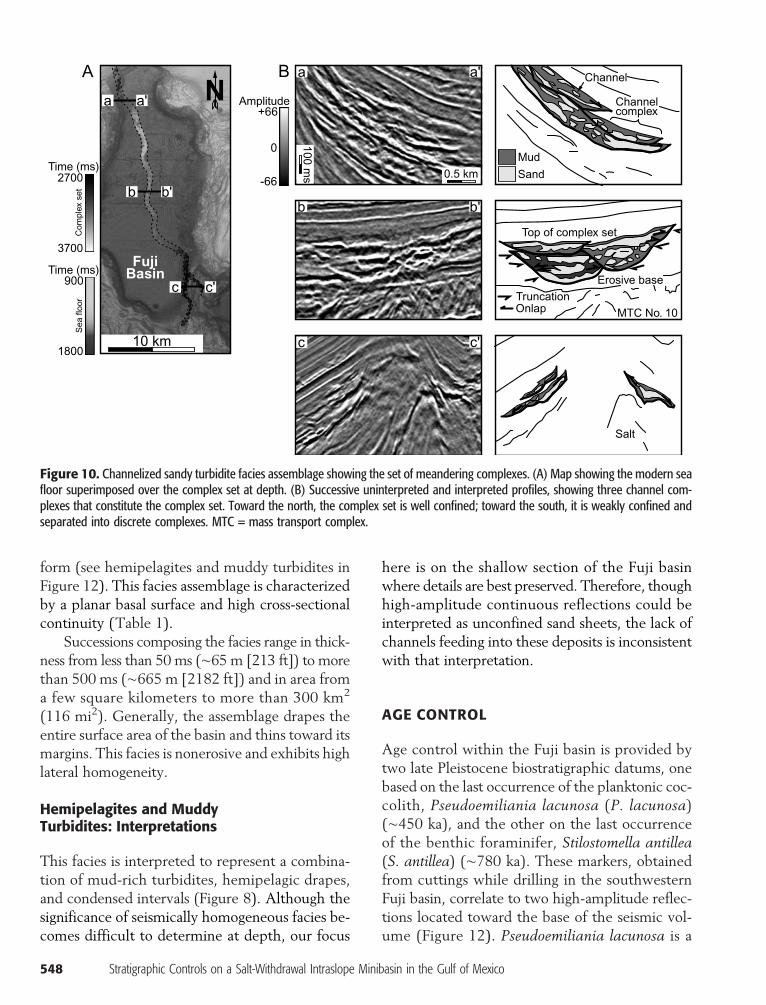
This facies is interpreted to represent a combina-tion of mud-rich turbidites, hemipelagic drapes,and condensed intervals (Figure 8). Although thesignificance of seismically homogeneous facies be-comes difficult to determine at depth, our focus
548 Stratigraphic Controls on a Salt-Withdrawal Intraslope Mini
here is on the shallow section of the Fuji basinwhere details are best preserved. Therefore, thoughhigh-amplitude continuous reflections could beinterpreted as unconfined sand sheets, the lack ofchannels feeding into these deposits is inconsistentwith that interpretation.
AGE CONTROL
Age control within the Fuji basin is provided bytwo late Pleistocene biostratigraphic datums, onebased on the last occurrence of the planktonic coc-colith, Pseudoemiliania lacunosa (P. lacunosa)(∼450 ka), and the other on the last occurrenceof the benthic foraminifer, Stilostomella antillea(S. antillea) (∼780 ka). These markers, obtainedfrom cuttings while drilling in the southwesternFuji basin, correlate to two high-amplitude reflec-tions located toward the base of the seismic vol-ume (Figure 12). Pseudoemiliania lacunosa is a
Figure 10. Channelized sandy turbidite facies assemblage showing the set of meandering complexes. (A) Map showing the modern seafloor superimposed over the complex set at depth. (B) Successive uninterpreted and interpreted profiles, showing three channel com-plexes that constitute the complex set. Toward the north, the complex set is well confined; toward the south, it is weakly confined andseparated into discrete complexes. MTC = mass transport complex.
basin in the Gulf of Mexico
well-documented planktonic coccolith (Thiersteinet al., 1977; Scott et al., 1998; Breard et al., 2000)that became globally extinct during marine isotopestage (MIS) 12, approximately 450–470 ka (Thier-stein et al., 1977; Beu and Edwards, 1984; Caulet,1986; Gard, 1988; Black, 1992; Wei et al., 1998;Flores andMarino, 2002; Olson and Smart, 2004).The last occurrence of P. lacunosa correlates with thebase of MTC no 10. Stilostomella antillea is a benthicforaminifer (Hayward, 2002; Witrock et al., 2003;Govindan, 2004; Gavriloff, 2006), with a last occur-rence dated as 780 ka during the MIS 16 global ex-tinction (Witrock et al., 2003) of deep-sea benthicforaminifers (Gavriloff, 2006). The S. antillea datumcorrelates with seismic surface no. 45 (S-45).
The largest source of uncertainty within theFuji basin consists of tying biostratigraphic datums,obtained from cuttings, to seismic sections, for
which two-way traveltime is the vertical scale.Available data permit the P. lacunosa datum tobe as much as 80 ms (∼60 m [197 ft]) below itscurrently interpreted position (T. Elliott, 2008,personal communication). The S. antillea datummay be as much as 25 ms (∼19 m [62 ft]) aboveand 80 ms (∼60 m [197 ft]) lower than indicated.
SEDIMENT TRANSPORT DIRECTIONS
Based on geometric evidence, MTCs within theFuji basin are interpreted to have flowed radially in-to the depocenter. Directions were inferred usinglarge-scale basal incision, small-scale scours, headscarps, fold orientation, and stratigraphic thinning.Basal incision and scours underlyingMTCs narrowand terminate down system, implying sediment
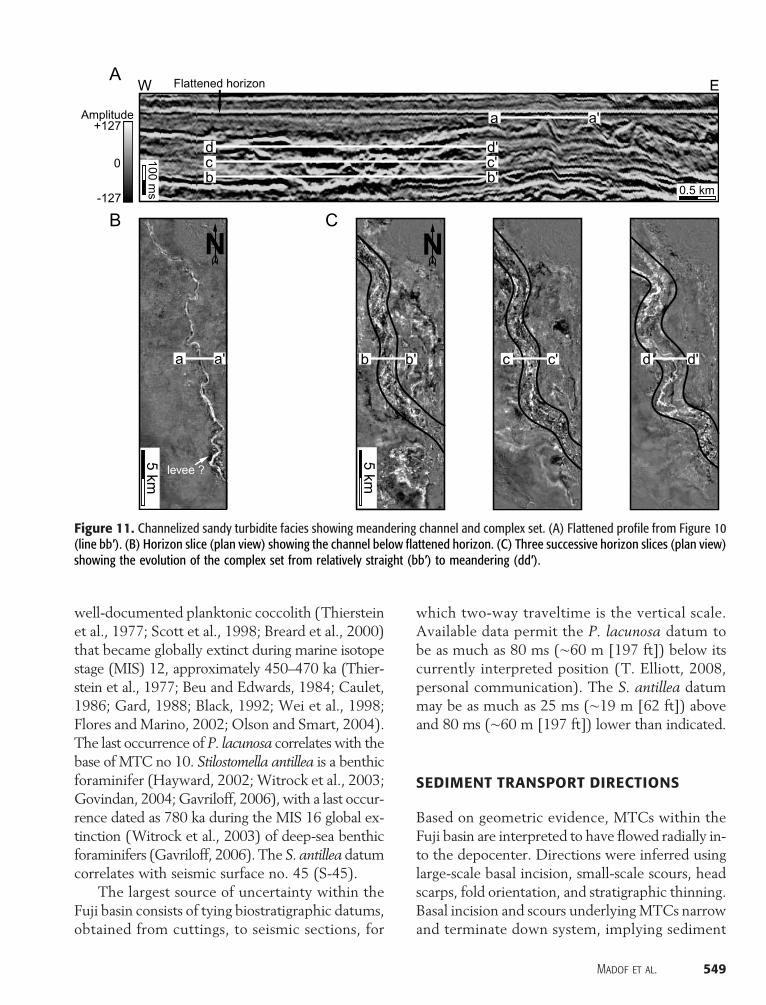
Figure 11. Channelized sandy turbidite facies showing meandering channel and complex set. (A) Flattened profile from Figure 10(line bb′). (B) Horizon slice (plan view) showing the channel below flattened horizon. (C) Three successive horizon slices (plan view)showing the evolution of the complex set from relatively straight (bb′) to meandering (dd′).
Madof et al. 549
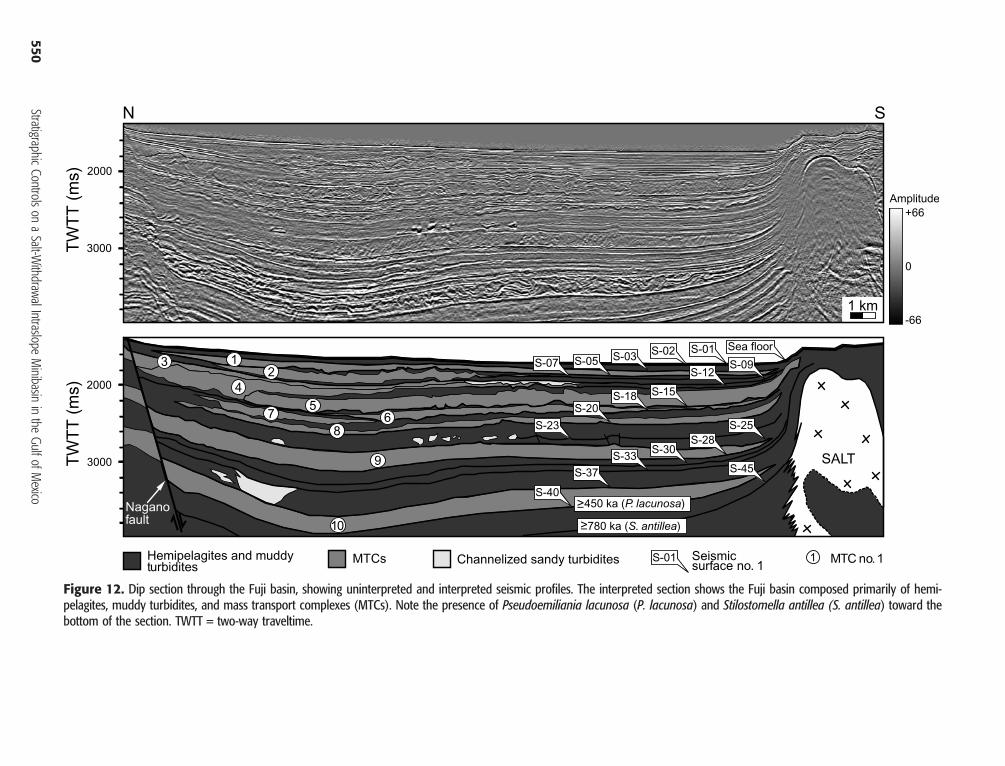
Figure 12. Dip section through the Fuji basin, showing uninterpreted and interpreted seismic profiles. The interpreted section shows the Fuji basin composed primarily of hemi-pelagites, muddy turbidites, and mass transport complexes (MTCs). Note the presence of Pseudoemiliania lacunosa (P. lacunosa) and Stilostomella antillea (S. antillea) toward thebottom of the section. TWTT = two-way traveltime.
550Stratigraphic
Controlson
aSalt-W
ithdrawalIntraslopeMinibasin
inthe
GulfofMexico

transport directions parallel to their longitudinalaxes (Posamentier and Kolla, 2003; Moscardelliet al., 2006). Head scarps and folds form roughlyorthogonal to transport (Martinez et al., 2005;Moscardelli et al., 2006), although fold orienta-tions are subject to rotation during emplacementand as a result of flow over antecedent topographyor a change in gradient. Sediment transport direc-tions are determined with least confidence on thebasis of stratigraphic thinning because MTCs thin
on both lateral and downdip margins. Directionaldata for indicators illustrated in Figure 5 are sum-marized in Table 2 and plotted as rose diagrams inFigure 13.
MTC No. 10
Mass transport complexno. 10, the oldest (Figures 7,12, 13), is an extrabasinalMTC, with large areal ex-tent. Axial surfaces within the deposit are oriented
Table 2. Measured Trends of Directional Indicators from Figure 5 and Inferred Sediment Transport Directions for MTC Nos. 9, 8, 5, and 1*
MTC No. 9
MTC No. 8 MTC No. 5Madof et a
MTC No. 1
Axial Surfaces
Scour Marks(No. 8.1) Head ScarpAxial Surface(No. 8.2)
Scour Marks(No. 5.1)
Scour Marks(No. 5.2)
Axial Surfaces026
048 282 009 037 001 023 008 026 049 293 038 001 024 016 031 049 295 040 002 037 017 033 049 295 041 002 062 018 035 050 298 041 003 062 018 038 050 299 042 005 087 018 040 051 299 042 005 095 020 041 051 302 044 005 022 042 052 304 045 007 022 044 053 305 045 010 044 056 308 045 045 057 311 047 045 059 312 049 046 061 313 049 046 064 315 050 046 068 318 047 071 320 047 076 325 047 116 328 047 118 330 047 128 048 142155
Mean: 055
Mean: 308 Mean: 044 Mean: 004 Mean: 056 Mean: 018Inferredtransportdirection: 180
Inferredtransportdirection: 308
Inferredtransportdirection: 314
Inferredtransportdirection: 004
Inferredtransportdirection: 056
Inferredtransportdirection: 288
*The mean was calculated for fold axial surfaces and scours. Transport directions were assumed to be orthogonal to the axial surfaces within MTCs no. 1 and no. 8 andparallel to the scour marks beneath MTCs no. 5 and no. 8. For MTC no. 9, axial surfaces are interpreted to be 135° from the transport direction as a result of deflectionaround an antecedent structural high. Azimuthal statistics were calculated according to the method of Jones (2006).
l. 551
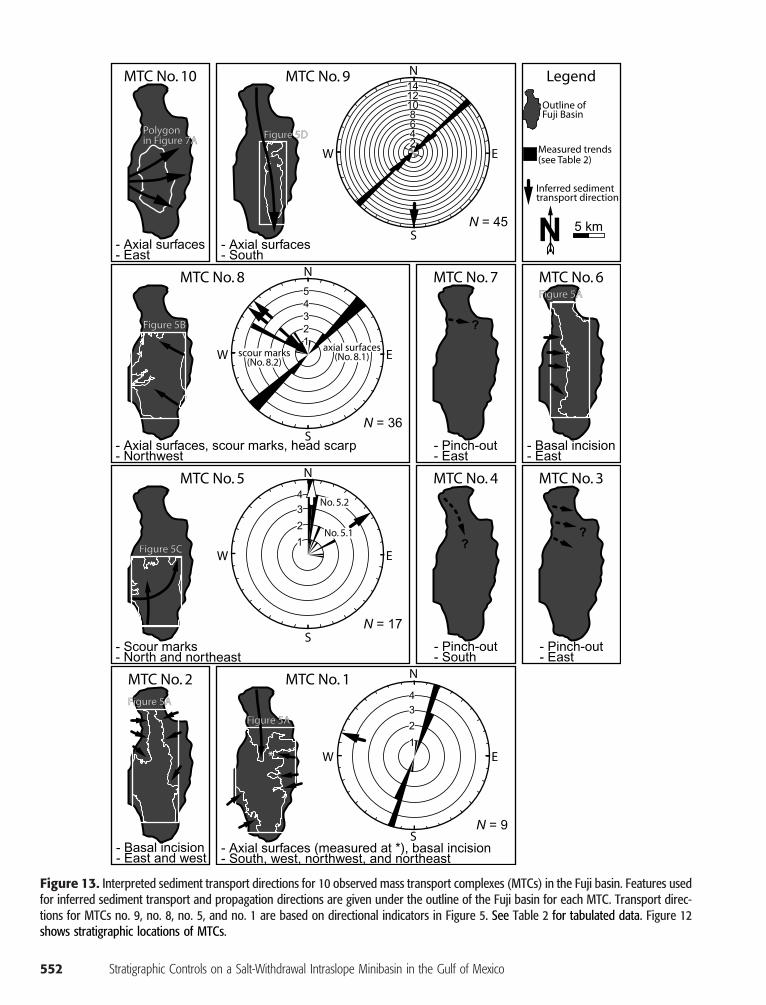
Figure 13. Interpreted sediment transport directions for 10 observed mass transport complexes (MTCs) in the Fuji basin. Features usedfor inferred sediment transport and propagation directions are given under the outline of the Fuji basin for each MTC. Transport direc-tions for MTCs no. 9, no. 8, no. 5, and no. 1 are based on directional indicators in Figure 5. See Table 2 for tabulated data. Figure 12shows stratigraphic locations of MTCs.
552 Stratigraphic Controls on a Salt-Withdrawal Intraslope Minibasin in the Gulf of Mexico
radially away from the basin’s western margin(Figure 7A). Based on the geometry of these fea-tures, the MTC is interpreted to have flowed east-ward (Figure 13).
MTC No. 9
Mass transport complexno. 9 (Figures 5D, 6, 12, 13)is an extrabasinal MTC, which covers the entiresurface area of the Fuji basin. Folds located withinthe deposit are oriented northeast–southwest(Figures 5D, 6A; rose diagram in Figure 13). Al-though transport is arguably toward the southeast,orthogonal to fold trend, we infer that their obliqueorientation is caused by rotation during emplace-ment. The MTC is bounded on its eastern marginby a salt-controlled structural high (Figure 6A). Asthe leading edge of the flowing sediment encoun-tered this topography, folds are thought to havepropagated up dip and to have been deflectedcounterclockwise. A topographic trench on theridge’s westernmargin (Figure 6A) represents a sur-ficial rift associated with the same solid body rota-tion. The western side of the MTC is otherwiseundeformed.
MTC No. 8
Mass transport complex no. 8 (Figures 5B, 12, 13)is among the thinnest intrabasinal MTCs withinthe study area. The MTC no. 8 is composed oftwo laterally amalgamated MTCs: the eastern partof the deposit (no. 8.2) is floored by numerousscours (Figure 5B), whereas the western part(no. 8.1) is associated with folds and a head scarpthat serves as a boundary. The MTC no. 8.2 is un-derlain by several short scours, oriented west–northwest, and abruptly terminating in that direc-tion (Figure 5B; rose diagram in Figure 13). Thedeposit is bounded on its southeastern margin bya salt-controlled structural high, its inferred localsource. The MTC no. 8.1 is floored by structuralelements trending northeast–southwest (Figure5B; rose diagram in Figure 13). The orientations offold axial surfaces and the dip of the head scarp pro-vide evidence for flow to the west–northwest andfor the truncation of MTC no. 8.2, which is inferred
to be older on this basis. These interpretations areconsistent with the inferred paleoslope.
MTC No. 7
Mass transport complex no. 7 (Figures 12, 13) ex-ists only in the northwestern part of the Fuji basinand is the least laterally persistent intrabasinalMTCrecognized. The deposit is delineated on the basisof its wedge-shaped chaotic seismic character andstratigraphic thinning to the east (Figure 13). TheMTCno. 7 is inferred to have flowed eastward fromthe salt-controlled structural high on its westernmargin.
MTC No. 6
Mass transport complex no. 6 (Figures 5A, 12, 13)is a relatively thin intrabasinal MTC of large arealextent. The deposit shows large-scale basal inci-sion, with relief decreasing to the east on its west-ernmargin. Based on basal incision beneath its coreand on the proximity of truncation to the north-west and southwest basin flanks, the deposit is in-terpreted to have been shed eastward in a series ofdiscrete events.
MTC No. 5
Mass transport complex no. 5 (Figures 5C, 12, 13)is the thickest intrabasinal MTC within the Fujibasin. TheMTC no. 5 is composed of two laterallyamalgamated parts: the lower (no. 5.2) is underlainby linear scours, oriented north and abruptly ter-minating in that direction; the upper part of thecomplex (no. 5.1) is floored by curvilinear scourstrending east to northeast (Figure 5C; rose diagramin Figure 13). The MTC no. 5.2 is bounded on itssouthern margin by a salt-controlled structuralhigh (Figure 5C) and is thought to have flowednorthward on this basis. The MTC no. 5.1, whichexhibits a more complicated evolution, is inter-preted to have flowed eastward and to have beendeflected by the northern edge of MTC no. 5.2 orby the west-dipping eastern margin of the Fuji ba-sin. In either scenario, no. 5.1 is interpreted to havebeen derived from the basin’s southwesternmargin.
Madof et al. 553

MTCS No. 4 and No. 3
Mass transport complexes no. 4 andno. 3 (Figures 12,13) are wedge-shaped, superimposed intrabasinalcomplexes that thin abruptly to the southeast. Inthe northwestern part of the Fuji basin, the depos-its appear to be a singleMTC.However, their distal,southeastern boundaries are discrete, and they areinferred on this basis to have been sourced locallyfrom the unstable salt-controlled northern andnorthwestern margins of the basin, respectively(Figure 13).
MTC No. 2
Mass transport complex no. 2 (Figures 5A, 12, 13)is a relatively thin, intrabasinal MTC that thinsabruptly to the south. The deposit is associated withprominent large-scale basal incision on its north-western and eastern margins, shallowing towardthe Fuji basin’s depocenter. This geometry impliesnumerous radial sediment sources.
MTC No. 1
Mass transport complex no. 1, the youngest of the10 examples (Figures 5A, 12, 13), is a thin, intra-basinal complex of large areal extent. Prominentlarge-scale basal incisions are present on its northern,eastern, and southwestern margins, with erosionalrelief decreasing radially toward the Fuji basin’scenter. North-trending folds are locally truncatedat the distal edge of the deposit (Figure 5A). TheMTC no. 1 is interpreted as a radially sourced andlaterally amalgamated composite of several events.
DISCUSSION
Passive salt motion accounts better for the volu-metric abundance of MTCs compared with otherfacies in the Fuji basin, for their varied directionsof emplacement, for their frequency during thelast four 100-k.y. cycles of sea level change, and forthe manner in which the basin evolved than cur-rently popular eustatic and steady-state bathymet-ric models.
554 Stratigraphic Controls on a Salt-Withdrawal Intraslope Mini
Halokinetic Autocyclicity
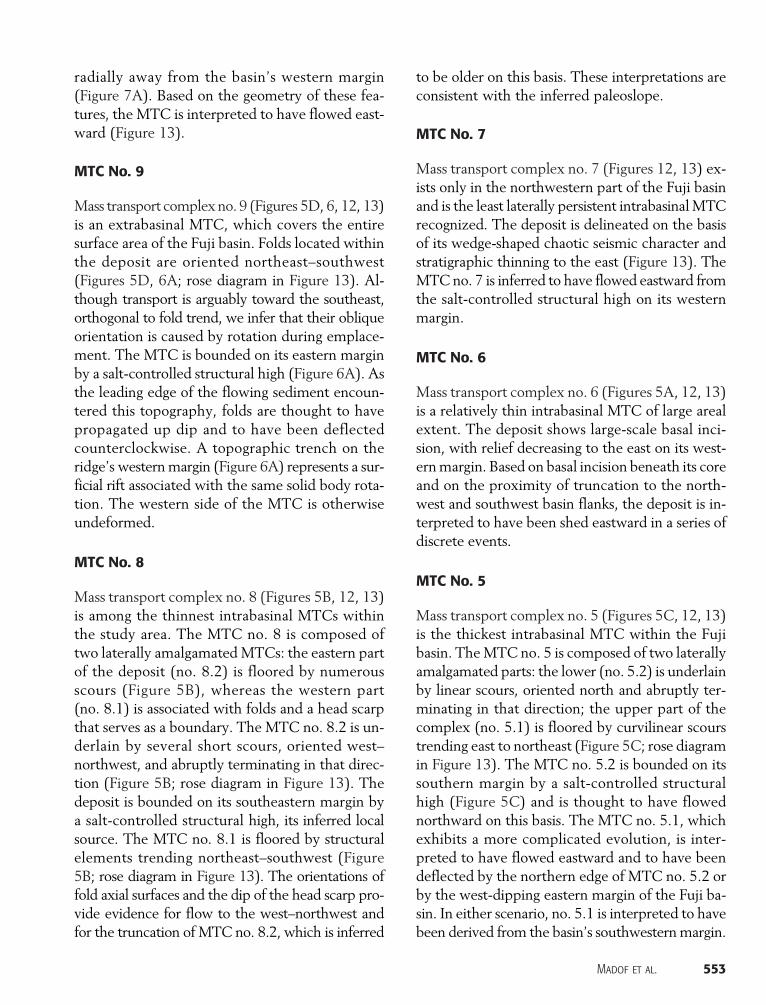
Halokinetic autocyclicity is identified as the prima-ry control on stratigraphic architecture in the Fujibasin. According to this hypothesis, slope stabilityand patterns of sediment accumulation are governedlocally by the 3-Dmotion of the salt (Figure 14). Atthe beginning of each cycle, the accumulation ofhemipelagites and muddy turbidites unevenlyloads preexisting bathymetry. Subsidence in thedepocenter displaces the salt at depth and inducespassive uplift and oversteepening of basin margins.Margin failure results in intrabasinal MTCs, whichflow radially toward and pond within the depo-center. Loading and compaction together resultin additional subsidence. The cycle repeats withrenewed accumulation of fine-grained sediments.At least eight such cycles have been documentedin the Fuji basin since 450 ka (MTCs no. 8 to 1).
Giles and Lawton (2002) reported similar salt-driven deposition adjacent to theEl Papalote diapirin northeasternMexico.Halokineticswere a funda-mental factor in that example in controlling the dis-tribution of upper Cretaceous to PaleogeneMTCs,but differences exist relative to the Fuji basin. Forexample, the La Popa Basin contains shallow-watersiliciclastic deposits punctuated by volumetricallysmaller carbonateMTCs shed from the El Papalotediapir. Diapiric material may have been extrudedonto the sea floor and motion of the salt enhancedbymiddle to lateMaastrichtian tectonic shortening.
Salt motion is also a factor at a scale larger thanthe Fuji basin through differential loadingmore gen-erally of sediments beneath the outer shelf and up-per slope (Tripsanas et al., 2004) and through theconcomitant triggering of sediment failure events.Although the distinction between intra- and extra-basinal MTCs is somewhat arbitrary, and in practi-cal terms, a function of the dimensions of the 3-Dseismic volume being studied, extrabasinal MTCssuch as no. 10 and 9 in this study appear to relateto salt motion at a regional scale instead of proxim-ity to a particular salt structure. The tendency forthe most recent MTCs to be intrabasinal insteadof extrabasinal may relate to the exhaustion ofthe salt source beneath the Fuji basin by 0.2 Ma(McBride, 1997).
basin in the Gulf of Mexico
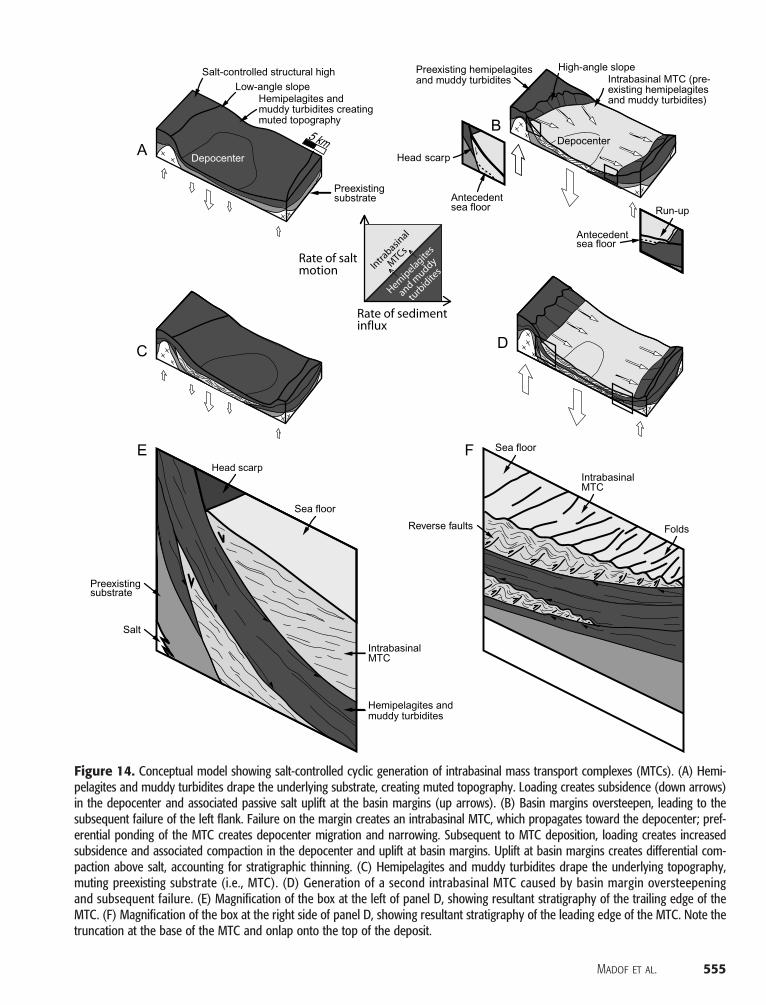
Figure 14. Conceptual model showing salt-controlled cyclic generation of intrabasinal mass transport complexes (MTCs). (A) Hemi-pelagites and muddy turbidites drape the underlying substrate, creating muted topography. Loading creates subsidence (down arrows)in the depocenter and associated passive salt uplift at the basin margins (up arrows). (B) Basin margins oversteepen, leading to thesubsequent failure of the left flank. Failure on the margin creates an intrabasinal MTC, which propagates toward the depocenter; pref-erential ponding of the MTC creates depocenter migration and narrowing. Subsequent to MTC deposition, loading creates increasedsubsidence and associated compaction in the depocenter and uplift at basin margins. Uplift at basin margins creates differential com-paction above salt, accounting for stratigraphic thinning. (C) Hemipelagites and muddy turbidites drape the underlying topography,muting preexisting substrate (i.e., MTC). (D) Generation of a second intrabasinal MTC caused by basin margin oversteepeningand subsequent failure. (E) Magnification of the box at the left of panel D, showing resultant stratigraphy of the trailing edge of theMTC. (F) Magnification of the box at the right side of panel D, showing resultant stratigraphy of the leading edge of the MTC. Note thetruncation at the base of the MTC and onlap onto the top of the deposit.
Madof et al. 555
Eustasy
Sequence stratigraphic models for deep-water de-positional systems use facies assemblages as proxiesfor the interpretation of eustatic cycles and shore-line position (Weimer, 1990; Posamentier andKolla,2003).According to this view, at eustatic high stands,the accumulation of coarse-grained sediments isthought to occur preferentially in shallow-marineenvironments. Deep-water off-shelf settings arerelatively starved and characterized for the mostpart by slowly accumulating hemipelagic sediments.Falling sea level leads to progradation and shoalingand, in slope settings, to the development of over-pressure as pore fluids in low-permeability mudfail to remain in equilibriumwith the decreasing ex-ternally imposed pressure. This leads in turn to up-per slope failure and to the development of MTCs(Weimer, 1990; Posamentier and Kolla, 2003). Ateustatic low stands, shorelines are thought to ex-tend close to the shelf-slope break. Coarse-grainedsediment bypasses the shelf via incised valleys andis delivered to the slope via turbidity currents.Posamentier and Kolla (2003) hypothesized thatfollowing turbidite deposition, rapid rises of sealevel may produce “disequilibrium conditions” onthe upper slope through water and sediment load-ing, leading to a second generation of MTCs. Themechanism by which MTCs are generated duringthis interval remains unclear however. Hemipelagicsedimentation resumes during eustatic high stands.
These ideas lead to testable corollaries. A verticalsuccession through a deep-water sequence shouldinclude the following elements in ascending order:a condensed section, an MTC, a turbidite complex,and in some cases, a second MTC and condensedsection. Sequence boundaries underlying MTCsare interpreted as laterally persistent, well beyondthe dimensions of any particular complex, and oftemporal significance. The pattern repeats becauseeustatic change is the principal modulator of sedi-mentation at continental margins (Posamentier andKolla, 2003). In the absence of sand, deep-water sys-tems may lack turbidites and consist primarily ofdebris flows (Posamentier and Kolla, 2003).
The main difficulty with the eustatic model isthat it fails to account for the volumetric abun-
556 Stratigraphic Controls on a Salt-Withdrawal Intraslope Mini
dance of MTCs in the Fuji basin, for their varieddirections of emplacement, or for their frequency.Since the late Pleistocene (∼450 ka), there havebeen four major eustatic cycles (Figure 15A), witha prominent eccentricity-dominated (100 k.y.)signature (Miller et al., 2005). Assuming that sed-imentwas available throughout each eustatic cycleand that the resultant stratigraphy was preserved,one would expect to see between four and eightMTCs sourced regionally from the upper slopeflowing southward down the regional paleoslope(Figure 16). Yet, 10 MTCs are present in the Fujibasin in the late Pleistocene to Holocene interval,and they were sourced for the most part from theflanks of the basin (Figure 13).
Studies of late Pleistocene deposits southeastof the ancestral Mississippi River, offshore Louisi-ana, lead to similar conclusions. Using log, core,and biostratigraphic data, Scott et al. (1998)found that the timing of erosional surfaces (i.e.,sequence boundaries) is aperiodic and not associ-ated with any single Milankovitch frequency.These authors concluded that a suite of sedimen-tary processes, and not simply continental glacialcycles, is responsible for the stratigraphic evolu-tion of passive continental margins.
Bathymetry
An alternative to the eustaticmodel is the idea thatsedimentation in a minibasin is controlled by itssteady-state longitudinal (dip) bathymetric profile(Winker and Booth, 2000; Mallarino et al., 2006)through a three-part evolution from ponded ba-sin fill to perched slope fill to complete bypass(Beaubouef and Friedmann, 2000). According tothis view, coarse-grained and slumped sedimentinitially becomes ponded below the basin’s spillpoint (Figure 15B, top). Hemipelagic sediment,in contrast, is able to accumulate both above andbelow this depth. Once the minibasin is filled, sed-iment perches from above the spill point to the lo-cal slope profile of the basin (Figure 15B, middle).As the minibasin enters a phase of bypass, pre-existing deposits are eroded basinward of the re-gional (equilibrium) profile and transported down-slope (Figure 15B, bottom).
basin in the Gulf of Mexico

Figure 15. Quaternarysea-level fluctuations andsteady state bathymetricprofile for Fuji basin.(A) Apparent sea levelcurve (eustasy plus wa-ter loading) showingeccentricity-dominatedsignature, 100-k.y. cycles(Miller et al., 2005). Tim-ing uncertainties in sealevel curve are approxi-mately ±5 k.y., whereasamplitude errors rangefrom ±10% (low stands)to +20% (high stands)(K. G. Miller, 2007, per-sonal communication).(B) Evolution of the Fujibasin, showing pondedbasin fill (top) to perchedslope fill (middle) tocomplete bypass (bottom),following Beaubouef andFriedmann (2000). Notethat the Fuji basin profileis taken from present-daybathymetry, whereas thedip of the regional profilewas taken from Pratheret al. (1998). P. lacunosa =Pseudoemiliania lacu-nosa; S. antillea = Stilos-tomella antillea.
M
adof et al. 557
Fundamental assumptions of the bathymetricmodel are that the gradient of intraslope basinsdoes not vary significantly along strike or at anygiven location at time scales of up to 250–750 k.y.(Winker and Booth, 2000), and that depositionoutpaces subsidence. Our work in the Fuji basinsuggests that these assumptions are unrealistic.The depocenter and margins of intraslope basinshave different depositional histories that cannotbe understood using a single (or simple) two-dimensional profile. Depocenters are sites of netdeposition and an archive of basin-margin insta-bility (e.g., intrabasinal MTCs). Basin flanksrange from depositional to erosional, depending onpatterns of salt motion at depth. This sediment-
558 Stratigraphic Controls on a Salt-Withdrawal Intraslope Mini
controlled motion enabled the Fuji basin to sub-side and subsequently pond sediments for the lastapproximately 780 k.y. In each case, the controlson sedimentation are inherently variable with re-spect to time.
Application of the bathymetric model to theFuji basin presents a problem also because it can-not explain the spatial and temporal evolution ofthe basin. Using the bathymetric concept impliesthat the Fuji basin should have low preservationpotential as a result of excessive bypass (Figure 15B,bottom). Yet, the only deposits that have bypassedthe Fuji basin during the last approximately 780 k.y.are those associatedwith the channelized sandy turbi-dite complex, with flow to the south and southeast
Figure 16. Conventional view of sediment transport directions for extrabasinal mass transport complexes (MTCs), intrabasinal MTCs,and channelized sandy turbidites. This model assumes that MTCs both bypass and pond in the Fuji basin, whereas channelized sandyturbidites primarily bypass to the south. Compare with Figure 14, which shows that most MTCs are derived from basin margins as a resultof passive salt motion.
basin in the Gulf of Mexico
(Figures 10a, 16). Other deposits within the basin(i.e., intrabasinal MTCs) were ponded as a resultof high subsidence rates. Therefore, the temporalevolution of the basin must be understood in termsof dynamic loading-driven basin-margin uplift andsubsequent failure and not through the use of asteady-state bathymetric profile.
RESERVOIR ANALOGS, SEALS, ANDDRILLING HAZARDS
The principal reservoir analogs in the late Pleisto-cene of the Fuji basin are the volumetrically minor(5%) channelized sandy turbidites. The remainingfacies (hemipelagites,muddy turbidites, andMTCs)are expected to be of low porosity and permeabilityand to act as seals both below and above reservoirsands at stratigraphic pinch-outs (e.g., the promi-nent channelized sandy turbidite overlying MTCno. 10, left side of Figure 12). To the extent thatstratigraphic architecture is locally controlled, aswe argue is the case in this article, the hydrocarbonprospectivity of salt-controlled minibasins is ex-pected to be highly variable.
OverpressuredMTCs constitute potential dril-ling hazards. Such hazards are hard to avoid whenMTCs account for 45% of the total volume of de-posits. However, risks can be mitigated by drillingthrough the margins of depocenters and preferen-tially through intrabasinal MTCs, which appear tobe more cohesive than deposits characterized bylonger run-out distances (Gee et al., 1999; Pirmezet al., 2004).
CONCLUSIONS
The Fuji basin, an upper Pliocene toHolocene salt-withdrawal intraslope minibasin in north-centralGreenCanyon,Gulf ofMexico, collectedmore than1.8 km (∼5900 ft) of sediment during the last ap-proximately 780 k.y. The basin fill consists of ap-proximately of 45% MTCs, 5% channelized sandyturbidites, and 50% hemipelagites and muddy tur-bidites. TheMTCs are interpreted to be halokinet-ically triggered, flowing radially toward the depo-
center, either from the basin flanks (i.e., intrabasinal)or as a result of larger-scale salt motion (i.e., extra-basinal). Sandy turbidites are channelized at a con-siderable range of scales. An amalgamated set ofthree sandy turbidite channel complexes locatedtoward the bottom of the volume represents themajor sand delivery to the basin. Hemipelagitesand muddy turbidites are of relatively uniformthickness at basin scale and constitute the most ho-mogeneous seismic facies in the Fuji basin.
Passive salt motion, as opposed to eustasy andsteady-state bathymetry, is inferred to be the pri-mary control on the stratigraphic architecture inthe Fuji basin. Eustatic models fail primarily whenconsidering the number of MTCs deposited sincethe late Pleistocene and the directions of emplace-ment of these deposits. Bathymetric models fallshort because they use static two-dimensional lon-gitudinal (dip) profiles to understand the dynamicand 3-D evolution of minibasins.
REFERENCES CITED
Acosta, Z., 1994, Sequence stratigraphy of the Plio-Pleistocenesediments in north central Green Canyon and westernEwing Bank, northern Gulf of Mexico: Masters thesis,University of Colorado, Boulder, Colorado, 187 p.
Beaubouef, R. T., and S. J. Friedmann, 2000, High resolutionseismic/sequence stratigraphic framework for the evolu-tion of Pleistocene intra slope basins, western Gulf ofMexico: Depositional models and reservoir analogs, inP. Weimer, R. M. Slatt, J. Coleman, N. C. Rosen, H.Nelson, A. H. Bouma, M. J. Styzen, and D. T. Lawrence,eds., Deep-water reservoirs of the world: Proceedings ofthe 20th Annual Research Conference, Gulf Coast Sec-tion Society for Sedimentary Geology Foundation,p. 40–60.
Beu, A. G., and A. R. Edwards, 1984, New Zealand Pleisto-cene and late Pliocene glacio-eustatic cycles: Palaeo-geography, Palaeoclimatology, Palaeoecology, v. 46,p. 119–142, doi:10.1016/0031-0182(84)90030-0.
Bevc, D., M. M. Fliedner, A. M. Popovici, and B. Biondi,2003,Optimal velocitymodels for wavefield continuationmigration: European Association of Geoscientists and En-gineers/Society of Exploration Geophysicists ResearchWorkshop, Trieste, Italy, August 31–September 4, 2003,p. 1–4.
Bird, D. E., K. Burke, S. A. Hall, and J. F. Casey, 2005, Gulfof Mexico tectonic history: Hotspot tracks, crustalboundaries, and early salt distribution: AAPG Bulletin,v. 89, p. 311–328, doi:10.1306/10280404026.
Black, T. M., 1992, Chronology of the middle Pleistocene
Madof et al. 559
Kidnappers Group, New Zealand and correlation toglobal oxygen isotope stratigraphy: Earth and PlanetaryScience Letters, v. 109, p. 573–584, doi:10.1016/0012-821X(92)90115-C.
Breard, S. Q., A. D. Callender, R. A. Denne, and M. J. Nault,2000, Gulf of Mexico Basin late Tertiary deep-waterbiostratigraphic zonation: Relationship to standard shelfforaminiferal and calcareous nannofossil marker termi-nology, in P. Weimer, R. M. Slatt, J. Coleman, N. C.Rosen, H. Nelson, A. H. Bouma, M. J. Styzen, and D. T.Lawrence, eds., Deep-water reservoirs of the world: Pro-ceedings of the 20th Annual Research Conference, GulfCoast Section Society for Sedimentary Geology Founda-tion, p. 116–126.
Buffler, R. T., and D. S. Sawyer, 1985, Distribution of crustand early history,Gulf ofMexico: GulfCoastAssociationof Geological Societies Transactions, v. 35, p. 333–344.
Bünz, S., J. Mienert, P. Bryn, and K. Berg, 2005, Fluid flow im-pact on slope failure from 3D seismic data: A case study inthe Storegga Slide: Basin Research, v. 17, p. 109–122,doi:10.1111/j.1365-2117.2005.00256.x.
Carbotte, S. M., et al., 2004,New integrated datamanagementsystem for Ridge2000 and MARGINS research: EOS,v. 85, no. 51, p. 553, 559, doi:10.1029/2004EO510002.
Caulet, J. P., 1986, A refined radiolarian biostratigraphy forthe Pleistocene of the temperate Indian Ocean: MarineMicropaleontology, v. 11, p. 217–229, doi:10.1016/0377-8398(86)90016-2.
Deptuck, M. E., G. S. Steffens, M. Barton, and C. Pirmez,2003, Architecture and evolution of upper fan channel-belts on the Niger Delta slope and in the Arabian Sea:Marine and Petroleum Geology, v. 20, p. 649–676,doi:10.1016/j.marpetgeo.2003.01.004.
Deptuck, M. E., Z. Sylvester, C. Pirmez, and C. O’Byrne,2007, Migration-aggradation history and 3-D seismicgeomorphology of submarine channels in the PleistoceneBenin-major Canyon, western Niger Delta slope: Marineand Petroleum Geology, v. 24, p. 406–433, doi:10.1016/j.marpetgeo.2007.01.005.
Diegel, F. A., J. F. Karlo, D. C. Schuster, R. C. Shoup, andP. R. Tauvers, 1995, Cenozoic structural evolution andtectono-stratigraphic framework of the northern GulfCoast continental margin, in M. P. A. Jackson, D. G.Roberts, and S. Snelson, eds., Salt tectonics: A global per-spective: AAPG Memoir 65, p. 109–151.
Expedition 308 Scientists, 2005, Overpressure and fluid flowprocesses in the deep water Gulf of Mexico: Slope sta-bility, seeps, and shallow-water flow: Integrated OceanDrilling Program Preliminary Report 308, doi: 10:2204/iodp.pr.308.2005.
Feng, J., R. T. Buffler, and M. A. Kominz, 1994, Laramideorogenic influence on late Mesozoic–Cenozoic subsi-dence history, western deep Gulf of Mexico basin: Ge-ology, v. 22, p. 359–362, doi:10.1130/0091-7613(1994)022<0359:LOIOLM>2.3.CO;2.
Flores, J. A., and M. Marino, 2002, Pleistocene calcareousnannofossil stratigraphy for the ODP leg 177 (Atlan-tic sector of the Southern Ocean): Marine Micropaleon-tology, v. 45, p. 191–224, doi:10.1016/S0377-8398(02)00030-0.
560 Stratigraphic Controls on a Salt-Withdrawal Intraslope Mini
Gard, G., 1988, Late Quaternary calcareous nannofossil bio-zonation, chronology, and paleo-oceanography in areasnorth of the Faeroe-Iceland Ridge: Quaternary Science Re-views, v. 7, p. 65–78, doi:10.1016/0277-3791(88)90094-7.
Gavriloff, I. J. C., 2006, The mid-Pleistocene “Stilostomellaextinction event” in the southeast Pacific Ocean: A review:Anuário do Instituto de Geociências, v. 29, p. 490.
Gee, M. J. R., D. G. Masson, A. B. Watts, and P. A. Allen,1999, The Saharan debris flow: An insight into the me-chanics of long runout submarine debris flows: Sedi-mentology, v. 46, p. 317–335, doi:10.1046/j.1365-3091.1999.00215.x.
Gee, M. J. R., R. L. Gawthorpe, and J. S. Friedmann, 2005,Giant striations at the base of a submarine landslide: Ma-rine Geology, v. 214, p. 287–294, doi:10.1016/j.margeo.2004.09.003.
Giles, K. A., and T. F. Lawton, 2002, Halokinetic sequencestratigraphy adjacent to the El Papalote diapir, north-eastern Mexico: AAPG Bulletin, v. 86, p. 823–840.
Govindan, A., 2004, Miocene deep water agglutinated fora-minifera from offshore Krishna-Godavari Basin, India:Micropaleontology, v. 50, p. 213–252.
Haflidason, H., H. P. Sejrup, A. Nygård, J. Mienert, P. Bryn,R. Lien, C. F. Forsberg, K. Berg, and D. Masson, 2004,The Storegga Slide: Architecture, geometry and slide de-velopment: Marine Geology, v. 213, p. 201–234,doi:10.1016/j.margeo.2004.10.007.
Hayward, B. W., 2002, Late Pliocene to middle Pleistoceneextinctions of deep-sea benthic foraminifera (“Stilosto-mella extinction”) in the southwest Pacific: Journal ofForaminiferal Research, v. 32, p. 274–307, doi:10.2113/32.3.274.
Jones, T. A., 2006, MATLAB functions to analyze directional(azimuthal) data: I. Single-sample inference: Computersand Geosciences, v. 32, p. 166–175, doi:10.1016/j.cageo.2005.06.009.
Mallarino, G., R. T. Beaubouef, A. W. Droxler, V. Abreu,and L. Labeyrie, 2006, Sea level influence on the natureand timing of a minibasin sedimentary fill (northwesternslope of the Gulf of Mexico): AAPG Bulletin, v. 90,p. 1089–1119, doi:10.1306/02210605058.
Marine Geoscience Data System, 2008, Explore our planetwith GeoMapApp: Lamont-Doherty Earth Observatory,Columbia University, New York: http://www.geomapapp.org/index.htm (accessed December 4, 2007).
Martinez, J. F., J. A. Cartwright, and B. Hall, 2005, 3D seis-mic interpretation of slump complexes, examples fromthe continental margin of Israel: Basin Research, v. 17,p. 83–108, doi:10.1111/j.1365-2117.2005.00255.x.
McBride, B. C., 1997, The geometry and evolution of al-lochthonous salt and its impact on petroleum systems,northern Gulf of Mexico basin, studies in three- andfour-dimensional analysis: Ph.D. dissertation, Universityof Colorado, Boulder, Colorado, 275 p.
McDonnell, A., R. G. Loucks, andW. E. Galloway, 2008, Pa-leocene to Eocene deep-water slope canyons, westernGulf of Mexico: Further insights for the provenance ofdeep-water offshore Wilcox Group plays: AAPG Bulletin,v. 92, p. 1169–1189, doi:10.1306/05150808014.
McHugh, C. M. G., J. E. Damuth, and G. S. Mountain, 2002,
basin in the Gulf of Mexico
Cenozoic mass-transport facies and their correlationwith relative sea-level change, New Jersey continentalmargin: Marine Geology, v. 184, p. 295–334,doi:10.1016/S0025-3227(01)00240-7.
Miller, K. G., M. A. Kominz, J. V. Browning, J. D. Wright,G. S. Mountain, M. E. Katz, P. J. Sugarman, B. S. Cramer,N. Christie-Blick, and S. F. Pekar, 2005, The Phanero-zoic record of global sea-level change: Science, v. 301,p. 1293–1298, doi:10.1126/science.1116412.
Moscardelli, L., L.Wood, and P. Mann, 2006, Mass-transportcomplexes and associated processes in the offshore area ofTrinidad and Venezuela: AAPG Bulletin, v. 90, p. 1059–1088, doi:10.1306/02210605052.
Nissen, S. E., N. L. Haskell, C. T. Steiner, and K. L. Cortelli,1999, Debris flow outrunner blocks, glide tracks, andpressure ridges identified on the Nigerian continentalslope using 3-D seismic coherency: The Leading Edge,v. 18, no. 5, p. 595–599, doi:10.1190/1.1438343.
Olson, H. C., and C. W. Smart, 2004, Pleistocene climatichistory reflected in planktonic Foraminifera from ODPsite 1073 (leg 174A), New Jersey margin, NW AtlanticOcean: Marine Micropaleontology, v. 51, p. 213–238,doi:10.1016/j.marmicro.2003.11.002.
Peakall, J., W. D. McCaffrey, and B. C. Kneller, 2000a, Aprocess model for the evolution, morphology and archi-tecture of sinuous submarine channels: Journal of Sedi-mentary Research, v. 70, p. 434–448, doi:10.1306/2DC4091C-0E47-11D7-8643000102C1865D.
Peakall, J., W. D. McCaffrey, B. C. Kneller, C. E. Stelting,T. R. McHargue, and W. J. Schweller, 2000b, A processmodel for the evolution of submarine fan channels: Im-plications for sedimentary architecture, in A. H. Boumaand C. G. Stone, eds., Fine-grained turbidite systems:AAPG Memoir 72, p. 73–87.
Pirmez, C., J. Marr, C. Shipp, and F. Kopp, 2004, Observationsand numerical modeling of debris flows in the Na Kika Ba-sin, Gulf of Mexico: Annual Offshore Technology Confer-ence, Houston, Texas, Offshore Geology Foundation(OTC) Paper 16749, p. 1–13.
Posamentier, H. W., and V. Kolla, 2003, Seismic geomor-phology and stratigraphy of depositional elements indeep-water settings: Journal of Sedimentary Research,v. 73, p. 367–388, doi:10.1306/111302730367.
Prather, B. E., J. R. Booth,G. S. Steffens, and P.A. Craig, 1998,Classification, lithologic calibration, and stratigraphicsuccession of seismic facies of intraslope basins, deep-water Gulf of Mexico: AAPG Bulletin, v. 82, p. 701–728.
Salvador, A., 1987, Late Triassic–Jurassic paleogeographyand origin of Gulf of Mexico Basin: AAPG Bulletin,v. 71, p. 419–451.
Salvador, A., ed., 1991, The Gulf of Mexico Basin: Boulder,Colorado, Geological Society of America, The Geologyof North America, v. J, 568 p.
Scott, R. W., J. M. Combes, and S. E. Nissen, 1998, High-precision chronostratigraphy of a late Pleistocene shelf-edge delta, Louisiana: Journal of Sedimentary Research,v. 68, p. 596–602.
Soto, G., 1997, 3-D seismic stratigraphic interpretation ofPleistocene sediments, Fuji minibasin, central GreenCanyon, northern deep Gulf of Mexico: Masters thesis,University of Colorado, Boulder, Colorado, 176 p.
Thierstein, H. R., K. Geitzenauer, B. Molfino, and N. J.Shackleton, 1977, Global synchroneity of late Quater-nary coccolith datum levels: Validation by oxygen iso-topes: Geology, v. 5, p. 400–404, doi:10.1130/0091-7613(1977)5<400:GSOLQC>2.0.CO;2.
Tripsanas, E. K., W. R. Bryant, and B. A. Phaneuf, 2004,Slope-instability processes caused by salt movementsin a complex deep-water environment, Bryant Canyonarea, northwest Gulf of Mexico: AAPG Bulletin, v. 88,p. 801–823, doi:10.1306/01260403106.
Wei, K. Y., T. Q. Lee, and the shipboard scientific party ofIMAGES III/MD106-IPHIS cruise (leg II), 1998, Nan-nofossil biochronology of tephra layers in coreMD972143, Benham Rise, western Philippine Sea: Ter-restrial, Atmospheric and Oceanic Sciences, v. 9,p. 153–163.
Weimer, P., 1990, Sequence stratigraphy, facies geometries,and depositional history of the Mississippi Fan, Gulf ofMexico: AAPG Bulletin, v. 74, p. 425–453.
Winker, C. D., and J. R. Booth, 2000, Sedimentary dynamicsof the salt-dominated continental slope, Gulf of Mexico:Integration of observations from the sea floor, near-surface, and deep subsurface, in P. Weimer, R. M. Slatt,J. Coleman, N. C. Rosen, H. Nelson, A. H. Bouma, M. J.Styzen, and D. T. Lawrence, eds., Deep-water reservoirsof the world: Proceedings of the 20th Annual ResearchConference, Gulf Coast Section Society for SedimentaryGeology Foundation, p. 1059–1086.
Winn Jr., R. D., H. H. Roberts, B. Kohl, R. H. Fillon, J. A.Crux, A. H. Bouma, and H. W. Spero, 1998, UpperQuaternary strata of the upper continental slope, north-east Gulf of Mexico, sequence stratigraphic model for aterrigenous shelf edge: Journal of Sedimentary Research,v. 68, p. 579–595.
Witrock, R. B., A. R. Friedmann, J. J. Galluzzo, L. D. Nixon,P. J. Post, and K. M. Ross, 2003, Biostratigraphic chart ofthe Gulf of Mexico offshore region, Jurassic to Quater-nary: New Orleans, U.S. Department of the Interior,Minerals Management Service, 1 sheet.
Madof et al. 561