Embed Size (px)
Citation preview
Strathprints Institutional Repository
Selamat, M.S. and Watson, L.M. and Baker, T.N. (2006) XRD and XPS studies of surface MMClayers developed by laser alloying Ti6Al4V using a combination of a dilute nitrogen environment andSiC powder. Surface and Coatings Technology, 201 (3-4). pp. 724-736. ISSN 0257-8972
Strathprints is designed to allow users to access the research output of the University of Strathclyde.Copyright c© and Moral Rights for the papers on this site are retained by the individual authorsand/or other copyright owners. You may not engage in further distribution of the material for anyprofitmaking activities or any commercial gain. You may freely distribute both the url (http://strathprints.strath.ac.uk/) and the content of this paper for research or study, educational, ornot-for-profit purposes without prior permission or charge.
Any correspondence concerning this service should be sent to Strathprints administrator:mailto:[email protected]
http://strathprints.strath.ac.uk/
Selamat, M.S. and Watson, L.M. and Baker, T.N.* (2006) XRD and XPS studies of surface MMC layers developed by laser alloying Ti6Al4V using a combination of a dilute nitrogen environment and SiC powder. Surface and Coatings Technology, 201 (3-4). pp. 724-736. ISSN 1359-6454 http://eprints.cdlr.strath.ac.uk/5782/ This is an author-produced version of a paper published in Surface and Coatings Technology, 201 (3-4). pp. 724-736. ISSN 1359-6454. This version has been peer-reviewed, but does not include the final publisher proof corrections, published layout, or pagination. Strathprints is designed to allow users to access the research output of the University of Strathclyde. Copyright © and Moral Rights for the papers on this site are retained by the individual authors and/or other copyright owners. You may not engage in further distribution of the material for any profitmaking activities or any commercial gain. You may freely distribute both the url (http://eprints.cdlr.strath.ac.uk) and the content of this paper for research or study, educational, or not-for-profit purposes without prior permission or charge. You may freely distribute the url (http://eprints.cdlr.strath.ac.uk) of the Strathprints website. Any correspondence concerning this service should be sent to The Strathprints Administrator: [email protected]
XRD AND XPS STUDIES OF SURFACE MMC LAYERS DEVELOPED BY LASER
ALLOYING Ti-6Al-4V USING A COMBINATION OF A DILUTE NITROGEN
ENVIRONMENT AND SiC POWDER
M. S. Selamat1, L. M. Watson2 and T. N. Baker2
1 Advanced Materials Research Centre (AMREC), SIRIM Berhad
1 Persiaran Dato Menteri, P. O. Box 7035, Section 2
40911 Shah Alam, Malay
2 Metallurgy and Engineering Materials Group, Department of Mechanical
Engineering
University of Strathclyde, Glasgow G1 1XN, U.K.
Corresponding author: Professor T.N.Baker, Metallurgy and Engineering Materials Group,
Department of Mechanical Engineering, University of Strathclyde, Glasgow G1 1XN, U.K.
Phone:01415483101, Fax: 01415525105, e-mail; [email protected]
16 December 2005
ABSTRACT
Using a continuous-wave CO2 laser, surface engineering of a Ti-6Al-4V alloy through a
combined treatment of laser nitriding and SiC preplacement was undertaken. Under spinning
laser beam conditions, a surface alloyed / metal matrix composite (MMC) layer over 300μm
in depth and 24mm wide was produced in the alloy by the overlapping of 12 tracks.
Microstructural and chemical changes were studied as a function of (a) depth in the laser
formed composite layer and (b) of the track position. Using X- ray diffraction (XRD) and X-
ray photospectrographic (XPS) techniques, it was shown that the composite layer contained a
complex microstructure which changed with depth. At the surface, a non-stoichiometric,
cubic TiNx solid solution ( possibly a carbonitride) containing C and Si , where x ≈ 0.65-0.8,
was prominent, but was replaced by α′-Ti with increasing depth to 300μm. TiC phase was
also identified, and the presence of TiN0.3 and Ti5Si3 phases considered a distinct possibility.
1
Keywords Laser surface engineering, Titanium alloy, X-ray diffraction, Photoelectron
spectroscopy,
Lattice parameters.
1 INTRODUCTION
Laser surface nitriding is a technique for modifying the near-surface region of alloys without
altering the bulk characteristics. This technique has been developed over the past 20 years and
involves the use of the intense optical energy of the laser to melt the surface in a nitrogen-
containing atmosphere [1-10]. While hardness values in excess of 2000VHN with melt depths
around 1mm have been reported, the nitrided surface invariably contained cracks.
The development of crack-free TiN surfaces was achieved by diluting the nitrogen content for
laser treated commercially pure titanium (CPTi), as reported by Mridha and Baker [5],and for
Ti-6Al-4V by Selamat et al [10].However, this proved to be at the expense of both a lower
hardness and a shallower melt depth.
An alternative means of developing a deep hard surface layer is to produce a surface MMC
[11-15]. The early work in this area reported the injection of 30-50 vol.-% of ~100μm size
particles of TiC into the laser melted surface of titanium alloys [11, 12]. This gave a hardness
value, measured between the embedded particles, of 450VHN.Abboud and West [13] injected
150μm particles of SiC powder into a commercially pure titanium surface. They observed
partial dissolution of the particles, which led to the enrichment of the matrix with silicon and
carbon during solidification. Both TiC and Ti5Si3 phases were formed, and the hardness
increased from 210 to 600VHN.A further development was made with the aim of completely
dissolving the preplaced particles 3 to 7μm in size, a size chosen to facilitate dissolution, [14-
15]. The resulting surfaces showed a hardness for the first 100μm below the surface, of 1000-
1400VHN, followed by a plateau of hardness in the range 450-550VHN, extending to a depth
of about 500μm. The large change in hardness was associated with the formation of TiC
2
during the laser melting, which was undertaken in a protective atmosphere of argon or
helium. Another advantage of alloying with SiC, is that Si in solid solution extends the liquid
phase to lower temperatures, reducing the possibility of cracking. A logical extension of
these two approaches was to combine them to explore the possibility of gaining the advantage
of both nitriding in a dilute environment and fine particle formation via alloying with carbide
or nitride particles. Using this technique it was hoped to increase the melt depth and the
hardness, while avoiding cracking. This approach was initially undertaken using a
commercially pure titanium alloy with 6μm preplaced SiC powder [16]. The results were very
promising and did achieve the objectives given above. Several compounds, including ZrC
and ZrN and a mixture of SiC and Ti-6Al-4V powders were considered as possible
improvements on SiC. The laser nitriding was carried out on a Ti-6Al-4V alloy base, again
with a single melt track.[17].Due to the limitations on the availability of the particle sizes of
the Zr compounds, the preplaced particles were of an average size of ~45μm. The new
surfaces were subjected to room temperature abrasive wear testing to rank the resistance of
the surfaces to this kind of wear. The SiC treated surfaces showed by far the best abrasive
wear resistance.
While much of the laser surface engineering discussed in the literature refers to either spot or
single track melting, there are many occasions when the laser processing of a surface requires
an area to be treated and therefore many overlapping melt tracks to be made. This has been
explored, both from the effect of preheat built up by the earlier laser passes, [18, 19] and the
effect on the microstructure [10].
In the present work, Ti-6Al-4V plate was laser processed using a combination of SiC powder
preplacement and nitriding in a dilute environment. A detailed phase characterisation was
undertaken mainly by X-ray diffractometry (XRD) and X-ray photo electron spectroscopy
(XPS) techniques, with the prime objective of identifying the phases present. This was a
similar approach to that used in previous work in this field,
3
[10, 20, 21].A second aim was to provide a better understanding of the influence of the laser
process on the microstructure. It is important to know how the microstructural features vary
as a function of depth. For example, many studies correlating microstructure with wear
resistance, determine only the details of microstructure close to the surface, and forget that
this will be worn away and a new surface, with possibly a different microstructure, will be
responsible for the wear resistance at a depth below the surface.
2 MATERIALS AND EXPERIMENTAL METHODS
A combination of laser surface nitriding and alloying with SiC preplacement on Ti-6Al-4V
alloy using a 40% nitrogen and 60% argon environment has been carried out using a
continuous-wave CO2 laser. A spinning beam mode was used to produce a ~ 2mm wide melt
track using a velocity of spinning of 1500 r.p.m. The laser power was set at 2.8 kW and the
specimen velocity at 10 mm/s. A total of 12 laser tracks with 50% overlaps was produced
on the surface of the 10 mm thick base alloy.
After the laser surface processing, the specimen was cut transversely to the direction of the
laser track. The track cross-sections were prepared by mounting the specimens in the bakelite
and grinding and polishing by standard metallographic techniques. The polished specimens
were chemically etched in a solution of 2gm NH4.H.HF, 50 ml methanol, and 100 ml H2O for
a period of 1 minute. After etching, the specimens were cleaned by water and methanol, then
dried by blasted air. A Nikon Epiphot projection optical microscope and a JEOL JSM 840A
scanning electron microscope (SEM) were used for detailed metallographic studies.
XRD patterns were taken using a conventional diffractometer utilizing CuKα radiation and
operated at 40kV and 20mA. A 2θ scan range from 30° to 80°, in steps of 0.1°/20 secs, was
recorded. After performing the XRD experiments on the top surface, the specimens were
ground to depths of ~100μm followed by 300μm, using SiC papers. The different depths
corresponded to different layers observed by optical microscopy, and the experiments
described above were repeated for each layer. To identify the possible XRD and XPS peaks
after laser processing, an untreated specimen, and standard specimens of powders of (a)
4
commercial high purity titanium nitride, (b) titanium carbide, (c) silicon carbide and (d)
titanium silicide, were examined [22].The error in lattice parameter measurements was
estimated to be ± 0.001Å.
Surface analytical spectra were acquired with a Vacuum Generators Scientific Ltd., Model:
ESCALAB MK11 x-ray photoelectron spectroscopy unit. The pressure was typically 9 x 10⁻⁹
torr in the analysing chamber. For the excitation of XPS spectra, MgKα(1253.6 eV) radiation
was employed throughout, with the anode operating at an output power of 20mA and 11kV.
Photoelectrons were collected at approximately 45° from the specimen surface normal. In this
study, the specimens were cleaned in-situ by Ar ion bombardment to remove the natural
protective titanium dioxide coating or any surface contamination. The residual carbon
contamination line at 284.5eV was used as a datum for the binding energy.
3 EXPERIMENTAL RESULTS
3.1 Microstructure
The external appearance of the Ti-6Al-4V alloy surface after processing using a
combination of laser surface nitriding and SiC preplacement, is shown in Fig. 1a. A pale gold
colour was observed on the surface indicative of nitriding.
The spinning laser beam resulted in a wider melt zone than that produced under the
corresponding laser processing conditions using a stationary beam. However, a consequence
of the spinning, which may give a similar result to an oscillating beam, is that the energy
density is considerably lower than that obtained from a stationary beam using the same laser
conditions. This reduction, coupled with the 50% overlapping, had a significant influence on
the microstructures formed in the melt zone during the laser alloying processing. The
microstructure of a vertical cross-section shows the melt zone, the heat affected zone (HAZ)
and a very flat surface crossing an overlapping area, Fig.1b. A crack at the eighth track was
observed. From the vertical cross-section, the crack was found to be elongated along the
width of the track, and to penetrate from the surface down to the melt zone, just stopping
5
before the heat affected zone. Also a number of pores were found. These can be seen in Fig
1b at T2 , (~ 30μm in size) ,T3 , (~130μm in size) and T5 ,(~50μm in size), with a large
defect ,~300μm in size in T2.
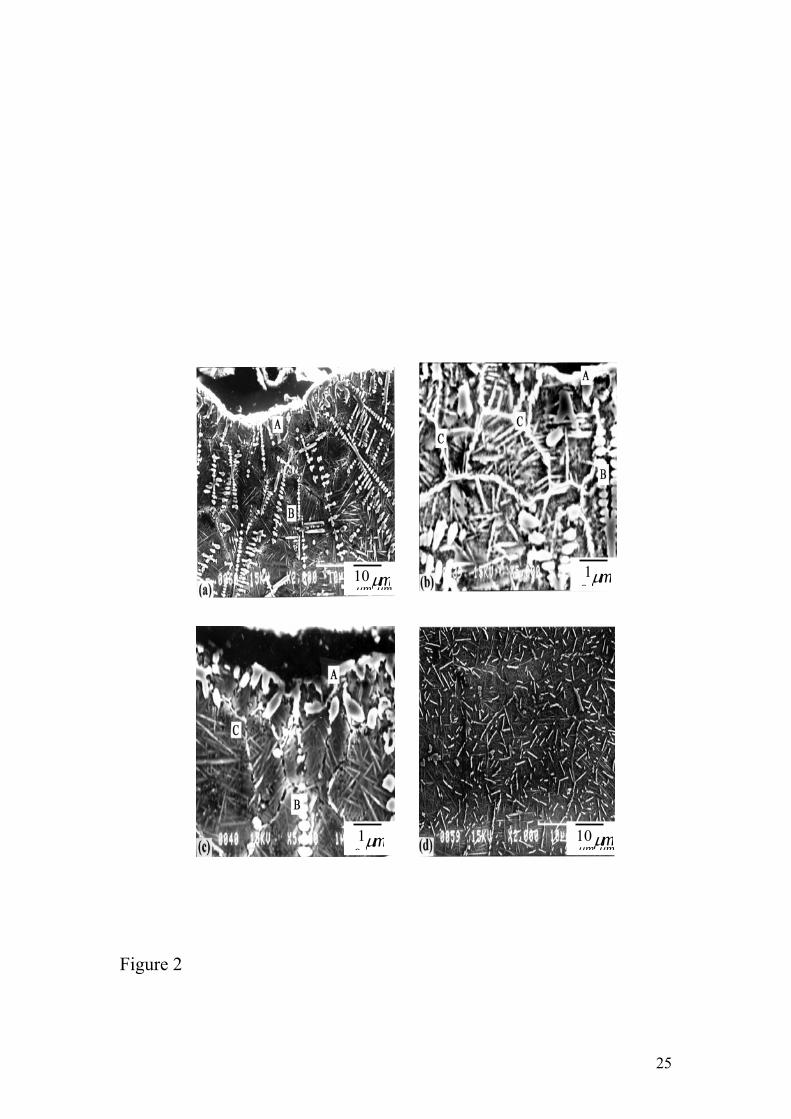
The SEM micrographs show the details of microstructures of the specimen at higher
magnification, Fig.2. The top region of the melt pool is shown in Figs. 2a-c. After
solidification, the microstructure in this region at track 2, seen in Fig.2a, contains a very thin
continuous layer on the surface (A) and small dendrites growing from the surface layer in
a direction nearly perpendicular to the surface, (B).
A micrograph from the surface of tracks 6 / 7, Fig. 2b, shows that the very thin continuous
surface layer, (A), is still present, and below the surface, a network, (C),consisting of small
particles and outlines grains of a size <10 microns. Again, the dendrites, (B), can be seen on
the right of the figure. Moving to track 7, Fig. 2c, the surface layer (A) is now discontinuous,
and at the lower magnification, the extent of the dendrites, (B), is clear. As in Fig.2b, particles
(C) can be seen to have formed at the grain boundaries. Fig.2d shows the microstructure,
>300 micron from the surface, the precise depth depending on the location with respect to the
beam centre. Here there are no significant dendrites or network compounds, but mainly small
needles. The phases formed in the melt zone are related to the laser processing conditions
such as laser power, traverse velocity and beam radius. They also varied with depth in the
melt zone during laser processing. XRD was used to characterize the phases formed at
different depths for two different sets of tracks, which are tracks 1 to 3, and tracks 6 to 8. It
was necessary to sample more than one track, because of overlapping and the extent of the x-
ray beam diameter.
In a previous study of nitrided-only specimens, [10, 20, 22], three phases, TiN, α′-Ti and
possibly TiN0.3 were formed at the surface. The results revealed that the quantity of TiN
precipitates decreased with the depth of melt pool. A similar trend was also expected in the
present specimens. The melt zone developed by laser alloying with SiC preplaced specimens
contained TiC particles (spherical), Ti5Si3 networks and α′-Ti phases, in agreement with
6
earlier work, [24]. The depth of the regions and the densities of these phases in the region
depend on the amount of SiC particles alloyed in the specific location, the laser processing
conditions and the beam modes used in the processing.
In the present study, the XRD spectra from three positions, the top surface, at a depth of
100 μm and of 300 μm below the surface of tracks 1-3,Fig.3, and tracks 6-8, Fig.4,show very
complicated results. The dots ●, ▲, x, ■, ♦ in the XRD spectra show the anticipated positions
of the peaks for α′-Ti, TiC, Ti5Si3, TiN and TiN0.3. The x-ray spectra in Fig.3a and Fig.4a
show that the phases, TiN, TiC, α′-Ti and possibly Ti5Si3 and TiN0.3, were formed on the
top surface. At a depths of 100 μm below the surface, Fig.3b and Fig 4b, the microstructure
consisted mainly of α′-Ti, some TiN, a little TiC, and possibly also Ti5Si3 and TiN0.3, while
at a depth of 300 μm, Fig.3c and Fig.4c, the microstructure contains mainly α′-Ti, a little
TiC, and possibly Ti5Si3 and TiN0.3. The spectra in Fig.3 show that the strong intensity of
the TiN peaks present at the top surface was decreased significantly at both 100μm, and 300
μm below the surface. This indicates that the TiN phase was present in the melt zone, but for
both sets of tracks 1-3 and tracks 6-8, Fig.4, the concentration decreased with depth, an
observation which is consistent with those made for the nitrided-only specimens [10, 20].
3.2 Lattice parameter changes
The lattice parameter changes in the TiN and α′-Ti phases were considered by
observing the peak shift for both sets of tracks at the three different melt depths. Other
phases, such as TiC, Ti5Si3 and TiN0.3 were not analysed due to the closeness of each peak
to one or two peaks of a different phase. The changes in lattice parameters are considered to
result from the combined effect of the residual stress due to the rapid solidification in the laser
processing, and to variations in composition of the phases.
By using the XRD data obtained from the laser processed specimens, the lattice
parameter, a, of the TiN phase as a function of depth after laser surface nitriding and SiC
preplaced alloying under 40% nitrogen environment, was calculated, and the results are
7
shown in Fig.5. The lattice parameter, a, of the TiN phase, Fig.5a, for the set of tracks 1-3
increases from 4.241 Å on the top surface to 4.250 Å at the 100 μm depth and reverts to the
surface value at 300μm. However, for the set of tracks 6-8, a of the TiN phase drops from
4.235 Å at the surface to 4.232 Å at 100μm and rises to 4.4250 Å at 300μm.
The lattice parameters, a and c, of the α′-Ti for both sets of tracks, 1-3 and 6-8 are given in
Figs.5b and c. For tracks 1-3, the lattice parameter a of α′-Ti increases from 2.906 Å at the
top surface to 2.915 Å at the 100 μm depth and then 2.916 Å at the 300 μm depth. However,
the lattice parameter, c, of the α′-Ti, increases from 4.612 Å at the top surface to 4.662 Å at
both the 100 μm and 300 μm depths. For the tracks 6-8, a has similar values to those of
tracks 1-3, but then increases to 2.924 Å at 300 μm depth. On the other hand, the lattice
parameter c is constant at 4.662 Å with depth for tracks 6-8. The increase of a of α′-Ti with
depth in the top surface resulted from the combined effect of the formation of TiN, TiC, the
influence of Si and N in solid solution, and also the possibility of an effect of the residual
stress exists. Zergioti et al [25] have also reported the shifting of XRD peaks due to the
presence of the residual stress, in their work on TiB and TiC thin layers produced by pulsed
laser deposition.
3.3 Surface analysis by x-ray photoelectron spectroscopy
A wide range scan of 0-500eV, as shown in the example in Fig.6a, was used for all the initial
surveys of the samples to identify the elements present. Detailed scans, as in Figs. 6b to e,
were then performed over the binding energy ranges of interest. For high intensity peaks, the
accuracy of locating relative peak positions is ± 0.1eV.For low intensity peaks, the peak
positions are not so well defined and the accuracy can decrease to ±0.5eV. The specimens
were cleaned with methanol before inserting into the spectrometer. The XPS spectrum before
argon ion sputtering (cleaning), was dominated by surface oxygen and carbon contamination,
which obscured the spectrum from the alloy. The ion sputtering removed the oxide layer, and
the XPS spectrum showed the presence of titanium nitride.
8
The XPS spectra of the Ti2p core levels for the processed alloy at different depths taken again
from tracks 1-3 and 6-8, are shown in Fig. 7. Table 1 and Table 2 give the values of the
binding energy of Ti2p3/2 and N1s peaks, and their binding energy difference at different
depths taken from tracks 1-3 and tracks 6-8, respectively. The peaks of Ti2p3/2 at 454.2 eV,
in Tables 1 and 2, correspond to TiN (454.4 eV [26]). At the depth of 100 μm and 300 μm for
tracks 1-3, and at the depth of 300 μm for tracks 6-8, the Ti2p3/2 peaks approached the base
alloy value at 453.6 eV, which correspond to titanium (453.8 eV [27], 453.6 eV [28]). All
N1s peaks at the top surface and at the 100 and 300 μm depths for both sets of tracks,
correspond to nitrides, which appeared at 396.6 eV [26]. These values confirm the presence of
titanium-nitrogen solid solution.
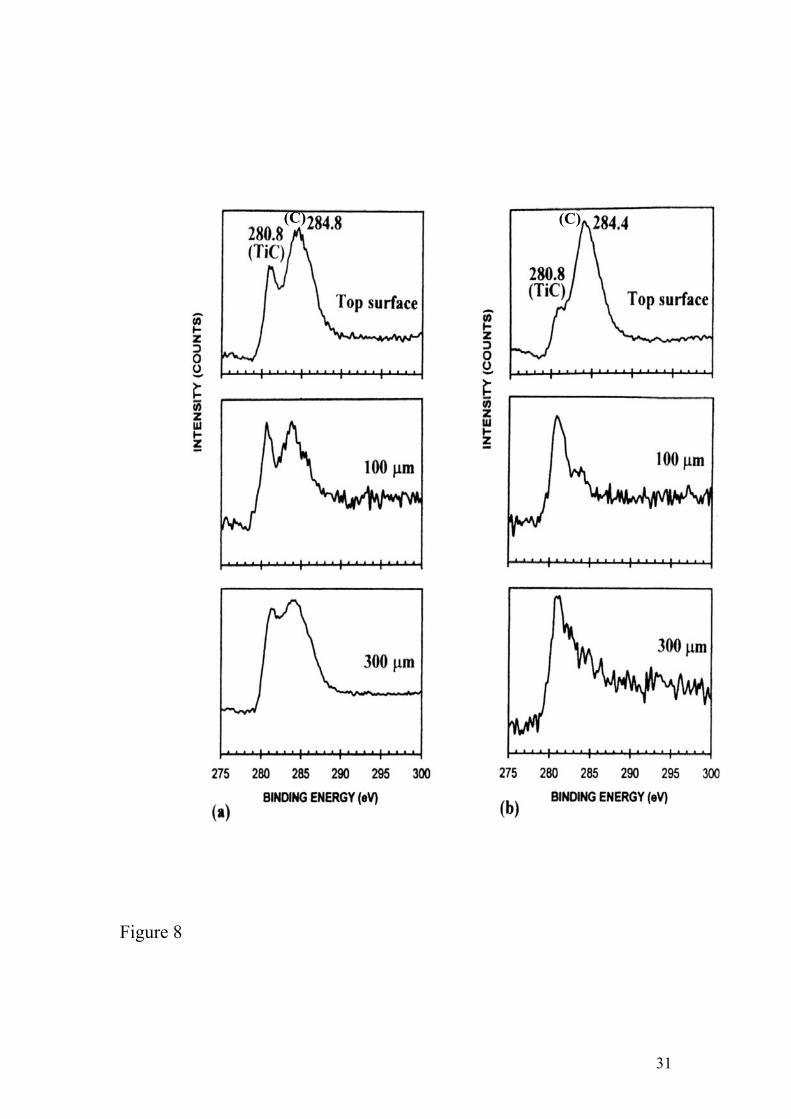
In the C1s spectra, Fig.8, two possible peaks appear. The higher binding energy
corresponds to the chemical bonding between Ti and C (labelled TiC), while the lower one is
due to absorbed (contamination) carbon (labelled C). The binding energy of the chemical
bonding between Ti and C is about 3.0 eV smaller than that arising from the contamination.
As mentioned in the literature, the peaks at 280.8 eV for the top surface of tracks 1-3 and
tracks 6-8 in the present specimen, indicate the presence of TiC (281 eV [27],
281.5 eV [29] , 81.7 eV [30],). The Si2p XPS core level spectra are shown in Fig.9. There is
little evidence for Si on the top surface but a distinct signal appears at 100 μm and at 300 μm
for both tracks 1 – 3 and tracks 6 –8. In a similar study with SiC preplacement only [22], the
Si 2p signal was apparent from the top surface downwards which implies that in the combined
laser treated specimen, the nitriding rejects the Si phase from the surface. The binding energy
of the Si 2p peaks in Fig.9 are at 98.4 eV, while the binding energy from the Ti5Si3 standard
was at 99.2 eV and that from pure Si is at 99.7 eV [29], indicating that the Si containing phase
is not pure Ti5Si3.
4 DISCUSSION
4.1 Microstructure
9
The results from the nitriding-only and the SiC preplaced specimens [10, 20, 22], were
used as a basis for characterising the phases formed after laser processing using the
combination of nitriding and SiC powder preplacment.
Titanium nitride has gold colour, and the track surfaces previously have been observed
to exhibit gold and yellow colours when melted in pure and dilute nitrogen environments
respectively [4,5]. In the present investigation, surface alloying with silicon carbide in the
40% nitrogen environment, produced a pale golden colour on all the overlapped tracks. This
is normally taken as an indication of the formation of a titanium nitride phase in the top
surface of melt zone.
The vertical cross-sections of all tracks produced on the Ti-6Al-4V surface in the 40%
nitrogen environment gave a melt zone almost free from any SiC particles, which had
dissolved after melting. No large SiC particles, picked up from the grinding technique used to
produce a new surface, were observed in this work. However, in Fig 1b a defect some 300μm
in size can be seen at T2, and several pores are present at the melt/ heat affected zone (HAZ)
interface. While ideally, macro-defect free microstructures are desirable, these laser processed
surfaces were developed to give improved wear and erosion resistance [15, 17, 31].The
presence of porosity, probably due to nitrogen gas quenched into the melt pool, at the
interface, had no effect on the surface properties in this work. The crack observed at the
eighth track is a more serious defect. However, in previous work, cracking has been overcome
by changes to the laser processing procedures, which have included preheating the substrate,
and this approach could be used in future work.
The microstructure after solidification in this specimen contained a very thin layer on
the surface and small dendrites growing from the surface layer in a direction nearly
perpendicular to the surface. The layer was continuous on the surface of tracks 2, Fig.2a, and
6/7, Fig.2b, but was discontinuous for track 7, Fig.2c. This shows an obvious difference from
the nitriding only processing where the top TiN compound which always formed a
continuous layer, and the dendrites, which had long arms projecting into the melt below the
surface [18]. Fig.2a shows some isolated particles formed both in the grains of the matrix and
10
at the grain boundaries. A network of a compound was formed in the melt pool, spreading
between the small grains (<10 μm in diameter) of the matrix and appearing with a eutectic
morphology.
Below the top region, particularly at a depth of ≥ 300 μm from the surface, there are no
significant dendrites or network compounds, but mainly small needles. In the nitrided only
specimens, a needle phase has been identified as TiN0.3, which has the same crystal structure
and similar lattice parameters of those of α-Ti. The difference is that in the present
processing, this needle phase formed only in the region far from the surface, whereas the
needles studied previously in the nitriding only process formed throughout the melt zone [20,
21].
4.2 X-ray diffraction
4.2.1 Surface layer
In the above discussion, the existence of a thin layer in the top region, seen in Figs 2a,
2b and 2c, was mentioned. It is clear from the results of the XRD experiments, that the thin
layer on the top surface is a primarily a cubic TiN compound. By comparing EDX spectra
from the thin layer and from the matrix, [18], it is suggested that the surface is no longer a
simple TiN compound, but a TiN solid solution containing carbon and silicon, although the
lattice parameters of the phase are unchanged. The matrix is considered to form from the β →
α′ martensitic transformation, where the α′-Ti has the same structure and lattice parameters
as the α-Ti.
4.2.2 Small dendrites
As the surface XRD spectra show strong TiN and α′-Ti peaks and the quantity of the
small dendrites was fairly high, the small dendrites growing in non-preferential directions in
the top region must be also the TiN solid solution with dissolved carbon and silicon. An
electron back-scattered pattern (EBSP) from this dendrite performed by Hu et al [24] showed
a face centred cubic (fcc) structure. This is consistent with the XRD data which contained the
11
TiN phase with a f.c.c. structure. The thin surface layer and the many small TiN dendrites
disconnected from the surface TiN layer are attributed to the addition of SiC particles on the
surface before the nitriding. First of all, while some nitrogen would be expected to diffuse
between the solid preplaced SiC particles, nitriding would not proceed quickly until the SiC
powder coating dissolved into the melt to allow the nitrogen to react with the liquid surface.
However, the priorities for the formation of TiN particles at the surface will depend on the
opportunities for contact between the liquid and nitrogen. Secondly, even after the SiC
particles dissolved into the melt, the TiN solid solution could not grow directly from the
surface in the form of long arm dendrites because of an insufficient nitrogen concentration
and concentration gradient in the liquid. In addition to this, when the convection flow in the
melt is considered, the discontinuous small TiN dendrites formed in the top region would be
transferred to a deeper location in the melt, to form the morphology shown in Fig.2d.
4.2.3 Isolated particles and network compound
The volume fraction of the isolated particles is obviously too small to be detected by
the XRD technique. Though the quantity of the network compound may be detectable by
XRD when the compound is a eutectic mixture and the major phase in the eutectic is the α′-
Ti, the quantity of the other phase in the eutectic might still be revealed by the XRD
spectrum. Another difficulty in attempting to ascertain the correct peaks for TiC or Ti5Si3 is
the closeness of other strong peaks. Hu et al [24] suggested, following analysis of EDX
spectra, that the isolated particles are a carbon rich phase and the network compound at grain
boundaries is a silicon rich phase. Consideration of the Ti-C and the Ti-Si phase diagrams
suggests that the isolated particles are most probably a TiC phase and the network compound,
Ti5Si3 phase. XRD results from the top surface and below 100 μm from surface show the
possibility of the existence of the TiC particles and a Ti5Si3 compound.
4.2.4 Needle phase
In earlier work of Hu et al [20], a needle phase in the nitriding only processing was
identified as TiN0.3.This phase has the same crystal structure (hexagonal) as the α′-Ti phase
12
and has similar lattice parameters. Also found in this earlier work was that the lattice
parameters of the TiN0.3 phase changed with a change in those of α′-Ti. Using XRD, these
investigations found the following lattice parameters in a commercial purity titanium alloy,
a=2.9511Å and c=4.6843 Å for the α′-Ti and a=2.976Å and c=4.807 Å for the TiN0.3 phase.
However, in a Ti-6Al-4V alloy studied in the same work [20], it was found that a=2.925Å and
c=4.670 Å for the α′-Ti and a=2.941Å and c=4.727 Å for the TiN0.3 phase. A further XRD
analysis was carried out in this region in the present work, by removing 300 μm from the
surface. The results in Fig.4c and Fig.5c show there are no additional strong peaks present
from this region, but only those associated with the α′-Ti and TiN0.3 phases. Thus, the needle
phase in the present work is considered to be the TiN0.3 phase, which has the same structure
as the α′-Ti phase with similar lattice parameters, but a higher nitrogen concentration.
4.2.5 Lattice parameter changes
Fig 5 shows the changes in lattice parameters of both TiN and α′-Ti with depth below the
processed surface for tracks 1-3 and 6-8. In the transition elements, the cubic nitrides can
exist in a wide range of non-stoichiometry, and FCC TiNx can be obtained with 0.5 ≤ x ≤ 1.1
[32].For slowly cooled specimens, TiNx has a lattice parameter which increases linearly from
4.215Å, when x=0.6, to a maximum of 4.242Å, when x=1 [32, 33]and then decreases
linearly to 4.225Å when x=1.1 [32]. Furthermore, most of the transition metal carbides and
nitrides are mutually soluble, forming a series of carbonitrides which have face-centered
cubic (FCC) NaCl crystal structures[34, 35]. The lattice parameter, a, for TiC is given as
4.312-4.315Å [36], 4.294Å [22] and 4.33Å [37], all of which are significantly greater than
the maximum a for TiN. The lattice parameter of the carbonitrides behaves linearly between
TiN-TiC [34].
In a previous paper by Selamat et al [10], discussing laser nitriding using 20%N, it was
found that for tracks 1-3, a increased from 4.213Å at the surface to 4.222Å at a depth of
13
100μm, while for tracks 6-8, a remained constant at 4.222Å. This indicated that that x was
always <1. TiN was not detected below 100µm.In the present work, which used 40%N, the
variations in a, as determined by XRD, and shown in Fig5a, can be explained by the
different C, N and Si contents of Ti(Cy,Nx), with Si in solid solution. a is always ≥ than
4.23Å,, indicating that in a TiNx C and Si free phase, x is ≥ 0.9. C diffuses ~17x faster than N
in βTi at 1423K [38, 39] (the difference in diffusion coefficients in the liquid state is not
known). In tracks 1-3 the increase in a between the surface and 100µm, may be associated
with the presence of C in TiN solid solution, while the decrease in a between 100 and 300µm
could be due to the limitations in the diffusion of C and N, in the latter case, 300µm depth,
resulting in a smaller values of x and y in Ti (Cy,Nx). It should be remembered that nitrogen
has to penetrate the SiC layer before reacting with the Ti-6Al-4V alloy.
The lattice parameters of the α phase in slowly cooled or aged Ti-6Al-4V are a = 2.925Å
and c= 4.670Å [39].These parameters are similar for α′[40],which are smaller than the lattice
parameters of CPTi, given as a = 2.951Å and c= 4.684Å, by Wriedt and Murray [32],and
included in Figs5b and5c.It is considered that the substitutional elements in solid solution in
α/α′ , Al and V, are responsible for the decrease in the lattice parameters. Both these
elements and silicon have smaller atomic diameters (2.86Å, 2.63Å, 2.35Å) than titanium
(2.95Å).On the other hand, the interstitial elements C,N, and O are known to increase the
lattice parameters of the α phase [20,40] . It is noted for tracks 6-8, that c is unchanged,
probably due to preheat producing slower cooling and allowing a closer approach to the
equilibrium lattice parameter value. This effect only appears for a in tracks 1-3,at 300μm
depth, as the smaller a value of the surface persists to 100μm. The XPS results suggest that
Si is rejected from the surface but is present in TiNx solid solution at 100μm and 300μm
subsurface. Hu and Baker [41]showed that overlapping 11 tracks could result in a preheat of
up to 290°C during laser nitriding with 20%N, recorded in 10mm thick Ti-6Al-4V plate. It is
considered that even higher temperatures could result through the exothermic reaction to form
TiN from the use of 40%N. This could result in greater distances in the diffusion of both N
14
and C below the surface, albeit at lower and lower concentrations, which might explain the
increase in a seen in Fig5a for tracks 6-8.
While the residual stress will have an effect on a, it would be expected that the preheat
generated by the melting of a number of tracks, would have a major influence in reducing the
residual stress level throughout the work-piece.
There are few experimental data in the literature concerning the residual stress levels
developed in laser surface processing [14, 42].Ubhi et al [42] showed that the residual stress
across a single track in laser glazed Ti-6Al-4V plate was +170MPa compared to +100MPa
(+ve is tensile) in the parent plate, and these values were reduced by annealing. Mridha et al
[14] determined the residual stresses in single track laser processed using 3mm thick CPTi
sheet, alloyed with ~6µm SiC particles. They showed that the tensile stresses determined
parallel to the track direction, decreased with depth from +259MPa at the surface to +124MPa
at a depth of 200µm.The compressive stresses determined perpendicular to the track
direction, also decreased from the surface -244MPa to -170MPa at 100µm subsurface, to
- 99MPa at 200µm subsurface. How the effects of the combined tensile and compressive
stresses would affect the local lattice parameters of TiN and α′-Ti has not been determined.
However, the residual stresses in tracks 6-8 would be expected to be reduced significantly
through the preheat developed in this work..
4.3 X-ray photospectroscopy
XPS results have suggested that with the present specimen, the surface is no longer a
simple TiN cubic compound, but a TiN solid solution containing carbon and silicon,
possibly a carbonitride. Further, it is thought that the small dendrites growing in non-
preferential directions in the top region, Fig 2a, must also be the TiN solid solution with
dissolved carbon and silicon. It is considered that the needle phase, Fig 2d, is most likely to
15
be the TiN0.3 phase, while the region below 300 μm from surface is associated with the α′-Ti
and TiN0.3 phases.
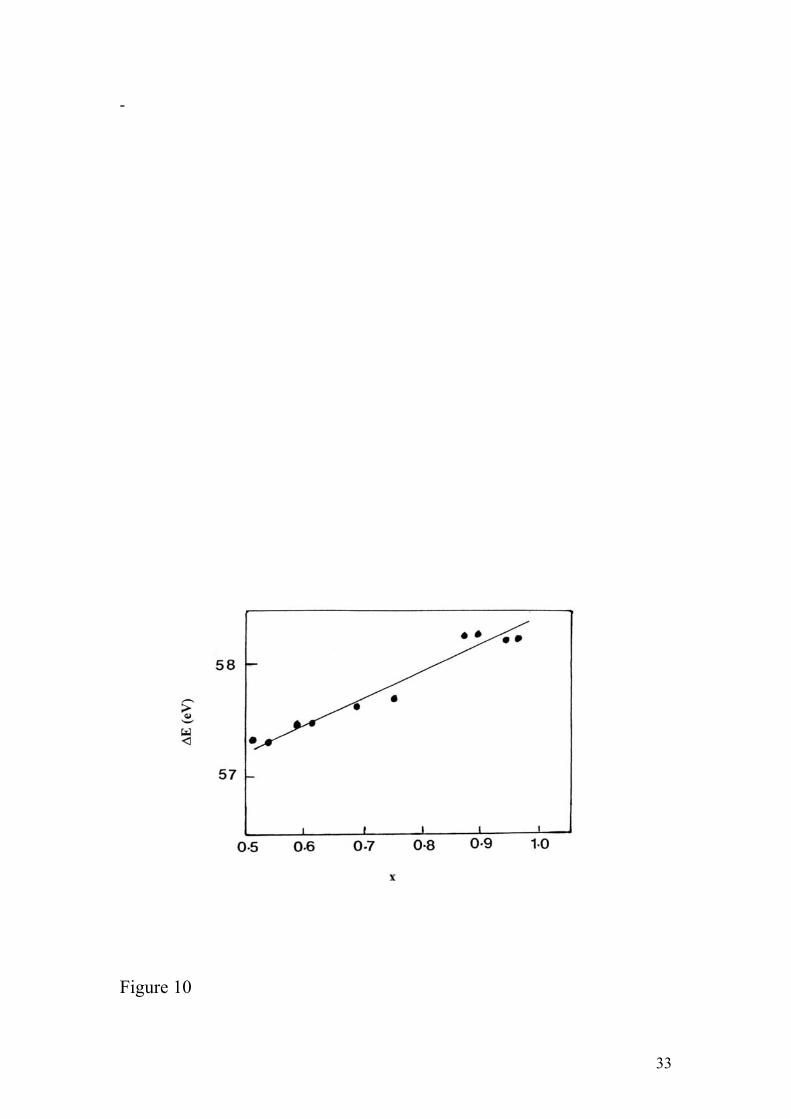
Comparison of the binding energy difference (ΔE) between the Ti2p3/2 and the N1s
core peaks, Table 1 and Table 2, with the work of Porte et al [43], Fig. 10, suggests that in the
present specimen, x ≈ 0.65-0.8 in TiNx.This range compares well with that of a 20% nitrogen
Ti-6Al-4V alloy, where for similar experiments, x ≈ 0.5-0.8 [10].The atomic fraction of C
was not assessed.
In the C1s core level spectra, Fig.9, the peak at about 280.8 eV binding energy, is due
to the chemical bonding between Ti and C ( labelled TiC) and that at about 284.5 eV
represents absorbed carbon. These results indicate that a certain amount of TiC and un-
reactive sources are contained in the specimens. For the layer showing strong TiC peaks, the
absorbed carbon is noticeably reduced and the chemical bonding of Ti-C dominates.
The Si 2p spectra of Figure 9 show that the silicon concentration is too low to produce a
discernable signal from the surface. However, such a signal does appear at the 100μm and the
300μm depths for both sets of tracks indicating that the silicon has diffused from the surface
into the depth of the melt pool. In the earlier study with SiC preplacement only, [22], Si was
present from the surface downwards so it would appear that the presence of nitrogen in
solution at high concentrations has the effect of rejecting silicon. Since the microstructure at
these depths shows only α’-Ti and the needle phase TiN0.3, the silicon must be in solid
solution.
4.4 Comparison with recent significant studies
With the exception of the work undertaken at Strathclyde University [22-24] there are few
publications concerned with Ti-6Al-4V alloys where SiC particles dissolved during laser
processing, and which discuss the microstructure in depth. Furthermore, there appears to be
no other published work on laser nitriding Ti-6Al-4V combined with alloying with SiC
additions [44]. However, Pei et al [45] have studied in detail the microstructure in single
16
track Nd:YAG laser processed Ti-6Al-4V alloys without nitriding, into which 50-90μm SiC
particles were injected, using beam scanning velocities in the range 8.3 to 13mm/s,which
spanned that used in the present work.
Like the present work, they also found a variation in the microstructure with depth, but in
their case, the presence of undissolved SiC particles had a major influence on the
morphology of the submicron phases [45]. For example, a heterogeneously nucleated TiC
reaction layer was always found to surrounded the SiC particles. This was sometimes
associated with Ti5Si3. A eutectic of TiC/α-Ti was also observed. The thickness of the
reaction layer was shown to be influenced by the beam velocity and the depth to which the
SiC had penetrated. The same phases were also identified by Oh and Lee [46] in surface
composites developed by melting powders of TiC, SiC or mixtures of both, on Ti-6Al-4V
alloys using high energy electron beam irradiation. One major difference to the
microstructure recorded by both these sets of workers [45,46] to that observed by Selamat et
al [22], was the absence of a thin surface layer comprised of Ti0.55C0.45, Ti5Si3 and a
martensitic α′-Ti solid solution containing Si and /or C. In the case of the combined SiC plus
laser nitriding studied here, this is replaced by a thin layer of TiN solid solution containing
C, possibly forming a carbonitride, and Si,. plus martensitic α′-Ti.
5 CONCLUSIONS
A combination of laser surface nitriding and alloying with SiC preplacement on a Ti-6Al-4V
alloy using a 40% nitrogen and 60% argon environment has been carried out and produced a
pale gold colour on the surface after laser processing. The spinning beam mode was used to
produce a 4mm wide melt track using a velocity of spinning of 1500 r.p.m. for the main
specimens studied in this work. The laser power was set at 2.8 kW and the specimen velocity
at 10 mm/s. A total of 12 laser tracks with 50% overlaps produced a 24mm wide modified
surface on the 7mm thick base alloy.
Following the study of characterization of the Ti-6Al-4V alloy using SEM, XPS and XRD,
a phase identification was made, and the following conclusions were reached:-
17

(1) a spinning beam associated with overlapping tracks produced a smoother and a uniformly
thick melted layer (more than 300μm deep) over a significant area, compared with a
stationary beam melting a single track.
(2) XRD spectra from the specimens taken from tracks 1-3 and 6-8, showed similar features.
At the surface, cubic TiN ( possibly a carbonitride) was prominent, while TiC and α′-Ti, were
identified, and Ti5Si3 and TiN0.3 were also possibly present. At depths of 100μm, cubic TiN
was less concentrated,.With increase in depth, α′-Ti became more prominent, while the other
phases were still in evidence. The results suggest that the surface layer comprised mainly of a
cubic TiN solid solution containing C, (possibly a carbonitride), and Si.
(3) XPS data suggest that the cubic TiN solid solution containing carbon and silicon is in fact
non-stoichiometric ie,TiNx , where x lies between 0.65 ≤ x ≤ 0.8. The evidence for Si on the
top surface is only slight but a distinct signal appears at 100 μm and at 300 μm for both sets
of tracks. In a similar study with SiC preplacement only [22], the Si 2p signal was apparent
from the top surface downwards. This implies that in the combined laser treated specimen, the
nitriding rejects the Si phase from the surface.
ACKNOWLEDGEMENTS
MSS gratefully acknowledges SIRIM Berhad and the Malaysian Government for the
financial support in this work. The contributions of Dr. Burdett for help of X-ray diffraction
analysis and Dr. C.Hu with the preparation of the laser nitrided specimen are also
acknowledged.
REFERENCES
1 S. Katayama, A. Matsunawa, A. Morimoto, S. Ishimoto, Y Arata, Proceedings of the Fifth
International Conference on Applied Laser Electro-Optics, Laser Institute of America,1983,
p.127.
2 A Walker, J Folkes, W.M Steen, D.R.F West ,J. Surf. Eng. 1 (1985), p23.
3.T. Bell, H.W. Bergmann, J, Lanagan, P.H Morton, A.M.Staines, J. Surf.Eng. 2 (1985),
p.133.
18
4 S.Mridha, T.N Baker, Mat. Sci. and Eng., A142 (1991) ,p.115
5. S. Mridha, T.N.Baker, Mat. Sci. and Eng., A188 (1994),p.229
6 H.Xin, T.N Baker, in P.F Blenkinsop, W.J. Evans, and H.M.Flower (Eds), Proceedings of
the Eighth International Conference on Titanium, Vol 3 1995, p.2031.
7. A.B. Kloosterman, J.Th.M.De.Hosson, Scripta Metall. Mat. 33/4 (1995),p567
8 A.I.P. Nwobu, R.D Rawlings, D.R.F West, Acta Mater. 47 (1999),p. 631
9. H.Xin, L.M. Watson, T.N.Baker, Acta Metall., 46 (1998),p.1949
10 M.S. Selamat, T.N.Baker, L.M.Watson, J.Mat.Proc.Tech., 113 (2001) 509
11 J.D.Ayers, R.T.Schaffer,W.P.Robey J.Met.33 (1981),p.19
12. J.D Ayers, R.N.Bolster, Wear, 93 (1984),p.193
13 J.H.Abboud, D.R.F. West, J.Mat.Sci.Lett. 10 (1991),p.1149
14 S.Mridha H.S.Ubhi P.Holdway T.N.Baker A.W.Bowen in R.H.Froes and I.Caplan,
(Eds.) Proceedings of the Seventh International Conference on Titanium,
Titanium '92, Science and Technology, Vol 3, 1994, p.2641
15 T.N.Baker, H.Xin, C.Hu, S.Mridha, Mater.Sci.Technol. 10 (1994),p.536.
16 S. Mridha, T.N Baker, Mat. Sci. Technol., 12 (1996),p.595
17 C. Hu, H.Xin, T.N Baker, in M.L Scott, (Ed.), Proceedings of the Eleventh International.
Conference on Composite Materials, Metal Matrix Composite and Physical Properties,
Woodhead Publishing, Abington, UK, Vol.3, 1997, p.80
18 C.Hu, T.N.Baker, J.Mat.Sci, 32 (1997), p.2821.
19 C.Hu, T.N.Baker, Mat.Sci. Tech. A265 (1999), p.268.
20 C. Hu, H. Xin, L.M.Watson, T.N.Baker, Acta Metall. Mater., 45 (1997), p.4311
21 H. Xin, L.M.Watson, T.N.Baker,: Acta Metall. Mater., 46 (1998),p.1946.
22 M.S.B Selamat, L.M.Watson, T.N.Baker, J. Mat. Proc. Tech. 142 (2003), p.725
23 H.Xin, C.Hu, T.N.Baker, J Mat.Sci. 35 (2000), p.3373.
24 C. Hu, M.S.B Selamat, H. S Ubhi, T.N Baker, Mater. Sci. Technol., 14 (1998), p.1045.
25 I. Zergioti, C. Fotakis, G.N Haidemenopoulos, Thin Solid Films, 303 (1997), p.39.
26 I. Bertoti, M. Mohai, J.L. Sullivan, and S.O. Saied, Appl. Surf. Sci., 84 (1995), p.357.
19
27 M.P.Bonnar, J.I.B. Wilson, B.M.Burnside, R.L. Reuben, T.R. Gengenbach,
H.J. Griesser, and G. Beamson, J. Mater. Sci., 33 (1998), p.4843.
28 J.C.Francois, Y. Massiani, and P Gravier, Thin Solid Films, 22 (1993), p.223.
29 D. Briggs, and M.P Seah, Practical Surface Analysis, John Wiley & Sons, (1990), p635
30 S.Seal, T.L.Barr, N.Sobczak and S.J.Kerber, J.Mater.Sci., 33 (1998),p.4147.
31 C.Hu,W.L.Stalker. R.D.Conroy and T.N.Baker, in. A. Strang, W.M.Banks,
R.D.Conroy and M.J.Goulette
(Eds) Proceedings Fourth Int. Charles Parsons Turbine Conf., (1997) Inst. Mat.,
London, p 454.
32. H.A.Wriedt and J.L.Murray, Phase Diagrams of Binary Titanium Alloys, ASM
International, USA,1987 , p 176
33 M.Shibuya, J.F.Despres and O.Odowara, Mater. Sci. Technol.,14 (1998), p80.
34 K.Aigner,W.Lengauer, D.Rafaja and P.Ettmayer, J. Alloys Cpds.,215 (1994),p121
35. I-J Jung, S.Kang, S-H Jhi and J.Ihm, Acta mat. 47 (1999) p3241.
36 K.Narita Bull.Japan.Inst.Metals, 19 (1969), p49
37 K.H.G.Ashbee and W.T.Eeles, Acta Cryst. 15,(1962),p1312
38 F.C.Wagner,E.J.Burcur and M.A.Steinberg, Am.Soc.Metals,53,(1961),p765.
39 R.J.Wasilewski and G.L.Kehl, J.Inst.Metals,83,(1954),p94.
40 R.Boyer, G.Welsh and E.W.Collins (Eds) Materials Properties Handbook, Titanium
Alloys, ASM International,
USA, 1994, p 49.
41 C.Hu and T.N.Baker, Mat.Sci.Eng. A265 (1999), p268.
42 H.S.Ubhi, T.N.Baker, P.Holdway and A.W.Bowen, Proceedings of the Sixth International
Conference on Titanium,
1988, p.1687.
43 L.Porte, L. Roux, and J.Hanus, Physical Review B, 6, 28 (1983),p3214.
44 Y.S.Tian,C.Z.Chen,S.T.Li and Q.H.Huo, Applied Surface Science,242 (2005), p177
20

45 Y.T.Pei, V.Ocelik and J.Th.M.De Hosson, Acta Mater. 50 (2002), p2035
46 J. C. Oh and S. Lee. Met.Mat.Trans A, 35A (2004), p139.
.
21
Tables
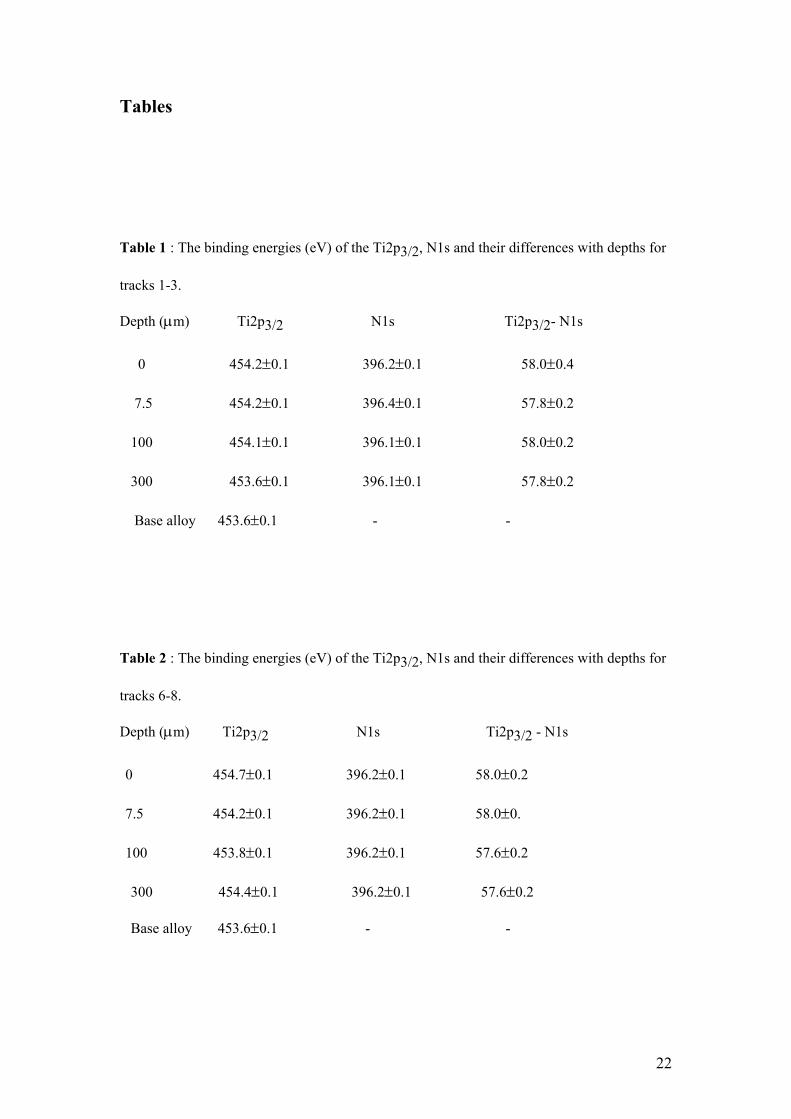
Table 1 : The binding energies (eV) of the Ti2p3/2, N1s and their differences with depths for
tracks 1-3.
Depth (μm) Ti2p3/2 N1s Ti2p3/2- N1s
0 454.2±0.1 396.2±0.1 58.0±0.4
7.5 454.2±0.1 396.4±0.1 57.8±0.2
100 454.1±0.1 396.1±0.1 58.0±0.2
300 453.6±0.1 396.1±0.1 57.8±0.2
Base alloy 453.6±0.1 - -
Table 2 : The binding energies (eV) of the Ti2p3/2, N1s and their differences with depths for
tracks 6-8.
Depth (μm) Ti2p3/2 N1s Ti2p3/2 - N1s
0 454.7±0.1 396.2±0.1 58.0±0.2
7.5 454.2±0.1 396.2±0.1 58.0±0.
100 453.8±0.1 396.2±0.1 57.6±0.2
300 454.4±0.1 396.2±0.1 57.6±0.2 Base alloy 453.6±0.1 - -
22
Figure Captions
Figure 1 : (a) Macrograph, and (b) optical micrograph of the laser processed specimen.
Figure 2 : SEM micrographs showing microstructure produced in the laser processed
specimen. (a) Top surface of track 2, (b) top surface of track 6/7, (c) top surface of track 7, (d)
at a depth of over 300 μm below the top surface of track 1/2.
Figure 3: X-ray diffraction spectra of the laser processed specimen for tracks 1-3, (a) at the
top surface, (b) at the 100 μm depth, and (c) at the 300 μm depth. ( ■ TiN,● α′-Ti, ▲ TiC, x
Ti5Si3,♦ TiN0.3)
Figure 4 : X-ray diffraction spectra of the laser processed specimen for tracks 6-8, (a) at the
top surface, (b) at the 100 μm depth, and (c) at the 300 μm depth. ( ■ TiN,● α′-Ti, ▲ TiC, x
Ti5Si3,♦ TiN0.3)
Figure 5 : The lattice parameters formed at different depths of the laser processed specimen.
(a) a of TiN, (b) a of α′-Ti, and (c) c of α′-Ti.
Figure 6 : (a) XPS wide energy range (0-550 eV) survey scan for the laser processed
specimen, taken from tracks 1-3. Detailed scans of the core level peaks, (b) Ti2p, (c) C1s, (d)
O1s and (e) N1s.
Figure 7 : The XPS spectra of the Ti2p core levels with different depths for the laser
processed specimen, (a) from tracks 1-3 and (b) from tracks 6-8.
Figure 8 : The XPS spectra of the C1s core levels with different depths for the laser
processed specimen, (a) from tracks 1-3 and (b) from tracks 6-8.
Figure 9 : The XPS spectra of the Si2p core levels with different depths for the laser
processed specimen, (a) from tracks 1-3 and (b) from tracks 6-8.
Figure 10 : Binding energy difference (ΔE) between the Ti2p3/2 and the N1s core-level peaks
versus x obtained from the TiNx produced using PVD method (31).
23

Figure 1
24
1 0
mμ 10 m m
Figure 2
μ μmμ
10 mμ mμmμ 1 mμ
0
25
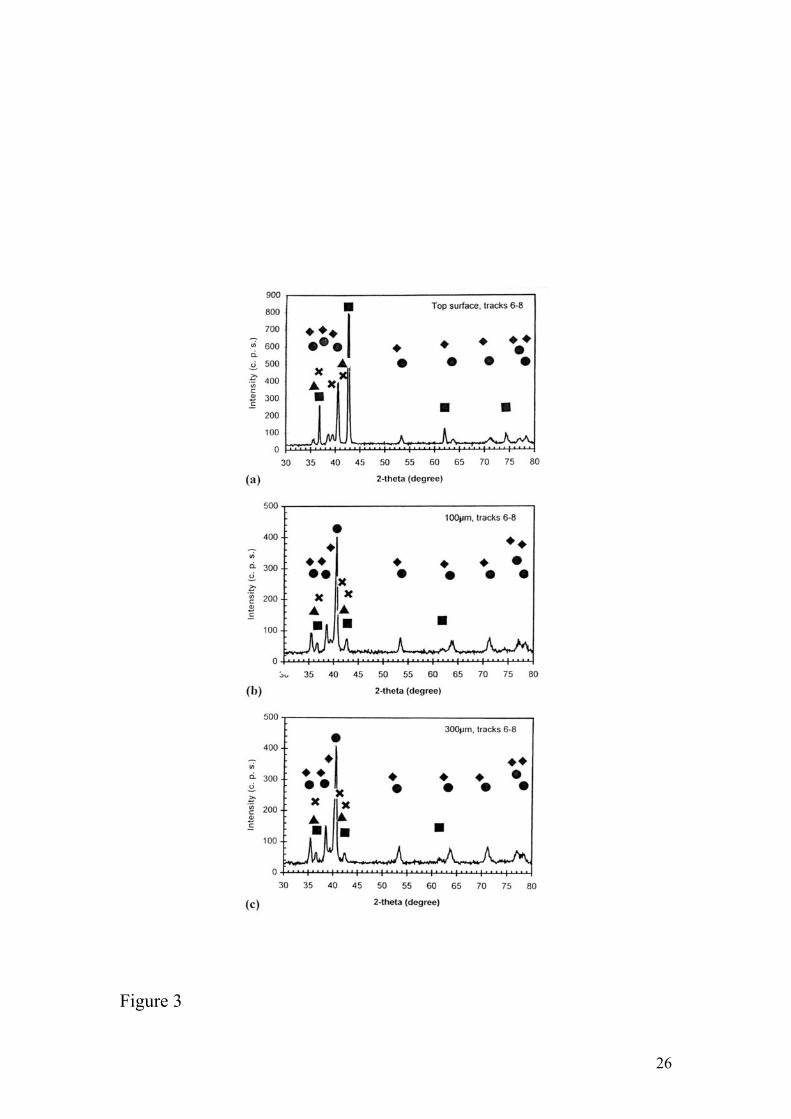
Figure 3
26
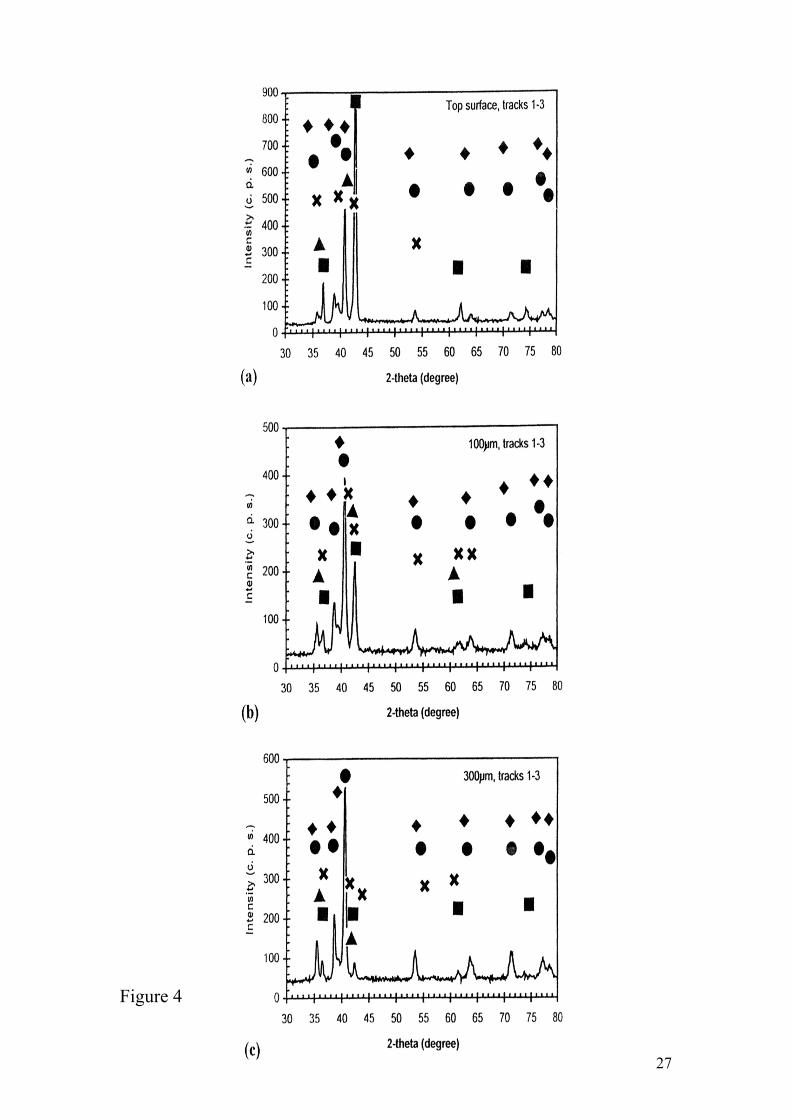
Figure 4
27
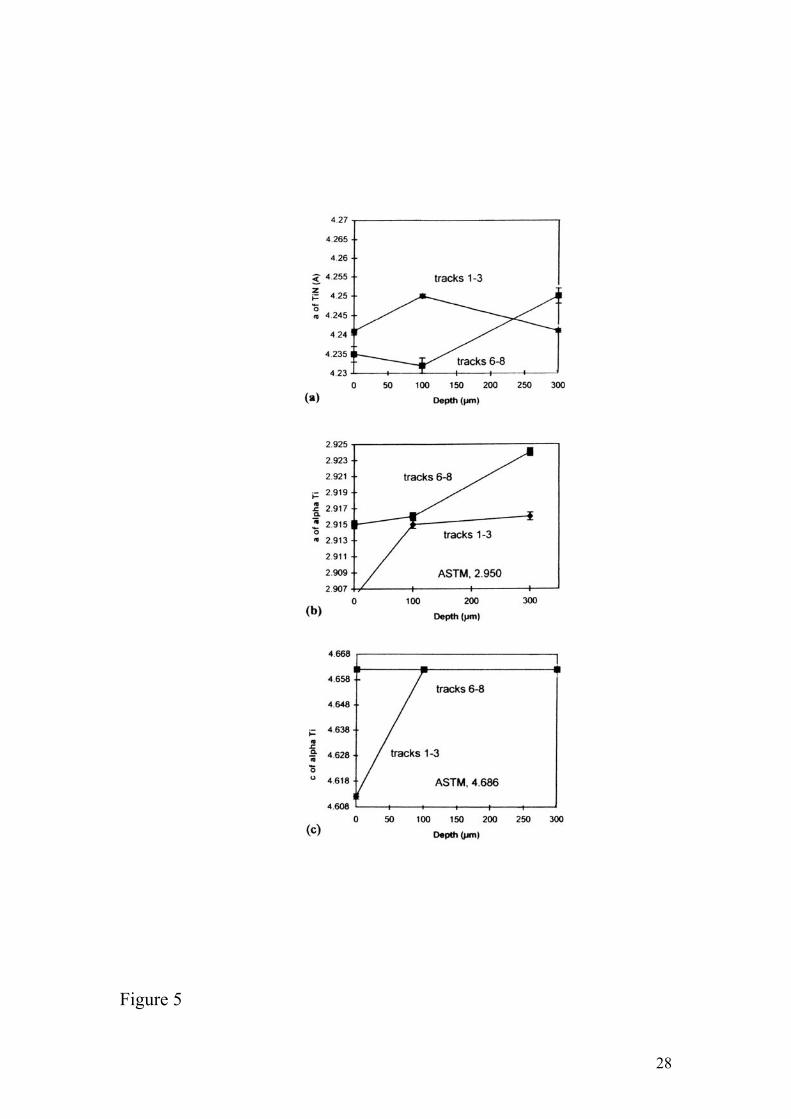
Figure 5
28
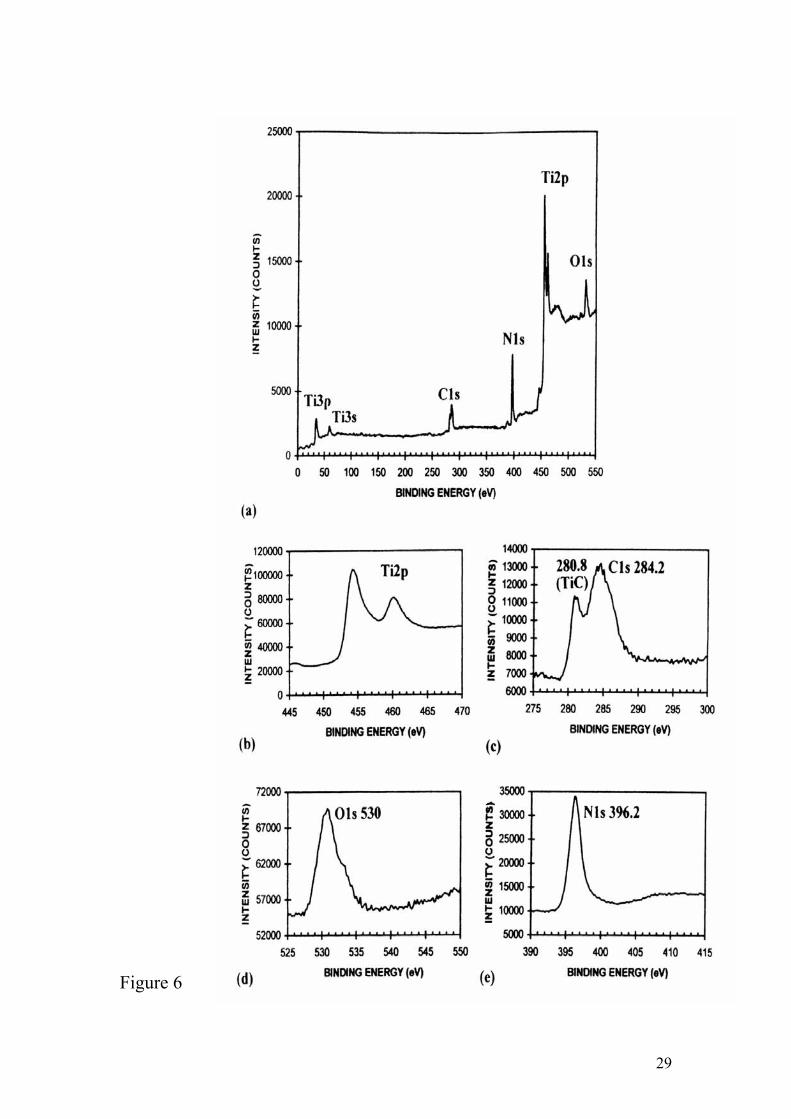
Figure 6
29
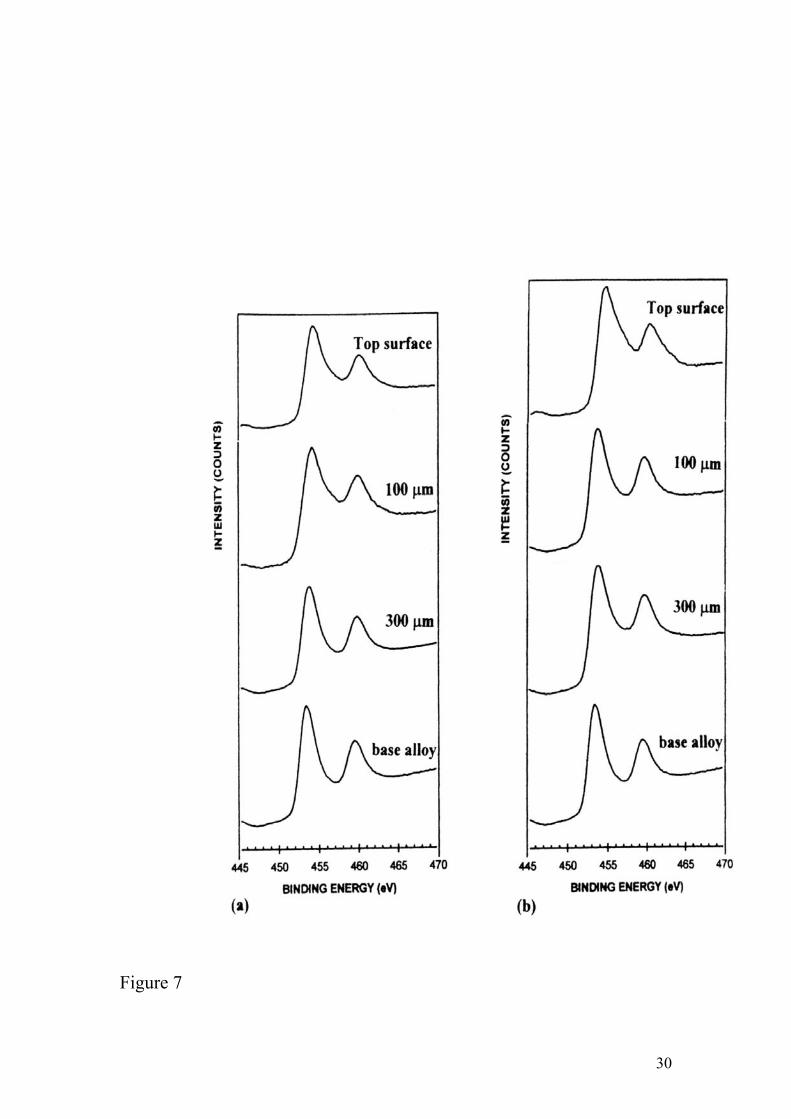
Figure 7
30
(C) (C) Figure 8
31
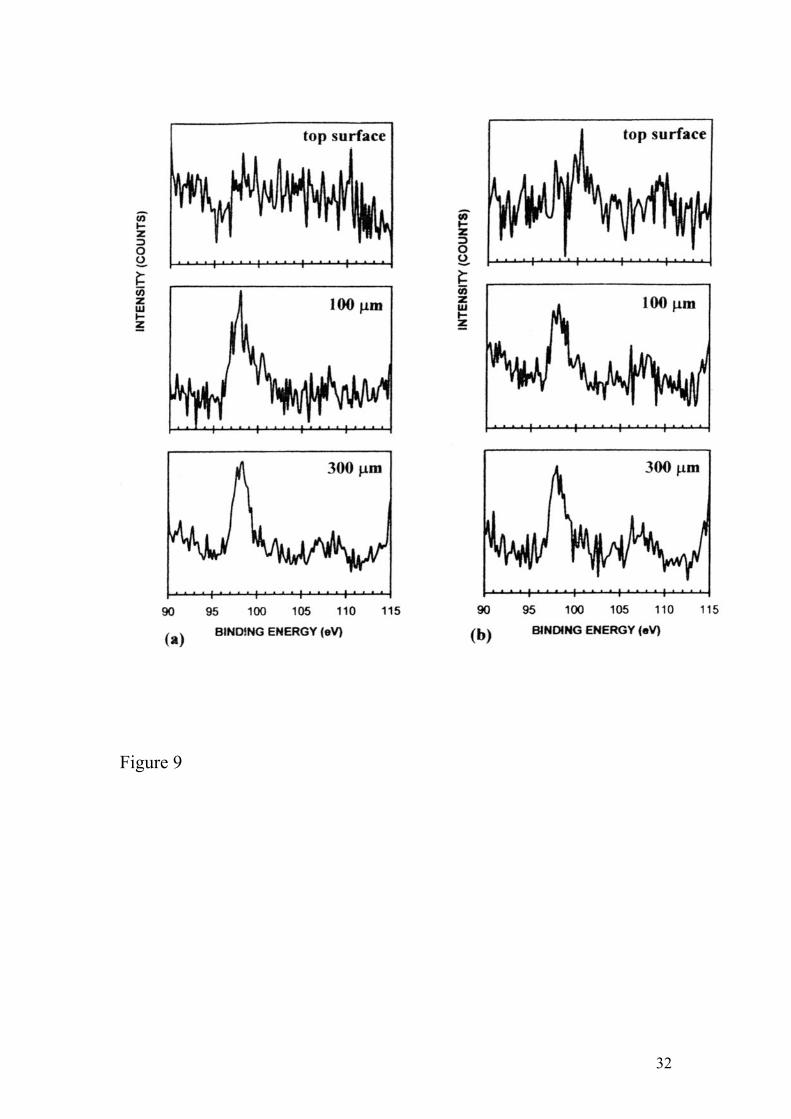
Figure 9
32
- Figure 10
33

34


![Deformed D1D5 CFT: a holographic probe of quantum gravity · The rst non-trivial solution to this equation was the Schwarzschild solution [2], ds2 = 2 1 2GM c2r dt 2+ 1 2 2GM c2r](https://img.pdfslide.us/doc/110x75/6003f66793f6c563617421f7/deformed-d1d5-cft-a-holographic-probe-of-quantum-gravity-the-rst-non-trivial-solution.jpg)