Embed Size (px)
Citation preview
Roman FriedrichSteven PattheeuwsDieter TrimmelHans Geerdes
Perspective
Sharing Mobile Networks Why the Pros Outweigh the Cons
Booz & Company
Contact Information
AmsterdamSteven PattheeuwsSenior Executive [email protected] BeirutBahjat [email protected]
BerlinHans GeerdesSenior [email protected]
DubaiKarim SabbaghSenior [email protected]
DüsseldorfMichael [email protected]
Roman [email protected]
Houston Kenny KurtzmanSenior [email protected]
MadridJose [email protected]
MelbourneSimon [email protected]
MilanLuigi PuglieseManaging [email protected]
MoscowSteffen [email protected]
MumbaiAbhishek SharmaSenior [email protected]
New YorkChristopher [email protected]
ParisPierre Pé[email protected]
São PauloMarcelo [email protected]
TokyoToshiya [email protected]
ViennaKlaus Hö[email protected]
Dieter [email protected]
ZurichAlex [email protected]
1Booz & Company
EXECUTIVE SUMMARY
Mobile network operators have been looking into the possibility of sharing their network infrastructure for several years now. Yet surprisingly few such arrangements have been made, especially in mature markets. In private, operators offer a variety of reasons for not engaging in sharing deals, often fearing the operational complexity they may bring, the up-front transformation costs, and the potential loss of control over their own destinies.
None of these reasons really hold up under analysis, however, especially given the potential for substantial savings in the cost of operating shared networks and the range of potential governance models that sharing parties can choose from. Though up-front infrastructure transformation costs can be high, they can be paid for by future savings or mitigated through emerging alternative financing arrangements.
Most important, operators should act quickly to make network-sharing arrangements. The early movers will be in a position to shape deals with partners of their choice, giving them a distinct cost advantage in their markets. And operators that have plans to implement long-term evolution (LTE) networks soon will find that these deployments can benefit significantly from well-planned network-sharing deals.
2 Booz & Company
With revenues under pressure, the ongoing explosion of data demanding that networks be upgraded, and next-generation LTE requiring further investments in networks, mobile network operators are scrutinizing their cost structures more than ever. As a result, these operators have been actively pursuing the potential of network sharing as a way to boost their returns on capital and reduce costs.
By teaming up with rivals in their markets to build, run, and maintain mobile networks—and splitting the expenses—operators can save as much as 30 to 40 percent of the cost. We estimate that mobile sharing offers the potential to save the European mobile industry €20 billion to €40 billion (US$25 billion to $50 billion) annually over the next five years, given its expected sales of around €150 billion in 2012. This translates to annual savings in the range of €1 billion to €2 billion for an individual large operator with revenues of €50 billion—no small drop in the bucket (see “Reaping the Benefits,” page 9).
Despite the potential, however, and the relative technical and financial flexibility of sharing arrangements, few operators have taken the plunge. In Europe, many operators have engaged in limited cell site sharing, but so far only about 10 comprehensive, large-scale deals have been closed and implemented. More network-sharing deals have been made in emerging markets, but that’s because the larger number of greenfield situations requiring entirely new networks in these markets make them ripe for collaboration among new entrants. Other stakeholders that might benefit—including shareholders and customers, through higher share prices and lower subscription costs—have not encouraged telecom operators to make more deals.
The reasons behind the reluctance to enter into network-sharing deals do not hold up under scrutiny. They generally fall into four categories—strategic, financial, technical, and transactional—and the solutions to them should provide a way for every mobile network operator to discover the benefits to be gained in sharing.
LEAVING MONEY ON THE TABLE
By teaming up with rivals in their markets to build, run, and maintain mobile networks, operators can save as much as 30 to 40 percent of the cost.
3Booz & Company
Many operators, particularly mobile incumbents whose early entrance into their markets has given them the best coverage and network quality, assume that sharing their network with rivals would dilute their competitive advantage. Some feel that they would not be able to control the direction their network would take in the future, their rollout strategies, and their choices about hardware and vendors. Finally, they point to the regulatory risk: that their market share might become so large that regulators would impose a fully regulated new entity to run the entire market’s mobile network.
Can an operator’s network really be a strategic differentiator? Not in the case of ordinary 2G and 3G networks; surveys have shown that their subscribers don’t notice any difference between networks, even if technical measurements tell a dif-ferent story. Operators looking for strategic advantage through newer technologies, such as LTE, can still share their networks, because each partner to a deal gets to decide
which technology to deploy on their shared equipment, and the network footprint to be shared.
Moreover, the fear of losing control over the future direction of their networks is simply misguided. Of course, the managers of the shared network must work within the limits of the performance targets set by both partners in the deal. But operators can always demand a certain degree of autonomy, letting them keep independent control of selected, strategically important sites such as on-site solutions for large business customers.
Worries about regulators might render deals involving shared spectrum unrealistic at this stage. Yet in several countries, opera-tors whose joint market share exceeds 50 percent have already implemented other types of active sharing. Depending on the market’s regulatory context, clarifying the differences between a commercial merger and a technical sharing deal will likely help regulators overcome any potential concerns.
OUR NETWORK IS A STRATEGIC DIFFERENTIATOR
4 Booz & Company
Many operators jump to the conclusion that network sharing simply won’t work in their particular case. Those with mature networks and few plans for future expansion argue that most of the potential savings eludes them and that their sunk costs are irrecoverable. Market leaders claim that they have no potential partner of similar size and a deal with a smaller competitor will unfairly benefit the partner. The initial cost of a network-sharing deal can also be daunting, so operators that don’t have the funds on hand to make the necessary investment are likely to assume that they simply can’t afford to participate.
Moreover, if network assets are to be transferred to the new sharing
entity, a significant tax may be incurred, which could have a real impact on the company’s income statement. If so, the benefits of sharing for the first couple of years may be wiped out and the business case for partnering may not look so attractive. This can be another reason that large operators may feel they can’t share networks with those that have smaller asset bases.
Yet the benefits of sharing are clear. The initial costs involved in the transition stage typically range between €20,000 and €30,000 per site, about a third the cost of building a new site. And even after the transformation cost is factored in, the business case typically remains attractive. The initial capital expenditures required will
SHARING DEALS ARE TOO EXPENSIVE
The initial cost of a network-sharing deal can be daunting, so operators that don’t have the funds on hand to make the necessary investment are likely to assume that they simply can’t afford to participate.
5Booz & Company
Note: Figures include unilateral micro sites. Source: Booz & Company analysis
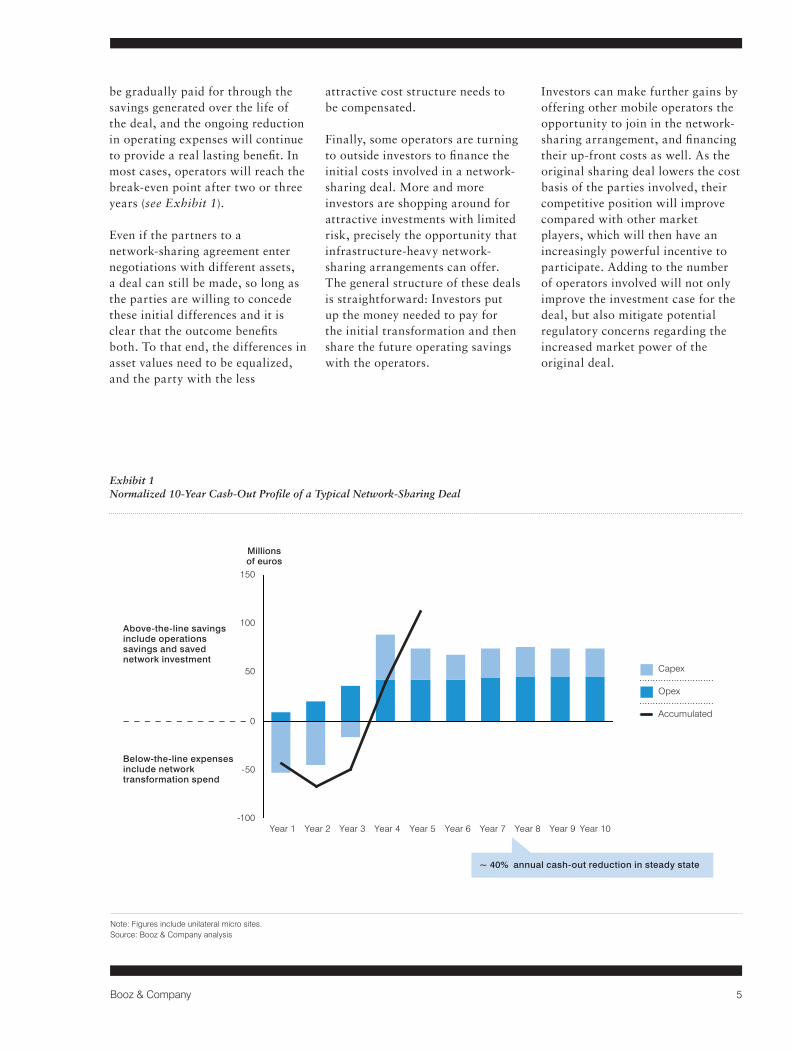
Exhibit 1 Normalized 10-Year Cash-Out Profile of a Typical Network-Sharing Deal
be gradually paid for through the savings generated over the life of the deal, and the ongoing reduction in operating expenses will continue to provide a real lasting benefit. In most cases, operators will reach the break-even point after two or three years (see Exhibit 1).
Even if the partners to a network-sharing agreement enter negotiations with different assets, a deal can still be made, so long as the parties are willing to concede these initial differences and it is clear that the outcome benefits both. To that end, the differences in asset values need to be equalized, and the party with the less
attractive cost structure needs to be compensated.
Finally, some operators are turning to outside investors to finance the initial costs involved in a network-sharing deal. More and more investors are shopping around for attractive investments with limited risk, precisely the opportunity that infrastructure-heavy network-sharing arrangements can offer. The general structure of these deals is straightforward: Investors put up the money needed to pay for the initial transformation and then share the future operating savings with the operators.
Investors can make further gains by offering other mobile operators the opportunity to join in the network-sharing arrangement, and financing their up-front costs as well. As the original sharing deal lowers the cost basis of the parties involved, their competitive position will improve compared with other market players, which will then have an increasingly powerful incentive to participate. Adding to the number of operators involved will not only improve the investment case for the deal, but also mitigate potential regulatory concerns regarding the increased market power of the original deal.
11.0 million = Subheads or highlighted text in Subheads
Guidelines:
aölkdfölka = Plain text / Body copy in Content Bullet points as dashes with tab position
32.8% = numbers in Data (Black)
CURRENT STATE ANALYSES TARGET STATE DESIGN IMPLEMENTATION
A4 format: - width for 3 columns: 169 mm = 6.654 in- width for 2 columns: 111 mm = 4.37 in
Letter format:- width for 3 columns: 167,64 mm = 6.6 in- width for 2 columns: 110,35 mm = 4.343 in
Lines: 0,5 ptLines for legend: 0,5 pt dotted, black
Note:Please always delete all unused colors, after creating the exhibit,otherwise InDesign will import the spot colors of this Illustrator file.These colors can’t be deleted in InDesign. Thanks.
Approved Colors, Tints and Patterns:
Line Weights:
0,5 pt
0,75 pt
1 pt
Arrows:
Line Textures:
solid
dashed
dotted
Operating Model Design
- Process architecture- Automation- Technology- Organization- Footprint- Metrics
Implementation Road Map
- Quantify benefits- Prioritize projects- Develop individual and integrated implementation plans- Create program management structure and governance
Execution
- Implement integrated plan- Ensure ongoing communications- Maintain business buy-in- Track and enforce benefit realization- Institutionalize culture of continuous improvement- Drive Lean adoption and mastery
Quick Win Implementation
1 2 3
- People involvement- Batch reduction- Cellular teams- Equipment reliability- Leveling- Reduce setup time
Workload Profiling
Risk Assessment
Spans and Layers Analysis
Workload Balancing
Risk Analytics and Solution
Identifying Waste
Time and Motion Study
Value Stream Mapping
Voice of the Customer AnalysisLean Design Principles
- Standardized work- Quality at source- Workplace organization- Visual controls- Pull systemsTEN-YEAR ANNUALIZED CHANGE IN ENTERPRISE VALUE, RELATIVE TO ANNUALIZED CHANGE
IN BENCHMARKS, OF COMPANIES WITH $1 BILLION OR MORE IN REVENUE
0
10
20
30
40
50
60
70
Annualized Change-20% 0%-10%-30%-35% 10% 20% 30% 40% 56%50%
Frequency
Sample set: bottom performers
(adjusted annualized return<= -10%)
PositiveNegative
~ 40% annual cash-out reductionin steady state
Above-the-line savings include operations savings and saved network investment
Millionsof euros
150
100
50
0
-50
-100Year 8Year 7Year 6Year 5Year 4Year 3Year 2Year 1 Year 10Year 9
Accumulated
Opex
Capex
Below-the-line expenses include network transformation spend
~ 40% annual cash-out reduction in steady state
6 Booz & Company
A combined network, some opera-tors believe, is fraught with too many technological and operational perils, especially during the tran-sition. The result, they fear, will be little financial benefit and the potential for chaos. Operators using different spectrums may view their networks as simply incompatible, while others may have competing visions of how and when to deploy LTE or on coverage requirements, given their different customer bases. And some simply insist that their networks have special technical conditions that make it impossible to partner with anyone.
Yet these hurdles, too, can be overcome. Even if a potential deal does not involve the rollout of new sites, existing 2G, 3G, and LTE networks can be combined. More recently built networks can be shared quite easily, especially if they have been equipped with state-of-the art single RAN technology, as most of them have. The technology allows networks of different generations to
be combined on the same site, and upgrading them becomes relatively inexpensive, increasing the potential financial benefit of sharing deals.
The key to making the best deal pos-sible lies in seeking out opportunities to maximize the cost savings every-where. The more equipment that can be reused, such as any recently renewed single RAN equipment, the better. Choosing the best technology for sharing sites will make a differ-ence; trying to accommodate legacy equipment, for instance, may lead to unnecessarily heavy investments. In dealing with these technical issues, operators should strive to coordinate the transition to the shared network with the network modernization cycles they may have needed anyway.
Finally, any deal should give both parties the room to operate unilaterally within clear limits, modernizing their networks when and where they choose and setting their own individual network performance targets.
OUR TECHNOLOGIES ARE INCOMPATIBLE
7Booz & Company
Many operators don’t feel confident that they can close a network-sharing deal, or execute on it afterward. Negotiations, they worry, will only get bogged down in the details, take forever, and lead nowhere. Or the expectations for the claimed benefits are simply too
high and cannot be met. All in all, a waste of time.
Yet the process of entering into and carrying out these deals can be eased by making sure that each party involved in the deal clearly understands the terms involved. Leadership counts too: The managerial and technical complications can be overcome if the executive team makes clear its determination to get the deal done and sets ambitious but realistic targets and time lines.
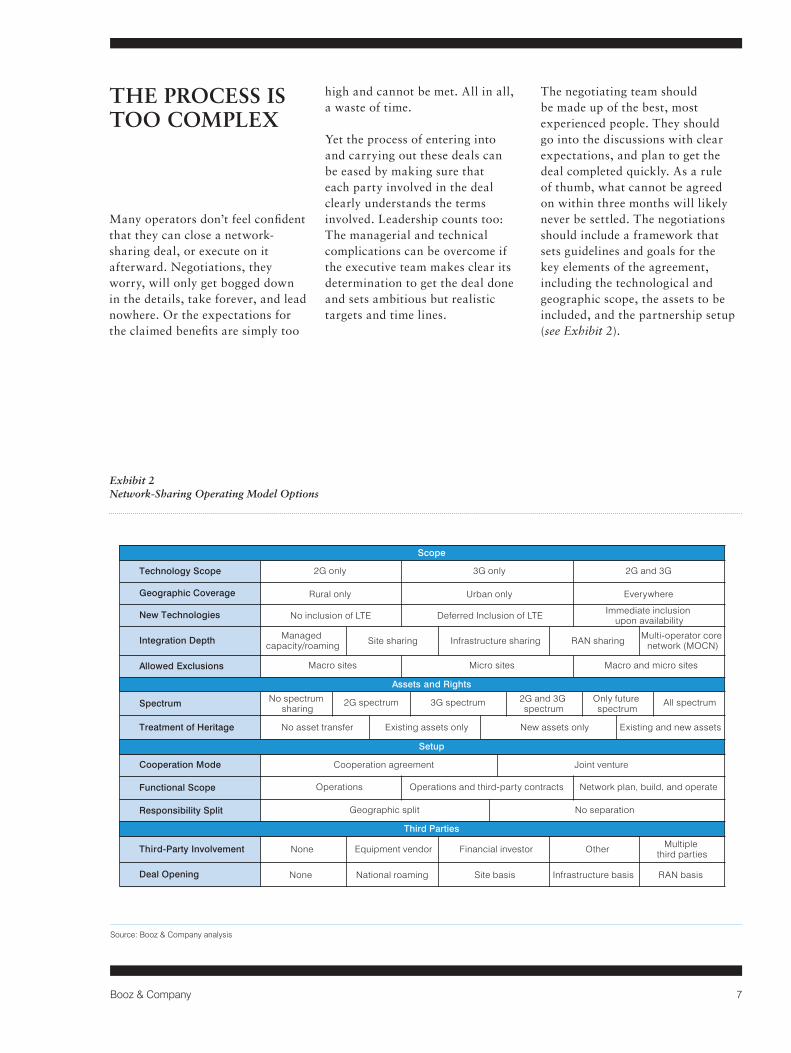
The negotiating team should be made up of the best, most experienced people. They should go into the discussions with clear expectations, and plan to get the deal completed quickly. As a rule of thumb, what cannot be agreed on within three months will likely never be settled. The negotiations should include a framework that sets guidelines and goals for the key elements of the agreement, including the technological and geographic scope, the assets to be included, and the partnership setup (see Exhibit 2).
THE PROCESS IS TOO COMPLEX
Source: Booz & Company analysis
Exhibit 2 Network-Sharing Operating Model Options
11.0 million = Subheads or highlighted text in Subheads
Guidelines:
aölkdfölka = Plain text / Body copy in Content Bullet points as dashes with tab position
32.8% = numbers in Data (Black)
CURRENT STATE ANALYSES TARGET STATE DESIGN IMPLEMENTATION
A4 format: - width for 3 columns: 169 mm = 6.654 in- width for 2 columns: 111 mm = 4.37 in
Letter format:- width for 3 columns: 167,64 mm = 6.6 in- width for 2 columns: 110,35 mm = 4.343 in
Lines: 0,5 ptLines for legend: 0,5 pt dotted, black
Note:Please always delete all unused colors, after creating the exhibit,otherwise InDesign will import the spot colors of this Illustrator file.These colors can’t be deleted in InDesign. Thanks.
Approved Colors, Tints and Patterns:
Line Weights:
0,5 pt
0,75 pt
1 pt
Arrows:
Line Textures:
solid
dashed
dotted
Operating Model Design
- Process architecture- Automation- Technology- Organization- Footprint- Metrics
Implementation Road Map
- Quantify benefits- Prioritize projects- Develop individual and integrated implementation plans- Create program management structure and governance
Execution
- Implement integrated plan- Ensure ongoing communications- Maintain business buy-in- Track and enforce benefit realization- Institutionalize culture of continuous improvement- Drive Lean adoption and mastery
Quick Win Implementation
1 2 3
- People involvement- Batch reduction- Cellular teams- Equipment reliability- Leveling- Reduce setup time
Workload Profiling
Risk Assessment
Spans and Layers Analysis
Workload Balancing
Risk Analytics and Solution
Identifying Waste
Time and Motion Study
Value Stream Mapping
Voice of the Customer AnalysisLean Design Principles
- Standardized work- Quality at source- Workplace organization- Visual controls- Pull systemsTEN-YEAR ANNUALIZED CHANGE IN ENTERPRISE VALUE, RELATIVE TO ANNUALIZED CHANGE
IN BENCHMARKS, OF COMPANIES WITH $1 BILLION OR MORE IN REVENUE
0
10
20
30
40
50
60
70
Annualized Change-20% 0%-10%-30%-35% 10% 20% 30% 40% 56%50%
Frequency
Sample set: bottom performers
(adjusted annualized return<= -10%)
PositiveNegativeAbove-the-line savings includes operations savings and saved network investment
Millionsof euros
150
100
50
0
-50
-100Year 8Year 7Year 6Year 5Year 4Year 3Year 2Year 1 Year 10Year 9
Accumulated
Opex
Capex
Below-the-line expenses include network transformation spend
~ 40% annual cash-out reduction in steady state
Technology Scope
2G
Geographic Coverage
New Technologies
Integration Depth
Allowed Exclusions
Spectrum
Treatment of Heritage
Cooperation Mode
Functional Scope
Responsibility Split
Third-Party Involvement
Deal Opening
2G only 3G only 2G and 3G
Rural only Urban only Everywhere
Operations Operations and third-party contracts Network plan, build, and operate
Managed capacity/roaming Site sharing Infrastructure sharing
Macro sites Micro sites Macro and micro sites
RAN sharing Multi-operator core network (MOCN)
Cooperation agreement
No asset transfer Existing assets only New assets only Existing and new assets
None Equipment vendor Financial investor Other Multiple third parties
None National roaming Site basis Infrastructure basis RAN basis
20% 20% 20% 20% 20%
No inclusion of LTE Deferred Inclusion of LTE Immediate inclusion upon availability
No spectrum sharing
3G spectrum Only future spectrum
2G spectrum 2G and 3G spectrum
All spectrum
Joint venture
Geographic split No separation
Scope
Assets and Rights
Setup
Third Parties

8 Booz & Company
The notion that first movers in network sharing will gain a real advantage over their non-sharing rivals suggests that it behooves every mobile operator to address any lingering concerns, start thinking seriously about the opportunity, and move fast. The conditions for making good deals will likely decline in most markets; indeed, several operators that have adopted a wait-and-see attitude have already been left out in the cold, at least for the time being.
Shareholders in mobile operators have a role to play here. They
should not allow themselves to be appeased with an array of excuses for avoiding these deals. It has been shown again and again that sharing works. Management teams should be actively encouraged to investigate the network-sharing possibilities in their markets, given their potential for improving the bottom line and ultimately the share price.
Investors looking for low-risk opportunities to boost their returns should consider investing in these arrangements. Again, the first movers are likely to capture the best deals.
ACT NOW
9Booz & Company
About the Authors
Roman Friedrich is a partner with Booz & Company based in Düsseldorf and Stockholm. He leads the firm’s global communications, media, and technology practice, and specializes in the strategic transformation of these industries in the context of digitization.
Steven Pattheeuws is a senior executive advisor with Booz & Company based in Amsterdam. He specializes in network and technology transformation, with a specific focus on active and passive network sharing.
Dieter Trimmel is a principal with Booz & Company based in Vienna. He specializes in strategy, technology, and organizational development for leading telecom operators in Europe, India, Russia, and the Middle East.
Hans Geerdes is a senior associate with Booz & Company based in Berlin. He specializes in IT strategy and large-scale transformation, with a focus on the com-munications industry.
Reaping the Benefits
Two European mobile operators, one with an estimated 10,000 sites and the other with about 8,000, decided to band together to share their 2G and 3G networks.
Moving to a shared footprint allowed the two operators to retire 45 percent of their existing sites, saving a total of 8,000 sites. It also rendered 45 percent of their combined planned rollout of new sites unnecessary. By reusing equipment and choosing the most efficient way to upgrade their current sites, the partnership spent just €250 million on the upgrade—€20,000 to €30,000 per site—30 percent or so of their planned network upgrade spending.
The cost of the upgrade was partly self-financing, thanks to a combination of the saved rollout costs and ongoing savings—the deal provided positive cash flow by the third year, and broke even in the fourth. Ultimately, the deal saved the two operators 40 percent of their annual run rate. The net present value of the deal was €250 million, and the operators expected €600 million in savings over its 10-year life, fully 20 percent of the two operators’ planned network spending.
Because the smaller of the two operators profited more from the reduction in its cost basis, it paid €80 million in compensation to the larger partner. Overall, a good deal for all concerned.
Booz & Company is a leading global management consulting firm focused on serving and shaping the senior agenda of the world’s leading institutions. Our founder, Edwin Booz, launched the profession when he established the first management consulting firm in Chicago in 1914. Today, we operate globally with more than 3,000 people in 58 offices around the world.
We believe passionately that essential advantage lies within and that a few differentiating capabilities drive any organization’s identity and success. We work with our clients to discover and build those capabilities that give them the right to win their chosen markets.
We are a firm of practical strategists known for our functional expertise, industry foresight, and “sleeves rolled up” approach to working with our clients. To learn more about Booz & Company or to access its thought leadership, visit booz.com. Our award-winning management magazine, strategy+business, is available at strategy-business.com.
The most recentlist of our officesand affiliates, withaddresses andtelephone numbers,can be found onour website,booz.com.
Worldwide Offices
AsiaBeijingDelhiHong KongMumbaiSeoulShanghaiTaipeiTokyo
Australia,New Zealand & Southeast AsiaBangkokBrisbane
CanberraJakartaKuala LumpurMelbourneSydney
EuropeAmsterdamBerlinCopenhagenDüsseldorfFrankfurtHelsinkiIstanbul
LondonMadridMilanMoscowMunichParisRomeStockholmStuttgartViennaWarsawZurich
Middle EastAbu DhabiBeirutCairoDohaDubaiRiyadh
North AmericaAtlantaBostonChicagoClevelandDallasDC
DetroitFlorham ParkHoustonLos AngelesMexico CityNew York CityParsippanySan Francisco
South AmericaBuenos AiresRio de JaneiroSantiagoSão Paulo
©2012 Booz & Company Inc.