Embed Size (px)
Citation preview
STRATEGY / PLANNING / RESEARCH
Harness Racing Australia: Economic Impact of the 2013 tab.com.au Inter Dominion Championship 1
STRATEGY / PLANNING / RESEARCH
Harness Racing Australia: Economic Impact of the 2013 tab.com.au Inter Dominion Championship 2
Harness Racing Australia /
Economic Impact 2013 tab.com.au Inter Dominion Championship
Prepared by: IER Pty Ltd
27A Stubbs St
Kensington, Victoria, 3031
Ph: (03) 9371 3000
Fax: (03) 9376 0675
W: www.ier.com.au
Supplier contacts: Glenn Hardy, Director
Paul Limoli, Director
Prepared for: Andrew Kelly
Chief Executive
Harness Racing Australia Inc.
400 Epsom Road
Flemington Vic 3039
Date: May 2013
Job Reference: ID13R-1
STRATEGY / PLANNING / RESEARCH
Harness Racing Australia: Economic Impact of the 2013 tab.com.au Inter Dominion Championship 3
Contents 1. Summary of Key Findings / .......................................................................................................... 4
2. Background Information / ........................................................................................................... 6
2.1 Overview ................................................................................................................................. 6
2.2 Objectives of the Study ........................................................................................................ 6
2.3 Study Methodology .............................................................................................................. 8
2.3 Economic Methodology ..................................................................................................... 10
3. Attendance Demographics / ..................................................................................................... 11
3.1 Gender .................................................................................................................................. 11
3.2 Age ........................................................................................................................................ 11
3.3 Visitor Origin ........................................................................................................................ 12
3.4 Annual Household Income ................................................................................................ 12
3.5 Household Composition .................................................................................................... 13
4. Tourism Impacts / ....................................................................................................................... 15
4.1 Attendance by Intrastate Visitors ...................................................................................... 15
4.2 Attendance by Interstate Visitors ...................................................................................... 15
4.3 Attendance by International Visitors ................................................................................ 15
4.4 Accommodation Impacts ................................................................................................... 17
5. Advertising Recall and Attendance Motivations / .................................................................. 18
5.1 Advertising Recall ................................................................................................................ 18
6. Customer Advocacy / ................................................................................................................. 19
6.1 Net Promoter Score ............................................................................................................ 19
7. Economic Impacts of ID13/........................................................................................................ 21
7.1 Direct Spending Impacts .................................................................................................... 21
7.2 Fashion Impacts ................................................................................................................... 23
7.3 Value Added Contribution to Gross Regional Product .................................................. 24
7.4 Regional input output (IO) models ................................................................................... 27
STRATEGY / PLANNING / RESEARCH
Harness Racing Australia: Economic Impact of the 2013 tab.com.au Inter Dominion Championship 4
1. Summary of Key Findings /
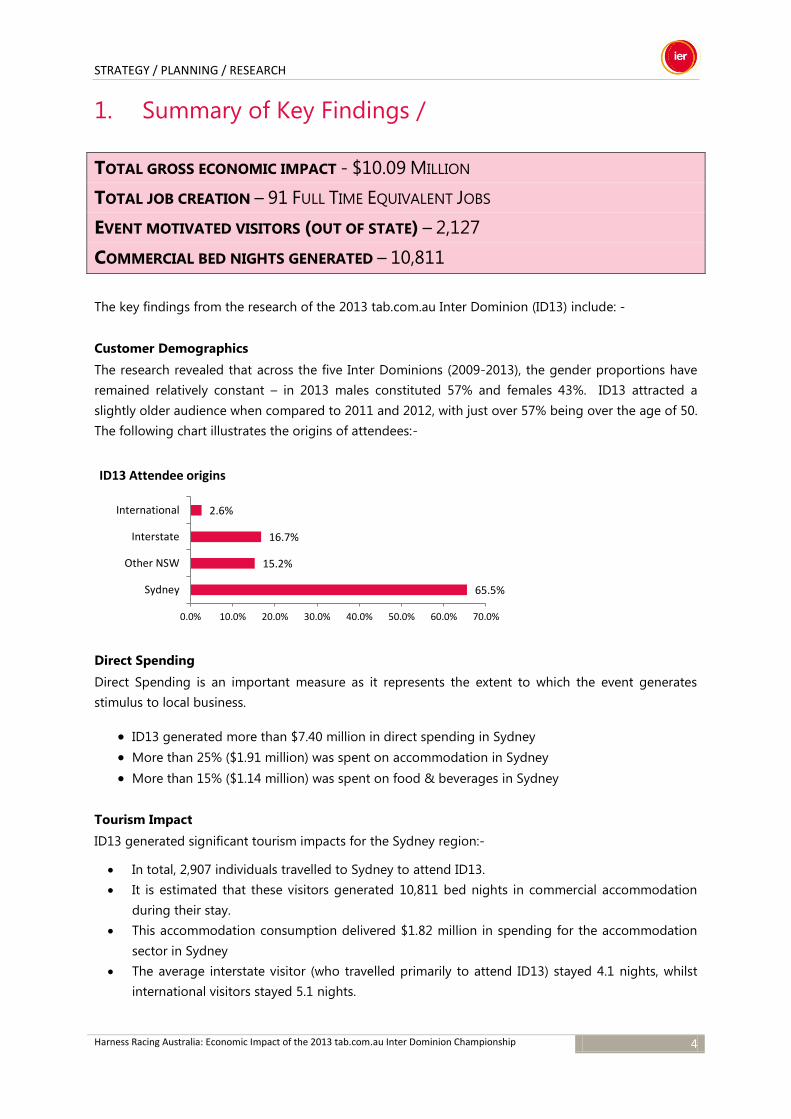
TOTAL GROSS ECONOMIC IMPACT - $10.09 MILLION
TOTAL JOB CREATION – 91 FULL TIME EQUIVALENT JOBS
EVENT MOTIVATED VISITORS (OUT OF STATE) – 2,127
COMMERCIAL BED NIGHTS GENERATED – 10,811
The key findings from the research of the 2013 tab.com.au Inter Dominion (ID13) include: -
Customer Demographics
The research revealed that across the five Inter Dominions (2009-2013), the gender proportions have
remained relatively constant – in 2013 males constituted 57% and females 43%. ID13 attracted a
slightly older audience when compared to 2011 and 2012, with just over 57% being over the age of 50.
The following chart illustrates the origins of attendees:-
Direct Spending
Direct Spending is an important measure as it represents the extent to which the event generates
stimulus to local business.
ID13 generated more than $7.40 million in direct spending in Sydney
More than 25% ($1.91 million) was spent on accommodation in Sydney
More than 15% ($1.14 million) was spent on food & beverages in Sydney
Tourism Impact
ID13 generated significant tourism impacts for the Sydney region:-
In total, 2,907 individuals travelled to Sydney to attend ID13.
It is estimated that these visitors generated 10,811 bed nights in commercial accommodation
during their stay.
This accommodation consumption delivered $1.82 million in spending for the accommodation
sector in Sydney
The average interstate visitor (who travelled primarily to attend ID13) stayed 4.1 nights, whilst
international visitors stayed 5.1 nights.
65.5%
15.2%
16.7%
2.6%
0.0% 10.0% 20.0% 30.0% 40.0% 50.0% 60.0% 70.0%
Sydney
Other NSW
Interstate
International
ID13 Attendee origins
STRATEGY / PLANNING / RESEARCH
Harness Racing Australia: Economic Impact of the 2013 tab.com.au Inter Dominion Championship 5
Economic Impacts
The economic impact measures the amount of spending that actually contributes to growth of the
host city economy.
The total gross expenditure linked to the Inter Dominion is estimated at $7.41 million
This expenditure is responsible for creating a total of $3.64 million value added (or wages
income plus gross operating surplus) directly, with wages and salaries being $2.27 million,
and there being approximately 47 jobs (in full time equivalent terms)
However the flow on effects linked to this expenditure more than double the size of the
contribution the sector makes. Including the flow on effects, the total contribution of the
racing sector is estimated as $10.09 million value added (or wages income plus gross
operating surplus, with wages and salaries being $5.50 million, and approximately 91 jobs (in
full time equivalent terms).
STRATEGY / PLANNING / RESEARCH
Harness Racing Australia: Economic Impact of the 2013 tab.com.au Inter Dominion Championship 6
2. Background Information / 2.1 Overview
Contested since 1936, the Inter Dominion is the pinnacle race on the Australasian harness racing
calendar attracting horses from around Australia, New Zealand and the USA. Historically, the host of
the series has been rotated between the 6 harness racing states of Australia and the North and South
Islands of New Zealand. New South Wales has the rights to run the Inter Dominion for three years
(2013 -2015).
Traditionally the series was held over a two week period with heats run over a sprint distance (1600m -
1900m), a middle distance (2100m - 2300m) and a staying distance (over 2400m). The scheduling of
the distances is usually at the discretion of the host club. The final and consolation are usually held
one week after the final round of heats over a distance in excess of 2400 meters.
ID13 was held over three weeks at Tabcorp Park, Menangle. In an entirely new concept Qualifying
Heats were held throughout Australasia over a 90 minute period during the evening of 16 February,
including 2 at Tabcorp Park Menangle. The carnival continued on February 23rd with the running of
the Allied Express Pink bonnet and Rod Fitzpatrick Memorial finals. Im Themightyquinn (NZ) wowed
the large crowd at the Grand Final by winning his third tab.com.au Inter Dominion in succession at
Tabcorp Park Menangle on Sunday Afternoon, 3rd March.
2.2 Objectives of the Study
The primary purpose of this report is to provide an independent assessment of the economic impacts
generated by ID13 on the Sydney and New South Wales economies. Unlike the 2011 study, which
assessed the economic impacts at a regional and national level (Auckland and New Zealand); this study
measures the economic impacts on a regional and state basis.
The main objectives of the HRA study are:
1. To provide an independent estimate of the economic impacts generated by the Inter
Dominion including:-
a. Direct expenditure generated by Customers
b. Value added contribution to Gross Regional Product
c. FTE employment impacts generated by the Series
d. State and Federal Government revenue generated by the Series
e. Calculate the total economic contribution of the Inter Dominion to the host city
economy, including spending by all attendees irrespective of origin.
2. To provide a basis for long term benchmarking and time-series analysis on key event and
economic impact indicators.
STRATEGY / PLANNING / RESEARCH
Harness Racing Australia: Economic Impact of the 2013 tab.com.au Inter Dominion Championship 7
3. To identify the number of interstate and overseas visitors who came to the state for the Inter
Dominion and assess the flow on tourism benefits that are generated.
4. To report on visitor spending patterns at the racecourse and also in the community during
their visit.
5. To provide valuable marketing information that positions Harness Racing Australia, its
members and future host clubs for increased corporate, public and government support.
The methodology employed to undertake this assessment has been developed with consistency in
mind, to ensure that past and future Inter Dominion assessments can be easily compared. The
assessment of economic impacts is based upon key indicators which can be defined as follows:-
Direct expenditure: - the calculation of direct expenditure effectively measures the total
spending generated by all customers and participants involved in the ID13 series. This
measure is not an attempt to quantify the ultimate growth impact on the economy (this is
achieved through the calculation of value added impacts). Rather, this measure provides an
indication of the economic stimulus that is generated by the event which provides direct
impacts on businesses in the regional host economies.
Value added contribution: - the calculation of value added contribution generated by ID13
is a measure that quantifies the extent to which hosting the event in the three host cities
increases the value of Gross Regional and State Products. Essentially, the extent to which
ID13 grows the local and Statewide economies is driven by the ability to attract visitors to the
region and, to a lesser extent, the ability to retain local resident spending that would
otherwise be lost to another market (i.e. if the Inter Dominion was held in another State or
Country.)
Gross Regional Product: - is defined, essentially, the same way as Gross State Product,
albeit on a regional level (i.e. Host regional economy). It is a measure of the value of goods
and services becoming available to the region as a result of economic activity generated by ID13.
FTE employment impacts: - the extent to which employment impacts can be allocated
against ID13 depends upon the determination of the level of economic activity generated by
the event. Employment that is identified as being a result of the increased in demand and
expenditure generated by the event, leads to an increase in the level of full-time and/or part-
time employment in the region. Outputs are referred to in terms of full time equivalent (FTE)
positions and takes into account both full time and part time employment.
State and Federal Government revenue: - the extent to which wagering activity delivers
taxation revenues to the State and Federal Governments. Whilst economic activity also
delivers taxation revenues through direct taxes (PAYG, GST etc.), it is the wagering tax which
is uniquely generated by harness racing activities.
STRATEGY / PLANNING / RESEARCH
Harness Racing Australia: Economic Impact of the 2013 tab.com.au Inter Dominion Championship 8
2.3 Study Methodology
Population of Interest
The population of interest to this study was attendees at three key events during the 2013 ID13 Series
at Tabcorp Park Menangle. For the purpose of this study, ‘attendees’ are identified as racegoers who
attended the heats and finals of the ID13.
Instrumentation
The data for this study was collected using a face-to-face survey, with IER deploying its field research
staff on each night of the event.
Data Collection
In order to generate an adequate sample size for each of the race nights, data was collected using field
research staff. IER sent trained research staff to each of the three race nights for the purpose of data
collection. IER field staff were instructed to approach attendees randomly at each of these events and
request them to provide details pertaining to demographics, advocacy, advertising recall and tourism
behaviour. IER instructed all field staff working at the events to collect data from attendees upon entry
and at key locations throughout the raceway.
Survey Development
The face-to-face surveys were developed in line with the methodology that was employed for the
previous four Inter Dominions. All attendees were asked a generic set of questions (page 1 of the
survey) and then depending on the visitor’s residence (Sydney, intrastate, interstate or overseas), they
were asked a range of questions relating to their travel and expenditure.
Whilst many of the questions remained static, there were subtle differences to reflect the different
profiles of attendees. The main differences were based on the customer type and visitor origin. The
following examples illustrate the main purpose for developing different survey tools:-
Different customer types require different analysis. For instance: - Corporate guests are invited
to the races and generally do not pay for entry, racebook or food and beverages. Therefore it
is important to capture their personal spending as well as company expenditure.
The type of travel arrangements plays a role in the types of questions asked. For instance: - It
is important to establish for travelling attendees, whether they booked a tour package or were
making their own arrangements. Attendees who book tour packages were asked the total cost
of the package and personal expenses, rather than itemising each expenditure item.
In addition to the economic and tourism questions, the survey also assessed attendee satisfaction,
motivations to attend and communication recall.
STRATEGY / PLANNING / RESEARCH
Harness Racing Australia: Economic Impact of the 2013 tab.com.au Inter Dominion Championship 9
2.3.1 Sample Design
In attempting to determine the population demographics from the ID13 audience, IER developed a
thorough sampling design. This sampling process allowed for the development of attendee data
samples from within each of the following customer groups:-
Sydney Residents – Attendees who reside in the greater Sydney region
Other NSW Residents – Attendees who reside within New South Wales, but not in
Sydney
Interstate and Overseas Residents – Attendees who reside out-of-state
It is important to segment the customer groups as this enables IER to determine expenditure by
‘locals’ and direct in-scope expenditure. Furthermore, it allows for a separate analysis of the economic
impact of the ID13 on the Sydney economy.
Field staff were sent to each of the three days of ID13 and distributed within the different areas of the
racetrack. Events such as ID13 are not able to quantify the exact population demographics of their
audience. They must, therefore, rely upon the sampling process to deliver the information that is
ultimately used to define the audience.
In order to deliver a sample that can represent the population, a random sampling process was
undertaken on each of the three nights. Field staff were instructed to approach attendees randomly
by making contact with every third person.
At this stage, field staff asked the attendee if they would be happy to complete a survey about their
attendance at ID13. Attendees were interviewed immediately by way of a face-to-face survey. In
total, IER field staff collected 606 surveys from attendees across the three race events. When taking
into consideration the number of individuals who attended the three nights of the ID13 (11,824), this
represents a confidence interval of 3.88 at a confidence level of 95%.
Analysing Attendee Data
Once the surveys were all collated and entered into the database, IER cleansed the data to ensure a
high level of quality control of the information received. Analysis was then undertaken and data
segmented into visitor origins. Care was taken to identify and assess package visitors within the
sample.
Data Received from Harness Racing NSW
The customer data was then supplemented by actual event data provided by Harness Racing NSW
(HRNSW). This data included:-
Wagering turnover
Attendances (split by the four race events)
On-Course Revenues
Details of non-racing social events held
Interstate and International Participant Data
STRATEGY / PLANNING / RESEARCH
Harness Racing Australia: Economic Impact of the 2013 tab.com.au Inter Dominion Championship 10
IER utilises a combination of attendee data and actual race club/industry data in the calculation of
economic impacts within this study.
2.3 Economic Methodology
The assessment of economic impacts accruing from ID13 has been determined utilising a regional
input output (IO) model. It was determined that the IO approach was best suited to an event of this
size. This model is based on an IO table (often referred to as the transaction table) that shows, in value
terms, the supply and usage of goods and services within an economy or a region over a particular
period. A row of an IO table exhibits usage by dependent industries and final demand categories of
the output of each industry. The transaction table gives details of primary and intermediate inputs
used in each industry. The table is balanced, as total inputs into each industry must be equal to total
outputs. The advantage of using an IO table is that it allows the calculation of a set of disaggregated
multipliers to measure the economic impact of an economic stimulus, such as unit increase in final
demand, on output, value added, income and employment. The increase in final demand is normally
measured in value terms, such as an increase of one dollar in sales to final demand by an industry.
The IO tables generate two types of multipliers. Type I multipliers measure the direct and indirect
effects (on income or output) resulting from a unit increase in final demand for a particular industry.
Type I multipliers take no account of induced income effects. In general, Type I multipliers take into
account the initial impact (direct impact) on final demand and the additional output required from
other industries in the economy (or region) needed to supply the additional demand of the industry
receiving the initial impact (this is also called industry support). The industry support multipliers
account for the flow-on effects that occur as the initially impacted industry changes its demand for
inputs required from other industries. Therefore, Type I multipliers capture the initial impact (direct
impact) plus the flow-on effects due to the change in input demands by the supporting industries
leading to additional activities.
Type II multipliers represent the type I impact plus the flow-on effects of subsequent rounds of
consumer spending that results from the increase in household income (the consumption induced
effect). It is generally believed that Type II multipliers overstate the true impact of a change to the final
demand.
STRATEGY / PLANNING / RESEARCH
Harness Racing Australia: Economic Impact of the 2013 tab.com.au Inter Dominion Championship 11
3. Attendance Demographics /
3.1 Gender
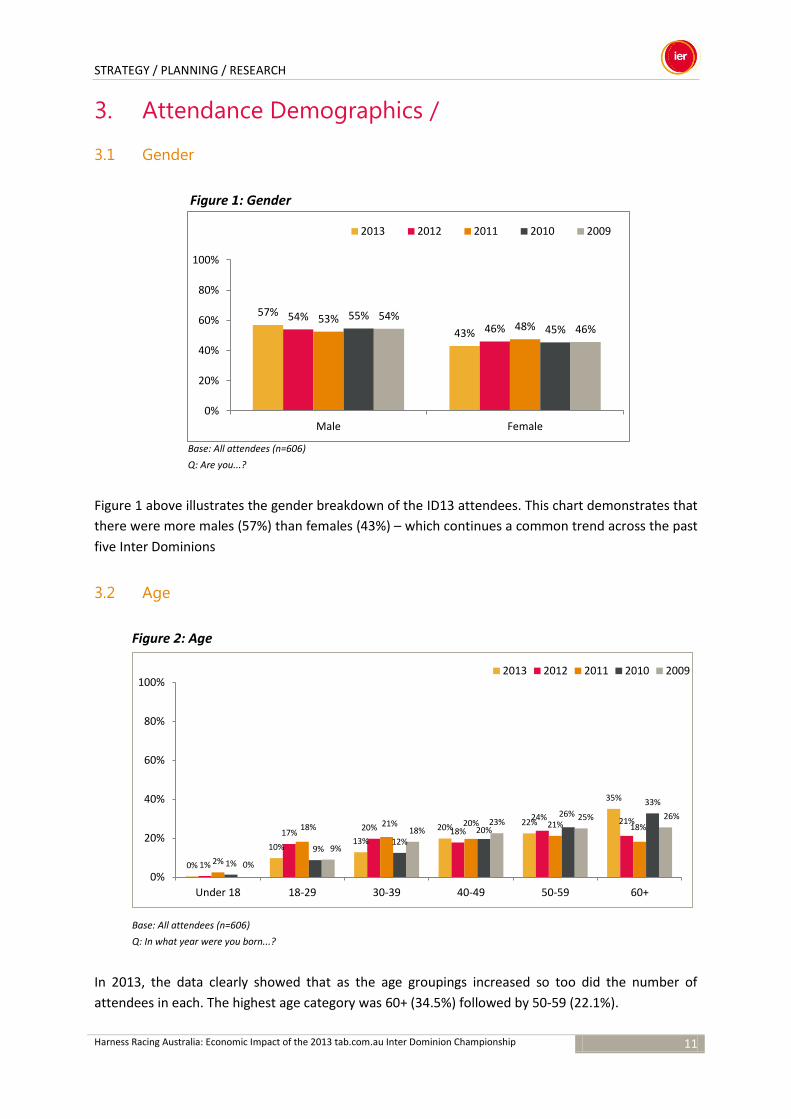
Figure 1: Gender
Base: All attendees (n=606)
Q: Are you...?
Figure 1 above illustrates the gender breakdown of the ID13 attendees. This chart demonstrates that
there were more males (57%) than females (43%) – which continues a common trend across the past
five Inter Dominions
3.2 Age
Figure 2: Age
Base: All attendees (n=606)
Q: In what year were you born...?
In 2013, the data clearly showed that as the age groupings increased so too did the number of
attendees in each. The highest age category was 60+ (34.5%) followed by 50-59 (22.1%).
57%
43%
54% 46%
53% 48%
55% 45%
54% 46%
0%
20%
40%
60%
80%
100%
Male Female
2013 2012 2011 2010 2009
0%
10% 13%
20% 22%
35%
1%
17% 20% 18%
24% 21%
2%
18% 21% 20% 21% 18%
1%
9% 12%
20%
26% 33%
0%
9%
18% 23%
25% 26%
0%
20%
40%
60%
80%
100%
Under 18 18-29 30-39 40-49 50-59 60+
2013 2012 2011 2010 2009
STRATEGY / PLANNING / RESEARCH
Harness Racing Australia: Economic Impact of the 2013 tab.com.au Inter Dominion Championship 12
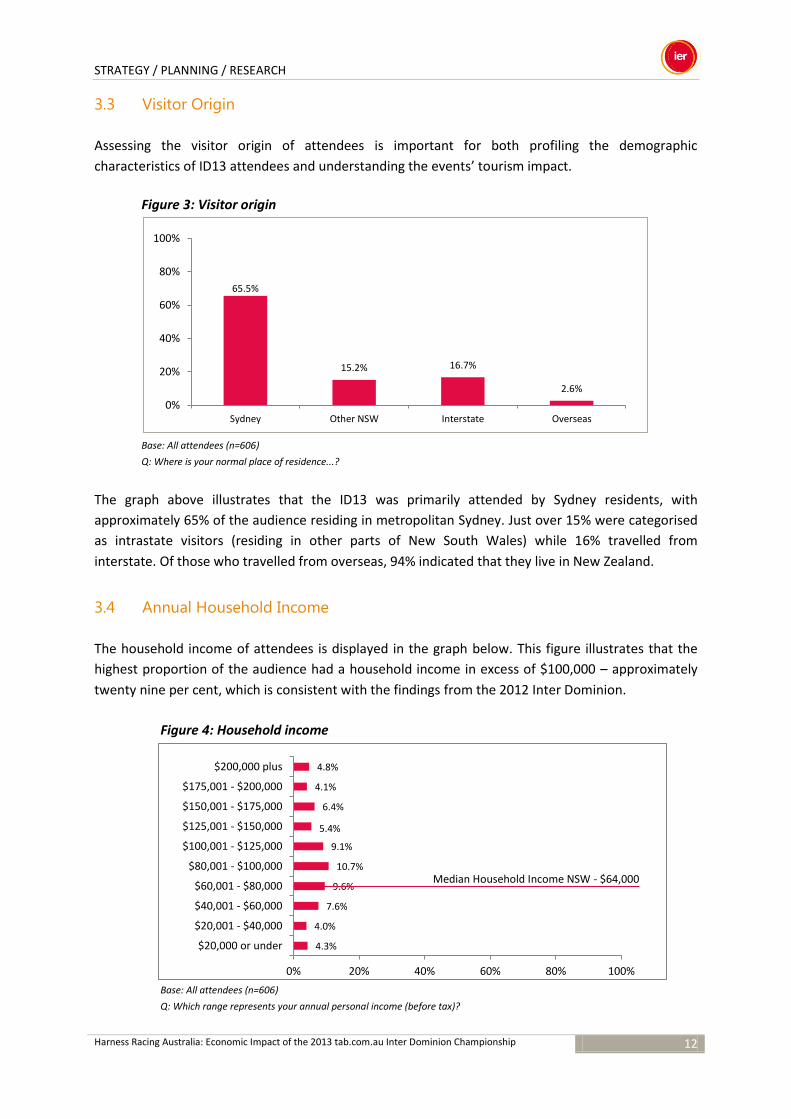
3.3 Visitor Origin
Assessing the visitor origin of attendees is important for both profiling the demographic
characteristics of ID13 attendees and understanding the events’ tourism impact.
Figure 3: Visitor origin
Base: All attendees (n=606)
Q: Where is your normal place of residence...?
The graph above illustrates that the ID13 was primarily attended by Sydney residents, with
approximately 65% of the audience residing in metropolitan Sydney. Just over 15% were categorised
as intrastate visitors (residing in other parts of New South Wales) while 16% travelled from
interstate. Of those who travelled from overseas, 94% indicated that they live in New Zealand.
3.4 Annual Household Income
The household income of attendees is displayed in the graph below. This figure illustrates that the
highest proportion of the audience had a household income in excess of $100,000 – approximately
twenty nine per cent, which is consistent with the findings from the 2012 Inter Dominion.
Figure 4: Household income
Base: All attendees (n=606)
Q: Which range represents your annual personal income (before tax)?
65.5%
15.2% 16.7%
2.6%
0%
20%
40%
60%
80%
100%
Sydney Other NSW Interstate Overseas
4.3%
4.0%
7.6%
9.6%
10.7%
9.1%
5.4%
6.4%
4.1%
4.8%
0% 20% 40% 60% 80% 100%
$20,000 or under
$20,001 - $40,000
$40,001 - $60,000
$60,001 - $80,000
$80,001 - $100,000
$100,001 - $125,000
$125,001 - $150,000
$150,001 - $175,000
$175,001 - $200,000
$200,000 plus
Median Household Income NSW - $64,000
STRATEGY / PLANNING / RESEARCH
Harness Racing Australia: Economic Impact of the 2013 tab.com.au Inter Dominion Championship 13
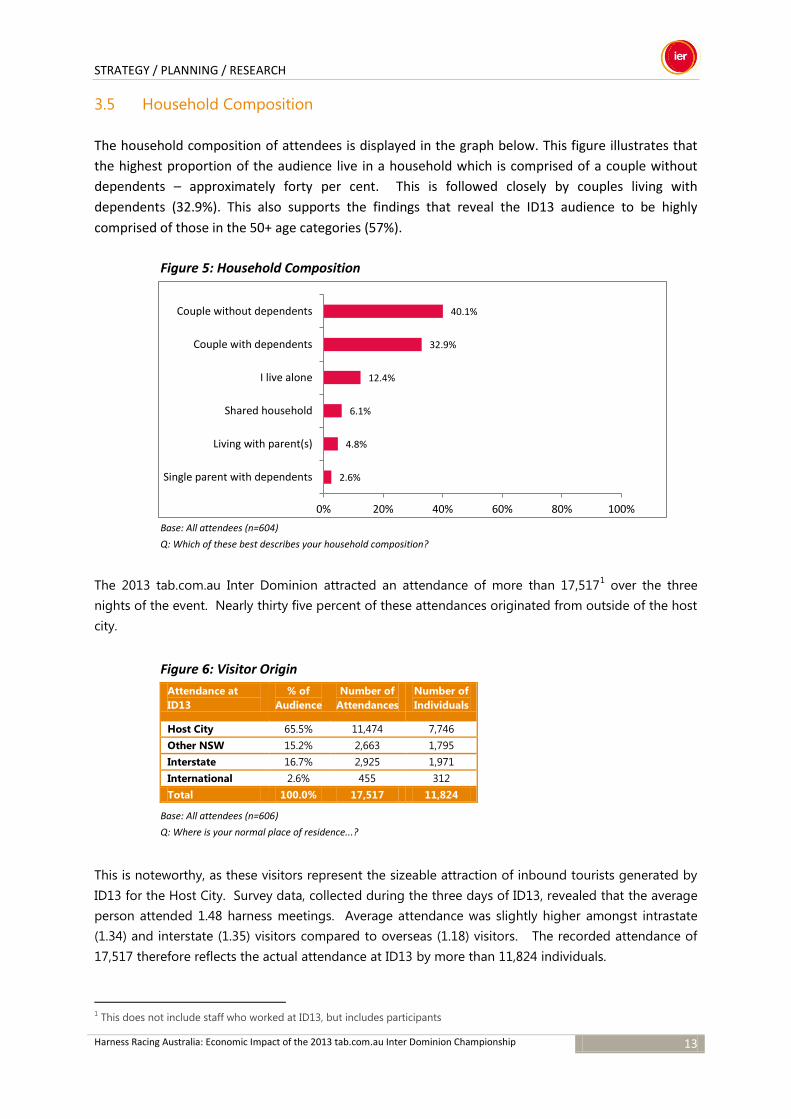
3.5 Household Composition
The household composition of attendees is displayed in the graph below. This figure illustrates that
the highest proportion of the audience live in a household which is comprised of a couple without
dependents – approximately forty per cent. This is followed closely by couples living with
dependents (32.9%). This also supports the findings that reveal the ID13 audience to be highly
comprised of those in the 50+ age categories (57%).
Figure 5: Household Composition
Base: All attendees (n=604)
Q: Which of these best describes your household composition?
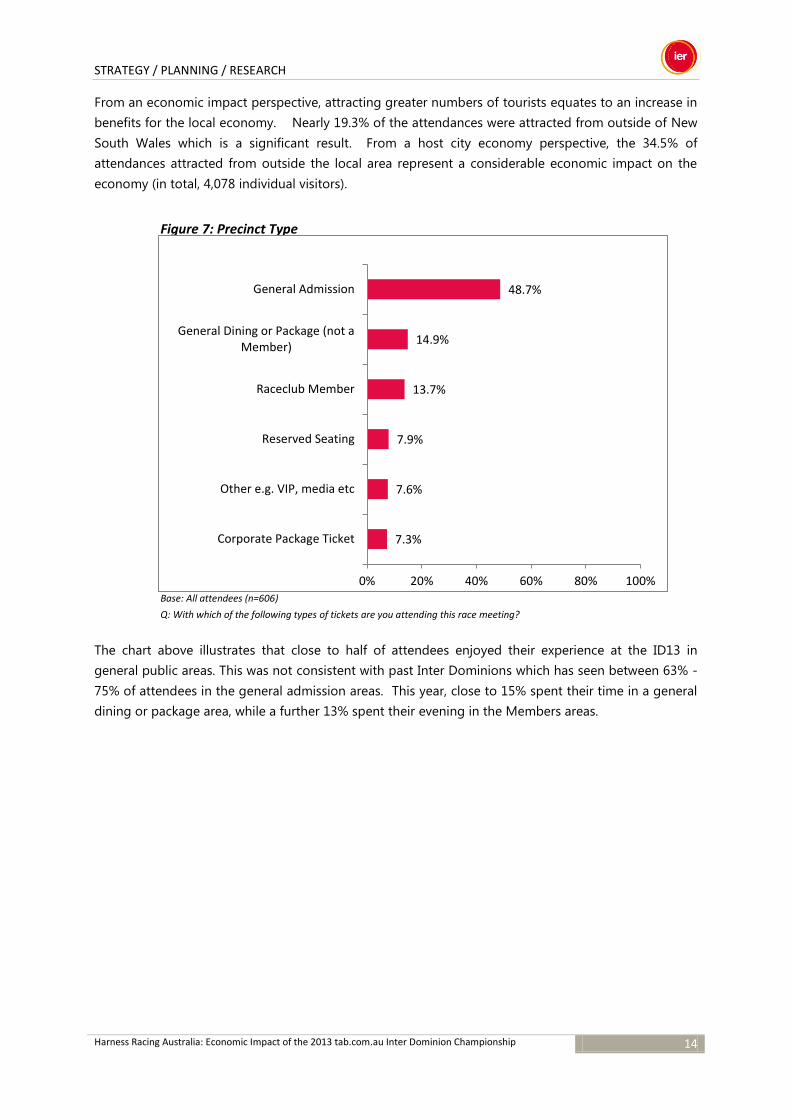
The 2013 tab.com.au Inter Dominion attracted an attendance of more than 17,5171 over the three
nights of the event. Nearly thirty five percent of these attendances originated from outside of the host
city.
Figure 6: Visitor Origin
Base: All attendees (n=606)
Q: Where is your normal place of residence...?
This is noteworthy, as these visitors represent the sizeable attraction of inbound tourists generated by
ID13 for the Host City. Survey data, collected during the three days of ID13, revealed that the average
person attended 1.48 harness meetings. Average attendance was slightly higher amongst intrastate
(1.34) and interstate (1.35) visitors compared to overseas (1.18) visitors. The recorded attendance of
17,517 therefore reflects the actual attendance at ID13 by more than 11,824 individuals.
1 This does not include staff who worked at ID13, but includes participants
Attendance at
ID13
% of
Audience
Number of
Attendances
Number of
Individuals
Host City 65.5% 11,474 7,746
Other NSW 15.2% 2,663 1,795
Interstate 16.7% 2,925 1,971
International 2.6% 455 312
Total 100.0% 17,517 11,824
2.6%
4.8%
6.1%
12.4%
32.9%
40.1%
0% 20% 40% 60% 80% 100%
Single parent with dependents
Living with parent(s)
Shared household
I live alone
Couple with dependents
Couple without dependents
STRATEGY / PLANNING / RESEARCH
Harness Racing Australia: Economic Impact of the 2013 tab.com.au Inter Dominion Championship 14
From an economic impact perspective, attracting greater numbers of tourists equates to an increase in
benefits for the local economy. Nearly 19.3% of the attendances were attracted from outside of New
South Wales which is a significant result. From a host city economy perspective, the 34.5% of
attendances attracted from outside the local area represent a considerable economic impact on the
economy (in total, 4,078 individual visitors).
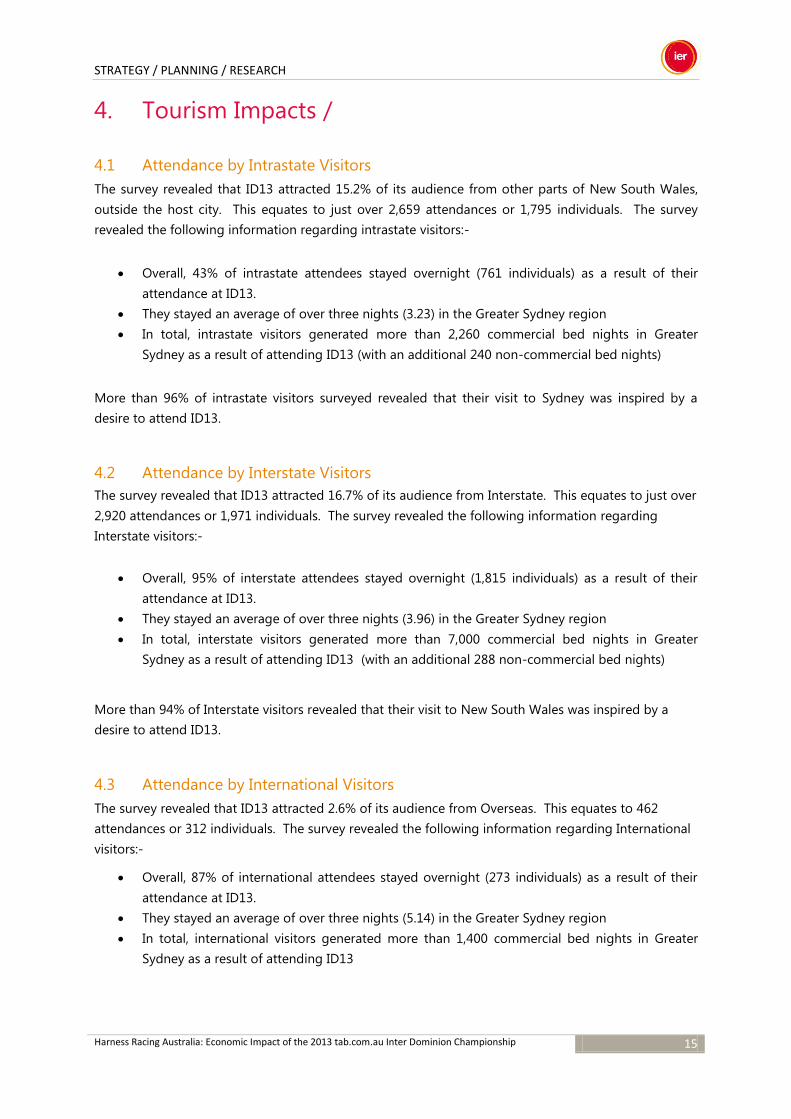
Figure 7: Precinct Type
Base: All attendees (n=606)
Q: With which of the following types of tickets are you attending this race meeting?
The chart above illustrates that close to half of attendees enjoyed their experience at the ID13 in
general public areas. This was not consistent with past Inter Dominions which has seen between 63% -
75% of attendees in the general admission areas. This year, close to 15% spent their time in a general
dining or package area, while a further 13% spent their evening in the Members areas.
7.3%
7.6%
7.9%
13.7%
14.9%
48.7%
0% 20% 40% 60% 80% 100%
Corporate Package Ticket
Other e.g. VIP, media etc
Reserved Seating
Raceclub Member
General Dining or Package (not aMember)
General Admission
STRATEGY / PLANNING / RESEARCH
Harness Racing Australia: Economic Impact of the 2013 tab.com.au Inter Dominion Championship 15
4. Tourism Impacts /
4.1 Attendance by Intrastate Visitors
The survey revealed that ID13 attracted 15.2% of its audience from other parts of New South Wales,
outside the host city. This equates to just over 2,659 attendances or 1,795 individuals. The survey
revealed the following information regarding intrastate visitors:-
Overall, 43% of intrastate attendees stayed overnight (761 individuals) as a result of their
attendance at ID13.
They stayed an average of over three nights (3.23) in the Greater Sydney region
In total, intrastate visitors generated more than 2,260 commercial bed nights in Greater
Sydney as a result of attending ID13 (with an additional 240 non-commercial bed nights)
More than 96% of intrastate visitors surveyed revealed that their visit to Sydney was inspired by a
desire to attend ID13.
4.2 Attendance by Interstate Visitors
The survey revealed that ID13 attracted 16.7% of its audience from Interstate. This equates to just over
2,920 attendances or 1,971 individuals. The survey revealed the following information regarding
Interstate visitors:-
Overall, 95% of interstate attendees stayed overnight (1,815 individuals) as a result of their
attendance at ID13.
They stayed an average of over three nights (3.96) in the Greater Sydney region
In total, interstate visitors generated more than 7,000 commercial bed nights in Greater
Sydney as a result of attending ID13 (with an additional 288 non-commercial bed nights)
More than 94% of Interstate visitors revealed that their visit to New South Wales was inspired by a
desire to attend ID13.
4.3 Attendance by International Visitors
The survey revealed that ID13 attracted 2.6% of its audience from Overseas. This equates to 462
attendances or 312 individuals. The survey revealed the following information regarding International
visitors:-
Overall, 87% of international attendees stayed overnight (273 individuals) as a result of their
attendance at ID13.
They stayed an average of over three nights (5.14) in the Greater Sydney region
In total, international visitors generated more than 1,400 commercial bed nights in Greater
Sydney as a result of attending ID13
STRATEGY / PLANNING / RESEARCH
Harness Racing Australia: Economic Impact of the 2013 tab.com.au Inter Dominion Championship 16
More than 87% of overseas visitors revealed that their visit to New South Wales was inspired by a
desire to attend ID13 – the same amount of people who actually stayed in the Host City during their
trip.
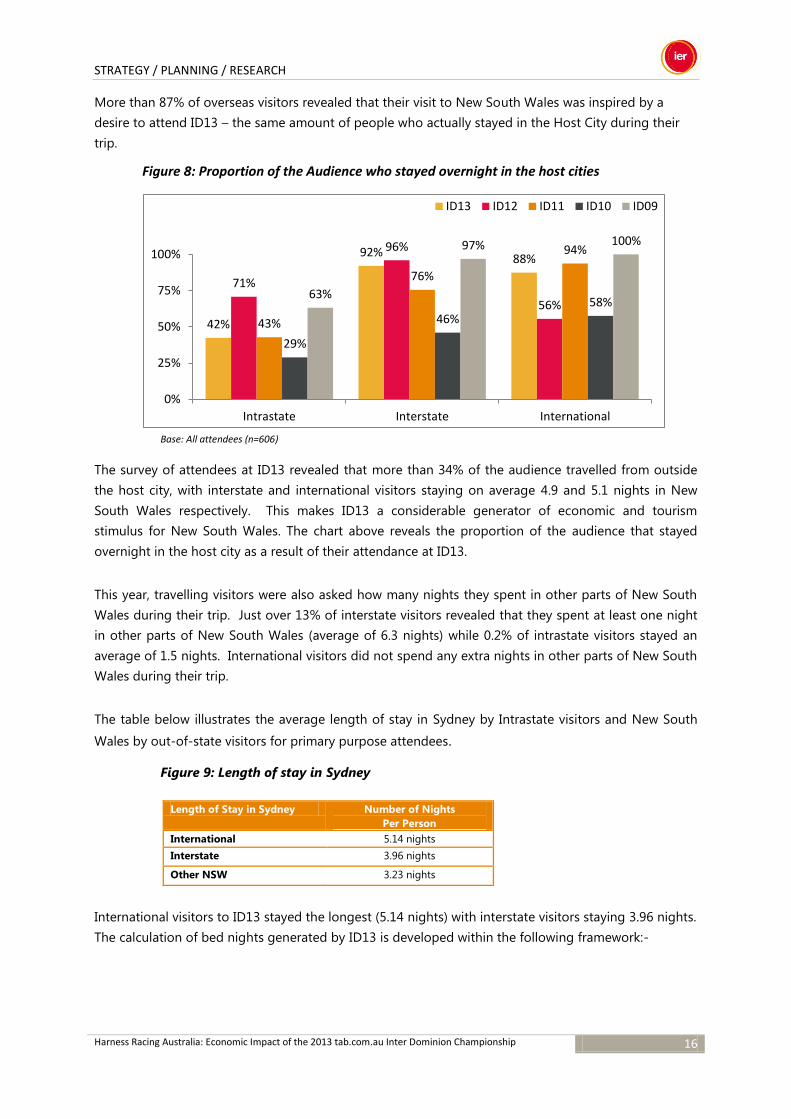
Figure 8: Proportion of the Audience who stayed overnight in the host cities
Base: All attendees (n=606)
The survey of attendees at ID13 revealed that more than 34% of the audience travelled from outside
the host city, with interstate and international visitors staying on average 4.9 and 5.1 nights in New
South Wales respectively. This makes ID13 a considerable generator of economic and tourism
stimulus for New South Wales. The chart above reveals the proportion of the audience that stayed
overnight in the host city as a result of their attendance at ID13.
This year, travelling visitors were also asked how many nights they spent in other parts of New South
Wales during their trip. Just over 13% of interstate visitors revealed that they spent at least one night
in other parts of New South Wales (average of 6.3 nights) while 0.2% of intrastate visitors stayed an
average of 1.5 nights. International visitors did not spend any extra nights in other parts of New South
Wales during their trip.
The table below illustrates the average length of stay in Sydney by Intrastate visitors and New South
Wales by out-of-state visitors for primary purpose attendees.
Figure 9: Length of stay in Sydney
International visitors to ID13 stayed the longest (5.14 nights) with interstate visitors staying 3.96 nights.
The calculation of bed nights generated by ID13 is developed within the following framework:-
Length of Stay in Sydney Number of Nights
Per Person
International 5.14 nights
Interstate 3.96 nights
Other NSW 3.23 nights
42%
92% 88%
71%
96%
56%
43%
76%
94%
29%
46%
58% 63%
97% 100%
0%
25%
50%
75%
100%
Intrastate Interstate International
ID13 ID12 ID11 ID10 ID09
STRATEGY / PLANNING / RESEARCH
Harness Racing Australia: Economic Impact of the 2013 tab.com.au Inter Dominion Championship 17
An assessment of the entire length of stay in the host city by those visitors who indicated that
ID13 was the primary reason for their visit to the host city,
An assessment of the extended length of stay generated by the event. Within the audience,
there were visitors who revealed that they had travelled to NSW for reasons other than ID13,
but made the decision to attend the event at some time during their stay. Their expenditure
and travel impacts can only be included within the ID13 economic impact assessment where
they subsequently change their plans to stay longer. This was a very small segment within the
ID13 audience (and limited to interstate attendees).
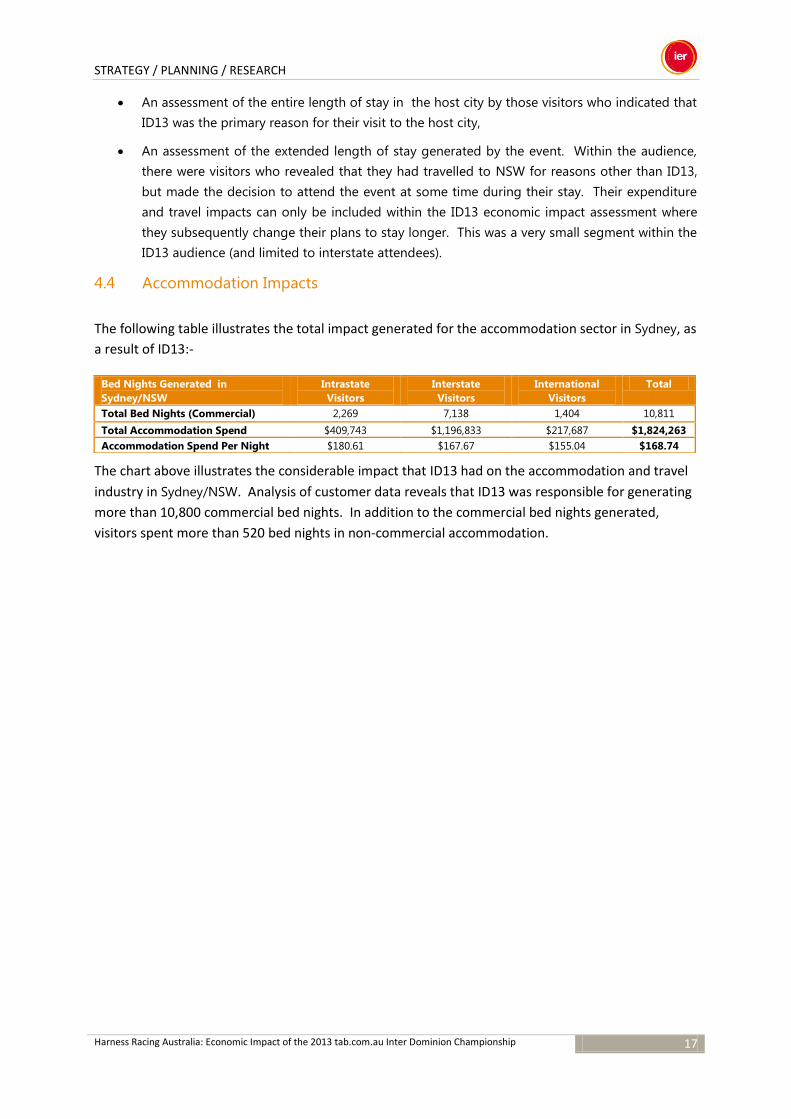
4.4 Accommodation Impacts
The following table illustrates the total impact generated for the accommodation sector in Sydney, as
a result of ID13:-
The chart above illustrates the considerable impact that ID13 had on the accommodation and travel
industry in Sydney/NSW. Analysis of customer data reveals that ID13 was responsible for generating
more than 10,800 commercial bed nights. In addition to the commercial bed nights generated,
visitors spent more than 520 bed nights in non-commercial accommodation.
Bed Nights Generated in
Sydney/NSW
Intrastate
Visitors
Interstate
Visitors
International
Visitors
Total
Total Bed Nights (Commercial) 2,269 7,138 1,404 10,811
Total Accommodation Spend $409,743 $1,196,833 $217,687 $1,824,263
Accommodation Spend Per Night $180.61 $167.67 $155.04 $168.74
STRATEGY / PLANNING / RESEARCH
Harness Racing Australia: Economic Impact of the 2013 tab.com.au Inter Dominion Championship 18
5. Advertising Recall and Attendance Motivations /
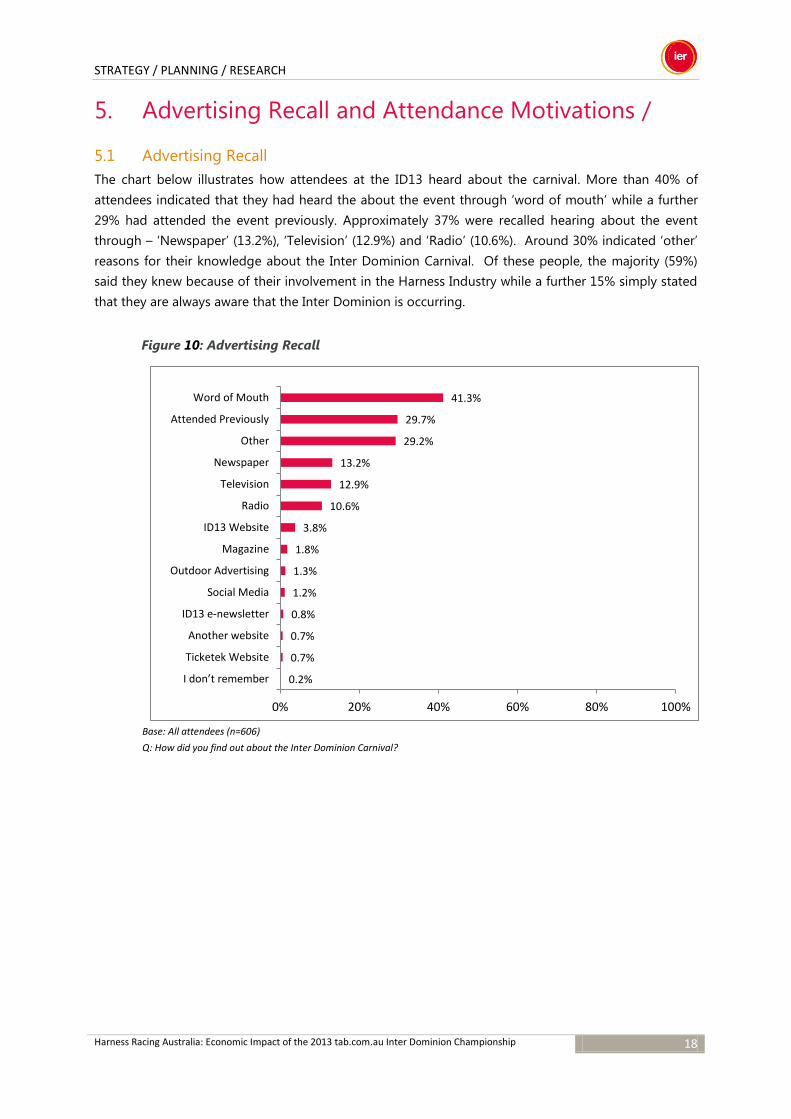
5.1 Advertising Recall
The chart below illustrates how attendees at the ID13 heard about the carnival. More than 40% of
attendees indicated that they had heard the about the event through ‘word of mouth’ while a further
29% had attended the event previously. Approximately 37% were recalled hearing about the event
through – ‘Newspaper’ (13.2%), ‘Television’ (12.9%) and ‘Radio’ (10.6%). Around 30% indicated ‘other’
reasons for their knowledge about the Inter Dominion Carnival. Of these people, the majority (59%)
said they knew because of their involvement in the Harness Industry while a further 15% simply stated
that they are always aware that the Inter Dominion is occurring.
Figure 10: Advertising Recall
Base: All attendees (n=606)
Q: How did you find out about the Inter Dominion Carnival?
0.2%
0.7%
0.7%
0.8%
1.2%
1.3%
1.8%
3.8%
10.6%
12.9%
13.2%
29.2%
29.7%
41.3%
0% 20% 40% 60% 80% 100%
I don’t remember
Ticketek Website
Another website
ID13 e-newsletter
Social Media
Outdoor Advertising
Magazine
ID13 Website
Radio
Television
Newspaper
Other
Attended Previously
Word of Mouth
STRATEGY / PLANNING / RESEARCH
Harness Racing Australia: Economic Impact of the 2013 tab.com.au Inter Dominion Championship 19
6. Customer Advocacy / 6.1 Net Promoter Score
The Net Promoter Score (NPS) allows for the measurement of performance through the eyes of the
attendees. It is based on the view that all attendees can be segmented into one of three categories:
Promoters, Passives and Detractors. This classification was undertaken in this study by asking
attendees one question – how likely is it that you will recommend attending the ID13 to a friend,
family member or colleague? Attendees responded using a 0-10 point rating scale and attendees were
categorised in the following manner:
Promoters (rating score 9-10) are classified as loyal enthusiasts who will keep attending and
refer others, fuelling growth.
Passives (score 7-8) are satisfied but unenthusiastic customers who are vulnerable to
competitive offerings.
Detractors (score 0-6) are unhappy attendees who can damage the ID13 brand and hinder
growth through negative word-of-mouth.
The NPS is calculated by subtracting the percentage of Detractors from the percentage of Promoters.
The difference between the two percentages is the NPS. The ultimate aim over time is to increase the
percentage of Promoters, whilst decreasing the percentage of Detractors, thus increasing the NPS and
positive word of mouth about the event.
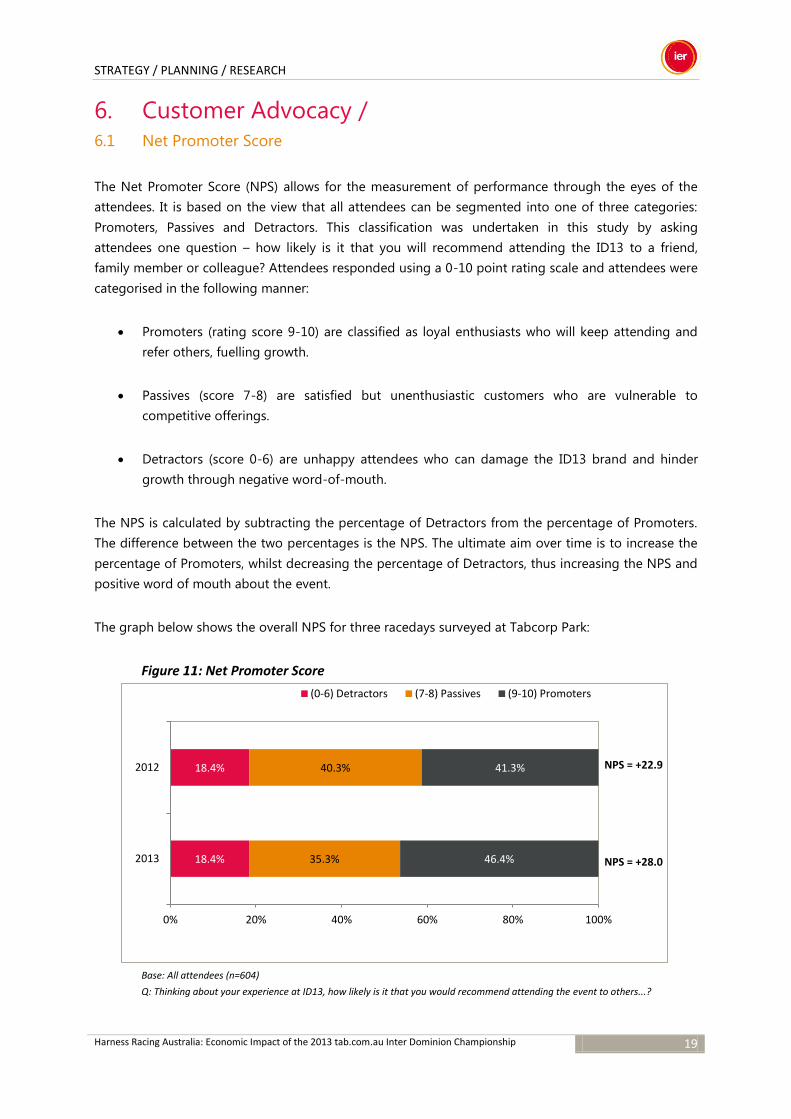
The graph below shows the overall NPS for three racedays surveyed at Tabcorp Park:
Figure 11: Net Promoter Score
Base: All attendees (n=604)
Q: Thinking about your experience at ID13, how likely is it that you would recommend attending the event to others...?
18.4%
18.4%
35.3%
40.3%
46.4%
41.3%
0% 20% 40% 60% 80% 100%
2013
2012
(0-6) Detractors (7-8) Passives (9-10) Promoters
NPS = +28.0
NPS = +22.9

STRATEGY / PLANNING / RESEARCH
Harness Racing Australia: Economic Impact of the 2013 tab.com.au Inter Dominion Championship 20
The aggregate NPS score achieved for the three racedays was +28.0. This result demonstrates that
there are more people spreading positive word of mouth about their experience than those spreading
negative word of mouth. Furthermore, it compares positively with the NPS achieved for the Perth
Interdominion in 2012 (+22.9).
STRATEGY / PLANNING / RESEARCH
Harness Racing Australia: Economic Impact of the 2013 tab.com.au Inter Dominion Championship 21
7. Economic Impacts of ID13/
7.1 Direct Spending Impacts
Events generate economic impacts primarily through two key areas:-
Spending generated by/at the event
Spending made by tourists who were attracted to visit the region in order to attend the event
Whilst some economic methodologies also determine that there can be an extended stay effect (i.e. a
tourist who did not travel primarily to attend the event, but subsequently decided to stay longer than
planned to attend the event), this was found to be minimal in the case of ID13.
It is important also to recognise the importance of approaches such as packaging. The study
incorporated an analysis of travel package visitors whose length of stay and overall spending levels are
generally higher than most other tourists.
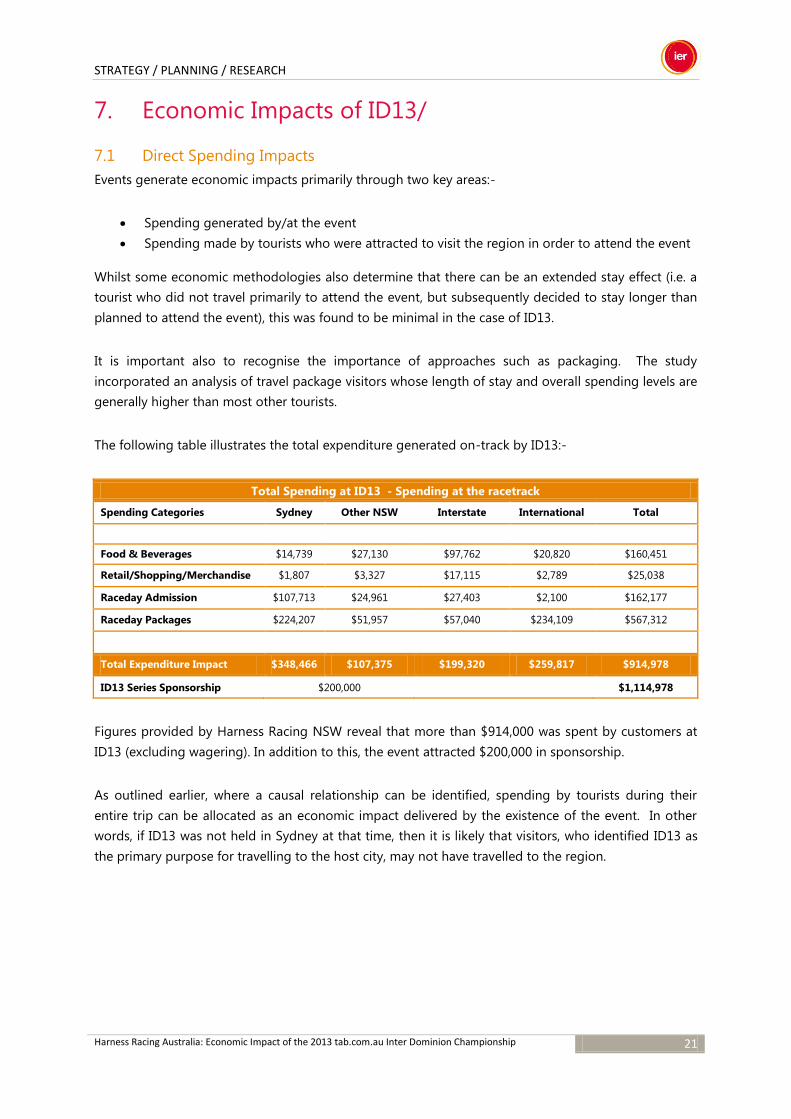
The following table illustrates the total expenditure generated on-track by ID13:-
Total Spending at ID13 - Spending at the racetrack
Spending Categories Sydney Other NSW Interstate International Total
Food & Beverages $14,739 $27,130 $97,762 $20,820 $160,451
Retail/Shopping/Merchandise $1,807 $3,327 $17,115 $2,789 $25,038
Raceday Admission $107,713 $24,961 $27,403 $2,100 $162,177
Raceday Packages $224,207 $51,957 $57,040 $234,109 $567,312
Total Expenditure Impact $348,466 $107,375 $199,320 $259,817 $914,978
Total Expenditure Impact $348,466 $107,375 $199,320 $259,817 $914,978
ID13 Series Sponsorship $200,000
$1,114,978
Figures provided by Harness Racing NSW reveal that more than $914,000 was spent by customers at
ID13 (excluding wagering). In addition to this, the event attracted $200,000 in sponsorship.
As outlined earlier, where a causal relationship can be identified, spending by tourists during their
entire trip can be allocated as an economic impact delivered by the existence of the event. In other
words, if ID13 was not held in Sydney at that time, then it is likely that visitors, who identified ID13 as
the primary purpose for travelling to the host city, may not have travelled to the region.
STRATEGY / PLANNING / RESEARCH
Harness Racing Australia: Economic Impact of the 2013 tab.com.au Inter Dominion Championship 22
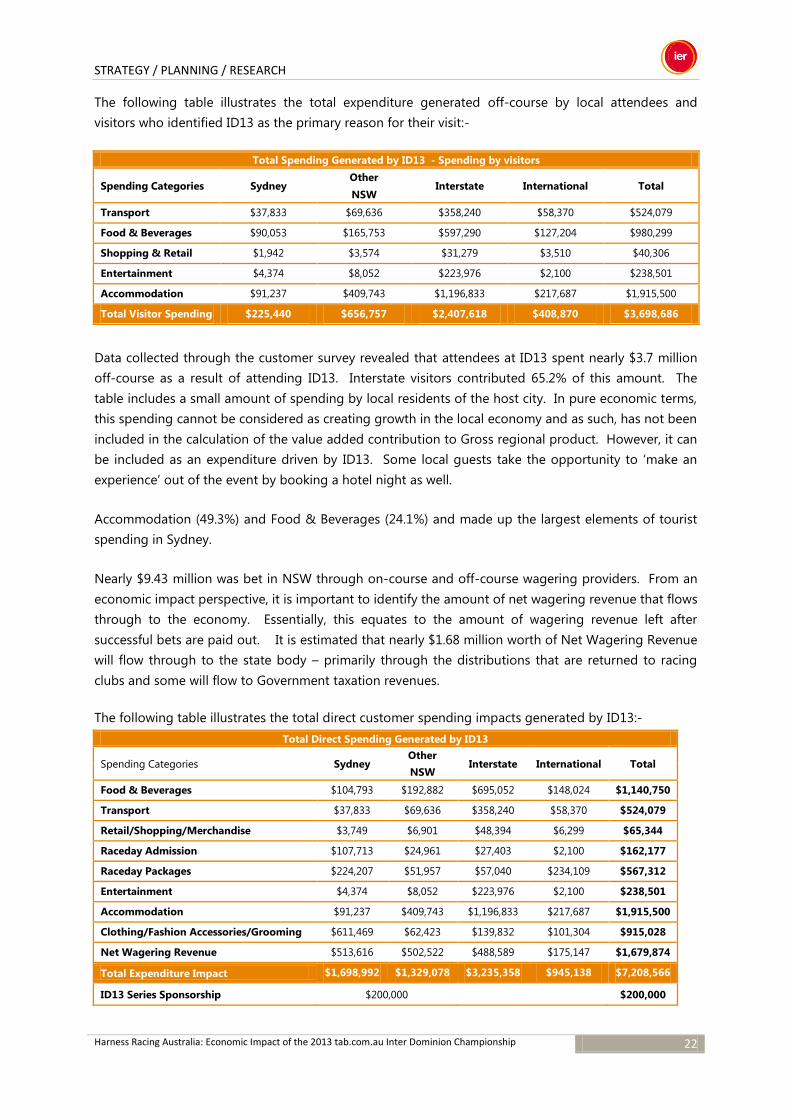
The following table illustrates the total expenditure generated off-course by local attendees and
visitors who identified ID13 as the primary reason for their visit:-
Total Spending Generated by ID13 - Spending by visitors
Spending Categories Sydney Other
Interstate International Total NSW
Transport $37,833 $69,636 $358,240 $58,370 $524,079
Food & Beverages $90,053 $165,753 $597,290 $127,204 $980,299
Shopping & Retail $1,942 $3,574 $31,279 $3,510 $40,306
Entertainment $4,374 $8,052 $223,976 $2,100 $238,501
Accommodation $91,237 $409,743 $1,196,833 $217,687 $1,915,500
Total Visitor Spending $225,440 $656,757 $2,407,618 $408,870 $3,698,686
Data collected through the customer survey revealed that attendees at ID13 spent nearly $3.7 million
off-course as a result of attending ID13. Interstate visitors contributed 65.2% of this amount. The
table includes a small amount of spending by local residents of the host city. In pure economic terms,
this spending cannot be considered as creating growth in the local economy and as such, has not been
included in the calculation of the value added contribution to Gross regional product. However, it can
be included as an expenditure driven by ID13. Some local guests take the opportunity to ‘make an
experience’ out of the event by booking a hotel night as well.
Accommodation (49.3%) and Food & Beverages (24.1%) and made up the largest elements of tourist
spending in Sydney.
Nearly $9.43 million was bet in NSW through on-course and off-course wagering providers. From an
economic impact perspective, it is important to identify the amount of net wagering revenue that flows
through to the economy. Essentially, this equates to the amount of wagering revenue left after
successful bets are paid out. It is estimated that nearly $1.68 million worth of Net Wagering Revenue
will flow through to the state body – primarily through the distributions that are returned to racing
clubs and some will flow to Government taxation revenues.
The following table illustrates the total direct customer spending impacts generated by ID13:-
Total Direct Spending Generated by ID13
Spending Categories Sydney Other
Interstate International Total NSW
Food & Beverages $104,793 $192,882 $695,052 $148,024 $1,140,750
Transport $37,833 $69,636 $358,240 $58,370 $524,079
Retail/Shopping/Merchandise $3,749 $6,901 $48,394 $6,299 $65,344
Raceday Admission $107,713 $24,961 $27,403 $2,100 $162,177
Raceday Packages $224,207 $51,957 $57,040 $234,109 $567,312
Entertainment $4,374 $8,052 $223,976 $2,100 $238,501
Accommodation $91,237 $409,743 $1,196,833 $217,687 $1,915,500
Clothing/Fashion Accessories/Grooming $611,469 $62,423 $139,832 $101,304 $915,028
Net Wagering Revenue $513,616 $502,522 $488,589 $175,147 $1,679,874
Total Expenditure Impact $1,698,992 $1,329,078 $3,235,358 $945,138 $7,208,566
ID13 Series Sponsorship $200,000 $200,000
STRATEGY / PLANNING / RESEARCH
Harness Racing Australia: Economic Impact of the 2013 tab.com.au Inter Dominion Championship 23
Including sponsorship, ID13 was responsible for the generation of more than $7.41 million in total
direct spending in the NSW economy. In addition to this, it is estimated that additional tourism and
travel to other parts of New South Wales delivered a further $1.44 million to the broader New South
Wales economy. This takes the total expenditure impact of ID13 to $8.83 million.
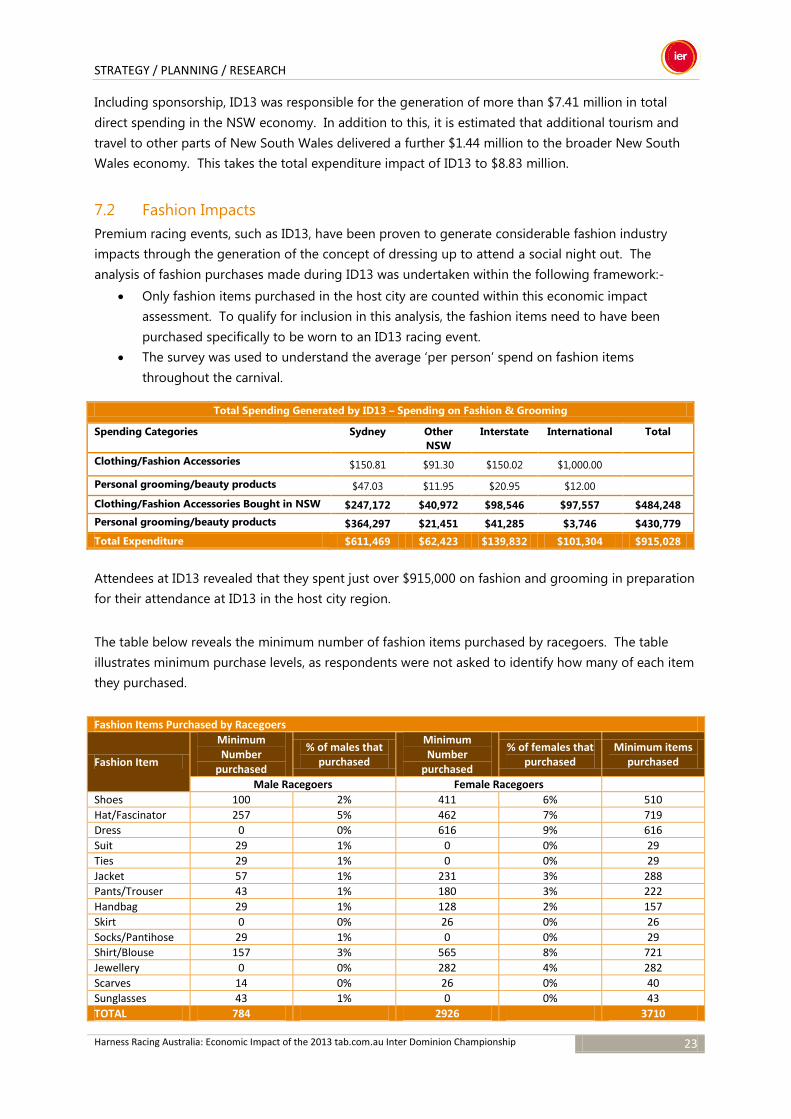
7.2 Fashion Impacts
Premium racing events, such as ID13, have been proven to generate considerable fashion industry
impacts through the generation of the concept of dressing up to attend a social night out. The
analysis of fashion purchases made during ID13 was undertaken within the following framework:-
Only fashion items purchased in the host city are counted within this economic impact
assessment. To qualify for inclusion in this analysis, the fashion items need to have been
purchased specifically to be worn to an ID13 racing event.
The survey was used to understand the average ‘per person’ spend on fashion items
throughout the carnival.
Total Spending Generated by ID13 – Spending on Fashion & Grooming
Spending Categories Sydney Other
NSW
Interstate International Total
Clothing/Fashion Accessories $150.81 $91.30 $150.02 $1,000.00
Personal grooming/beauty products $47.03 $11.95 $20.95 $12.00
Clothing/Fashion Accessories Bought in NSW $247,172 $40,972 $98,546 $97,557 $484,248
Personal grooming/beauty products $364,297 $21,451 $41,285 $3,746 $430,779
Total Expenditure $611,469 $62,423 $139,832 $101,304 $915,028
Attendees at ID13 revealed that they spent just over $915,000 on fashion and grooming in preparation
for their attendance at ID13 in the host city region.
The table below reveals the minimum number of fashion items purchased by racegoers. The table
illustrates minimum purchase levels, as respondents were not asked to identify how many of each item
they purchased.
Fashion Items Purchased by Racegoers
Fashion Item
Minimum Number
purchased
% of males that purchased
Minimum Number
purchased
% of females that purchased
Minimum items purchased
Male Racegoers Female Racegoers
Shoes 100 2% 411 6% 510
Hat/Fascinator 257 5% 462 7% 719
Dress 0 0% 616 9% 616
Suit 29 1% 0 0% 29
Ties 29 1% 0 0% 29
Jacket 57 1% 231 3% 288
Pants/Trouser 43 1% 180 3% 222
Handbag 29 1% 128 2% 157
Skirt 0 0% 26 0% 26
Socks/Pantihose 29 1% 0 0% 29
Shirt/Blouse 157 3% 565 8% 721
Jewellery 0 0% 282 4% 282
Scarves 14 0% 26 0% 40
Sunglasses 43 1% 0 0% 43
TOTAL 784 2926 3710

STRATEGY / PLANNING / RESEARCH
Harness Racing Australia: Economic Impact of the 2013 tab.com.au Inter Dominion Championship 24
In 2013, hats were the most commonly purchased item by men (5.1%), while dresses were again the
most commonly purchased item by women (9.1%).
7.3 Value Added Contribution to Gross Regional Product
Basis of Evaluation
The economic impact analysis of an event focuses on the effect of the event in terms of the creation of
regional incomes and employment. This effect arises through the primary expenditure directly
associated with the event, and from further rounds of indirect expenditure that this direct expenditure
stimulates as it flows to supplying industries and into incomes and consumption.
The economic impact of a special event arises from a number of sources, which are tied in with the
possibility of earning ‘export’ dollars for the region, or the replacement of ‘imports’. The impacts can
be summarised as arising from: -
o Dollars spent within a region by attendees and associated visitors. From a New South Wales
perspective, visitors are attendees from interstate or overseas. This will include expenditure not
only to support the event itself, but expenditure on items such as accommodation and other
entertainment. The main parameters relevant in determining the amount involved will include
average expenditure per day and length of stay. Length of stay data was not collected in this
survey and would be useful to allow comparison with average expenditure relative other events. It
is important to also recognise that if the visit is in place of an alternative visit (and has just been re-
timed or coincided with the event) the expenditure cannot be truly fully claimed as resulting from
the visit. This includes not just the expenditure in the reason, but a proportion of travel
expenditure associated with getting to and from the region.
o Expenditure of locals in the analysis of the economic impact of events is generally assumed to be
transferred from other activities within the region. This assumption means that no benefits
accrues from this type of expenditure, despite the fact that local expenditure represents an
economic choice that is made which suggests that the benefits outweigh the opportunity cost
involved. However in the case of the Adelaide Fringe it could reasonably be expected that in the
absence of the event in New South Wales, a proportion of people would choose to attend the
event outside of the State. This reduction in money flowing out of the state is equally a benefit. It
is indicatively assumed that there attendances at non-ticketed events are not likely to lead to out
of state travel, but that 5% of those who attended ticketed events would lead to this outcome (5%
is an order of magnitude consistent with other events – indeed somewhat conservative).
o Dollars spent within a region based on sponsorship or contribution from parties external to the
region may also be significant and this needs to measured or modelled.
The categorisation of expenditure is consistent with the approach adopted for studies of many special
events over recent times – and has been recognised as the appropriate methodology by the
Commonwealth Government (Standing Committee on Sport and Recreation) and the Bureau of
Tourism Research, and in event management and tourism economics literature internationally.
STRATEGY / PLANNING / RESEARCH
Harness Racing Australia: Economic Impact of the 2013 tab.com.au Inter Dominion Championship 25
The importance of the expenditures identified above is that they will sustain turnover in local industry,
and specifically this will support local jobs and incomes. While the total increase in expenditure is
interpreted as the increase in economic spend in the region, it is the jobs and incomes that are taken
to be the measure of economic impact or benefit, netting out expenditure on imports etc.
It is also generally acknowledged that, in addition to the jobs in direct suppliers to the services (eg the
event itself, hotels, restaurants) that the expenditure has a multiplier effect within the community,
extending the spend effect and the impact through the expenditure of wages and purchases of the
direct suppliers. The use of an input output table or the multipliers derived from input output tables
has become the predominant process for translating the direct expenditure into jobs and incomes, and
for establishing the extent of multiplier impact.
Use of these input-output based multipliers would therefore allow a reporting to the estimated
outcomes of the event in terms of the effect of expenditure or turnover on value added in a regional
economy and in terms of job creation. Again, this methodology is generally recognised as the
appropriate methodology for event analysis, although there an acknowledgement that a Computable
General Equilibrium model (an economy wide model based on underlying input output tables but with
a more advanced framework of demand and supply curves surrounding the economic structure) can
be superior in that it allows for supply constraints. It is suggested here that at the regional level, the
results of a short term shock as in a major event would have little in the way of constraints of this
nature and therefore the input output model results represent a sufficient order of magnitude
estimate.
Further there is a school of thought that suggests the results of either input output or CGE based
analysis does not allow for the fact that job creation comes at an offsetting cost of foregone leisure
time, and therefore impacts should be reduced to reflect this. Given the under-employment
opportunities in the arts and cultural industry and the sense of vitality in this area of employment, this
argument would seem to be limited in this context, even if given credibility in the first instance.
This study of the impact of Interdominion in NSW is undertaken by firstly identifying the expenditures
of the industry – that is the spend on activities, and then applying this expenditure to state input
output tables.
However, as discussed above, some of this gross expenditure is likely to have occurred anyway – if the
event was not held then most locals would choose some other form to spend their money, and some
of the visitors would have made the visit anyway (to visit family, or for some other reason). As such the
gross spend must be discounted. It is assumed that all of the participant expenditure and the
sponsorship is fully linked to the event. However of the local attendees spend (Sydney and Other
NSW) it is assumed that on 20% is additional (that linked to people who would have travelled
interstate to attend a similar event, or those who might spend more in aggregate). The 20%
assumption is based on other event studies that find (though survey) that around 10% of attendees
would have travelled interstate to attend an event if a given major event was held – and it is assumed
that these people spent only ½ of what they would spend in travelling in the actual attendance itself.
High profile events are also a strong drawcard for interstate and international tourism. It is assumed
that 90% of the expenditure above would not have occurred in New South Wales without the event.
These proportions are assumed to be relevant across all categories of attendee expenditure.
STRATEGY / PLANNING / RESEARCH
Harness Racing Australia: Economic Impact of the 2013 tab.com.au Inter Dominion Championship 26
These amounts of expenditure need to be distributed to the industry sector in which they occur, and
then shock the input-output model with the change in demand and trace it through the economy.
The expenditure by participants and sponsorship are distributed based on the basis of the distributions
of the expenditure of harness racing – as identified in the recent IER study on the racing industry. The
attendee expenditure is distributed on the category of the spending. For example food and beverage
spend is allocated 20% to agriculture, 40% to food processing, 15% to retail trade, 20% to food
services and 5% to direct imports. The other expenditure where direct imports are seen as significant
are clothing and general retail – both where 10% of the spend is assumed to be on direct imports.
These aggregated data are converted from purchasers’ prices to basic prices, as the raw data include
margins, taxes and subsidies. All monetary values in the national, NSW I-O models are expressed as
basic values. The prime differences between purchaser prices and basic values are that:
basic values exclude the cost of transport and wholesale and retail trade embedded in the
purchase price (and allocate these to the transport and trade sectors).
GST will be allocated to Gross Operating Surplus
The NSW model adopted in this study is for 2006 and was prepared by Econsearch. The core
assumptions to make the adjustments from purchaser price distributions to basic values are:
The average value added in each of the industry sectors is extracted and then the GST
component (at 10% - which is only paid on the value added) is deducted and separately
identified
The purchaser price is adjusted for the average margin for wholesale, retail and transport
sectors, as identified in the national input output tables
The total expenditures at the state level are then distributed to industry sectors and the resultant value
added, household income and employment outcomes calculated. It is assumed that GST revenue is
directed back to the State – and is used to fund government administration, health and education
expenditures).
The direct impacts are the value added, household income and employment in the industries
supplying the racing industry and the industry itself, calculated using the ratios of the various
measures for the relevant ANZSIC code as identified in the input output table.
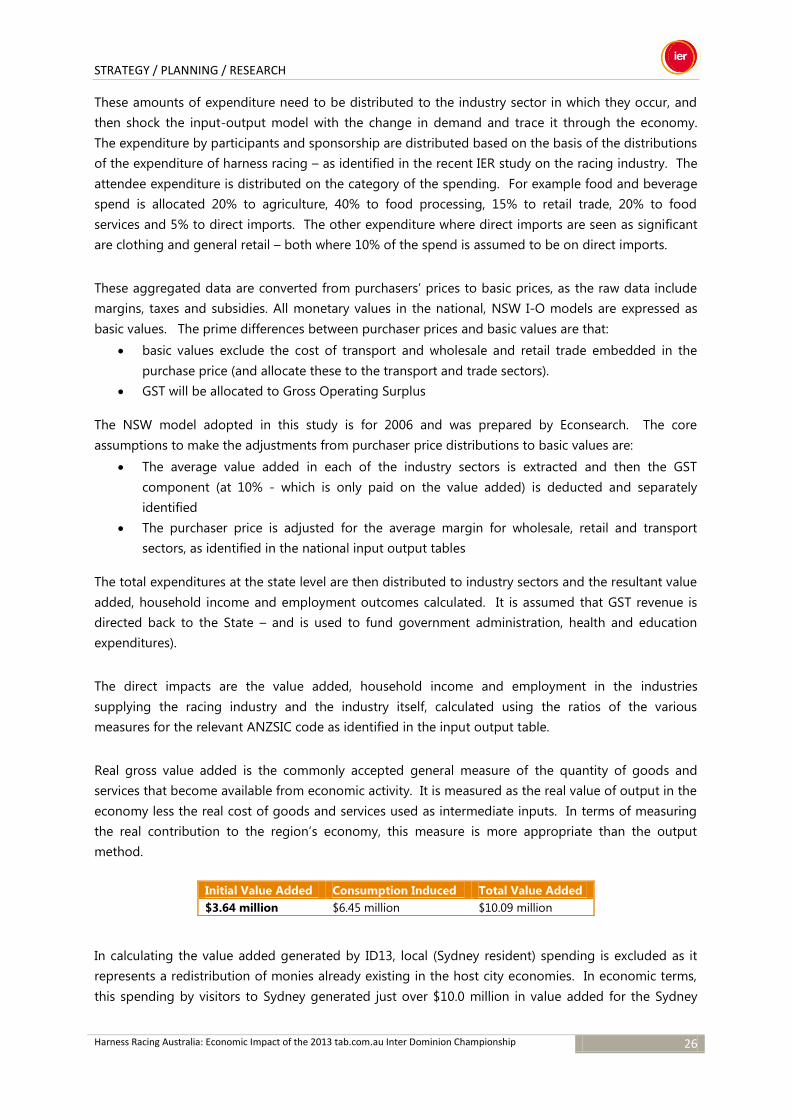
Real gross value added is the commonly accepted general measure of the quantity of goods and
services that become available from economic activity. It is measured as the real value of output in the
economy less the real cost of goods and services used as intermediate inputs. In terms of measuring
the real contribution to the region’s economy, this measure is more appropriate than the output
method.
In calculating the value added generated by ID13, local (Sydney resident) spending is excluded as it
represents a redistribution of monies already existing in the host city economies. In economic terms,
this spending by visitors to Sydney generated just over $10.0 million in value added for the Sydney
Initial Value Added Consumption Induced Total Value Added
$3.64 million $6.45 million $10.09 million
STRATEGY / PLANNING / RESEARCH
Harness Racing Australia: Economic Impact of the 2013 tab.com.au Inter Dominion Championship 27
economy. The $3.64 million reflects the direct and indirect effects resulting from the increase in final
demand generated by ID13. In other words, the direct and indirect impact of attracting non-local
investment (tourists, sponsorship, participants) lead to the growth of the Sydney economies to the
value of $3.64 million. In general, this takes into account the initial impact (direct impact) on final
demand and the additional output required from other industries in the economy (or region) needed
to supply the additional demand of the industry receiving the initial impact (this is also called industry
support). The industry support multipliers account for the flow-on effects that occur as the initially
impacted industry changes its demand for inputs required from other industries.
The consumption induced expenditure represent the direct and indirect impact plus the flow-on
effects of subsequent rounds of consumer spending that results from the increase in household
income (the consumption induced effect). Essentially, this means that as a result of the increased
spending in the host city economies, households generate higher incomes and therefore spend more.
In some ways, this measure can overstate the true economic impact, as it includes spending of monies
that already exist within the host city economies. However, when included in the calculation of the
economic impacts, the total value added generated by ID13 totals nearly $10.1 million.
It is estimated that the economic activity generated by ID13 resulted in the direct and indirect
employment of 47 full time equivalent positions. That is – positions that otherwise may not have been
generated or sustained without the stimulation to final demand. The consumption induced
expenditure resulted in a further 44 positions being employed, leading to a total of 91 full time
equivalent positions being generated by ID13.
7.4 Regional input output (IO) models
IO models play a vital role in the system of national accounts. These models are based on an IO table
(often referred as the transaction table) that shows, in value terms, the supply and usage of goods and
services within an economy or a region over a particular period. A row of an IO table exhibits usage by
dependent industries and final demand categories of the output of each industry. The transaction
table gives details of primary and intermediate inputs used in each industry. The table is balanced, as
total inputs into each industry must be equal to total outputs. The advantage of using an IO table is
that it allows the calculation of a set of disaggregated multipliers to measure the economic impact of
an economic stimulus, such as unit increase in final demand, on output, value added, income and
employment. The increase in final demand is normally measured in value terms, such as an increase of
one dollar in sales to final demand by an industry.
The IO tables generate two types of multipliers. Type I multipliers measure the direct and indirect
effects (on income or output) resulting from a unit increase in final demand for a particular industry.
Type I multipliers take no account of induced income effects. In general, Type I multipliers take into
account the initial impact (direct impact) on final demand and the additional output required from
other industries in the economy (or region) needed to supply the additional demand of the industry
receiving the initial impact (this is also called industry support). The industry support multipliers
account for the flow-on effects that occur as the initially impacted industry changes its demand for
inputs required from other industries. Therefore, Type I multipliers capture the initial impact (direct
STRATEGY / PLANNING / RESEARCH
Harness Racing Australia: Economic Impact of the 2013 tab.com.au Inter Dominion Championship 28
impact) plus the flow-on effects due to the change in input demands by the supporting industries
leading to additional activities.
Type II multipliers represent the type I impact plus the flow-on effects of subsequent rounds of
consumer spending that results from the increase in household income (the consumption induced
effect). Therefore, Type II multipliers take account of induced income effects. It is generally believed
that Type II multipliers overstate the true impact of a change to the final demand. Therefore, the Type
II multipliers may substantially overstate the true impact.
The value added impact measures the net increase in the economic activity resulting directly and
indirectly from a change in demand. Similarly, the income effect measures the impact of the change in
demand on the amount of additional wages, salaries and supplements paid to labour (a component of
value added). The employment multipliers are defined as employment generated per million dollars
from a change in final demand.