Embed Size (px)
Citation preview
Organizations often recognize that there is a significant gap between their strate-
gic plans and their ability to execute them. Many try to implement tools known as
scorecards to solve this problem. Unfortunately, in doing so they often put meas-
ures into place without establishing the cause-and-effect linkages between those
measures and the daily activities that drive them. This paper explores ways to
address this problem, ensuring a successful scorecard implementation.
Strategy Management and the Balanced Scorecard
white paper
Performance Management
Geac....................www.geac.com....................April 2004
Table of Contents
Introduction: The Strategy Gap....................................................................................................................................................................... 3
Scorecards................................................................................................................................................................................................................ 4
Overcoming the Strategy Gap with Geac® Strategy Management .................................................................................................. 6
Clarifying and Translating Vision and Strategy ................................................................................................................................ 6
Communicating and Linking Strategic Objectives and Measures ........................................................................................... 9
Setting Targets and Aligning Strategic Initiatives............................................................................................................................ 11
Enhancing Strategic Feedback and Learning................................................................................................................................... 11
Alternative Approach to the Balanced Scorecard................................................................................................................................ 20
Geac Strategy Management: The Better Solution................................................................................................................................. 22
Business ......................................................................................................................................................................................................... 22
Technology.................................................................................................................................................................................................... 22
Geac’s Balanced Scorecard Capabilities ................................................................................................................................................... 22
Planning Features ...................................................................................................................................................................................... 22
Data Visualization Capabilities............................................................................................................................................................. 22
Integration Capabilities........................................................................................................................................................................... 23
Analysis Capabilities ................................................................................................................................................................................ 23
Technology.................................................................................................................................................................................................... 23
About the Geac Performance Management Suite ................................................................................................................................ 23
About Geac............................................................................................................................................................................................................ 23
Strategy Management and the Balanced Scorecard
2
Introduction: The Strategy GapMost organizations recognize that there is a significantgap between their strategic plans and their ability to exe-cute. Part of the reason for this was shown in a recent sur-vey conducted by CFO Research Services where 60 per-cent of organizations said they were dissatisfied in thealignment between strategy and budgets.1 This alignmentis vital because the budget is often the only enterprise-wide process where users are directed and controlled intheir use of company assets to achieve organizationalobjectives.
But why is this alignment so hard? In the book Competingfor the Future, this disconnect was summed up in thestatement:
“In too many companies there is a grand, andoverly vague, long-term goal on one hand…anddetailed short-term budgets and annual plans onthe other hand …with nothing in between to linkthe two together…. The long term doesn’t start atyear five of the current strategic plan. It startsright now!”2
Today, most organizations rely on the budget process tobridge the gap. Managers are told the results that arerequired for next year and in turn they develop a rev-enue/cost budget to achieve them. But this process isusually devoid of anything to do with strategy, providinglittle direction as to how strategies are to be achieved, lit-tle analysis as to whether budgeting activities make sensegiven the current overall strategic plan, and little thought
for conflicts between activities and resource allocation.Instead, the “how” of strategy management is eitherassumed or, worse still, worked out as the year progress-es and failure looms.
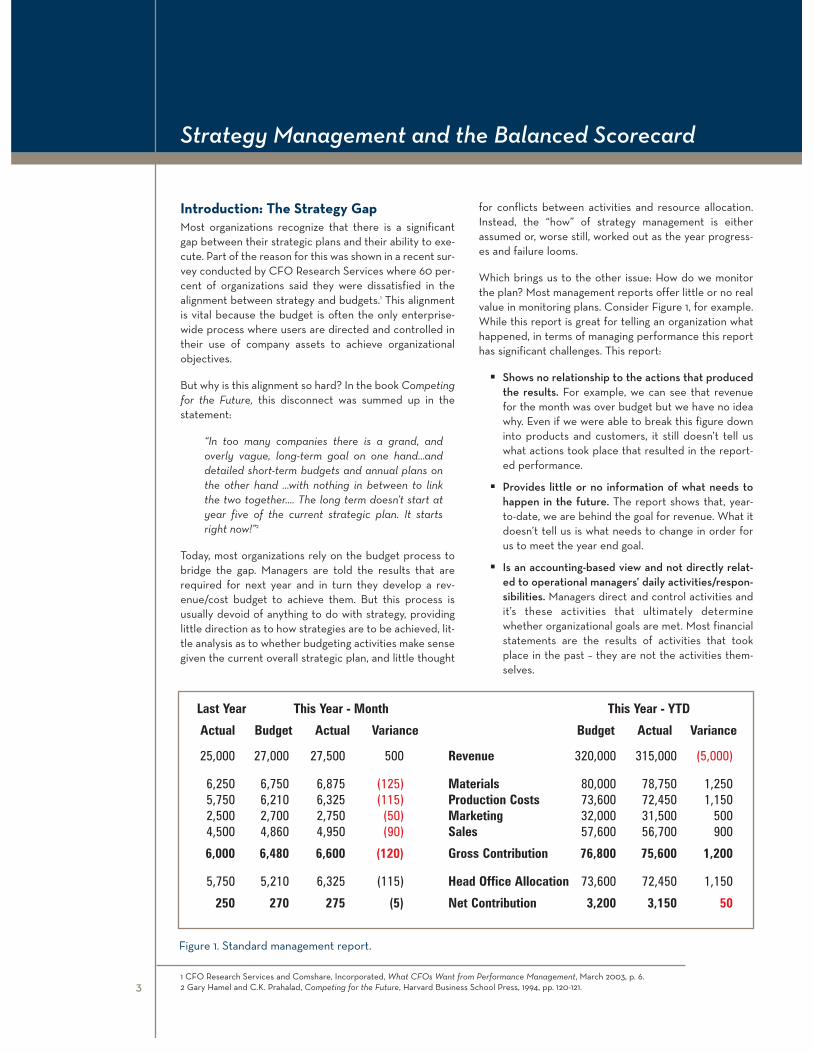
Which brings us to the other issue: How do we monitorthe plan? Most management reports offer little or no realvalue in monitoring plans. Consider Figure 1, for example.While this report is great for telling an organization whathappened, in terms of managing performance this reporthas significant challenges. This report:
� Shows no relationship to the actions that producedthe results. For example, we can see that revenuefor the month was over budget but we have no ideawhy. Even if we were able to break this figure downinto products and customers, it still doesn’t tell uswhat actions took place that resulted in the report-ed performance.
� Provides little or no information of what needs tohappen in the future. The report shows that, year-to-date, we are behind the goal for revenue. What itdoesn’t tell us is what needs to change in order forus to meet the year end goal.
� Is an accounting-based view and not directly relat-ed to operational managers’ daily activities/respon-sibilities. Managers direct and control activities andit’s these activities that ultimately determinewhether organizational goals are met. Most financialstatements are the results of activities that tookplace in the past – they are not the activities them-selves.
Strategy Management and the Balanced Scorecard
3
Figure 1. Standard management report.
Last Year This Year - Month This Year - YTD
Actual Budget Actual Variance Budget Actual Variance
25,000 27,000 27,500 500 Revenue 320,000 315,000 (5,000)
6,250 6,750 6,875 (125) Materials 80,000 78,750 1,250 5,750 6,210 6,325 (115) Production Costs 73,600 72,450 1,150 2,500 2,700 2,750 (50) Marketing 32,000 31,500 500 4,500 4,860 4,950 (90) Sales 57,600 56,700 900
6,000 6,480 6,600 (120) Gross Contribution 76,800 75,600 1,200
5,750 5,210 6,325 (115) Head Office Allocation 73,600 72,450 1,150
250 270 275 (5) Net Contribution 3,200 3,150 50
1 CFO Research Services and Comshare, Incorporated, What CFOs Want from Performance Management, March 2003, p. 6.2 Gary Hamel and C.K. Prahalad, Competing for the Future, Harvard Business School Press, 1994, pp. 120-121.
� Provides no context on what’s happening in the“real world.” Budgets are usually the results of nego-tiations that took place many, many months in thepast. Assuming (and this is a big assumption) thatbudget managers set these budgets based on theprevailing economic environment, if that environ-ment changes, for example a competitor releases amuch improved product/service, then the budgetassumptions are no longer valid. Beating a budgetthat was unrealistic to begin with, does not help inthe slightest an organization who wants to beat themarket.
� Does not tell us if strategy was successful. There is no way of knowing from this report what the strategy of the company was, whether it was actually implemented and if the results reflectedthat implementation. Without this feedback, managers can delude themselves over the causes ofsuccess or failure.
The question facing managers is this: How do we bridgethe gap between strategy and execution?
ScorecardsScorecards are being hailed as the solution to the gapbetween strategy and execution. They are not new. In thelate 1980s, it became apparent that the traditionalapproach to monitoring performance based on financialmeasures such as ROI was no longer appropriate in theincreasingly complex business environment. Initiativessuch as Total Quality Management (TQM) in the U.K. andthe Malcolm Baldrige Quality Award in the U.S. provideda more practical approach to managing performance –one based on a wider range of measures such as quality,strategy, people, and partnerships.
In the early 1990s, many methodologies were developedthat sought to link the different activities, both internaland external, as well as cost and non-cost categories of anorganization to overall performance. The breakthroughmethodology came with Norton and Kaplan’s BalancedScorecard.
Today, organizations realize that to manage performancethey need to take into account a number of businessfacets, including how they deal with customers, managetheir internal processes, and continue to develop innova-tive solutions. This requires a balanced, broad array ofmeasures that need to be planned and monitored. Usersinteract with these measures in the same way that a driver uses a car dashboard.
A car dashboard consists of important “managementinformation” such as speed, engine temperature, and fuelconsumption. Warning lights, or alerts, inform the driverof issues that need attention – for example, low fuel.
To steer, the driver needs to continually gather informa-tion about the road ahead by looking out of the wind-shield and then making continuous adjustments to direc-tion. He or she may plan the route before starting out, butthe driver needs to keep updating this view and actingaccordingly. For example, there may be road works ortraffic jams ahead which need to be avoided if the driveris to arrive at the destination on time. Looking in the rearview mirror doesn’t help that much – in the same way thatreading financial reports doesn’t help an organizationdetermine what it needs to do next to achieve its plannedgoals.
As can be seen from this analogy, the focus needs to bemeasures related to activities that show “How do we getthere?” and “Are we on course?” as well as on the warninglights telling us what is currently happening. And yettoday, most organizations look solely at the warning lights– how close are expenses and revenue to budget – ratherthan focusing on where they want to go and how they aregoing to get there.
In a report prepared by Gartner and Cranfield BusinessSchool3, the authors found that although a balanced set ofmeasures helps make strategy comprehensible toemployees, the implementation of a balanced measure-ment system is a difficult task. It is estimated that:
� Only 5 percent of the workforce understand strategy.
� Only 25 percent of managers have incentives linkedto strategy.
� 85 percent of executives spend less than 1 hour amonth in discussing strategy.
� 60 percent do not link budgets to strategic plans.
The report goes on to say that a tool is needed which con-tains both short- and long-term measures, as well as finan-cial and nonfinancial ones. The tool must be acceptableto all sectors of the workforce; must be easily understoodand communicate overall business strategy; must showthe drivers necessary for long-term results and indicateevery employee’s contribution to overall success; must beeasy to use; must integrate with existing business systems;and must fit in with the overall culture of the organization.
Scorecard solutions were designed to fulfill this role but,unfortunately, the way many of them are implementedmeans they fall short of this purpose.
Strategy Management and the Balanced Scorecard
4 3 Centre for Business Performance, Cranfield School of Management, Automating Your Scorecard, Report Number CRT-5102, October 2003, pp. 12-13.
The Balanced ScorecardThe Balanced Scorecard was developed by Robert Kaplan and David Norton in an attempt to showorganizations how to make strategy become “everyone’severy day job.”
It is a framework that:
� Communicates strategy so that everyone understands the objectives and their role in achieving them.
� Aligns resources to focus on the key drivers of strategy.
� Monitors the execution of strategy by trackingmeasurable results.
The Balanced Scorecard methodology typically communicates strategy across the four perspectives:
1. Financial. What financial returns are required by investors?
2. Customer. What do our customers want?
3. Internal Process. What do we need to do to deliver?
4. Learning and Growth. How do we sustain the business?
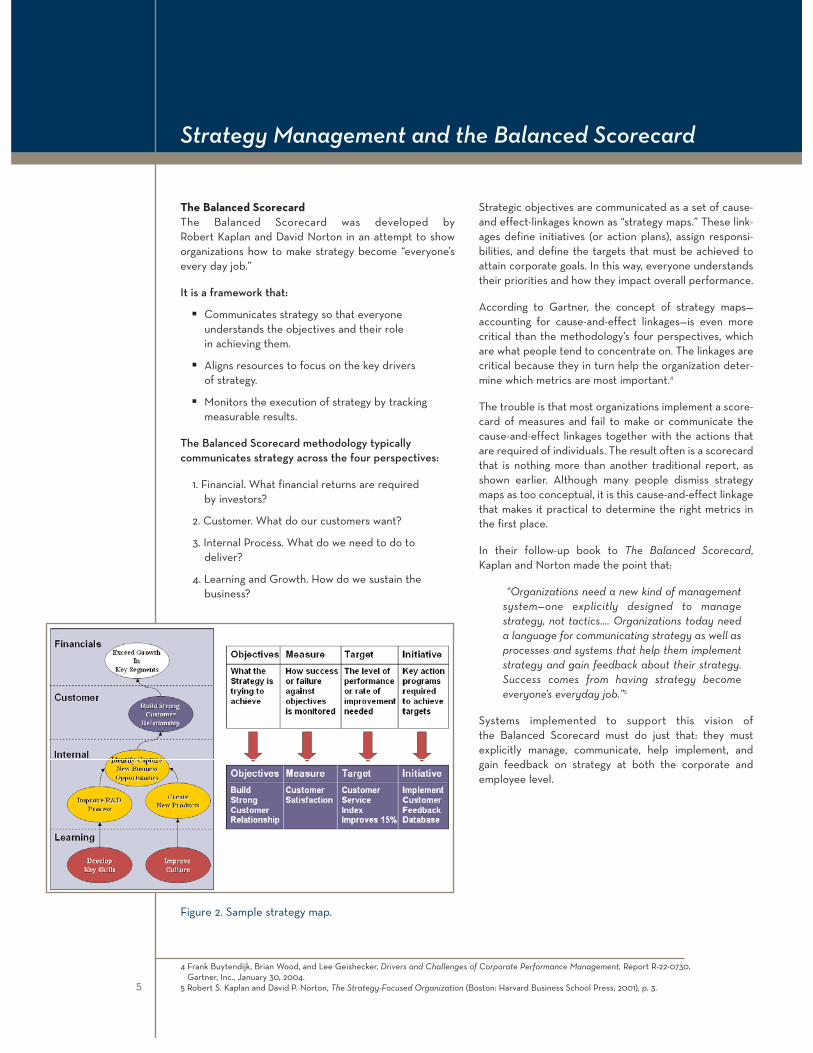
Strategic objectives are communicated as a set of cause-and effect-linkages known as “strategy maps.” These link-ages define initiatives (or action plans), assign responsi-bilities, and define the targets that must be achieved toattain corporate goals. In this way, everyone understandstheir priorities and how they impact overall performance.
According to Gartner, the concept of strategy maps—accounting for cause-and-effect linkages—is even morecritical than the methodology’s four perspectives, whichare what people tend to concentrate on. The linkages arecritical because they in turn help the organization deter-mine which metrics are most important.4
The trouble is that most organizations implement a score-card of measures and fail to make or communicate thecause-and-effect linkages together with the actions thatare required of individuals. The result often is a scorecardthat is nothing more than another traditional report, asshown earlier. Although many people dismiss strategymaps as too conceptual, it is this cause-and-effect linkagethat makes it practical to determine the right metrics inthe first place.
In their follow-up book to The Balanced Scorecard,Kaplan and Norton made the point that:
“Organizations need a new kind of managementsystem—one explicitly designed to manage strategy, not tactics…. Organizations today needa language for communicating strategy as well asprocesses and systems that help them implementstrategy and gain feedback about their strategy.Success comes from having strategy becomeeveryone’s everyday job.”5
Systems implemented to support this vision of the Balanced Scorecard must do just that: they mustexplicitly manage, communicate, help implement, andgain feedback on strategy at both the corporate andemployee level.
Strategy Management and the Balanced Scorecard
5
Figure 2. Sample strategy map.
4 Frank Buytendijk, Brian Wood, and Lee Geishecker, Drivers and Challenges of Corporate Performance Management, Report R-22-0730,Gartner, Inc., January 30, 2004.
5 Robert S. Kaplan and David P. Norton, The Strategy-Focused Organization (Boston: Harvard Business School Press, 2001), p. 3.
Overcoming the Strategy Gap with Geac® Strategy ManagementTo overcome the gap between strategy and execution, ascorecard solution must support a number of manage-ment processes. The critical processes outlined by theCranfield School of Business are:
� Clarifying and translating the vision and strategy
� Communicating and linking the strategic objectivesand measures
� Planning and setting targets and aligning strategicinitiatives
� Enhancing strategic feedback and learning6
Performing these processes requires a system that sup-ports the enterprise-wide development of operationalplans that are clearly linked to high-level organizationalgoals. Let’s take a look at these critical processes in moredetail and see how one solution – Geac® StrategyManagement – supports those activities.
Clarifying and Translating Vision and Strategy The development of a strategic plan typically begins withreviewing current performance. This review requires sys-tems that support the detailed analysis of activities andresults. From this analysis, senior management develops ahigh-level financial plan, which in a profit-driven companywould show the returns expected by investors in themedium to long term. Armed with this information, seniormanagement can now communicate to operational man-agement the high-level goals to be achieved and thestrategic themes to be adopted – for example, “focus ondeveloping existing customer relationships.”
Geac Strategy Management is a unique and innovativesolution for implementing management systems thatdevelop, communicate, monitor, and assess the imple-mentation of strategy. It was designed to support a rangeof methodologies, including the Balanced Scorecard. Thesolution also allows organizations to customize a method-ology to suit their needs.
Once installed, users can select the Balanced Scorecardoption. Geac Strategy Management will then display therelevant building blocks of a plan. These are known as“plan objects” and reflect the different components ofthe Balanced Scorecard (Figure 3). When creating aBalanced Scorecard, the perspective (financial, customer,internal, and learning and growth) will be assigned to eachobject.
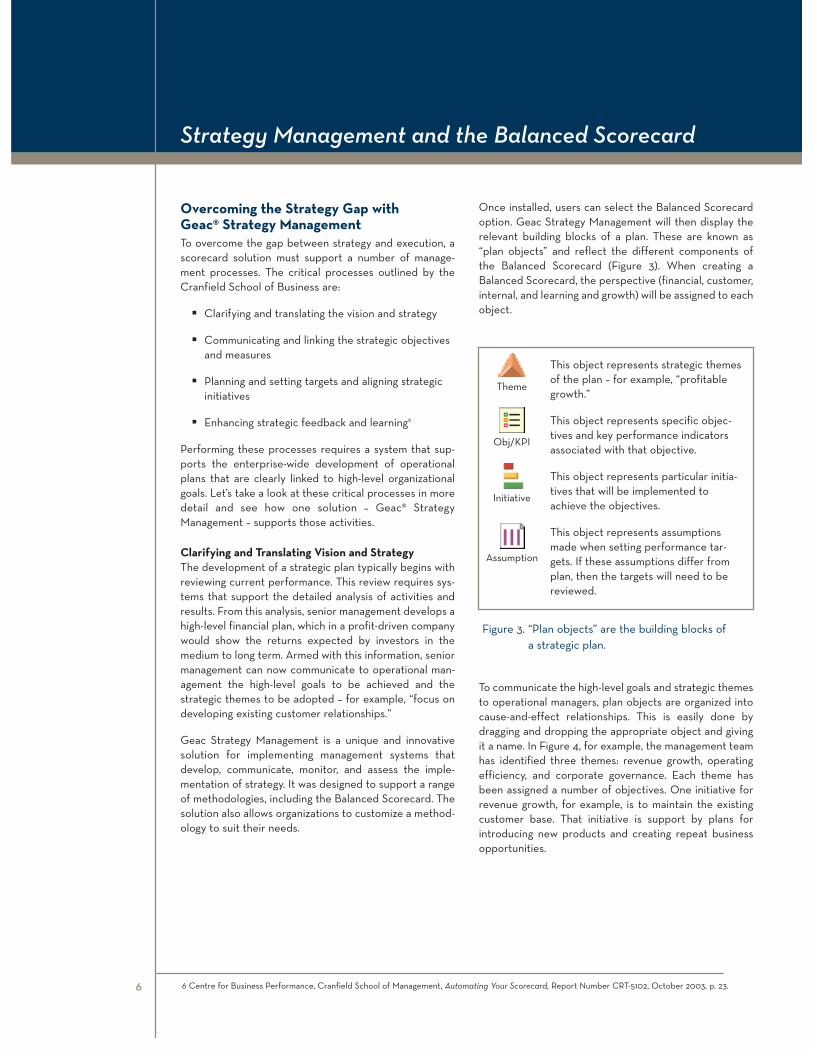
To communicate the high-level goals and strategic themesto operational managers, plan objects are organized intocause-and-effect relationships. This is easily done bydragging and dropping the appropriate object and givingit a name. In Figure 4, for example, the management teamhas identified three themes: revenue growth, operatingefficiency, and corporate governance. Each theme hasbeen assigned a number of objectives. One initiative forrevenue growth, for example, is to maintain the existingcustomer base. That initiative is support by plans forintroducing new products and creating repeat businessopportunities.
Strategy Management and the Balanced Scorecard
6 6 Centre for Business Performance, Cranfield School of Management, Automating Your Scorecard, Report Number CRT-5102, October 2003, p. 23.
This object represents strategic themesof the plan – for example, “profitablegrowth.”
This object represents specific objec-tives and key performance indicatorsassociated with that objective.
This object represents particular initia-tives that will be implemented toachieve the objectives.
This object represents assumptionsmade when setting performance tar-gets. If these assumptions differ fromplan, then the targets will need to bereviewed.
Theme
Obj/KPI
Initiative
Assumption
Figure 3. “Plan objects” are the building blocks of a strategic plan.
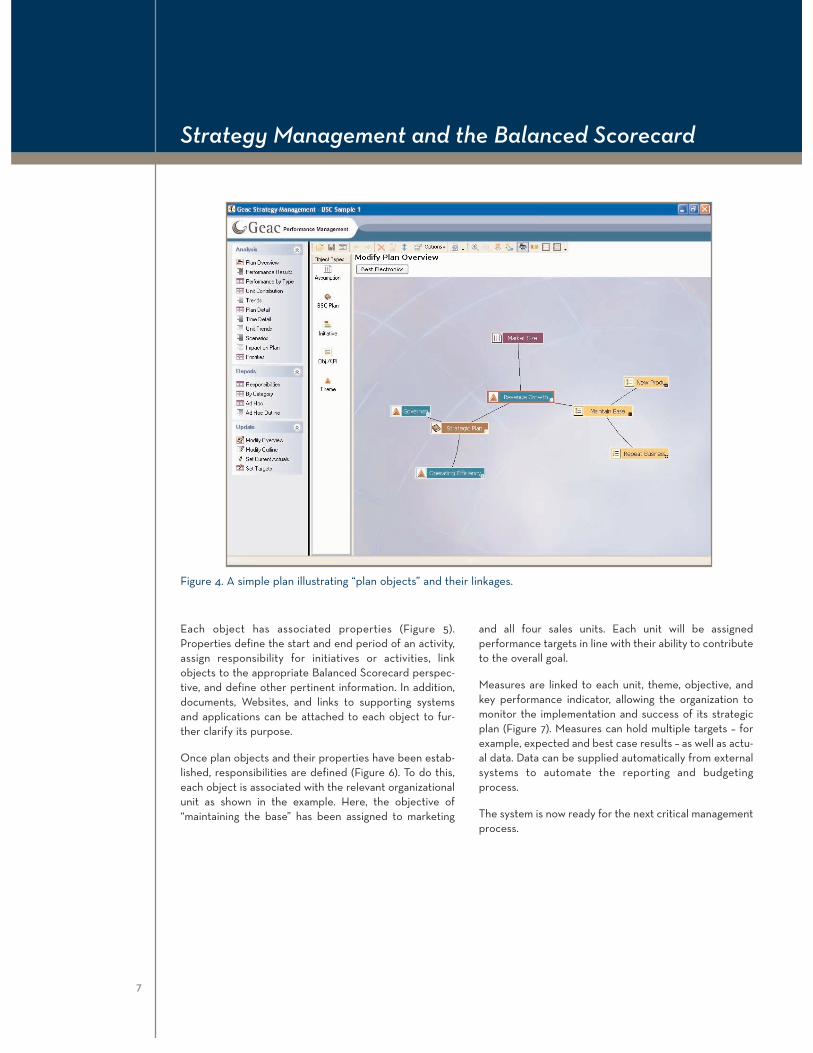
Each object has associated properties (Figure 5).Properties define the start and end period of an activity,assign responsibility for initiatives or activities, linkobjects to the appropriate Balanced Scorecard perspec-tive, and define other pertinent information. In addition,documents, Websites, and links to supporting systemsand applications can be attached to each object to fur-ther clarify its purpose.
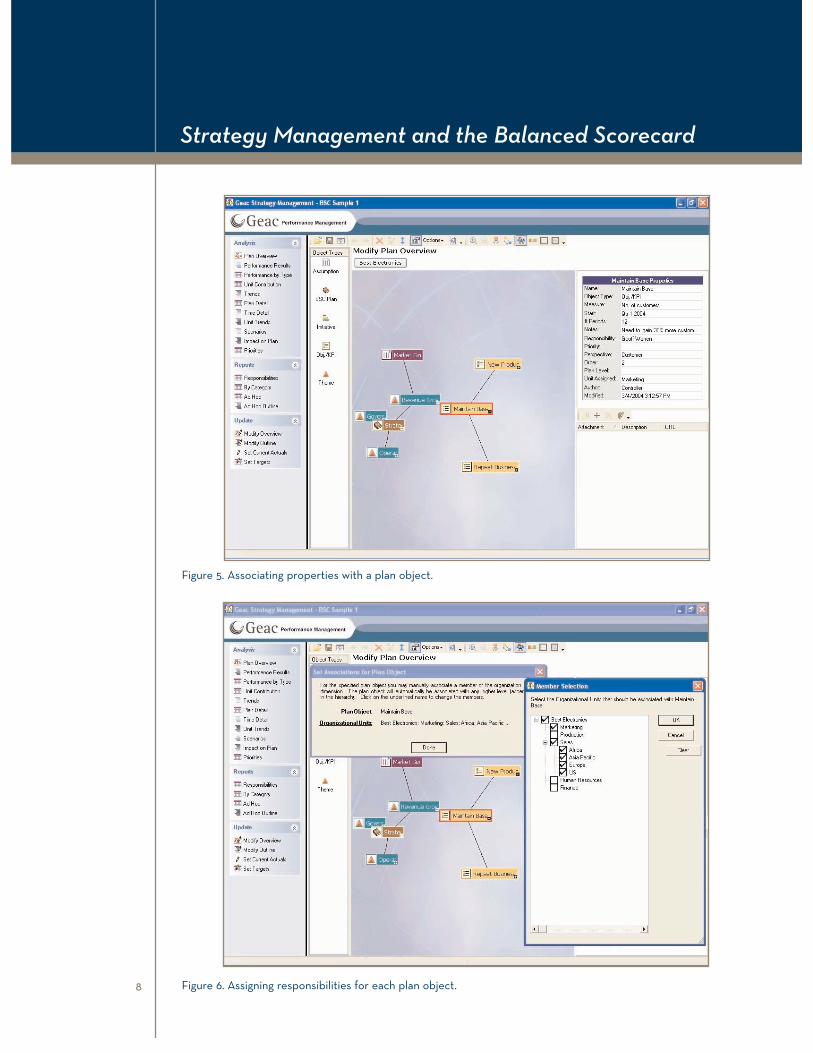
Once plan objects and their properties have been estab-lished, responsibilities are defined (Figure 6). To do this,each object is associated with the relevant organizationalunit as shown in the example. Here, the objective of“maintaining the base” has been assigned to marketing
and all four sales units. Each unit will be assigned performance targets in line with their ability to contributeto the overall goal.
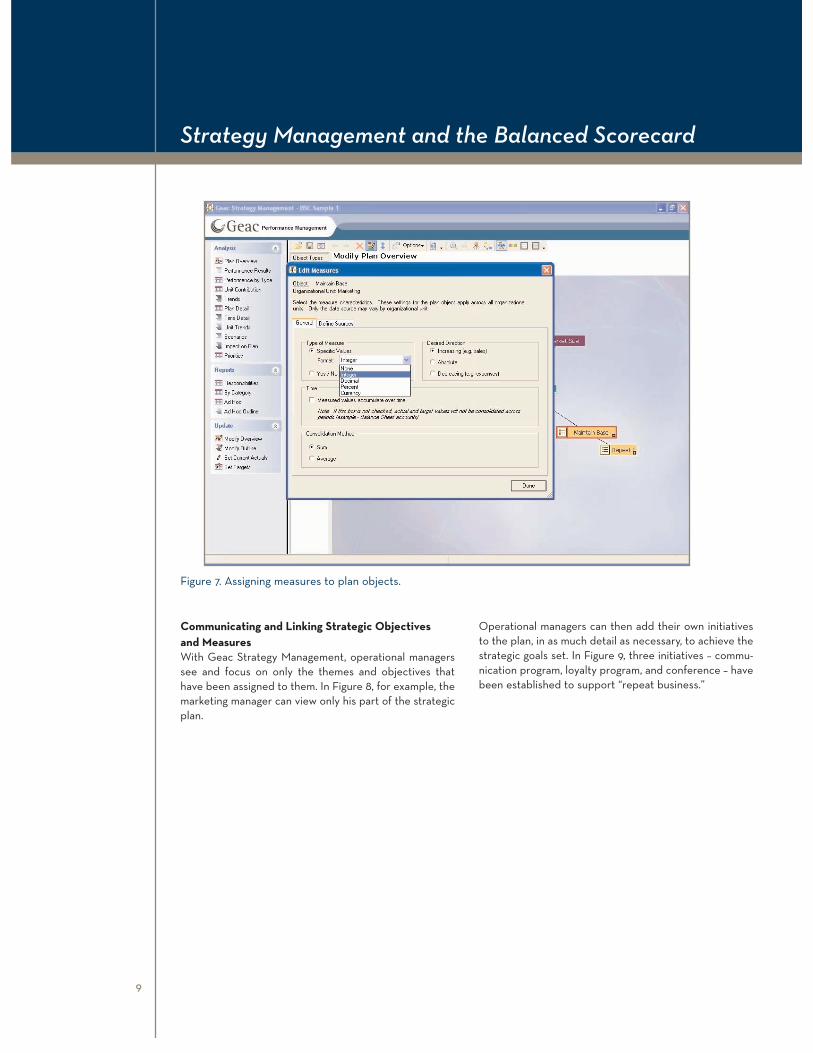
Measures are linked to each unit, theme, objective, andkey performance indicator, allowing the organization tomonitor the implementation and success of its strategicplan (Figure 7). Measures can hold multiple targets – forexample, expected and best case results – as well as actu-al data. Data can be supplied automatically from externalsystems to automate the reporting and budgetingprocess.
The system is now ready for the next critical managementprocess.
Strategy Management and the Balanced Scorecard
7
Figure 4. A simple plan illustrating “plan objects” and their linkages.
Strategy Management and the Balanced Scorecard
8
Figure 5. Associating properties with a plan object.
Figure 6. Assigning responsibilities for each plan object.
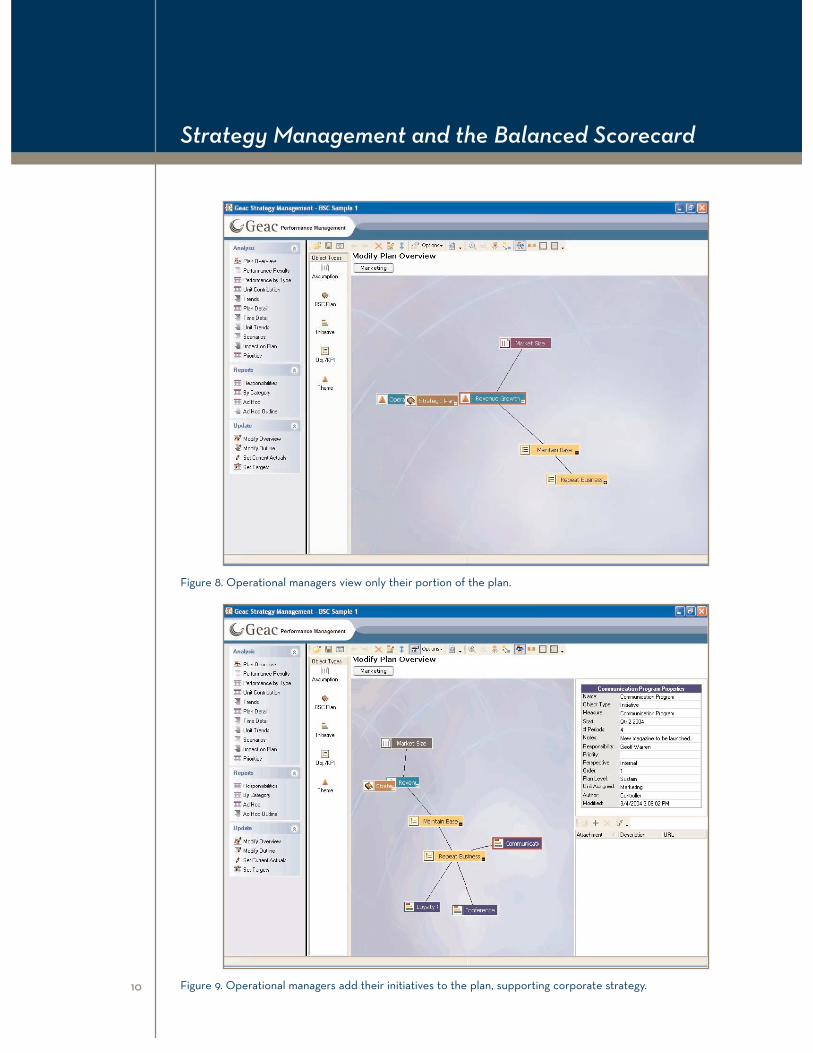
Communicating and Linking Strategic Objectives and MeasuresWith Geac Strategy Management, operational managerssee and focus on only the themes and objectives thathave been assigned to them. In Figure 8, for example, themarketing manager can view only his part of the strategicplan.
Operational managers can then add their own initiativesto the plan, in as much detail as necessary, to achieve thestrategic goals set. In Figure 9, three initiatives – commu-nication program, loyalty program, and conference – havebeen established to support “repeat business.”
Strategy Management and the Balanced Scorecard
9
Figure 7. Assigning measures to plan objects.
Strategy Management and the Balanced Scorecard
10
Figure 8. Operational managers view only their portion of the plan.
Figure 9. Operational managers add their initiatives to the plan, supporting corporate strategy.
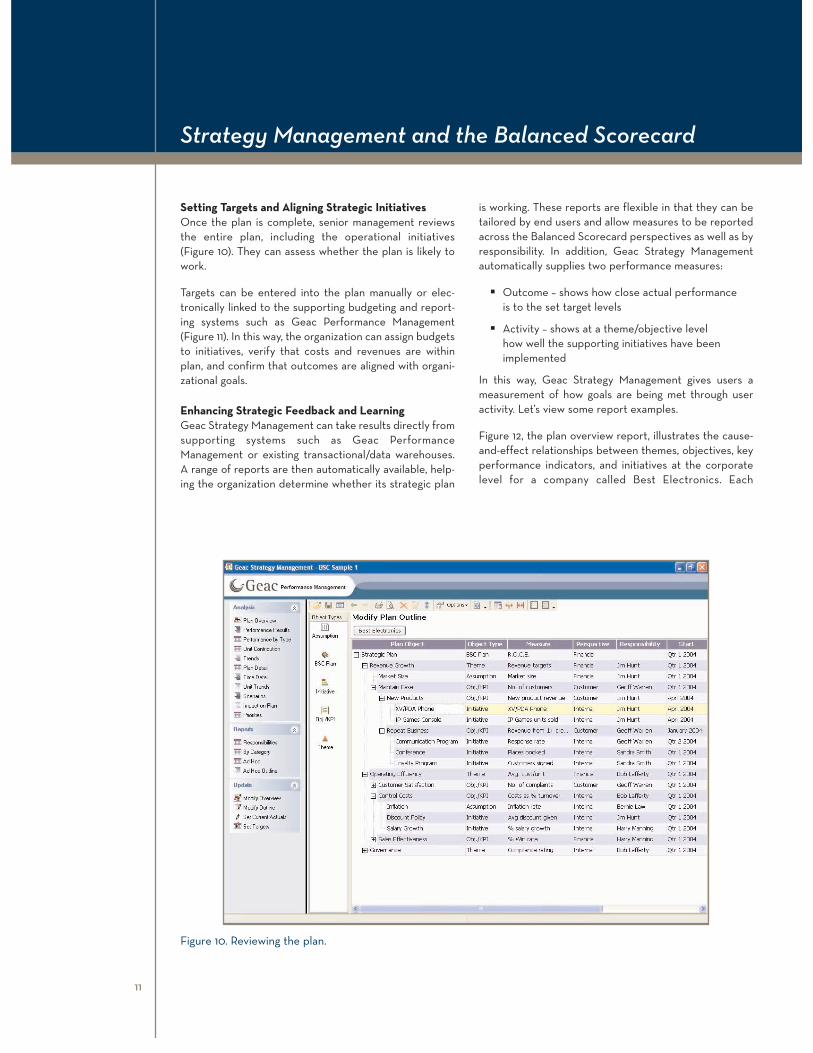
Setting Targets and Aligning Strategic InitiativesOnce the plan is complete, senior management reviewsthe entire plan, including the operational initiatives(Figure 10). They can assess whether the plan is likely towork.
Targets can be entered into the plan manually or elec-tronically linked to the supporting budgeting and report-ing systems such as Geac Performance Management(Figure 11). In this way, the organization can assign budgetsto initiatives, verify that costs and revenues are withinplan, and confirm that outcomes are aligned with organi-zational goals.
Enhancing Strategic Feedback and LearningGeac Strategy Management can take results directly fromsupporting systems such as Geac PerformanceManagement or existing transactional/data warehouses.A range of reports are then automatically available, help-ing the organization determine whether its strategic plan
is working. These reports are flexible in that they can betailored by end users and allow measures to be reportedacross the Balanced Scorecard perspectives as well as byresponsibility. In addition, Geac Strategy Managementautomatically supplies two performance measures:
� Outcome – shows how close actual performance is to the set target levels
� Activity – shows at a theme/objective level how well the supporting initiatives have beenimplemented
In this way, Geac Strategy Management gives users ameasurement of how goals are being met through useractivity. Let’s view some report examples.
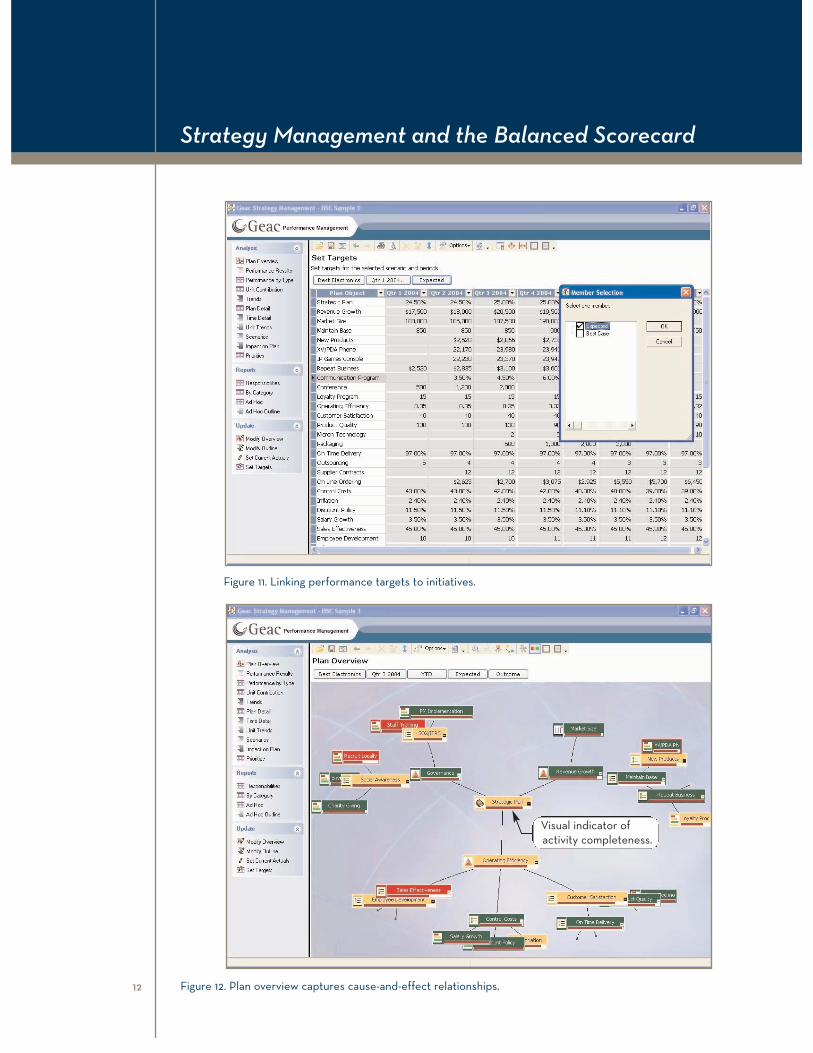
Figure 12, the plan overview report, illustrates the cause-and-effect relationships between themes, objectives, keyperformance indicators, and initiatives at the corporatelevel for a company called Best Electronics. Each
Strategy Management and the Balanced Scorecard
11
Figure 10. Reviewing the plan.
Strategy Management and the Balanced Scorecard
12
Figure 11. Linking performance targets to initiatives.
Figure 12. Plan overview captures cause-and-effect relationships.
Visual indicator of activity completeness.
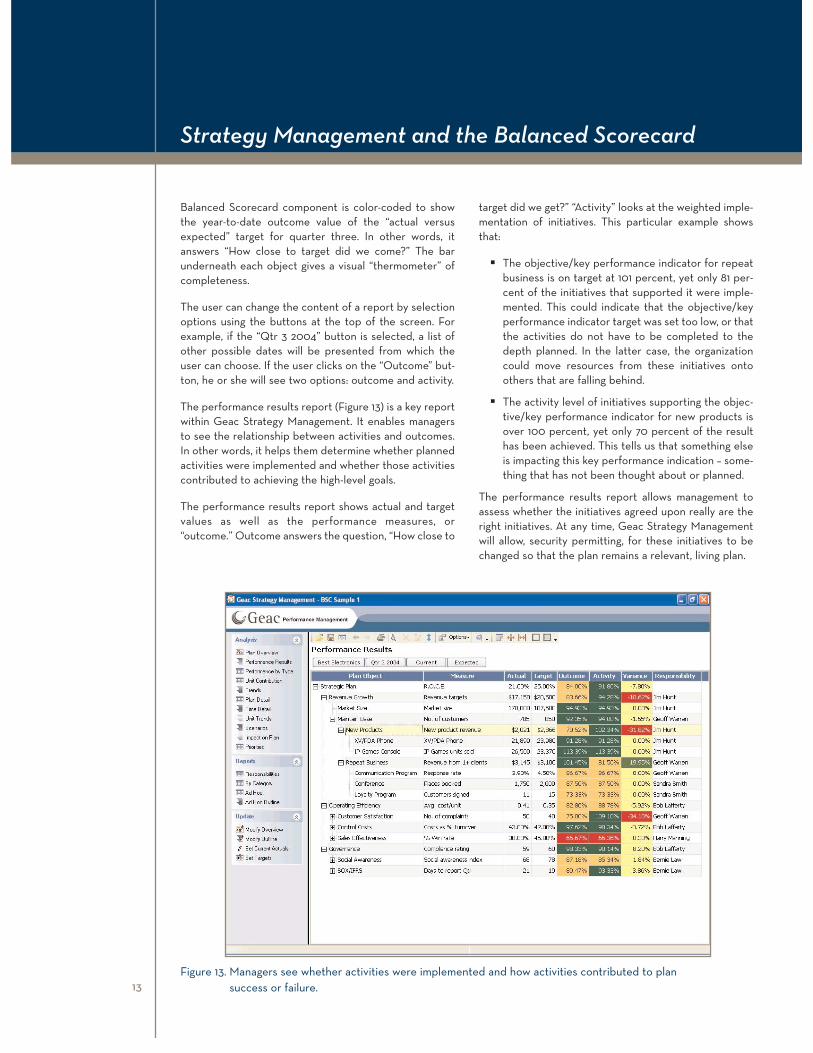
Balanced Scorecard component is color-coded to showthe year-to-date outcome value of the “actual versusexpected” target for quarter three. In other words, itanswers “How close to target did we come?” The barunderneath each object gives a visual “thermometer” ofcompleteness.
The user can change the content of a report by selectionoptions using the buttons at the top of the screen. Forexample, if the “Qtr 3 2004” button is selected, a list ofother possible dates will be presented from which theuser can choose. If the user clicks on the “Outcome” but-ton, he or she will see two options: outcome and activity.
The performance results report (Figure 13) is a key reportwithin Geac Strategy Management. It enables managersto see the relationship between activities and outcomes.In other words, it helps them determine whether plannedactivities were implemented and whether those activitiescontributed to achieving the high-level goals.
The performance results report shows actual and targetvalues as well as the performance measures, or “outcome.” Outcome answers the question, “How close to
target did we get?” “Activity” looks at the weighted imple-mentation of initiatives. This particular example showsthat:
� The objective/key performance indicator for repeatbusiness is on target at 101 percent, yet only 81 per-cent of the initiatives that supported it were imple-mented. This could indicate that the objective/keyperformance indicator target was set too low, or thatthe activities do not have to be completed to thedepth planned. In the latter case, the organizationcould move resources from these initiatives ontoothers that are falling behind.
� The activity level of initiatives supporting the objec-tive/key performance indicator for new products isover 100 percent, yet only 70 percent of the resulthas been achieved. This tells us that something elseis impacting this key performance indication – some-thing that has not been thought about or planned.
The performance results report allows management toassess whether the initiatives agreed upon really are theright initiatives. At any time, Geac Strategy Managementwill allow, security permitting, for these initiatives to bechanged so that the plan remains a relevant, living plan.
Strategy Management and the Balanced Scorecard
13Figure 13. Managers see whether activities were implemented and how activities contributed to plan
success or failure.
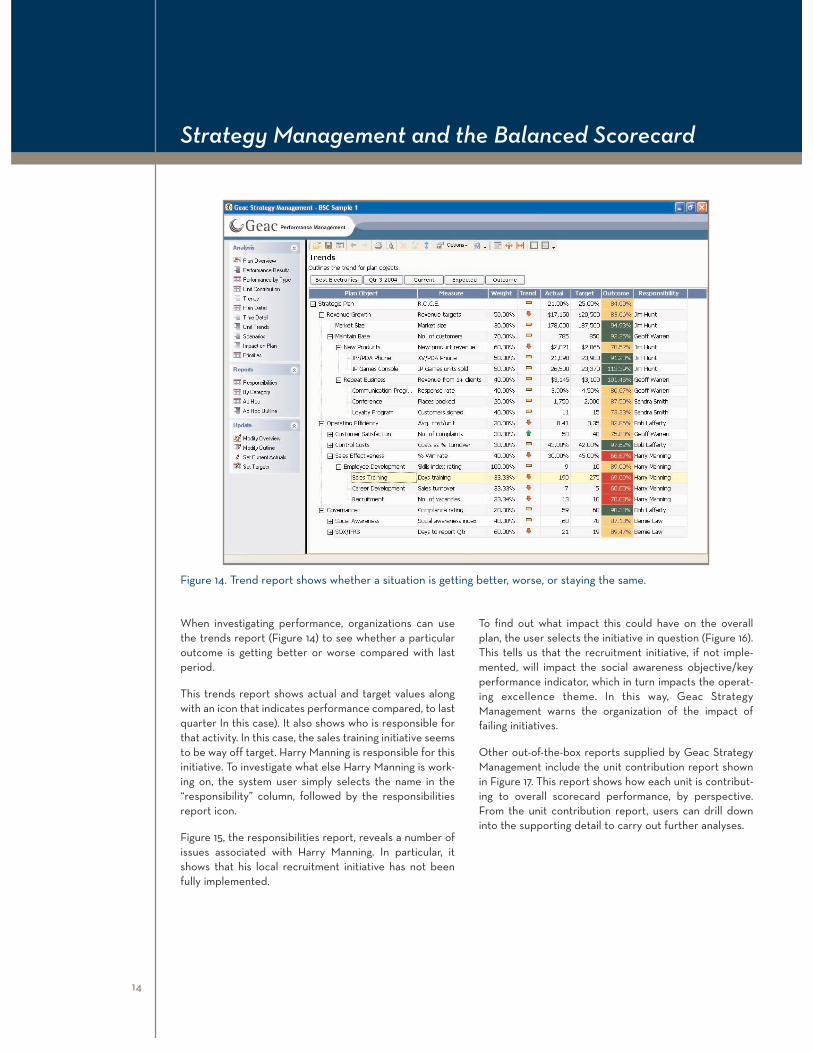
When investigating performance, organizations can usethe trends report (Figure 14) to see whether a particularoutcome is getting better or worse compared with lastperiod.
This trends report shows actual and target values alongwith an icon that indicates performance compared, to lastquarter In this case). It also shows who is responsible forthat activity. In this case, the sales training initiative seemsto be way off target. Harry Manning is responsible for thisinitiative. To investigate what else Harry Manning is work-ing on, the system user simply selects the name in the“responsibility” column, followed by the responsibilitiesreport icon.
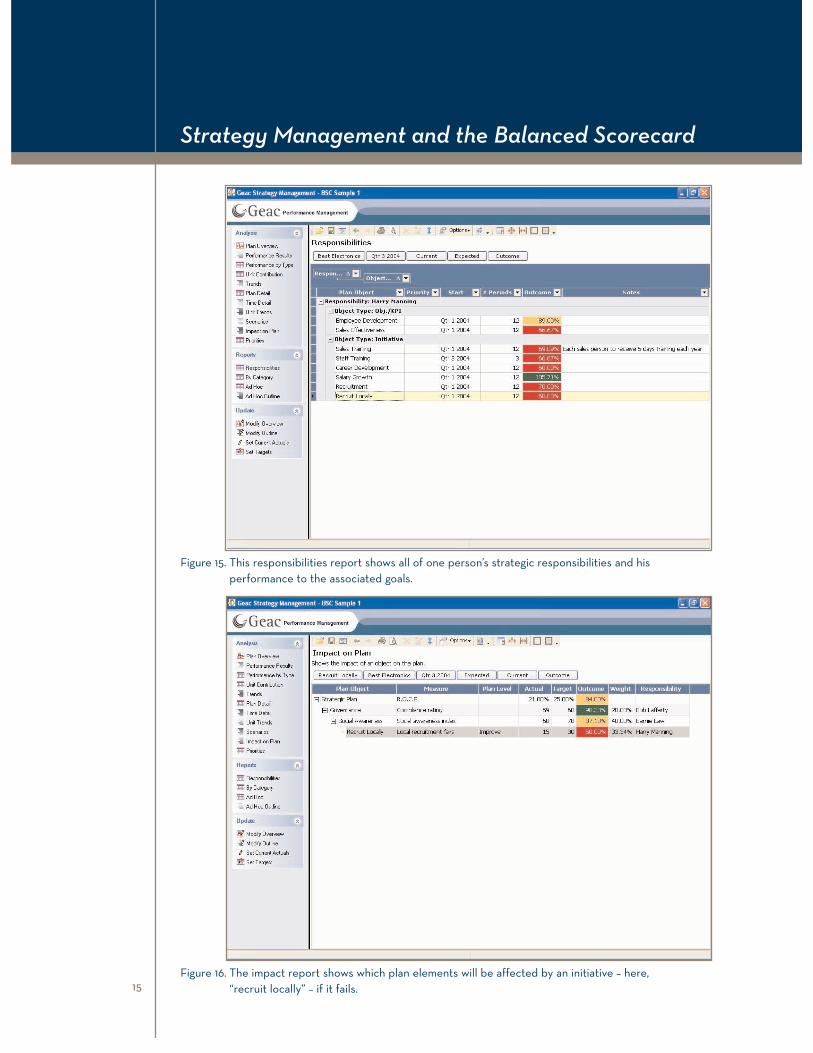
Figure 15, the responsibilities report, reveals a number ofissues associated with Harry Manning. In particular, itshows that his local recruitment initiative has not beenfully implemented.
To find out what impact this could have on the overallplan, the user selects the initiative in question (Figure 16).This tells us that the recruitment initiative, if not imple-mented, will impact the social awareness objective/keyperformance indicator, which in turn impacts the operat-ing excellence theme. In this way, Geac StrategyManagement warns the organization of the impact of failing initiatives.
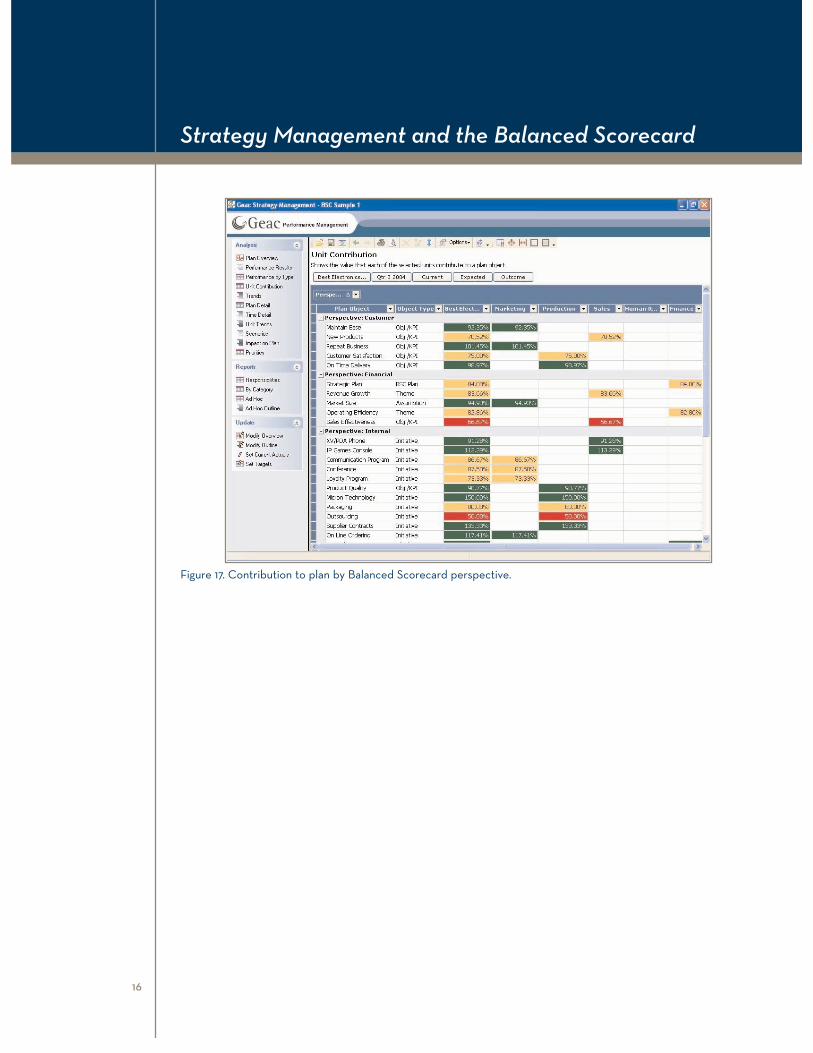
Other out-of-the-box reports supplied by Geac StrategyManagement include the unit contribution report shownin Figure 17. This report shows how each unit is contribut-ing to overall scorecard performance, by perspective.From the unit contribution report, users can drill downinto the supporting detail to carry out further analyses.
Strategy Management and the Balanced Scorecard
14
Figure 14. Trend report shows whether a situation is getting better, worse, or staying the same.
Strategy Management and the Balanced Scorecard
15
Figure 15. This responsibilities report shows all of one person’s strategic responsibilities and his performance to the associated goals.
Figure 16. The impact report shows which plan elements will be affected by an initiative – here, “recruit locally” – if it fails.
Strategy Management and the Balanced Scorecard
16
Figure 17. Contribution to plan by Balanced Scorecard perspective.
Strategy Management and the Balanced Scorecard
17
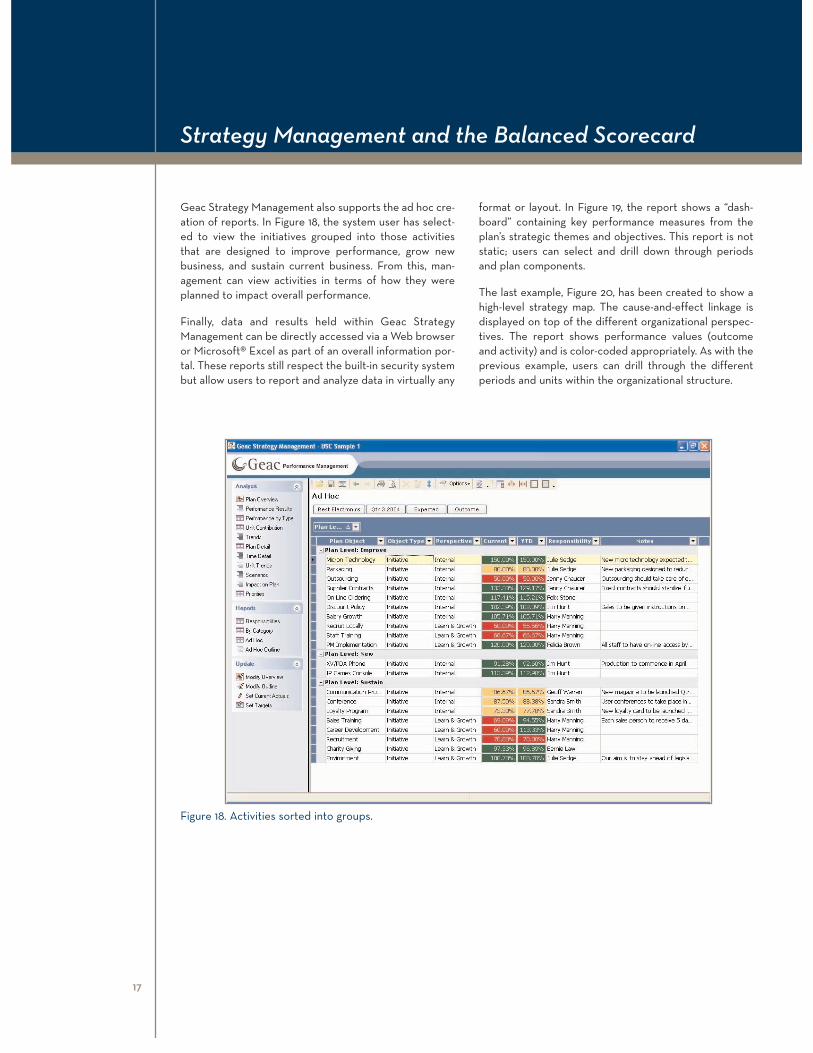
Figure 18. Activities sorted into groups.
Geac Strategy Management also supports the ad hoc cre-ation of reports. In Figure 18, the system user has select-ed to view the initiatives grouped into those activitiesthat are designed to improve performance, grow newbusiness, and sustain current business. From this, man-agement can view activities in terms of how they wereplanned to impact overall performance.
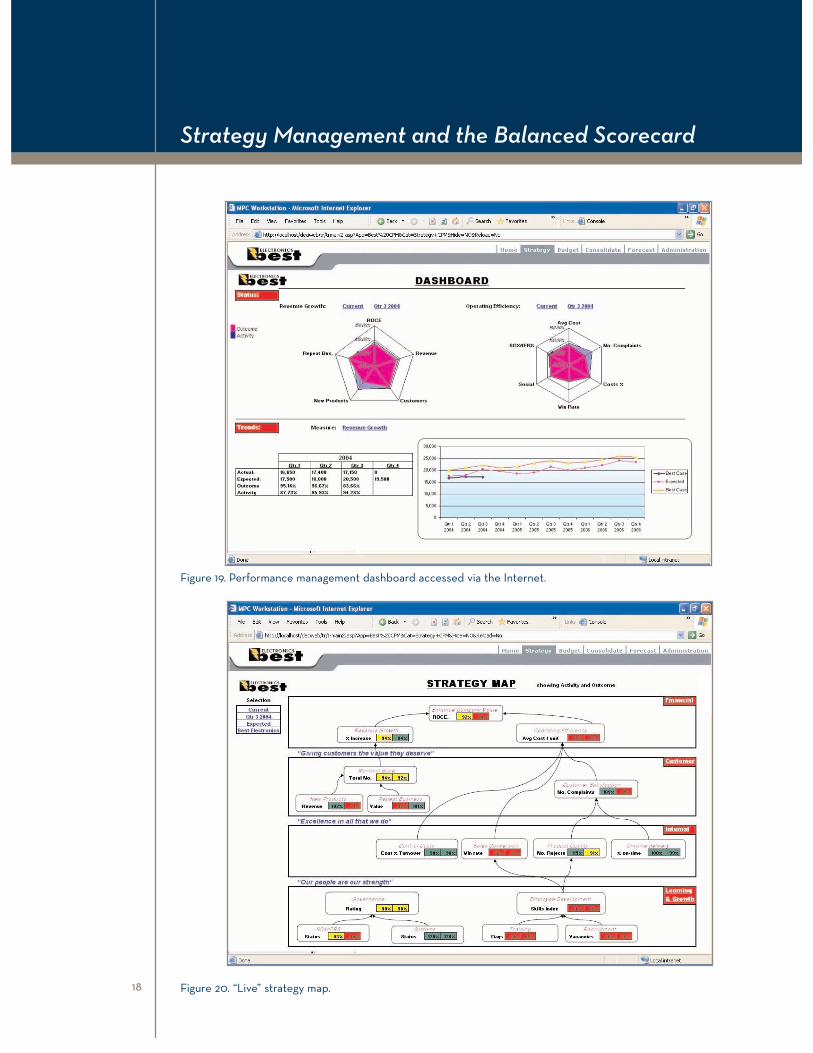
Finally, data and results held within Geac StrategyManagement can be directly accessed via a Web browseror Microsoft® Excel as part of an overall information por-tal. These reports still respect the built-in security systembut allow users to report and analyze data in virtually any
format or layout. In Figure 19, the report shows a “dash-board” containing key performance measures from theplan’s strategic themes and objectives. This report is notstatic; users can select and drill down through periodsand plan components.
The last example, Figure 20, has been created to show ahigh-level strategy map. The cause-and-effect linkage isdisplayed on top of the different organizational perspec-tives. The report shows performance values (outcomeand activity) and is color-coded appropriately. As with theprevious example, users can drill through the differentperiods and units within the organizational structure.
Strategy Management and the Balanced Scorecard
18
Figure 19. Performance management dashboard accessed via the Internet.
Figure 20. “Live” strategy map.
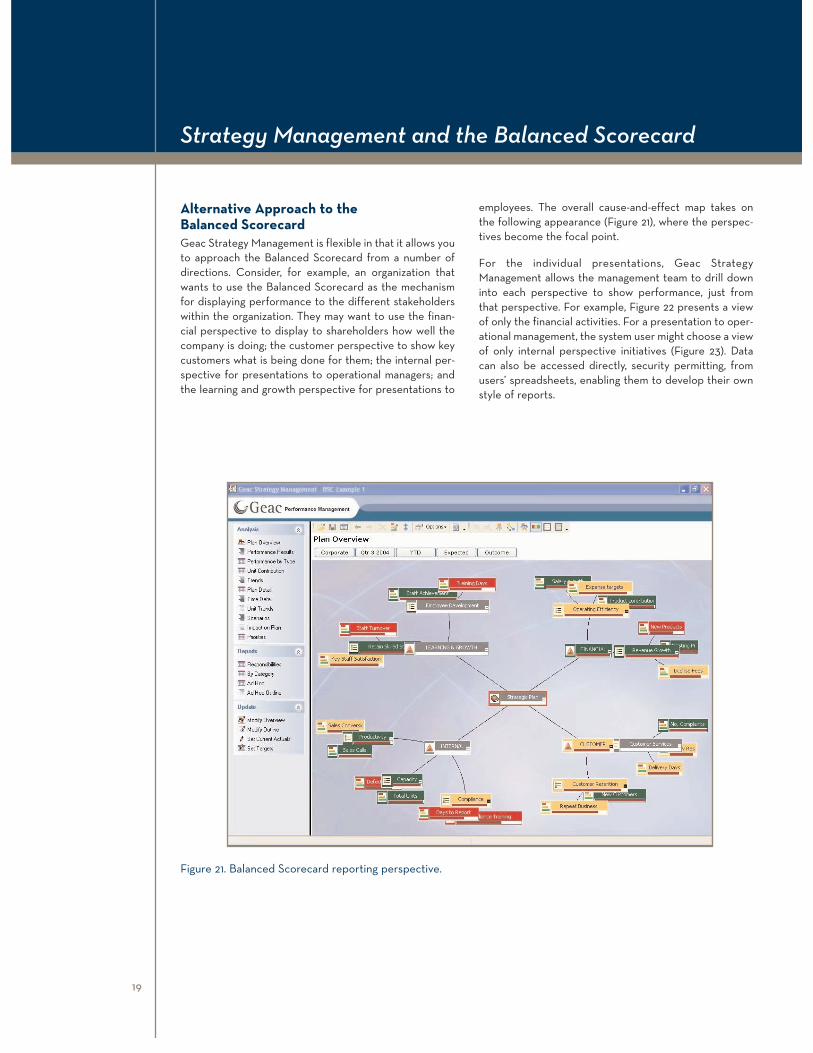
Alternative Approach to the Balanced ScorecardGeac Strategy Management is flexible in that it allows youto approach the Balanced Scorecard from a number ofdirections. Consider, for example, an organization thatwants to use the Balanced Scorecard as the mechanismfor displaying performance to the different stakeholderswithin the organization. They may want to use the finan-cial perspective to display to shareholders how well thecompany is doing; the customer perspective to show keycustomers what is being done for them; the internal per-spective for presentations to operational managers; andthe learning and growth perspective for presentations to
employees. The overall cause-and-effect map takes onthe following appearance (Figure 21), where the perspec-tives become the focal point.
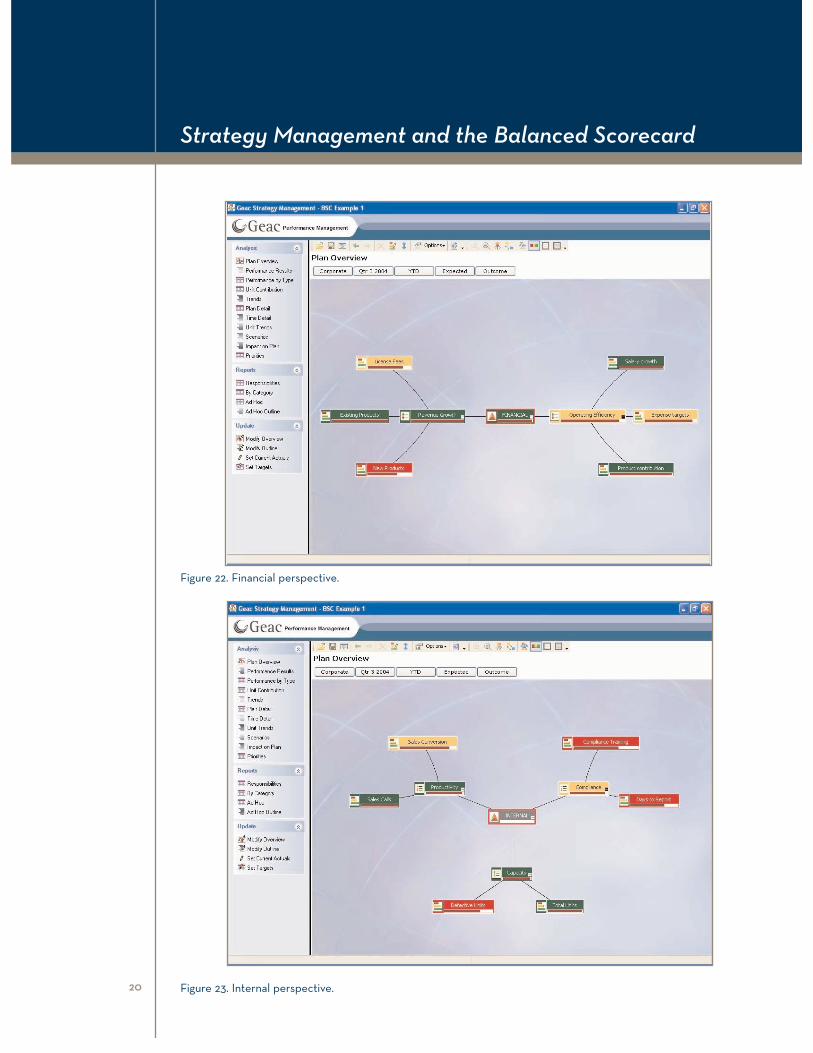
For the individual presentations, Geac StrategyManagement allows the management team to drill downinto each perspective to show performance, just fromthat perspective. For example, Figure 22 presents a viewof only the financial activities. For a presentation to oper-ational management, the system user might choose a viewof only internal perspective initiatives (Figure 23). Datacan also be accessed directly, security permitting, fromusers’ spreadsheets, enabling them to develop their ownstyle of reports.
Strategy Management and the Balanced Scorecard
19
Figure 21. Balanced Scorecard reporting perspective.
Strategy Management and the Balanced Scorecard
20
Figure 22. Financial perspective.
Figure 23. Internal perspective.
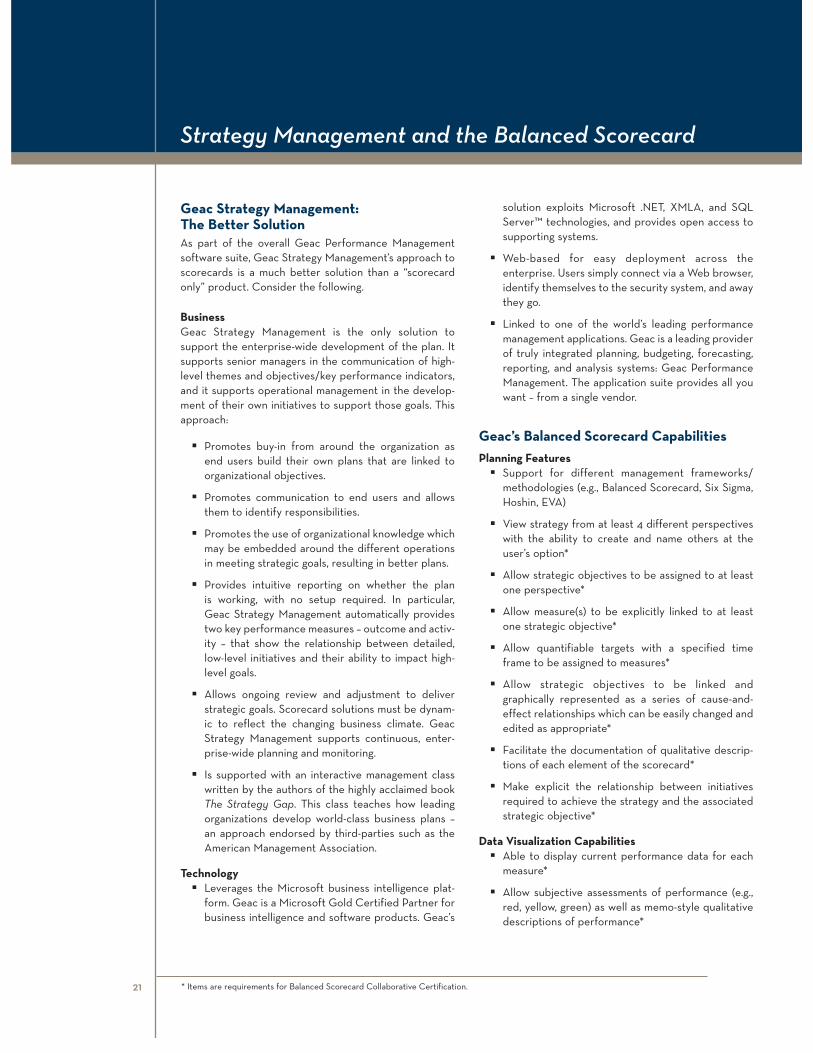
Geac Strategy Management: The Better SolutionAs part of the overall Geac Performance Managementsoftware suite, Geac Strategy Management’s approach toscorecards is a much better solution than a “scorecardonly” product. Consider the following.
BusinessGeac Strategy Management is the only solution to support the enterprise-wide development of the plan. Itsupports senior managers in the communication of high-level themes and objectives/key performance indicators,and it supports operational management in the develop-ment of their own initiatives to support those goals. Thisapproach:
� Promotes buy-in from around the organization asend users build their own plans that are linked toorganizational objectives.
� Promotes communication to end users and allowsthem to identify responsibilities.
� Promotes the use of organizational knowledge whichmay be embedded around the different operationsin meeting strategic goals, resulting in better plans.
� Provides intuitive reporting on whether the plan is working, with no setup required. In particular,Geac Strategy Management automatically providestwo key performance measures – outcome and activ-ity – that show the relationship between detailed,low-level initiatives and their ability to impact high-level goals.
� Allows ongoing review and adjustment to deliverstrategic goals. Scorecard solutions must be dynam-ic to reflect the changing business climate. GeacStrategy Management supports continuous, enter-prise-wide planning and monitoring.
� Is supported with an interactive management classwritten by the authors of the highly acclaimed bookThe Strategy Gap. This class teaches how leadingorganizations develop world-class business plans –an approach endorsed by third-parties such as theAmerican Management Association.
Technology� Leverages the Microsoft business intelligence plat-
form. Geac is a Microsoft Gold Certified Partner forbusiness intelligence and software products. Geac’s
solution exploits Microsoft .NET, XMLA, and SQLServer™ technologies, and provides open access tosupporting systems.
� Web-based for easy deployment across the enterprise. Users simply connect via a Web browser,identify themselves to the security system, and awaythey go.
� Linked to one of the world’s leading performancemanagement applications. Geac is a leading providerof truly integrated planning, budgeting, forecasting,reporting, and analysis systems: Geac PerformanceManagement. The application suite provides all youwant – from a single vendor.
Geac’s Balanced Scorecard CapabilitiesPlanning Features
� Support for different management frameworks/methodologies (e.g., Balanced Scorecard, Six Sigma,Hoshin, EVA)
� View strategy from at least 4 different perspectiveswith the ability to create and name others at theuser’s option*
� Allow strategic objectives to be assigned to at leastone perspective*
� Allow measure(s) to be explicitly linked to at leastone strategic objective*
� Allow quantifiable targets with a specified timeframe to be assigned to measures*
� Allow strategic objectives to be linked and graphically represented as a series of cause-and-effect relationships which can be easily changed andedited as appropriate*
� Facilitate the documentation of qualitative descrip-tions of each element of the scorecard*
� Make explicit the relationship between initiativesrequired to achieve the strategy and the associatedstrategic objective*
Data Visualization Capabilities� Able to display current performance data for each
measure*
� Allow subjective assessments of performance (e.g.,red, yellow, green) as well as memo-style qualitativedescriptions of performance*
Strategy Management and the Balanced Scorecard
21 * Items are requirements for Balanced Scorecard Collaborative Certification.
� Graphically display performance against targets in an easy-to-comprehend format that allows formodification to suit individual end-user needs*
Integration Capabilities� Link to different applications without having to close
the application down
� Provide data integration links to transaction/datawarehouse systems
� Integration with Geac Performance Management toanalyze performance data
Analysis Capabilities� User-defined tolerances with multiple levels of
tolerance
� Basic trend (e.g., icons) and trend analysis (via GeacPerformance Management) over time
� Integrate OLAP capability with data stored in a multidimensional format
� Actual comparison with multiple targets/benchmarks
� Drill down from summary data into detailed analysis
� Detail description of measures including name,description, format, desired value direction, targetvalue(s) for period and unit, start date, duration, fre-quency, person responsible, data source, currentvalue, user definable attributes, general notes, andattachments
� Visual link between measures
� Security on data viewing and functionality
� Reporting by person responsible
Technology� Web enabled
� Scalable across the enterprise
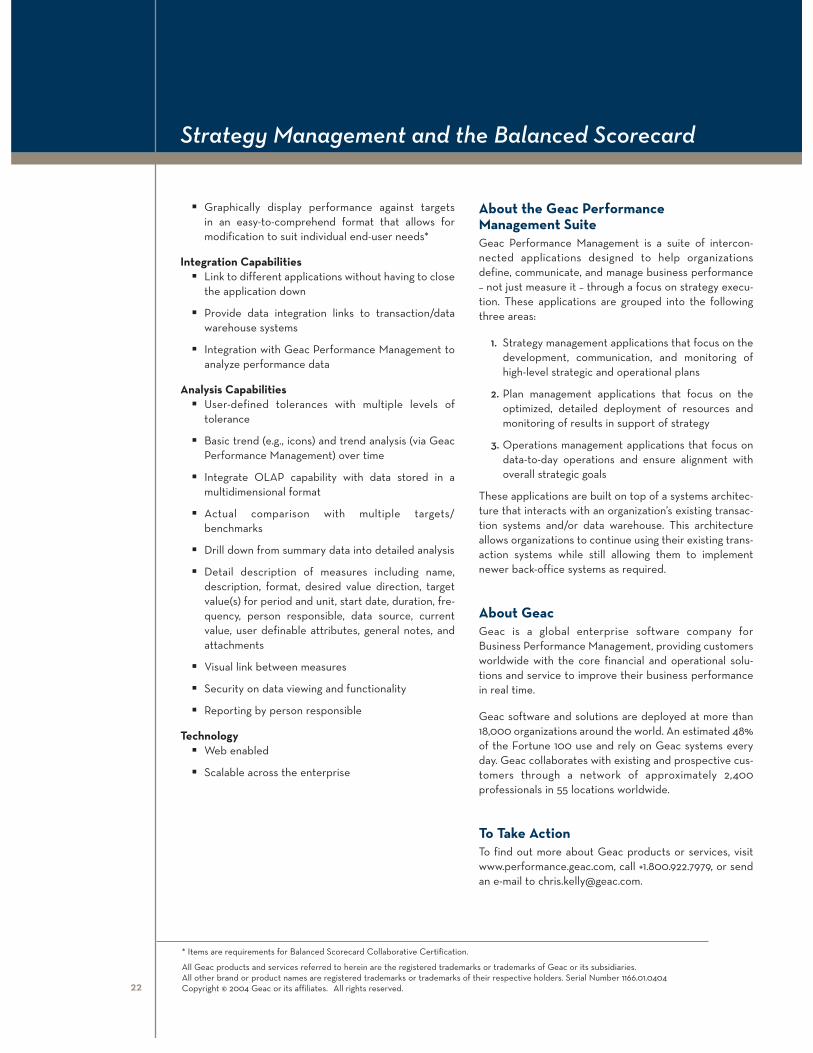
About the Geac Performance Management SuiteGeac Performance Management is a suite of intercon-nected applications designed to help organizationsdefine, communicate, and manage business performance– not just measure it – through a focus on strategy execu-tion. These applications are grouped into the followingthree areas:
1. Strategy management applications that focus on thedevelopment, communication, and monitoring ofhigh-level strategic and operational plans
2. Plan management applications that focus on theoptimized, detailed deployment of resources andmonitoring of results in support of strategy
3. Operations management applications that focus ondata-to-day operations and ensure alignment withoverall strategic goals
These applications are built on top of a systems architec-ture that interacts with an organization’s existing transac-tion systems and/or data warehouse. This architectureallows organizations to continue using their existing trans-action systems while still allowing them to implementnewer back-office systems as required.
About GeacGeac is a global enterprise software company forBusiness Performance Management, providing customersworldwide with the core financial and operational solu-tions and service to improve their business performancein real time.
Geac software and solutions are deployed at more than18,000 organizations around the world. An estimated 48%of the Fortune 100 use and rely on Geac systems everyday. Geac collaborates with existing and prospective cus-tomers through a network of approximately 2,400 professionals in 55 locations worldwide.
To Take ActionTo find out more about Geac products or services, visitwww.performance.geac.com, call +1.800.922.7979, or sendan e-mail to [email protected].
Strategy Management and the Balanced Scorecard
22
* Items are requirements for Balanced Scorecard Collaborative Certification.
All Geac products and services referred to herein are the registered trademarks or trademarks of Geac or its subsidiaries. All other brand or product names are registered trademarks or trademarks of their respective holders. Serial Number 1166.01.0404 Copyright © 2004 Geac or its affiliates. All rights reserved.


![Performance Measure Congruity and the Balanced Scorecard · Performance Measure Congruity and the Balanced Scorecard ... Contrary to Kaplan and Norton’s [1996] intention for scorecard](https://img.pdfslide.us/doc/110x75/5e32821d40504757394a2662/performance-measure-congruity-and-the-balanced-scorecard-performance-measure-congruity.jpg)