Embed Size (px)
Citation preview
Dec 2014 cohort – QPB Module Preparation Seminar
www.corexams.com
Strategy -1 Prepared by Dave Yang for Core Admin queries please email [email protected]
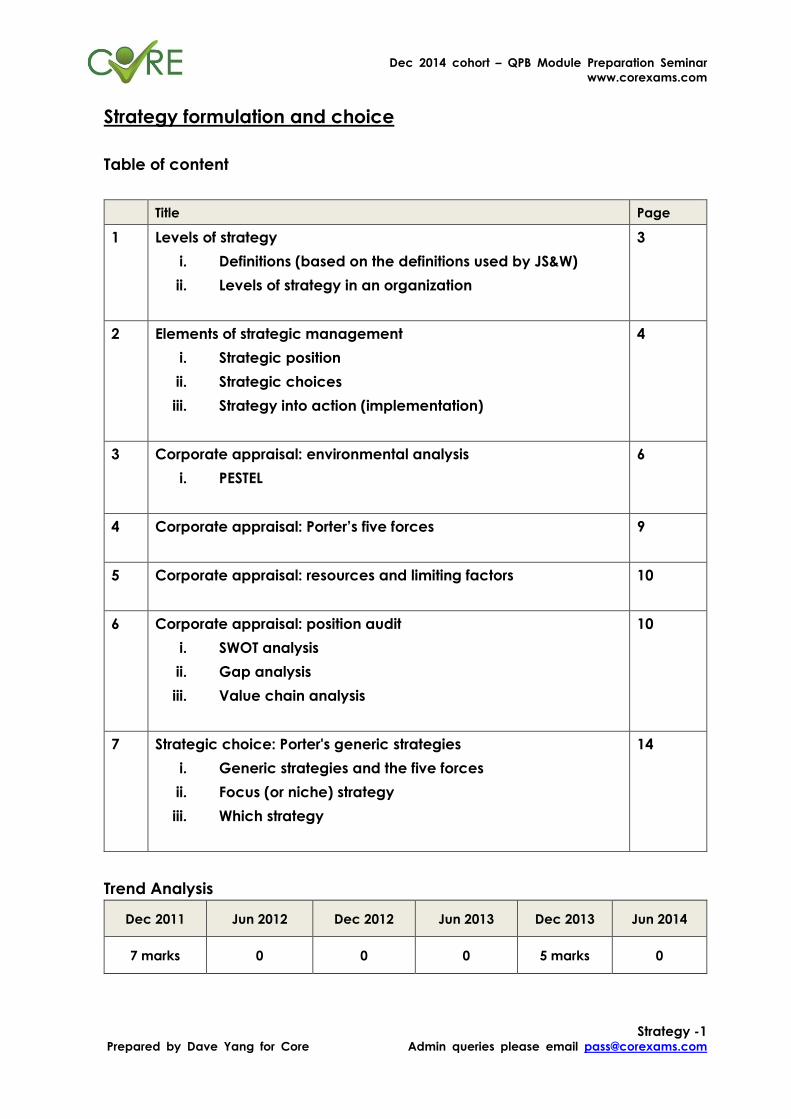
Strategy formulation and choice
Table of content
Title Page
1 Levels of strategy
i. Definitions (based on the definitions used by JS&W)
ii. Levels of strategy in an organization
3
2 Elements of strategic management
i. Strategic position
ii. Strategic choices
iii. Strategy into action (implementation)
4
3 Corporate appraisal: environmental analysis
i. PESTEL
6
4 Corporate appraisal: Porter’s five forces
9
5 Corporate appraisal: resources and limiting factors
10
6 Corporate appraisal: position audit
i. SWOT analysis
ii. Gap analysis
iii. Value chain analysis
10
7 Strategic choice: Porter's generic strategies
i. Generic strategies and the five forces
ii. Focus (or niche) strategy
iii. Which strategy
14
Trend Analysis
Dec 2011 Jun 2012 Dec 2012 Jun 2013 Dec 2013 Jun 2014
7 marks 0 0 0 5 marks 0
Dec 2014 cohort – QPB Module Preparation Seminar
www.corexams.com
Strategy -2 Prepared by Dave Yang for Core Admin queries please email [email protected]
Dec 2014 cohort – QPB Module Preparation Seminar
www.corexams.com
Strategy -3 Prepared by Dave Yang for Core Admin queries please email [email protected]
1. Levels of strategy
1.i) Definitions (based on the definitions used by JS&W)
Mission. The organisation's overriding purpose; it reflects the values or expectations of
stakeholders and answers the question "what business are we in?".
Vision or strategic intent. The future state desired by the organisation's strategists: they
aim to guide the organisation's collective aspiration toward it.
A goal. Statement of a general aim or purpose that supports the mission. It may be
qualitative in nature.
An objective. A more specific aim or purpose and will probably be quantified.
Strategic capability. Flows from resources and competencies. Unique resources and
core competencies create competitive advantage.
A business model. Describes the structure of product, service and information flows
between the parties involved.
Strategic control. Has two parts, first monitoring the effectiveness of strategies and
actions and second taking corrective action when required.
1.ii) Levels of strategy in an organization
Hofer and Schendel refer to three levels of strategy:
Corporate strategies
Corporate strategy is concerned with the overall purpose and general direction of the
organisation and how value will be added to the different parts (business units) of the
organisation.
Dec 2014 cohort – QPB Module Preparation Seminar
www.corexams.com
Strategy -4 Prepared by Dave Yang for Core Admin queries please email [email protected]
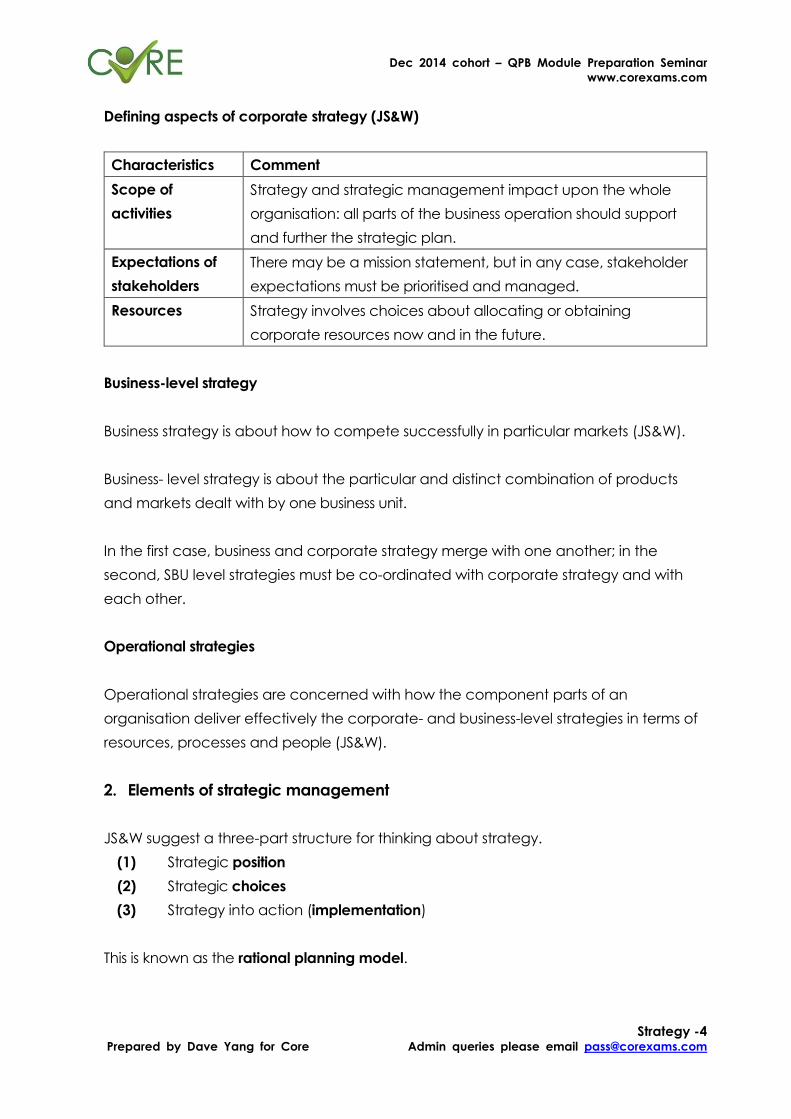
Defining aspects of corporate strategy (JS&W)
Characteristics Comment
Scope of
activities
Strategy and strategic management impact upon the whole
organisation: all parts of the business operation should support
and further the strategic plan.
Expectations of
stakeholders
There may be a mission statement, but in any case, stakeholder
expectations must be prioritised and managed.
Resources Strategy involves choices about allocating or obtaining
corporate resources now and in the future.
Business-level strategy
Business strategy is about how to compete successfully in particular markets (JS&W).
Business- level strategy is about the particular and distinct combination of products
and markets dealt with by one business unit.
In the first case, business and corporate strategy merge with one another; in the
second, SBU level strategies must be co-ordinated with corporate strategy and with
each other.
Operational strategies
Operational strategies are concerned with how the component parts of an
organisation deliver effectively the corporate- and business-level strategies in terms of
resources, processes and people (JS&W).
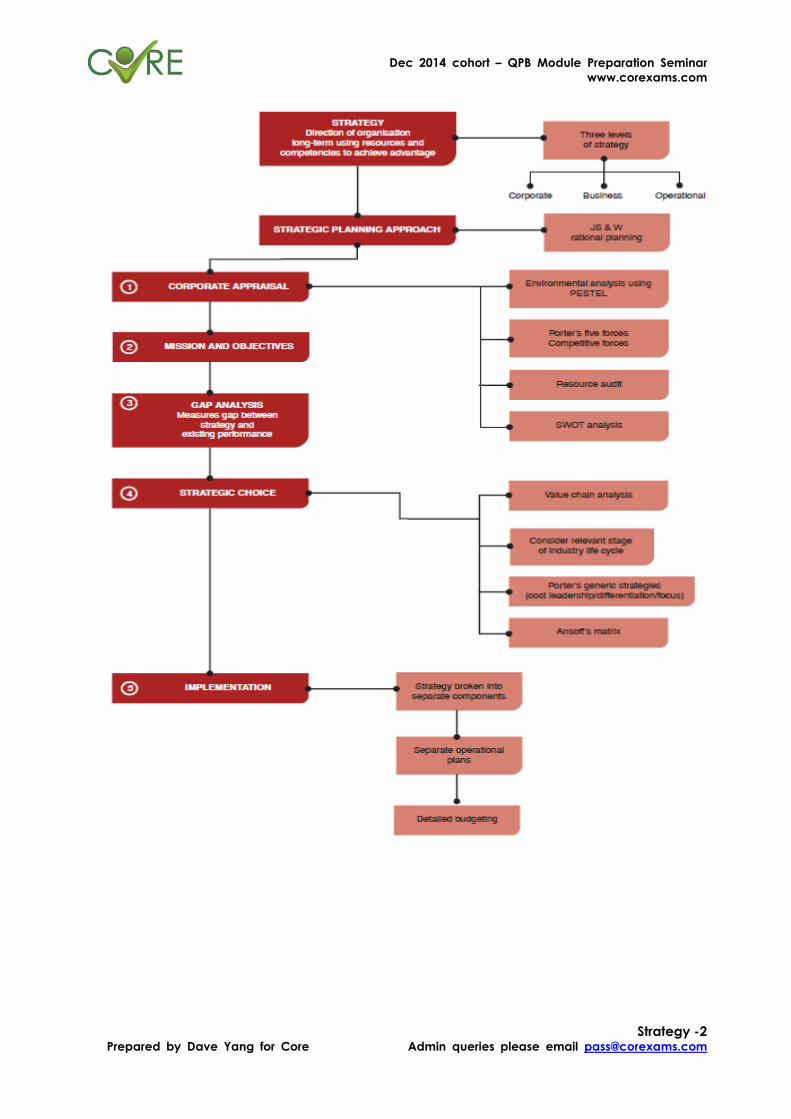
2. Elements of strategic management
JS&W suggest a three-part structure for thinking about strategy.
(1) Strategic position
(2) Strategic choices
(3) Strategy into action (implementation)
This is known as the rational planning model.
Dec 2014 cohort – QPB Module Preparation Seminar
www.corexams.com
Strategy -5 Prepared by Dave Yang for Core Admin queries please email [email protected]
2.i) Strategic position
The strategic managers must attempt to understand the organisation's strategic
position. There are three main groups of influences to consider: the environment,
strategic capability and the expectations of stakeholders.
The environment
The environment of business includes wider political, economic, social, technological,
environmentally conscious and legal forces as well as the more immediate pressures of
business competition.
Strategic capability
The organisation's resources and competencies make up its strategic capability.
Stakeholders' expectations
Consideration must also be given to the expectations of stakeholder groups that have
a less formal relationship with the organisation.
Stakeholder power and interest influence the direction in which strategy evolves, as do
ethical issues.
2.ii) Strategic choices
Strategic choices are made at both the corporate and business unit level.
At the level of the business unit, these choices are about how to achieve competitive
advantage and are based on an understanding of customers and markets.
At the corporate level, strategy is primarily about scope: this is concerned with the
overall product/business portfolio, the spread of markets and the relationship between
business units and the corporate centre.
Strategic choices must also be made about the direction and method of
development.
Dec 2014 cohort – QPB Module Preparation Seminar
www.corexams.com
Strategy -6 Prepared by Dave Yang for Core Admin queries please email [email protected]
2.iii) Strategy into action (implementation)
Strategies must be made to work in practice. Major issues here include structuring,
enabling and change.
(a) Structuring includes processes, relationships, organisation structure and how
these elements work together.
(b) Enabling is the complex two-way process by which the organisation's resources
are managed to both support and to create strategies.
(c) Change is a very common feature of strategic development and the
management of change is a most important feature of strategic
implementation.
3. Corporate appraisal: environmental analysis
Strategic position may involve an internal and/or external analysis of the business using
models such as PESTEL, Porter's five forces and SWOT.
3.i) PESTEL
The macro-environment may be analysed into five or six segments using the PESTE or
PESTEL framework. (Mentioned in LP11 Risk Identification)
Political
Economic
Socio-cultural
Technological
Environmental protection
Legal

Dec 2014 cohort – QPB Module Preparation Seminar
www.corexams.com
Strategy -7 Prepared by Dave Yang for Core Admin queries please email [email protected]
The political environment
Government is responsible for providing a stable framework for economic activity and,
in particular, for maintaining and improving the physical, social and market
infrastructure.
Government policy affects the whole economy, and governments are responsible for
enforcing and creating a stable framework in which business can be done.
Considerations:
Stability of the countries’ political environment
The time of the current government remain in power (Strong/weak government)
Government policies on the infrastructure of the country in different aspects (e.g.
transportation, education system, welfare scheme, law enforcement and equal
opportunity)
The economic environment
The economic environment affects firms at national and international level, both in the
general level of economic activity and in particular variables, such as exchange rates,
interest rates and inflation.
Considerations:
The demand for goods depends on the economy of the country
The office rents, labor cost and property prices are rising or dropping
The inflation expectation
The domestic currency interest rate expectation
The foreign exchange policy will significantly affect the willingness of investing in a
country
Tax system of the country on corporate and individual levels
Government spending
Dec 2014 cohort – QPB Module Preparation Seminar
www.corexams.com
Strategy -8 Prepared by Dave Yang for Core Admin queries please email [email protected]
The socio-cultural environment
The economic environment affects firms at national and international level, both in the
general level of economic activity and in particular variables, such as exchange rates,
interest rates and inflation.
Considerations:
The rate of growth of the population
Age distribution of the population
The concentration of population in certain regions within the country
Social Diversity
Social structure with different social classes and their population
Recruitment environment and employment culture
The technology environment
Gains in productivity (more output per units of input)
Reduced costs (for example, transportation technology)
New types of product
Considerations:
Technology will affect the type of products or services that are made and sold
Change the way products or services are made and sold
Identify and explore new market in an easier and accurate way (big data)
The way how a firm is managed (home-working and more overseas connection)
The environmental protection
Environmental protection is now a key aspect of corporate social responsibility.
Pressure on businesses for better environmental performance is coming from many
quarters.
Whether the government is encouraging the corporate and individuals to
concern about the environmental problems
Consumer demand for products that appear to be environmental friendly
Demand for less pollution from industrial production
Dec 2014 cohort – QPB Module Preparation Seminar
www.corexams.com
Strategy -9 Prepared by Dave Yang for Core Admin queries please email [email protected]
Encourage to use green energy and whether the facilities are in place
Request companies to be more social responsible
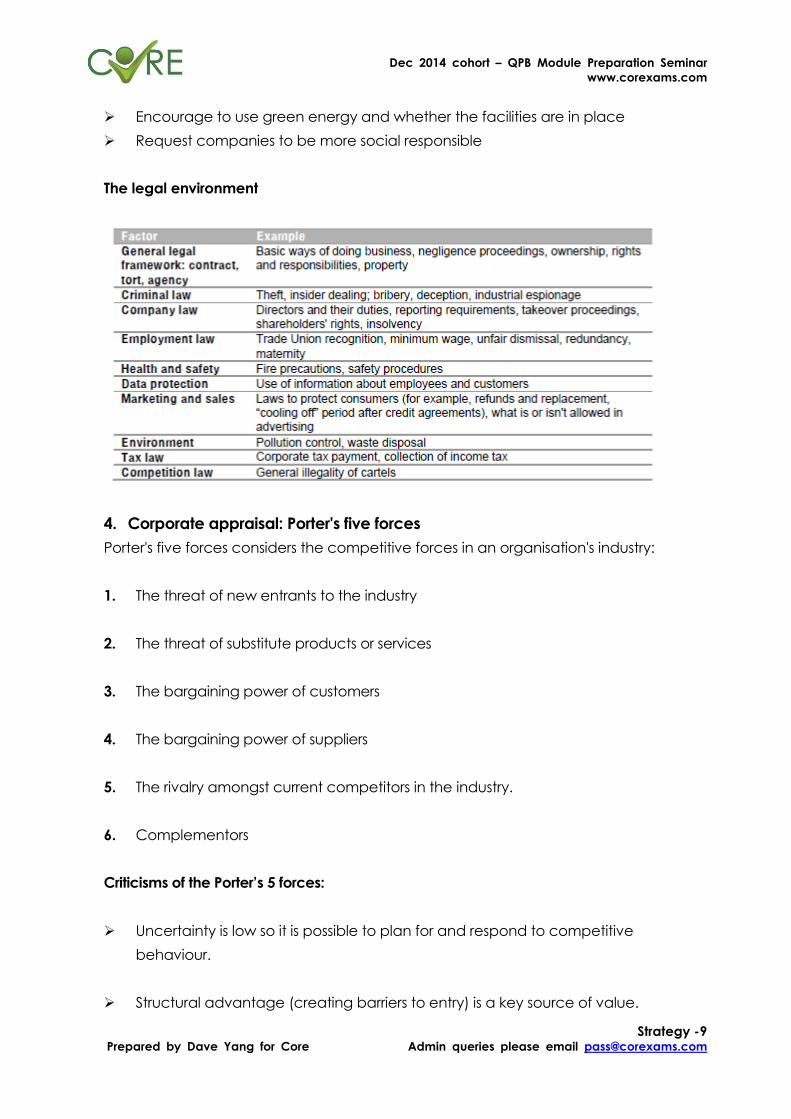
The legal environment
4. Corporate appraisal: Porter's five forces
Porter's five forces considers the competitive forces in an organisation's industry:
1. The threat of new entrants to the industry
2. The threat of substitute products or services
3. The bargaining power of customers
4. The bargaining power of suppliers
5. The rivalry amongst current competitors in the industry.
6. Complementors
Criticisms of the Porter’s 5 forces:
Uncertainty is low so it is possible to plan for and respond to competitive
behaviour.
Structural advantage (creating barriers to entry) is a key source of value.
Dec 2014 cohort – QPB Module Preparation Seminar
www.corexams.com
Strategy -10 Prepared by Dave Yang for Core Admin queries please email [email protected]
Buyers, competitors and suppliers are unrelated and do not interact or collude.
5. Corporate appraisal: resources and limiting factors
A resource audit is a review of all aspects of the resources the organisation uses.
Resource audits identify human, financial and material resources and how they are
deployed.
A limiting factor or key factor is a factor which at any time or over a period may limit
the activity of an entity, often one where there is shortage or difficulty of supply.
6. Corporate appraisal: position audit
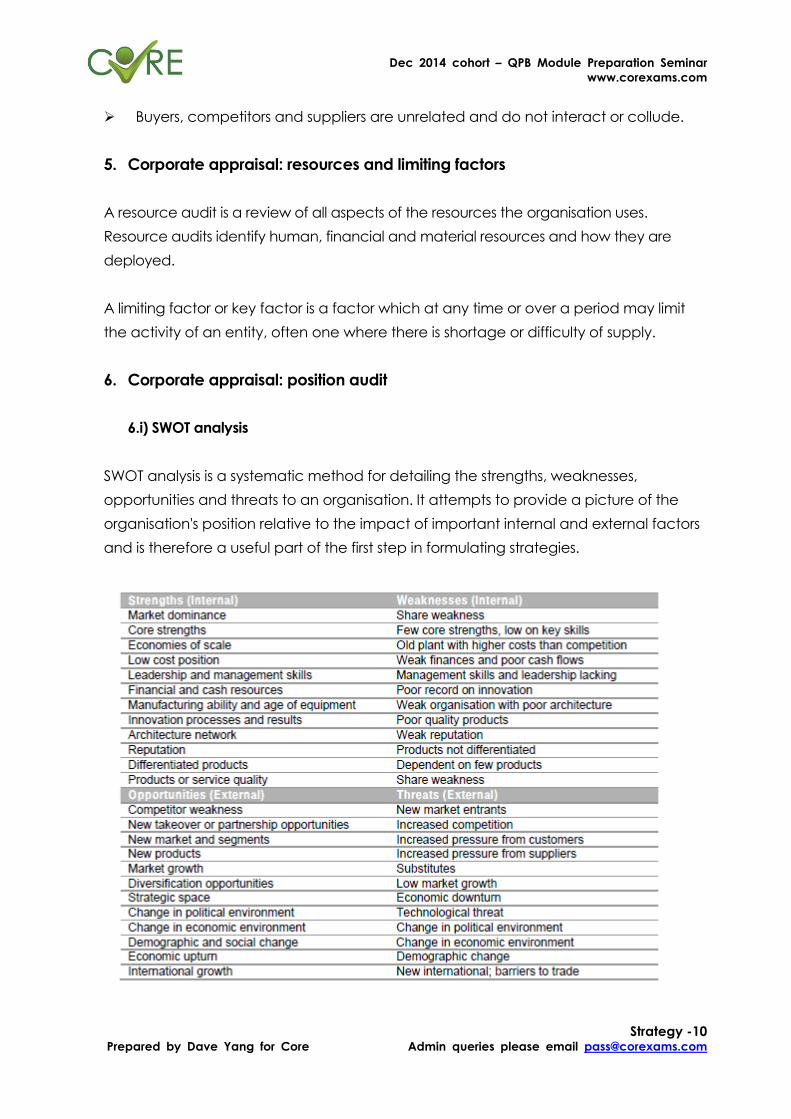
6.i) SWOT analysis
SWOT analysis is a systematic method for detailing the strengths, weaknesses,
opportunities and threats to an organisation. It attempts to provide a picture of the
organisation's position relative to the impact of important internal and external factors
and is therefore a useful part of the first step in formulating strategies.
Dec 2014 cohort – QPB Module Preparation Seminar
www.corexams.com
Strategy -11 Prepared by Dave Yang for Core Admin queries please email [email protected]
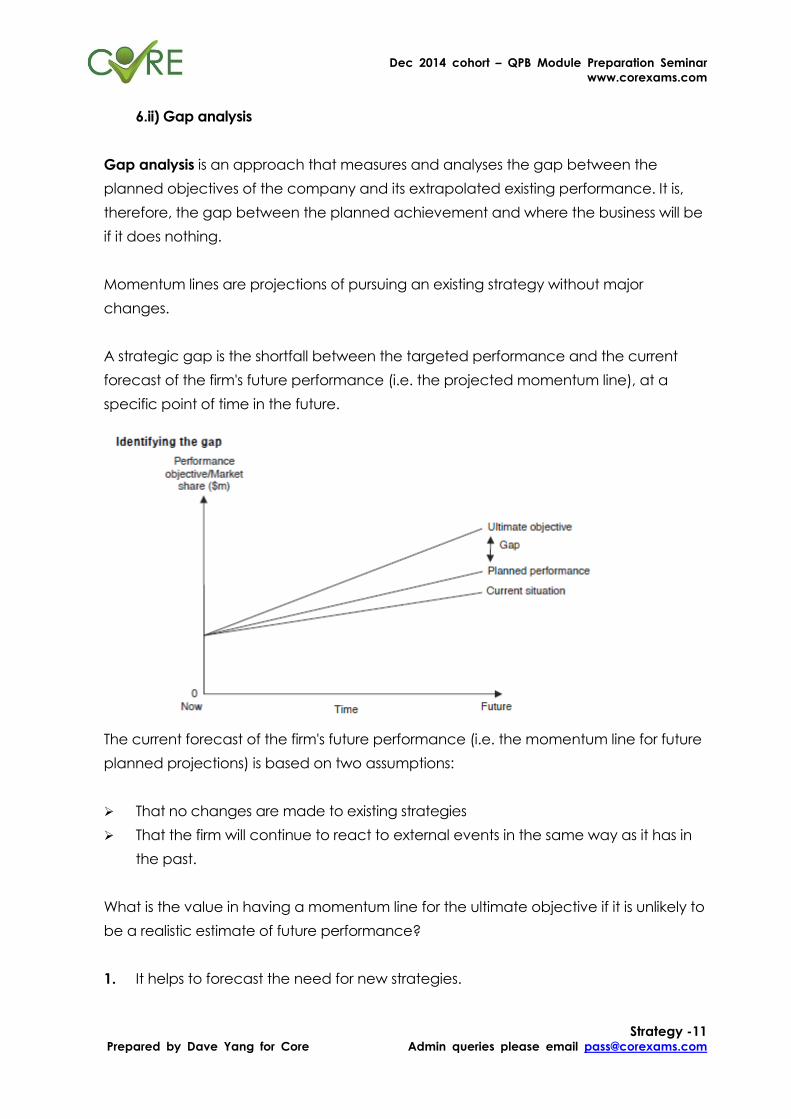
6.ii) Gap analysis
Gap analysis is an approach that measures and analyses the gap between the
planned objectives of the company and its extrapolated existing performance. It is,
therefore, the gap between the planned achievement and where the business will be
if it does nothing.
Momentum lines are projections of pursuing an existing strategy without major
changes.
A strategic gap is the shortfall between the targeted performance and the current
forecast of the firm's future performance (i.e. the projected momentum line), at a
specific point of time in the future.
The current forecast of the firm's future performance (i.e. the momentum line for future
planned projections) is based on two assumptions:
That no changes are made to existing strategies
That the firm will continue to react to external events in the same way as it has in
the past.
What is the value in having a momentum line for the ultimate objective if it is unlikely to
be a realistic estimate of future performance?
1. It helps to forecast the need for new strategies.
Dec 2014 cohort – QPB Module Preparation Seminar
www.corexams.com
Strategy -12 Prepared by Dave Yang for Core Admin queries please email [email protected]
2. Standing still may be better than changing just for the sake of it.
3. Incorporating new strategies would make accuracy even more difficult.
4. Simple momentum lines remove some of the complexity of real-life situations.
5. The work on preparing momentum lines highlights the important indicators.
6. It canhighlight the speed and size of recent change.
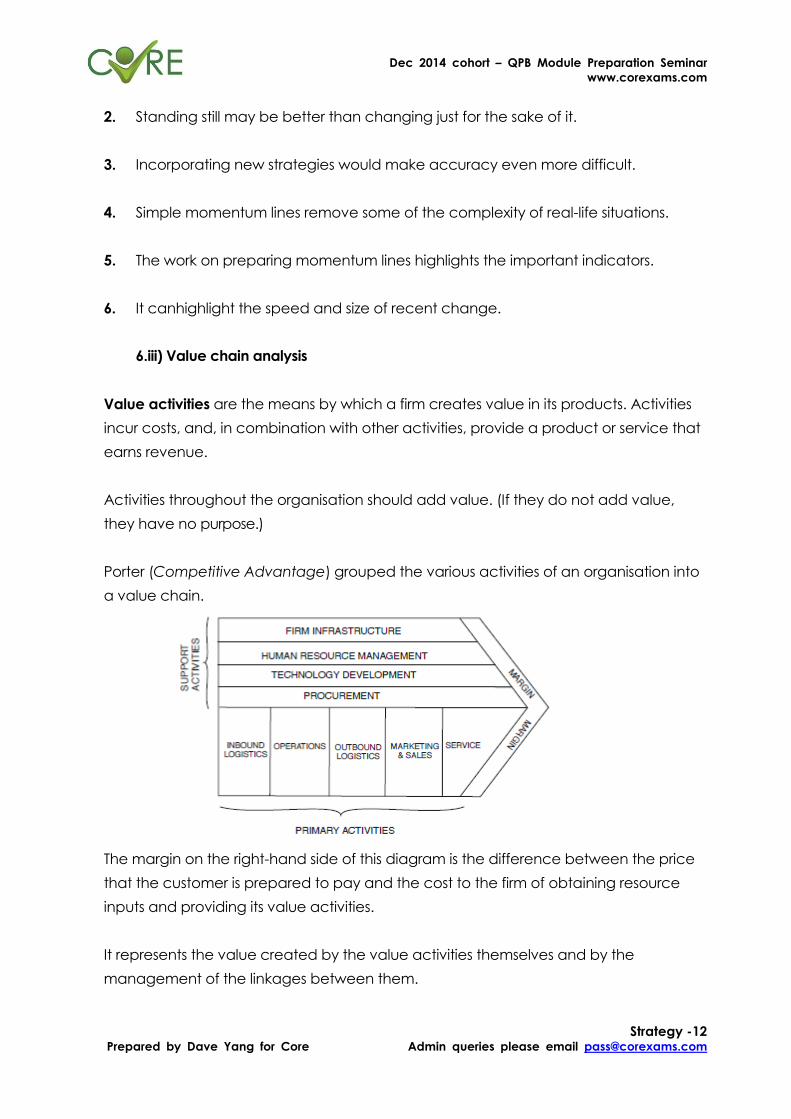
6.iii) Value chain analysis
Value activities are the means by which a firm creates value in its products. Activities
incur costs, and, in combination with other activities, provide a product or service that
earns revenue.
Activities throughout the organisation should add value. (If they do not add value,
they have no purpose.)
Porter (Competitive Advantage) grouped the various activities of an organisation into
a value chain.
The margin on the right-hand side of this diagram is the difference between the price
that the customer is prepared to pay and the cost to the firm of obtaining resource
inputs and providing its value activities.
It represents the value created by the value activities themselves and by the
management of the linkages between them.
Dec 2014 cohort – QPB Module Preparation Seminar
www.corexams.com
Strategy -13 Prepared by Dave Yang for Core Admin queries please email [email protected]
The value chain, core competencies and outsourcing
A core competency will enable the company to create value in a way that its
competitors cannot imitate. These value activities are the basis of the company's
unique offering.
There is a strong case for examining the possibilities of outsourcing non-core activities
so that management can concentrate on what the company does best.
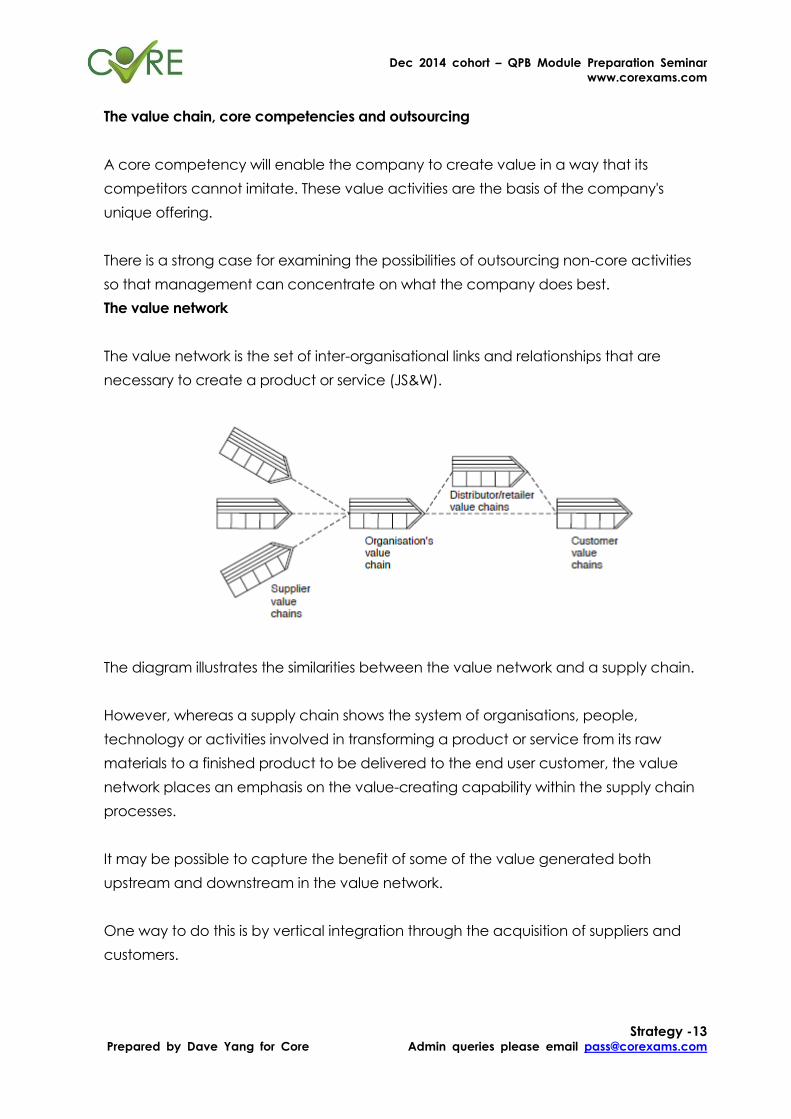
The value network
The value network is the set of inter-organisational links and relationships that are
necessary to create a product or service (JS&W).
The diagram illustrates the similarities between the value network and a supply chain.
However, whereas a supply chain shows the system of organisations, people,
technology or activities involved in transforming a product or service from its raw
materials to a finished product to be delivered to the end user customer, the value
network places an emphasis on the value-creating capability within the supply chain
processes.
It may be possible to capture the benefit of some of the value generated both
upstream and downstream in the value network.
One way to do this is by vertical integration through the acquisition of suppliers and
customers.
Dec 2014 cohort – QPB Module Preparation Seminar
www.corexams.com
Strategy -14 Prepared by Dave Yang for Core Admin queries please email [email protected]
7. Porter’s generic strategies
Porter believes there are three generic strategies for competitive advantage.
Cost leadership means being the lowest cost producer in the industry as a whole.
Differentiation is the exploitation of a product or service that the industry as a
whole believes to be unique.
Focus involves a restriction of activities to only part of the market (a segment).
- Providing goods and/or services at lower cost (cost-focus)
- Providing a differentiated product or service (differentiation-focus)
7.i) Focus (or niche) strategy
In a focus strategy, a firm concentrates its attention on one or more particular
segments or niches of the market, and does not try to serve the entire market with a
single product.
(a) A cost focus strategy: aim to be a cost leader for a particular segment. This type
of strategy is often found in the printing, clothes manufacture and car repair
industries.
(b) A differentiation focus strategy: pursue differentiation for a chosen segment.
Luxury goods suppliers are the prime exponents of such a strategy.
7.ii) Drawbacks of a focus strategy:
The firm sacrifices economies of scale that would be gained by serving a wider
market.
Competitors can move into the segment, with increased resources (for example, the
Japanese moved into the luxury car market, to compete with Mercedes and BMW).
The segment's needs may eventually become less distinct from the main market.
Dec 2014 cohort – QPB Module Preparation Seminar
www.corexams.com
Strategy -15 Prepared by Dave Yang for Core Admin queries please email [email protected]
7.iii) Which Strategy
JS&W (Exploring Corporate Strategy) provide a checklist for assessing strategic options:
1. Suitability - Does the strategy fit the company's operational circumstances and
strategic position? This involves assessing the strategy in relation to issues identified
in the SWOT analysis, its external environment, its mission and objectives and its
competencies.
2. Acceptability - Does the strategy meet the stakeholders' expectations? This
includes consideration of the risks and returns for the company's shareholders but
also the wider stakeholders. It also involves issues such as ethics and corporate
responsibility.
3. Feasibility - Does the organisation have the time and resources to implement the
strategy? Key issues here are whether the company can access sufficient finance
and resources quickly to implement the strategy and whether it will deliver results
within an appropriate timeframe.
Dec 2014 cohort – QPB Module Preparation Seminar
www.corexams.com
Performance measurement systems -1 Prepared by Dave Yang or Core Admin queries please email [email protected]
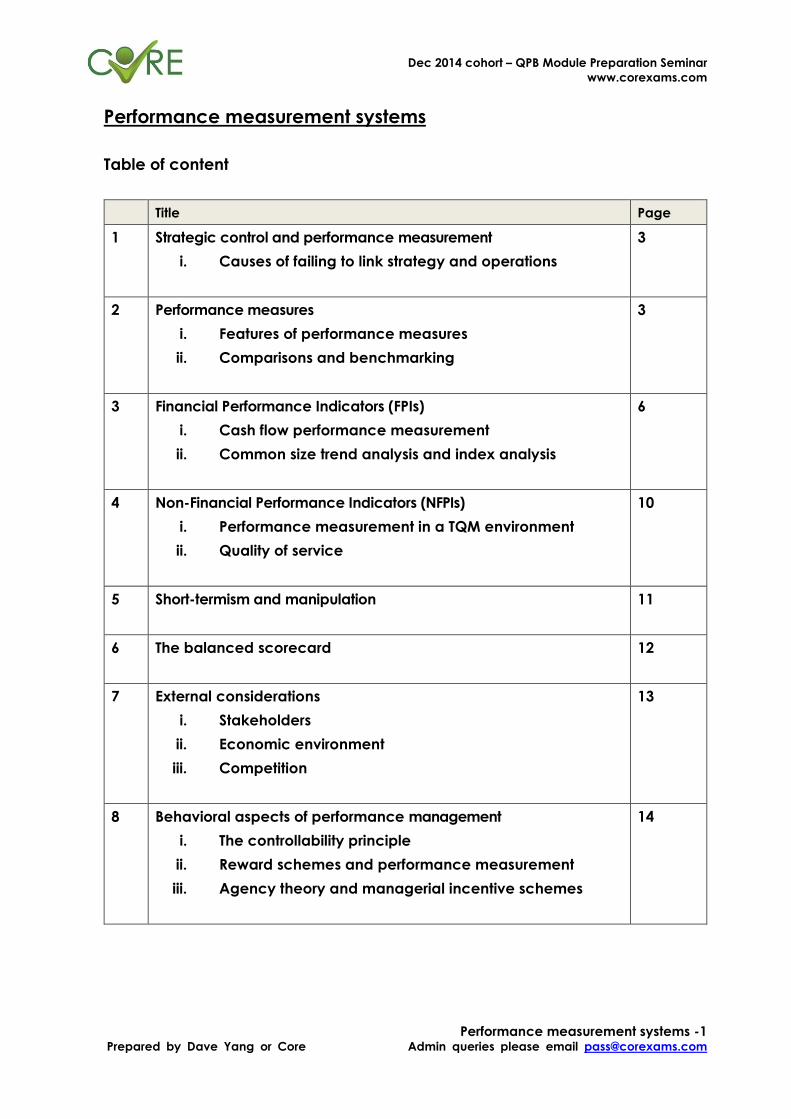
Performance measurement systems
Table of content
Title Page
1 Strategic control and performance measurement
i. Causes of failing to link strategy and operations
3
2 Performance measures
i. Features of performance measures
ii. Comparisons and benchmarking
3
3 Financial Performance Indicators (FPIs)
i. Cash flow performance measurement
ii. Common size trend analysis and index analysis
6
4 Non-Financial Performance Indicators (NFPIs)
i. Performance measurement in a TQM environment
ii. Quality of service
10
5 Short-termism and manipulation
11
6 The balanced scorecard
12
7 External considerations
i. Stakeholders
ii. Economic environment
iii. Competition
13
8 Behavioral aspects of performance management
i. The controllability principle
ii. Reward schemes and performance measurement
iii. Agency theory and managerial incentive schemes
14
Dec 2014 cohort – QPB Module Preparation Seminar
www.corexams.com
Performance measurement systems -2 Prepared by Dave Yang or Core Admin queries please email [email protected]
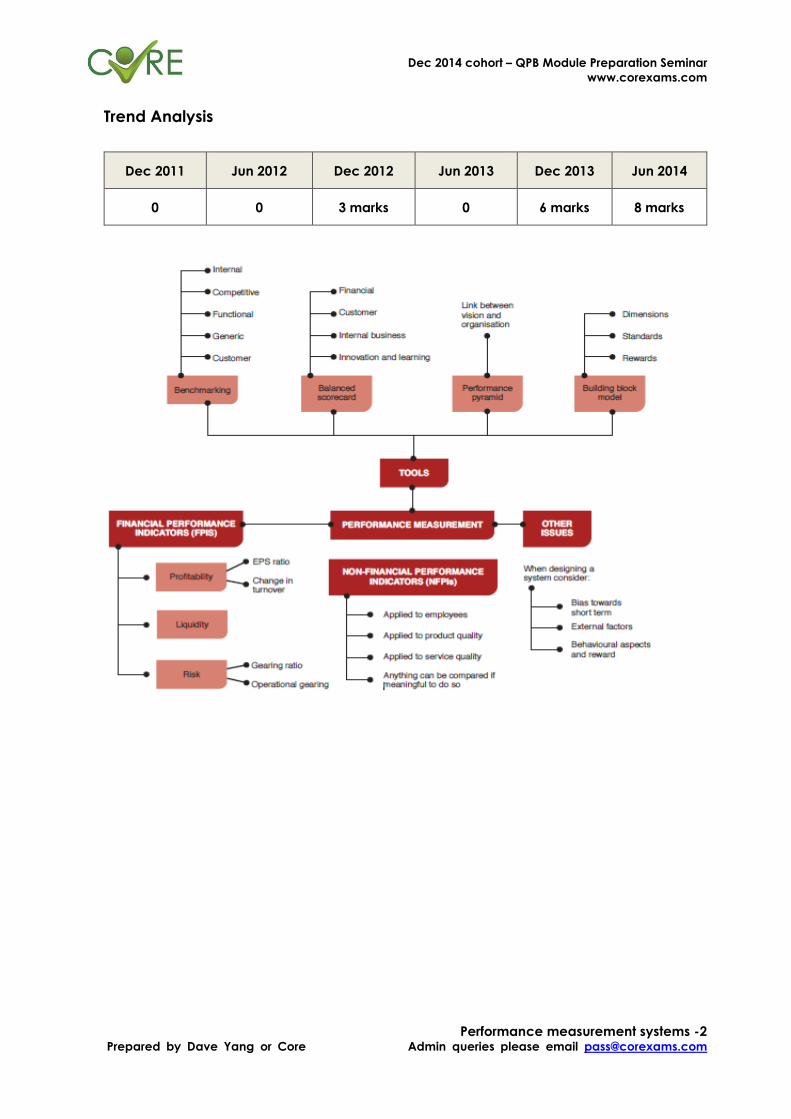
Trend Analysis
Dec 2011 Jun 2012 Dec 2012 Jun 2013 Dec 2013 Jun 2014
0 0 3 marks 0 6 marks 8 marks
Dec 2014 cohort – QPB Module Preparation Seminar
www.corexams.com
Performance measurement systems -3 Prepared by Dave Yang or Core Admin queries please email [email protected]
1. Strategic control and performance measurement
1.i) Causes of failing to link strategy and operations
a. Unrealistic plans: Goals defined is over-ambitious and employees are being forced
to achieve something they think they impossible to do it in the current circumstance
with limited resources.
b. Inconsistent goals: The frequent change of goals will confuse employees in about
the long term achievement of the company. This will affect employees’ morale
and also incur additional costs following the new direction of the company.
c. Poor Communication: Senior management must be able to deliver the key
concepts of the strategy planning of the company to their employees effectively,
clearly and no ambiguity. This can avoid middle management directs their team to
the opposite way of where the company is targeting at.
d. Inadequate performance measurement: There is no systematic and transparent
performance measurement mechanism in the company or insufficient
measurement tools in place to evaluate the targets accomplished by the
responsible employees. Employees who are not rewarded appropriately don’t see
their interest is align with the company’s goals.
2. Performance measures
2.i) Features of performance measures
Characteristics of performance measures:
a. Measurement incurs cost: a net off between cost and benefit of producing a
performance indicator
b. Measurement is meaningful only when only there is a benchmark to measure
against
c. Must be relevant
d. Must be fair
Dec 2014 cohort – QPB Module Preparation Seminar
www.corexams.com
Performance measurement systems -4 Prepared by Dave Yang or Core Admin queries please email [email protected]
e. Both short term and long term achievement should be measured, but may lead
to agency problems
f. A variety of measures should be used: A single measure may be manipulated
or distorted by the management; balanced scorecard provides a method of
measuring performance from a number of perspectives
g. Realistic estimate
h. Continuous supervision
2.ii) Comparisons and benchmarking
Exam: comparisons must be made with:
1. Company’s past performance or budget
2. Between divisions of the organization
3. Competitors
Define benchmarks:
The establishment, through data gathering, of targets and comparators, that permits
relative levels of performance (and particular areas of underperformance) to be
identified. Adoption of identified best practices should improve performance.
It is a reference point where a company to conclude whether it is doing good or
bad since it is a performance measure and review.
Types of Benchmarks
a. Internal benchmarks
b. Competitive benchmarks
c. Functional benchmarks (non-competing sectors but with similar core operations)
d. Generic benchmarks
e. Customer benchmarks (with customer expectation)
Dec 2014 cohort – QPB Module Preparation Seminar
www.corexams.com
Performance measurement systems -5 Prepared by Dave Yang or Core Admin queries please email [email protected]
Sources of gathering benchmark data:
a. Existing well recognized benchmarks or indices
b. Analyst report from brokers or bankers
c. International authorities (E.g. World Bank, IMF)
d. Comparable companies which are listed (annual report available)
e. Market research (news, journal, price quotation from services provider)
f. Inter-firm comparison reports (from government bodies, lagging behind)
Why use benchmarking? (Advantages of using benchmarks)
a. Help organization to focus on change and provides the direction for the change
process.
b. It can be a spark to innovation. New challenges need new method to counter.
c. It identifies the processes to improve or be more effective. It helps with cost
reduction.
d. It can provide early warning of competitive disadvantage.
e. Position audit. Benchmarking can assess a firm's existing position, and provide a
basis for establishing standards of performance.
f. Its flexibility means that it can be used in both the public and private sectors and
by people at different levels of responsibility.
g. Cross comparisons (as opposed to comparisons with similar organizations) are
more likely to expose radically different ways of doing things.
h. It should lead to a greater incidence of team working and cross-functional
learning.
Dec 2014 cohort – QPB Module Preparation Seminar
www.corexams.com
Performance measurement systems -6 Prepared by Dave Yang or Core Admin queries please email [email protected]
Weaknesses of benchmarking
a. Does not consider the circumstances under which the competitors attained
such standards.
b. Following competitors’ actions will only limit organization’s ability to innovate
and counter challenges.
c. Successful practices in one organization may not transfer successfully to another.
d. It is always not easy to obtain competitors’ information and the reliability is not
guaranteed.
e. It can be difficult to decide which activities to benchmark or not all activities
can be benchmarked.
f. It may be difficult to identify the "best in class" for each activity.
g. It is meaningless to use out-dated benchmark if there is in lack of info to update
it.
3. Financial Performance Indicators (FPIs)
All financial ratios analysis are consolidated in Chapter 3.
3.i) Cash flow performance measurement
Reasons to hold cash:
Pay transactions arising in the ordinary course of business
As a buffer to satisfy potential cash needs
For speculative purposes in order to take advantage of potential profit making
situations
Marginal cash flow
Marginal cash flow shows the net of the variable cash inflows generated by operations
after financing the variable working capital used by these operations.
Dec 2014 cohort – QPB Module Preparation Seminar
www.corexams.com
Performance measurement systems -7 Prepared by Dave Yang or Core Admin queries please email [email protected]
Marginal cash flow is the difference between the margin of a product and the marginal
working capital required to support the sale of the product which includes trade
receivables and inventory, less trade payables required for the next unit of product or
service.
It helps to indicate what is likely to happen to cash flow in the future if these fundamental
relationships are maintained
The Marginal Cash Flow (MCF) calculation is:
MCF = Contribution Margin - Change in Working Capital
Where Change in working capital is an increase in working capital, if not any decrease
is added rather than subtracted
Operating cash flow
Operating cash flow measures the cash generated from operations, less the cash
invested to fund operations and indicates whether the business' ongoing ordinary
operations are providing cash towards paying interest, tax, dividends, and so on.
If operating cash flow is negative there is not necessarily a problem. The business may
be investing in non-current assets for future growth.
The Operating Cash Flow (OCF) calculation is:
OCF = EBIT - change in net operating assets
Where Change in Net Operating Assets =
Current Assets + Non-Current Assets - Current Liabilities – Cash-in-Hand +
Bank Overdraft
Net cash flow
Net cash flow is the real cash flow, the change in borrowings for the year. Depreciation
and other non-cash items are included in the determination of retained income and in
the change in net assets.
Dec 2014 cohort – QPB Module Preparation Seminar
www.corexams.com
Performance measurement systems -8 Prepared by Dave Yang or Core Admin queries please email [email protected]
Net cash flow is the operating cash flow less interest, tax, dividends and extraordinary
items (if applicable) and changes in equity, provision for tax and provision for dividend
(if applicable).
3.ii) Common size trend analysis and index analysis
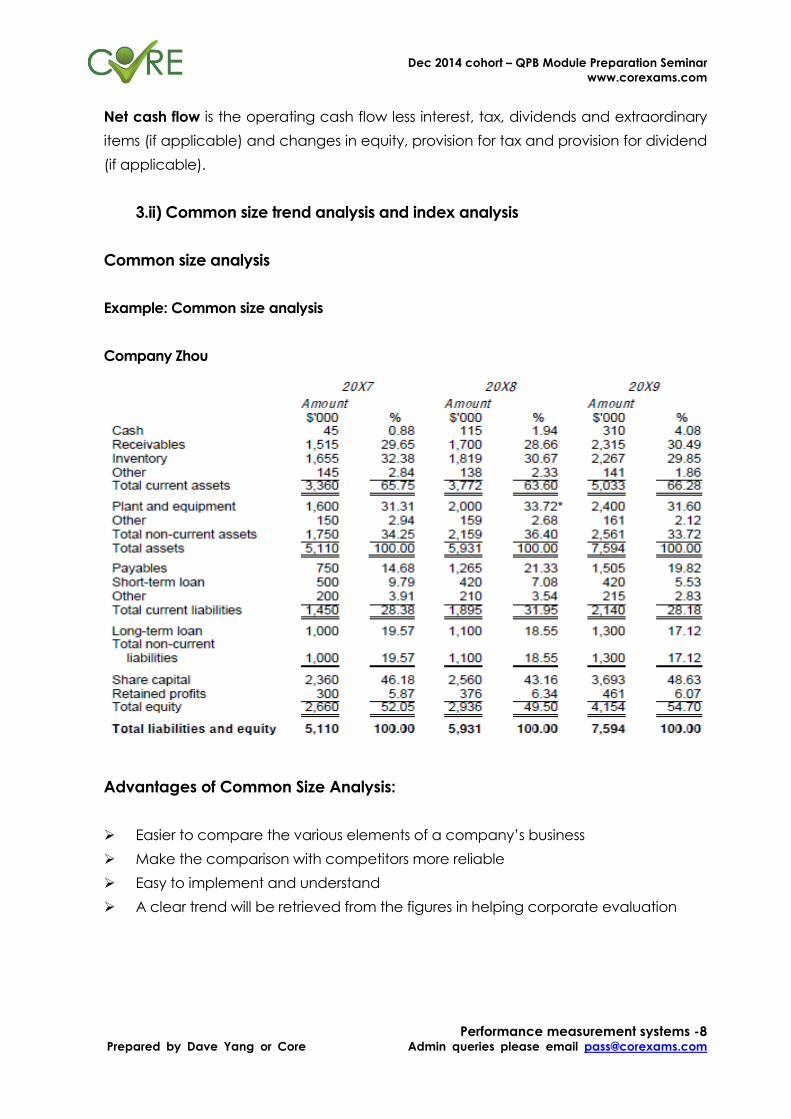
Common size analysis
Example: Common size analysis
Company Zhou
Advantages of Common Size Analysis:
Easier to compare the various elements of a company’s business
Make the comparison with competitors more reliable
Easy to implement and understand
A clear trend will be retrieved from the figures in helping corporate evaluation
Dec 2014 cohort – QPB Module Preparation Seminar
www.corexams.com
Performance measurement systems -9 Prepared by Dave Yang or Core Admin queries please email [email protected]
Disadvantages:
Different companies use different accounting periods and accounting practices
Not easy to determine the “benchmark ratio” of an industry; market leaders
doesn’t mean they have the best ratio in every aspect
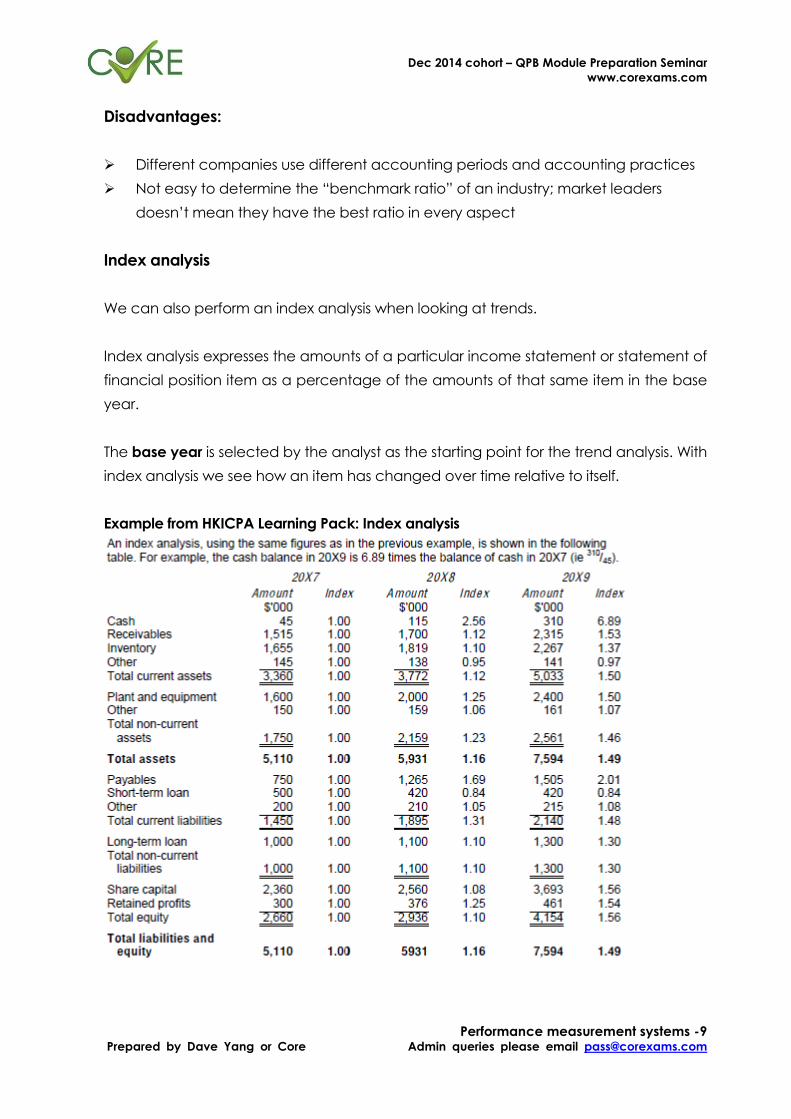
Index analysis
We can also perform an index analysis when looking at trends.
Index analysis expresses the amounts of a particular income statement or statement of
financial position item as a percentage of the amounts of that same item in the base
year.
The base year is selected by the analyst as the starting point for the trend analysis. With
index analysis we see how an item has changed over time relative to itself.
Example from HKICPA Learning Pack: Index analysis
Dec 2014 cohort – QPB Module Preparation Seminar
www.corexams.com
Performance measurement systems -10 Prepared by Dave Yang or Core Admin queries please email [email protected]
Disadvantages of Index Analysis:
It is only as good as company uses it for internal comparison.
Define of base year become very important. The index may become meaningless
after many years without resetting the base year to more recent past. Subject to
manipulation.
It will become a complicated measures if a company is trying to compare with
competitors as time goes by.
4. Non-Financial Performance Indicators (NFPIs)
a. Not only focus on financial variables
b. Lack of information on quality of operations
c. Can’t reflect the true picture of the changes in competitive environment
d. Blindly focusing on cost reduction and ignore other important strategic
manufacturing goals
e. NFPIs are a better indicator of future prospects
4.i) Performance measurement in a TQM environment
Total Quality Management (TQM) is a comprehensive and structured approach to
organisational management that seeks to improve the quality of products and
services through ongoing refinements in response to continuous feedback.
TQM is a highly significant trend in modern business thinking. Because TQM embraces
every activity of a business, it is an all-round measure of different departments of the
company.
a. Measuring the quality of incoming supplies. Quality control of goods inwards and
measurement of rejects.
b. Monitoring work done as it proceeds. "In-process" controls include statistical process
controls and random sampling, and measures such as the amount of scrap and
reworking in relation to good production.
Dec 2014 cohort – QPB Module Preparation Seminar
www.corexams.com
Performance measurement systems -11 Prepared by Dave Yang or Core Admin queries please email [email protected]
c. Measuring customer satisfaction. Complaints may be monitored in the form of
letters of complaint, returned goods, penalty discounts, claims under guarantee,
or requests for visits by service engineers. Surveying their customers on a regular
basis is a proactive approach.
4.ii) Quality of service
Measures of customer satisfaction
Questionnaires / Market research information on customer preferences and
customer satisfaction with specific product features
Number of defective units supplied to customers
Number of customer complaints
On-time delivery rate
Average time to deal with customer queries
Repeat business from existing customers
5. Short-termism and manipulation
Short-termism is when there is a bias towards short-term rather than long-term
performance. It is often due to the fact that managers' performance is measured on
short-term results.
Organisations often have to make a trade-off between short-term and long-term
objectives. Decisions which involve the sacrifice of longer-term objectives include the
following:
a. Postponing or abandoning capital expenditure projects, this would eventually
contribute to growth and profits, in order to protect short-term cash flow and
profits.
b. Cutting R&D expenditure to save operating costs, and so reducing the prospects
for future product development.
c. Reducing quality control, to save operating costs (but also adversely affecting
reputation and goodwill).
Dec 2014 cohort – QPB Module Preparation Seminar
www.corexams.com
Performance measurement systems -12 Prepared by Dave Yang or Core Admin queries please email [email protected]
d. Reducing the level of customer service, to save operating costs (but sacrificing
goodwill).
e. Cutting training costs or recruitment (so the company might be faced with skills
shortages).
Managers may also manipulate results, especially if rewards are linked to
performance. This can be achieved by changing the timing of capital purchases,
building up inventories and speeding up or delaying payments and receipts.
Methods to encourage a long-term view
a. Making short-term targets realistic. If budget targets are unrealistically tough, a
manager will be forced to make trade-offs between the short and long term.
b. Providing sufficient management information to allow managers to see what
trade-offs they are making. Managers must be kept aware of long-term aims as
well as shorter-term (budget) targets.
c. Evaluating managers' performance in terms of contribution to long-term as well as
short- term objectives.
d. Link managers' rewards to share price. This may encourage goal congruence.
e. Set quality based targets as well as financial targets. Multiple targets can be used.
6. The balanced scorecard
The balanced scorecard approach emphasises the need to provide management
with a set of information which covers all relevant areas of performance in an
objective and unbiased fashion. The information provided may be both financial and
non-financial and cover areas such as profitability, customer satisfaction, internal
efficiency and innovation to reflect different aspect of achievement.
Important features of this approach are as follows:
a. It looks at both internal and external matters concerning the organisation.
Dec 2014 cohort – QPB Module Preparation Seminar
www.corexams.com
Performance measurement systems -13 Prepared by Dave Yang or Core Admin queries please email [email protected]
b. It is related to the key elements of a company's strategy.
c. Financial and non-financial measures are linked together.
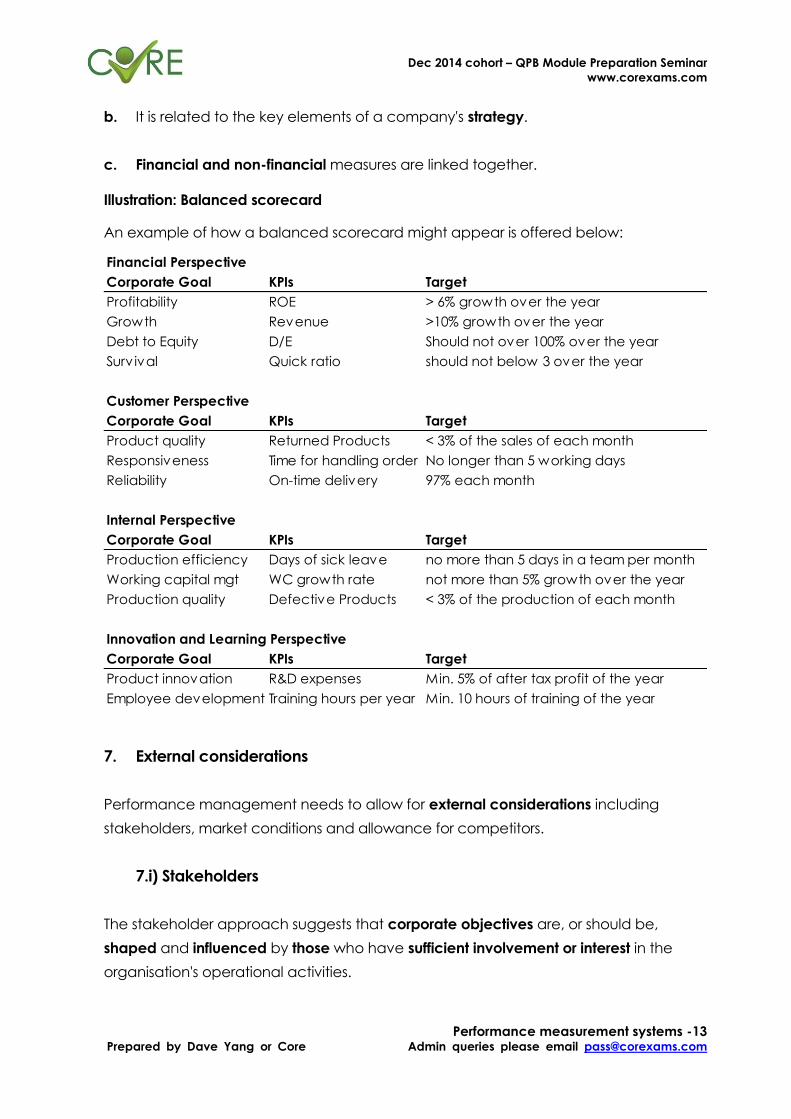
Illustration: Balanced scorecard An example of how a balanced scorecard might appear is offered below:
7. External considerations
Performance management needs to allow for external considerations including
stakeholders, market conditions and allowance for competitors.
7.i) Stakeholders
The stakeholder approach suggests that corporate objectives are, or should be,
shaped and influenced by those who have sufficient involvement or interest in the
organisation's operational activities.
Financial Perspective
Corporate Goal KPIs Target
Profitability ROE > 6% growth over the year
Growth Revenue >10% growth over the year
Debt to Equity D/E Should not over 100% over the year
Surv ival Quick ratio should not below 3 over the year
Customer Perspective
Corporate Goal KPIs Target
Product quality Returned Products < 3% of the sales of each month
Responsiveness Time for handling order No longer than 5 working days
Reliability On-time delivery 97% each month
Internal Perspective
Corporate Goal KPIs Target
Production efficiency Days of sick leave no more than 5 days in a team per month
Working capital mgt WC growth rate not more than 5% growth over the year
Production quality Defective Products < 3% of the production of each month
Innovation and Learning Perspective
Corporate Goal KPIs Target
Product innovation R&D expenses Min. 5% of after tax profit of the year
Employee development Training hours per year Min. 10 hours of training of the year
Dec 2014 cohort – QPB Module Preparation Seminar
www.corexams.com
Performance measurement systems -14 Prepared by Dave Yang or Core Admin queries please email [email protected]
7.ii) Economic environment
Economic growth; Local economic trends; Inflation; Interest rates; Exchange rates;
Government fiscal policy; Government spending
7.iii) Competition
Performance management must consider information on competitors' prices and cost
structures and identify which features of an organisation's products add most value.
Management accounting information has to be produced speedily and be up to
date so that managers can react quickly and effectively to changing market
conditions.
8. Behavioral aspects of performance management
8.i) The controllability principle
As we have seen, the controllability principle is that managers of responsibility centres
should only be held accountable for costs over which they have some influence.
From a motivation point of view this is important because it can be very demoralising
for managers who feel that their performance is being judged on the basis of
something over which they have no control.
8.ii) Reward schemes and performance measurement
Problems associated with reward schemes
a. Performance-related pay and performance evaluation systems can encourage
dysfunctional behaviour. E.g. Pet projects, focus on short-term performance.
b. Schemes designed to ensure long-term achievements (that is, to combat short-
termism) may not motivate since efforts and reward are too distant in time from
each other (or managers may not think they will be around that long!).
Dec 2014 cohort – QPB Module Preparation Seminar
www.corexams.com
Performance measurement systems -15 Prepared by Dave Yang or Core Admin queries please email [email protected]
c. It is questionable whether any performance measures or set of measures can
provide a comprehensive assessment of what a single person achieves for an
organization (e.g. lack of goal congruence, - employees being committed to
what is measured, rather than the objectives of the organization)
d. Self-interested performance may be encouraged at the expense of team work.
e. In order to make bonuses more accessible, standards and targets may have to be
lowered, with knock-on effects on quality.
8.iii) Agency theory and managerial incentive schemes
An agency theory exists whenever one party (the principal) hires another party (the
agent) to perform some service, and the agent’s interest is not align with the principal.
E.g. The CEO is looking for long-term company growth but the middle management is
only acting on short-term planning for their own bonus.
It is a costly procedure to monitor the middle management whether they are acting
on their best effort.
Therefore, to encourage managers to take actions that are in the firm's best interests,
the owners may introduce incentive compensation plans that enable the managers
to share in the firm's increased wealth.
Dec 2014 cohort – QPB Module Preparation Seminar
www.corexams.com
Performance measurement systems -16 Prepared by Dave Yang or Core Admin queries please email [email protected]
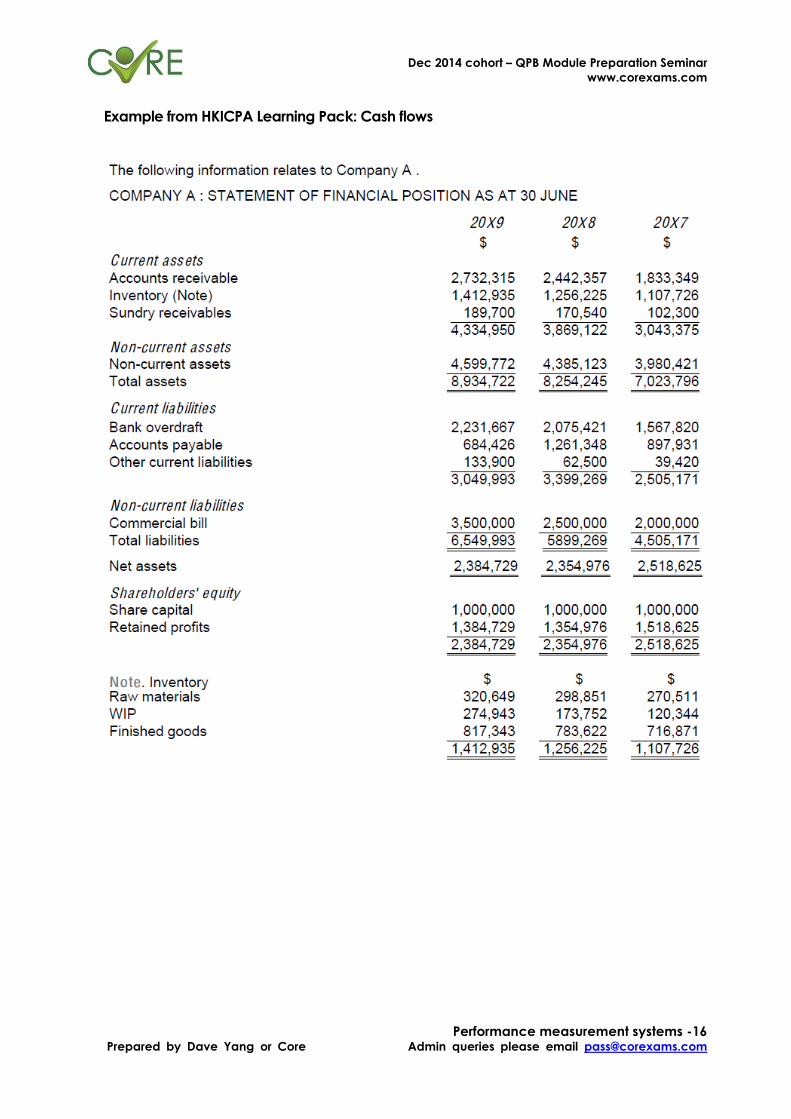
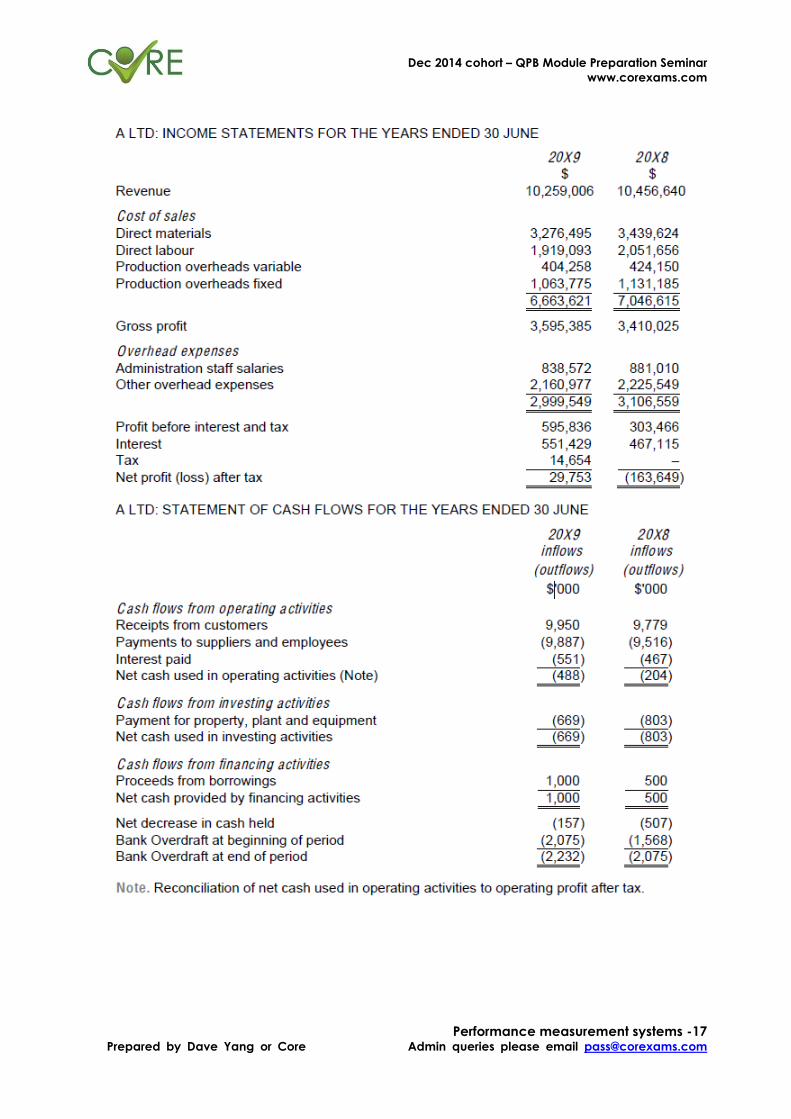
Example from HKICPA Learning Pack: Cash flows
Dec 2014 cohort – QPB Module Preparation Seminar
www.corexams.com
Performance measurement systems -17 Prepared by Dave Yang or Core Admin queries please email [email protected]
Dec 2014 cohort – QPB Module Preparation Seminar
www.corexams.com
Performance measurement systems -18 Prepared by Dave Yang or Core Admin queries please email [email protected]
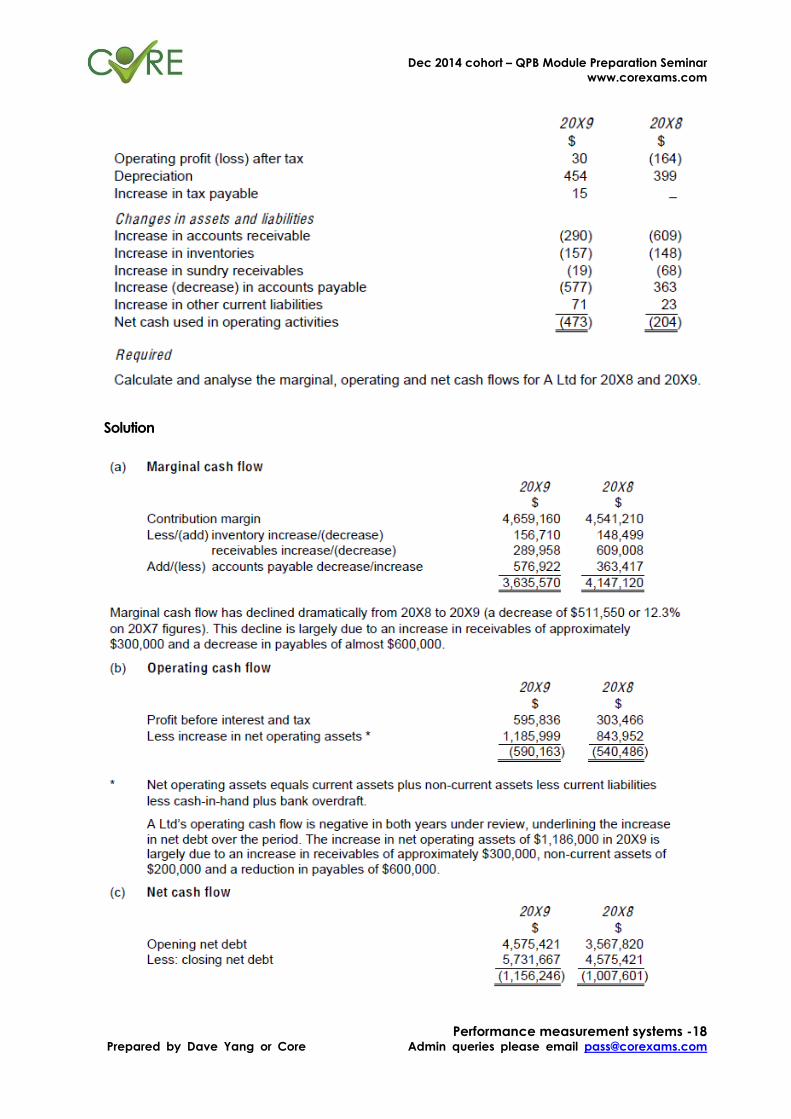
Solution

Dec 2014 cohort – QPB Module Preparation Seminar
www.corexams.com
Performance measurement systems -19 Prepared by Dave Yang or Core Admin queries please email [email protected]
Dec 2014 cohort – QPB Module Preparation Seminar
www.corexams.com
Investment appraisal -1 Prepared by Core for Dave Yang Admin queries please email [email protected]
Investment appraisal
Table of content
Title Page
1 The capital budgeting process
i. Creation of capital budgets
ii. The investment decision-making process
4
2 Relevant cash flows
i. Relevant cash flows in investment appraisal
ii. Relevant benefits of investments
4
3 The payback period
iii. Why is payback alone an inadequate investment
appraisal technique?
iv. Disadvantages of the payback method
v. Advantages of the payback method
7
4 The return on capital employed
i. ROCE and the comparison of mutually exclusive projects
ii. The advantages and disadvantages to the ROCE method
8
5 DCF: NPV and IRR compared
i. Advantages and disadvantages of IRR
ii. Non-conventional cash flows
iii. Mutually exclusive projects
iv. Reinvestment assumptions
v. Summary of NPV and IRR comparison
13
6 Assessment of DCF methods of project appraisal
i. Advantages of DCF methods
ii. Problems with DCF methods
iii. The use of appraisal methods in practice
18
7 Allowing for inflation
iv. Real rate or the nominal rate?
18
Dec 2014 cohort – QPB Module Preparation Seminar
www.corexams.com
Investment appraisal -2 Prepared by Core for Dave Yang Admin queries please email [email protected]
v. The advantages and misuses of real values and a real rate
of return
vi. Expectations of inflation and the effects of inflation
8 Allowing for taxation
i. General points
ii. Tax-allowable depreciation
iii. Taxation and DCF
iv. NPV layout
20
9 Working capital
22
10 Impact of cost of capital on investments
iv. The relationship between company value and cost of
capital
v. Using the WACC in investment appraisal
vi. The arguments against using the WACC
23
11 Risk and uncertainty
i. Sensitivity analysis
ii. Probability analysis
iii. Other risk adjustment techniques
24
Trend Analysis
Dec 2011 Jun 2012 Dec 2012 Jun 2013 Dec 2013 Jun 2014
0 0 16 marks 0 0 0
Dec 2014 cohort – QPB Module Preparation Seminar
www.corexams.com
Investment appraisal -3 Prepared by Core for Dave Yang Admin queries please email [email protected]
Dec 2014 cohort – QPB Module Preparation Seminar
www.corexams.com
Investment appraisal -4 Prepared by Core for Dave Yang Admin queries please email [email protected]
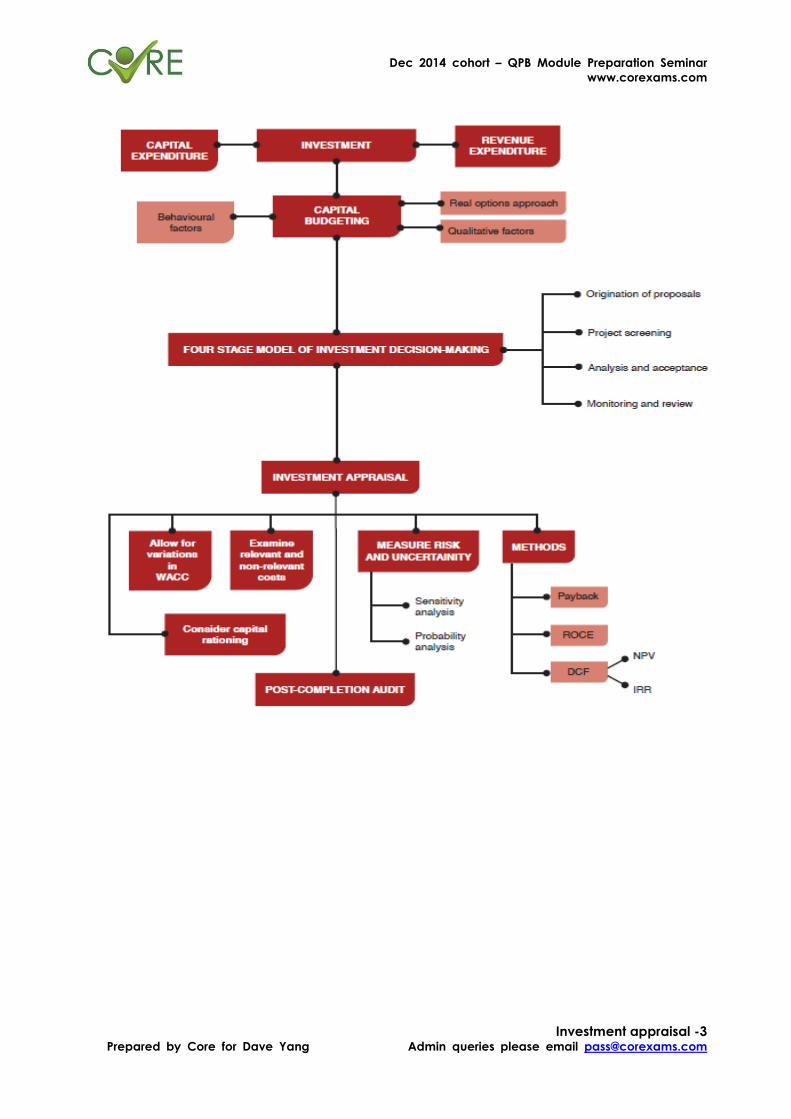
1. The capital budgeting process
1.i) The investment decision-making process
A typical model for investment decision making has a number of distinct stages:
Origination of proposals
Project screening
Analysis and acceptance
Monitoring and review
2. Relevant cash flows
2.i) Relevant cash flows in investment appraisal
Opportunity costs
These are the costs incurred or revenues lost from diverting existing resources from their
best use.
Tax
The extra taxation that will be payable on extra profits, or the reductions in tax arising
from capital allowances or operating losses in any year.
Residual value
The residual value or disposal value of equipment at the end of its life, or its disposal
cost.
Working capital
Changes in working capital create a difference between "cash profit" and actual cash
flows in a period.
Dec 2014 cohort – QPB Module Preparation Seminar
www.corexams.com
Investment appraisal -5 Prepared by Core for Dave Yang Admin queries please email [email protected]
Other relevant costs
Costs that will often need to be considered include:
1. incremental infrastructure costs, such as additional information technology or
communication systems
2. marketing costs, which may be substantial, particularly if the investment is in a
new product or service. They will include the costs of market research, promotion
and branding and the organisation of new distribution channels
3. human resource costs, including training costs and the costs of reorganisation
arising from investments.
2.ii) Relevant benefits of investments
Types of benefit
The benefits from a proposed investment must also be evaluated. These might consist
of benefits of several types:
1. Savings because assets used currently will no longer be used. The savings should
include:
Savings in staff costs
Savings in other operating costs, such as consumable materials
2. Extra savings or revenue benefits because of the improvements or enhancements
that the investment might bring:
More sales revenue and so additional contribution
More efficient system operation
Further savings in staff time, resulting perhaps in reduced future staff growth
Dec 2014 cohort – QPB Module Preparation Seminar
www.corexams.com
Investment appraisal -6 Prepared by Core for Dave Yang Admin queries please email [email protected]
3. Possibly, some one-off revenue benefits from the sale of assets that are currently in
use, but which will no longer be required.
Some benefits might be intangible, or impossible to give a money value to:
1. Greater customer satisfaction, arising from a more prompt service (e.g. because
of a computerized sales and delivery service)
2. Improved staff morale from working with higher-quality assets
3. Better decision making may result from better information systems
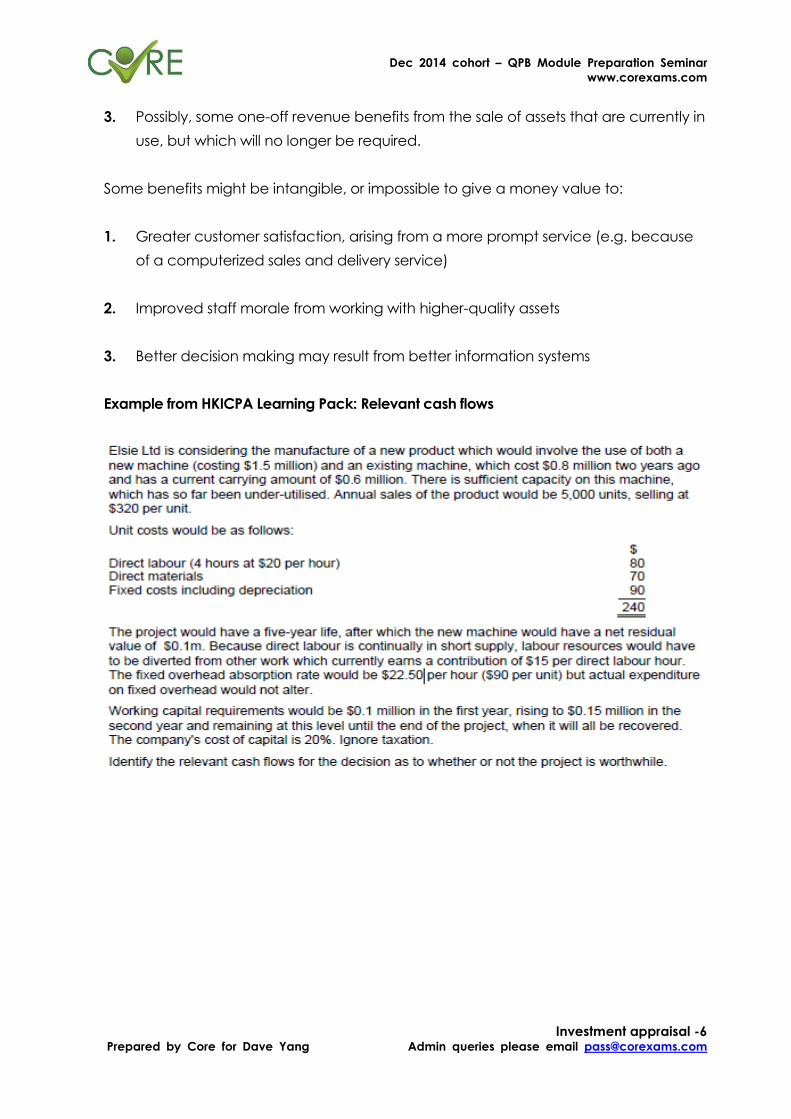
Example from HKICPA Learning Pack: Relevant cash flows
Dec 2014 cohort – QPB Module Preparation Seminar
www.corexams.com
Investment appraisal -7 Prepared by Core for Dave Yang Admin queries please email [email protected]
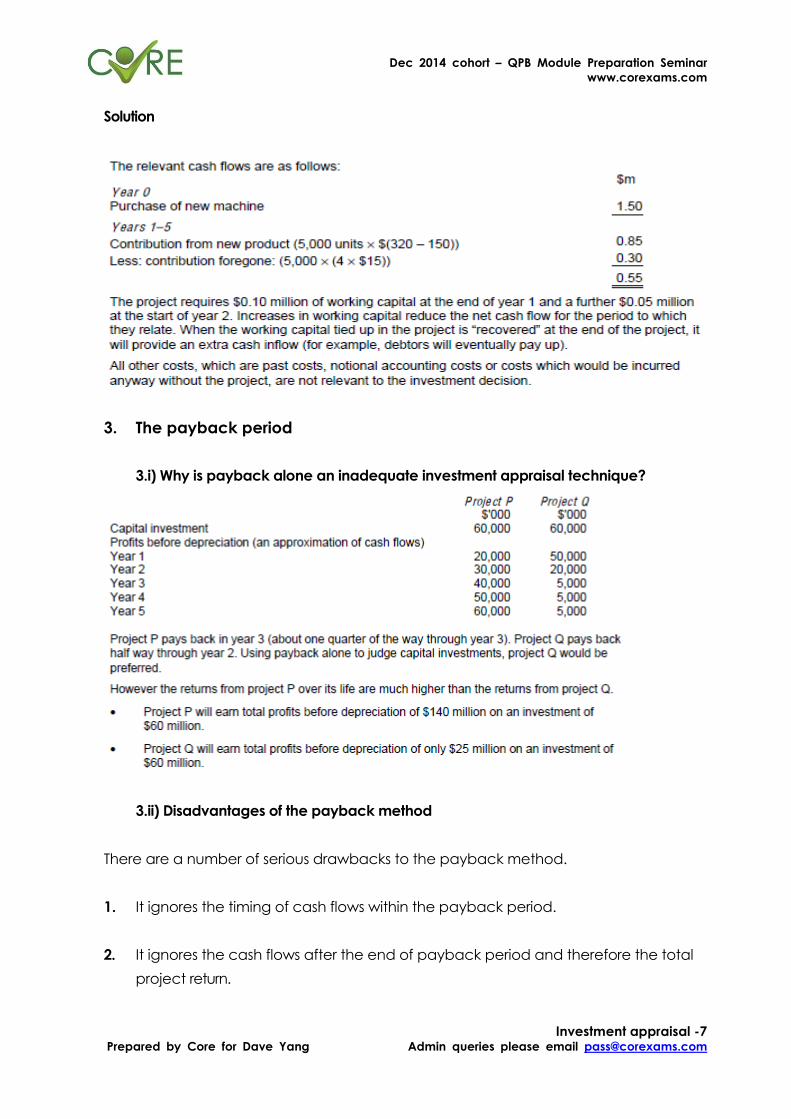
Solution
3. The payback period
3.i) Why is payback alone an inadequate investment appraisal technique?
3.ii) Disadvantages of the payback method
There are a number of serious drawbacks to the payback method.
1. It ignores the timing of cash flows within the payback period.
2. It ignores the cash flows after the end of payback period and therefore the total
project return.
Dec 2014 cohort – QPB Module Preparation Seminar
www.corexams.com
Investment appraisal -8 Prepared by Core for Dave Yang Admin queries please email [email protected]
3. It ignores the time value of money (a concept incorporated into more
sophisticated appraisal methods). This means that it does not take account of the
fact that $1 today is worth more than $1 in one year's time. An investor who has $1
today can either consume it immediately or alternatively can invest it at the
prevailing interest rate, say 10%, to get a return of $1.10 in a year's time.
4. Payback is unable to distinguish between projects with the same payback period.
5. The choice of any cut-off payback period by an organisation is arbitrary.
6. It may lead to excessive investment in short-term projects.
7. It takes account of the risk of the timing of cash flows but not the variability of
those cash flows.
3.iii) Advantages of the payback method
1. It is simple to calculate and simple to understand. This may be important when
management resources are limited. It is similarly helpful in communicating
information about minimum requirements to managers responsible for submitting
projects.
2. It uses cash flows rather than accounting profits.
3. It can be used as a screening device as a first stage in eliminating obviously
inappropriate projects prior to more detailed evaluation.
4. The fact that it tends to bias in favour of short-term projects means that it tends to
minimise both financial and business risk.
5. It can be used when there is a capital rationing situation to identify those projects
which generate additional cash for investment quickly.
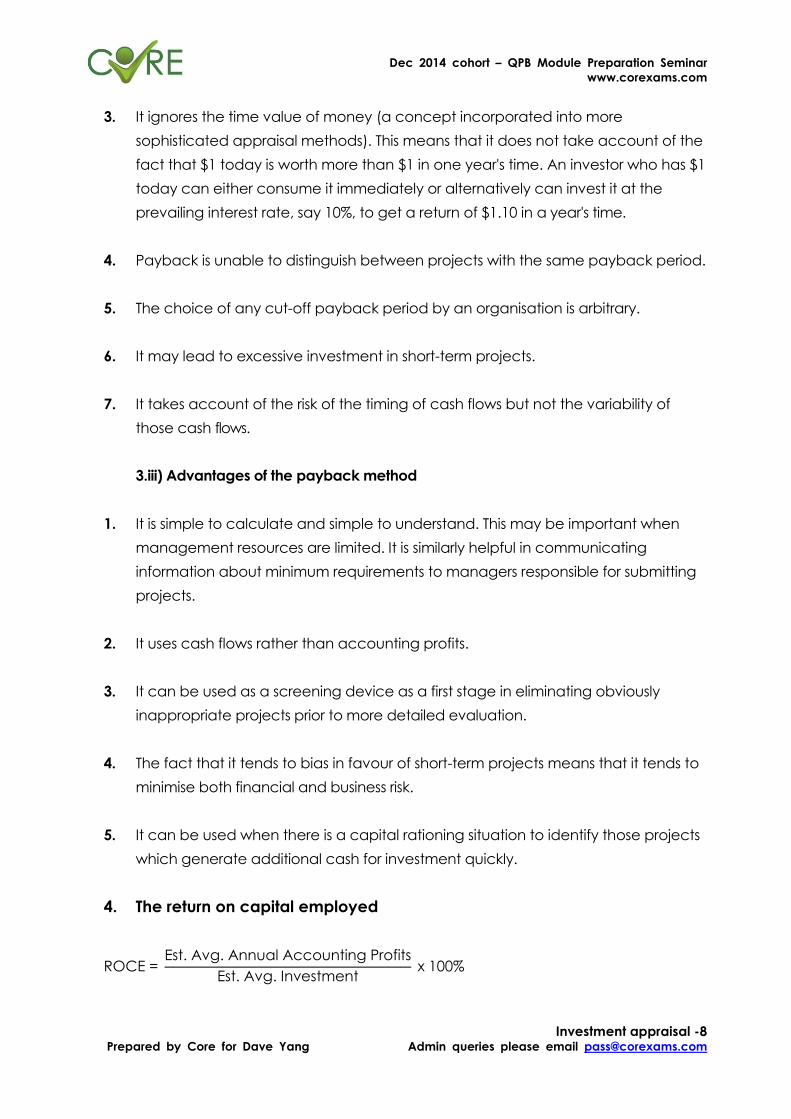
4. The return on capital employed
ROCE = Est. Avg. Annual Accounting Profits
Est. Avg. Investment x 100%
Dec 2014 cohort – QPB Module Preparation Seminar
www.corexams.com
Investment appraisal -9 Prepared by Core for Dave Yang Admin queries please email [email protected]
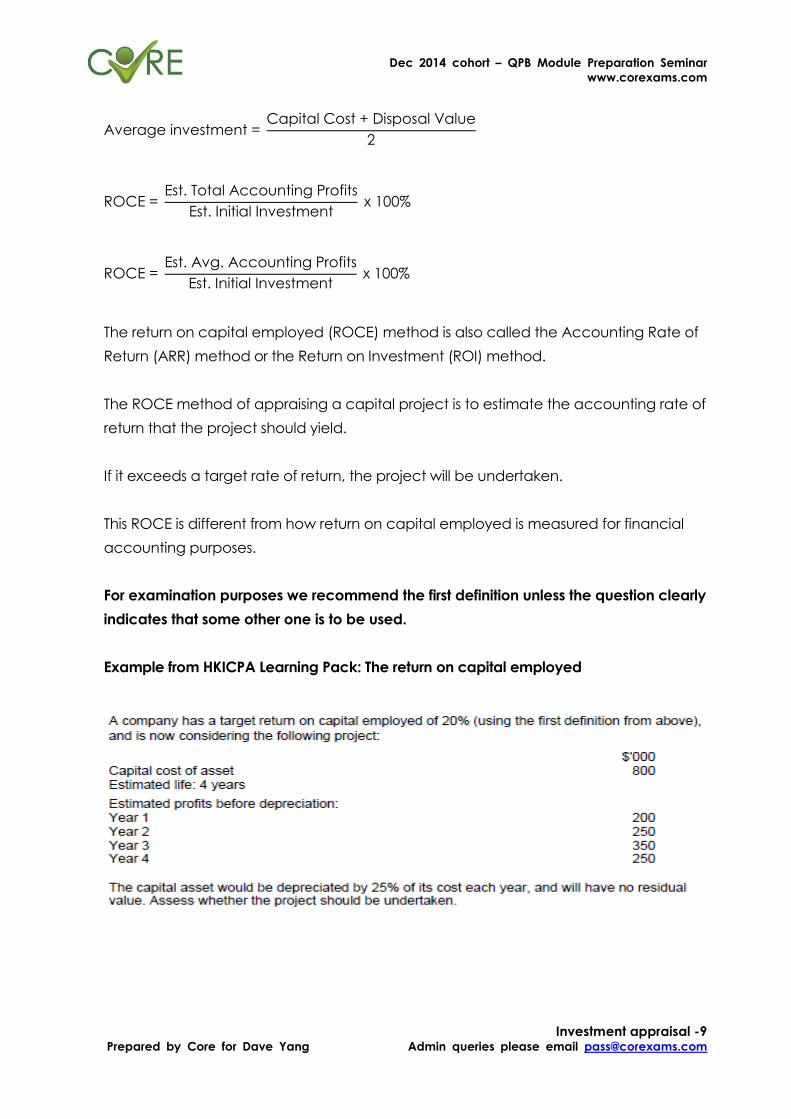
Average investment = Capital Cost + Disposal Value
2
ROCE = Est. Total Accounting Profits
Est. Initial Investment x 100%
ROCE = Est. Avg. Accounting Profits
Est. Initial Investment x 100%
The return on capital employed (ROCE) method is also called the Accounting Rate of
Return (ARR) method or the Return on Investment (ROI) method.
The ROCE method of appraising a capital project is to estimate the accounting rate of
return that the project should yield.
If it exceeds a target rate of return, the project will be undertaken.
This ROCE is different from how return on capital employed is measured for financial
accounting purposes.
For examination purposes we recommend the first definition unless the question clearly
indicates that some other one is to be used.
Example from HKICPA Learning Pack: The return on capital employed
Dec 2014 cohort – QPB Module Preparation Seminar
www.corexams.com
Investment appraisal -10 Prepared by Core for Dave Yang Admin queries please email [email protected]
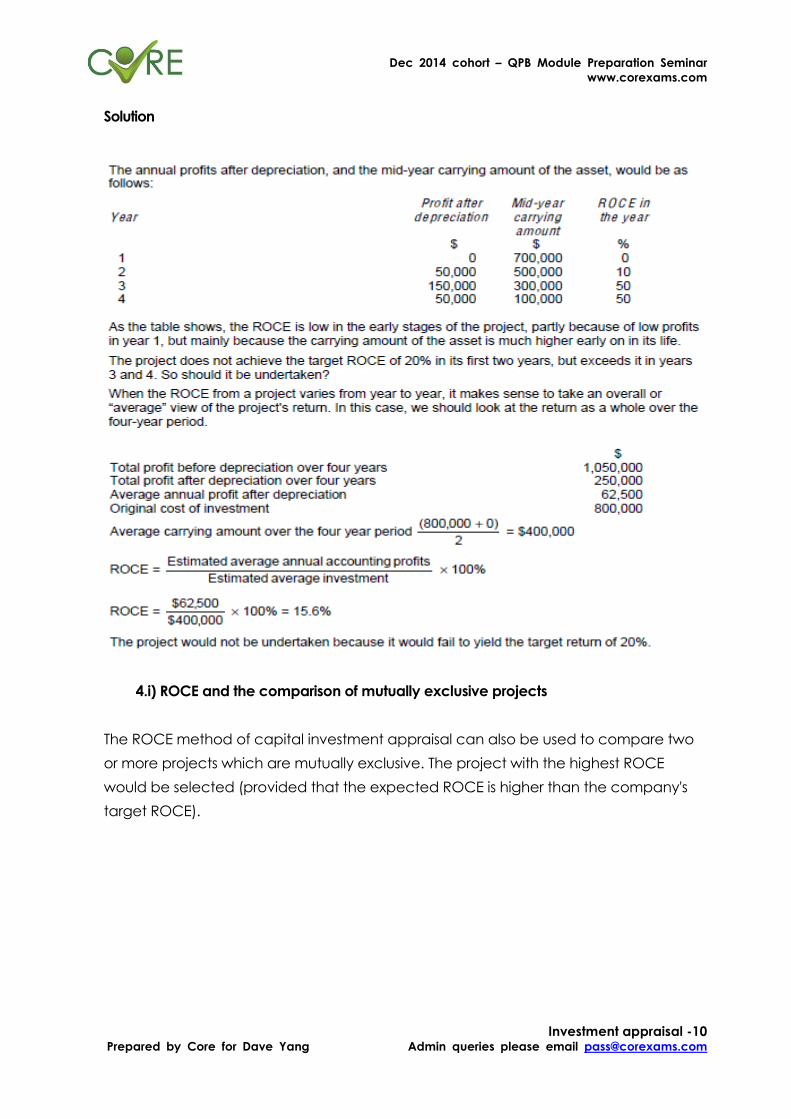
Solution
4.i) ROCE and the comparison of mutually exclusive projects
The ROCE method of capital investment appraisal can also be used to compare two
or more projects which are mutually exclusive. The project with the highest ROCE
would be selected (provided that the expected ROCE is higher than the company's
target ROCE).
Dec 2014 cohort – QPB Module Preparation Seminar
www.corexams.com
Investment appraisal -11 Prepared by Core for Dave Yang Admin queries please email [email protected]
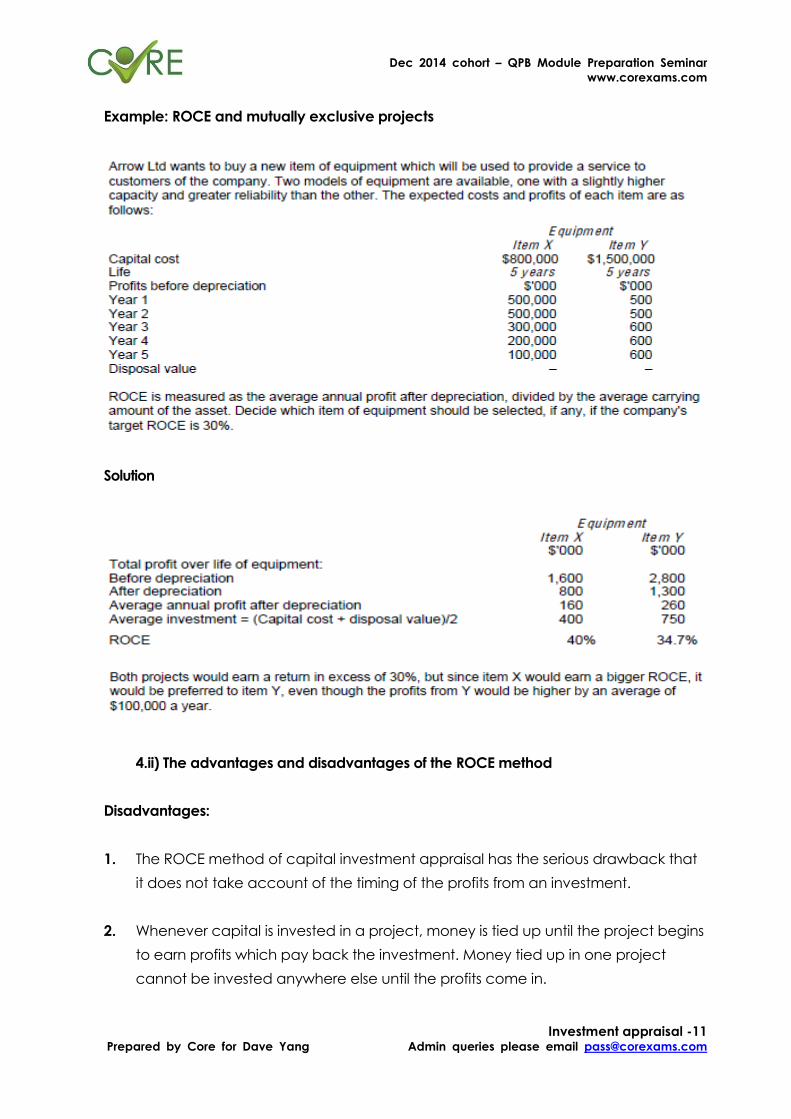
Example: ROCE and mutually exclusive projects
Solution
4.ii) The advantages and disadvantages of the ROCE method
Disadvantages:
1. The ROCE method of capital investment appraisal has the serious drawback that
it does not take account of the timing of the profits from an investment.
2. Whenever capital is invested in a project, money is tied up until the project begins
to earn profits which pay back the investment. Money tied up in one project
cannot be invested anywhere else until the profits come in.

Dec 2014 cohort – QPB Module Preparation Seminar
www.corexams.com
Investment appraisal -12 Prepared by Core for Dave Yang Admin queries please email [email protected]
3. It is based on accounting profits and not cash flows. Accounting profits are
subject to a number of different accounting treatments.
4. It is a relative measure rather than an absolute measure and hence takes no
account of the size of the investment.
5. It takes no account of the length of the project.
6. Like the payback method, it ignores the time value of money.
Advantages:
1. It is a quick and simple calculation.
2. It involves the familiar concept of a percentage return.
3. It looks at the entire project life.
Dec 2014 cohort – QPB Module Preparation Seminar
www.corexams.com
Investment appraisal -13 Prepared by Core for Dave Yang Admin queries please email [email protected]
5. Discounted cash flow (DCF)
5.i) NPV and IRR compared
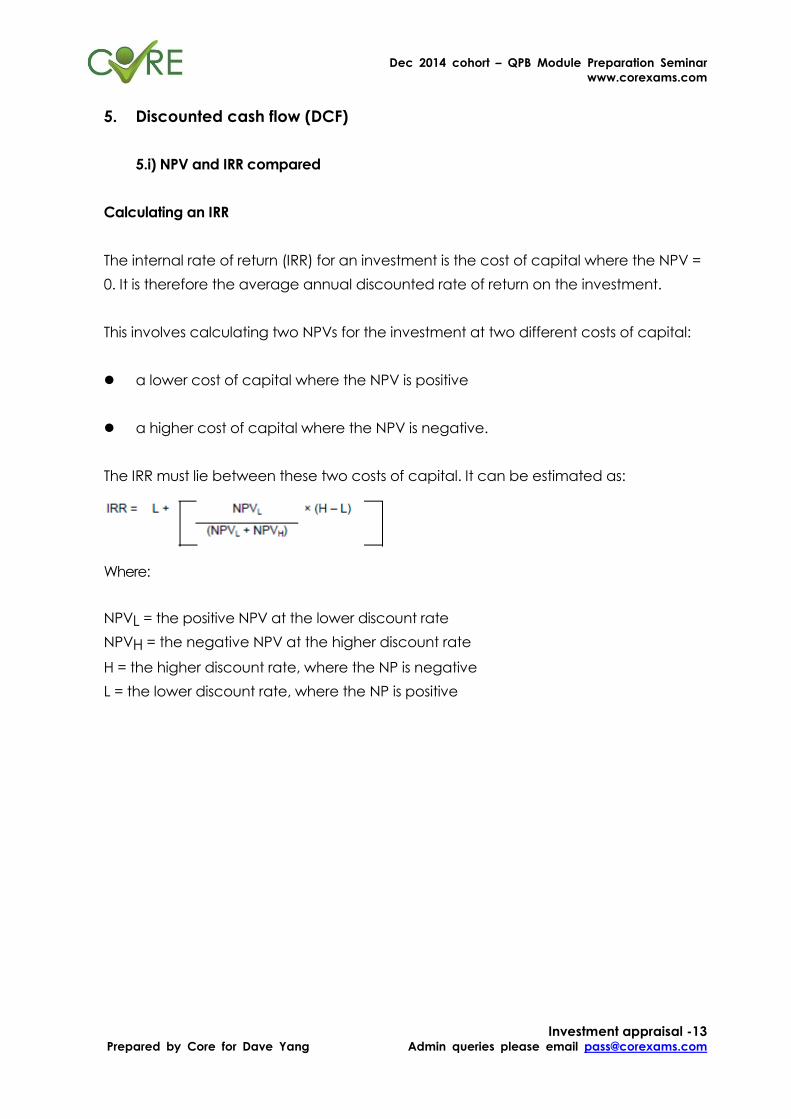
Calculating an IRR
The internal rate of return (IRR) for an investment is the cost of capital where the NPV =
0. It is therefore the average annual discounted rate of return on the investment.
This involves calculating two NPVs for the investment at two different costs of capital:
a lower cost of capital where the NPV is positive
a higher cost of capital where the NPV is negative.
The IRR must lie between these two costs of capital. It can be estimated as:
Where:
NPVL = the positive NPV at the lower discount rate
NPVH = the negative NPV at the higher discount rate
H = the higher discount rate, where the NP is negative
L = the lower discount rate, where the NP is positive
Dec 2014 cohort – QPB Module Preparation Seminar
www.corexams.com
Investment appraisal -14 Prepared by Core for Dave Yang Admin queries please email [email protected]
Advantages and disadvantages of IRR method
Advantage:
The main advantage of the IRR method is that the information it provides is more easily
understood by managers, especially non-financial managers.
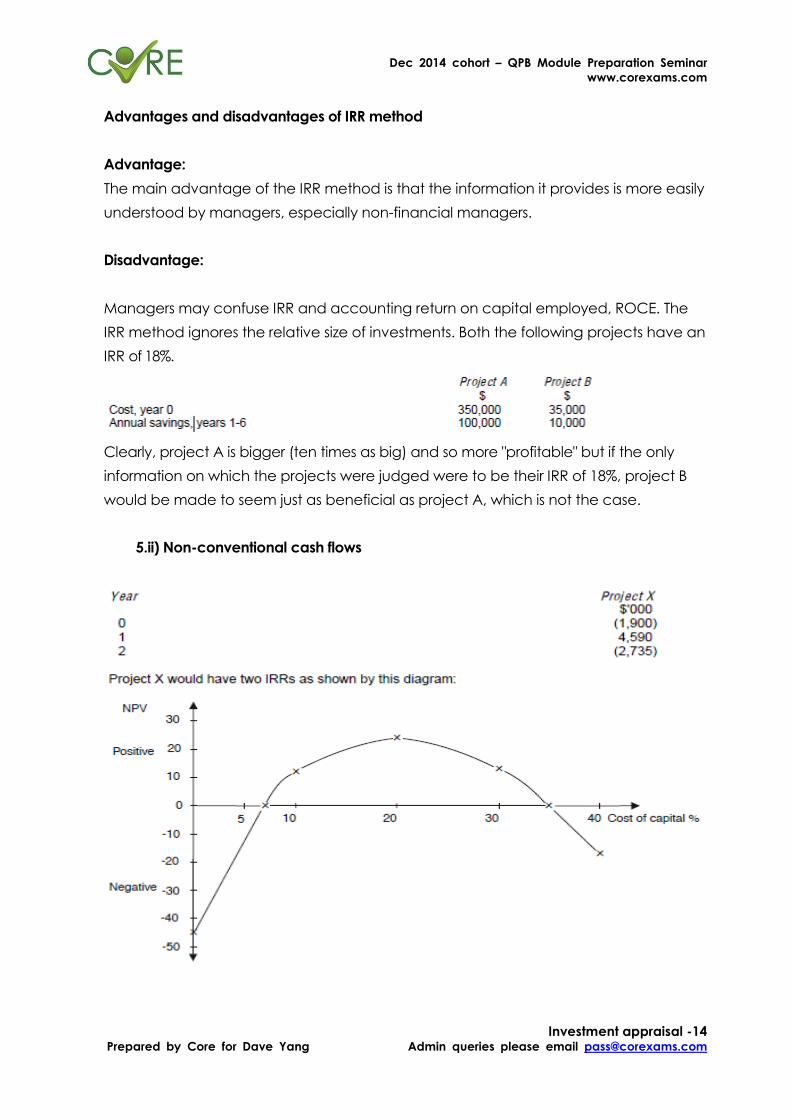
Disadvantage:
Managers may confuse IRR and accounting return on capital employed, ROCE. The
IRR method ignores the relative size of investments. Both the following projects have an
IRR of 18%.
Clearly, project A is bigger (ten times as big) and so more "profitable" but if the only
information on which the projects were judged were to be their IRR of 18%, project B
would be made to seem just as beneficial as project A, which is not the case.
5.ii) Non-conventional cash flows
Dec 2014 cohort – QPB Module Preparation Seminar
www.corexams.com
Investment appraisal -15 Prepared by Core for Dave Yang Admin queries please email [email protected]
The NPV rule suggests that the project is acceptable between costs of capital of 7%
and 35%.
Suppose that the required rate on project X is 10% and that the IRR of 7% is used in
deciding whether to accept or reject the project.
The project would be rejected since it appears that it can only yield 7%.
The diagram shows, however, that between rates of 7% and 35% the project should be
accepted.
Using the IRR of 35% would produce the correct decision to accept the project. Lack
of knowledge of multiple IRRs could therefore lead to serious errors in the decision of
whether to accept or reject a project.
In general, if the sign of the net cash flow changes in successive periods, the
calculations may produce as many IRRs as there are sign changes. IRR should not
normally be used when there are non-conventional cash flows.
5.iii) Mutually exclusive projects
Mutually exclusive projects are two or more projects from which only one can be
chosen. Examples include the choice of a factory location or the choice of just one of
a number of machines. The IRR and NPV methods can, however, give conflicting
rankings as to which project should be given priority
Dec 2014 cohort – QPB Module Preparation Seminar
www.corexams.com
Investment appraisal -16 Prepared by Core for Dave Yang Admin queries please email [email protected]
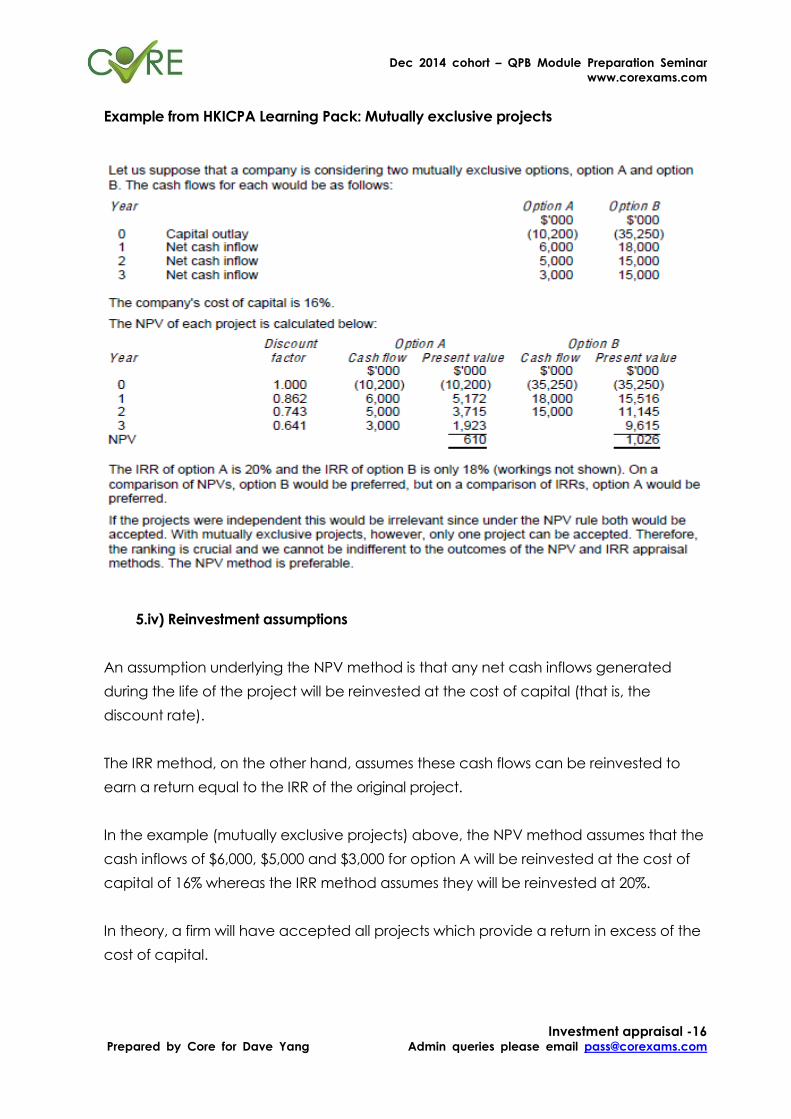
Example from HKICPA Learning Pack: Mutually exclusive projects
5.iv) Reinvestment assumptions
An assumption underlying the NPV method is that any net cash inflows generated
during the life of the project will be reinvested at the cost of capital (that is, the
discount rate).
The IRR method, on the other hand, assumes these cash flows can be reinvested to
earn a return equal to the IRR of the original project.
In the example (mutually exclusive projects) above, the NPV method assumes that the
cash inflows of $6,000, $5,000 and $3,000 for option A will be reinvested at the cost of
capital of 16% whereas the IRR method assumes they will be reinvested at 20%.
In theory, a firm will have accepted all projects which provide a return in excess of the
cost of capital.
Dec 2014 cohort – QPB Module Preparation Seminar
www.corexams.com
Investment appraisal -17 Prepared by Core for Dave Yang Admin queries please email [email protected]
Any other funds which become available can only be reinvested at the cost of
capital. This is the assumption implied in the NPV rule.
5.v) Summary of NPV and IRR comparison
1. When cash flow patterns are conventional both methods give the same accept
or reject decision.
2. The IRR method is more easily understood.
3. NPV is technically superior to IRR and simpler to calculate.
4. IRR and accounting ROCE can be confused.
5. IRR ignores the relative sizes of investments.
6. Where cash flow patterns are non-conventional, there may be several IRRs which
decision makers must be aware of to avoid making the wrong decision.
7. The NPV method is superior for ranking mutually exclusive projects in order of
attractiveness.
8. The reinvestment assumption underlying the IRR method cannot be substantiated.
9. When discount rates are expected to differ over the life of the project, such
variations can be incorporated easily into NPV calculations, but not into IRR
calculations.
10. Despite the advantages of the NPV method over the IRR method, the IRR method
is widely used in practice.
Dec 2014 cohort – QPB Module Preparation Seminar
www.corexams.com
Investment appraisal -18 Prepared by Core for Dave Yang Admin queries please email [email protected]
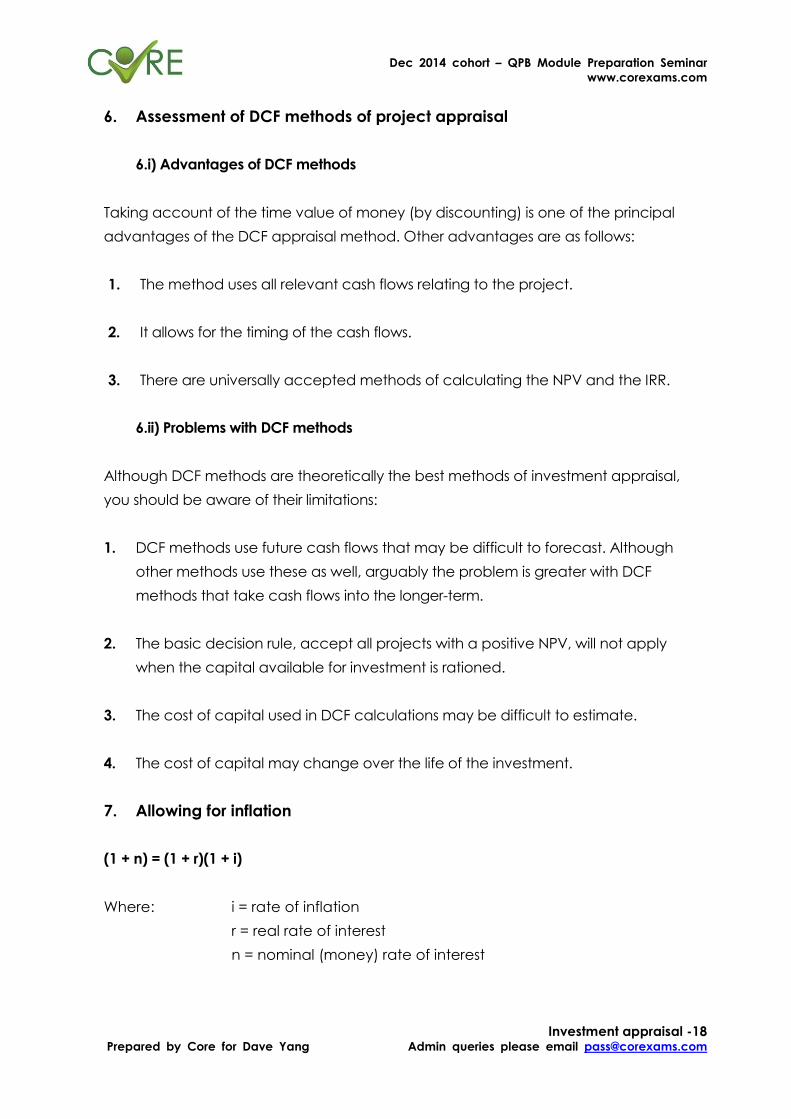
6. Assessment of DCF methods of project appraisal
6.i) Advantages of DCF methods
Taking account of the time value of money (by discounting) is one of the principal
advantages of the DCF appraisal method. Other advantages are as follows:
1. The method uses all relevant cash flows relating to the project.
2. It allows for the timing of the cash flows.
3. There are universally accepted methods of calculating the NPV and the IRR.
6.ii) Problems with DCF methods
Although DCF methods are theoretically the best methods of investment appraisal,
you should be aware of their limitations:
1. DCF methods use future cash flows that may be difficult to forecast. Although
other methods use these as well, arguably the problem is greater with DCF
methods that take cash flows into the longer-term.
2. The basic decision rule, accept all projects with a positive NPV, will not apply
when the capital available for investment is rationed.
3. The cost of capital used in DCF calculations may be difficult to estimate.
4. The cost of capital may change over the life of the investment.
7. Allowing for inflation
(1 + n) = (1 + r)(1 + i)
Where: i = rate of inflation
r = real rate of interest
n = nominal (money) rate of interest
Dec 2014 cohort – QPB Module Preparation Seminar
www.corexams.com
Investment appraisal -19 Prepared by Core for Dave Yang Admin queries please email [email protected]
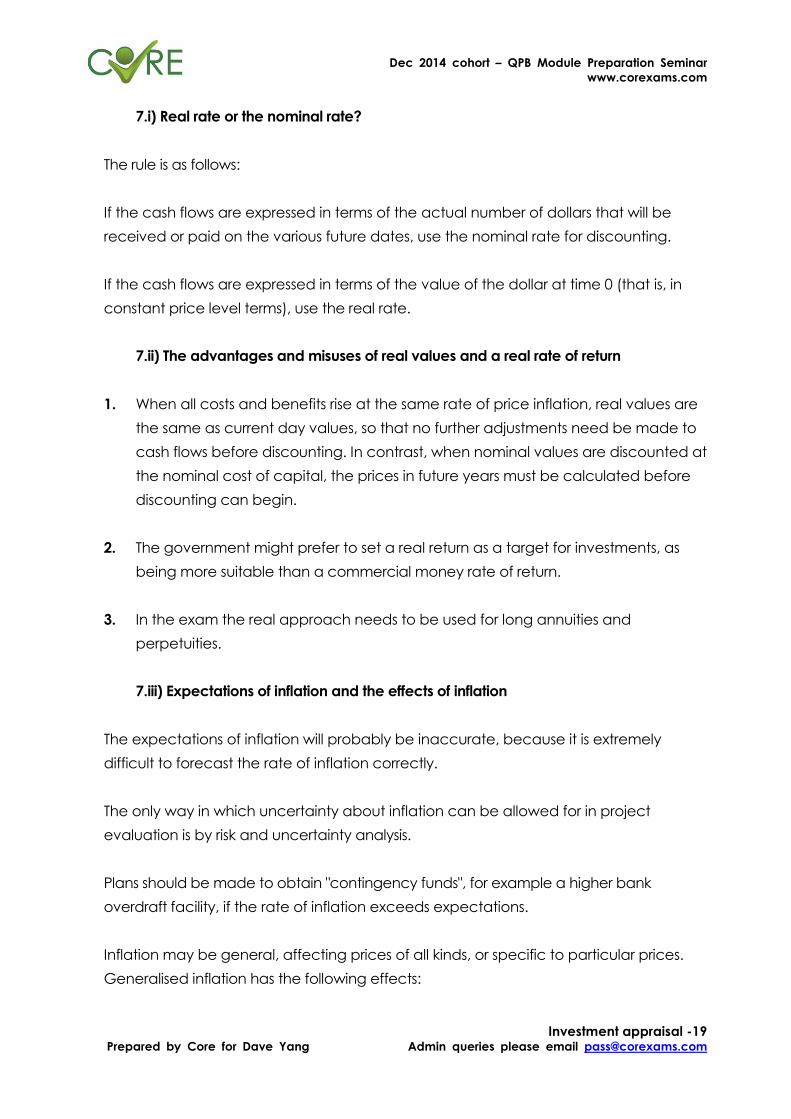
7.i) Real rate or the nominal rate?
The rule is as follows:
If the cash flows are expressed in terms of the actual number of dollars that will be
received or paid on the various future dates, use the nominal rate for discounting.
If the cash flows are expressed in terms of the value of the dollar at time 0 (that is, in
constant price level terms), use the real rate.
7.ii) The advantages and misuses of real values and a real rate of return
1. When all costs and benefits rise at the same rate of price inflation, real values are
the same as current day values, so that no further adjustments need be made to
cash flows before discounting. In contrast, when nominal values are discounted at
the nominal cost of capital, the prices in future years must be calculated before
discounting can begin.
2. The government might prefer to set a real return as a target for investments, as
being more suitable than a commercial money rate of return.
3. In the exam the real approach needs to be used for long annuities and
perpetuities.
7.iii) Expectations of inflation and the effects of inflation
The expectations of inflation will probably be inaccurate, because it is extremely
difficult to forecast the rate of inflation correctly.
The only way in which uncertainty about inflation can be allowed for in project
evaluation is by risk and uncertainty analysis.
Plans should be made to obtain "contingency funds", for example a higher bank
overdraft facility, if the rate of inflation exceeds expectations.
Inflation may be general, affecting prices of all kinds, or specific to particular prices.
Generalised inflation has the following effects:
Dec 2014 cohort – QPB Module Preparation Seminar
www.corexams.com
Investment appraisal -20 Prepared by Core for Dave Yang Admin queries please email [email protected]
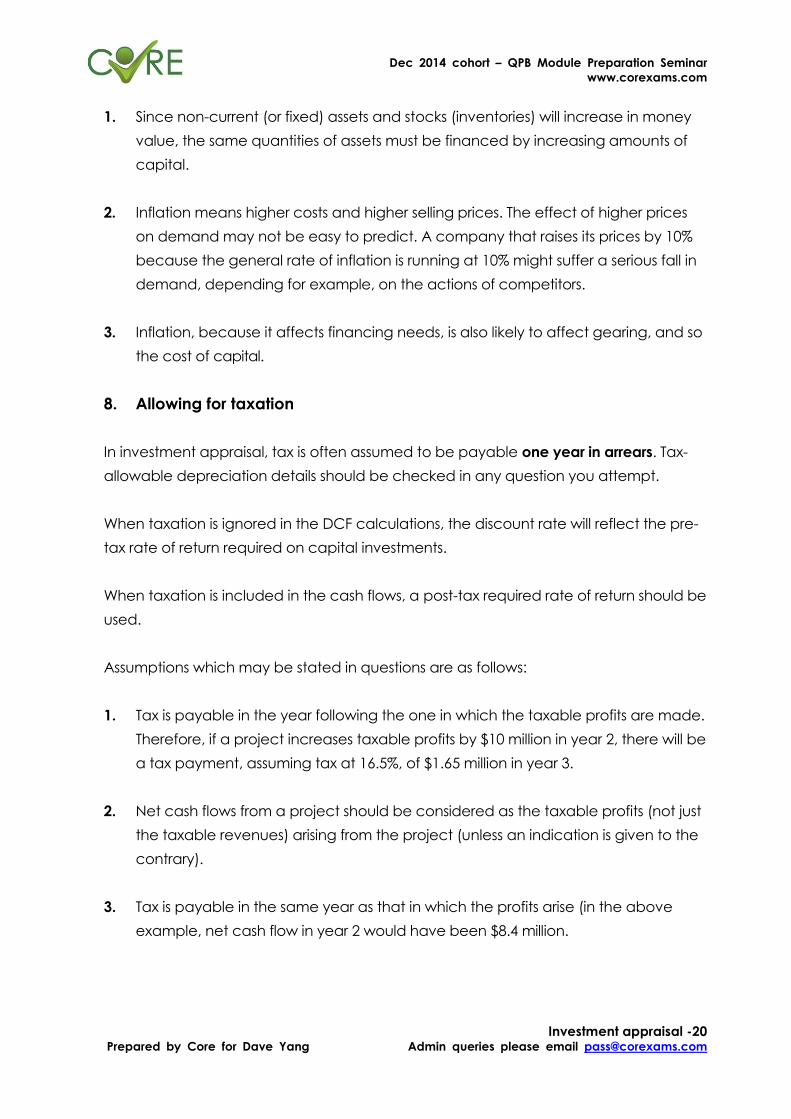
1. Since non-current (or fixed) assets and stocks (inventories) will increase in money
value, the same quantities of assets must be financed by increasing amounts of
capital.
2. Inflation means higher costs and higher selling prices. The effect of higher prices
on demand may not be easy to predict. A company that raises its prices by 10%
because the general rate of inflation is running at 10% might suffer a serious fall in
demand, depending for example, on the actions of competitors.
3. Inflation, because it affects financing needs, is also likely to affect gearing, and so
the cost of capital.
8. Allowing for taxation
In investment appraisal, tax is often assumed to be payable one year in arrears. Tax-
allowable depreciation details should be checked in any question you attempt.
When taxation is ignored in the DCF calculations, the discount rate will reflect the pre-
tax rate of return required on capital investments.
When taxation is included in the cash flows, a post-tax required rate of return should be
used.
Assumptions which may be stated in questions are as follows:
1. Tax is payable in the year following the one in which the taxable profits are made.
Therefore, if a project increases taxable profits by $10 million in year 2, there will be
a tax payment, assuming tax at 16.5%, of $1.65 million in year 3.
2. Net cash flows from a project should be considered as the taxable profits (not just
the taxable revenues) arising from the project (unless an indication is given to the
contrary).
3. Tax is payable in the same year as that in which the profits arise (in the above
example, net cash flow in year 2 would have been $8.4 million.
Dec 2014 cohort – QPB Module Preparation Seminar
www.corexams.com
Investment appraisal -21 Prepared by Core for Dave Yang Admin queries please email [email protected]
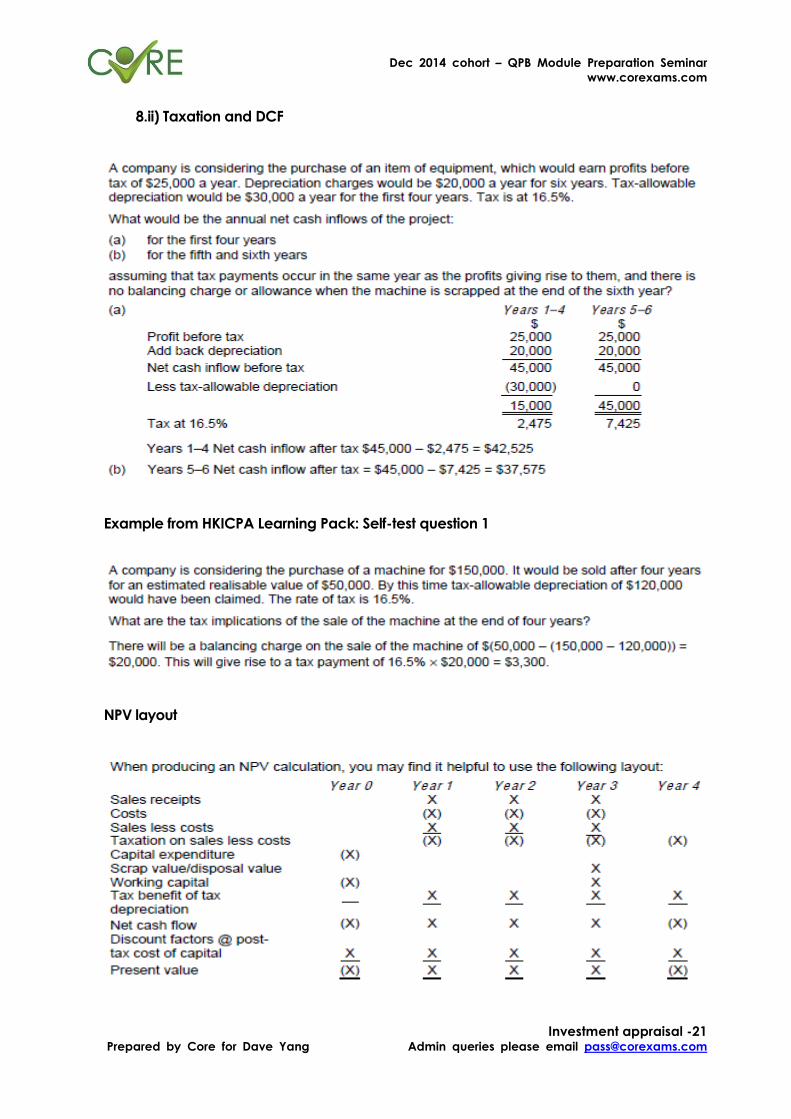
8.ii) Taxation and DCF
Example from HKICPA Learning Pack: Self-test question 1
NPV layout

Dec 2014 cohort – QPB Module Preparation Seminar
www.corexams.com
Investment appraisal -22 Prepared by Core for Dave Yang Admin queries please email [email protected]
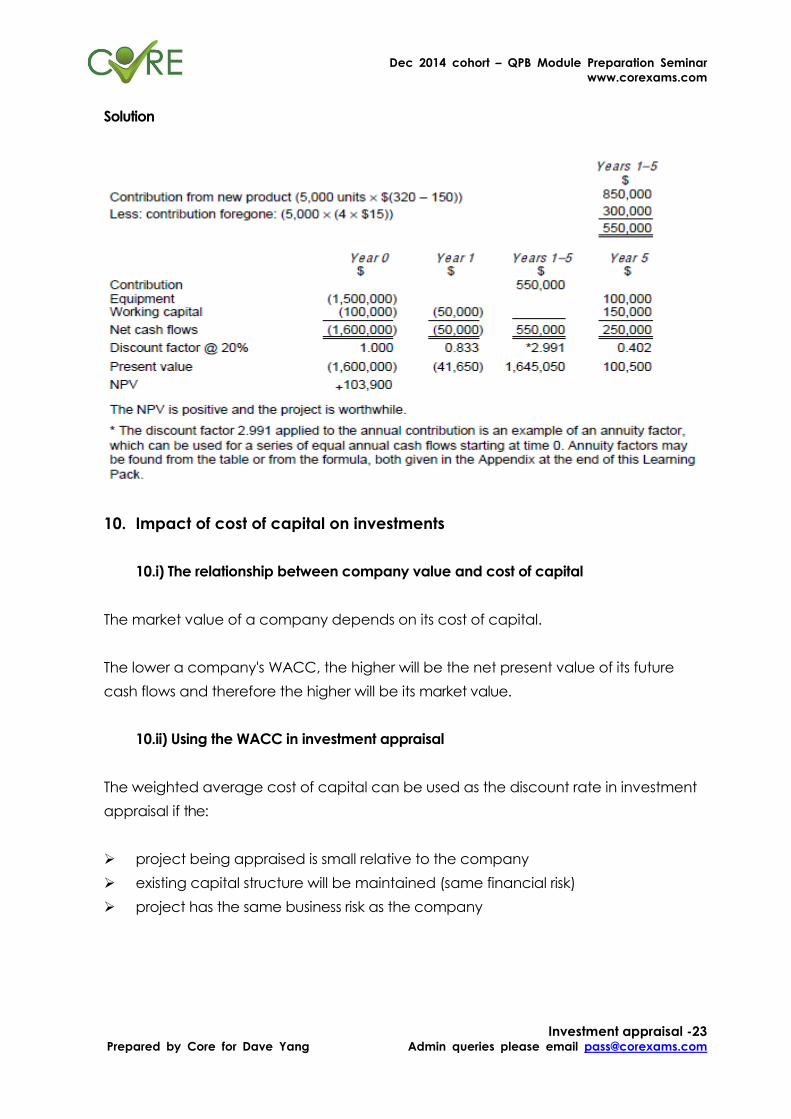
9. Working capital
If a project lasts for five years with a $200,000 working capital requirement at the end
of year 1, rising to $300,000 at the end of year 2, the DCF calculation will show $200,000
as a year 1 cash outflow and $100,000 (300,000 - 200,000) as a year 2 cash outflow.
Working capital is assumed to be recovered at the end of the project. In the example
above, this will be shown by a $300,000 cash inflow at year 5. Assume there are no
associated tax effects for working capital flows.
Example from HKICPA Learning Pack: Working capital
Dec 2014 cohort – QPB Module Preparation Seminar
www.corexams.com
Investment appraisal -23 Prepared by Core for Dave Yang Admin queries please email [email protected]
Solution
10. Impact of cost of capital on investments
10.i) The relationship between company value and cost of capital
The market value of a company depends on its cost of capital.
The lower a company's WACC, the higher will be the net present value of its future
cash flows and therefore the higher will be its market value.
10.ii) Using the WACC in investment appraisal
The weighted average cost of capital can be used as the discount rate in investment
appraisal if the:
project being appraised is small relative to the company
existing capital structure will be maintained (same financial risk)
project has the same business risk as the company
Dec 2014 cohort – QPB Module Preparation Seminar
www.corexams.com
Investment appraisal -24 Prepared by Core for Dave Yang Admin queries please email [email protected]
10.iii) The arguments against using the WACC
New investments undertaken by a company might have different business risk
characteristics from the company's existing operations.
As a consequence, the return required by investors might go up (or down) if the
investments are undertaken, because their business risk is perceived to be higher (or
lower).
The finance that is raised to fund a new investment might substantially change the
capital structure and the perceived financial risk of investing in the company.
Depending on whether the project is financed by equity or by debt capital, the
perceived financial risk of the entire company might change. This must be taken into
account when appraising investments.
Many companies raise floating rate debt capital as well as fixed interest debt capital.
With floating rate debt capital, the interest rate is variable, and is altered every three
or six months or so in line with changes in current market interest rates. The cost of debt
capital will therefore fluctuate as market conditions vary.
Floating rate debt is difficult to incorporate into a WACC computation, and the best
that can be done is to substitute an "equivalent" fixed interest debt capital cost in
place of the floating rate debt cost.
11. Risk and uncertainty
11.i) Sensitivity analysis
Sensitivity analysis assesses how responsive the project's NPV is to changes in the
variables used to calculate that NPV.
Selling price
Sales volume
Cost of capital
Initial capital investment
Operating costs
Dec 2014 cohort – QPB Module Preparation Seminar
www.corexams.com
Investment appraisal -25 Prepared by Core for Dave Yang Admin queries please email [email protected]
The basic approach of sensitivity analysis is to calculate the project's NPV under
alternative assumptions to determine how sensitive it is to changing conditions.
An indication is thus provided of those variables to which the NPV is most sensitive
(critical variables) and the extent to which those variables may change before the
investment results in a negative NPV.
Sensitivity analysis therefore provides an indication of why a project might fail.
Management should review critical variables to assess whether or not there is a strong
possibility of events occurring which will lead to a negative NPV.
Management should also pay particular attention to controlling those variables to
which the NPV is particularly sensitive, once the decision has been taken to accept
the investment.
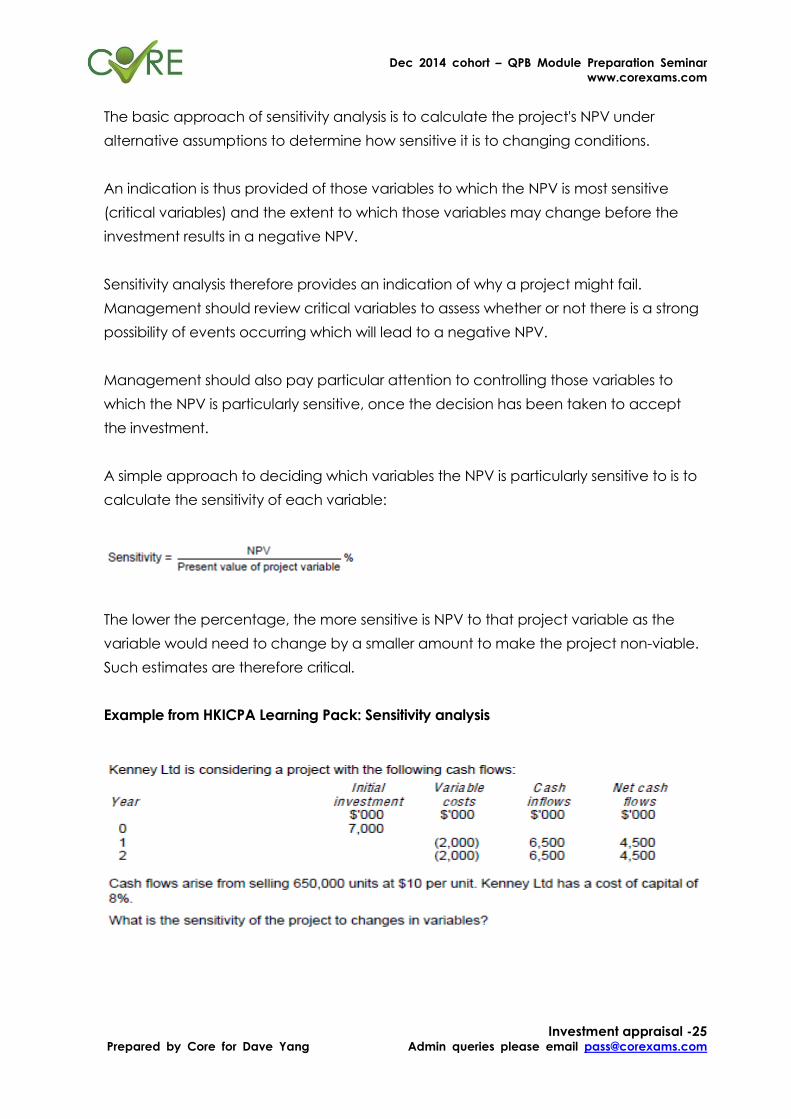
A simple approach to deciding which variables the NPV is particularly sensitive to is to
calculate the sensitivity of each variable:
The lower the percentage, the more sensitive is NPV to that project variable as the
variable would need to change by a smaller amount to make the project non-viable.
Such estimates are therefore critical.
Example from HKICPA Learning Pack: Sensitivity analysis
Dec 2014 cohort – QPB Module Preparation Seminar
www.corexams.com
Investment appraisal -26 Prepared by Core for Dave Yang Admin queries please email [email protected]
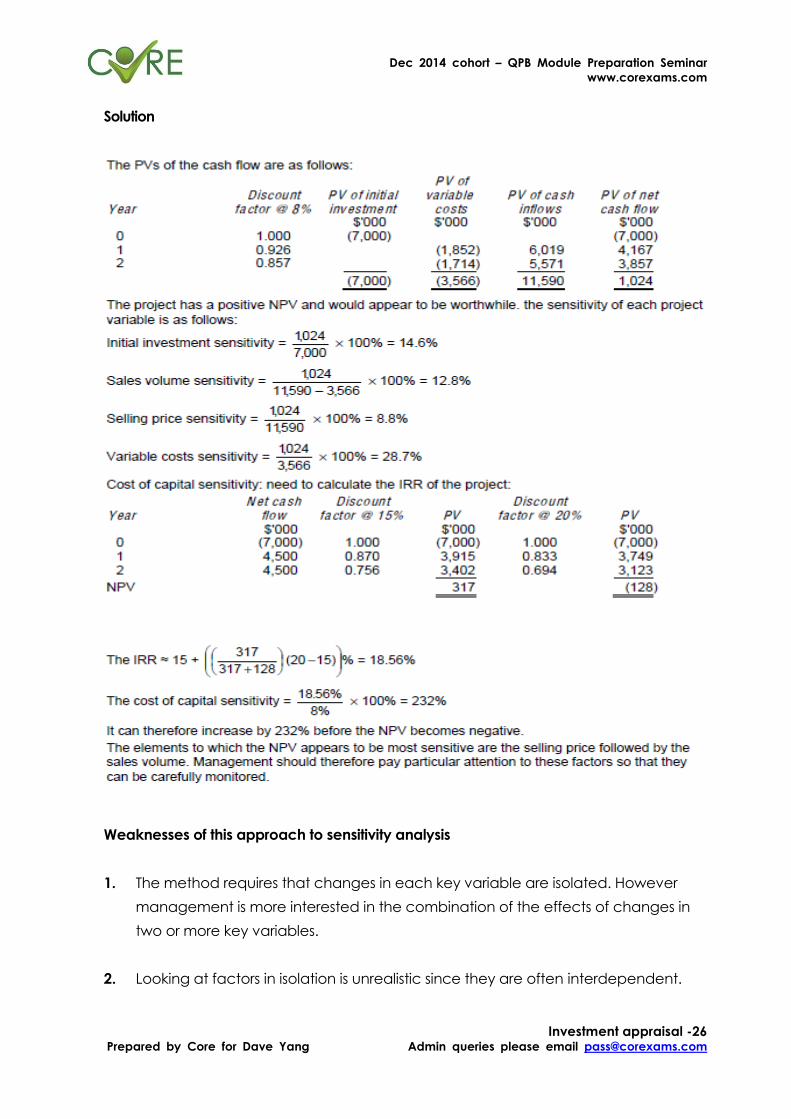
Solution
Weaknesses of this approach to sensitivity analysis
1. The method requires that changes in each key variable are isolated. However
management is more interested in the combination of the effects of changes in
two or more key variables.
2. Looking at factors in isolation is unrealistic since they are often interdependent.
Dec 2014 cohort – QPB Module Preparation Seminar
www.corexams.com
Investment appraisal -27 Prepared by Core for Dave Yang Admin queries please email [email protected]
3. Sensitivity analysis does not examine the probability that any particular variation in
costs or revenues might occur.
4. Critical factors may be those over which managers have no control.
5. In itself it does not provide a decision rule. Parameters defining acceptability must
be laid down by managers.
11.ii) Probability analysis
A probability analysis of expected cash flows can often be estimated and used both
to calculate n expected NPV and to measure risk
A probability distribution of "expected cash flows" can often be estimated, recognising
there are several possible outcomes, not just one. This may be used to do the following:
1. Calculate an expected value of the NPV
2. Measure risk, for example in the following ways:
By calculating the worst possible outcome and its probability
By calculating the probability that the project will fail to achieve a positive
NPV
By calculating the standard deviation of the NPV
Dec 2014 cohort – QPB Module Preparation Seminar
www.corexams.com
Investment appraisal -28 Prepared by Core for Dave Yang Admin queries please email [email protected]
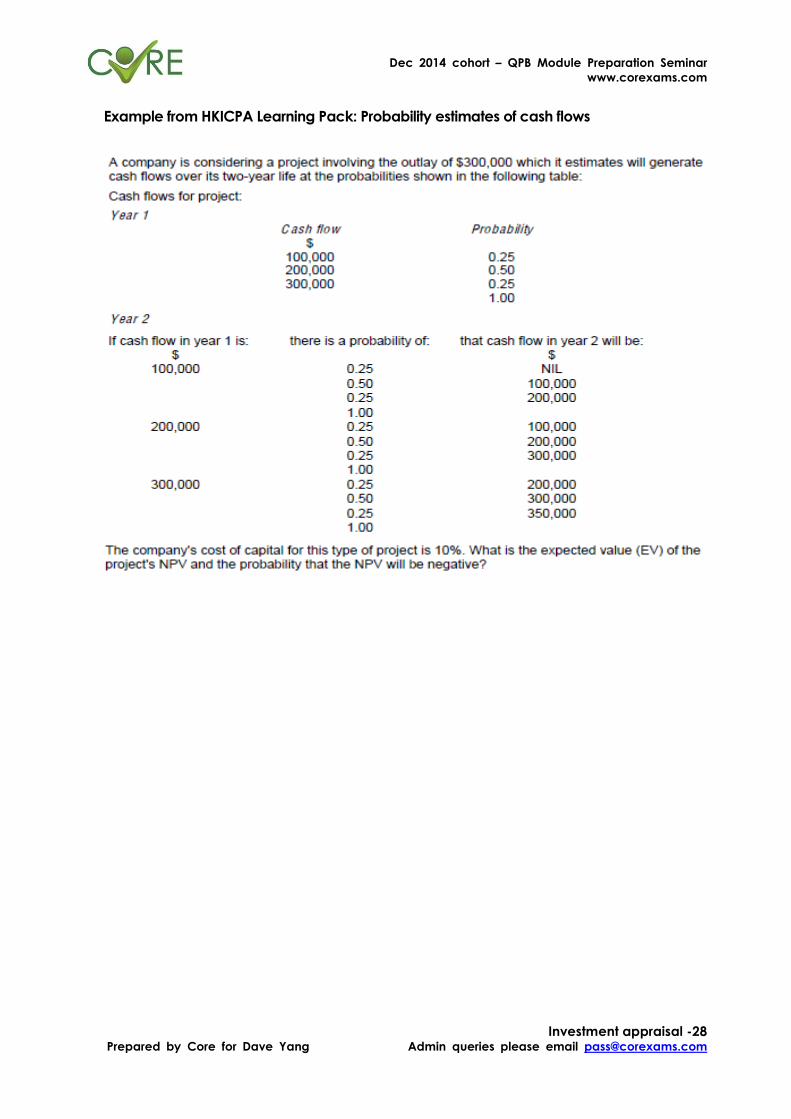
Example from HKICPA Learning Pack: Probability estimates of cash flows
Dec 2014 cohort – QPB Module Preparation Seminar
www.corexams.com
Investment appraisal -29 Prepared by Core for Dave Yang Admin queries please email [email protected]
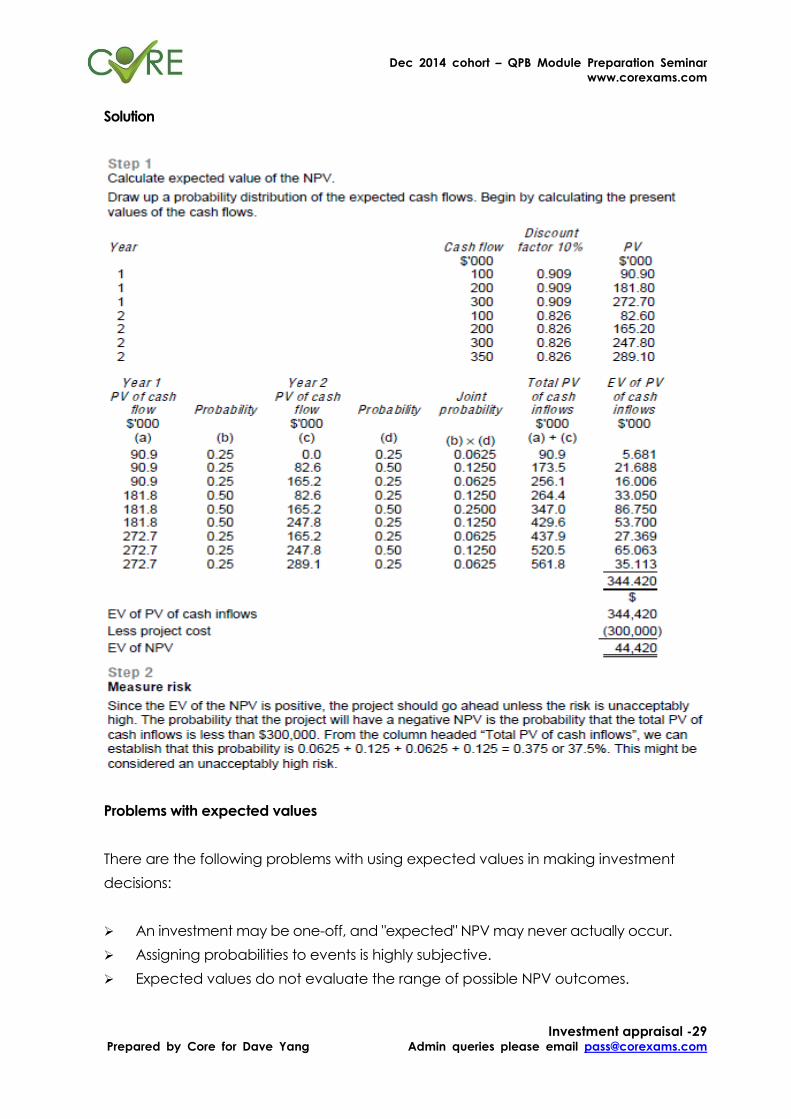
Solution
Problems with expected values
There are the following problems with using expected values in making investment
decisions:
An investment may be one-off, and "expected" NPV may never actually occur.
Assigning probabilities to events is highly subjective.
Expected values do not evaluate the range of possible NPV outcomes.
Dec 2014 cohort – QPB Module Preparation Seminar
www.corexams.com
Investment appraisal -30 Prepared by Core for Dave Yang Admin queries please email [email protected]
11.iii) Other risk adjustment techniques
Simulation
Simulation will overcome problems of having a very large number of possible
outcomes, also the correlation of cash flows (a project which is successful in its early
years is more likely to be successful in its later years).
Adjusted payback
Adjusted payback uses discounted cash flows.
One way of dealing with risk is to shorten the payback period required.
A maximum payback period can be set to reflect the fact that risk increases the
longer the time period under consideration.
However, the disadvantages of payback as an investment appraisal method mean
that adjusted payback cannot be recommended as a method of adjusting for risk.
Risk-adjusted discount rates
Investors want higher returns for higher risk investments. The greater the risk attached to
future returns, the greater the risk premium required.
Investors also prefer cash now to later and require a higher return for longer time
periods.
In investment appraisal, a risk-adjusted discount rate can be used for particular types
or risk classes of investment projects to reflect their relative risks.
For example, a high discount rate can be used so that a cash flow which occurs quite
some time in the future will have less effect on the decision.
Alternatively, with the launch of a new product, a higher initial risk premium may be
used with a decrease in the discount rate as the product becomes established.