Embed Size (px)
DESCRIPTION
Strategy for Renewable Electricity in San Diego by 2020. Richard Caputo San Diego Renewable Energy Society Chapter of the American Solar Energy Society 20 Sept 2010. OUTLINE. A Point of View National Level Climate Change Non-Carbon Options Apply to San Diego Energy Tribes - PowerPoint PPT Presentation
Citation preview
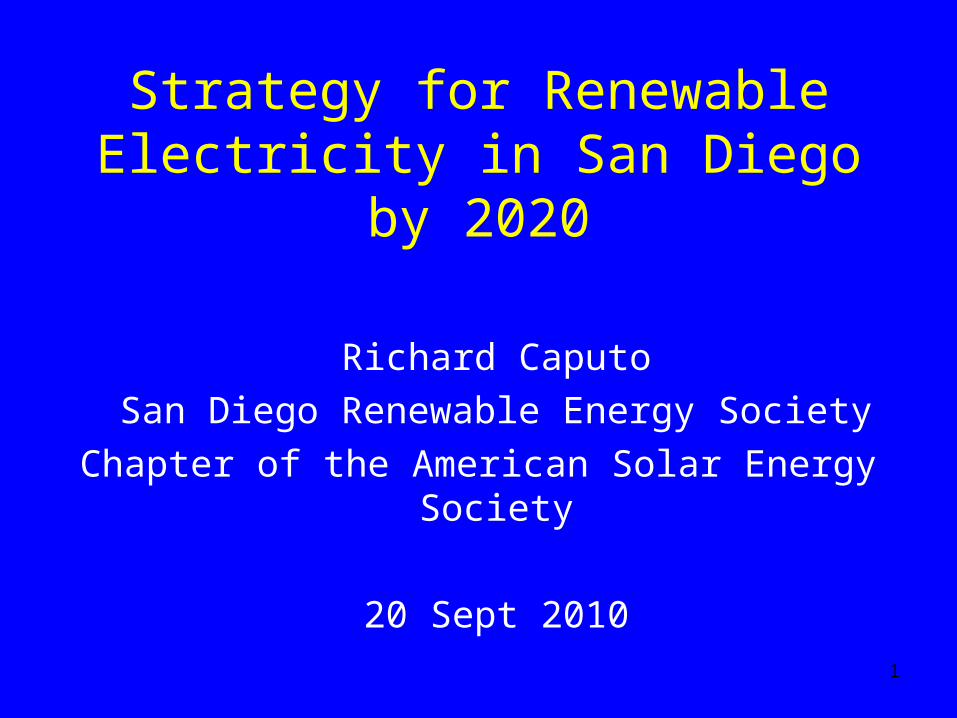
Strategy for Renewable Electricity in San Diego by 2020
Richard Caputo
San Diego Renewable Energy Society
Chapter of the American Solar Energy Society
20 Sept 2010
1
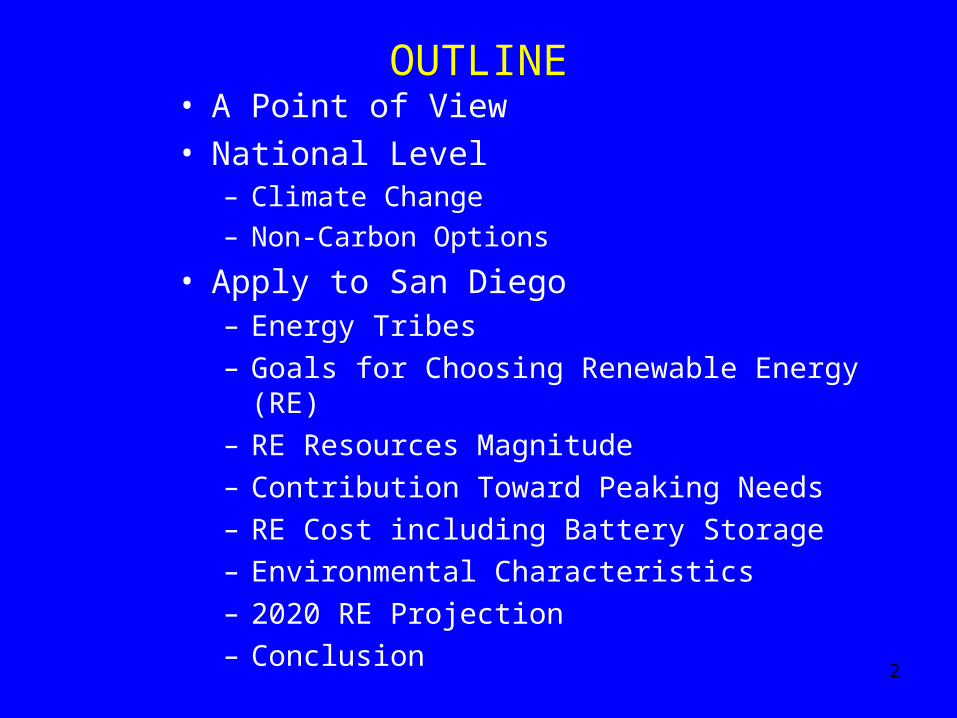
OUTLINE• A Point of View
• National Level – Climate Change
– Non-Carbon Options
• Apply to San Diego– Energy Tribes
– Goals for Choosing Renewable Energy (RE)
– RE Resources Magnitude
– Contribution Toward Peaking Needs
– RE Cost including Battery Storage
– Environmental Characteristics
– 2020 RE Projection
– Conclusion2
APPROACH
• Take a Particular But General Point of View About:– Energy
– Environment, and
– Equity Issues
• Identify Some Problems and Develop Solutions
• Go Back and Identify Other Points of View
• Revaluate the Problem and Solutions
3
Why This Approach ?
• You can’t really talk about what you call a “problem” and what you call a “solution” without talking about different value systems
• Some of us may not be disagreeing about technical data but about core values
4
A Particular Point of View
• See the world as controllable
• Nature is stable until pushed beyond discoverable limit
• Environmental management requires:– certified experts to determine the precise locations of
nature’s limits, and – statutory regulation to ensure that all economic activity is
kept with those limits
• Man is malleable, deeply flawed but redeemable by long-lasting, and trustworthy institutions
• Fair distribution is by need, and the need is determined by expert and dispassionate authority
5
6
People Causing Rapid Climate Change
• Human Driven with 90% Probability ( IPCC,2007)
• Carbon Dioxide (CO2) less than 300 ppm for last 650,000 yrs
• Since 1750, CO2 from 280 to 380 pp (= + 0.5C)
• 100 ppm Swing Is a Large Number– Caused 1 Mile Thick Ice Over Chicago (280 to 180)
• Without CO2 Reductions:– Unprecedented Warming with both flood and drought– Large Sea Level Rise– Large-Scale Species Extinctions --up to 80% by 2100– 100s Millions of Climate Change Refugees
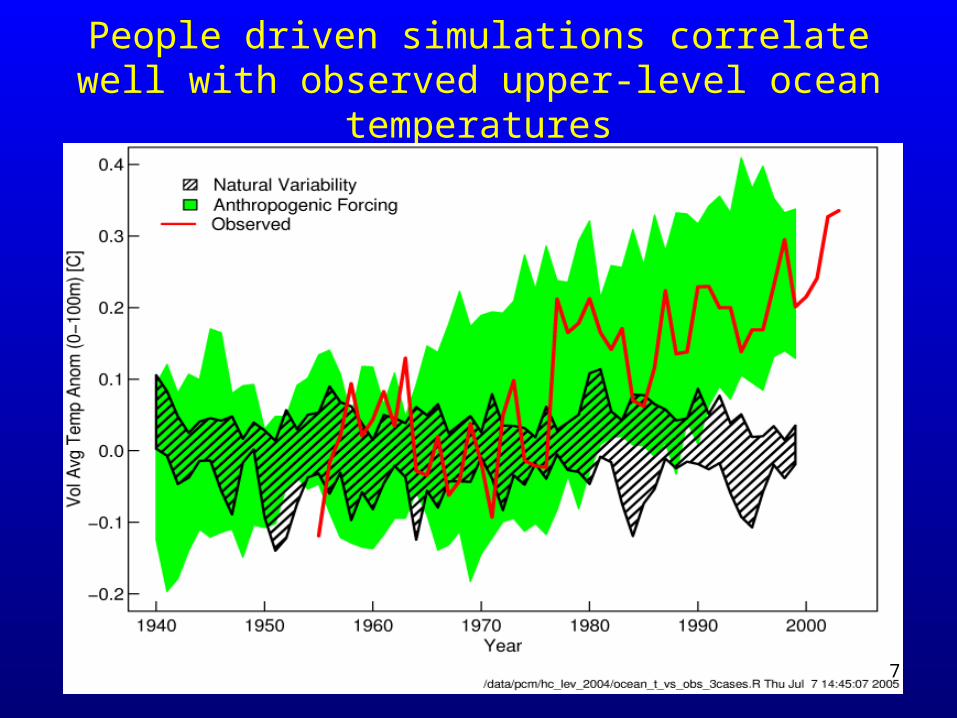
People driven simulations correlate well with observed upper-level ocean temperatures
7
8
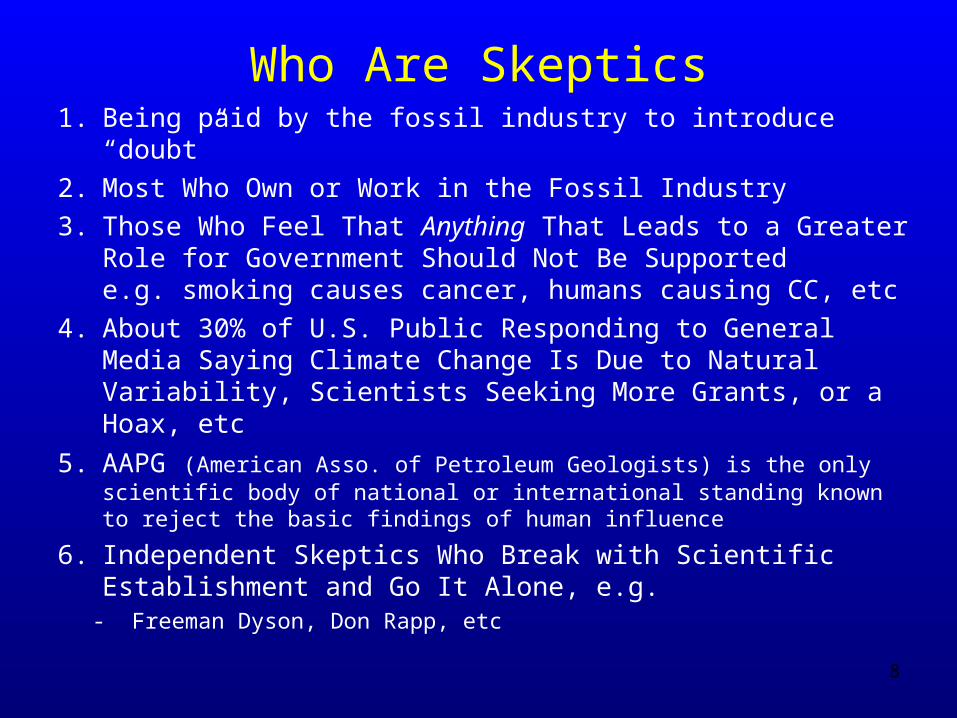
1. Being paid by the fossil industry to introduce “doubt”
2. Most Who Own or Work in the Fossil Industry
3. Those Who Feel That Anything That Leads to a Greater Role for Government Should Not Be Supported e.g. smoking causes cancer, humans causing CC, etc
4. About 30% of U.S. Public Responding to General Media Saying Climate Change Is Due to Natural Variability, Scientists Seeking More Grants, or a Hoax, etc
5. AAPG (American Asso. of Petroleum Geologists) is the only scientific body of national or international standing known to reject the basic findings of human influence
6. Independent Skeptics Who Break with Scientific Establishment and Go It Alone, e.g.
- Freeman Dyson, Don Rapp, etc
Who Are Skeptics
9
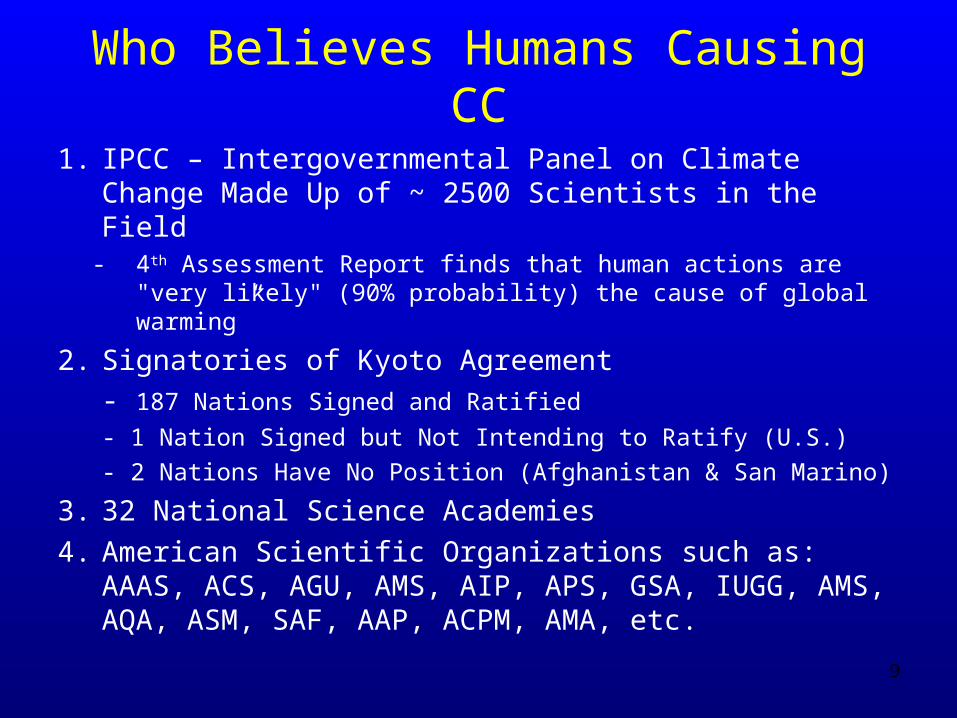
1. IPCC – Intergovernmental Panel on Climate Change Made Up of ~ 2500 Scientists in the Field
- 4th Assessment Report finds that human actions are "very likely" (90% probability) the cause of global warming”
2. Signatories of Kyoto Agreement
- 187 Nations Signed and Ratified
- 1 Nation Signed but Not Intending to Ratify (U.S.)
- 2 Nations Have No Position (Afghanistan & San Marino)
3. 32 National Science Academies
4. American Scientific Organizations such as: AAAS, ACS, AGU, AMS, AIP, APS, GSA, IUGG, AMS, AQA, ASM, SAF, AAP, ACPM, AMA, etc.
Who Believes Humans Causing CC
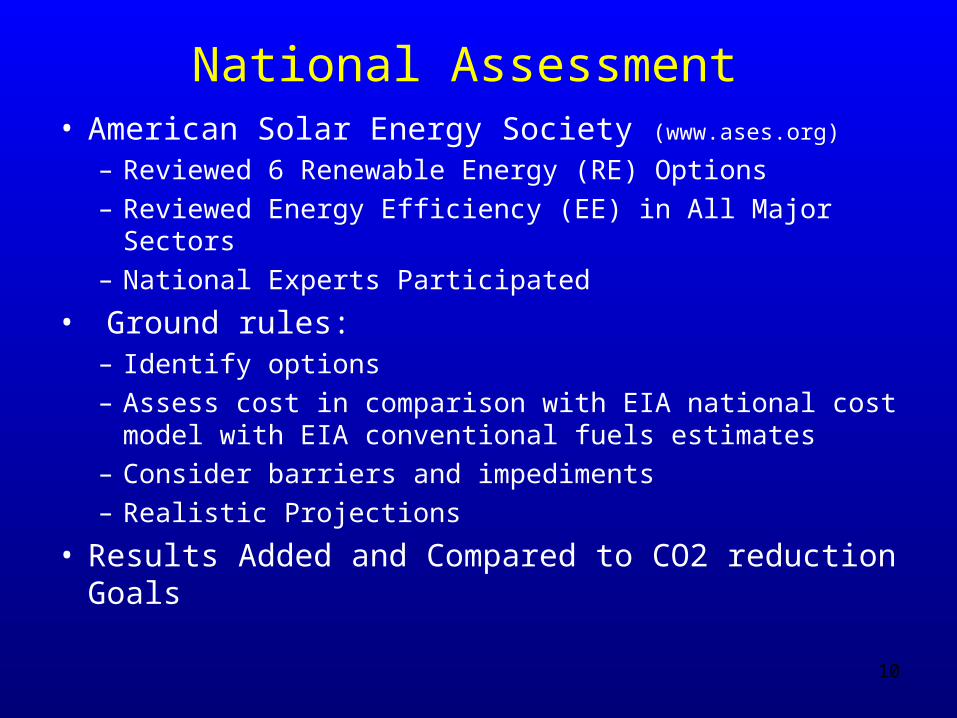
National Assessment • American Solar Energy Society (www.ases.org)
– Reviewed 6 Renewable Energy (RE) Options
– Reviewed Energy Efficiency (EE) in All Major Sectors
– National Experts Participated
• Ground rules:– Identify options
– Assess cost in comparison with EIA national cost model with EIA conventional fuels estimates
– Consider barriers and impediments
– Realistic Projections
• Results Added and Compared to CO2 reduction Goals
10
11
Buildings: Marilyn Brown, Therese Stovall, and Patrick Hughes (Oak Ridge National Laboratory)
Plug-In Hybrid Electric Vehicles: Peter Lilienthal and Howard Brown (National Renewable Energy Laboratory [NREL])
Overall Energy Efficiency: Joel Swisher (Rocky Mountain Institute)
Concentrating Solar Power: Mark Mehos (NREL) and David Kearney (Kearney and Associates)
Photovoltaics: Paul Denholm and Robert Margolis (NREL) and Ken Zweibel (PrimeStar Solar, Inc.)
Wind Power: Michael Milligan (NREL)
Biomass: Ralph Overend and Anelia Milbrandt (NREL)
Biofuels: John Sheehan (NREL)
Geothermal Power: Martin Vorum (NREL) and Jefferson Tester (MIT)
Summary/Editor: Charles Kutscher, American Solar Energy Society
Contributors for Non-Carbon Sources
12
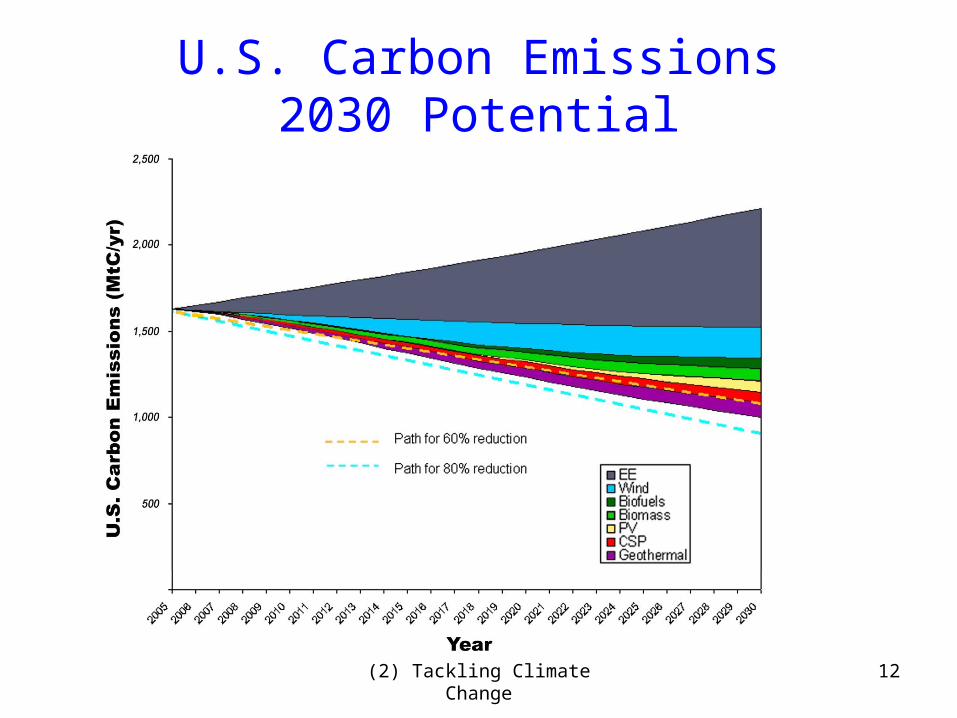
U.S. Carbon Emissions2030 Potential
(2) Tackling Climate Change
GOOD NEWS
• ENERGY EFFICIENCY and RENEWABLE ENERGY
CAN
REDUCE CARBON EMISSIONS and MEET GOAL for the U.S.
AT
A REASONABLE COST
13
14
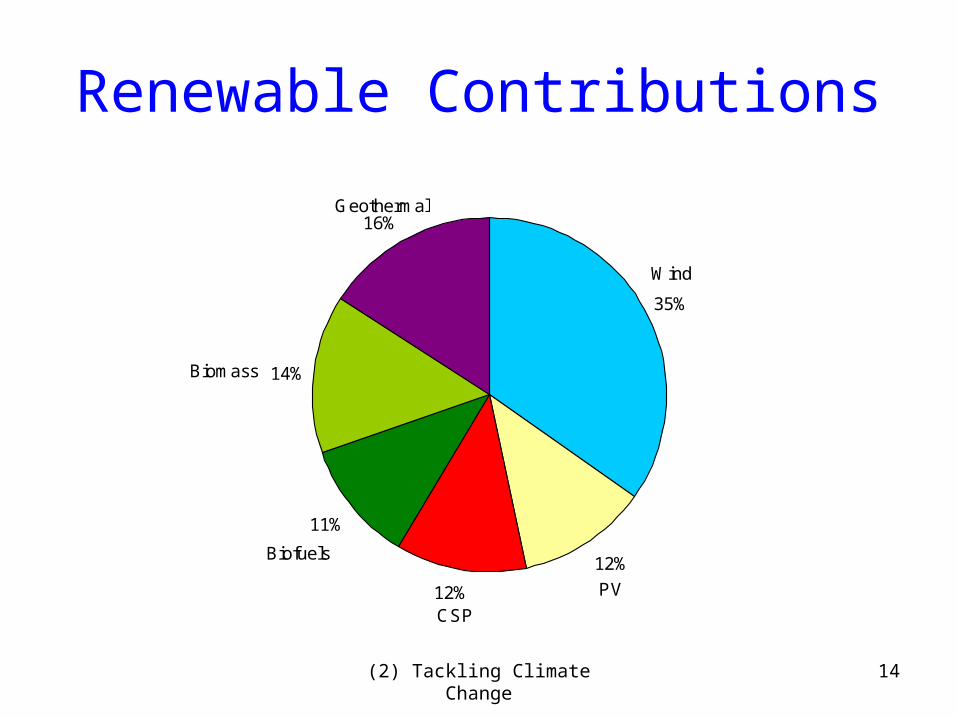
Renewable Contributions
35%
12%
12%
11%
14%
16%
Wind
PV
CSP
Biofuels
Biomass
Geothermal
(2) Tackling Climate Change
15
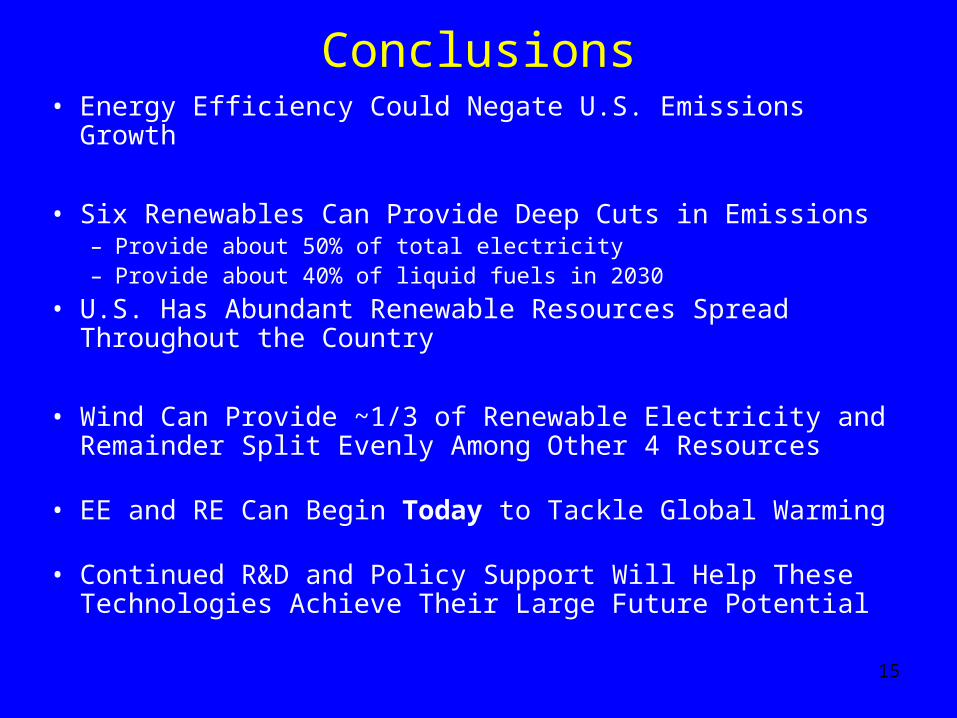
Conclusions• Energy Efficiency Could Negate U.S. Emissions Growth
• Six Renewables Can Provide Deep Cuts in Emissions– Provide about 50% of total electricity– Provide about 40% of liquid fuels in 2030
• U.S. Has Abundant Renewable Resources Spread Throughout the Country
• Wind Can Provide ~1/3 of Renewable Electricity and Remainder Split Evenly Among Other 4 Resources
• EE and RE Can Begin Today to Tackle Global Warming
• Continued R&D and Policy Support Will Help These Technologies Achieve Their Large Future Potential
16
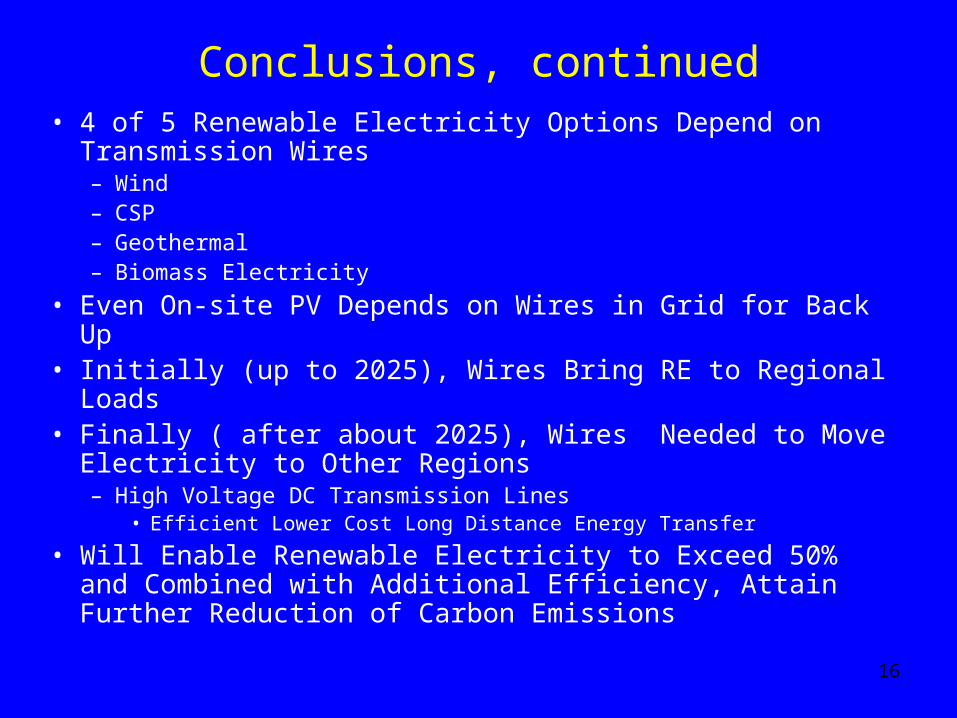
Conclusions, continued• 4 of 5 Renewable Electricity Options Depend on
Transmission Wires– Wind– CSP– Geothermal– Biomass Electricity
• Even On-site PV Depends on Wires in Grid for Back Up• Initially (up to 2025), Wires Bring RE to Regional Loads• Finally ( after about 2025), Wires Needed to Move
Electricity to Other Regions– High Voltage DC Transmission Lines
• Efficient Lower Cost Long Distance Energy Transfer
• Will Enable Renewable Electricity to Exceed 50% and Combined with Additional Efficiency, Attain Further Reduction of Carbon Emissions
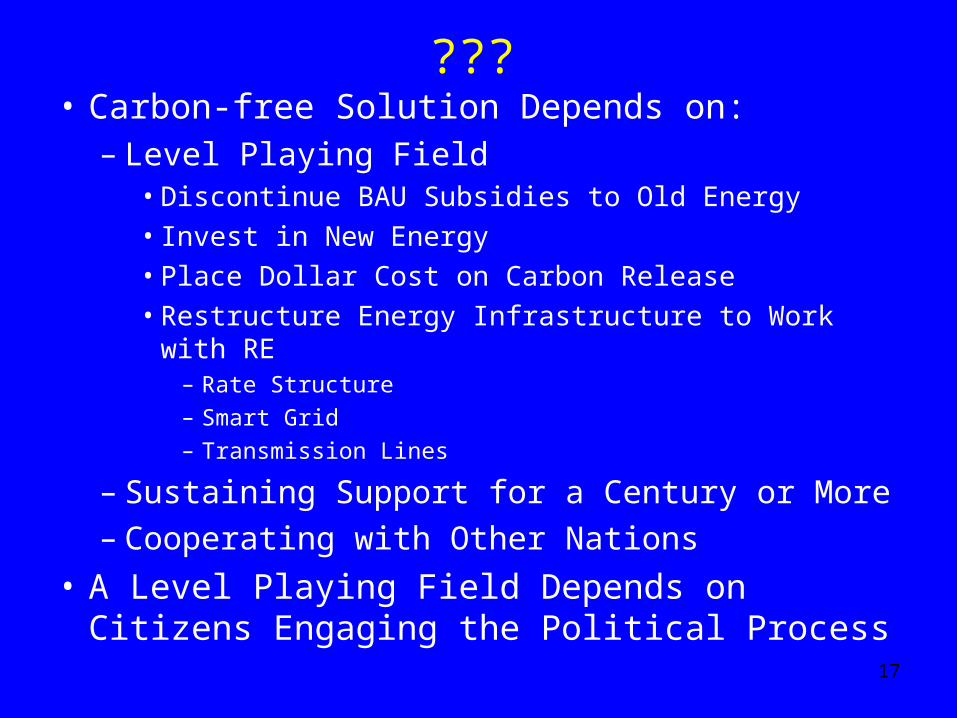
??? • Carbon-free Solution Depends on:
– Level Playing Field• Discontinue BAU Subsidies to Old Energy• Invest in New Energy• Place Dollar Cost on Carbon Release• Restructure Energy Infrastructure to Work with RE
– Rate Structure– Smart Grid– Transmission Lines
– Sustaining Support for a Century or More– Cooperating with Other Nations
• A Level Playing Field Depends on Citizens Engaging the Political Process 17
Apply to San Diego Region
In the Renewable Energy Electric Sector
18
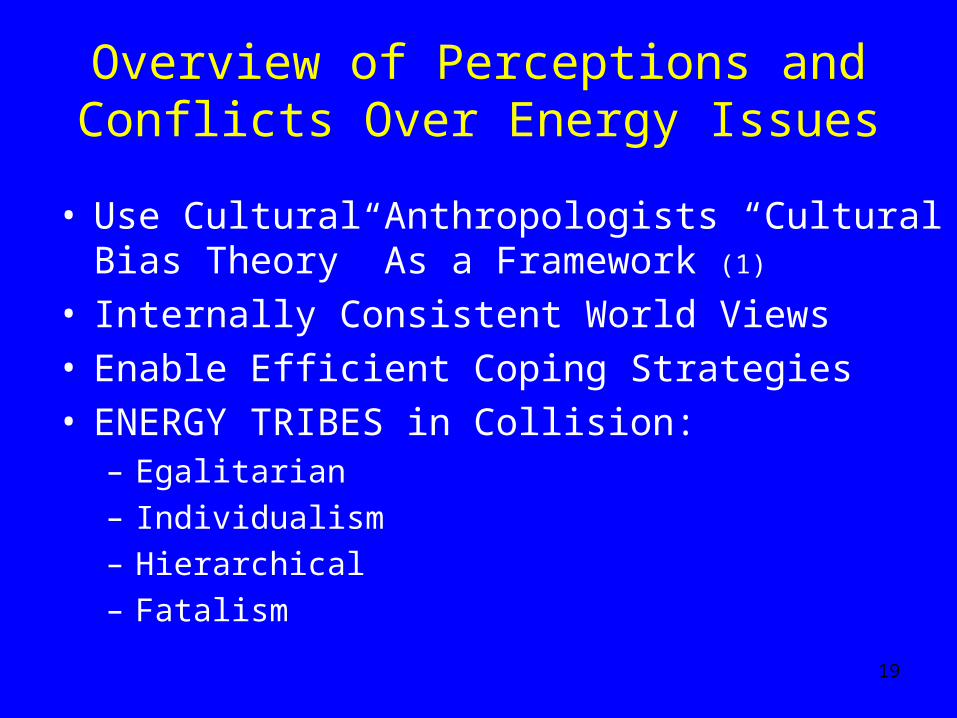
Overview of Perceptions and Conflicts Over Energy Issues
• Use Cultural Anthropologists “Cultural Bias Theory” As a Framework (1)
• Internally Consistent World Views• Enable Efficient Coping Strategies• ENERGY TRIBES in Collision:
– Egalitarian– Individualism– Hierarchical – Fatalism
19
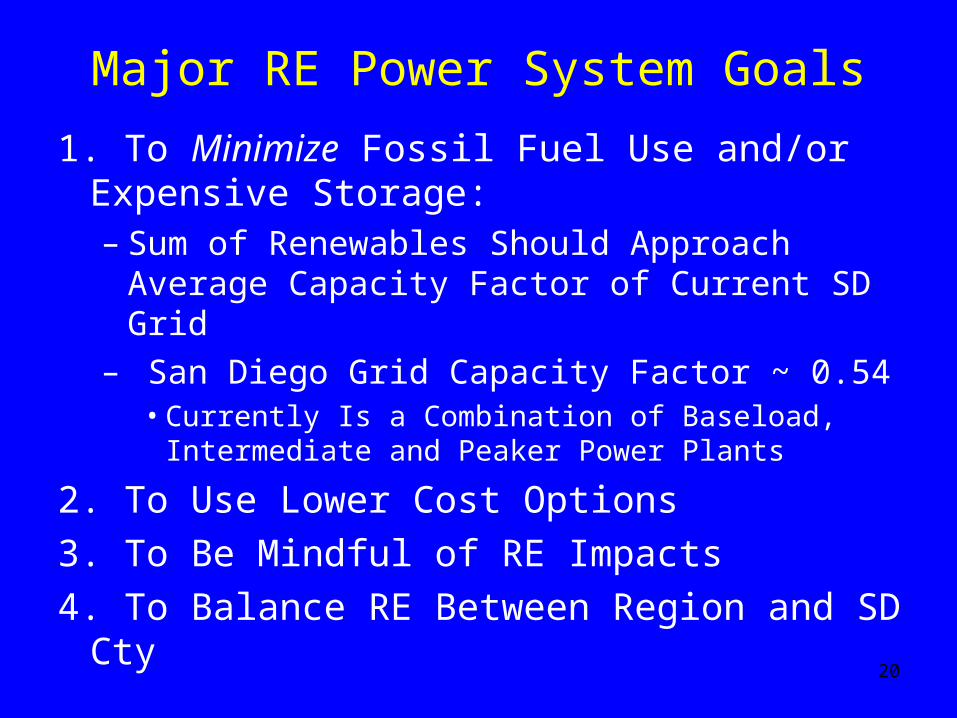
Major RE Power System Goals
1. To Minimize Fossil Fuel Use and/or Expensive Storage:– Sum of Renewables Should Approach Average
Capacity Factor of Current SD Grid– San Diego Grid Capacity Factor ~ 0.54
• Currently Is a Combination of Baseload, Intermediate and Peaker Power Plants
2. To Use Lower Cost Options
3. To Be Mindful of RE Impacts
4. To Balance RE Between Region and SD Cty20
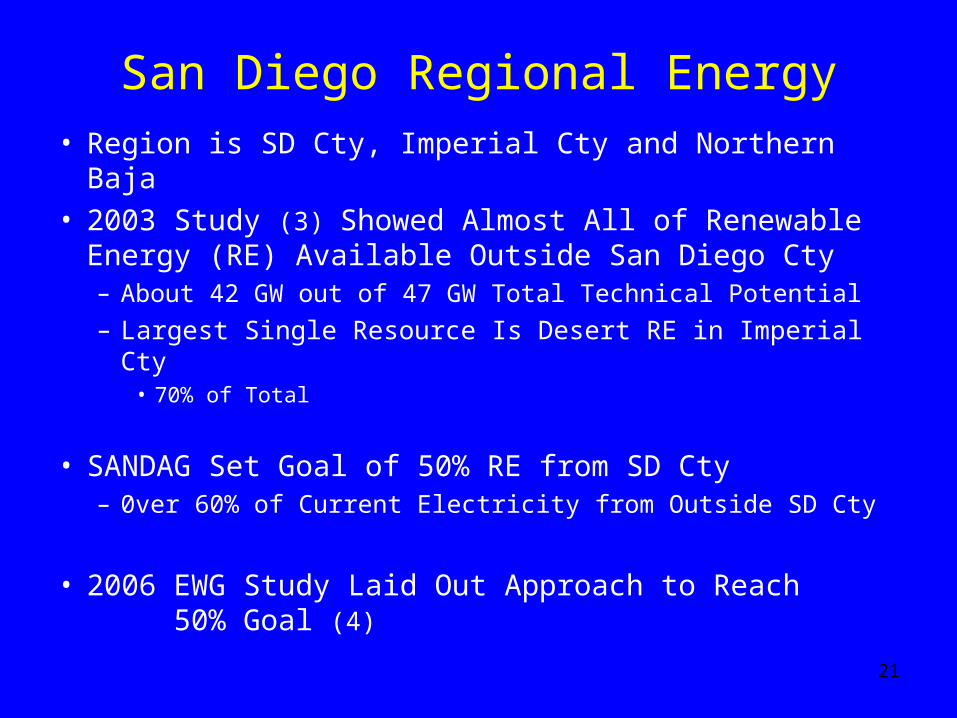
San Diego Regional Energy
• Region is SD Cty, Imperial Cty and Northern Baja• 2003 Study (3) Showed Almost All of Renewable
Energy (RE) Available Outside San Diego Cty – About 42 GW out of 47 GW Total Technical Potential
– Largest Single Resource Is Desert RE in Imperial Cty • 70% of Total
• SANDAG Set Goal of 50% RE from SD Cty – 0ver 60% of Current Electricity from Outside SD Cty
• 2006 EWG Study Laid Out Approach to Reach 50% Goal (4)
21
22
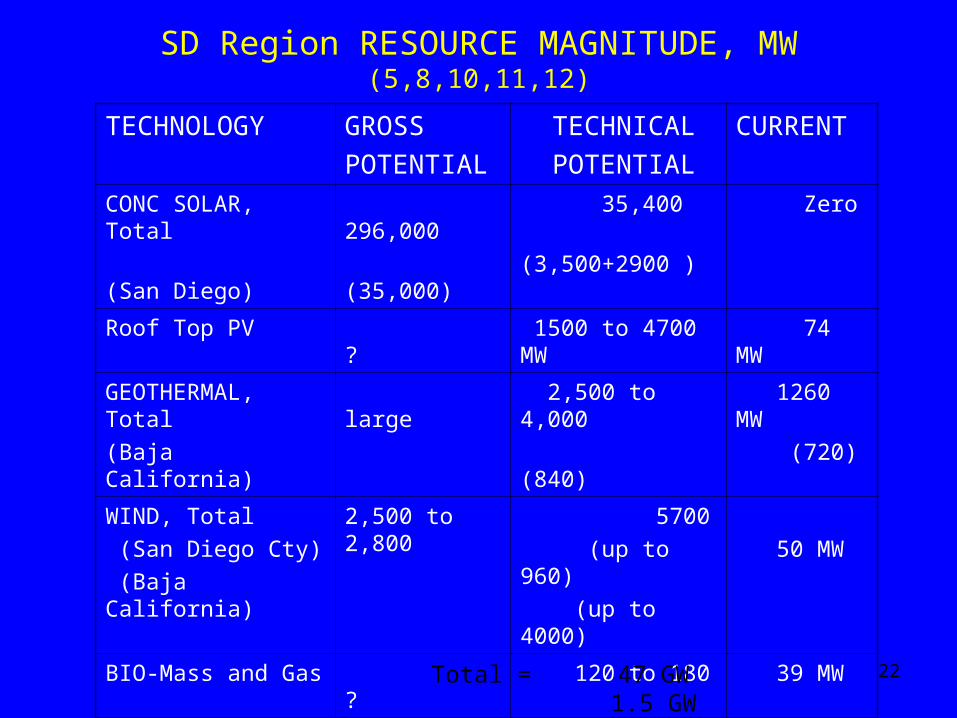
SD Region RESOURCE MAGNITUDE, MW (5,8,10,11,12)
TECHNOLOGY GROSS
POTENTIAL
TECHNICAL
POTENTIAL
CURRENT
CONC SOLAR, Total
(San Diego)
296,000
(35,000)
35,400
(3,500+2900 )
Zero
Roof Top PV ? 1500 to 4700 MW 74 MW
GEOTHERMAL, Total
(Baja California)
large 2,500 to 4,000
(840)
1260 MW
(720)
WIND, Total
(San Diego Cty)
(Baja California)
2,500 to 2,800 5700
(up to 960)
(up to 4000)
50 MW
BIO-Mass and Gas ? 120 to 180 39 MW
Small HYDRO, Total
(San Diego Cty)
(Imperial Cty)
(Baja California)
? 170
(10)
(up to 86)
(up to 75)
94.5 MW
(8)
(86.5)
Total = 47 GW 1.5 GW
23
24
25
26
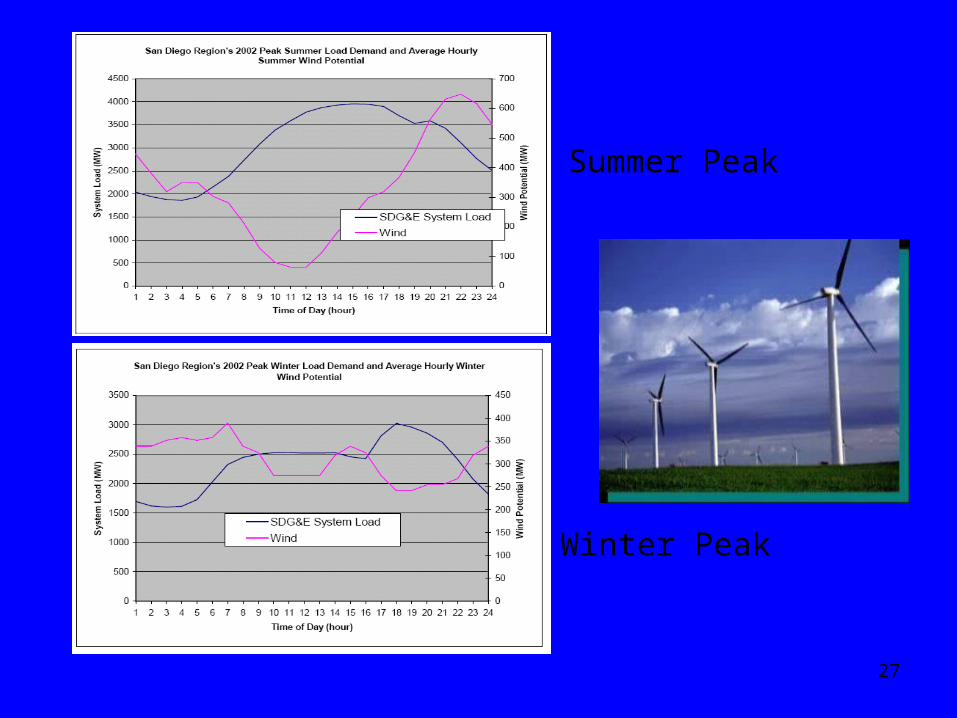
27
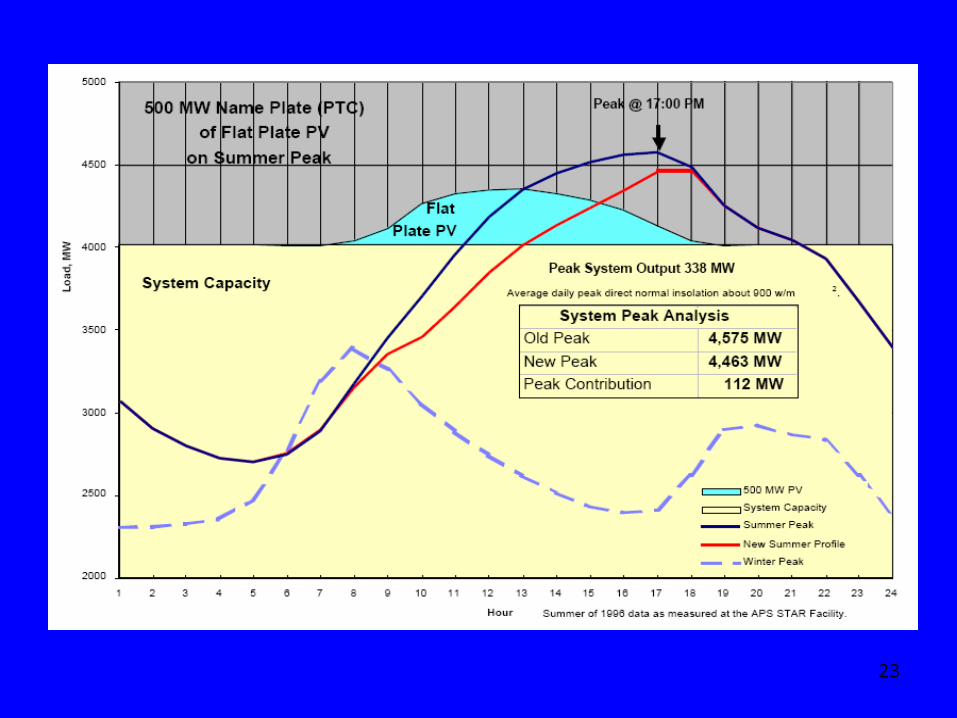
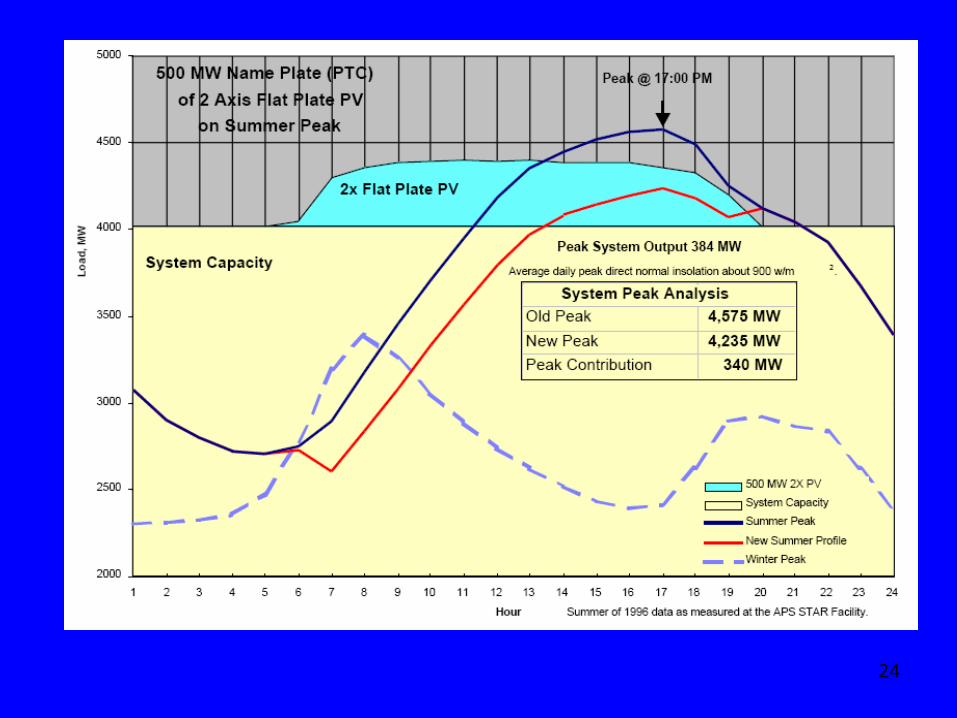
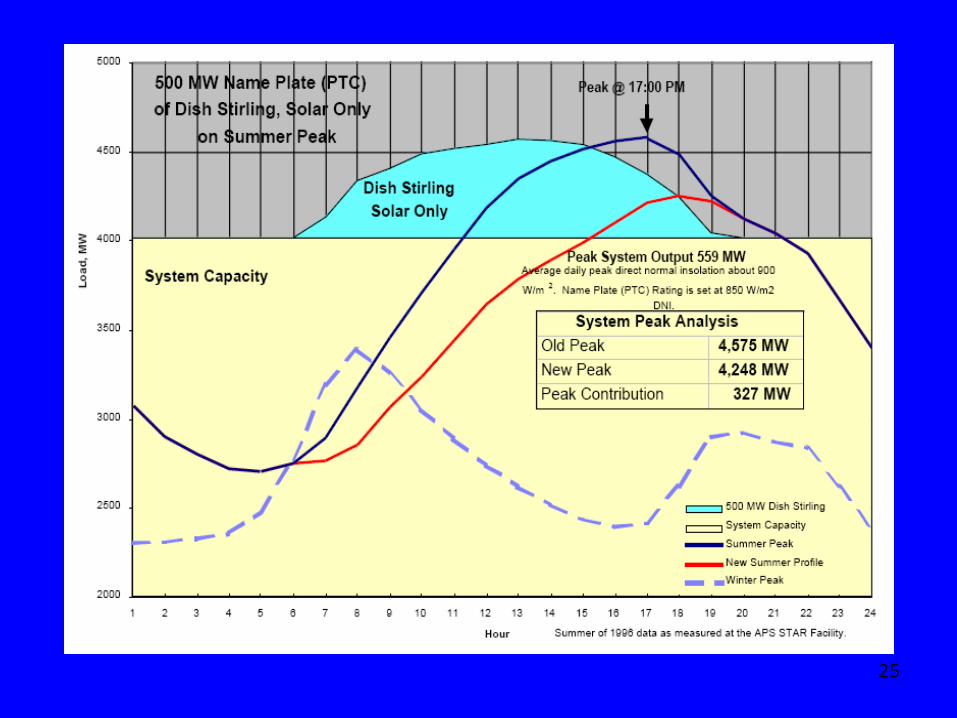
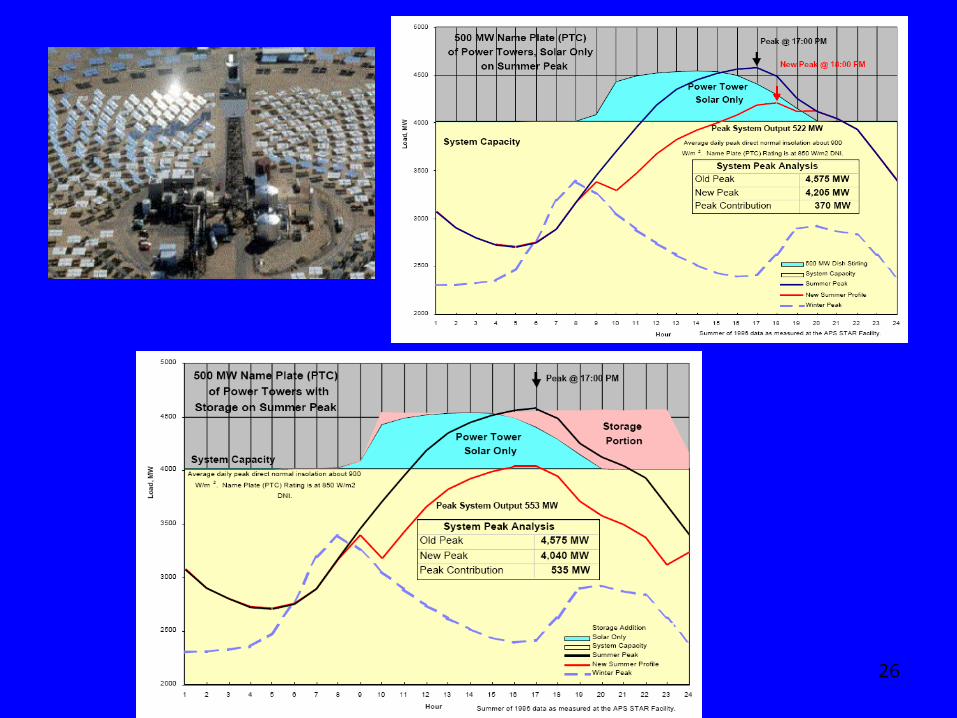
Summer Peak
Winter Peak
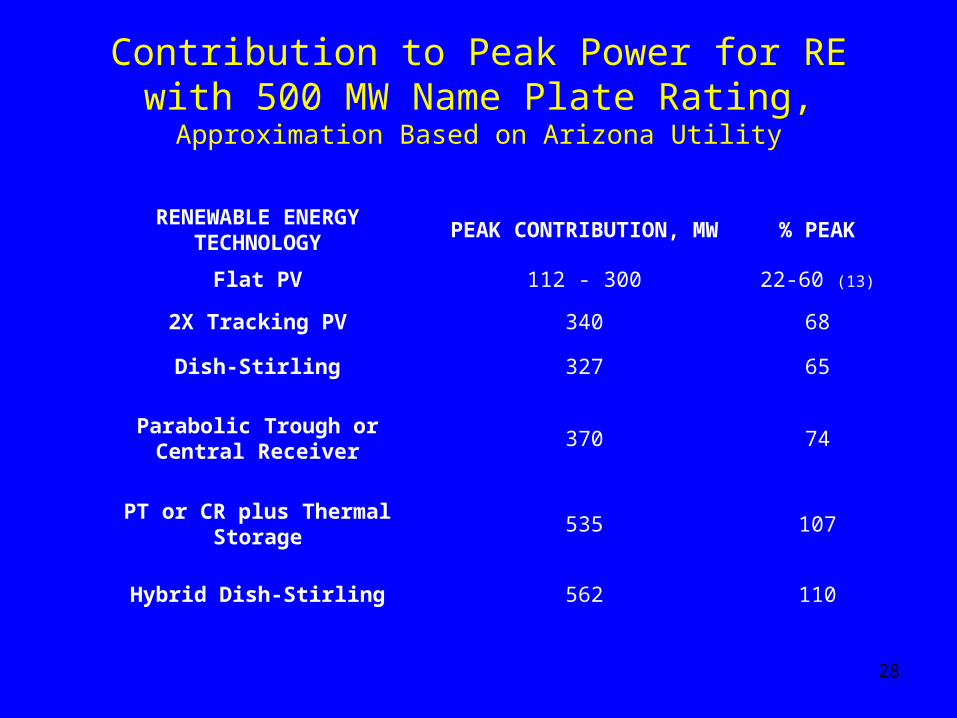
Contribution to Peak Power for RE with 500 MW Name Plate Rating, Approximation Based on Arizona Utility
RENEWABLE ENERGY TECHNOLOGY
PEAK CONTRIBUTION, MW
% PEAK
Flat PV 112 - 300 22-60 (13)
2X Tracking PV 340 68
Dish-Stirling 327 65
Parabolic Trough or Central Receiver
370 74
PT or CR plus Thermal Storage
535 107
Hybrid Dish-Stirling 562 110
28
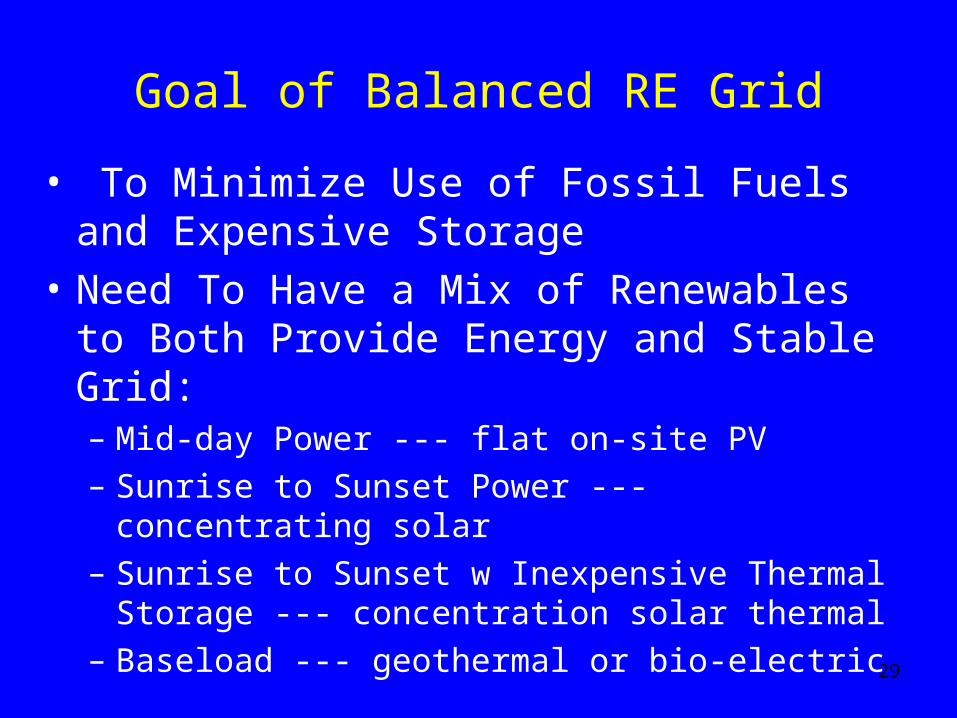
Goal of Balanced RE Grid
• To Minimize Use of Fossil Fuels and Expensive Storage
• Need To Have a Mix of Renewables to Both Provide Energy and Stable Grid:– Mid-day Power --- flat on-site PV
– Sunrise to Sunset Power --- concentrating solar
– Sunrise to Sunset w Inexpensive Thermal Storage --- concentration solar thermal
– Baseload --- geothermal or bio-electric
29
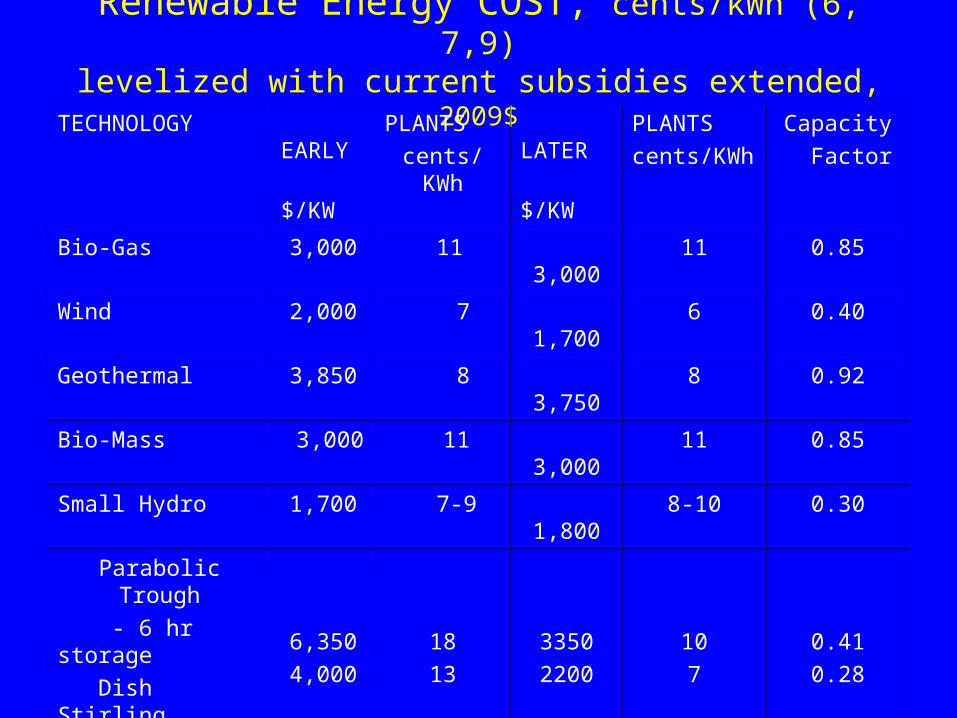
Renewable Energy COST, cents/kWh (6, 7,9)levelized with current subsidies extended, 2009$
TECHNOLOGY EARLY
$/KW
PLANTS
cents/KWh
LATER
$/KW
PLANTS
cents/KWh
Capacity
Factor
Bio-Gas 3,000 11 3,000 11 0.85
Wind 2,000 7 1,700 6 0.40
Geothermal 3,850 8 3,750 8 0.92
Bio-Mass 3,000 11 3,000 11 0.85
Small Hydro 1,700 7-9 1,800 8-10 0.30
Parabolic Trough
- 6 hr storage
Dish Stirling
6,350
4,000
18
13
3350
2200
10
7
0.41
0.28
Flat Plate PV
-Residential, 3.8kW
- Commercial100kW
-3rd Party,10 MW
- Utility IPP, 10 MW
6,000
5,500
4,750
4,750
15
8
16
19
4,100
3,900
3,300
1,700
10
5
10
12
0.19
0.19
0.19
0.21
Concentrating PV 6,000 15 3,000 10 0.30
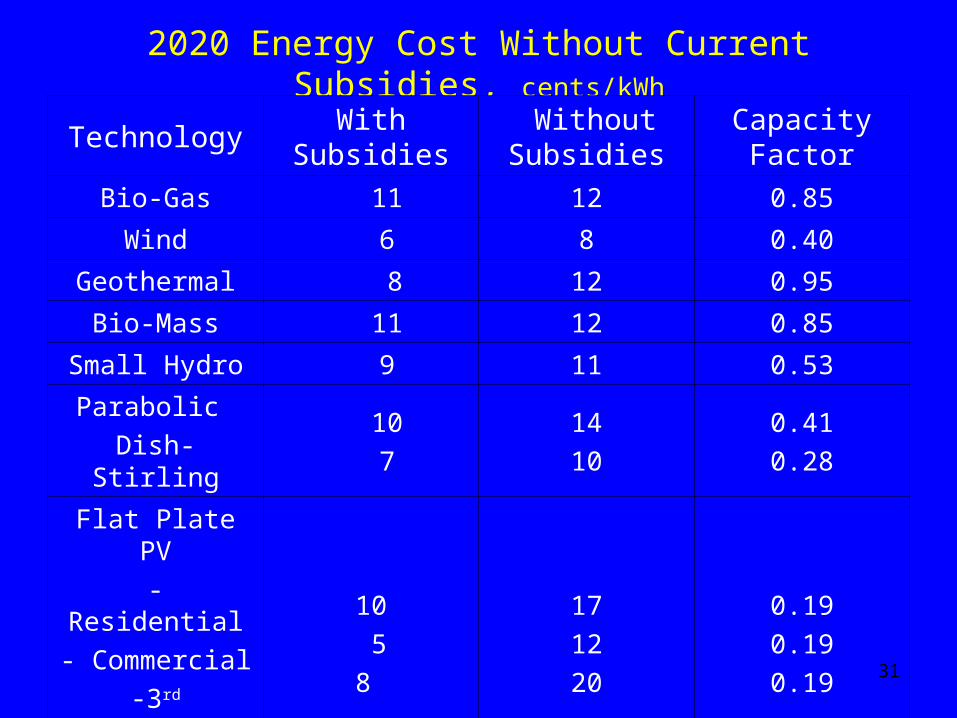
2020 Energy Cost Without Current Subsidies, cents/kWh
Technology With Subsidies Without
SubsidiesCapacity Factor
Bio-Gas 11 12 0.85
Wind 6 8 0.40
Geothermal 8 12 0.95
Bio-Mass 11 12 0.85
Small Hydro 9 11 0.53
Parabolic
Dish-Stirling
10
7
14
10
0.41
0.28
Flat Plate PV
- Residential
- Commercial-3rd Party10MW
10
5
8
17
12
20
0.19
0.19
0.19
Concentrating PV
10 13 0.30 31
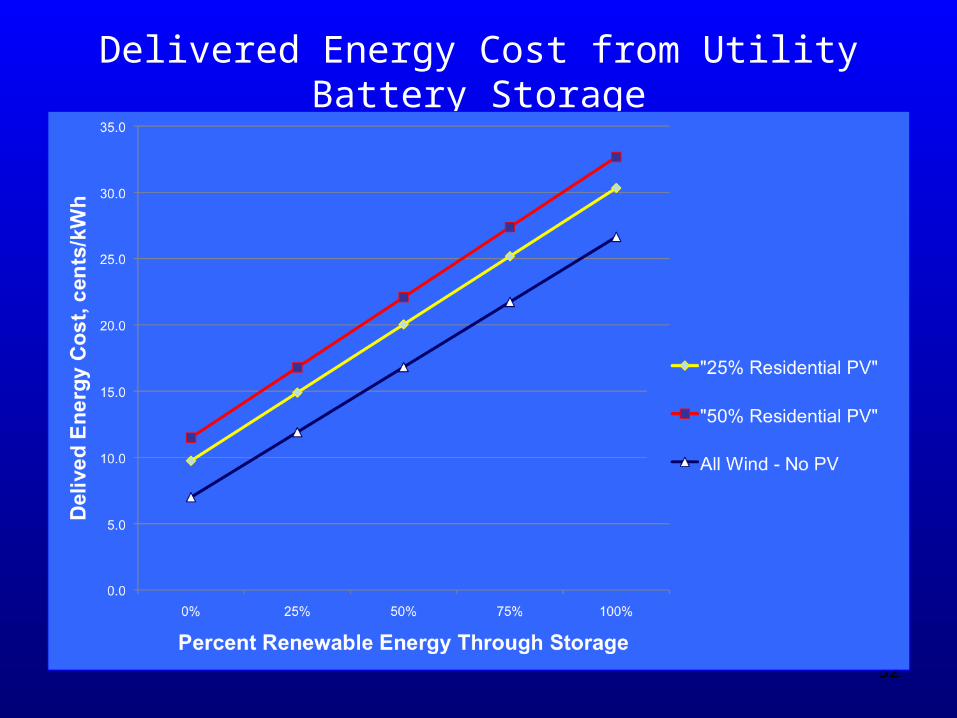
Delivered Energy Cost from Utility Battery Storage
32
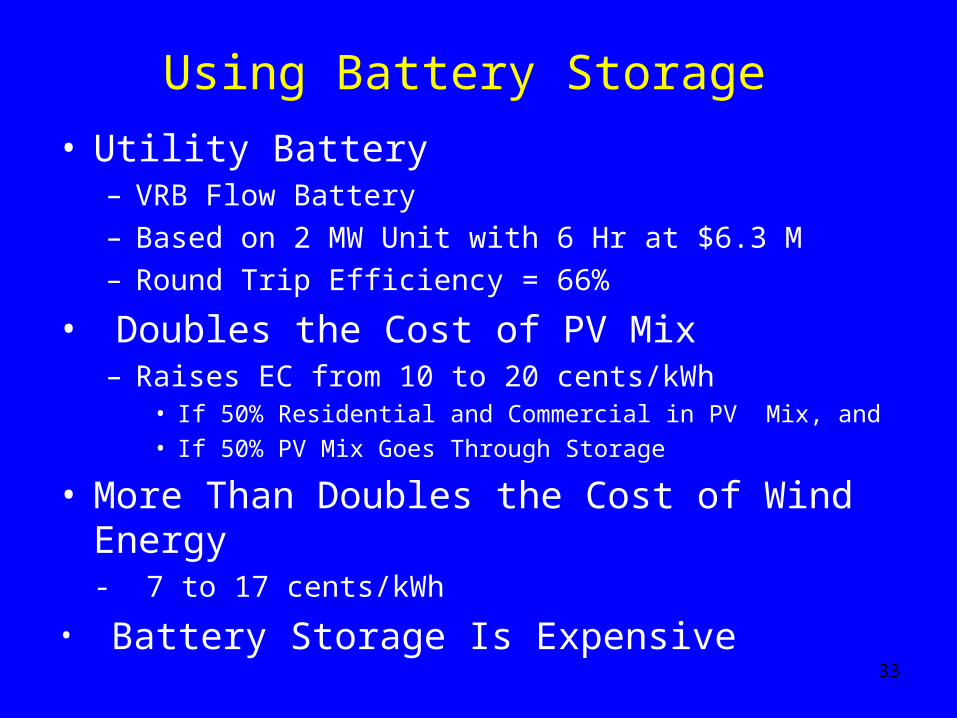
Using Battery Storage
• Utility Battery– VRB Flow Battery
– Based on 2 MW Unit with 6 Hr at $6.3 M
– Round Trip Efficiency = 66%
• Doubles the Cost of PV Mix – Raises EC from 10 to 20 cents/kWh
• If 50% Residential and Commercial in PV Mix, and
• If 50% PV Mix Goes Through Storage
• More Than Doubles the Cost of Wind Energy- 7 to 17 cents/kWh
• Battery Storage Is Expensive
33
Environmental Impacts
• To Minimize Local and Global CO2 Impacts, U.S. To Reduce CO2 by 80% by 2050
• All RE Options – Avoid Onerous Impacts of CO2 – Desirable As a Class of Options
• Among RE Options, There Are a Range of Lesser and Local Impacts
34
35
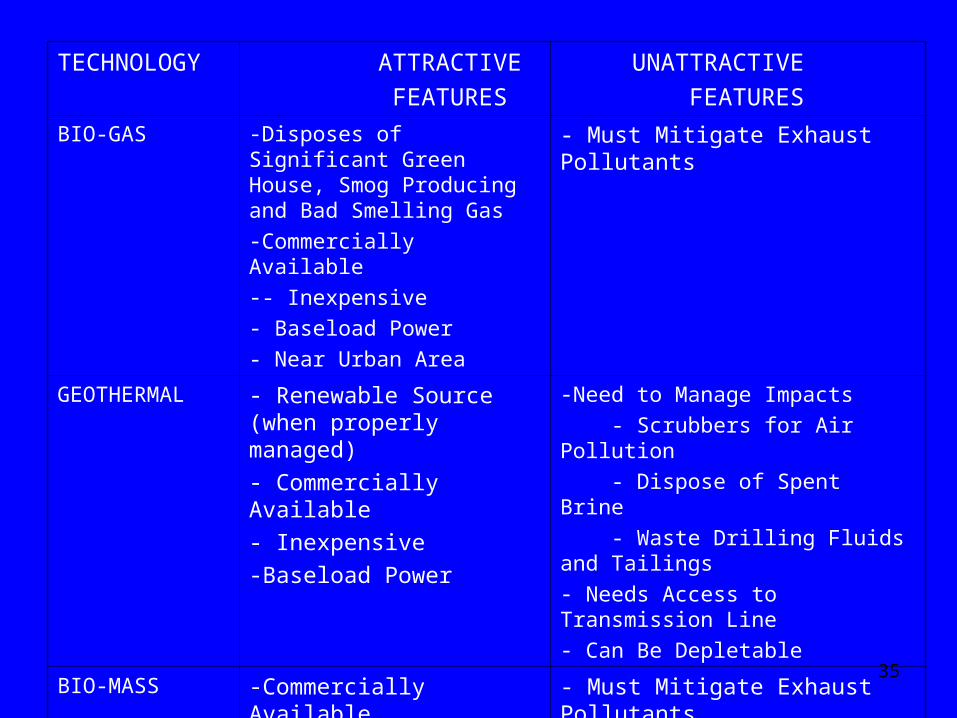
TECHNOLOGY ATTRACTIVE
FEATURES
UNATTRACTIVE
FEATURES
BIO-GAS -Disposes of Significant Green House, Smog Producing and Bad Smelling Gas-Commercially Available-- Inexpensive - Baseload Power
- Near Urban Area
- Must Mitigate Exhaust Pollutants
GEOTHERMAL - Renewable Source (when properly managed)
- Commercially Available
- Inexpensive
-Baseload Power
-Need to Manage Impacts
- Scrubbers for Air Pollution
- Dispose of Spent Brine
- Waste Drilling Fluids and Tailings- Needs Access to Transmission Line - Can Be Depletable
BIO-MASS -Commercially Available
-Baseload Power
- Must Mitigate Exhaust Pollutants
- Limited and Variable
HYDRO
- Renewable
- Commercially Available
- Need to Manage Impacts Especially Fisheries, Wildlife, Cultural, Recreational & Scenic
36
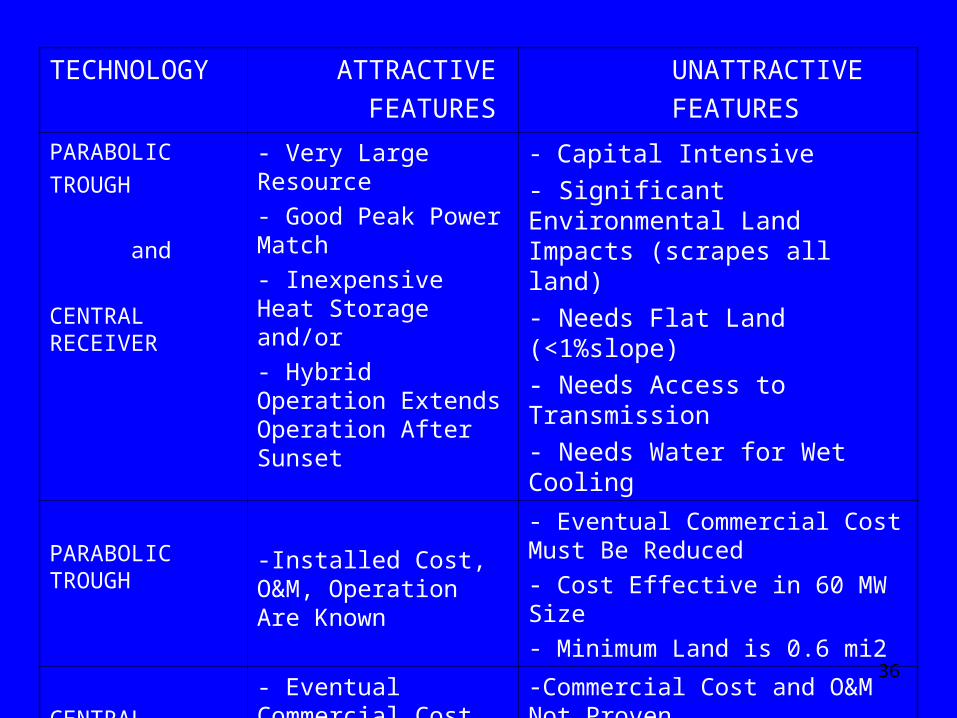
TECHNOLOGY ATTRACTIVE
FEATURES
UNATTRACTIVE
FEATURES
PARABOLIC
TROUGH
and
CENTRAL RECEIVER
- Very Large Resource
- Good Peak Power Match
- Inexpensive Heat Storage and/or
- Hybrid Operation Extends Operation After Sunset
- Capital Intensive- Significant Environmental Land Impacts (scrapes all land)- Needs Flat Land (<1%slope)
- Needs Access to Transmission- Needs Water for Wet Cooling
PARABOLIC TROUGH
-Installed Cost, O&M, Operation Are Known
- Eventual Commercial Cost Must Be Reduced
- Cost Effective in 60 MW Size
- Minimum Land is 0.6 mi2
CENTRAL RECEIVER
- Eventual Commercial Cost Likely Less Than Trough
-Commercial Cost and O&M Not Proven
-Cost Effective in 100 MW Size and Minimum Land Is 1.0 mi2
37
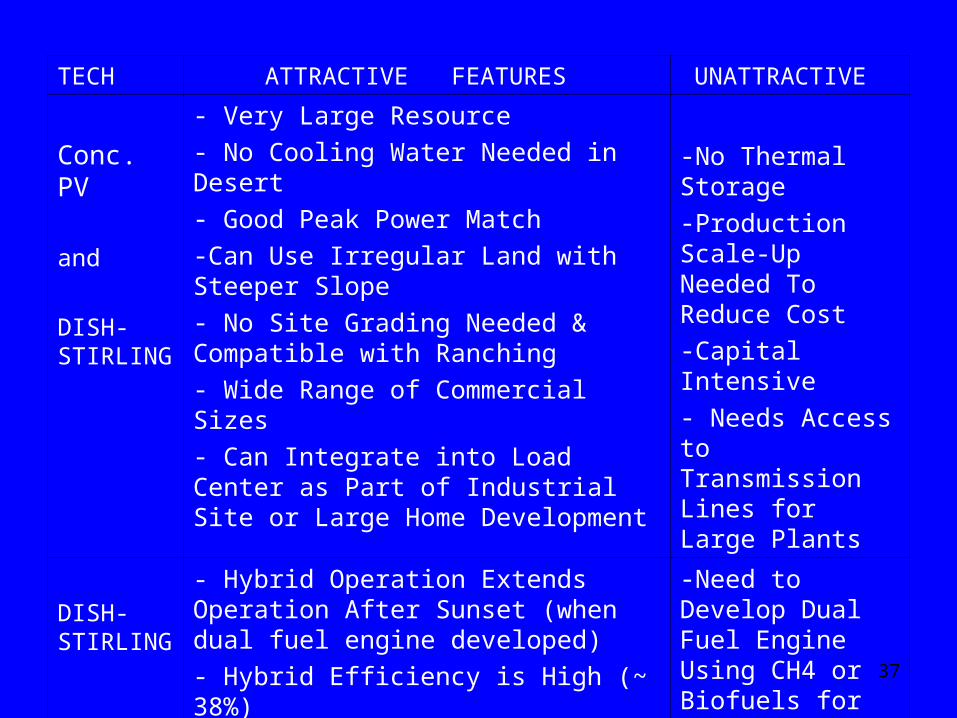
TECH ATTRACTIVE FEATURES UNATTRACTIVE
Conc. PV
and
DISH-STIRLING
- Very Large Resource- No Cooling Water Needed in Desert- Good Peak Power Match -Can Use Irregular Land with Steeper Slope- No Site Grading Needed & Compatible with Ranching- Wide Range of Commercial Sizes - Can Integrate into Load Center as Part of Industrial Site or Large Home Development
-No Thermal Storage-Production Scale-Up Needed To Reduce Cost-Capital Intensive- Needs Access to Transmission Lines for Large Plants
DISH-STIRLING
- Hybrid Operation Extends Operation After Sunset (when dual fuel engine developed)- Hybrid Efficiency is High (~ 38%)
-Need to Develop Dual Fuel Engine Using CH4 or Biofuels for Hybrid Operation
38
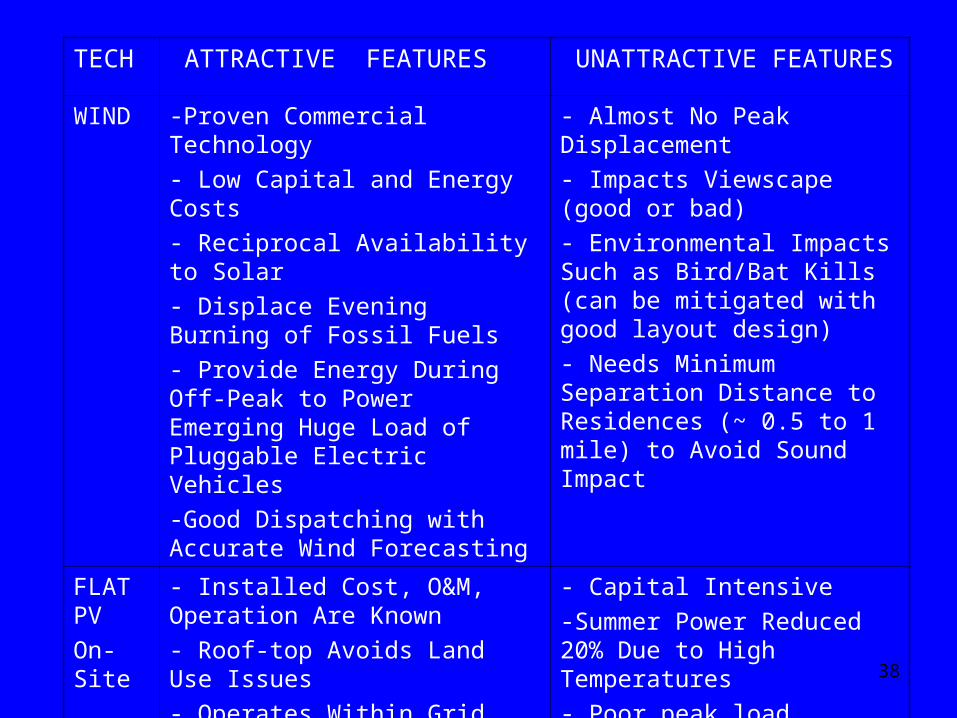
TECH ATTRACTIVE FEATURES UNATTRACTIVE FEATURES
WIND -Proven Commercial Technology
- Low Capital and Energy Costs
- Reciprocal Availability to Solar
- Displace Evening Burning of Fossil Fuels
- Provide Energy During Off-Peak to Power Emerging Huge Load of Pluggable Electric Vehicles
-Good Dispatching with Accurate Wind Forecasting
- Almost No Peak Displacement
- Impacts Viewscape (good or bad)
- Environmental Impacts Such as Bird/Bat Kills (can be mitigated with good layout design)
- Needs Minimum Separation Distance to Residences (~ 0.5 to 1 mile) to Avoid Sound Impact
FLAT PV
On-Site
- Installed Cost, O&M, Operation Are Known
- Roof-top Avoids Land Use Issues
- Operates Within Grid Without Transmission Lines
- Reduces Distribution Costs
- Capital Intensive
-Summer Power Reduced 20% Due to High Temperatures
- Poor peak load reduction
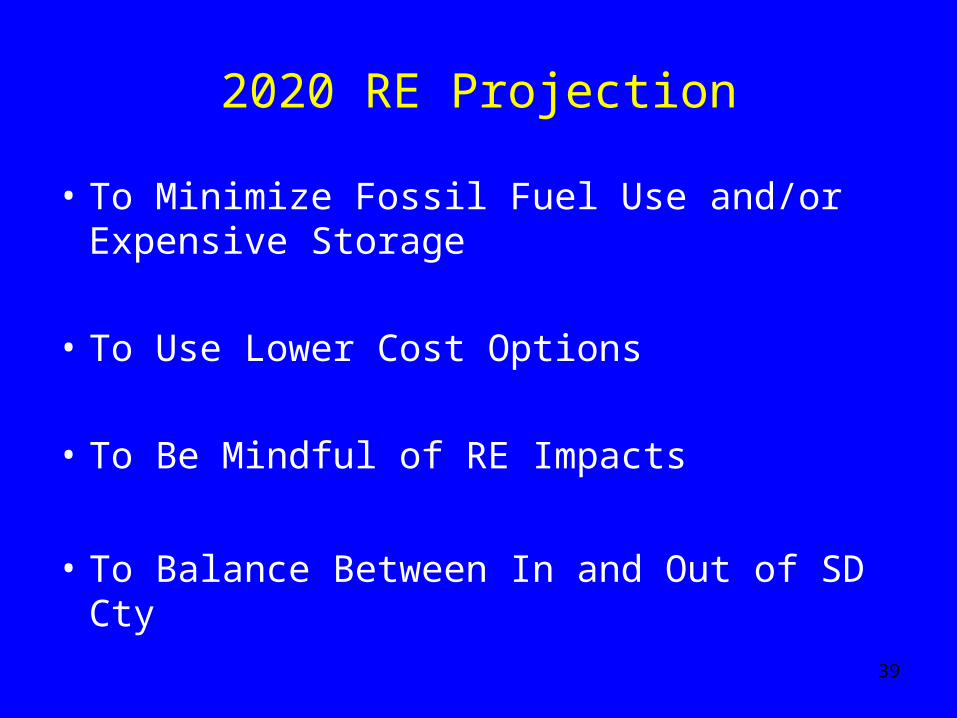
2020 RE Projection
• To Minimize Fossil Fuel Use and/or Expensive Storage
• To Use Lower Cost Options
• To Be Mindful of RE Impacts
• To Balance Between In and Out of SD Cty39
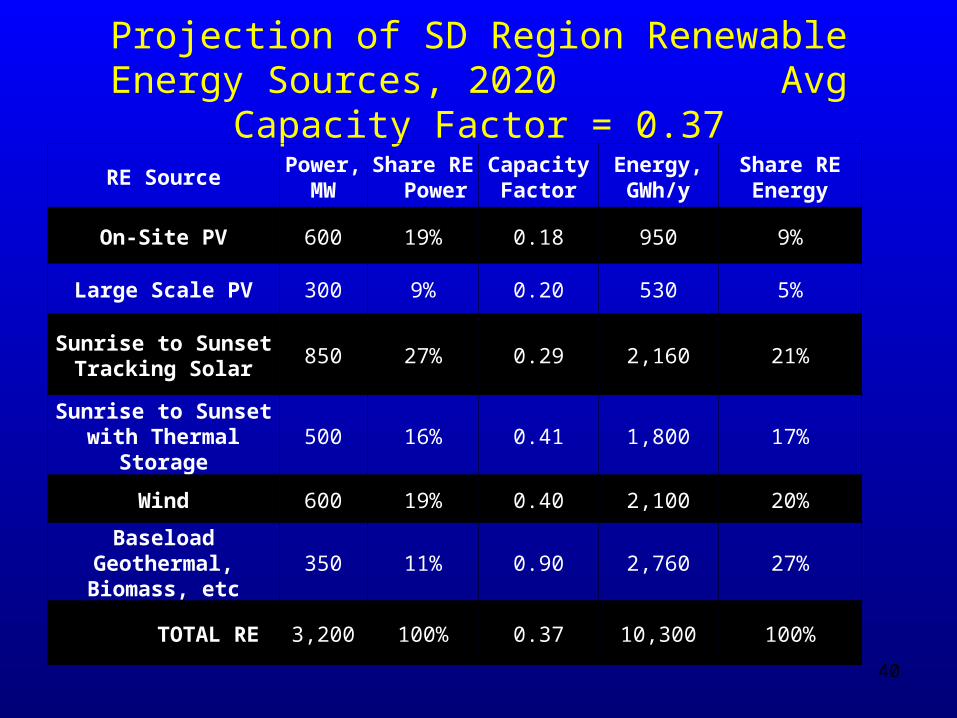
Projection of SD Region Renewable Energy Sources, 2020 Avg Capacity Factor = 0.37
RE SourcePower,
MWShare RE
PowerCapacity
FactorEnergy, GWh/y
Share RE Energy
On-Site PV 600 19% 0.18 950 9%
Large Scale PV 300 9% 0.20 530 5%
Sunrise to Sunset Tracking Solar
850 27% 0.29 2,160 21%
Sunrise to Sunset with Thermal Storage
500 16% 0.41 1,800 17%
Wind 600 19% 0.40 2,100 20%
Baseload Geothermal, Biomass, etc
350 11% 0.90 2,760 27%
TOTAL RE 3,200 100% 0.37 10,300 100%
40
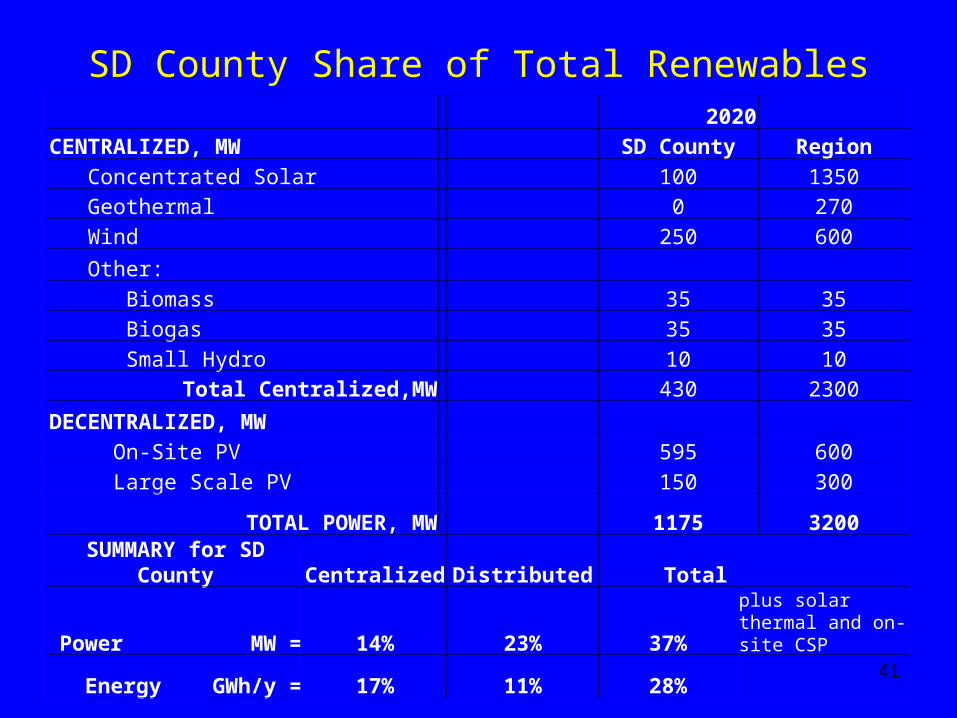
SD County Share of Total Renewables 2020
CENTRALIZED, MW SD County Region Concentrated Solar 100 1350 Geothermal 0 270 Wind 250 600
Other: Biomass 35 35 Biogas 35 35 Small Hydro 10 10
Total Centralized,MW 430 2300
DECENTRALIZED, MW On-Site PV 595 600 Large Scale PV 150 300
TOTAL POWER, MW 1175 3200SUMMARY for SD
County Centralized Distributed Total
Power MW = 14% 23% 37%plus solar thermal and on-site CSP
Energy GWh/y = 17% 11% 28% 41
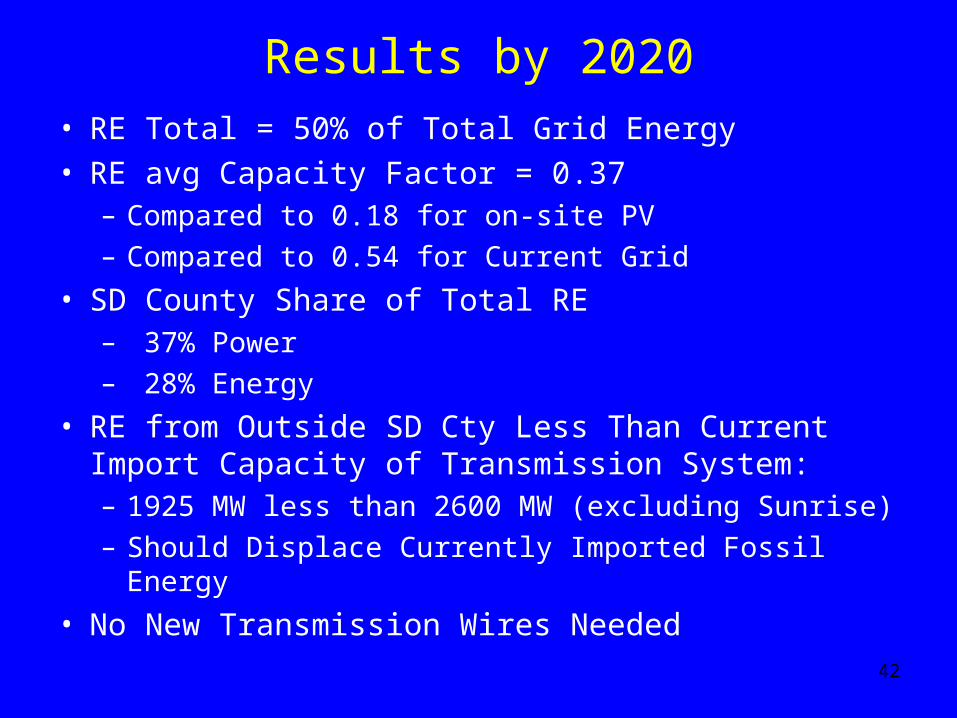
Results by 2020
• RE Total = 50% of Total Grid Energy
• RE avg Capacity Factor = 0.37– Compared to 0.18 for on-site PV– Compared to 0.54 for Current Grid
• SD County Share of Total RE– 37% Power– 28% Energy
• RE from Outside SD Cty Less Than Current Import Capacity of Transmission System: – 1925 MW less than 2600 MW (excluding Sunrise)– Should Displace Currently Imported Fossil Energy
• No New Transmission Wires Needed42
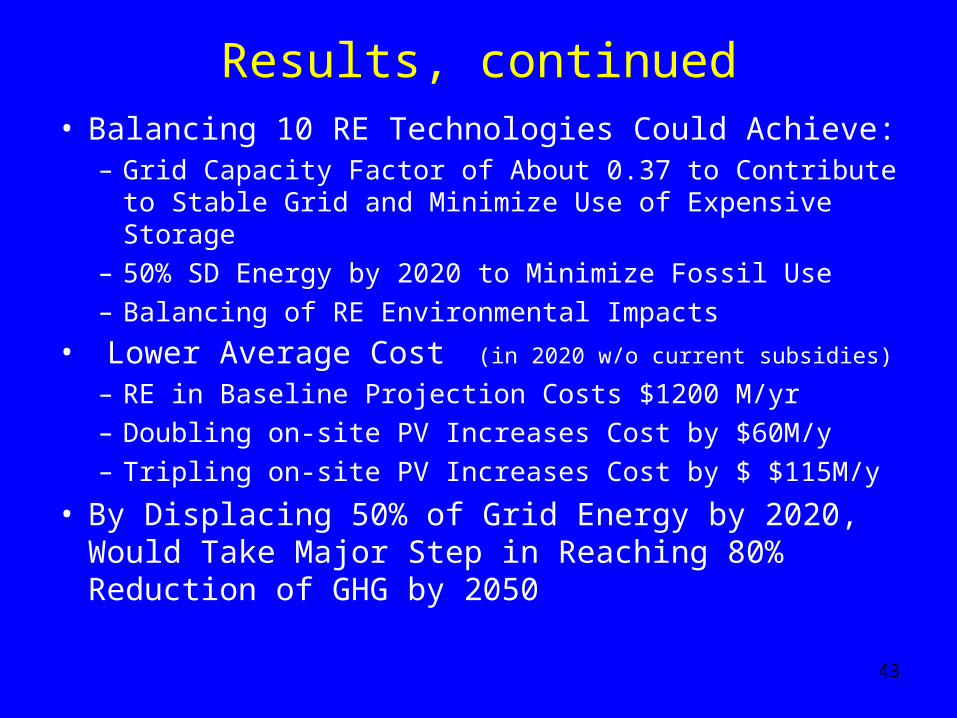
Results, continued• Balancing 10 RE Technologies Could Achieve:
– Grid Capacity Factor of About 0.37 to Contribute to Stable Grid and Minimize Use of Expensive Storage
– 50% SD Energy by 2020 to Minimize Fossil Use– Balancing of RE Environmental Impacts
• Lower Average Cost (in 2020 w/o current subsidies)
– RE in Baseline Projection Costs $1200 M/yr– Doubling on-site PV Increases Cost by $60M/y– Tripling on-site PV Increases Cost by $ $115M/y
• By Displacing 50% of Grid Energy by 2020, Would Take Major Step in Reaching 80% Reduction of GHG by 2050
43
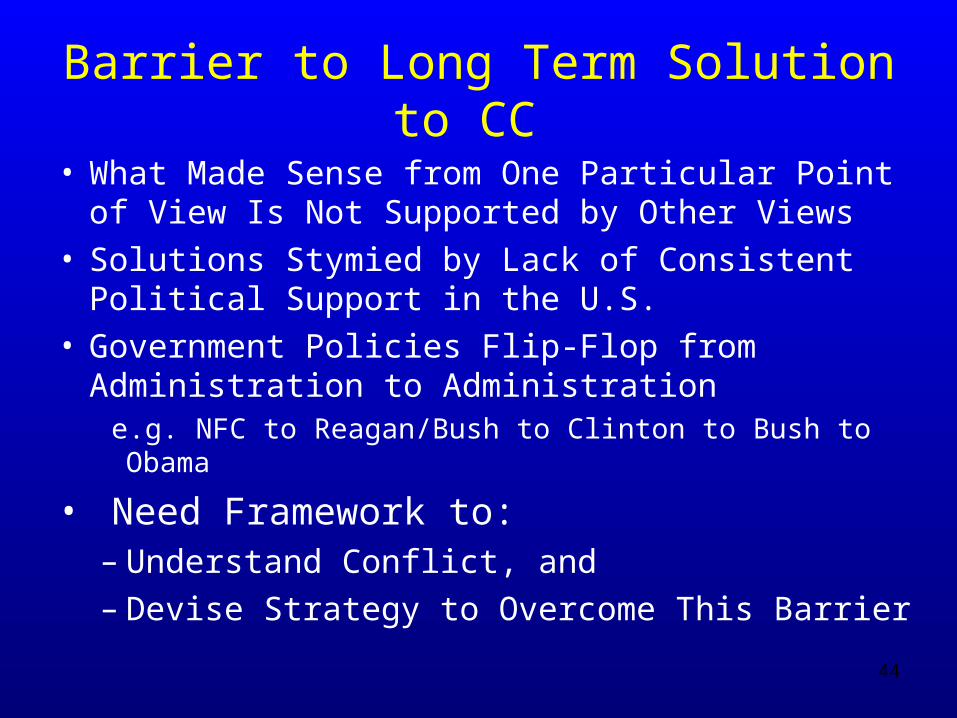
Barrier to Long Term Solution to CC
• What Made Sense from One Particular Point of View Is Not Supported by Other Views
• Solutions Stymied by Lack of Consistent Political Support in the U.S.
• Government Policies Flip-Flop from Administration to Administration e.g. NFC to Reagan/Bush to Clinton to Bush to Obama
• Need Framework to: – Understand Conflict, and – Devise Strategy to Overcome This Barrier
44
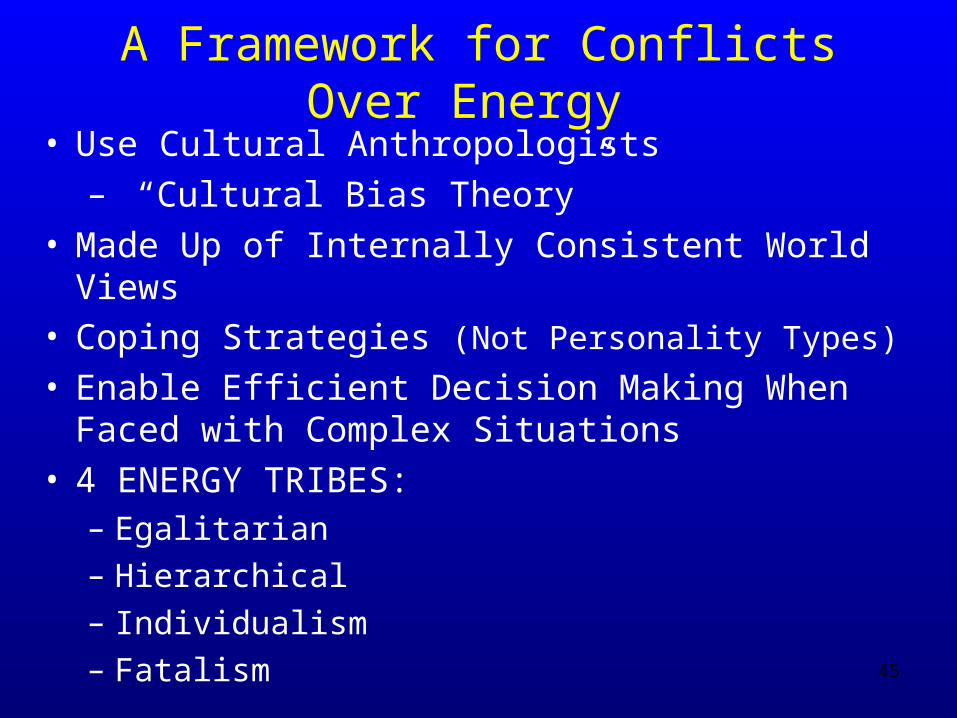
A Framework for Conflicts Over Energy
• Use Cultural Anthropologists– “Cultural Bias Theory”
• Made Up of Internally Consistent World Views• Coping Strategies (Not Personality Types)
• Enable Efficient Decision Making When Faced with Complex Situations
• 4 ENERGY TRIBES:– Egalitarian
– Hierarchical
– Individualism
– Fatalism 45
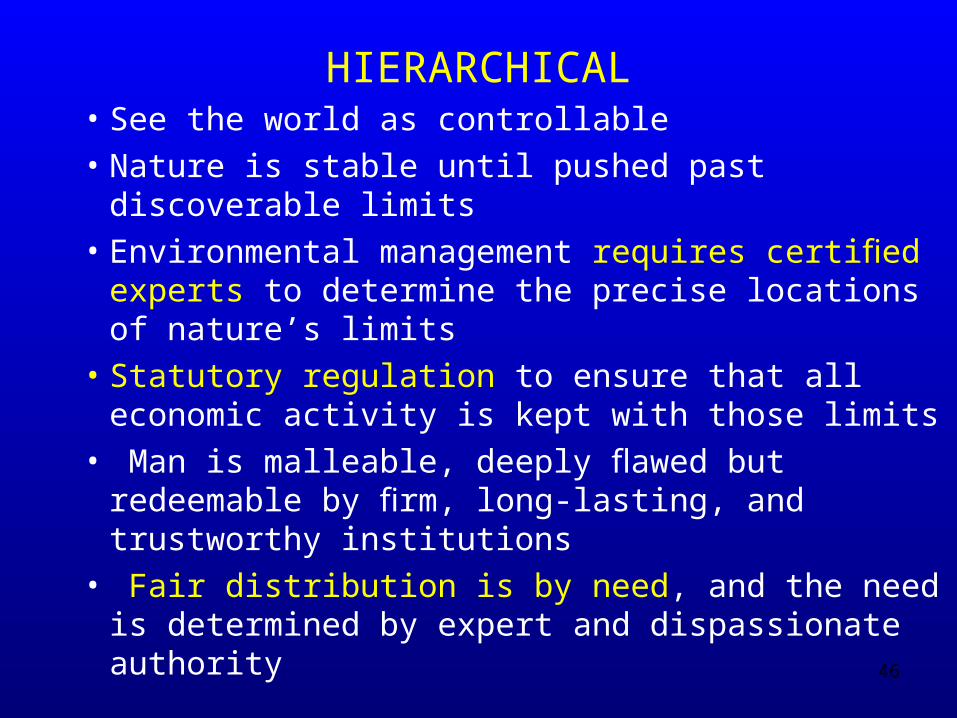
HIERARCHICAL• See the world as controllable• Nature is stable until pushed past discoverable
limits• Environmental management requires certified
experts to determine the precise locations of nature’s limits
• Statutory regulation to ensure that all economic activity is kept with those limits
• Man is malleable, deeply flawed but redeemable by firm, long-lasting, and trustworthy institutions
• Fair distribution is by need, and the need is determined by expert and dispassionate authority46
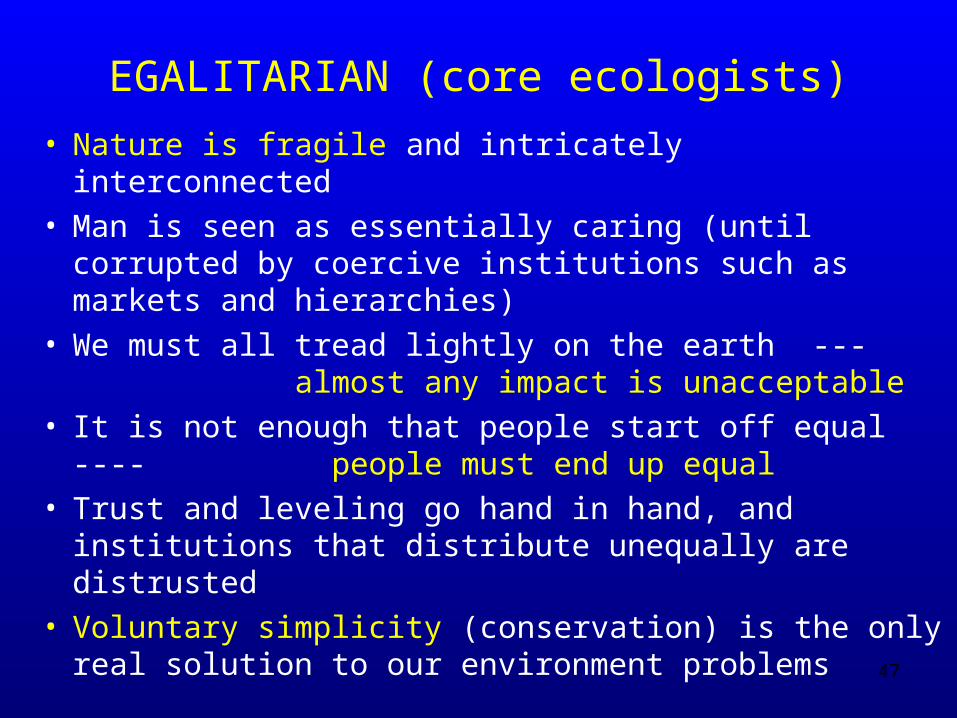
EGALITARIAN (core ecologists)
• Nature is fragile and intricately interconnected
• Man is seen as essentially caring (until corrupted by coercive institutions such as markets and hierarchies)
• We must all tread lightly on the earth --- almost any impact is unacceptable
• It is not enough that people start off equal ---- people must end up equal
• Trust and leveling go hand in hand, and institutions that distribute unequally are distrusted
• Voluntary simplicity (conservation) is the only real solution to our environment problems
47
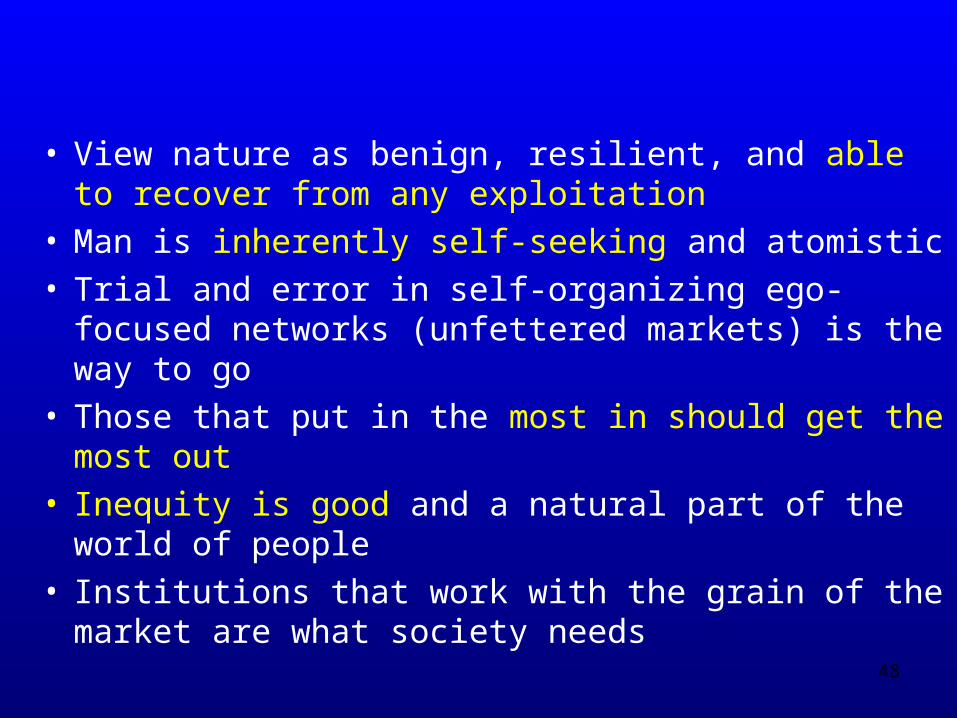
INDIVIDUALISM
• View nature as benign, resilient, and able to recover from any exploitation
• Man is inherently self-seeking and atomistic• Trial and error in self-organizing ego-focused
networks (unfettered markets) is the way to go• Those that put in the most in should get the most out• Inequity is good and a natural part of the world of
people• Institutions that work with the grain of the market are
what society needs
48
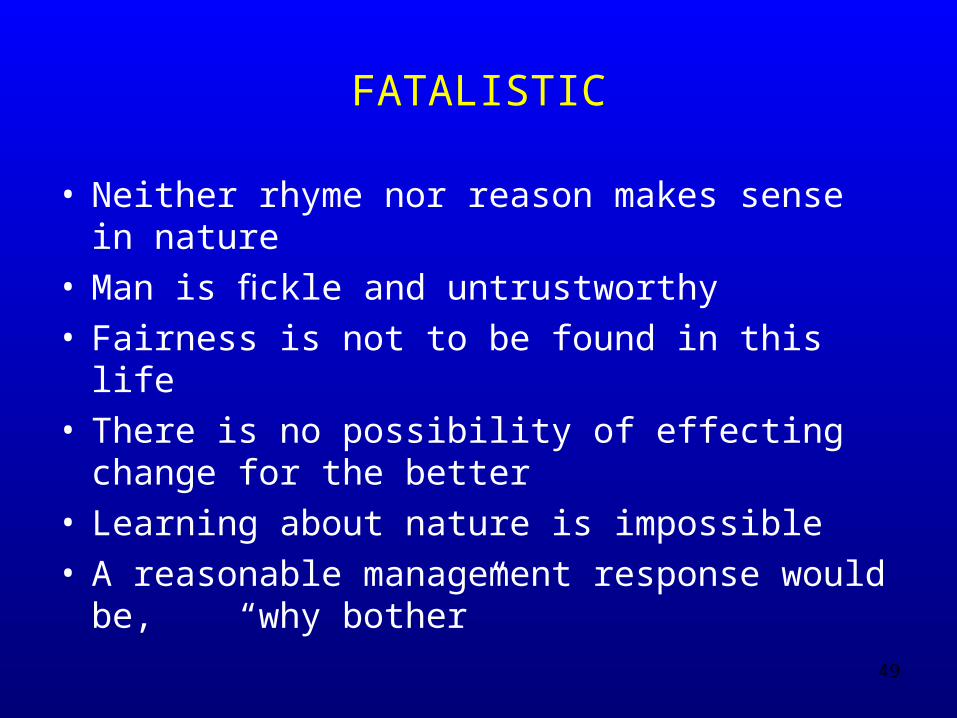
FATALISTIC
• Neither rhyme nor reason makes sense in nature
• Man is fickle and untrustworthy• Fairness is not to be found in this life• There is no possibility of effecting change for the
better• Learning about nature is impossible• A reasonable management response would be,
“why bother”
49
EACH ENERGY TRIBE NOT COMPLETE
• Have Strong Capabilities
• Have Blind Spots
• To Formulate and Implement Effective Approach Would Require a Blending of All
50
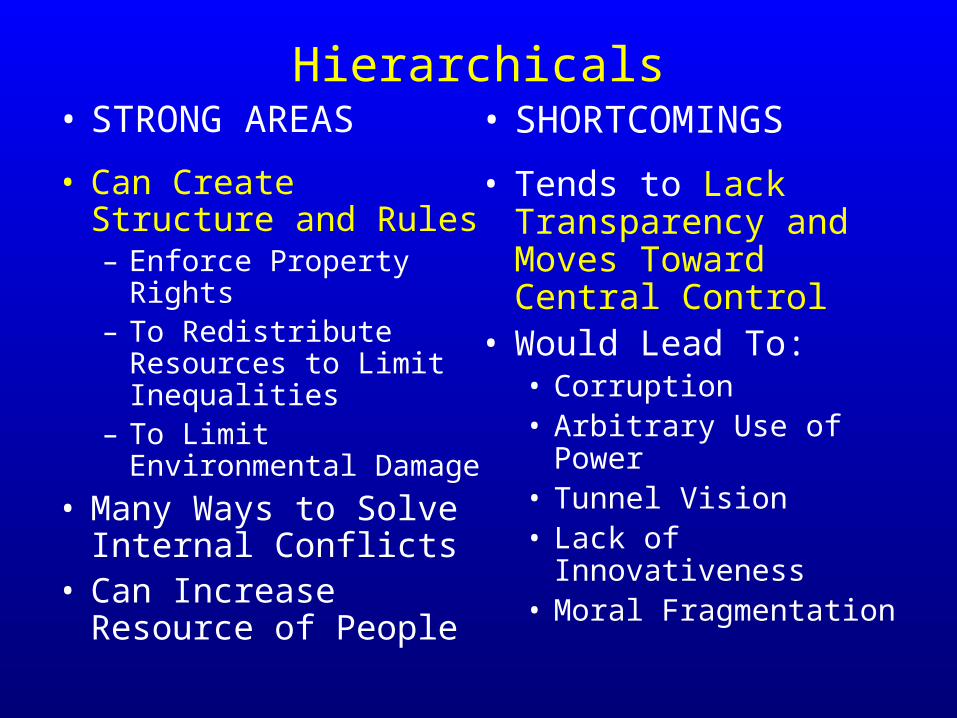
Hierarchicals• STRONG AREAS
• Can Create Structure and Rules– Enforce Property Rights– To Redistribute
Resources to Limit Inequalities
– To Limit Environmental Damage
• Many Ways to Solve Internal Conflicts
• Can Increase Resource of People
• SHORTCOMINGS
• Tends to Lack Transparency and Moves Toward Central Control
• Would Lead To:• Corruption• Arbitrary Use of Power• Tunnel Vision• Lack of Innovativeness• Moral Fragmentation
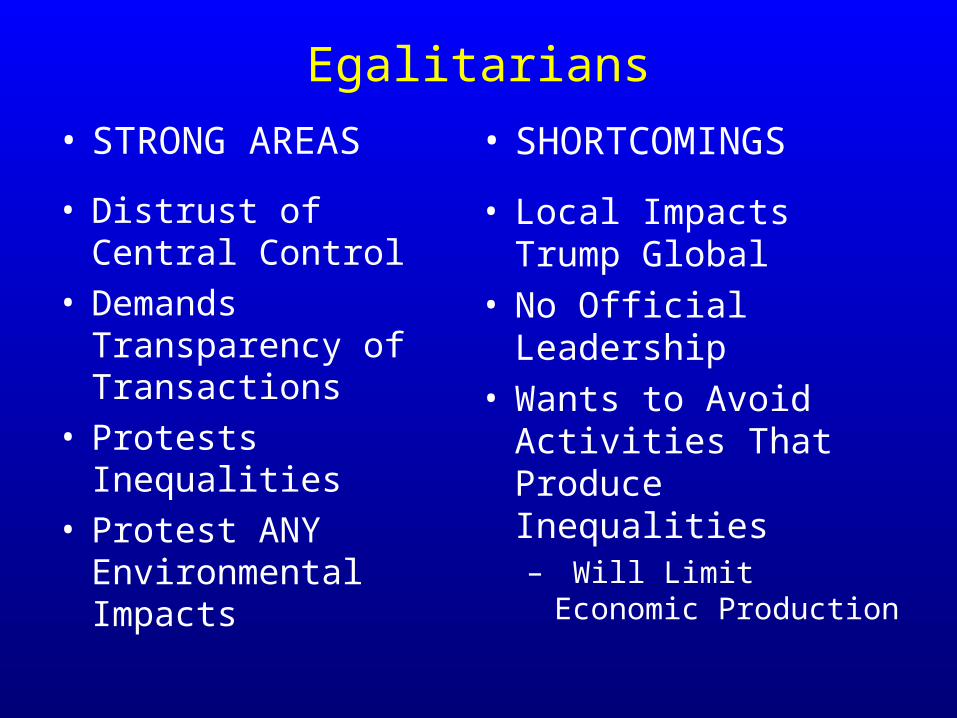
Egalitarians
• STRONG AREAS
• Distrust of Central Control
• Demands Transparency of Transactions
• Protests Inequalities• Protest ANY
Environmental Impacts
• SHORTCOMINGS
• Local Impacts Trump Global
• No Official Leadership• Wants to Avoid
Activities That Produce Inequalities– Will Limit Economic
Production
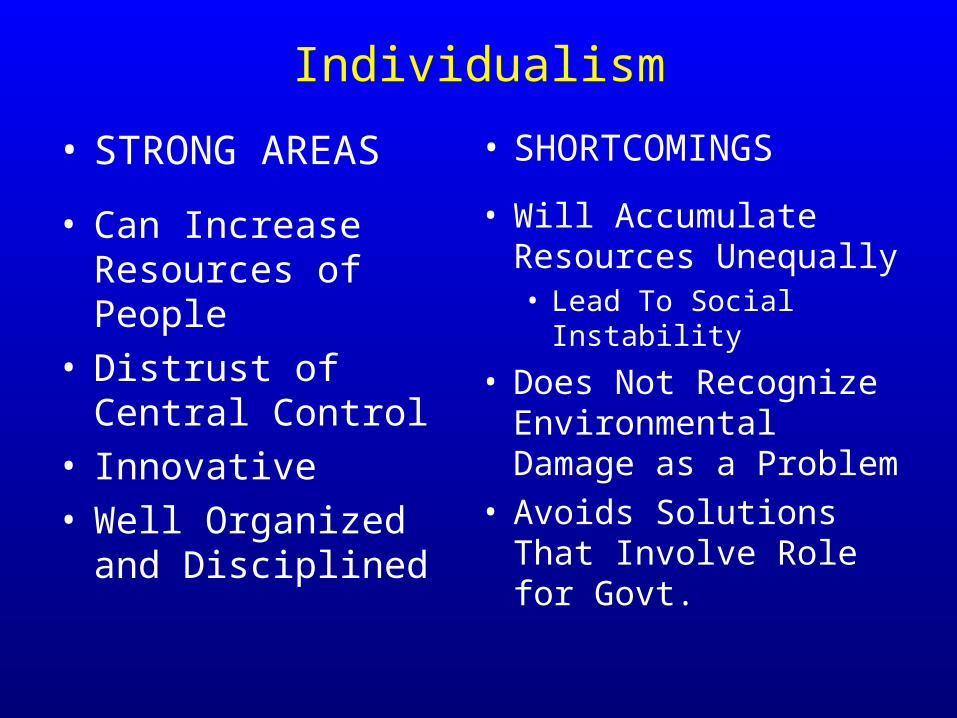
Individualism
• STRONG AREAS
• Can Increase Resources of People
• Distrust of Central Control
• Innovative• Well Organized and
Disciplined
• SHORTCOMINGS
• Will Accumulate Resources Unequally• Lead To Social
Instability
• Does Not Recognize Environmental Damage as a Problem
• Avoids Solutions That Involve Role for Govt.
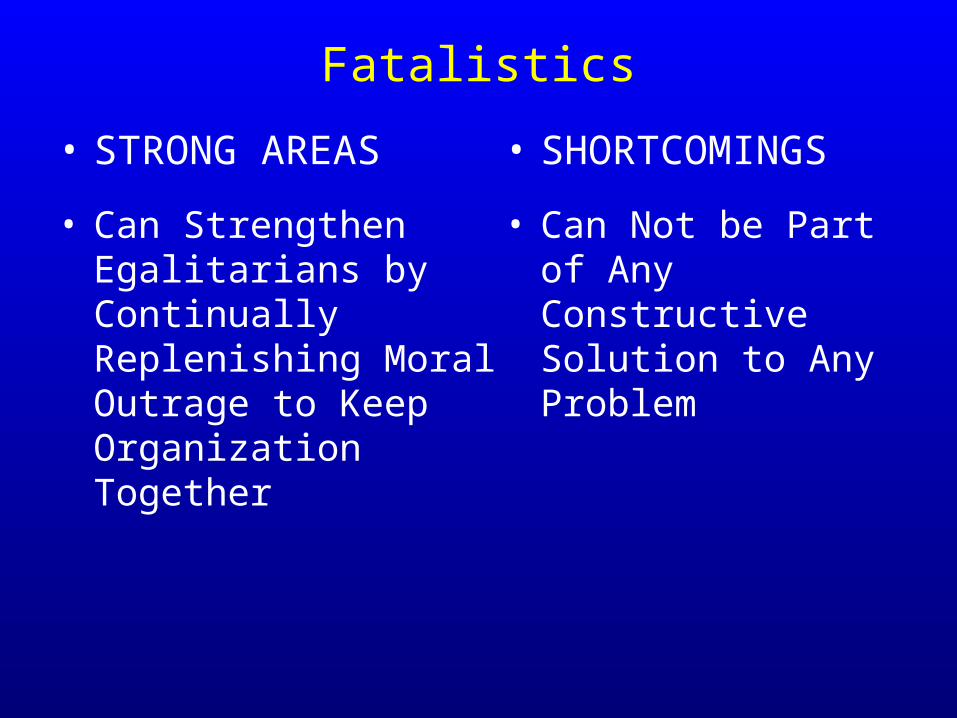
Fatalistics
• STRONG AREAS
• Can Strengthen Egalitarians by Continually Replenishing Moral Outrage to Keep Organization Together
• SHORTCOMINGS
• Can Not be Part of Any Constructive Solution to Any Problem

Energy Tribes Views of Climate Change
- Causes - Solutions
55

How EGALITARIANS See Climate Change
• Causes:– Profligate Consumption– Obsession with Economic Growth which Generates
Great Inequities– Environmentally Unsustainable Production
• Solutions:– Live in Harmony with Nature and Each Other– Solutions Must Be Proven to Have Innocuous Impacts
• Approaches with any local impacts need to be excluded from contributing to global solutions
– Industrialized Countries Need To Fundamentally Reform• Political Institutions • Unsustainable Lifestyles
56
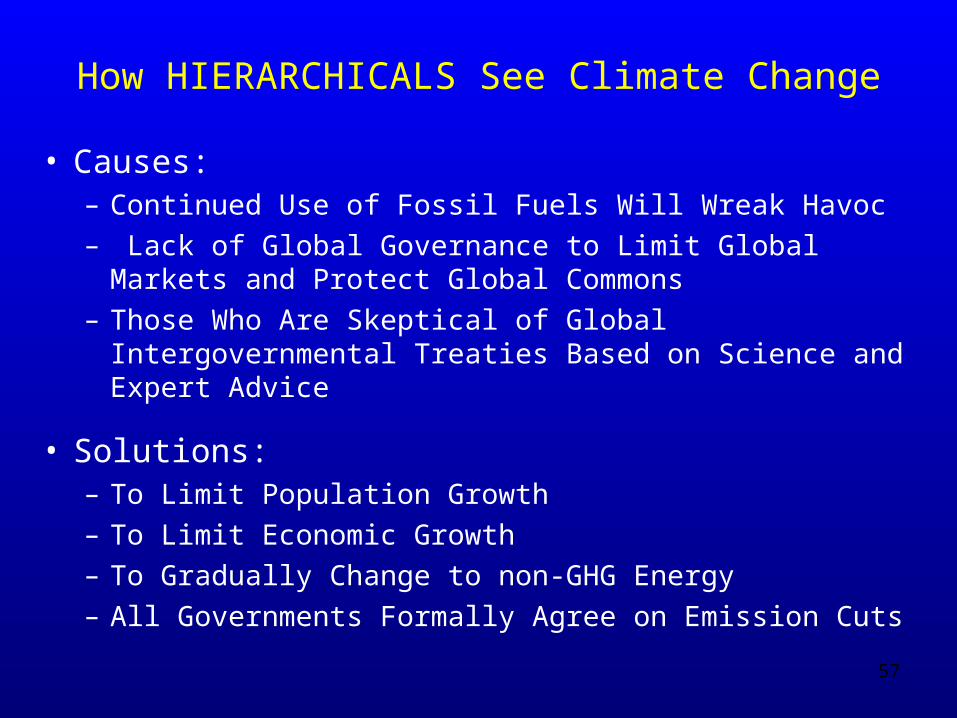
How HIERARCHICALS See Climate Change
• Causes:– Continued Use of Fossil Fuels Will Wreak Havoc– Lack of Global Governance to Limit Global Markets
and Protect Global Commons– Those Who Are Skeptical of Global Intergovernmental
Treaties Based on Science and Expert Advice
• Solutions:– To Limit Population Growth– To Limit Economic Growth– To Gradually Change to non-GHG Energy– All Governments Formally Agree on Emission Cuts
57
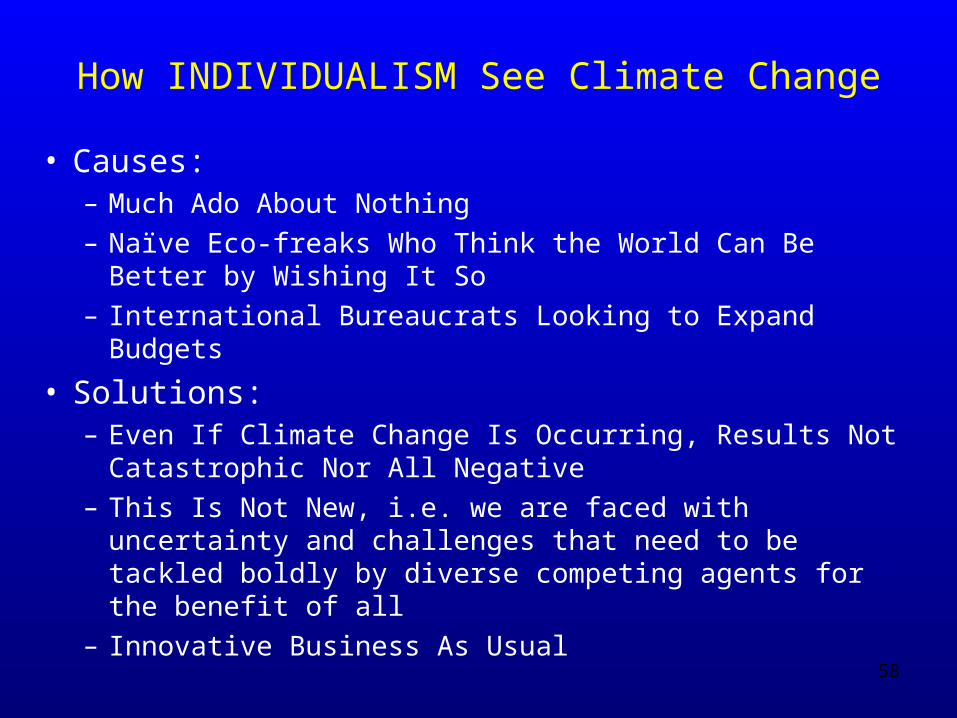
How INDIVIDUALISM See Climate Change
• Causes:– Much Ado About Nothing– Naïve Eco-freaks Who Think the World Can Be Better
by Wishing It So– International Bureaucrats Looking to Expand Budgets
• Solutions:– Even If Climate Change Is Occurring, Results Not
Catastrophic Nor All Negative– This Is Not New, i.e. we are faced with uncertainty and
challenges that need to be tackled boldly by diverse competing agents for the benefit of all
– Innovative Business As Usual58
Does Mother Nature Care About Tribal Perceptions ?
Reality of What Is Happening Physically on the Planet Is Indifferent to Human Views
59
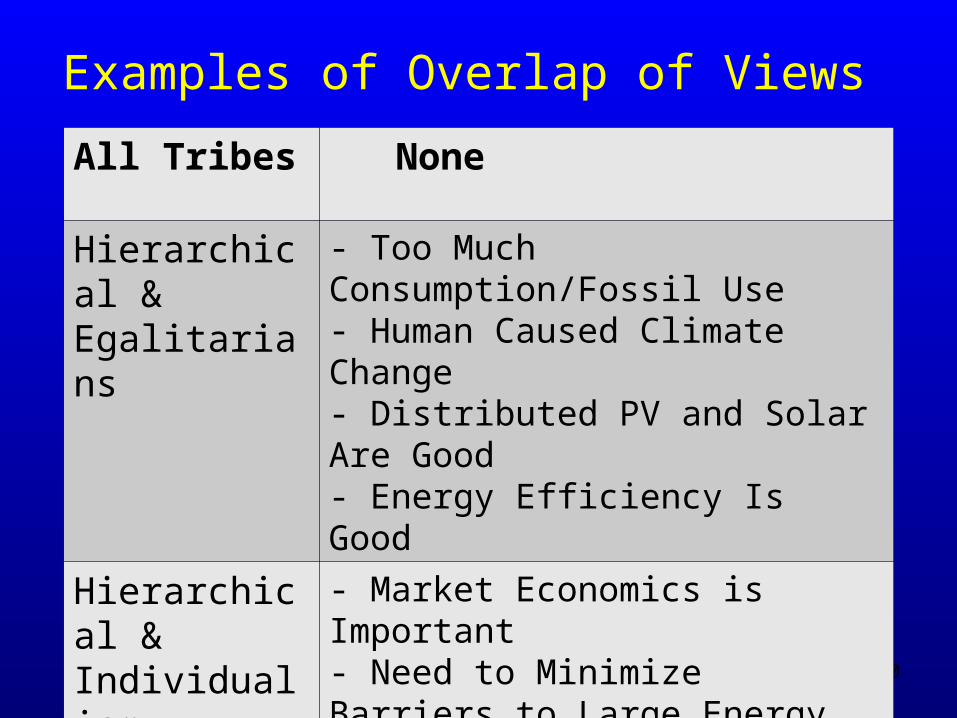
Examples of Overlap of Views
60
All Tribes None
Hierarchical & Egalitarians
- Too Much Consumption/Fossil Use- Human Caused Climate Change- Distributed PV and Solar Are Good- Energy Efficiency Is Good
Hierarchical & Individualism
- Market Economics is Important- Need to Minimize Barriers to Large Energy Projects
Egalitarians & Individualism
- Distrust Central Authority
Characteristics of Energy Tribes Theory
• Tribes arguing from different premises • Will never fully agree• Each distils certain elements of experience and
wisdom that are missed by the others• Each needs the others:
– each is incomplete in some important aspect
– each represents a part of what is needed
• Unfortunately, Each Tribe Thinks It Is Complete In It’s World View, – it is almost a moral issue to violate any of its precepts
61
To Use Energy Tribes for Policy Framework
• Policy Approach Should Be: – Reviewed Through the “Eyes” of Each Energy Tribe
– Reasonable to More Than One Particular Tribe
• Any Short Comings from Tribe’s View Needs to Be:– Acknowledged, and – Accommodated To Some Extent
• Overall Approach for Long Term Policy Stability:– All need to be respectful and inclusive, – KEEP EVERYONE in the (messy) PROCESS
• Be Pragmatic not Doctrinaire for the Long Haul62
Limitation to Energy Tribe Framework
• Little Evidence That Different Energy Tribes Are Willing to Be Less Doctrinaire and More Pragmatic
• U.S. Congress:– Increasingly Stringent in Imposing Personal View
on Entire Process
– Fails to See Need/Value of Other Views
– Fail to See Limits to Own Perceptions
• If Pragmatism Is Required for the Long Haul, There is Little Basis for Optimism
63
Any Areas of Specific Agreement ?
• When State/Federal Programs Stimulate RE and EE, an Area of Agreement Emerges:– On-site Distributed Solar, and – Energy Efficiency in Profit Making Situations– These Contribute to About 3/5s of the Solution
• Reasons for Support– Egalitarians See It As Having No Impacts– Individualism See It As a Business Opportunity– Hierarchicals See It As Part of Long Term Plan
64
Can Lack of Pragmatism Be Overcome for Other 2/5 of Solution ?
1. Can a Public Education Program Encourage Citizens to:– Vote for Pragmatic (moderate) Candidates ???
– Avoid Doctrinaire Candidates ???
2. Can a 3rd Political Party Be Formed ???
3.Can We Build on This Initial Area of Overlap, e.g. Distributed Solar, EE, Bio-fuels ?
4.Can a Proactive Program be Designed to Reduce Conflicts Over Remaining RE ?
65

Proposed Next Steps1. Continue Support for On-site Solar and EE
2. Use Public Participation Process (PPP) to Encourage Support for Rest of Renewables
- Focus on Areas of High Conflicts Such As:• Solar Power Plants • Wind Farms• Waste Biomass Plants• Biomass Liquids from Wastes and Low Productivity Land • Geothermal Plants• Transmission Lines
- Bring Stakeholders Together in Different Conflict Zones
- Use PPP Professional to Broker Dialogue and Develop Consensus
66
Public Participation Process, continued
• For Each Conflict Zone,– Find Areas To Be Placed Off Limits– Find Areas To Be Develop
• Develop Each Opportunity with Multiple Energy Tribe Buy-in
• Streamline Approval Process• Example Is Desert RE Conservation Plan in
CA67
CA Example: Desert RE Conservation Plan
• Major Elements– Established by Governor
– 35 Stakeholders plus federal and state agencies
– Covers Mojave and Colorado Deserts
– To provide binding, long-term endangered species permit assurances
– To facilitate renewable energy project review and approval processes
• Establishes Renewable Energy Action Team (REAT) To Oversee Implementation
68
Need to Extend This Process to All Renewables In Conflict in All
Geographic Areas
69
References
70