Embed Size (px)
Citation preview

Strategy for Doubling Income
of Farmers in India
Hkk-Ï-v-i-– jk"Vªh; oGf"k vkfFkZdh ,oe~ uhfr vuqlaèkku laLFkkuICAR – NATIONAL INSTITUTE OF AGRICULTURAL ECONOMICS AND POLICY RESEARCH
Raka Saxena
Naveen P Singh
Balaji S J
Usha R Ahuja
Deepika Joshi
Policy Paper 31

NIAP Publication Committee
Suresh PalP S BirthalNaveen P SinghShiv KumarRaka Saxena
National Institute of Agricultural Economics and Policy Research (NIAP) was established by the Indian Council of Agricultural Research (ICAR) to strengthen agricultural economics and policy research in the National Agricultural Research System comprising network of ICAR institutions and State Agricultural Universities. The mandate of the Institute is:
• Agricultural economics and policy research on markets, trade and institutions
• Growth and development models for sustainable agriculture
• Technology policy, evaluation and impact assessment
NIAP has emerged as a think tank in the area of agricultural policy and it has contributed to increased participation of ICAR in policy making. Besides ICAR, the Institute regularly provides research based input to NITI Aayog, Government Departments, States and other stakeholders for policy decisions in diverse areas related to agriculture.

Strategy for Doubling Income of Farmers in India
Policy Paper 31
Raka SaxenaNaveen P Singh
Balaji S JUsha R AhujaDeepika Joshi
ICAR – National Institute of Agricultural Economics and Policy ResearchNew Delhi - 110 012

ii
Saxena R., Naveen P. Singh, Balaji S.J., Usha R. Ahuja, and Deepika Joshi. (2017). Strategy for Doubling Income of Farmers in India. Policy Paper 31. National Institute of Agricultural Economics and Policy Research (NIAP), New Delhi.
PublishedNovember, 2017
Published byDr Suresh PalDirectorICAR – National Institute of Agricultural Economics and Policy ResearchNew Delhi - 110 012
© 2017, National Institute of Agricultural Economics and Policy Research
The views expressed in this policy paper are those of the authors and do not necessarily reflect the official policy or position of NIAP or ICAR.
Printed atNational Printers, B-56, Naraina Industrial Area, Phase II, New Delhi-110028; Phone No.: 011-42138030, 09811220790

iii
Foreword
Agriculture continues to be a source of livelihood for majority of Indian population and contributed about 14 per cent to the gross domestic product (GDP) of the country in 2014-15. The agricultural sector grew at a growth of around 3.7 per cent per year during 2004-05 to 2014-15 and the growth was quite impressive as compared to 2.3 per cent per annum during the previous decade (1995-96 to 2004-05). Despite this notable achievement, interest of farming community in agriculture is reported to be declining and consequently, agricultural workers, including cultivators and agricultural labourers, are moving away from agriculture. The shift is welcome provided these workers are productively and gainfully employed in other sectors. Studies have also reported that agrarian distress is increasing owing to low farm income and inequality in income between agriculture and non-agriculture sectors, which is a matter of concern.
A number of initiatives have been taken up by the present Government to improve the performance of Indian agriculture. For the first time, Hon’ble Prime Minister of India has set a target of “Doubling Farmers’ Income” by 2022. This goal has enthused and fueled motivation among the stakeholders and channelized the efforts in a holistic manner. All the major programs for agricultural development are revisited to attain this objective following a Seven-point Strategy.
Several initiatives are being taken up by different institutions to address this challenge and as a policy think tank of ICAR, NIAP has come out with a comprehensive strategy for doubling farmers’ income. This policy paper highlights various aspects including issues in estimation of farmers’ income and opportunities of growth for income augmentation in the next couple of years. It also outlines the role of different approaches, viz. use of technology, post-harvest management and value addition, marketing and prices, and non-farm income. I am sure that this paper will serve as a reference material for understanding the policies and programs and channelizing the efforts to realize the vision of doubling farmers’ income within stipulated time frame.
Trilochan MohapatraSecretary, DARE & DG, ICAR
Dated the 29th November, 2017 New Delhi

v
Preface
A pre-requisite of inclusive economic growth is faster agricultural development and higher income of people dependent on this sector. However, inequality between agriculture and non-agriculture sectors is a major concern. The Government has therefore shifted policy focus to farmers income and a target of doubling farmers income by 2022 is envisaged. This is a major challenge but if a strategy to harness growth potential of different sub-sectors of agriculture along with a matching price and trade policy, are worked out, this challenge could be a reality.
ICAR-NIAP has accorded high priority to this policy goal and studies are undertaken to evolve the strategy and implementation plan. To begin with, analysis of present level and sources of farm income are analysed for different agro-ecoregions. The present policy paper takes this work further and examines potential of different sectors, e.g. livestock, horticulture, food processing etc. Agricultural diversification and non-farm sector are also analysed in the context of their income potential in different regions. Technology is another important source of productivity growth and reducing cost of production and therefore has been discussed in detail. Since market and price risks are increasingly becoming critical for higher income and welfare of farmers, these issues have also been given due attention.
The low productivity regions comprising SAT and eastern India are more vulnerable to climatic variability and therefore income trends and vulnerability of these have been special focus of this paper. I am sure that the measures suggested in the concluding section of this paper shall be examined by the Department of Agriculture, Cooperation and Farmers Welfare and Indian Council of Agricultural Research, who have been active partners in this task. Policy makers, researchers and students will also find this work equally useful. Comments and suggestions from the readers will be useful to improve our work on this topic.
Suresh Pal Director


vii
Acknowledgments
This paper is an outcome of preliminary findings of the project on “Doubling Farmers’ Income in India by 2021-22: Estimating Farm Income and Preparation Strategic Framework” funded by the Department of Agriculture & Cooperation and Farmers’ Welfare (DAC&FW). We are extremely grateful to Dr Ashok Dalwai, CEO, National Rainfed Area Authority and Mr Dinesh Kumar, Joint Secretary, (Policy, now MIDH). Our sincere thanks are due to DAC&FW for providing funds for carrying out project activities.
Our special thanks are due to Prof Ramesh Chand, Member, NITI Aayog. This work started at ICAR-NIAP in 2015 itself under the guidance of Prof Ramesh Chand, which focused on the estimation and analysis of farm income in the country with more holistic approach. Afterwards also, the team has been enriched by his expertise and guidance to carry out this work.
We are grateful to Dr Suresh Pal, Director, NIAP and Dr P S Birthal, National Professor, ICAR for their valuable feedback and suggestions, which helped in improvements of the manuscript and sharpening the interpretations. We also acknowledge the valuable comments from referees on the manuscript. The research staff working under the project deserve special appreciation for their hard work and sincere efforts. Last but not the least, we are equally thankful to all those who helped us in bringing out this important policy paper.
Authors


ix
Contents
Foreword iii
Preface v
Acknowledgments vii
List of Tables, Figures and Boxes xi
Executive Summary xiii
1. Rationale for Doubling Farmers’ Income 1
2. Methodological Approach 3
3. Performance of Agriculture in India 7
3.1 Performance of various Sub-Sectors 7
3.2 Sectoral Growth across States 10
4. Farmers’ Income and its Estimation 15
4.1 Earlier Efforts on Farm Income Estimation 15
4.2 Current Status of Farm and Non-Farm Income 16
4.3 Disparities in Agriculture and Non-Agriculture Income 17
4.4 Farmers’ Income: Major Sources 18
4.5 Delineating the Sources of Off-Farm and Non-Farm Income 21
5. Role of Technology and Diversification 27
5.1 Total Factor Productivity 27
5.2 Addressing Yield Gaps 29
5.3 Role of Diversification 31
5.4 Impact of Irrigation on Crop Yield and Income 34
6. Food Processing and Post-Harvest Management 37
6.1 Food Processing in India 37
6.2 Reducing Post-Harvest Losses 41

7. Commodity Prices, Price Volatility and Farmers’ Gains 45
7.1 Price Behaviour of Agricultural Commodities 45
7.2 Price Realisation and Farm Size 46
7.3 Farmers’ Share in Consumer Price: Selected Cases 48
7.4 Participation of Paddy Farmers in Minimum Support Price 49 Scheme (MSPS): Inclusiveness across Farm Categories
7.5 Price Volatility across Different Crops 51
7.6 How Volatility Wipes Away the Gains from Farmers? 53
8. Contribution of Agricultural Research and Development 55
8.1 Varietal Development 55
8.2 Integrated Farming Solutions 56
8.3 Protected Cultivation 56
8.4 Resource Conservation Technologies 57
8.5 Livestock Technologies 59
8.6 Agricultural Education 60
8.7 Agricultural Extension 60
9 Conclusions and Strategies 63
9.1 Reducing Dependence on Agriculture 64
9.2 Value Chain Approach 66
9.3 Review of Current Programmes and Schemes 66
9.4 Infrastructure Development 67
9.5 Linkages among the Organisations and Stakeholders 68
9.6 Prioritisation of Areas for Investment 68
9.7 Centre-State Linkages 68
9.8 Making the Farmers’ Party to the Mission 68
9.9 Agricultural Credit and Other Reforms 69
10 References 71

xi
List of Tables, Figures and Boxes
Tables
Table 1: Performance of Indian agriculture: At a glance 8Table 2: Historical growth rates of crop categories, livestock and
fisheries in India, based on VoP at 2004-05 prices10
Table 3: Performance of agriculture, manufacturing and service sector across states (Rs. billion @ 2004-05 prices)
12
Table 4: Performance of various sub-sectors agriculture, manufacturing and service sector across states (Rs. lakhs @ 2004-05 prices)
13
Table 5: Real and current farm income and wage earnings of agricultural labour (Rs)
17
Table 6: Income earned by agricultural and non-agricultural workers (1983-84 to 2011-12)
18
Table 7: Average monthly income per agricultural household during 2012-13 (Rs)
20
Table 8: Off-farm and non-farm economic activities across states (July-December, 2012)
22
Table 9: Off-farm and non-farm economic activities across states (January-March, 2013)
24
Table 10: Growth in total factor productivity 28Table 11: Yield gap estimates, adoption of improved and hybrid
seeds along with area under irrigation for selected crops and states
30
Table 12: Crop productivity across various crop segments (Value of output per ha of cropped area in Rs @ 2004-05 prices)
32
Table 13: Evidences on diversification: Ratio of gross returns to cereals in high value crops
33
Table 14: Evidences of gains from irrigation on crop yield and farmers’ income (2013-14)
35
Table 15: Performance and contribution of food processing sector 38

Table 16: Number and share of persons employed in various food and manufacturing industries in india, 2011-12
42
Table 17: Prices received for major kharif crops, 2012 (Rs/kg) 46Table 18: Prices received for major rabi crops, 2013 (Rs/kg) 47Table 19: Marketing cost, marketing margins and farmers’ share for
major fruits and vegetables in Ahmedabad and Chennai markets
48
Table 20: Participation of paddy farmers in MSPS (% of paddy growers-cum-sellers)
51
Table 21: Extent of volatility across commodities 52
Figures
Figure 1: Growth rates in GDP across sub-sectors at 2004-05 prices 9Figure 2: Sources of farmers’ income across size classes 19Figure 3: Components of food processing (Value added in Rs crore
at 2011-12 prices)39
Figure 4: Growth in value added across various components of food processing in household and corporate sector (2011-15)
39
Figure 5: Share of workers employed in various food manufacturing industries (2011-12)
40
Figure 6: Trends in wholesale price indices of food commodities 45Figure 7: Assuming different growth in number of cultivators:
Impact on cultivators’ income (Rs per annum)66
Boxes
Box 1: Sources for doubling of farmers’ income 3Box 2: Extent of post-harvest losses across commodity groups 41Box 3: Farmers’ share for various commodities, years, channels
and states (As per cent of consumer price)50
Box 4: Losses to farmers from price volatility: Case of onion in Maharashtra
54

xiii
Executive Summary
The Prime Minister’s call to double farmers’ income by 2022 has brought renewed interest among stakeholders in the country, ranging from the agricultural research community, policy makers, state authorities, extension agencies, private players, and more importantly among farmers. Major approaches include re-orienting focus from intensification to diversification, from sustenance to commercialization, and turning the agricultural units to enterprises. Different central and state level programs have been floated to execute and monitor the outreach of technologies, soil health, farm credit and market to the farmers. Price supports are triggered for many of the crops and entrepreneurship is inculcated to the farming community.
The sources for doubling of farmers’ income (DFI) would ultimately vary at disaggregated geographies, demanding numerous approaches in different environments. The present study attempts to devise strategies to double farmers’ income, balancing both macro and meso environments. The study covers possible contributions of different sources at both national level, and at state level. The study also bypasses the other major hurdle: obtaining income estimates of the farmers, and generating methodology of estimation.
It highlights the role of total factor productivity (TFP) growth that emerges from agricultural R&D, extension services, new knowledge and practices in achieving the goal. It brings to our focus that technology dissemination than generation still provides us a promising scope to increase income at farm level. The estimates portray that yield gap vary from one-fourth to one-third within the paddy farms. Jowar farms in Maharashtra and Karnataka, and bajra farms in Rajasthan still exhibit yield gap as high as 50 per cent. The estimates for gram in Madhya Pradesh stands more than 30 per cent, and by 45 per cent in Rajasthan and Maharashtra. Cash crops, which are input intensive, also exhibit yield of around 30-50 per cent. These scenarios offer us to increase output, thereby income, by using the existing technologies itself. Tapping this potential depends on expanding irrigation, and delivering better quality seeds. The yield differences in irrigated fields produce around 8 quintals/ha of higher paddy, 2-5 quintals/ha of higher gram, 5-15 quintal/ha of higher maize and 3 quintal/ha of higher cotton. Even when prices turn poor, higher output

xiv
from the same land could offer increased income to the farmers. The issue can be addressed by expanding irrigation, use of improved seeds in sowing and better credit access.
The strategy of irrigation expansion holds true for maize as well. Area covered under irrigation in major states like Andhra Pradesh and Karnataka are 50 per cent and 36 per cent respectively. The other major state, Bihar, also suffers with less use of improved seeds. Only two-third of the farmers use hybrids and improved seeds use, and the irrigation coverage is just 65 per cent. Being an input responsive crop, yield levels can be appreciably raised by better seed delivery and irrigation. Irrigated cotton farms produce higher yield than the un-irrigated farms. The cotton yield margins in irrigated farms are 11 qtl/ha and 6 qtl/ha in Gujarat and Maharashtra, respectively. If these yield gaps are addressed through proper scientific and management interventions; there can be significant gain in output. Research and development organizations need to make concerted efforts to bridge such gaps.
In rice, there exists a huge potential to expand irrigation in West Bengal as just half of the rice area is irrigated, and yield differentials are significant. The irrigated fields, on an average, record 8 quintals/ha higher yield than the unirrigated fields. Odisha depicts considerable scope for improvement in yield levels under the unirrigated environment. All the major wheat producing states grow almost the entire crop under irrigation, hence, offer limited scope to expand irrigation. While Madhya Pradesh has 91 per cent area under irrigation; Uttar Pradesh, Punjab, Haryana and Rajasthan have more than 98 per cent area under irrigation. But the yield differentials are high, revealing scope to achieve higher production. The average yield levels in 2013-14 were around 50 quintals/ha in Punjab and Haryana; 30 quintals/ha in Uttar Pradesh and Rajasthan and around 24 quintals/ha and in Madhya Pradesh. Hence, an effort to achieve higher wheat production depends on factors other than irrigation. Considering the potential of micro-irrigation in saving of water and nutrients along with productivity enhancement, a lot of emphasis is being given to micro-irrigation in the country. Micro-irrigation can bring substantial increase in productivity and also result in water saving.
The non-traditional areas for cultivation can provide a remunerative solution for further enhancing the farmers’ income. These may include shifting orientation from cereal dominance to high value crops (HVC) like horticulture and livestock. Even, as pulses are becoming a high value commodity, shift in favour of pulses can meet the nutritional as well as income security. Jammu & Kashmir and Himachal Pradesh, due to their

xv
agro-ecological typologies, are highly suitable for cultivation of horticultural crops and bring highly substantial gains in cultivation of HVC. A marginal and small farmer in Himachal Pradesh is able to earn 23 times returns in HVC as compared to cereals. Cultivation of vegetables is profitable (in terms of gross returns) for small and marginal farmers across majority of the states except Haryana and Uttarakhand. The diversification strategy requires strong emphasis on regional crop planning and preparation of optimum crop plans for identification of competitive crops which ensure reasonable income, nutrition along with sustainability to particular agro-climatic conditions.
The other major strategy to follow is to encourage processing by the household sector. Against the corporate sector, which contributes by around 7 per cent, household sector contributes by around 13 per cent of the output of food processing sector. Fruits and vegetables, and livestock processing especially provide high scope. This would turn to reality under optimal skill delivery to the farm households. Special schemes could be introduced that cater processing by the farmers and simultaneously link the processed food to the urban market. Equally, encouraging Farmer Producer Organizations and other private sector to invest more in processing would complement the effort.
The market trends display relative price stability to the cereal sector against high volatility for the vegetables and fruits. For example, the wholesale price index (WPI) for onion for the year 2011 was 619, and has peaked to 783 during 2015. Further, cob-web phenomenon as well turns proved through this study. Market prices remain high, but as a contrary, farmers share remain low for these high value crops. While paddy, wheat and gram growers fetch by around 60-80 percent, fruits and vegetable growers report around 25-40 percent only. This demands attention of the researchers and policy makers while proposing farmers to diversify. It demands for improved market efficiency and price policies more in favour of high value crops, and creating localized market infrastructure that could store fruits and vegetables to reap market gains. Marketing infrastructure plays crucial role in increasing the efficiency of the agricultural transactions. Such efficiency and gains, if aggregated on a larger scale, may provide fruitful gains to the farmers.
Further, the study emphasized on reducing dependence on agriculture, rather focuses on increased emphasis on agri-business. This requires agriculture units not to remain as isolated cultivating units rather transformed into agri-enterprises performing more functions at the same time rather than simply the cultivation function. Encouraging processing
xvi
and building value chains would help create non-farm jobs in rural areas. The time has come when things are to be dealt in totality not in isolation. Neither the productivity centric nor the marketing and price centric approach are going to work in isolation. Every commodity has to be dealt in a holistic value chain approach where suitable interventions are required at all the critical stages.
It would be prerequisite that the implementation of DFI Plan should be with a clear visionary framework and strategic plans need to be formulated for all sub-sectors. This requires linkages among the high-powered think tanks and implementing bodies. Role of Indian Council of Agricultural Research would be extremely important to initiate and launch various technological breakthroughs for required transformation. Simultaneously, Centre-State linkages would be extremely important in mainstreaming and channelizing the policies and investment to the targeted goals for development. A crucial role would be played by the state and state development agencies in formulating state plans and strategic framework for fulfilling the objective.
1
Rationale for Doubling Farmers’ Income
The agrarian distress in the farming community has increased overtime due to a number of reasons. Chand (2016) attributed this distress to the widening disparities between agricultural and non-agricultural sectors, resulting in burgeoning gap between the incomes generated per worker from the two sectors. Further, the National Crime Records Bureau data reveal that the number of farmers’ suicides increased from 10,700 in 1995 to 18,200 in 2005; an increase of 70 per cent in 11 years. In an another study, Chand et al. (2015) reported that the growth rate in per farmer income during this period was mere 1.96 per cent the lowest during 1983-84 to 2011-12. The growth rate in per cultivator income accelerated to 7.29 per cent after 2004 and the number of farmers’ suicides dropped to 13,700 by 2012. A clear indication may be drawn from the fact that the low growth rate in farm income is concomitant with an increase in farmers’ distress. Any increase in farmers’ income will reduce the agrarian distress and vice-versa. Further, price factors are also becoming increasingly important in ensuring the welfare of farmers and farm labourers.
The agricultural sector received continuous attention of the policy makers and stakeholders. A number of initiative were undertaken to improve the performance of the sector. However, for the first time in our history, Hon’ble Prime Minister of India exhorted to “Double the Farmers’ Income” by 2022-23. This enthused and fuelled lot of energy and motivation among the stakeholders and channelized the efforts in unified direction. Doubling of farmers’ income (DFI) goal was also coupled with many new and well-thought out schemes on insurance for mitigating losses (Pradhan Mantri Fasal Bima Yojana), ensuring effective marketing through unified national agricultural marketing platform (e-National Agricultural Market), and improving soil health via promoting organic farming through Paramparagat Krishi Vikas Yojana for maximising the gains from farming.
To ensure that DFI mission is moving in the desired direction within stipulated time frame i.e. 2022-23, it is important that accurate information on certain indicators which reflect the farmers’ welfare is generated and made available to monitor the situation. The most appropriate measure of farmers’ well-being is the level of income. It is unfortunate to note that farmers’ income series are not prepared and published in the country by
1Chapter

2
any official agency on a regular basis. A few attempts have been made by some scholars to prepare estimates of farm income in the past and these are based either on a sample of farmers or a particular segment of agriculture (Narayanamoorthy, 2006; Sen and Bhatia, 2004). The researchers have come out with various methodologies which provide estimates of farmers’ income; however, the estimates are available only for different time periods. The studies have largely referred to the growth in output, i.e. value of output (VoP), gross domestic product (GDP), gross state domestic product (GSDP), output and input price behaviour along with price spread, rise in wages, indebtedness, etc. to indicate the state of Indian framing. Thus, authentic estimates of farmers’ income across all states are warranted for affecting a strategy which can translate the vision of DFI into reality.
The pathway for doubling of farmers’ income requires consideration of different dimensions related to enhancement in agricultural production along with providing efficient markets and improved marketing facilities. As area expansion is limited, production enhancement can be done through bridging yield gaps in crops through adoption of efficient and effective cultivation practices, crop diversification with focus on high value crops, further improvements in the total factor productivity, proper irrigation management along with other factors leading to productivity improvements (GoI, 2007; Evenson et al., 1999; Chand et al., 2011; Birthal et al., 2007). The enhanced output may support the farmers in getting better returns. However, the efficient marketing network would be the key factor for monetization of the output and realization of better gains. The markets would need to be accompanied by market infrastructure, market accessibility and market related policies which finally reflect in enhanced producer share along with the gains and losses from burgeoning agricultural price volatility especially in case of vegetables (Saxena and Chand, 2017). The primary factor triggering abnormal hike in prices is production shock generally caused by weather related events (Government of India, 2015). Studies show that this situation is aggravated by further exploitation by a section of traders and middlemen through stocking and market manipulations (GoI, 2015). A probe would also be required that how the post-harvest management would save the losses in crops and livestock sectors. The losses in India’s agricultural produce is estimated to be Rs. 92,651 crore, approximately $13 billion (MoFPI, 2016), indicating that there is need for better infrastructure and proper management to prevent these losses. Household level and small scale value addition and processing may prove to be success factors in this regard. Thus, it is also important that these sources of growth in farmers’ income are examined to ensure the realization of DFI mission. This paper provides dissection of important sources of growth and the desired approach for doubling of farmers’ income in the country.

3
2Chapter
Methodological Approach
For doubling of farmers’ income, it is essential that different income sources are identified and their potential contribution is quantified. This section provides the estimated contributions of various critical factors, which have potential to contribute to the desired growth. Box 1 lists various sources of growth broadly under four categories viz. technology and cropping system related, post-harvest management and value addition; marketing and price related and non-farm income sources.
Box 1 : Sources for doubling of farmers’ income
1. Technology and Cropping System Related
2. Post Harvest Management and Value Addition
3. Marketing and Price Related
4. Enhancing Non-Farm Income
• Increase in total factor productivity
• Reducing yield gaps
• Through diversification
• Gains from irrigation
• Reducing post-harvest losses
• Encouraging value addition and processing
• Improving price realization to the farmers
• Reducing price volatility
• Creating non-farm opportunities
• Reducing dependence on agriculture

4
The study is based on secondary data and information from different official sources and publications. GDP data from 1980-81 to 2014-15 at 2004-05 prices were compiled from the National Accounts Statistics to compute the growth rates in GDP across sub-sectors. To estimate yield and income differences in irrigated and unirrigated plots, plot level data provided for the year 2013-14 by the Ministry of Agriculture and Farmers’ Welfare (MoAFW) were used. As the data doesn’t directly provide the status of irrigation for a given plot, it was assumed that when a given plot received at least one irrigation, the crop was treated as irrigated and the rest were treated as unirrigated (rainfed). The t-statistics was used to study the significance in yield and income differences among irrigated and unirrigated plots. Further, extent of use of local, improved and hybrid seeds in different crops across states was calculated using the same data source pertaining to the years 2011-12 to 2013-14. Descripitive analysis was used in arriving the shares of improved and hybrid seeds use in total seed use. Yield gap estimates were obtained using plot level data pertaining to the years 2011-12 to 2013-14. The yield gaps were calculated using the formula
Yg= {1– Ya }* 100
Yr
where, Yg , Ya and Yr are yield gap, actual mean yield and reference yield respectively. Actual mean yield are averages of yield at farmers’ plots, and 90th percentile of yield distribution was used as reference yield for a given crop at a given state during the reference period.
To examine the gains from diversification, unit record data of Situation Assessment Survey of agricultural households for 2012-13 (NSSO, 2014) was used. The data provides the total disposal of different commodities along with the price realized. The gross returns for cereals, fruits, vegetables and flowers were obtained by aggregating the individual gross returns for various commodities in that group. To examine the relative profitability of horticultural commodity groups (fruits, vegetable and flowers) over cereals, the ratio of gross returns in horticultural commodity crops (high-value crops) was obtained over the cereals. A ratio of more than one signifies higher relative profitability of former to the later indicating greater potential for high value crops.
The price volatility was measured on the basis of monthly wholesale price index (WPI) at 2004-05 base for major crops compiled from WPI database of the Office of the Economic Advisor. The instability in prices of major agricultural commodities was measured in relative terms by the Cuddy-Della Valle index computed for WPI of selected agricultural commodities for two phases i.e. 2005-2010 and 2011-2016. This has been

5
used in recent years by a number of researchers as a measure of variability in time series data. The formula suggested by Cuddy-Della is used to compute the index of instability.
Cuddy-Della Vella Instability Index (CV*) = Coefficient of variation x (1- R2) 0.5
The index value of Cuddy Della Vella between 0 to 15 characterizes low instability; whereas the values between 15 to 30 and above 30 imply medium and high instability in the data, respectively.
The compound annual growth rates in gross value added of household and corporate sector in food processing were computed to analyse the trends in processing for various food categories.


7
3Chapter
Performance of Agriculture in India
Agriculture continues to be the source of livelihood for the majority of Indian population; the sector contributed about 13 per cent to the gross domestic product (GDP) of the country in 2014-15. The agricultural sector grew at the growth of around 3.7 per cent per year during 2004-05 to 2014-15 and the growth was quite impressive as compared to 2.3 per cent per annum during the previous decade (1995-96 to 2004-05). Though the industry and service sectors grew at a much higher rate during last two decades (during 1995-96 to 2004-05) (industry at 4.9 per cent and service at 7.9 per cent per annum) and 2004-05 to 2014-15 (industry at 8.4 per cent and service at 9.0 per cent per annum); agricultural sector was able to improve its rate of growth leading to reduction in the relative growth gap (Table 1). The National Sample Survey Office (NSSO) survey on employment and unemployment also highlights the intriguing fact that the number of agricultural labourers declined from 9.27 crore in 2004-05 to 7.82 crores in 2011-12 indicating that every year around 22 lakh agricultural labourers have left the sector. This led to radical increase in the wage earnings by 16.14 per cent per year during 2004-05 to 2011-12. At the same time, the number of cultivators declined at the rate of 1.80 per cent per year during 2004-05 to 2011-12. Despite these achievements, interest of farming community in agriculture is reported to be declining and consequently, agricultural workers including both the cultivators and agricultural labourers are leaving the industry (NSSO Employment and Unemployment Surveys, 2004-05 and 2011-12). This reported shift is good provided the workers, who left the sector, are productively and gainfully employed in alternate sectors/industries.
3.1 Performance of various Sub-SectorsExamination of the existing growth scenario becomes an essential
condition for projecting the growth across various sub-sectors of agriculture. For this, the data of GDP along with value of production (VoP) of various sub-sectors and crop categories at 2004-05 prices were used. Chand and Parappurathu (2012) estimated the moving decennial growth rates by fitting a semi-log trend to the smoothened data. The moving decennial growth

8
rates were also computed in this study to examine the performance of various sub-sectors. The decennial growth rates indicate remarkable growth 2004-05 onwards for all the sub-sectors, i.e. crop, livestock and fisheries.
During the recent decade (2004-05 to 2014-15), crop, livestock and fisheries registered growth of 2.93, 6.11 and 5.13 per cent per annum, respectively. The pattern indicates that overall growth in agriculture is principally determined by the crop sector and the two growth rate series move in a parallel fashion. The same is also confirmed from the year-on-year fluctuations in different sub-sectors (Figure 1). Livestock sector is growing at an appreciable and sustainable rate and is ahead among all sub-sectors. It is remarkable to mention that livestock sector never attained
Table 1 : Performance of Indian agriculture: At a glance
Particular 1995-96 2004-05 2014-15 Growth during1995-96 /
2004-052004-05 /
2014-15GDP (Rs crore) @ 2004-05 pricesAgriculture & allied Sector 447127 565427 814303 2.3 3.7Agriculture (Crops and livestock) 376243 476634 693727 2.2 3.9Industry 494262 829783 1649739 4.9 8.4Services 794041 1576255 3675479 7.9 9.0Overall 1737741 2971464 6139520 6.1 8.4Share of (%)Agriculture & Allied Sector 25.7 19.0 13.3 - -Agriculture 21.7 16.0 11.3 - -Industry 28.4 27.9 26.9 - -Services 45.7 53.1 59.9 - -Agricultural Trade (Rs Billion)Total exports 1064 3753 18916 15.0 19.7Agriculture exports 204 416 2395 8.2 21.5Total imports 1226 5011 27339 16.9 20.7Agriculture imports 59 228 1154 16.2 19.7Price Indices (@ 2004-05 base)CPIAL - 100 261 - 11.2WPI - 100 225 - 9.4Employment (Numbers in crore)Cultivators 14.39* 16.61 14.62** 1.3 -1.8Agricultural Labourers 9.56* 9.27 7.82** -0.3 -2.4
Source: Computed by authors.
Note: *Agricultural workers data pertains to 50th round of NSSO (1993-94) and ** agricultural workers data pertains to 68th round of NSSO (2011-12) on employment and unemployment.

9
a negative growth in any of the years during the span of last 34 years; the lowest growth rate attained in the sector was just one per cent in the year 2003-04. Thus, the livestock sector can be relied upon for risk mitigation to the farmers in case of even worst outcomes from other sub-sectors. The studies have reported that livestock is the source of sustained income and generates income more frequently than the crop sector (Hegde, 2006; 12th Five year plan - 2012-17).
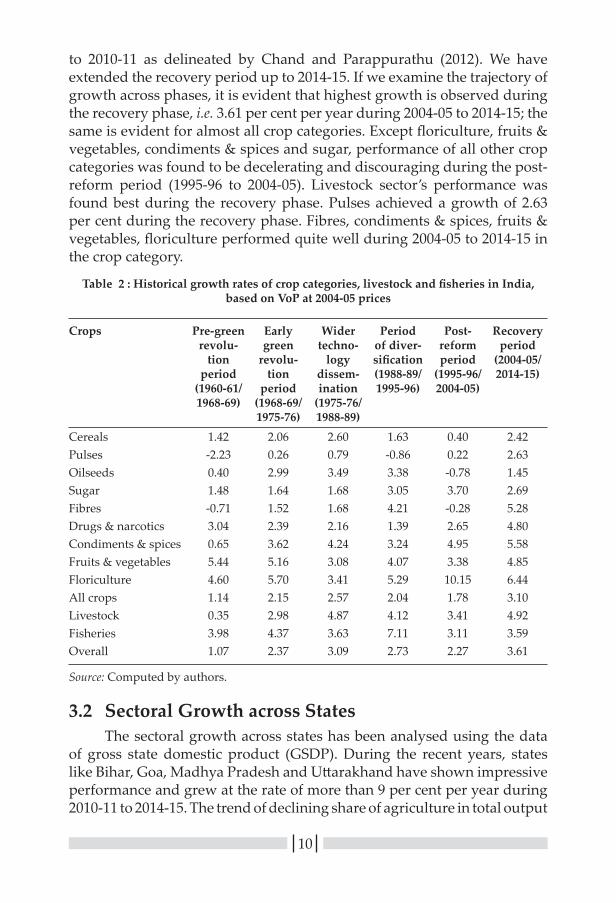
Table 2 provides the existing growth rates for different crop categories based on VoP at 2004-05 prices. The historical growth rates have been provided for six phases as Pre-green revolution period (PGR)–1960-61 to 1968-69, Early green revolution period (EGR)–1968-69 to 1975-76, Period of wider technology dissemination (WTD)–1975-76 to 1988-89, Period of diversification (DIV)–1988-89 to 1995-96, Post-reform period (PR)–1995-96 to 2004-05 and Period of recovery (REC)–2004-05
Figure 1 : Growth rates in GDP across sub-sectors at 2004-05 prices
Source: National Accounts Statistics, various years.
10
to 2010-11 as delineated by Chand and Parappurathu (2012). We have extended the recovery period up to 2014-15. If we examine the trajectory of growth across phases, it is evident that highest growth is observed during the recovery phase, i.e. 3.61 per cent per year during 2004-05 to 2014-15; the same is evident for almost all crop categories. Except floriculture, fruits & vegetables, condiments & spices and sugar, performance of all other crop categories was found to be decelerating and discouraging during the post-reform period (1995-96 to 2004-05). Livestock sector’s performance was found best during the recovery phase. Pulses achieved a growth of 2.63 per cent during the recovery phase. Fibres, condiments & spices, fruits & vegetables, floriculture performed quite well during 2004-05 to 2014-15 in the crop category.
Table 2 : Historical growth rates of crop categories, livestock and fisheries in India, based on VoP at 2004-05 prices
Crops Pre-green revolu-
tion period
(1960-61/ 1968-69)
Early green
revolu-tion
period (1968-69/ 1975-76)
Wider techno-
logy dissem-ination
(1975-76/ 1988-89)
Period of diver-sification (1988-89/ 1995-96)
Post- reform period
(1995-96/ 2004-05)
Recovery period
(2004-05/ 2014-15)
Cereals 1.42 2.06 2.60 1.63 0.40 2.42Pulses -2.23 0.26 0.79 -0.86 0.22 2.63Oilseeds 0.40 2.99 3.49 3.38 -0.78 1.45Sugar 1.48 1.64 1.68 3.05 3.70 2.69Fibres -0.71 1.52 1.68 4.21 -0.28 5.28Drugs & narcotics 3.04 2.39 2.16 1.39 2.65 4.80Condiments & spices 0.65 3.62 4.24 3.24 4.95 5.58Fruits & vegetables 5.44 5.16 3.08 4.07 3.38 4.85Floriculture 4.60 5.70 3.41 5.29 10.15 6.44All crops 1.14 2.15 2.57 2.04 1.78 3.10Livestock 0.35 2.98 4.87 4.12 3.41 4.92Fisheries 3.98 4.37 3.63 7.11 3.11 3.59Overall 1.07 2.37 3.09 2.73 2.27 3.61
Source: Computed by authors.
3.2 Sectoral Growth across StatesThe sectoral growth across states has been analysed using the data
of gross state domestic product (GSDP). During the recent years, states like Bihar, Goa, Madhya Pradesh and Uttarakhand have shown impressive performance and grew at the rate of more than 9 per cent per year during 2010-11 to 2014-15. The trend of declining share of agriculture in total output

11
has continued till recent times (Table 3). In Tamil Nadu & Maharashtra, agriculture output share in total output during TE 2014-15 is just 7 per cent and in Kerala and Uttarakhand, it is around 10 per cent. Highest share of agriculture doesn’t exceed one-third of state output. To the highest extent, agriculture in Madhya Pradesh contributes 28 per cent of its total output. In Punjab, Uttar Pradesh and Andhra Pradesh, they range between 20 per cent and 25 per cent. The pattern is not just being recorded for the said year, but has continued since past. Between TE 2006-07 and TE 2014-15, output share has declined in Bihar and Punjab by 10 per cent, from 30 per cent to 20 per cent, and from 31 per cent to 21 per cent respectively. The decline has been 9 per cent in Uttarakhand, and 7 per cent in Jammu & Kashmir, Kerala, Haryana and West Bengal.
Not just agriculture reflects declining contribution but the manufacturing sector as well. Despite higher share than agriculture, in many of the states, share of manufacturing has also declined during this period. For example, share of manufacturing has declined from 48 per cent to 37 per cent in Jharkhand, 33 per cent to 28 per cent in Haryana and 31 per cent to 27 per cent in Karnataka. Service sector has captured the momentum and compensated the decline in output in agriculture and manufacturing. During the TE 2014-15, Kerala has produced 70 per cent its output through service sector, followed by West Bengal (65 per cent), Tamil Nadu and Maharashtra (64 per cent both). To ascertain, none of the states have recorded a negative change in output share. During the period TE 2006-07 to TE 2014-15, output share has grown by more than 10 per cent in Haryana, Jammu & Kashmir and Jharkhand, and by more than 9 per cent in Uttar Pradesh, Kerala and West Bengal. Such trends and patterns clearly indicate transformation across states and increasing dependence on non-farm sector for growth.
Output composition within agriculture sector showed mixed trends. Seven out of twenty major states have reduced their output in crop and livestock sector, nine have increased. Output shares in forest sector in most of the states have not seen major changes. Fisheries sector has gradually picked up, albeit very marginally. Andhra Pradesh and Kerala have reduced their output share from crop and livestock sector. Andhra Pradesh has marginally shifted towards fisheries sector (Table 4). While output share in crop and livestock sector has declined by 7 per cent TE 2006-07 to TE 2014-15, output in fisheries sector has increased by 7 per cent. Kerala, rather, has produced more from forestry than in fisheries. A decline of 4 per cent output share in agriculture and livestock has been compensated by a 3 per cent increase in fisheries. On the other hand, Jharkhand, Madhya Pradesh, Chhattisgarh and Bihar have expanded their output primarily through agriculture and livestock sector.

12
Tabl
e 3
: Per
form
ance
of a
gric
ultu
re, m
anuf
actu
ring
and
ser
vice
sec
tor a
cros
s st
ates
(Rs.
bill
ion
@ 2
004-
05 p
rice
s)
Stat
esA
gric
ultu
ral S
ecto
rM
anuf
actu
ring
Sec
tor
Serv
ice
Sect
orO
vera
llG
SDP
Gro
wth
in G
SDP
GSD
PG
row
th in
GSD
PG
SDP
Gro
wth
in G
SDP
GSD
PG
row
th in
GSD
PTE
20
06/0
7TE
20
14/1
5Pe
riod
I
Peri
od
IITE
20
06/0
7TE
20
14/1
5Pe
riod
I
Peri
od
IITE
20
06/0
7TE
20
14/1
5Pe
riod
I
Peri
od
IITE
20
06/0
7TE
20
14/1
5Pe
riod
I
Peri
od
II
Odi
sha
187.
923
3.7
3.67
0.32
289.
346
4.5
9.02
3.16
364.
870
5.4
10.4
85.
9984
1.9
1403
.58.
544.
07Ja
mm
u &
Kas
hmir
77.0
86.6
1.95
-1.6
982
.111
3.1
4.23
5.38
130.
224
8.2
8.88
6.41
289.
344
7.9
5.84
4.46
Punj
ab32
1.2
367.
91.
981.
3827
6.7
485.
011
.55
2.13
443.
588
7.0
8.47
9.43
1041
.317
39.8
7.45
5.48
Utta
r Pra
desh
794.
210
29.1
2.67
3.69
679.
510
04.0
7.64
1.68
1322
.626
31.9
9.50
7.91
2796
.346
64.9
7.22
5.53
Ker
ala
210.
820
1.1
-1.4
61.
5929
8.3
456.
46.
802.
5379
8.4
1537
.810
.44
7.73
1307
.421
95.3
7.93
6.01
And
hra
Prad
esh
402.
459
5.9
4.71
6.43
323.
249
8.8
7.88
2.45
721.
413
76.9
9.28
7.28
1447
.124
71.6
7.73
6.05
Kar
nata
ka32
9.3
477.
85.
972.
9856
4.2
863.
77.
962.
6495
2.2
1877
.19.
448.
7818
45.6
3218
.58.
386.
11Ta
mil
Nad
u27
7.3
347.
74.
041.
4679
3.6
1397
.69.
363.
1114
49.4
3068
.211
.28
8.18
2520
.348
13.4
9.96
6.12
Raja
stha
n33
6.2
511.
15.
541.
7743
7.7
813.
38.
406.
3461
3.5
1260
.010
.17
8.09
1387
.425
84.4
8.55
6.17
Chh
attis
garh
111.
918
3.2
5.42
5.19
229.
140
3.5
9.15
6.15
178.
536
9.5
10.6
87.
3751
9.6
956.
18.
946.
43H
imac
hal P
rade
sh63
.782
.81.
886.
5310
2.2
177.
610
.23
3.63
96.3
198.
310
.12
9.35
262.
245
8.7
8.34
6.52
Mah
aras
htra
499.
865
7.1
4.78
0.07
1462
.626
00.3
9.62
4.92
2774
.556
76.7
10.3
98.
1647
36.9
8934
.29.
616.
55W
est B
enga
l51
0.4
608.
12.
392.
7247
5.4
709.
55.
275.
5212
45.9
2408
.99.
058.
1622
31.7
3726
.56.
836.
70H
arya
na22
8.8
301.
44.
012.
2534
3.5
555.
27.
324.
5648
3.5
1148
.213
.07
9.43
1055
.820
04.8
9.42
6.89
Guj
arat
376.
553
4.0
4.35
5.47
922.
116
98.2
10.9
64.
8110
03.2
2111
.810
.93
9.44
2301
.843
43.9
9.97
7.08
Jhar
khan
d95
.218
2.6
6.48
11.0
528
0.5
408.
73.
403.
6421
3.7
504.
012
.23
9.72
589.
410
95.4
7.25
7.49
Utta
rakh
and
54.8
71.2
2.23
3.63
88.7
279.
419
.04
11.4
514
0.8
362.
316
.34
7.34
284.
471
3.0
14.8
38.
50M
adhy
a Pr
ades
h32
9.7
650.
54.
2817
.99
334.
159
9.9
10.6
43.
4254
2.1
1062
.38.
987.
9512
05.8
2312
.78.
249.
20G
oa10
.910
.3-1
.80
2.49
64.7
98.1
8.36
0.66
62.5
184.
212
.22
16.7
913
8.1
292.
69.
529.
84Bi
har
244.
435
5.3
3.77
3.74
120.
232
0.4
16.9
66.
1844
5.7
1064
.79.
9413
.46
810.
317
40.4
9.41
9.89
Nor
th e
ast
Miz
oram
6.4
10.1
9.09
-0.9
15.
38.
710
.30
2.48
16.8
35.2
11.5
86.
5128
.554
.110
.80
4.36
Ass
am13
9.8
179.
73.
163.
3014
3.6
199.
52.
906.
0327
1.3
487.
88.
167.
0355
4.6
867.
05.
616.
00N
agal
and
20.7
28.9
3.56
4.25
8.8
15.5
9.25
8.99
34.5
69.5
9.49
7.63
64.0
113.
97.
646.
91M
anip
ur12
.716
.24.
165.
5119
.921
.31.
782.
6521
.343
.47.
6411
.15
53.9
80.9
4.85
7.57
Aru
nach
al P
rade
sh
12.4
17.9
3.51
4.38
11.4
17.4
7.93
3.62
12.4
23.6
11.2
35.
6336
.158
.87.
734.
62Tr
ipur
a23
.440
.08.
734.
6624
.041
.67.
699.
1047
.697
.98.
8511
.68
95.1
179.
48.
549.
39M
egha
laya
15.8
21.3
2.04
6.99
19.0
41.4
10.7
58.
3436
.170
.98.
938.
7770
.913
3.6
8.02
8.34
Sikk
im3.
35.
73.
4812
.29
5.5
35.7
35.5
69.
4910
.017
.99.
966.
0218
.959
.319
.26
8.63
Peri
od 1
: 200
4-05
to 2
010-
11; P
erio
d-II
: 201
0-11
to 2
014-
15.
The
stat
es h
ave
been
sor
ted
acco
rdin
g to
gro
wth
in G
SDP
(Ag)
in a
scen
ding
ord
er.

13
Tabl
e 4
: Per
form
ance
of v
ario
us s
ub-s
ecto
rs a
gric
ultu
re, m
anuf
actu
ring
and
ser
vice
sec
tor a
cros
s st
ates
(Rs.
lakh
s @
200
4-05
pri
ces)
Stat
esC
rops
and
Liv
esto
ck S
ecto
rFo
rest
ryFi
sher
ies
Agr
icul
ture
Tot
alG
SDP
Gro
wth
in G
SDP
GSD
PG
row
th in
GSD
PG
SDP
Gro
wth
in G
SDP
GSD
PG
row
th in
GSD
PTE
20
06/0
7TE
20
14/1
5Pe
riod
I
Peri
od
IITE
20
06/0
7TE
20
14/1
5Pe
riod
I
Peri
od
IITE
20
06/0
7TE
20
14/1
5Pe
riod
I
Peri
od
IITE
20
06/0
7TE
20
14/1
5Pe
riod
I
Peri
od
II
Jam
mu
& K
ashm
ir61
.671
.62.
64-1
.97
13.9
13.2
-1.4
9-0
.13
1.5
1.8
3.27
-1.6
977
.086
.61.
95-1
.69
Mah
aras
htra
391.
251
7.9
5.59
-1.3
893
.612
3.1
1.92
6.44
14.9
16.2
0.41
2.21
499.
865
7.1
4.78
0.07
Odi
ssa
150.
218
9.1
4.07
-0.2
326
.526
.90.
95-0
.85
11.1
17.6
4.26
8.95
187.
923
3.7
3.67
0.32
Punj
ab30
5.9
347.
61.
911.
2312
.316
.63.
304.
463.
03.
73.
122.
5332
1.2
367.
91.
981.
38Ta
mil
Nad
u23
8.4
298.
04.
121.
2017
.221
.01.
833.
6321
.728
.65.
102.
7327
7.3
347.
74.
041.
46K
eral
a17
2.0
157.
0-2
.25
1.35
21.1
25.3
2.80
2.66
17.7
18.8
0.57
2.08
210.
820
1.1
-1.4
61.
59Ra
jast
han
287.
745
5.1
6.08
1.77
47.5
54.2
1.78
1.56
1.0
1.8
8.80
7.77
336.
251
1.1
5.54
1.77
Har
yana
216.
828
5.1
4.00
2.16
10.7
13.2
2.58
3.07
1.4
3.2
14.7
07.
2722
8.8
301.
44.
012.
25G
oa7.
16.
3-2
.74
0.34
0.8
1.1
2.69
9.28
3.0
2.9
-0.8
04.
7010
.910
.3-1
.80
2.49
Wes
t Ben
gal
406.
547
1.1
2.10
1.86
24.2
35.5
1.98
13.8
679
.610
1.6
3.96
3.20
510.
460
8.1
2.39
2.72
Kar
nata
ka28
0.6
405.
76.
072.
9741
.959
.44.
493.
316.
812
.710
.54
2.06
329.
347
7.8
5.97
2.98
Utta
rakh
and
40.7
51.9
2.14
2.52
14.1
19.2
2.46
6.76
0.1
0.1
6.84
1.14
54.8
71.2
2.23
3.63
Utta
r Pra
desh
718.
393
4.9
2.65
3.82
65.6
77.7
2.13
2.19
10.3
16.5
7.29
3.66
794.
210
29.1
2.67
3.69
Biha
r20
6.3
314.
24.
573.
7526
.722
.8-2
.00
-1.8
811
.418
.31.
7912
.61
244.
435
5.3
3.77
3.74
Chh
attis
garh
80.4
139.
86.
185.
4625
.930
.81.
902.
775.
712
.69.
568.
5111
1.9
183.
25.
425.
19G
ujar
at31
4.5
463.
94.
925.
8345
.250
.20.
632.
7516
.719
.83.
533.
1537
6.5
534.
04.
355.
47A
ndhr
a Pr
ades
h31
9.3
432.
24.
523.
9520
.726
.22.
194.
8962
.413
7.5
6.40
15.9
140
2.4
595.
94.
716.
43H
imac
hal P
rade
sh47
.961
.00.
706.
9415
.421
.45.
305.
340.
40.
52.
037.
5663
.782
.81.
886.
53Jh
arkh
and
72.7
150.
66.
9012
.79
20.9
27.7
3.98
2.95
1.6
4.4
18.1
312
.62
95.2
182.
66.
4811
.05
Mad
hya
Prad
esh
292.
860
7.6
4.61
19.4
334
.138
.51.
580.
912.
84.
31.
4712
.85
329.
765
0.5
4.28
17.9
9N
orth
eas
tM
izor
am3.
77.
314
.40
-1.7
72.
42.
3-0
.57
0.43
0.3
0.5
0.97
7.01
6.4
10.1
9.09
-0.9
1A
ssam
118.
014
7.5
2.92
2.67
13.5
19.2
4.78
4.43
8.2
13.1
3.81
9.61
139.
817
9.7
3.16
3.30
Trip
ura
19.3
27.1
6.44
1.83
2.6
8.2
18.2
09.
421.
64.
716
.05
15.4
323
.440
.08.
734.
66N
agal
and
16.2
22.5
3.16
4.41
4.2
5.9
4.58
3.70
0.3
0.5
11.1
53.
4620
.728
.93.
564.
25M
anip
ur9.
612
.85.
226.
141.
91.
9-0
.23
-0.2
11.
21.
51.
698.
2212
.716
.24.
165.
51M
egha
laya
11.5
16.7
2.55
9.14
4.0
4.2
1.07
-0.3
40.
30.
3-4
.65
6.17
15.8
21.3
2.04
6.99
Sikk
im2.
95.
44.
1313
.14
0.4
0.3
-2.1
80.
850.
00.
03.
6435
.36
3.3
5.7
3.48
12.2
9
Peri
od 1
: 200
4-05
to 2
010-
11; P
erio
d-II
: 201
0-11
to 2
014-
15.
The
stat
es h
ave
been
sor
ted
acco
rdin
g to
gro
wth
in G
SDP
(Ag)
in a
scen
ding
ord
er.


15
4Chapter
Farmers’ Income and its Estimation
4.1 Earlier Efforts on Farm Income EstimationFarm business income from cost of cultivation (CoC) data: The
Comprehensive Scheme for Cost of Cultivation (CSCC) in India was started in the year 1970-71, which collects and compiles the data on costs and receipts of selected agricultural commodities. Farm Business income is calculated by deducting the relevant costs from the receipts by the farmers, i.e. value added in crop production less factor payments. This income provides a good indication at the region and commodity level; however, it may not be useful in estimating the aggregate farm business income for the sector as a whole. Farmers’ welfare is closely linked to the level of farm incomes. Estimates of value added from crop production can, of course, be obtained for the sector as a whole without detailed cost of production studies – by combining estimates of physical crop production (from area estimates and results of crop cutting experiments on yields) with estimates of farm-gate prices to obtain the gross value of output, and then by deducting from it the use of inputs (Sen and Bhatia, 2004). They estimated farm business income using the data from the CSCC from 1981-82 to 1999-00 and included the farm business income both from crop cultivation and livestock. Though CSCC data are representative of crops in major growing states, but these do not cover horticultural crops and several minor crops. Horticultural sector is tremendously growing in India and exclusion of this sector ignores the major source of potential growth. The data on income from the livestock sector are not appropriately captured in the cost of cultivation schedules, which do not intend to do so, and the farm business income derived from the CSCC data is not an adequate measure of actual farm business income in the country or a state (Chand et al., 2015).
Farm income using the National Sample Survey Office (NSSO) data: Chand et al. (2015) derived the farm income by deducting the capital consumption and wage bill for hired labour employed in agriculture from GDP. The wage bill for agriculture and allied sector was computed by multiplying the number of hired labourers employed in agriculture with per day agricultural wage earnings and the number of days of wage employment in a year in agriculture and allied activities based on

16
various rounds of NSSO on employment and unemployment and also the Rural Labour Enquiry Reports (RLER). The estimates of farm income were prepared for various points corresponding to six rounds of NSSO on Employment and Unemployment—1983 (38th Round), 1987-88 (43rd Round), 1993-94 (50th Round), 1999-00 (55th Round), 2004-05 (61st Round), and 2011-12 (68th Round). Farm income obtained at current prices was deflated by Consumer Price Index for Agricultural Labourers (CPIAL) to arrive at real farm incomes. This was the maiden attempt in India to estimate the aggregate farm income, which was also computed for per cultivator, per household and per unit of net sown area to reflect the scenario at the disaggregated level.
Farmers’ Income on the basis of Situation Assessment Survey of NSSO: Besides the above approaches, NSSO carried out two separate rounds on Situation Assessment Survey (SAS) of Agricultural Households (59th and 70th Rounds), which included all possible dimensions for determining the socio-economic status of agricultural households. As per the SAS, the total income per average agricultural households grew annually at 11.75 per cent from Rs 25,380 in 2002-03 to Rs 77,112 in 2012-13, the income doubled in about 6 years; however, in real terms (after neutralizing the effect of inflation), the income growth was 5.24 per cent and at this rate doubling of income would take 14 years (Satyasai and Bharti, 2016). However, one needs to identify a proper deflator to convert the nominal income into real income. The doubling of income requires initial set of estimates of farmers’ income which are to be doubled in a given timeframe. Thus, a Committee has been constituted by Ministry of Agriculture and Farmers’ Welfare for developing the methodology and institutionalization of the strategy to double the income.
4.2 Current Status of Farm and Non-Farm IncomeChand et al. (2015) provided the farm income details for the income
earned by a cultivator, per unit of net sown area per household/holding along with the income earned by a labour. Between 1983–84 and 2011–12, the farm income per cultivator deflated by CPIAL (base year 2004–05) rose 2.7 times, from Rs 16,103 to Rs 42,781; the farm income per holding doubled and per hectare of net sown area (NSA) trebled. In 2011–12, a cultivator earned an annual income of Rs 78,200 at current prices; while one hectare of net cultivated area generated an income of Rs 80,800 to a farmer (Table 5). The farm income in real terms increased at the rate of 3.67 per cent per year between 1983–84 and 1993–94. The annual growth rate of the income of farmers accelerated to 5.36 per cent after 2004-05. The number of cultivators declined from 16.7 crores in 2004–05 to 14.6 crores in 2011–12 leading to an impressive growth in the income.

17
Table 5 : Real and current farm income and wage earnings of agricultural labour (Rs)
Year/Period Per cultivator
Per hectare net sown area
Per holding
Wage earning per labourer
Real income1983–84 16,103 14,798 22,603 5,5131987–88 17,030 16,770 22,298 6,6301993–94 21,110 21,345 27,147 8,1681999–00 26,875 26,437 31,325 9,9312004–05 26,146 30,755 34,103 10,0432011–12 42,781 44,176 44,688 17,662Income at current prices2011–12 78,264 80,817 81,753 32,311
Growth in farm income
Total Per cultivator
Per holding
Per hectare of NSA
1983-84 to 1993-94 3.67 2.74 1.85 3.731993-94 to 2004-05 3.30 1.96 2.10 3.382004-05 to 2011-12 5.36 7.29 3.94 5.31
Source: Chand et al. (2015).
4.3 Disparities in Agriculture and Non-Agriculture IncomeIt is often felt that disparity between farm income and non-farm
income is rising (Chand, 2008) and that those who work outside agriculture are progressing much faster than those who work in it. It is also alleged that labour in agriculture is becoming more costly and eating into the net income of farmers. In 1983–84, a cultivator earned three times what a labourer earned while a non-agriculture worker earned three times the income earned by a farmer or his family members engaged in agriculture as their main activity. The disparity in income of a cultivator and a non-agricultural worker increased from 1:3 to 1:4 between 1983–84 and 2004–05 (Chand et al., 2015). After this, the disparity in farm and non-farm income declined to 1:3.15; and a non-agricultural worker earned 3.15 times the income of a cultivator in 2011–12 (Table 6). Acceleration in growth of agricultural output and a decline in the number of cultivators from 2004–05 to 2011–12 arrested and reversed the rising disparity in the incomes of farmers and non-farmers. The recent years have seen some narrowing of gap in the income earned by those who are engaged in agricultural activities and those who are engaged in non-agricultural occupations. Between farmer and agricultural labourer, the development process has benefited the latter a little more, but there still remains a large gap between the incomes of a cultivator and an agricultural labourer (Chand et al., 2015).

18
Table 6 : Income earned by agricultural and non-agricultural workers (1983-84 to 2011-12)
Year
Farm income per cultivator
(Rs) F
Wage earning per agricultural
labour (Rs) L
Income per non- agricultural
worker (Rs) N
Ratio L:F
Ratio N:F
1983-84 4286 1467 12786 0.34 2.981987-88 5653 2201 18036 0.39 3.191993-94 12365 4784 37763 0.39 3.051999-00 24188 8938 78565 0.37 3.252004-05 26146 10043 106688 0.38 4.082011-12 78264 32311 246514 0.41 3.15
Source: Chand et al. (2015).
4.4 Farmers’ Income: Major SourcesThe recently conducted Situation Assessment Survey of Agricultural
Households by NSSO provides the income details for four broad categories i.e. income from crop cultivation, farming of animals, income from wages and salary and income from non-farm sources. On an average, one household earns Rs 6,426 from all these four sources, out of which 60 per cent is derived from farm sources while remaining 40 per cent is derived from off farm and non-farm sources (Figure 2). As far as income across size classes is concerned, small farmers derive maximum share from non-farm sources. As we move up in the size class category, the share of income derived from crop cultivation improves significantly and the share of non farm activities, i.e. wages and salaries, and non farm business activities declines (Birthal et al. 2017). Thus, differential strategies are required for different size classes for doubling of income.
Table 7 provides income estimates and sources of income across states. It is difficult to demarcate and identify different categories on the basis of sources of income. Even the composition of different sources of income in the best performing state, viz. Punjab and the least performing state, viz. Bihar is quite similar.
The share of income derived from crop cultivation is relatively higher in Punjab, Haryana, Chhattisgarh, Madhya Pradesh, Uttar Pradesh and Uttarakhand; while the least is noticed in case of Jammu & Kashmir, Tamil Nadu and West Bengal. The income from farming of animals occupies larger share in Haryana, Gujarat, Odisha, Jharkhand and Andhra Pradesh; while least is observed in Kerala, Chhattisgarh, Karnataka and West Bengal. It is surprising to note that Chhattisgarh derives total income only from crops and wages; thus, the state needs special consideration in terms of preparation of strategic plan of the state.

19
As far as non-farm and wages & salary as alternate sources of income are concerned, states like Kerala, Jammu & Kashmir, Himachal Pradesh, Tamil Nadu and West Bengal earn maximum from these two sources. As these states are special states in terms of the typology i.e. the states fall into either hilly or coastal typology and dominated by specialised horticultural and fishery products. Thus, farmers rely on alternate sources to ensure their livelihood. Again, these states need special attention and a customised strategic framework is required for doubling of income.
Figure 2 : Sources of farmers’ income across size classes
Source: NSSO (2014).
All India average income per month per household : Rs 6426
Sources of income across farm size

20
Table 7 : Average monthly income per agricultural household during 2012-13 (Rs)
State/UTs
Income from
wages
Net receipt from
cultivation
Net receipt from
farming of animals
Net receipt from
non-farm business
Total income
Andhra Pradesh 2482 2022 1075 400 5979
Arunachal Pradesh 2076 6647 1310 836 10869
Assam 1430 4211 799 255 6695
Bihar 1323 1715 279 240 3558
Chhattisgarh 1848 3347 -19 1 5177
Gujarat 2683 2933 1930 380 7926
Haryana 3491 7867 2645 431 14434
Himachal Pradesh 4030 2876 1047 824 8777
Jammu & Kashmir 7336 3063 801 1483 12683
Jharkhand 1839 1451 1193 238 4721
Karnataka 2677 4930 600 625 8832
Kerala 5254 3531 575 2529 11888
Madhya Pradesh 1332 4016 732 129 6210
Maharashtra 2156 3856 539 834 7386
Manipur 3815 2924 1563 540 8842
Meghalaya 3776 6472 657 887 11792
Mizoram 3655 4561 864 19 9099
Nagaland 5393 3212 1384 59 10048
Odisha 1716 1407 1314 539 4976
Punjab 4779 10862 1658 760 18059
Rajasthan 2534 3138 967 710 7350
Sikkim 3113 1696 980 1009 6798
Tamil Nadu 2902 1917 1100 1061 6980
Telangana 1450 4227 374 260 6311
Tripura 2185 2772 311 162 5429
Uttarakhand 1069 2531 848 253 4701
Uttar Pradesh 1150 2855 543 376 4923
West Bengal 2126 979 225 650 3980
Group of UTs 5179 1864 213 1312 8568
All-India 2071 3081 763 512 6426
Source: NSSO (2014).

21
4.5 Delineating the Sources of Off-Farm and Non-Farm Income The non-farm income contributes around 40 per cent of the total
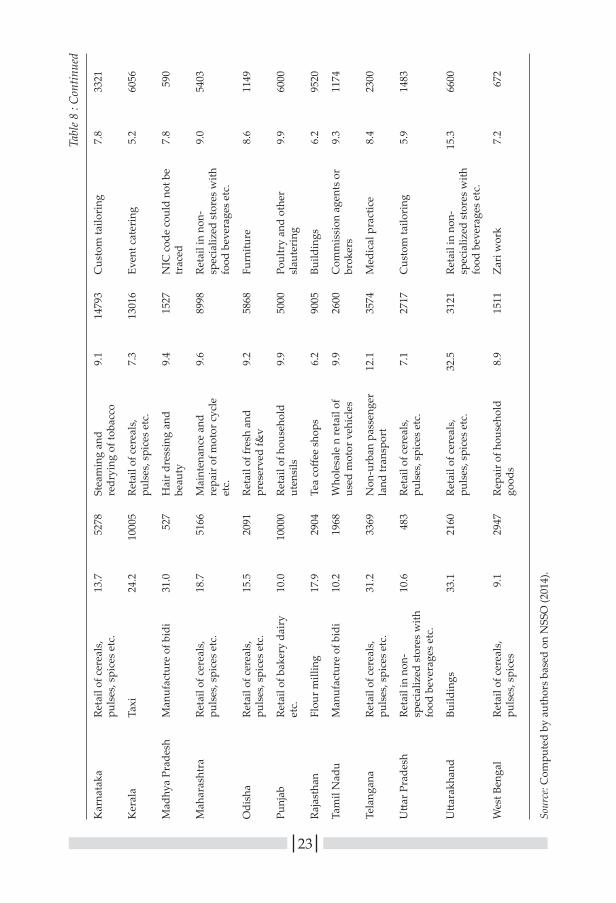
income earned by a farmer and is an important source in doubling of farmers’ income. Providing a connect between the income generated from farm and the activities linked with farm as off-farm and non-farm activities is crucial in strengthening both the farm as well as other than farm income sources. Table 8 and Table 9 provide the details of off-farm and non-farm sources of income around the year. The details regarding the share in employment and average monthly income earned from different sources for three most important non-farm activities have also been provided based on 70th round of NSSO on Situation Assessment Survey of farmers in India.
Retail trade in cereals, pulses, spices etc. is the most prevalent activity across majority of the states and occupies the maximum share in employment. Such income earned by an average farmer ranges from Rs 1,115 in Jharkhand to Rs 6,430 in Himachal Pradesh. Retail of meat and meat products is the most prevalent activity in Assam which is also justified according to the habitat of the region. Similarly, retail of fresh and preserved fruits and vegetables is the dominant activity in Jammu & Kashmir.
It is observed that non-farm sources of income in general for majority of the states are an extension of farm activities and are part of the value chain and there is no disconnect between the two. Thus, impetus on addressing supply side constraints by creating the infrastructure like specialised storage, efficient transport, and maintaining the link in terms of product management skills among farm, off farm and non-farm sources emerge as two major critical interventions to strengthen the linkages, improving the product quality and creating a win-win situation for the producers as well as consumers.

22
Tabl
e 8
: Off
-far
m a
nd n
on-f
arm
eco
nom
ic a
ctiv
ities
acr
oss
stat
es (J
uly-
Dec
embe
r, 20
12)
Stat
eFi
rst m
ost I
mpo
rtan
t off
farm
/non
-far
m
sour
ce o
f Inc
ome
Seco
nd m
ost I
mpo
rtan
t off
farm
/non
-far
m
sour
ce o
f Inc
ome
Thir
d m
ost I
mpo
rtan
t off
farm
/non
-far
m
sour
ce o
f Inc
ome
NIC
indu
stry
Shar
e in
em
ploy
-m
ent (
%)
Ave
rage
m
onth
ly
inco
me
of
hous
ehol
ds
enga
ged
(Rs)
NIC
indu
stry
Shar
e in
em
ploy
-m
ent (
%)
Ave
rage
m
onth
ly
inco
me
of
hous
ehol
ds
enga
ged
(Rs)
NIC
indu
stry
Shar
e in
em
ploy
-m
ent (
%)
Ave
rage
m
onth
ly
inco
me
of
hous
ehol
ds
enga
ged
(Rs)
And
hra
Prad
esh
Man
ufac
ture
of g
ur15
.026
100
Reta
il of
cer
eals
, pu
lses
, spi
ces
etc.
11.2
2541
Repa
ir a
nd
mai
nten
ance
of p
ump
9.2
4000
Ass
amRe
tail
of m
eat a
nd
mea
t pro
duct
s27
.316
73Re
tail
of c
erea
ls,
puls
es, s
pice
s et
c.11
.641
51St
ruct
ural
woo
den
good
s7.
834
50
Biha
rRe
tail
of c
erea
ls,
puls
es, s
pice
s et
c.52
.434
36Fl
our m
illin
g7.
750
09C
usto
m ta
ilori
ng7.
143
57
Chh
attis
garh
Reta
il in
non
-sp
ecia
lized
sto
res
with
fo
od b
ever
ages
etc
.
60.4
-300
0Re
tail
of b
aker
y da
iry
etc.
23.9
1312
Cus
tom
tailo
ring
7.3
1300
Guj
arat
Reta
il of
cer
eals
, pu
lses
, spi
ces
etc.
21.3
4138
Mot
oriz
ed ro
ad fr
eigh
t tr
ansp
ort
14.5
1063
2Em
broi
dery
9.5
350
Har
yana
Reta
il of
te
leco
mm
unic
atio
n17
.887
58Re
tail
of c
erea
ls,
puls
es, s
pice
s et
c.17
.442
93C
afet
eria
s fa
st fo
od
rest
aura
nts
16.2
3500
Him
acha
l Pra
desh
Reta
il of
cer
eals
, pu
lses
, spi
ces
etc.
23.9
6430
Swee
t mea
ts8.
537
62N
on-m
otor
ized
road
fr
eigh
t tra
nspo
rt7.
277
97
Jam
mu
& K
ashm
irRe
tail
of fr
esh
and
pres
erve
d fr
uits
and
ve
geta
bles
22.8
3000
Reta
il of
cer
eals
, pu
lses
, spi
ces
etc.
21.7
3219
Build
ings
9.8
-120
8
Jhar
khan
dRe
tail
of c
erea
ls,
puls
es, s
pice
s et
c.24
.611
15M
anuf
actu
re o
f bid
i22
.522
00O
ther
com
mis
sion
ag
ents
13.6
3900
23
Kar
nata
kaRe
tail
of c
erea
ls,
puls
es, s
pice
s et
c.13
.752
78St
eam
ing
and
redr
ying
of t
obac
co9.
114
793
Cus
tom
tailo
ring
7.8
3321
Ker
ala
Taxi
24.2
1000
5Re
tail
of c
erea
ls,
puls
es, s
pice
s et
c.7.
313
016
Even
t cat
erin
g5.
260
56
Mad
hya
Prad
esh
Man
ufac
ture
of b
idi
31.0
527
Hai
r dre
ssin
g an
d be
auty
9.4
1527
NIC
cod
e co
uld
not b
e tr
aced
7.8
590
Mah
aras
htra
Reta
il of
cer
eals
, pu
lses
, spi
ces
etc.
18.7
5166
Mai
nten
ance
and
re
pair
of m
otor
cyc
le
etc.
9.6
8998
Reta
il in
non
-sp
ecia
lized
sto
res
with
fo
od b
ever
ages
etc
.
9.0
5403
Odi
sha
Reta
il of
cer
eals
, pu
lses
, spi
ces
etc.
15.5
2091
Reta
il of
fres
h an
d pr
eser
ved
f&v
9.2
5868
Furn
iture
8.6
1149
Punj
abRe
tail
of b
aker
y da
iry
etc.
10.0
1000
0Re
tail
of h
ouse
hold
ut
ensi
ls9.
950
00Po
ultr
y an
d ot
her
slau
teri
ng
9.9
6000
Raja
stha
nFl
our m
illin
g17
.929
04Te
a co
ffee
shop
s6.
290
05Bu
ildin
gs6.
295
20
Tam
il N
adu
Man
ufac
ture
of b
idi
10.2
1968
Who
lesa
le n
reta
il of
us
ed m
otor
veh
icle
s9.
926
00C
omm
issi
on a
gent
s or
br
oker
s9.
311
74
Tela
ngan
aRe
tail
of c
erea
ls,
puls
es, s
pice
s et
c.31
.233
69N
on-u
rban
pas
seng
er
land
tran
spor
t12
.135
74M
edic
al p
ract
ice
8.4
2300
Utta
r Pra
desh
Reta
il in
non
-sp
ecia
lized
sto
res
with
fo
od b
ever
ages
etc
.
10.6
483
Reta
il of
cer
eals
, pu
lses
, spi
ces
etc.
7.1
2717
Cus
tom
tailo
ring
5.9
1483
Utta
rakh
and
Build
ings
33.1
2160
Reta
il of
cer
eals
, pu
lses
, spi
ces
etc.
32.5
3121
Reta
il in
non
-sp
ecia
lized
sto
res
with
fo
od b
ever
ages
etc
.
15.3
6600
Wes
t Ben
gal
Reta
il of
cer
eals
, pu
lses
, spi
ces
9.1
2947
Repa
ir o
f hou
seho
ld
good
s8.
915
11Za
ri w
ork
7.2
672
Tabl
e 8 :
Cont
inue
d
Sour
ce: C
ompu
ted
by a
utho
rs b
ased
on
NSS
O (2
014)
.

24
Tabl
e 9
: Off
-far
m a
nd n
on-f
arm
eco
nom
ic a
ctiv
ities
acr
oss
stat
es (J
anua
ry-M
arch
, 201
3)
Stat
eFi
rst m
ost I
mpo
rtan
t off
farm
/non
-far
m
sour
ce o
f Inc
ome
Seco
nd m
ost I
mpo
rtan
t off
farm
/non
-far
m
sour
ce o
f Inc
ome
Thir
d m
ost I
mpo
rtan
t off
farm
/non
-far
m
sour
ce o
f Inc
ome
NIC
indu
stry
Shar
e in
em
ploy
-m
ent (
%)
Ave
rage
m
onth
ly
inco
me
of
hous
ehol
ds
enga
ged
(Rs)
NIC
indu
stry
Shar
e in
em
ploy
-m
ent (
%)
Ave
rage
m
onth
ly
inco
me
of
hous
ehol
ds
enga
ged
(Rs)
NIC
indu
stry
Shar
e in
em
ploy
-m
ent (
%)
Ave
rage
m
onth
ly
inco
me
of
hous
ehol
ds
enga
ged
(Rs)
And
hra
Prad
esh
Reta
il of
cer
eals
and
pu
lses
etc
.13
.928
81Re
pair
and
m
aint
enan
ce o
f pum
ps11
.910
00Re
tail
in n
on-
spec
ializ
ed s
tore
s11
.415
67
Ass
amRe
tail
of m
eat a
nd
mea
t pro
duct
s30
.514
76M
anuf
actu
re o
f w
oode
n go
ods
9.2
4300
Reta
il of
cer
eals
and
pu
lses
etc
.7.
334
29
Biha
rRe
tail
of c
erea
ls a
nd
puls
es e
tc.
65.4
2408
Mot
oris
ed ro
ad fr
eigh
t tr
ansp
ort
4.8
6519
Flou
r mill
ing
3.8
5564
Chh
attis
garh
Cus
tom
tailo
ring
83.6
1900
Reta
il of
ele
ctro
nic
hous
ehol
d go
ods
16.4
-200
00N
A
Guj
arat
Reta
il of
cer
eals
and
pu
lses
etc
.19
.444
06M
otor
ised
road
frei
ght
tran
spor
t16
.810
841
Embr
oide
ry w
ork
and
mak
ing
of la
ces
and
frin
ges
9.6
465
Har
yana
Reta
il of
te
leco
mm
unic
atio
n eq
uipm
ent
24.4
1243
6C
afet
eria
s, fa
st-fo
od
rest
aura
nts
22.2
4250
Reta
il of
cer
eals
and
pu
lses
etc
.21
.144
35
Him
acha
l Pra
desh
Reta
il of
cer
eals
and
pu
lses
etc
.24
.732
31N
on-m
otor
ised
road
fr
eigh
t tra
nspo
rt7.
337
87M
anuf
actu
re o
f je
wel
lery
7.2
1200
Jam
mu
& K
ashm
irRe
tail
of fr
esh
or
pres
erve
d fr
uit a
nd
vege
tabl
es
24.3
3000
Reta
il of
cer
eals
and
pu
lses
etc
.20
.438
74C
onst
ruct
ion
of
build
ings
10.5
-168
1
Jhar
khan
dRe
tail
of c
erea
ls a
nd
puls
es e
tc.
31.6
1447
Man
ufac
ture
of b
idi
29.0
2470
Reta
il of
jew
elle
ry
9.6
3600

25
Kar
nata
kaRe
tail
of c
erea
ls a
nd
puls
es e
tc.
11.0
4581
Inte
rior
and
ext
erio
r pa
intin
g8.
7-5
000
Cus
tom
tailo
ring
7.1
5225
Ker
ala
Taxi
ope
ratio
n22
.812
890
Reta
il of
cer
eals
and
pu
lses
etc
.8.
614
890
Reta
il of
foot
wea
r5.
651
33
Mad
hya
Prad
esh
Man
ufac
ture
of b
idi
37.4
583
Hai
rdre
ssin
g an
d ot
her b
eaut
y tr
eatm
ent
11.4
4941
NIC
cod
e co
uld
not b
e tr
aced
9.7
290
Mah
aras
htra
Reta
il of
cer
eals
and
pu
lses
etc
.25
.160
09M
aint
enan
ce a
nd
repa
ir o
f mot
or c
ycle
s et
c.
11.2
5476
Reta
il in
non
-sp
ecia
lized
sto
res
with
fo
od b
ever
ages
etc
.
10.9
5434
Odi
sha
Reta
il of
cer
eals
and
pu
lses
etc
.18
.330
59Re
tail
sale
of f
resh
or
pres
erve
d fr
uit a
nd
vege
tabl
es
12.1
6182
Man
ufac
ture
of
furn
iture
mad
e of
w
ood
11.2
6984
Punj
abRe
tail
of b
aker
y pr
oduc
ts, d
airy
pr
oduc
ts a
nd e
ggs
15.8
1300
0Re
tail
of c
erea
ls a
nd
puls
es e
tc.
15.0
6388
Mot
oris
ed ro
ad fr
eigh
t tr
ansp
ort
11.9
1096
3
Raja
stha
nFl
our m
illin
g22
.033
63Te
a/co
ffee
shop
s7.
890
00M
otor
ised
road
frei
ght
tran
spor
t6.
318
926
Tam
il N
adu
Man
ufac
ture
of b
idi
11.3
2262
Com
mis
sion
age
nts,
br
oker
s11
.058
89M
otor
ised
road
frei
ght
tran
spor
t7.
153
52
Tela
ngan
aRe
tail
of c
erea
ls a
nd
puls
es e
tc.
41.1
2827
Med
ical
pra
ctic
e ac
tiviti
es11
.130
00Po
ultr
y &
oth
er
slau
ghte
ring
, 10
.911
300
Utta
r Pra
desh
Reta
il in
non
-sp
ecia
lized
sto
res
9.6
4101
Reta
il of
cer
eals
and
pu
lses
etc
.7.
943
08M
otor
ised
road
frei
ght
tran
spor
t6.
520
900
Utta
rakh
and
Reta
il of
cer
eals
and
pu
lses
etc
.43
.628
23C
onst
ruct
ion
of
build
ings
29.4
1581
Rest
aura
nts
with
out
bars
9.4
5500
Wes
t Ben
gal
Reta
il of
cer
eals
and
pu
lses
etc
.11
.536
75Re
pair
of o
ther
pe
rson
al a
nd
hous
ehol
d go
ods
n.e.
c.
9.6
2506
Zari
wor
k an
d ot
her
orna
men
tal t
rim
min
gs7.
114
10
Tabl
e 9 :
Cont
inue
d
Sour
ce: C
ompu
ted
by a
utho
rs b
ased
on
NSS
O (2
014)
.


27
5Chapter
Role of Technology and Diversification
5.1 Total Factor ProductivityA significant contributor to output growth would be the total factor
productivity (TFP). A number of studies have been conducted on this subject, which dealt with disaggregated regions and crops, the summary is provided in Table 10. A recent exhaustive study completed at ICAR-NIAP established that annual TFP growth in agriculture was around 1.55 percent during 1980-81 to 2011-12 and it improved to 5.49 per cent during 2004-05 to 2011-12 (Jain and Chand, 2015). According to other studies, estimated TFP growth was 2.33 per cent per year for crop sector, 2.66 per cent per year for livestock sector and 2.41 per cent per year for crops and livestock combined during 1981 to 2001 (Avila and Evenson, 2004). Another study by the Reserve Bank of India establishes the TFP trend growth rate during 2000-08 at 0.7 per cent based on value added function framework (Goldar et al., 2014). Chand et al. (2011) estimated crop-wise and state-wise TFP and the given growth ranged from as low as -0.69 in redgram to as high as 1.92 in wheat during 1975 to 2005.
As an illustration, Murali (2012) revealed that a comparison of the productivity in the pre-introduction of the variety Co86032 period with after introduction of variety Co86032 shown that more technological progress and hence more improvement in productivity was recorded after introduction of variety Co86032 than pre-introduction of variety Co86032 period. Co86032 variety is an early season variety which performs well in all soil types and extremely well in garden land condition, yielding good quality cane with higher yield having multi ratooning capacity and can be grown throughout the year. The annual TFP growth over the whole period is 7.6 per cent. The improvement was more due to technological progress rather than improvement in efficiency. The study indicates greater TFP changes after introduction of variety Co86032 than pre introduction of variety Co86032. Government schemes like Rashtriya Krishi Vikas Yojana, (RKVY), National Food Security Mission and Pradhan Mantri Fasal Bima Yojana (PMFBY) will facilitate attainment of desired growth in output as

28
Table 10 : Growth in total factor productivity
Author(s)
Commodity
Period
TFP Growth
(%)
Author(s)
Commodity
Period
TFP Growth
(%)
Evenson et al. (1999)
Crops 1956-1965 1.10 Jain and Chand (2015)
Agriculture 1980-1981 to
2011-2012
1.55
1966-1976 1.39 2004-2005 to
2011-2012
5.49
1977-1987 1.05 Chand et al. (2011)
Rice 1975-1985 0.90
Birthal et al. (1999)
Livestock 1951-1970 -0.04 1986-1995 0.74
1970-1980 0.93 1996-2005 0.40
1980-1995 1.79 1975-2005 0.67
Fan et al. (1999)
Crops and Livestock
1970-1979 1.55 Wheat 1975-1985 1.60
1980-1989 2.52 1986-1995 2.51
1990-1994 2.29 1996-2005 1.61
1970-1994 1.75 1975-2005 1.92
Coelli and Rao (2003)
Crops and Livestock
1980-2000 0.90 Gram 1975-1985 0.06
Avila and Evenson (2004)
Crops 1961-1980 1.54 1986-1995 0.09
1981-2001 2.33 1996-2005 0.34
Livestock 1961-1980 2.63 1975-2005 0.16
1981-2001 2.66 Groundnut 1975-1985 0.49
Crop and Livestock
1961-1980 1.92 1986-1995 0.55
1981-2001 2.41 1996-2005 1.30
Joshi et al. (2003)
Rice (IGP) 1980-1990 3.50 1975-2005 0.77
1990-1999 2.08 Cotton 1975-1985 2.84
Wheat (IGP) 1980-1990 2.44 1986-1995 0.92
1990-1999 2.14 1996-2005 0.80
Kumar et al. (2008)
Wheat 1971-1986 1.28 1975-2005 1.41
1986-2000 0.68 Rada (2016) Grains 1980-2008 -1.83
Pulses 1971-1986 0.52 Pulses -4.03
1986-2000 -0.39 Horticulture 2.45
Oilseeds 1971-1986 0.14 Oilseeds -0.12
1986-2000 0.33 Specialty crops -0.41
Sugarcane 1971-1986 0.79 Animal products
1.18
1986-2000 -0.10
Source: Drawn from relevant studies mentioned in the Table.

29
these schemes aim at holistic development of agriculture and allied sector, aim at accelerating production of crops mainly responsible for ensuring the food security along with soil fertility, and compensating farmers for crop losses/damages along with ensuring credit flow to farmers. Chand (2016) opined that TFP growth, which is mainly contributed by agricultural R&D, extension services, new knowledge, efficient practices like precision farming, is required to follow annual increase of 3.0 per cent.
5.2 Addressing Yield GapsThere exist huge yield gaps in agricultural sector. A study by Planning
Commission outlined these yield gaps between 6 to 300 per cent in cereals, 5 to 185 per cent in oilseeds and 16 to 167 per cent in sugarcane in different states (GoI, 2007). Such gaps exist at two levels—one, between the best scientific practices and the best farm practices and second, between the best farm practices to the average farmer practices and are caused by a number of environmental factors. Technology adoption helps in reducing yield gap at farm level. The estimates of yield gap for major crops across states are given in Table 11. These estimates of yield gap were obtained for 2011-12 to 2013-14 based on the plot level data provided by the Ministry of Agriculture, Government of India. The crop yield at 90th percentile was used as bench mark in computing the yield gap estimates (YGE). The YGE show considerable gaps across states among different crops (Table 11). Yield gap in paddy varied around one-fourth to one third of the benchmark yield. The estimates with respect to the best performing farmers in major paddy growing states like West Bengal, Uttar Pradesh, Andhra Pradesh and Punjab are 33 per cent, 29 per cent, 29 per cent and 28 per cent, respectively.
In wheat, the yield gap estimates are slightly less. For Punjab and Haryana, the yield gap stands at 19 per cent and 23 per cent, whereas for Uttar Pradesh and Madhya Pradesh, the corresponding figures are 27 per cent and 33 per cent, respectively. There exist considerable yield gap in coarse cereals and pulses. The states like Maharashtra and Karnataka in Jowar, and Rajasthan in Bajra have yield gap of more than 50 per cent. Among pulses, while yield gap stands at 32 per cent in Madhya Pradesh for gram, it stands at 45 per cent in Rajasthan and Maharashtra.
In case of tur, YGE stands at 60 per cent in Maharashtra and Karnataka. Cash crops like maize and cotton as well indicate high yield gap estimates across states. The YGE for maize stands at 33 per cent in Andhra Pradesh, whereas it accelerated to 45 per cent and 58 per cent in Karnataka and Bihar, respectively. In Rajasthan, the YGE stands highest at 63 per cent. YGE for cotton stands at around 45 per cent in Gujarat and Maharashtra. In Andhra Pradesh, it is slightly less (38 per cent). The YGE for sugarcane, the other major cash crop are 25 per cent, 35 per cent and 41

30
per cent respectively for Uttar Pradesh, Karnataka and Maharashtra. The issue can be addressed by expanding irrigation, use of improved seeds in sowing and better credit access.
Table 11 : Yield gap estimates, adoption of improved and hybrid seeds along with area under irrigation for selected crops and states
Crop State Crop yield gap (%)
Adoption of improved &
hybrid seeds (%)
Area under irrigation (% of cropped area)
Paddy West Bengal 33 98 48.2Uttar Pradesh 29 100 83.1Andhra Pradesh 29 95 96.8Punjab 28 100 99.6
Wheat Uttar Pradesh 27 98 98.4Punjab 19 100 98.9Madhya Pradesh 33 100 90.8Haryana 23 96 99.5
Jowar Maharashtra 53 59 9.5Karnataka 56 66 11.5
Bajra Rajasthan 50 78 3.3Uttar Pradesh 35 83 8.9
Gram Madhya Pradesh 32 100 57.9Rajasthan 46 50 49.2Maharashtra 45 84 24.2
Tur Maharashtra 61 70 1.5Madhya Pradesh 36 52 1.6Karnataka 59 23 5.1
Maize Andhra Pradesh 33 99 49.5Karnataka 45 98 36.0Bihar 58 67 65.2
Cotton Gujarat 47 - 58.7Maharashtra 45 - 2.7Andhra Pradesh 38 - 13.9
Sugarcane Uttar Pradesh 25 - 95.1Maharashtra 41 - 100.0Karnataka 35 - 100.0
Note: Estimates of yield gap and seed use are obtained for 2011-12 to 2013-14. Yield at 90th percentile is used as bench mark in computing the estimates. Irrigation figures correspond to the year 2012-13.
Source: Yield gaps and seeds use are authors’ estimates based on Ministry of Agriculture data (various years); irrigation coverage is based on Agricultural Statistics at a Glance, 2015.

31
The strategy of irrigation expansion holds true for maize as well. Area covered under irrigation in major states like Andhra Pradesh and Karnataka are 50 per cent and 36 per cent, respectively. The other major state, Bihar, also suffers from less use of improved seeds. Only two-third of the farmers use hybrids and improved seeds use, and the irrigation coverage is just 65 per cent. Being an input responsive crop, yield levels can be appreciably raised by better seed delivery and irrigation.
Irrigated cotton farms produce higher yield than the un-irrigated farms. The cotton yield margins in irrigated farms are 11 qtl/ha and 6 qtl/ha in Gujarat and Maharashtra, respectively. Sugarcane and wheat crops require special attention as almost entire area is irrigated and entire area under wheat is sown with improved and hybrid seeds. Still, there exist yield differences across and within the states. If these yield gaps are addressed through proper scientific and management interventions; there can be significant gain in output. Research and development organizations need to make concerted efforts to bridge such gaps.
5.3 Role of DiversificationSustained economic growth and increasing urbanisation are fuelling
rapid growth in the demand for high value food commodities like fruits, vegetables, milk, meat, eggs and fish and the producers are responding positively to the emerging demand patterns by altering their production portfolio (Rao et al., 2006; Kumar and Gupta, 2015). Moving on to non-traditional areas for cultivation can provide a remunerative solution for further enhancing the farmers’ income. Agricultural diversification towards high-value crops can potentially increase farm incomes, especially in a country like India where demand for high-value food products has been increasing more quickly than that for staple crops (Birthal et al., 2007). The non-traditional areas may include shifting orientation from cereal dominance to high value crops like horticulture and livestock. Even, as pulses are becoming a high value commodity, shift in favour of pulses can meet the nutritional as well as income security. Studies have established that high value crops generate more revenue, provide employment and premium price to the market participants. Table 12 provides the details of crop productivity (in terms of value of output) across various commodities. It is revealed that fruits and vegetables provide significantly higher revenue over other commodities.
To examine how diversification towards fruits, vegetables and flowers provide gainful returns to the marginal and small farmers, we tried to see how the high value crops (HVC) bring returns over the traditional crops like cereals. Table 13 provides the ratio between the gross revenue earned in fruits, vegetables and flowers over the gross revenue in cereals.

32
Jammu & Kashmir and Himachal Pradesh, due to their agro-ecological typologies, are highly suitable for cultivation of horticultural crops and bring substantial gains in cultivation of HVC. A marginal and small farmer in Himachal Pradesh is able to earn 23 times returns in HVC as compared to cereals. Cultivation of vegetables is profitable (in terms of gross returns) for small and marginal farmers across majority of the states except Haryana and Uttarakhand. As flower cultivation requires sizeable investment and specialized environment and network, its cultivation is found more beneficial among relatively larger farm size categories.
Table 12 : Crop productivity across various crop segments (Value of output per ha of cropped area in Rs @ 2004-05 prices)
Crop Category Crops TE 1982-83 TE 1993-94 TE 2004-05 TE 2014-15
Cereals 8663 12413 14019 17675Paddy 11395 15739 16810 20744Wheat 12039 16370 18125 20441Jowar 4220 5310 4810 5611Bajra 2570 3385 4938 6110Barley 7357 10027 11801 14938Maize 6621 8732 10311 14148
Pulses 7334 8330 8818 11922Gram 9322 10711 11529 14392Pigeonpea 11915 11173 11359 14020Other Pulses 5155 6401 6828 8937
Oilseeds 12886 14147 15638 18486Linseed 5636 6301 8127 12166Sesamum 7360 6998 9251 10822Groundnut 13005 14824 16823 19993Rapeseed & Mustard
16208 14492 17661 20188
Coconut 28935 37648 36320 46319Sugarcane 40685 44707 42092 53616Fibres 9934 14346 16070 26357Kapas 9985 14459 16004 26803Jute 11913 15965 18703 22015Condiments & Spices 27913 34859 49046 81914Fruits & Vegetables 100164 95591 114214 175387Floriculture - 322526 473719 470806Value of Output from Agriculture 15435 19012 24014 31593
Source: Computed by authors.

33
Table 13 : Evidences on diversification: Ratio of gross returns to cereals in high value crops
State Marginal farmers Small farmers All categories
Fruits Vegeta-bles
Fruits Vegeta-bles
Flowers Fruits Vegeta-bles
Flowers
Andhra Pradesh 0.83 0.96 2.21 1.66 1.22 5.71 2.49 2.41
Assam 1.71 1.69 2.46 1.08 0.00 1.24 1.21 0.00
Bihar 1.07 1.91 19.08 2.36 1.70 2.07 1.08 1.55
Chhattisgarh 0.00 2.74 2.38 4.07 0.00 6.74 0.00 0.00
Gujarat 1.93 1.83 1.92 2.60 0.00 2.32 2.01 0.00
Haryana 0.86 2.00 0.00 0.95 0.00 4.90 4.43 0.00
Himachal Pradesh 22.22 3.46 23.61 4.53 4.88 2.61 13.74 7.99
Jammu & Kashmir 28.45 1.36 10.36 1.93 0.33 1.88 0.00 0.33
Jharkhand 12.00 2.92 18.37 3.12 0.00 2.31 0.55 0.00
Karnataka 2.84 6.60 3.18 3.70 3.87 5.30 1.67 5.37
Kerala 2.56 1.65 2.13 1.68 0.00 4.70 0.00 0.42
Madhya Pradesh 0.00 2.53 0.00 2.54 1.84 3.13 2.13 1.68
Maharashtra 2.52 2.25 4.70 3.79 0.00 2.89 1.33 1.43
Odisha 9.89 2.79 2.29 2.58 0.00 8.57 1.76 18.92
Punjab 0.00 0.56 0.00 2.49 0.00 1.13 0.73 0.00
Rajasthan 0.00 1.27 0.00 1.00 0.00 2.22 2.32 0.00
Tamil Nadu 5.09 2.89 5.95 2.34 2.69 10.39 2.49 8.56
Telangana 0.00 2.52 0.66 3.58 0.00 3.22 2.24 0.00
Uttar Pradesh 1.81 1.93 3.14 1.64 1.59 2.97 1.32 6.24
Uttarakhand 3.73 2.14 0.00 0.73 0.00 0.83 0.44 0.00
West Bengal 3.64 2.17 4.41 2.37 12.24 2.87 1.82 6.65
Rest of the states 0.92 0.47 0.89 1.29 3.38 1.96 0.95 5.11
All states 6.08 2.06 4.46 2.05 3.29 3.30 1.86 5.68
Source: Computed by authors.
The diversification strategy requires strong emphasis on regional crop planning and preparation of optimum crop plans for identification of competitive crops which ensure reasonable income, nutrition along with sustainability to particular agro-climatic conditions. Scope also exists to raise farmers’ income by diversifying towards other allied enterprises like forestry rather than depending primarily on crop cultivation (Chand, 2016).
Increase in crop intensity at the same rate as observed in the recent past has the potential to raise farmers’ income by 3.4 per cent in 7 years
34
and 4.9 per cent in ten years; this can turn out to be much higher as the possibilities for taking second crop are brightening (Chand, 2016).
5.4 Impact of Irrigation on Crop Yield and IncomeThe irrigated area in the country increased by 11 per cent between
TE 2006-07 and TE 2013-14. The irrigation intensity, expressed as the ratio of gross irrigated area (GIA) to gross cropped area (GCA), increased by 8 per cent during the above mentioned period. The states like Madhya Pradesh, Chhattisgarh, Karnataka, Bihar, Gujarat and Rajasthan have shown appreciable increase in GIA and thereby increase in irrigation intensity (DAC&FW). The growth performance in Gross State Domestic Product (GSDP) of these states has also been much ahead of other states. Based on the plot level cost of cultivation data for 2013-14, the difference in yield and income levels of farmers were examined for irrigated and unirrigated plots. The details are provided in Table 14.
Rice: In rice, there exists a huge potential to expand irrigation in West Bengal as just half of the rice area is irrigated, and yield differentials are significant. The irrigated fields, on an average, record 8 quintals/ha higher yield than the unirrigated fields. Odisha depicts considerable scope for improvement in yield levels under the unirrigated environment.
Wheat: All the major wheat producing states grow almost the entire crop under irrigation, hence, offer limited scope to expand irrigation. While Madhya Pradesh has 91 per cent area under irrigation; Uttar Pradesh, Punjab, Haryana and Rajasthan have more than 98 per cent area under irrigation. But the yield differentials are high, revealing scope to achieve higher production. The average yield levels in 2013-14 were around 50 quintals/ha in Punjab and Haryana; 30 quintals/ha in Uttar Pradesh and Rajasthan and around 24 quintals/ha and in Madhya Pradesh. Hence, an effort to achieve higher wheat production depends on factors other than irrigation.
Maize: Yield response to irrigation is high in maize. All major maize producing states depict enormous scope to expand irrigated area.
Gram: Madhya Pradesh, Maharashtra and Rajasthan together produce around 70 per cent of total gram production in the country. While Madhya Pradesh and Maharashtra have sizeable irrigation, just one-fourth of the gram area is irrigated in Rajasthan. In terms of yield gains due to irrigation, while Madhya Pradesh offers limited scope, Rajasthan and Maharashtra provide better output. The average gram yield in irrigated farms in Rajasthan and Maharashtra is 5.3 quintals/ha and 2.4 quintals/ha, respectively.
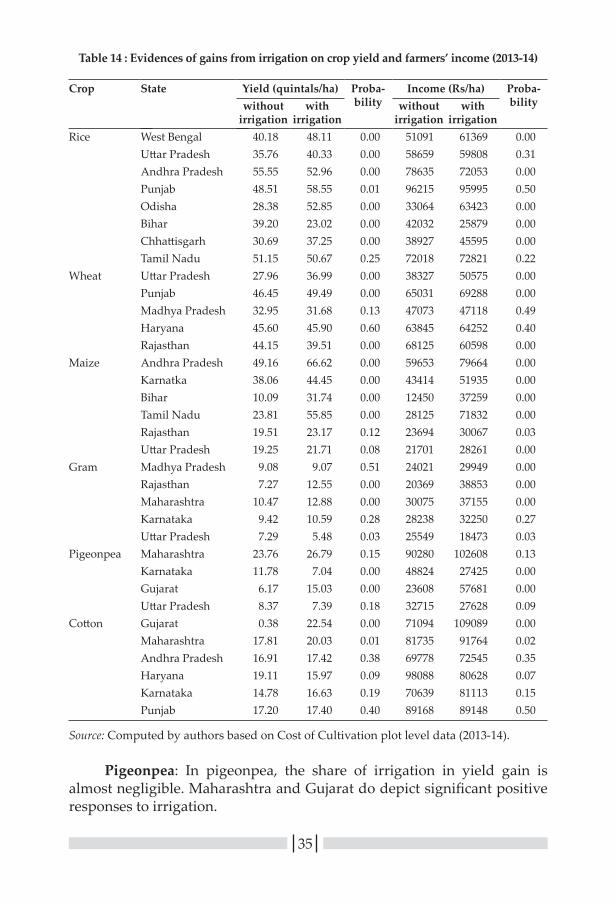
35
Table 14 : Evidences of gains from irrigation on crop yield and farmers’ income (2013-14)
Crop State Yield (quintals/ha) Proba-bility
Income (Rs/ha) Proba-bilitywithout
irrigationwith
irrigationwithout
irrigationwith
irrigationRice West Bengal 40.18 48.11 0.00 51091 61369 0.00
Uttar Pradesh 35.76 40.33 0.00 58659 59808 0.31Andhra Pradesh 55.55 52.96 0.00 78635 72053 0.00Punjab 48.51 58.55 0.01 96215 95995 0.50Odisha 28.38 52.85 0.00 33064 63423 0.00Bihar 39.20 23.02 0.00 42032 25879 0.00Chhattisgarh 30.69 37.25 0.00 38927 45595 0.00Tamil Nadu 51.15 50.67 0.25 72018 72821 0.22
Wheat Uttar Pradesh 27.96 36.99 0.00 38327 50575 0.00Punjab 46.45 49.49 0.00 65031 69288 0.00Madhya Pradesh 32.95 31.68 0.13 47073 47118 0.49Haryana 45.60 45.90 0.60 63845 64252 0.40Rajasthan 44.15 39.51 0.00 68125 60598 0.00
Maize Andhra Pradesh 49.16 66.62 0.00 59653 79664 0.00Karnatka 38.06 44.45 0.00 43414 51935 0.00Bihar 10.09 31.74 0.00 12450 37259 0.00Tamil Nadu 23.81 55.85 0.00 28125 71832 0.00Rajasthan 19.51 23.17 0.12 23694 30067 0.03Uttar Pradesh 19.25 21.71 0.08 21701 28261 0.00
Gram Madhya Pradesh 9.08 9.07 0.51 24021 29949 0.00Rajasthan 7.27 12.55 0.00 20369 38853 0.00Maharashtra 10.47 12.88 0.00 30075 37155 0.00Karnataka 9.42 10.59 0.28 28238 32250 0.27Uttar Pradesh 7.29 5.48 0.03 25549 18473 0.03
Pigeonpea Maharashtra 23.76 26.79 0.15 90280 102608 0.13Karnataka 11.78 7.04 0.00 48824 27425 0.00Gujarat 6.17 15.03 0.00 23608 57681 0.00Uttar Pradesh 8.37 7.39 0.18 32715 27628 0.09
Cotton Gujarat 0.38 22.54 0.00 71094 109089 0.00Maharashtra 17.81 20.03 0.01 81735 91764 0.02Andhra Pradesh 16.91 17.42 0.38 69778 72545 0.35Haryana 19.11 15.97 0.09 98088 80628 0.07Karnataka 14.78 16.63 0.19 70639 81113 0.15Punjab 17.20 17.40 0.40 89168 89148 0.50
Source: Computed by authors based on Cost of Cultivation plot level data (2013-14).
Pigeonpea: In pigeonpea, the share of irrigation in yield gain is almost negligible. Maharashtra and Gujarat do depict significant positive responses to irrigation.

36
Cotton: Major share of cotton comes from Gujarat, Maharashtra and Andhra Pradesh. While around 60 per cent of area under cotton is irrigated in Gujarat, it is just 3 per cent in Maharashtra. While positive yield differentials on irrigated plots are small in cotton, expanding the irrigation in Maharashtra on a larger scale could help in achieving higher production. Andhra Pradesh has no major yield difference between irrigated and non-irrigated cotton, but the difference is high in Gujarat. The expansion of irrigation could be a better choice for Gujarat, and the strategy could be combined with other yield improving factors for Maharashtra.
Considering the potential of micro-irrigation in saving of water and nutrients along with productivity enhancement, a lot of emphasis is being given to micro-irrigation in the country. Micro-irrigation can bring substantial increase in productivity and also result in water saving (GoI, 2009; 2014). According to the report of Task Force on Irrigation, an increase in productivity on adoption of micro-irrigation ranged from 3 per cent each in cow pea and cabbage to 27 per cent in gram. At the same time, micro-irrigation resulted in water saving of 16 per cent in lucerne to 56 per cent each in bajra and barley. According to another study, only 9.2 per cent of potential area of 42.23 million hectares is currently covered under micro-irrigation (Palanisami and Raman, 2012). Therefore, strategies for enhancing irrigation coverage would be beneficial in enhancing the productivity and income of the farm household and need special attention. Other schemes recently started like soil health card will also bring change in output through qualitative and quantitative growth in output.

37
6Chapter
Food Processing and Post-Harvest Management
6.1 Food Processing in India Even after holding important position in the production of many
agricultural commodities like fruits, vegetables, dairy products; the country still lags in food processing behind many other agriculturally important nations. Out of the total production of fruits and vegetables, wastage and losses account for 20 to 22 per cent; only 2 per cent of vegetable production and 4 per cent of fruit production are being processed, whereas the extent of fruit processing is very high in some countries such as Brazil (70 per cent), Malaysia (83 per cent), Philippines (78 per cent) and Thailand (30 per cent) (FAO, 2014).
Overall manufacturing sector in the country has shown impressive growth performance. However, the performance of food processing has not been commensurate with this performance. For corporate sector, the food processing comprises 7-8 per cent share in the gross value added (GVA) manufacturing; the share is found higher in household sector though household sector contributes only 20-25 per cent of the GVA food processing (Table 15). Food processing takes place in the corporate as well as household sector. The added gains from food processing can be arrived at by changing the orientation of farming community and households towards small scale food processing.
This requires that farmers are provided facilitating environment in terms of “skills” and “schemes”. There is need to inculcate entrepreneurial skills in the farm households to process regionally important products, which have greater demand outside the region. Skills alone will not bring desired changes in income, farmers need to be provided support to create infrastructural capacity for meeting their requirement. This will be kind of “Essential Condition” as most of the farmers are small and marginal. Specific policy linked to consolidation of produce and then changing its forms would facilitate small scale operations. Women self-help groups

38
need to be provided with marketing support. This will not only enhance the income from non-farm source but also ensure income security to combat with any exigency in the primary activity, i.e. farming. Trade oriented value addition and processing, considering the requirement of foreign customers, will provide premium price to the farmers and enhance their incomes.
Table 15 : Performance and contribution of food processing sector
Unit 2011-12 2012-13 2013-14 2014-15 Growth (2011-15)
Corporate sector
GVA manufacturing (1) Rs Crore @ 2011-12 prices
1230439 1295964 1360746 1441832 5.38
GVA Manufacture of food products, beverages & tobacco (2)
137024 126856 125707 132535 -1.08
GVA Food processing (3) 93799 86198 91117 97009 1.58
Share of 2 to 1 % 11.1 9.8 9.2 9.2
Share of 3 to 1 % 7.6 6.7 6.7 6.7
Household sector
GVA manufacturing (1) Rs Crore @ 2011-12 prices
179546 199304 218975 225236 8.05
GVA Manufacture of food products, beverages & tobacco (2)
38255 37702 38955 40759 2.25
GVA Food processing (3) 29263 26328 28763 30498 2.15
Share of 2 to 1 % 21.3 18.9 17.8 18.1
Share of 3 to 1 % 16.30 13.21 13.14 13.54
Source: National Accounts Statistics (2016).
Food processing usually takes place in the form of grain processing, manufacturing of animal feed, dairy processing, meat, fish fruits, vegetables and oil processing (Figure 3). Grain milling and processing along with other food products account for the major chunk of processing in both household and corporate sector. Extent of horticulture and livestock processing remains quite low in both corporate as well as household sector.

39
Source: National Accounts Statistics (2016).
It is emerging that livestock and horticulture are the two major sub-sectors which can drive maximum potential growth required for doubling the farmers’ incomes. Horticulture sector contributed around 30 per cent in the value of output of agriculture sector in the country in the year 2013-14. However, the growth (in GVA during 2011-2015) in processing of livestock (meat etc.) and horticultural sector has significantly declined (Figure 4). Stringent efforts need to be made to promote the value-addition of livestock (including dairy) and horticultural products.
Figure 4 : Growth in value added across various components of food processing in household and corporate sector (2011-15)
Figure 3 : Components of food processing (Value added in Rs crore at 2011-12 prices)
Source: Computed by authors.
The employment and un-employment survey data of NSSO (2011-12) were examined to understand the status of workers engaged in food manufacturing. The employment data were analysed at 5-digit NIC-
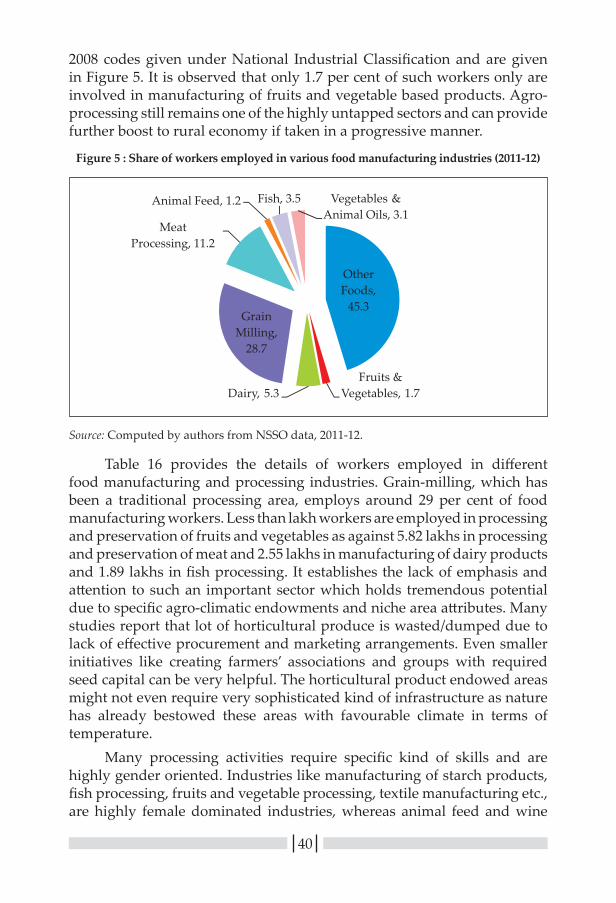
40
2008 codes given under National Industrial Classification and are given in Figure 5. It is observed that only 1.7 per cent of such workers only are involved in manufacturing of fruits and vegetable based products. Agro-processing still remains one of the highly untapped sectors and can provide further boost to rural economy if taken in a progressive manner.
Figure 5 : Share of workers employed in various food manufacturing industries (2011-12)
Source: Computed by authors from NSSO data, 2011-12.
Table 16 provides the details of workers employed in different food manufacturing and processing industries. Grain-milling, which has been a traditional processing area, employs around 29 per cent of food manufacturing workers. Less than lakh workers are employed in processing and preservation of fruits and vegetables as against 5.82 lakhs in processing and preservation of meat and 2.55 lakhs in manufacturing of dairy products and 1.89 lakhs in fish processing. It establishes the lack of emphasis and attention to such an important sector which holds tremendous potential due to specific agro-climatic endowments and niche area attributes. Many studies report that lot of horticultural produce is wasted/dumped due to lack of effective procurement and marketing arrangements. Even smaller initiatives like creating farmers’ associations and groups with required seed capital can be very helpful. The horticultural product endowed areas might not even require very sophisticated kind of infrastructure as nature has already bestowed these areas with favourable climate in terms of temperature.
Many processing activities require specific kind of skills and are highly gender oriented. Industries like manufacturing of starch products, fish processing, fruits and vegetable processing, textile manufacturing etc., are highly female dominated industries, whereas animal feed and wine

41
industries are completely in the hands of male workers. Thus, customised financial support and proper marketing arrangements need to be ensured for sustenance and growth of such female dominant industries. The extent of female participation is around 10 per cent in dairy processing which may be further enhanced. Many self-help groups (SHGs) are emerging in dairy processing in different areas which may be scaled-up with proper policy and infrastructure and institutional support. Saxena and Srivastava (2012) reported that proper identification of markets and marketing of dairy products remain the major challenges for female SHGs based on case study of Anmol Women Milk Cooperative in Haryana.
6.2 Reducing Post-Harvest LossesPost-harvest management in crops, livestock and fisheries is highly
crucial as it is responsible for maintaining quality and quantity of the produce. It becomes further critical in case of perishable commodities. A recent estimate has been given that the country lost the output worth approximately Rs 92,651 crore during 2012-13 at 2014 prices (Jha et al., 2015). Box 2 provides the decomposition of these losses across commodities. Such losses basically happen on account of ineffective post-harvest management at critical stages of value-chains. Fruits, vegetables and livestock account for about 54 per cent of these losses. Such losses need to be saved through effective post-harvest management, improved marketing and value chain networks.
Box 2 : Extent of post-harvest losses across commodity groups
Crop/commodity
Monetary losses (production of 2012-13
and prices at 2014, Rs crore)
Major crops/segments in term of monetary losses (%)
Cereals 20698 Paddy (50), Wheat (38 ), Others (12)Pulses 3877 Chickpea (63), Pigeonpea (25), Others (12)Oilseeds 8278 Soybean (65), Mustard (18), Others (16)Fruits 16644 Mango (43), Banana (23), Citrus (9),
Apple (8), Others (16)Vegetables 14842 Potato (34), Tomato (25), Onion (16),
Cauliflower (8), Others (18)Plantation crops 9325 Sugarcane (60), Coconut (22), Others (18)Livestock Produce 18987 Milk (23), Marine fish (23), Poultry meat
(21), Inland fish (20), Others (13)
Source: Jha et al. (2015).
Mission for Integrated Development of Horticulture (MIDH) is a Centrally Sponsored Scheme for the holistic growth of the horticulture

42
Tabl
e 16
: N
umbe
r and
sha
re o
f per
sons
em
ploy
ed in
var
ious
food
and
man
ufac
turi
ng in
dust
ries
in In
dia,
201
1-12
Proc
essi
ng a
nd p
rese
rvin
g of
m
eat
Proc
essi
ng a
nd p
rese
rvin
g of
fish
, cr
usta
cean
s an
d m
ollu
scs
and
prod
ucts
ther
eof
Proc
essi
ng a
nd p
rese
rvin
g of
frui
t an
d ve
geta
bles
Man
ufac
ture
of v
eget
able
and
an
imal
oils
and
fats
5.82
Lak
h w
orke
rs e
mpl
oyed
1.89
Lak
h w
orke
rs e
mpl
oyed
0.96
Lak
h w
orke
rs e
mpl
oyed
1.64
Lak
h w
orke
rs e
mpl
oyed
Poul
try
and
othe
r sl
augh
teri
ng, p
repa
ratio
n44
.8Pr
oces
sing
and
can
ning
of
fish
39.7
Man
ufac
ture
of p
ickl
es,
chut
ney
etc.
36.9
Vege
tabl
e oi
ls a
nd fa
ts
excl
udin
g co
rn o
il64
.1
Mutt
on-s
laug
hter
ing,
pr
epar
atio
n38
.7Su
n-dr
ying
of fi
sh39
.4M
anuf
actu
re o
f fru
it or
ve
geta
ble
juic
es a
nd th
eir
conc
entr
ates
, squ
ashe
s an
d po
wde
r
29.4
Hyd
roge
nate
d oi
l and
va
nasp
ati g
hee
17.9
Prod
uctio
n, p
roce
ssin
g an
d pr
eser
ving
of o
ther
mea
t and
m
eat p
rodu
cts
8.4
Proc
essi
ng a
nd p
rese
rvin
g of
fis
h cr
usta
cean
and
sim
ilar
food
s
14.2
Pres
erva
tion
of fr
uit a
nd
vege
tabl
es
22.4
Non
-def
atted
flou
r or m
eals
of
oils
eeds
, oil
nuts
or
kern
els
9.1
Pork
-sla
ught
erin
g,
prep
arat
ion
4.5
Radi
atio
n pr
eser
vatio
n of
fis
h an
d si
mila
r foo
d4.
5M
anuf
actu
re o
f sau
ces,
jam
s,
jelli
es a
nd m
arm
alad
es6.
7O
ther
veg
etab
le o
il, a
nim
al
oil a
nd fa
ts
4.3
Beef
-sla
ught
erin
g,
prep
arat
ion
3.1
Prod
uctio
n, p
roce
ssin
g an
d pr
eser
vatio
n of
oth
er fi
sh
prod
ucts
2.2
Can
ning
of f
ruits
and
ve
geta
bles
3.9
Edib
le a
nim
al o
ils a
nd fa
ts3.
2
othe
rs0.
5ot
hers
0.7
othe
rs1.
5

43
Man
ufac
ture
of d
airy
pr
oduc
ts
Man
ufac
ture
of g
rain
mill
pr
oduc
ts, s
tarc
hes
and
star
ch p
rodu
cts
Man
ufac
ture
of o
ther
food
pr
oduc
ts
Man
ufac
ture
of p
repa
red
anim
al fe
eds
2.55
Lak
h w
orke
rs e
mpl
oyed
15.1
2 La
kh w
orke
rs em
ploy
ed25
Lak
h w
orke
rs e
mpl
oyed
0.61
Lak
h w
orke
rs e
mpl
oyed
Past
euri
zed
milk
35
.5Fl
our m
illin
g41
.8Sw
eetm
eats
incl
udin
g da
iry
base
d sw
eetm
eats
19.0
Catt
le fe
ed64
.4
Oth
er d
airy
pro
duct
s 21
.7Ri
ce m
illin
g34
.8M
anuf
actu
re o
r refi
ning
of
sug
ar (s
ucro
se) f
rom
su
garc
ane
11.8
Poul
try
feed
35.6
Baby
milk
food
s14
.6C
erea
l bre
akfa
st fo
ods
obta
ined
by
roas
ting
or
swel
ling
cere
al g
rain
s
11.0
Bisc
uits
, cak
es, p
astr
ies,
ru
sks
etc.
9.9
Cre
am, b
utter
, che
ese,
cur
d,
ghee
, kho
ya e
tc.
12.5
Dal
(pul
ses)
mill
ing
5.0
Proc
essi
ng o
f edi
ble
nuts
9.6
Ice-
crea
m, k
ulfi
etc.
12.3
Oth
er g
rain
mill
ing
and
proc
essi
ng
3.1
Papa
ds, a
ppal
am a
nd s
imila
r fo
od p
rodu
cts
8.7
Milk
-pow
der,
ice-
crea
m
pow
der a
nd c
onde
nsed
milk
ex
cept
bab
y m
ilk fo
od
3.3
Gra
in m
illin
g ot
her t
han
whe
at, r
ice
and
dal
2.0
Proc
essi
ng a
nd b
lend
ing
of
tea
incl
udin
g m
anuf
actu
re o
f in
stan
t tea
8.0
othe
rs2.
3O
ther
bak
ery
prod
ucts
7.
0
Brea
d6.
4
Prep
ared
mea
ls a
nd d
ishe
s3.
5
Oth
er p
roce
ssed
pro
duct
s16
.2
Sour
ce: C
ompu
ted
by a
utho
rs.
Not
e: Fi
gure
s in
par
enth
eses
are
per
cent
ages
to th
e w
orke
rs e
mpl
oyed
to th
e to
tal w
orke
rs in
the
resp
ectiv
e in
dust
ry.
Tabl
e 16
: Con
tinue
d

44
sector and it aims at regionally differentiated strategies in accordance with comparative advantage of various agro-climatic regions, encourages aggregation of farmers, enhances horticulture production, augments farmers’ income and strengthens nutritional security along with skill development and employment generation in horticulture and post-harvest management (Government of India, 2014). Along with this, the schemes like Rural Godown Scheme aim to facilitate storage of cereal crops by building storage capacity at farmers’ doors. Ensuring public-private partnership can provide further boost to effective post-harvest management especially in rural areas.

45
7Chapter
Commodity Prices, Price Volatility and Farmers’ Gains
7.1 Price Behaviour of Agricultural CommoditiesRecently, the prices of many agricultural commodities have shown
a high degree of volatility. There is enough evidence to show that prices of agricultural commodities are more volatile than those of the non-farm commodities (Chand and Parappurathu, 2011). The issue of high price volatility in agricultural commodities in domestic as well as international market has assumed critical importance. Figure 6 depicts the trends in wholesale price index (WPI) for various food commodities. The changes have been depicted on the basis of monthly series of WPI. Fruits and vegetables seem to exhibit highest price volatility among all agricultural commodities. Some commodities in this category, like onion, have created crisis situation in the economy many a times due to the extreme volatility in their prices. Onion is a highly sensitive commodity in fruits and vegetables category, whose WPI has touched the highest peaks of 619 in January, 2011 and 846 in September, 2013 and 782.8 in September, 2015. Year 2017 has also witnessed some price aberrations in onion.
Figure 6 : Trends in wholesale price indices of food commodities
Source: Office of the Economic Adviser.

46
7.2 Price Realisation and Farm Size It has been established that prices will be one of the major sources
of growth even if the status quo in the production is maintained. It does not imply here that prices need to be increased essentially; it implies that we need to improve farmers’ share in consumer price and need to minimize during the chain costs, margins and inefficiencies. Table 17 and Table 18 provide the details of price realisation by the farmers for selected crops based on the SAS of Agricultural Households. We also examined whether the price realisation varies across farm size for major agencies
Table 17 : Prices received for major kharif crops, 2012 (Rs/kg)
Agency Category Paddy Jowar Bajra Maize Arhar Urad Moong Sugar- cane
Cotton
Local Private
Marginal 12 13 11 12 36 29 37 2 37
Small 11 4 10 11 38 28 38 3 39
Semi-medium 14 9 11 12 31 28 41 2 39
Medium 14 9 11 12 36 27 34 3 40
Large 11 11 12 35 40 3 37
Mandi Marginal 13 6 10 12 37 28 38 3 37
Small 13 13 11 12 36 29 35 2 40
Semi-medium 16 12 11 12 37 30 32 3 39
Medium 14 14 10 12 34 28 38 4 40
Large 15 12 13 12 38 27 44 3 37
Input dealers
Marginal 11 13 10 12 34 29 46 2 37
Small 12 12 11 13 33 29 47 2 41
Semi-medium 13 14 11 12 33 30 40 2 37
Medium 12 13 12 12 32 28 53 2 40
Large 14 - 10 11 - 26 - 2 38
Cooperative & Government Agency
Marginal 13 20 15 - - 25 - 2 37
Small 14 24 13 13 40 12 50 3 36
Semi-medium 13 12 11 12 - 32 27 2 38
Medium 13 14 13 13 36 - 31 5 37
Large 14 15 - 13 - - - - 42
Processors Marginal 12 - - 13 - - - 3 37
Small 13 - - 14 - - - 2 39
Semi-medium 13 - - 11 - - - 3 38
Medium 14 - - - - - 3 34
Large 15 - - - - - 3 38
Source: Computed from NSSS Unit Record Data on Situation Assessment Survey (2014).

47
to which the produce is sold. In general, medium and large farmers received higher price as compared to relatively marginal farm size categories. The major quantity of output at farm level flows through the local private and mandi. It was interesting to note that marginal and small farmers received comparatively higher price from cooperative and government agency in both season crops. The prices show minor difference across farm sizes in case of paddy, maize and sugarcane. However, pulses depict large variation in prices across farm categories, where medium farmers are receiving a high price of Rs 53 from input dealer to semi-medium receiving Rs 27 from cooperative and government agency from moong crop.
Table 18 : Prices received for major rabi crops, 2013 (Rs/kg)
Agency Category Jowar Wheat Barley Gram Lentil Rapeseed/Mustard
Local Private Marginal 20 13 10 28 44 29
Small 14 13 12 30 41 30
Semi-medium 20 13 12 31 41 31
Medium 15 13 10 33 43 30
Large 12 13 11 35 39 29
Mandi Marginal 14 14 13 28 33 31
Small 14 14 10 30 35 31
Semi-medium 15 14 12 30 37 31
Medium 17 14 11 31 33 31
Large 14 14 - 28 33 31
Input dealers Marginal 25 12 - 30 46 29
Small 14 12 13 30 35 30
Semi-medium 14 13 13 29 34 31
Medium 16 14 11 31 35 31
Large - 14 - 38 - 29
Cooperative & Government Agency
Marginal - 14 - 30 - -
Small - 14 - 28 - 30
Semi-medium - 14 - - - -
Medium - 14 - 32 - 32
Large - 14 - - - -
Processors Marginal - 16 - - 30 20
Small - 13 - - - 28
Semi-medium - 11 - - - 20
Medium - 14 - - - 28
Large - - - - - -
Source: Computed from NSSS Unit Record Data on Situation Assessment Survey (2014).

48
7.3 Farmers’ Share in Consumer Price: Selected Cases The studies have reported that farmers’ share in consumer price
remains very low, this share has been reported to be especially very low in case of horticultural commodities. A case study reported that farmers’ share in consumer price varied from 25.5 per cent in apple, 39.9 per cent in banana, 41.1 per cent in onion, 41.7 per cent in tomato, 43.2 per cent in mango and 58.6 per cent in potato in Ahmedabad market during 2004 (Table 19). Producers stand to gain when improved marketing efficiency increases demand and prices for their products (Landes, 2010). Bhat and Aara (2012) reported that farmers’ share is around 50 per cent in case of Delicious and American Apple (Channel: Producer-Commission Agent-Wholesaler Retailer-Consumer) except for Maharaji apple which is 35 per cent. The farmers’ share are quite close in a different channels ranging from 48-51 per cent (Channel: Producer-Pre-harvest Contractor-wholesaler-Retailer-Consumer) for all three categories of apple.
Table 19 : Marketing cost, marketing margins and farmers’ share for major fruits and vegetables in Ahmedabad and Chennai markets
Commodity Ahmedabad Chennai
Marketing Cost
Marketing Margin
Farmer’s Share
Marketing Cost
Marketing Margin
Farmer’s Share
Vegetables
Potato 8.4 32.9 58.6 28.9 9.7 61.4
Onion 18.3 40.6 41.1 25.4 20.6 54.0
Tomato 8.0 50.3 41.7 17.3 34.5 48.2
Cabbage 11.1 43.2 45.8 42.9 16.7 40.4
Cauliflower 5.5 37.0 68.5 49.3 9.0 41.8
Brinjal 9.1 48.1 42.9 29.7 22.1 48.3
Lady’s finger 7.5 36.3 56.1 27.0 34.3 38.7
Fruits
Mango 17.9 38.9 43.2 18.7 13.7 67.6
Apple 5.0 69.4 25.5 37.5 21.8 40.8
Sapota 13.6 33.1 53.2 27.8 11.9 60.3
Banana 14.5 45.6 39.9 32.9 9.6 57.5
Sweet Orange 11.0 54.5 34.5 15.8 35.6 48.6
Pineapple 11.2 46.1 42.7 19.9 21.0 59.2
Pomegranate 11.7 48.5 39.8 23.2 33.8 43.0
Source: Gandhi and Namboodiri (2004).

49
As has been established, output growth only will not drive sufficient growth for farmers; rather it will be through efficient marketing arrangements that the income of farmers would be enhanced. Many innovative marketing arrangements have shown that farmers’ share can be magnified and the marketing costs and margins of the chain can be handled efficiently. For gathering the temporal and spatial evidence of how the price realization across various commodities and regions, we conducted the meta-analysis of selected studies conducted at regional level and published in various journals. The summary results are presented in Box 3. The price realization to farmers, expressed as share in consumer rupee, indicates that it is lowest for fruits and vegetables after pulses. It varies according to the marketing channel selected even within a given geography for the selected commodity.
It is surprising to note that the farmers’ share in onion remains around 43-44 per cent despite being the highest and quality producer of the onion in the country. Banana trading seems to be efficient as only 15-18 per cent of the consumer rupee is wiped away during marketing.
7.4 Participation of Paddy Farmers in Minimum Support Price Scheme (MSPS): Inclusiveness across Farm CategoriesThe idea behind MSP was to give guaranteed prices and assured
market to the farmers and save them from the price fluctuations. The volatile and unstable behaviour of market prices in agricultural produce in India tends to create a situation of uncertainty in the mind of farmers. This calls for the assurance of remunerative and stable price environment for farmers and price policy in the form of minimum support price announced by the government is one of the initiatives in this direction. The efficacy of any program depends upon its powerful implementation and its widespread coverage. The successful implementation of any scheme can be achieved only if the targeted population is aware and participates in it.
Table 20 presents the percentage of aware farmers participating in MSPS. It was worked out that total 16 per cent farmers are aware of MSP for paddy crop and out of that 16 per cent only 3.8 per cent farmers participated in the sale of paddy crop under MSPS. This may be due to two reasons that either the market prices are lucrative or the procurement process is not fully supportive like the procurement agency is not available. Across the farm size, medium and large farmers are among the highest participating in MSPS, whereas the proportion of marginal farmers selling the produce at MSP is lowest. In Uttarakhand half of the farmers are selling their paddy produce through MSPS, whereas overall participation was highest among Chhattisgarh, Punjab and Haryana farmers.

50
Box
3 : F
arm
ers’
sha
re fo
r var
ious
com
mod
ities
, yea
rs, c
hann
els
and
stat
es (A
s pe
r cen
t of c
onsu
mer
pri
ce)
Sour
ce: D
raw
n fr
om v
ario
us s
tudi
es o
n co
mm
odity
mar
ketin
g ch
anne
ls a
nd p
rice
spr
ead.
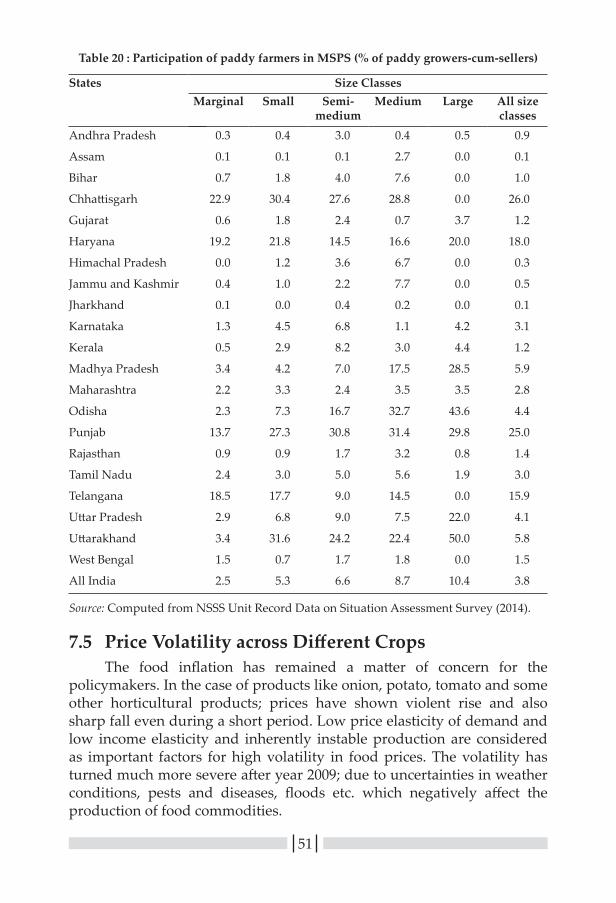
51
Table 20 : Participation of paddy farmers in MSPS (% of paddy growers-cum-sellers)
States Size ClassesMarginal Small Semi-
mediumMedium Large All size
classesAndhra Pradesh 0.3 0.4 3.0 0.4 0.5 0.9
Assam 0.1 0.1 0.1 2.7 0.0 0.1
Bihar 0.7 1.8 4.0 7.6 0.0 1.0
Chhattisgarh 22.9 30.4 27.6 28.8 0.0 26.0
Gujarat 0.6 1.8 2.4 0.7 3.7 1.2
Haryana 19.2 21.8 14.5 16.6 20.0 18.0
Himachal Pradesh 0.0 1.2 3.6 6.7 0.0 0.3
Jammu and Kashmir 0.4 1.0 2.2 7.7 0.0 0.5
Jharkhand 0.1 0.0 0.4 0.2 0.0 0.1
Karnataka 1.3 4.5 6.8 1.1 4.2 3.1
Kerala 0.5 2.9 8.2 3.0 4.4 1.2
Madhya Pradesh 3.4 4.2 7.0 17.5 28.5 5.9
Maharashtra 2.2 3.3 2.4 3.5 3.5 2.8
Odisha 2.3 7.3 16.7 32.7 43.6 4.4
Punjab 13.7 27.3 30.8 31.4 29.8 25.0
Rajasthan 0.9 0.9 1.7 3.2 0.8 1.4
Tamil Nadu 2.4 3.0 5.0 5.6 1.9 3.0
Telangana 18.5 17.7 9.0 14.5 0.0 15.9
Uttar Pradesh 2.9 6.8 9.0 7.5 22.0 4.1
Uttarakhand 3.4 31.6 24.2 22.4 50.0 5.8
West Bengal 1.5 0.7 1.7 1.8 0.0 1.5
All India 2.5 5.3 6.6 8.7 10.4 3.8
Source: Computed from NSSS Unit Record Data on Situation Assessment Survey (2014).
7.5 Price Volatility across Different CropsThe food inflation has remained a matter of concern for the
policymakers. In the case of products like onion, potato, tomato and some other horticultural products; prices have shown violent rise and also sharp fall even during a short period. Low price elasticity of demand and low income elasticity and inherently instable production are considered as important factors for high volatility in food prices. The volatility has turned much more severe after year 2009; due to uncertainties in weather conditions, pests and diseases, floods etc. which negatively affect the production of food commodities.

52
Table 21 provides the extent of price volatility across various commodities based on the wholesale price index (WPI) of selected commodities. We have tried to compare the volatility among the selected commodities based on whether there exists the MSP price support scheme or not. The volatility remains low in commodities where, support exists in terms of MSP and organized mechanisms exist for procurement and logistics. On the other hand, instability in prices of fruits and vegetables remains a matter of concern. This is due to the nature of commodities in terms of their perishability and further no price support scheme exists for these commodities. Farmers find it difficult to decide a gainful cropping plan as prices go sky rocketing one year and suddenly dump next year. Such volatility in prices needs to be addressed through proper market information and intelligence efforts. Also, the role of procurement agencies like NAFED is also very important to provide assured sale to the farmers for their produce at reasonable prices. Effective utilisation of the Price Stabilisation Fund for monitoring and Surveillance of price volatility is the need of the hour. Increased investment and enhancement of storage capacity at farmers’ field will be very helpful in increasing the price realization and will be beneficial for both the producers and consumers.
Table 21 : Extent of volatility across commodities
Commodity Mean WPI Range Instability Index (%)
2005-10 2011-16 2005-16 2005-10 2011-16 2005-10 2011-16 2005-16
Under Price Support Operations
Rice 131.1 216.6 173.9 101-171 167-255 4.0 5.3 9.4
Wheat 138.6 204.4 171.5 96-182 164-252 4.0 4.5 8.0
Maize 134.7 241.2 187.9 104-172 175-297 3.0 5.5 10.9
Gram 143.4 254.7 199.0 98-183 152-582 11.2 28.5 15.8
Pigeonpea 144.9 250.9 197.9 89-263 176-421 14.0 16.4 16.0
Groundnut 131.4 227.4 179.4 90-178 154-288 7.3 11.2 13.7
Soybean 108.3 198.7 153.5 67-153 125-268 12.7 14.6 15.4
Cotton 121.5 216.3 168.9 82-220 177-306 10.6 11.2 14.9
No Price Support
Potato 139.4 206.7 173.0 72-304 99-427 31.5 34.4 16.4
Onion 165.6 325.9 245.8 75-469 134-846 33.7 49.3 25.3
Banana 128.9 242.1 185.5 93-178 150-364 6.1 10.0 15.5
Source : Computed by authors.

53
7.6 How Volatility Wipe away the Gains from Farmers?The country has witnessed two major onion price shocks during the
last five years, which have affected the producers as well as consumers. Volatility in onion prices continues to be a matter of concern not only in domestic markets but also for export market. It is important to understand the production-price linkages to understand the recurring price shocks in the country. As evident, onion production has witnessed profound changes during the recent years. However, the growth in production reveals that previous year’s growth during the crisis preceding years plays a determining role. This becomes evident from close examination of the sequence of change in production, market arrival and prices during the crisis year and in the year preceding the price shocks using the evidence from the state of Maharashtra (Box 4), which is the largest onion producing state and market leader for onion.
A very strong and signifying association is seen between the production in year T and market arrivals in the state in the year T+1. The production decline in any year was followed by the decline in market arrivals in the subsequent years. The consequent change was observed in prices. In year 2012-13, the production declined by 32 per cent leading to 238 per cent increase in prices in 2013-14. Following this, acreage increased by 80 per cent next year and production increased by 26 per cent; however, prices declined by about 43 per cent. This led to decline in the gross revenue for onion declined by 28 per cent. The similar cycle repeated during the next two years. An extreme situation was observed in 2016-17 followed by the hike in prices in 2015, when increase in production by 22 per cent led to an extreme decline in prices by 61 per cent. This led to decline in gross revenue by 53 per cent. The traders and farmers in Nashik region revealed that production decline not only resulted in the decline in market arrivals but also the quality as the production shock resulted mainly due to untimely rains and thunderstorms. This further affected the storability of rabi onion and reduced the shelf life of the crop.
The farmers suffered on two counts: a) the decline in gross income from onion due to decline in its prices, b) the loss also occurred due to shift in acreage from the other competitive crop which otherwise would have provided remunerative returns to farmers. Thus, the price instability needs to be checked and minimised through suitable interventions to ensure stable and required returns to the farmers. Effective procurement strategies by NAFED and proper use of Price Stabilisation Fund would be useful in this regard.
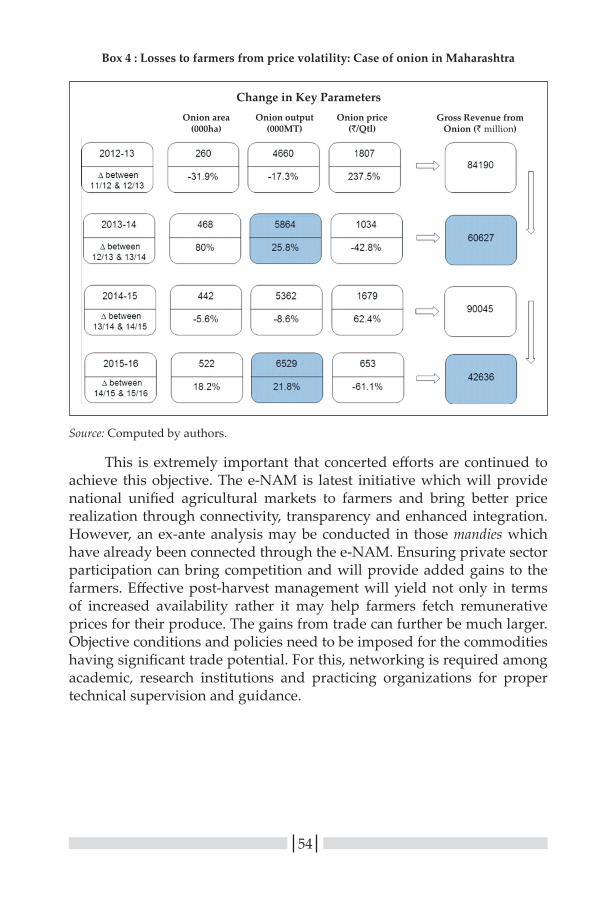
54
Box 4 : Losses to farmers from price volatility: Case of onion in Maharashtra
Source: Computed by authors.
This is extremely important that concerted efforts are continued to achieve this objective. The e-NAM is latest initiative which will provide national unified agricultural markets to farmers and bring better price realization through connectivity, transparency and enhanced integration. However, an ex-ante analysis may be conducted in those mandies which have already been connected through the e-NAM. Ensuring private sector participation can bring competition and will provide added gains to the farmers. Effective post-harvest management will yield not only in terms of increased availability rather it may help farmers fetch remunerative prices for their produce. The gains from trade can further be much larger. Objective conditions and policies need to be imposed for the commodities having significant trade potential. For this, networking is required among academic, research institutions and practicing organizations for proper technical supervision and guidance.

55
8Chapter
Contribution of Agricultural Research and Development 1
ICAR Institutes developed a number of cost-effective technologies, techniques and products, not only to enhance the productivity of various crops and commodities, but also the quality of produce, for enabling remunerative agriculture and enhancing farmers’ incomes.
8.1 Varietal Development Role of ICAR is extremely crucial in developing and spreading the
use of better yielding varieties suitable for different typologies which can contribute to farmers’ incomes. Besides, the development of improved varieties/hybrids of food crops and their cultivation are central to increased farm production and consequently national food and nutritional security. During 2015-16, high-yielding varieties of cereals (21), oilseeds (16), pulses (8), forage crops (6) and commercial crop (3) were released from ICAR institutions for cultivation in different production ecologies of the country. Biofortified rice variety CR Dhan 310 was commercialized successfully in the Indo-Gangetic Plains belt and Swarna Shreya, a new rice variety for drought–prone conditions was released. To ensure a faster spread to farmers’ fields, 978, 17562, 12847, 14000, and 3418 tonnes of breeder, foundation, certified, truthfully labelled seed and planting material, respectively, were produced.
Pusa Basmati 1121: Pusa basmati 1121 was released in the year 2003 and recommended for Punjab, Haryana, western Uttar Pradesh, and Uttarakhand along with other Basmati growing areas. The crop has the productivity of 4.0-4.5 t/ha and matures in 140-145 days, a fortnight earlier than Taraori basmati. The grain is longer (8 mm) with cooked grain length of approximately 20 mm and it is better in cooking compared to that of Taraori basmati. It requires low input and provides high yield with better quality rice for export.
1 This section has been drawn from the ICAR Annual Report and the Annual Reports of respective ICAR Institutes developing the technologies.
56
8.2 Integrated Farming SolutionsIntegrated farming is one of the solutions for enhancing the
income and gains to farmers. An integrated farming system (1 ha) model comprising cropping systems (0.52 ha) + horticulture (0.32 ha) + dairy including bio-gas and vermi-compost unit (0.08 ha) + fish cum poultry (0.1 ha) + mushroom developed in western Himalayas, provided round the year improved production (21.52 tonnes REY (rice equivalent yield)/year), profit (3.06 lakh/year) and employment (731 man days/year).
By rice-wheat-mungbean or rice-potato-mungbean cropping system, an increase of 12-15% in total productivity and a net profit of Rs. 15000 to 22000/ha can be obtained as compared to rice-wheat cropping system. Cotton-wheat, pigeonpea-wheat, maize-vegetable pea/potato-sunflower, soybean-vegetable pea/potato sunflower and groundnut-wheat-mungbean cropping systems are economically acceptable and environmentally sustainable option for rice-wheat system. African mustard/Indian mustard based intercropping systems with potato (1:3 replacement series), wheat (1:4 or 1:6), linseed (1:6), and chickpea (1:4 or 2:8) are more productive and profitable than their sole stand. African mustard at 90 cm + 2 rows of peas, coriander, fenugreek or radish are more productive and remunerative compared to their sole stand. Horticulture will also assure substantial gains to the farmers. Nutrient management schedule for organic production of Grand Naine and Nendran banana; the technology for production of iron-fortified oyster mushrooms (Hypsizygus ulmarius); fertilizer adjustment equation for targeted yield (690–1140 kg/ha) of Appangala 1 and Green Gold varieties of cardamom and integrated nutrient management schedule with improved corn yield of turmeric variety Sudarsana, were developed. An integrated cropping system having coconut + cocoa + banana + pineapple with net income of 3.77 lakh/ha was developed and successfully demonstrated at Aliyarnagar, Tamil Nadu.
8.3 Protected CultivationProtected cultivation is a cropping technique for growing horticultural
crops under protective structures to shield them from pests and weather for assured, climate-resilient and enhanced production of quality products. Protected cultivation can be undertaken in the following structures:
Naturally ventilated polyhouse technology: This is a special structure made of G.I. pipes, insect proof nets and transparent plastic sheets, which protect the crops from adverse climatic conditions, insect-pests and different viruses. In this type of polyhouse, all four sides of the greenhouse are covered with an insect-proof, 40 mesh nylon net. Rollable plastic curtains from the ground are used to cover sides. During summer, this plastic curtain

57
is rolled up and down in winter for proper cross ventilation with the help of a pipe. The roof is covered with 200 micron thick, transparent polythene film. This kind of polyhouse does not require electricity. For irrigation, low pressure drip irrigation system is used. This type of structure is suitable for peri-urban areas where high value vegetables like tomato, capsicum, parthenocarpic cucumber etc. and flowers like rose, chrysanthemum and gerbera can be grown easily.
Integrated Pest Management (IPM): The major contributions relate to validation and dissemination of IPM in the targeted crops (rice, cotton, pulses, oilseeds, vegetables and fruits). During 2008 to 2014, area covered under IPM programmes in different target crops increased from 658 to 1587 ha. The e-Pest Surveillance and Advisory System covering 14 States with emphasis on Maharashtra and Odisha were established; this resulted in reduction in the use of insecticides for pest management without compromising the productivity of crops. The IPM module developed by the Centre for pest management in basmati rice was found to be very effective in Uttarakhand, Haryana and Uttar Pradesh. IPM practices helped in increasing cotton productivity by 20-25 per cent. The IPM modules developed for cotton also gave significant reduction in mealybug infestation in Punjab. IPM also showed good promise in pulse production. A major impact of IPM was observed in improving productivity of pigeonpea in Karnataka. A GIS-based automated crop pest mapping system has been developed for major pests and diseases of soybean, cotton, chickpea and pigeonpea.
8.4 Resource Conservation TechnologiesResource use efficiency may also contribute significantly to the
savings on cost front and thus enhancing the revenues to farmers. Land resource inventory on 1:10,000 scale was prepared taking Landscape Ecological Unit (LEU) consisting of landforms, land use and slope as the base map while bio-climatic map of India was revised. Electronic atlas of water resources, developed for Odisha and Himachal Pradesh, is a useful tool for catch assessment and developing GIS based Decision Support System. The information will help planners to concentrate efforts, allocate resources and deploy manpower according to the distribution of fishery resources.
Zero–Tillage Technology: In zero tillage (ZT) technology, soil is not ploughed, but sowing of crop is done by using a specially designed zero-till seed-cumfertilizer drill/planter, which disturbs soil to the least possible extent. At the time of seeding, fertilizers are simultaneously placed beneath the seeds. Several modern seeding machines, such as happy seeder, turbo

58
seeder, multi-crop planter, rotodouble disc planter are necessary for sowing in residue-laden conditions. Zero tillage proves better for direct-seeded rice, maize, soybean, cotton, pigeonpea, mungbean, clusterbean, pearlmillet during kharif season and wheat, barley, chickpea, mustard and lentil during rabi season. Wheat sowing after rice can be advanced by 10-12 days by adopting this technique compared to conventionally tilled wheat, and wheat yield reduction caused by late sowing can be avoided. ZT provides opportunity to escape wheat crop from terminal heat stress. Zero tillage reduces cost of cultivation by nearly Rs 2,500-3,000/ha through reduction in cost of land preparation, and reduces diesel consumption by 50-60 litres per hectare. Zero tillage reduces water requirement of crop and the loss of organic carbon by oxidation. Zero tillage reduces Phalaris minor problem in wheat. The carbon status of soil is significantly enhanced in surface soil (0-5 cm), particularly under crop residue retention with zero tillage.
Raised Bed planting technology for enhancing crop productivity: Raised bed planting is a promising technique of crop establishment during kharif season. It increases the productivity of crops like cotton, maize, pigeonpea, green gram, soybean, cowpea, vegetables, etc., which are grown in kharif and prone to water logging. Raised bed planting increases grain yield and economic returns, improves resource use efficiency and reduces weed problem. Bed planting system helps in efficient use of water under rainfed as well as irrigated conditions because of optimum water storage and safe disposal of excess water. Furrow irrigated raised-bed system (FIRBS) of wheat usually saves seed by around 25 per cent, water by 25-30 per cent and nutrients by 25 per cent without affecting wheat grain yield. It reduces weed populations on the top of beds and lodging of wheat crop. The productivity of cotton-wheat, pigeonpea-wheat and maize wheat systems is higher under ZT bed planting with crop residue. Cotton-wheat cropping system under ZT broad bed with residues of both crops gave higher system productivity and net returns than that in the transplanted rice-conventional till wheat cropping system. Therefore, it can be an alternative option for rice-wheat system under irrigated conditions.
Direct-Seeded Rice: Direct-seeded rice (DSR) avoids water required for puddling and reduces overall water demand compared to conventional puddled transplanted rice (TPR). DSR is a labour, fuel, time and water saving technology, which gives comparable yield as that of TPR. Soil health is maintained or improved, and fertilizer and water-use efficiencies are higher in DSR (saving of 30-40% irrigation water). Therefore, DSR is a technically and economically feasible alternative to TPR. In North Indian conditions, summer mungbean can be adopted before DSR. It gives grain

59
yield of 0.8-1.0 t/ha and usually adds 40-60 kg N/ha in soil, reducing N requirement for the subsequent crop.
8.5 Livestock TechnologiesLivestock sector is supposed to contribute significantly among all
sub-sectors to the farmers’ incomes. India has been holding the position of leading milk producing nation in the world for the last several years with sustainable increase in the annual milk production wherein the research developments played a crucial role. Studies showed that average first lactation 305 days milk yield of cows was 3,703.6±31.3 kg and average age at first calving was 1,036.6±10.2 days. Under Conservation and Genetic Improvement of Indigenous Cattle Breeds, the milk yield showed an increasing trend among the progenies of different sets, and average 305 days milk yield increased from 1,958 kg in first set to 2,604 kg in 10th set.
Certain pockets in the country are dominated by the existence of small ruminants, proper management of which may contribute significantly to the incomes. The implementation of goat husbandry technologies in famers’ flock provided average employment ranging between 80 and 140 man days in a year; and income improved from 67 to 257 per cent of investment in Assam hill goat.
Peste des Petits Ruminants (PPR) and Foot and Mouth Disease (FMD) Vaccine: PPR or goat plague is the most important disease of sheep and goats causing an economic loss to the tune of Rs 1,800 million/annum. The mass scale use of PPR vaccine developed by IVRI resulted in reduction of more than 75 per cent disease incidence (< 300 outbreaks as against 1,200 outbreaks/annum) thus saving an annual loss of about Rs 1,200 million. The application of this vaccine has a very high impact on livelihood security of poor people, who depend on sheep and goat rearing. The technology has been transferred to four industries. FMD is the most important infectious disease of cattle and buffaloes causing an economic loss of Rs 20,000 crores/annum. FMD vaccine production technology in India was first implemented at IVRI, Bangalore campus in late 1970s. About 52 million doses of trivalent vaccine has been produced and supplied till date for FMD prophylaxis throughout the country. The reduced incidence of the disease has ultimately impacted on livelihood security of poor people, who depend on these animals for milk and draught purposes.
Mineral Mixture Supplementation: The mineral deficiency is manifested in the form of loss of hairs, skin disorders, anaemia, loss of appetite, bone abnormalities and suboptimum production and reproductive problems. Thus, supplementation of minerals is inevitable

60
to achieve optimum health and production. The technology is available for the formulation of mineral mixtures as per the recommendations of Bureau of Indian Standards for different species i.e. cattle, buffalo and goat to supplement major and trace minerals like Ca, P, Mg, Fe, Zn, Mn, I and Co etc. There are two types of formulations of mineral mixture, one is with salt and the other is without salt. It should be mixed in the concentrate mixture @ 2kg per 100 kg (without salt) and @ 3 kg/100 kg (with salt). Supplementation increases the feed intake, feed conversion efficiency and productive performance of animals in terms of growth, reproduction and milk production. Mineral supplementation was found to enhance productive and reproductive performances of ruminant species, particularly to those who are deficient in particular types of minerals.
Fisheries Sector: ICAR has extended support for multiple breeding of Indian major carps for year round seed production. The technologies related to intensive carp culture and production levels of 10-15 tonnes/ha/yr along with improved rohu (Jayanti) with 17 per cent higher growth realization per generation after eight generations through selective breeding have been developed. Besides these, the breeding, seed production and culture technology for important brackishwater and marine finfishes such as milkfish (Chanos chanos), pearlspot (Etroplus suratensis), Asian seabass (Lates calcarifer), cobia (Rachycentron canadum)and Silver pompano (Trachinotus blochii), etc. have also been developed.
8.6 Agricultural EducationAgricultural education will facilitate proper awareness, adoption and
utilization of existing resources, technologies and processing activities. Higher agricultural education, financial and monitoring support was provided for Niche Area of Excellence (28), Experiential Learning Units (21 new), besides refurbishing and maintenance of educational structures, student and faculty amenities, course curricula revision/improvement, strengthening of libraries with ICT and modernization of teaching with multimedia learning resources.
8.7 Agricultural ExtensionExtension services are important in spreading the technologies and
the associated benefits. Kisan mobile advisory (KMA), an initiative by the ICAR, sent 93,949 short text messages, 14,788 voice messages and 1,180 both SMS and voice messages to benefit 223.94 lakh farmers on various aspects of agriculture based on input provided by 557 Krishi Vigyan Kendras (KVKs). The processes of technology assessment and refinement are as important as the technology generation prior to transfer at the field level. During 2015-16, 2,652 technology interventions were assessed across 4,003

61
locations by laying out 27,008 trials on the farmers’ fields. In all, 228.75 lakh quality planting materials of elite species of different crops were produced and provided to 18.38 lakh farmers.
For doubling of farmers’ incomes, it is important that existing pool of agricultural knowledge regarding technologies and processes is channelized and implemented for the benefits of its stakeholders. The strategies covering various policies and strategies related to technology development, refinement and spread/adoption; effective implementation of marketing reforms; expansion of value addition and processing capacity; inculcating entrepreneurial skills among the educated farm youth and effective trade policies need to be prepared.


63
9Chapter
Conclusions and Strategies
The Prime Minister’s call to double farmers’ income by 2022 has brought renewed interest among entire stakeholders in the country, ranging from the agricultural research community, policy executives, state authorities, extension agencies, private players, and more importantly among farmers. Major approaches include re-orienting focus from intensification to diversification, from sustenance to commercialization, and turning the agricultural units to enterprises. Different central and state level programs have been floated to execute and monitor the outreach of technologies, soil health, farm credit and market to the farmers. Price supports are triggered for many of the crops, entrepreneurship is inculcated to the farming community.
Despite of all strengths, an inherent drawback in these approaches has been that many of them operate in isolates, lacking a unified framework that numerically explain various factors that contribute to the doubling goal. Of course, strategies could only be region-specific, and could operate only under given agro-climatic forces. The sources would ultimately vary at disaggregated geographies, demanding numerous approaches at different environments. Still, the macro forces that explain the short-future, at least till the target year 2022, and possible contributions of factor productivity, labor transformation, terms of trade and market volatility demands high place in achieving the goal. The present study attempts to devise strategies to double farmers’ income, balancing both macro and meso environments. The study covers possible contributions of different sources at both national level and at state level. The study also bypasses the other major hurdle: obtaining income estimates of the farmers, and generating methodology of estimation.
It highlights the role of TFP growth that emerges from agricultural R&D, extension services, new knowledge and practices in achieving the goal. It brings to our focus that technology dissemination than generation still provides us a promising scope to increase income at farm level. The estimates portray that yield gap vary from one-fourth to one-third within the paddy farms. Jowar farms in Maharashtra and Karnataka, and bajra farms in Rajasthan still exhibit yield gap as high as 50 per cent. The estimates for gram in Madhya Pradesh stands more than 30 per cent, and by 45 per

64
cent in Rajasthan and Maharashtra. Cash crops, which are input intensive, also exhibit yield gap of around 30-50 per cent. These scenarios offer us to increase output, thereby income, by using the existing technologies itself. Tapping this potential depends on expanding irrigation, and delivering better quality seeds. The yield differences in irrigated fields produce around 8 quintals/ha of higher paddy, 2-5 quintals/ha of higher gram, 5-15 quintal/ha of higher maize and 3 quintal/ha of higher cotton. Even when prices turn poor, higher output from the same land could offer increased income to the farmers.
The other major strategy to follow is to encourage processing by the household sector. Against the corporate sector, which contributes by around 7 per cent, household sector contributes by around 13 per cent of the output of food processing sector. Fruits and vegetables, and livestock processing especially provide high scope. This would turn to reality under optimal skill delivery to the farm households. Special schemes could be introduced that cater processing by the farmers and simultaneously link the processed food to the urban market. Equally, encouraging Farmer Producer Organizations and other private sector to invest more in processing would complement the effort.
The market trends display relative price stability to the cereal sector against high volatility for the vegetables and fruits. For example, the WPI for onion for the year 2011 was 619, and has peaked to 783 during 2015. Further, cob-web phenomenon as well turn proved through this study. Market prices remain high, but as a contrary, farmers share remain low for these high value crops. While paddy, wheat and gram growers fetch by around 60-80 per cent, fruits and vegetable growers report around 25-40 per cent only. This demands attention of the researchers and policy makers while proposing farmers to diversify. It demands for improved market efficiency and price policies more in favour of high value crops, and creating localized market infrastructure that could store fruits and vegetables to reap market gains.
The study brings out region-specific issues and constraints in holistic but detailed sphere, ranging from production to processing and marketing; meanwhile provides appropriate strategies as solutions. Moving our steps towards suggested directions would foster the efforts to double income of the farmers in the stipulated year.
STRATEGIES
9.1 Reducing Dependence on AgricultureThe agricultural workforce in the country, which can be classified
into cultivators and agricultural labourers, decreased from 25.84 crores

65
in 2004-05 to 22.44 crores in 2011-12. The cultivators declined from 16.6 crores in 2004-05 to 14.6 crores in 2011-12. At the same time, a decline of 15.63 per cent was noticed in case of agricultural labourers during 2004-05 to 2011-12. This indicates that cultivators are leaving farming due to its unprofitable nature or better non-farm opportunities. The 59th NSSO survey on Situation Assessment of Agricultural Households revealed that 40 per cent of the farmers would like to take up another profession. Even some micro studies have revealed that the cultivators lease out the cultivable land to contractors/leases due to some inherent constraints in cultivation process.
To examine the impact of decline in number of cultivators on increase in per cultivator income, we computed per cultivator income by assuming different rates of decline in number of cultivators following the farm income methodology given by Chand et al. (2015). During 2004-05 to 2011-12, the number of cultivators in agriculture declined at the rate of 1.8 per cent per year. One may assume the same rate for next six years also and that would tantamount to 24 per cent increase in cultivators’ income between 2015-16 and 2021-22. However, it has been witnessed during last few decades that non-farm sector grew at much appreciable rate as compared to farm sector. It may be noted that agriculture (including allied activities), manufacturing and service sector grew at CAGR of 3.7, 8.4, and 9.0 per cent, respectively, during 2004-05 to 2014-15. Thus, the non-farm sector is providing better employment opportunities to the cultivators’ young and educated family members. Further, policies related to continuous emphasis on land consolidation may also yield some impact on the current state of holdings and cultivators.
Moving on this premise, we assumed the double rate of decline in cultivators, i.e. -3.6 per cent per year as compared -1.80 per cent per year during 2004-05 to 2011-12. This may be particularly true for those cultivators who are at a marginal and very small level and has been assumed for next 6 years. The premise of 3.6 per cent decline per year in number of cultivators shall increase farm income from Rs 45,163 in 2015-16 to Rs 62,403 in 2021-22 (Figure 7), which is contributing to approximately 38 per cent increase in farmers’ income. As we move ahead with interventions in other critical areas, we might bring the remaining increase in farmers’ income. This may seem to be a soft approach and people may argue that this increase in income by just reducing the denominator, i.e. numbers of cultivators is not plausible. There, it may be noted that it is not simply pressing the denominator rather it is a graceful shift to more earning avenues in agriculture as well as non-agriculture sector.
The increasing emphasis on agri-business requires that agriculture units do not remain isolated cultivating units rather are transformed into

66
agri-enterprises performing more functions at the same time rather than simply the cultivation function. Encouraging processing and building value chains would help create nonfarm jobs in rural areas (Gulati and Saini, 2016). This demands inter-sectoral as well as intra-sectoral integration in terms of functions and activities along with manpower.
Figure 7 : Assuming different growth in number of cultivators: Impact on cultivators’ income (Rs per annum)
Source: Computed by authors.
9.2 Value Chain ApproachThe technological interventions will increase the profitability, but
as has been experienced in the past that producers become the victims of increased supply and loose significantly and, thus, suitable, procurement, logistics and marketing interventions will help optimise the revenues to farmers. For illustration, the case of onion has been explained in detail in previous section. The producers borne the losses despite significant increase in production in Maharashtra. The time has come when things are to be dealt in totality not in isolation. Neither the productivity centric nor the marketing and price centric approach are going to work in isolation. Every commodity has to be dealt in a holistic value chain approach when suitable interventions are required at all the critical stages.
9.3 Review of Current Programmes and SchemesA number of schemes and programmes have already been in existence
for number of years in the country. The schemes were started with good

67
ideas and intended to deliver with welfare motives. Hon’ble Prime Minister has already taken initiative to review and revamp the existing irrigation schemes. Other mega initiatives and schemes on crop insurance, soil health card, promotion of organic agriculture are already in vogue and will yield the intended benefits in due course of time.
Agri-entrepreneurship needs to be provided boost to cater to the emerging needs of the sector and enhance the agribusiness potential. Agriclinics and Agribusiness Centres Scheme of Government of India was started in the year 2002-03 with the financial support of NABARD. The mid-term evaluation report of the scheme the scheme has been successfully implemented in 25 states across the country and generated employment for 4,152 graduates, post graduates and doctorates, which in turn created further 25,000 jobs across segments, thus, benefiting more than one lakh farmers in more than 7,000 villages across the country. Such programmes, if implemented on a mega scale, can change the face of Indian agriculture, increase farmers’ incomes and enhance overall welfare of the rural economy. Such programmes, in long run, will accelerate the inclination towards farming and orient the agriculture educated youth towards agribusiness.
Consensus among stakeholders is necessary to promise and deliver the targeted growth for each sub-sector; strategic framework may be formulated for achieving the targeted growth. Wide-scale sensitization of stakeholders is required across the country to put them on the targeted growth.
9.4 Infrastructure DevelopmentAs established in the studies, marketing infrastructure plays crucial
role in increasing the efficiency of the agricultural transactions. Such efficiency and gains, if aggregated on a larger scale, may provide fruitful gains to the farmers. The Central sector scheme on Agricultural Marketing Infrastructure-Grading and Standardization was launched in 2004 for general or commodity specific marketing infrastructure for agricultural and allied commodities and for strengthening and modernization of existing agricultural markets, including those of wholesale, rural, periodic in nature. As per the schemes documents, the scheme intended to provide additional agricultural marketing infrastructure to cope up with the large expected marketable surpluses of agricultural and allied commodities including dairy, poultry, fishery, livestock and minor forest produce. Such schemes need a mid-term and ex-post impact analysis and examine the operational constraints for effective implementation and optimum benefit realization.

68
9.5 Linkages among the Organisations and StakeholdersIt would be prerequisite that the implementation of DFI Plan
should be with a clear visionary framework and strategic plans need to be formulated for all sub-sectors. This requires linkages among the high-powered think tanks like NITI Aayog, Ministry of Agriculture and Farmers’ Welfare, Ministry of Food Processing Industries, Ministry of Commerce and Industry and other relevant organizations working in this direction. National Bank for Agriculture and Rural Development (NABARD) is playing pivotal role in refinancing initiatives, building producer groups and association, capacity building of the stakeholders and establishing linkages. Role of Indian Council of Agricultural Research would be extremely important to initiate and launch various technological breakthroughs for required transformation. Organisations dealing with data warehouses and repositories like, Ministry of Agriculture and Farmers’ Welfare, Ministry of Statistics and Programme Implementation, Labour Bureau and other relevant organizations will establish a connect among the implementing and development agencies.
9.6 Prioritisation of Areas for InvestmentPrioritization of areas for investment based on the potential to
contribute to the targeted growth can be attempted by identifying and prioritizing the constraints. It will not be the responsibility of public sector alone rather the specific modes of interventions need to be identified through public, private or participatory approach. Some areas may require only the attention of public sector, like building of roads, markets and other infrastructure.
9.7 Centre-State LinkagesCentre-State linkages would be extremely important in mainstreaming
and channelizing the policies and investment to the targeted goals for development. A crucial role would be played by the state and state development agencies in formulating state plans and strategic framework for fulfilling the objective. Farmers’ associations and non-government organizations will put forth farmers’ interests and their voices on the fore-front. Emphasis on women self-help groups should improve the micro and small industries.
9.8 Making the Farmers Party to the MissionA relevant approach would be making the farmers party to the
mission and ensure their participatory approach so as to awaken them and put them on the wheel of growth. According to the Hon’ble Prime

69
Minister, agriculture has to stand on three pillars-Paramparagat Kheti (traditional agriculture), diversification into agroforestry by planting trees on the boundaries of farmers’ fields, and encouraging livestock and beekeeping, duly supported by food processing; these pillars will reduce the risks in farming, and augment farmers’ incomes. The educated youth from farming families can be the change agents. The skill development and capacity building of these young members would help in adoption of improved technologies and modern farm and marketing practices.
9.9 Agricultural Credit and Other ReformsRole of agricultural credit is extremely important in meeting the
crop cultivation, animal rearing and other sub-sectors’ requirements in agriculture. The Government of India has initiated several policy reforms to ensure the timely and required availability of credit to the farmers with the purpose to have progressive institutionalization with an inclusive approach. A notable reform initiated recently is Kisan Credit Card Scheme to enable the farmers to purchase agricultural inputs and draw cash to meet their consumption needs. National Bank for Agriculture and Rural Development is extensively promoting the micro-finance and the Farmer Producer Organizations. Some state governments and NABARD are also promoting FPOs; however, the number and network of FPOs is very small and it needs to be expanded to enable farmers to reduce transaction coasts, access technology, raise bargaining power and integrate with value chains (Chand 2017). Credit expansion across regions and farm size classes would further help in enhancing efficiency and farmers’ gains.
As most of the farmers in the country lie in the marginal and small category with very small holding size which makes the diffusion of advanced technologies difficult. The holdings are tiny and scattered particularly in the hilly areas. Thus, land consolidation coupled with other suitable reforms need to be effectively implemented. Further, the climatic risks are resulting in decline in productivity and creating distorting impact on prices. Thus, risk management is an essential component to be studied in detail.
Doubling of farmers’ income requires not only the interventions and development in the agricultural sector but also requires the strong linkages with manufacturing and service sector to transform the ‘agricultural units to agricultural enterprises’. Thus, it is not going to be an isolated game that would transform the face of Indian agriculture. Rather, it will be putting all forces together for the holistic development of this sector to provide it more modern and professional orientation.


71
References
Avila, A.F.D., and R.E. Evenson. (2004). Total Factor Productivity Growth in Agriculuture: The Role of Technology Capital. Yale Economic Growth Centre. New Haven, CT.
Bhat, J.A., and Ruhi Rifath Aara. (2012). Marketing Efficiency of Kashmir Apple, International Journal of Scientific and Research Publications, 2 (7): 2250-3153.
Birthal, P.S., A. Kumar, A. Ravishankar, and U.K. Pandey. (1999). Sources of Growth in Livestock Sector. Policy Paper 9. National Centre for Agricultural Economics and Policy Research (NCAP), New Delhi.
Birthal, P.S., P.K. Joshi, Devesh Roy, and Amit Thorat. (2007). Diversification in Indian Agriculture Towards High-Value Crops: The role of smallholders. IFPRI Discussion Paper 00727, International Food Policy Research Institute, Washington, DC.
Birthal, P.S., Digvijay S. Negi, and Devesh Roy. (2017). Enhancing Farmers’ Income: Who to Target and How? Policy Paper 30. National Institute of Agricultural Economics and Policy Research (NIAP), New Delhi.
Chand, R. (2016). Doubling Farmers’ Income: Strategy and Prospects, Presidential Address delivered at 76th Annual Conference of Indian Society of Agricultural Economics held at Assam Agricultural University Jorhat, Assam during 21-23 November, 2016.
Chand, R. (2017). Doubling Farmers’ Income: Rationale, Strategy, Prospects and Action Plan, NITI Policy Paper 01/2017 National Institution for Transforming India, Government of India, New Delhi.
Chand, R. (2016). Addressing Agrarian Distress Sops v/s Development, B.P. Pal Memorial Lecture 26 May, 2016 IARI, New Delhi.
Chand, R., Raka Saxena, and Simmi Rana. (2015). Estimates and Analysis of Farm Income in India, 1983-84 to 2011-12, Economic and Political Weekly, 50 (22): 139-145.
Chand, R., and Shinoj Parappurathu. (2012). Temporal and Spatial Variations in Agricultural Growth and Its Determinants. Economic and Political Weekly, 47 (26&27): 55-64.

72
Chand, R., Praduman Kumar, and Sant Kumar. (2011). Total Factor Productivity and Contribution of Research Investment to Agricultural Growth in India. Policy Paper 25. National Centre for Agricultural Economics and Policy Research, New Delhi.
Chand R., and Shinoj Parappurathu. (2011). Historical and Spatial Trends in Agriculture: Growth Analysis at national and State Level in India, Paper presented in the Workshop on ‘Policy Options and Investment Priorities for Accelerating Agricultural Productivity and Development in India’, India International Centre, New Delhi, November 10-11.
Chand, R. (2008). The State of Indian Agriculture and Prospects for Future. In: Kanchan Chopra and C.H. Hanumantha Rao (eds), Growth, Equity, Environment and Population: Economic and Sociological Perspectives, Sage, New Delhi, Ch 8, pp 133–48.
Coelli, T.J., and D.S.P. Rao. (2003). Total Factor Productivity Growth in Agriculture: A Malmquist Index Analysis of 93 Countries, 1980–2000. Centre for Efficiency and Productivity Analysis (CEPA), Working Paper Series No. 02/2003, Australia.
Evenson, R.E., C. Pray, and M.W. Rosegrant. (1999). Agricultural Research and Productivity Growth in India. Research Report No. 109. International Food Policy Research Institute, Washington, D.C.
Fan, S., P.B.R. Hazell, and S. Thorat. (1999). Linkages between Government Spending, Growth, and Poverty in Rural India. Research Report No. 110. International Food Policy Research Institute, Washington, D.C.
FAO (2014). Food and Agricultural Organization of the United Nations, (http://www.fao.org).
Gandhi, V.P., and N.V. Namboodiri. (2004). Marketing of Fruits and Vegetables in India: A study Covering the Ahmedabad, Chennai and Kolkata Markets, IIMA-Working Paper (06-09), Research and Publication Department, Indian Institute of Management Ahmedabad.
Gandhi, V.P., and Abraham Koshy. (2006). Wheat Marketing and its Efficiency in India, Working Paper (2006-09-03), Research and Publication Department, Indian Institute of Management, Ahmedabad.
Goldar, B.N., Deb Kusum Das, Suresh Aggarwal, Abdul Azeez Erumban, Sreerupa Sengupta, Kuhelika De, and Pilu Chandra Das. (2014). Estimates of Productivity Growth for Indian Economy Reserve Bank of India, (https://rbi.org.in/Scripts/PublicationReportDetails.aspx? ID=785#AP6A).

73
Government of India. (2007). Agriculture Strategy for Eleventh Plan: Some Critical Issues, Planning Commission, Govt. of India, New Delhi.
Government of India. (2009). Report of the Taskforce on Irrigation, Planning Commission, Govt. of India, New Delhi.
Government of India. (2014). Mission for Integrated Development of Horticulture. Operational Guidelines, Horticulture Mission, Govt. of India, New Delhi.
Government of India. (2015). Volatility in Onion Prices can be Managed through Appropriate Mechanisms and Interventions. Press Information Bureau, New Delhi.
Government of India. (various years). National Accounts Statistics. Ministry of Statistics and Programme Implementation, New Delhi.
Government of India. Department of Agriculture, Cooperation and Farmers Welfare. Ministry of Agriculture and Farmers Welfare, New Delhi.
Gulati, A., and Shweta Saini. (2016). From Plate to Plough: Raising farmers income by 2022. Indian Express, 28th March.
Hegde, N.G. (2006). Livestock Development for Sustainable Livelihood of Small Farmers. In: Souvenir of the 39th Annual General Meeting and 48th National Symposium on “Energising Rural India - A Chanllenge to Livestock Industry. Compound Livestock Feed Manufactures Association of India (CLFMA), Manesar, Haryana. August 26: 50-63.
ICAR, Annual Reports, Indian Council of Agricultural Research, New Delhi (various years).
Jain, R., and Ramesh Chand. (2015). Total Factor Productivity and its determinants in Indian Agriculture, Unpublished Project Report. ICAR-National Institute of Agricultural Economics and Policy Research (NIAP), New Delhi.
Jha, S.N., R.K. Vishwakarma, Tauqueer Ahmad, Anil Rai, and Anil K. Dixit. (2015). Assessment of Quantitative Harvest and Post-Harvest Losses of Major Crops and Commodity in India, ICAR—All-India Coordinated Research Project on Post-Harvest Technology, ICAR-CIPHET.
Joshi, P.K., L. Joshi, R.K. Singh, J. Thakur, K. Singh, and A.K. Giri. (2003). Analysis of Productivity Changes and Future Sources of Growth for Sustaining Rice-Wheat Cropping System. National Agricultural Technology Project ((PSR 15; 4.2). National Centre for Agricultural Economics and Policy Research (NCAP), New Delhi.

74
Kumar, P., Surabhi Mittal, and Mahabub Hossain. (2008). Agricultural Growth Accounting and Total Factor Productivity in South Asia: A Review and Policy Implications. Agricultural Economics Research Review, 21 (2): 145-172.
Kumar, S., and Sakshi Gupta. (2015). Crop Diversification towards High-value Crops in India: A State Level Empirical Analysis. Agricultural Economics Research Review, 8 (2): 339-350.
Landes, M.R. (2010). Growth and Equity Effects of Agricultural Marketing Efficiency Gains in India, DIANE Publishing.
MoFPI. (2016). Ministry of Food Processing Industries, Govt. of India, (http://mofpi.nic.in).
Murali, P., R. Balakrishnan, D. Puthira Prathap, C. Karpagam, and G.N. Govindaraj. (2012). Productivity Improvement in Sugarcane Farming in Tamil Nadu (India): Parametric and Non Parametric Analysis. No. 126346, International Association of Agricultural Economists.
Narayanamoorthy, A. (2006). State of India’s Farmers. Economic & Political Weekly. 41 (6): 471-473.
NSSO. (2003). Situation Assessment Survey of Farmers: Some Aspects of Farming, Report No. 496(59/33/3), 59th Round (January–December 2003), National Sample Survey Organization, Ministry of Statistics and Programme Implementation, Government of India, New Delhi.
NSSO. (2014). Key Indicators of Situation of Agricultural Households in India, 70th Round (January–December 2013), Ministry of Statistics and Programme Implementation, National Sample Survey Office, New Delhi.
NSSO. (Various rounds). Employment and Unemployment Situation in India, Ministry of Statistics and Programme Implementation, New Delhi.
Palanisami K., and S. Raman. (2012). Potential and Challenges in Up-scaling Micro-irrigation in India Experiences from Nine States, Water Policy Research Highlight, IWMI-TATA Water Policy Programme.
Rada, N. (2016). India’s Post-Green-Revolution Agricultural Performance: What is Driving Growth? Agricultural Economics, 47: 341-350.
Rao, P.P., P.S. Birthal, and P.K. Joshi. (2006). Diversification towards High Value Agriculture role of Urbanisation and Infrastructure. Economic and Political Weekly, 41(26): 2747-2753.

75
Satyasai, K.J.S., and Sandhya Bharti. (2016). Doubling Farmers Income: way forward, Rural pulse. Issue - XIV, March - April 2016 Occasional Paper, National Bank for Agriculture and Rural Development (NABARD), Mumbai.
Saxena, R., and A.K. Srivastava. (2012). Livestock Sector in India: Strategies for Enhancing Small Holders’ Income. Agricultural Situation in India, 69 (9): 505-512.
Saxena, R., and Ramesh Chand. (2017). Understanding the Recurring Onion Price Shocks: Revelations from Production-Trade-Price Linkages. Policy Paper (Forthcoming), ICAR-National Institute of Agricultural Economics and Policy Research (NIAP), New Delhi.
Sen, A., and N.S. Bhatia. (2004). Cost of Cultivation and Farm Income, State of the Indian Farmer: A Millennium Study. Vol. 14, Academic Foundation, in association with Department of Agriculture and Cooperation, Ministry of Agriculture, New Delhi.
12th Five year plan. (2012-17). Report of the Working Group on Animal Husbandry and Dairying, Planning Commision, Government of India, New Delhi.

NIAP Publications
Policy Papers
16. Pal, S., and D. Byerlee. 2003. The Funding and Organization of Agricultural Research in India: Evolution and Emergency Policy Issues.
17. Adhiguru, P., and C. Ramasamy. 2003. Agricultural-based Interventions for Sustainable Nutritional Security.
18. Birthal, P.S. 2003. Economic Potential of Biological Substitutes for Agrochemicals.
19. Chand, R. 2003. Government Intervention in Foodgrain Markets in the New Context.
20. Mruthyunjaya, S. Pal, and R. Saxena. 2003. Agricultural Research Priorities for South Asia.
21. Dastagiri, M.B. 2004. Demand and Supply Projections for Livestock Products in India.
22. Bhowmick, B.C., B.C. Barah, S. Pandey, and N. Barthakur. 2005. Changing Pattern of Rice Production Systems and Technology in Assam.
23. Jha, D., and S. Kumar. 2006. Research Resource Allocation in Indian Agriculture.
24. Anjani Kumar. 2009. India’s Livestock Sector Trade: Opportunities and Challenges.
25. Chand, R., P. Kumar, and S. Kumar. 2011. Total Factor Productivity and Contribution of Research Investment to Agricultural Growth in India.
26. Chand, R., S.S. Raju, S. Garg, and L. M. Pandey. 2011. Instability and Regional Variation in Indian Agriculture.
27. S.S. Raju, P. Shinoj, R. Chand, P.K. Joshi, P. Kumar, and S. Msangi. 2012. Biofuels in India: Potential, Policy and Emerging Paradigms.
28. Shinoj P., A. Kumar, S. Kumar, and R. Jain. 2014. Commodity Outlook on Major Cereals in India.
29. Birthal, P.S., S. Kumar, D.S. Negi, and D. Roy. 2016. The Impact of Information on Returns from Farming.
Policy Briefs
26. Ganesh Kumar, B. and K. K. Datta. 2008. Tackling Avian Influenza, An Emerging Transboundary Disease.
27. Beintema, N., P. Adhiguru, P.S. Birthal, and A.K. Bawa. 2008. Public Agricultural Research Investments: India in a Global Context.
th28. Chand, R.. 2009. Demand for Foodgrains During 11 Plan and Towards 2020.
29. Shinoj, P. 2009. India-ASEAN Trade in Agriculture: Retrospect and Prospect.
30. Birthal, P. S., and S. Kumar. 2009. Conditions for the Success of Contract Farming in Smallholder Agriculture?
31. Raju, S.S., and R. Chand. 2009. Problems and Prospects in Agricultural Insurance in India.
32. Birthal, P.S., and P.K. Joshi. 2009. Agriculture and Regional Disparities in India.
33. Singh, H., and R. Chand. 2010. The Seeds Bill, 2010: Acritical Appraisal.
34. Kumar, S., P.A.L. Prasanna, and S. Wankhade. 2010. Economic Benefits of Bt Brinjal-An Ex-Ante Assessment.
35. Chand, R., A. Gulati, P. Shinoj and K. Ganguly. 2011. Managing Food Inflation in India: Reforms and Policy Options.
36. Shinoj. P., S.S. Raju, R. Chand, P. Kumar, and S. Msangi. 2011. Biofuels in India: Future Challenges.
37. Ramasundaram, P., A. Suresh, and R. Chand. 2011. Maneuvering Technology for Surplus Extraction: The case of Bt Cotton in India.
38. Chand, R., and J. Jumrani. 2013. Food Security and Undernourishment in India: Assessment of Alternative Norms and the Income Effect.
39. Chand, R., and P.S. Birthal. 2014. Buffer Stock Norms for Food grains during Twelfth Five Year Plan.
40. Chand, R., and S.K. Srivastava. 2014. Changing Structure of Rural Labour Market: Trends, Drivers and Implications for Agriculture.
41. Birthal, P.S., D.S. Negi, Md. Tajudding Khan, and S. Agarwal. 2015. Is Indian Agriculture Becoming Resilient to Droughts ? Evidence form Rice Production.
42. Singh, N.P., and J.P. Bisen. 2017. Goods and Services Tax: What it holds for Agricultural Sector?
30. Birthal, P.S., Digvijay S Negi and Devesh Roy 2017. Enhancing Farmers' Income: Who to Target and How?

Hkk-Ï-v-i-–jk"Vªh; oGf"k vkfFkZdh ,oe~ uhfr vuqlaèkku laLFkkuICAR – NATIONAL INSTITUTE OF AGRICULTURAL ECONOMICS AND POLICY RESEARCH
(Indian Council of Agricultural Research)Dev Prakash Shastri Marg, Pusa, New Delhi-110 012, INDIA
Phone : 91-11-25847628, 25848731, Fax : 91-11-25842684 E-mail : [email protected]: // www.ncap.res.in