Embed Size (px)
Citation preview

Deutsche Bank Research
Global
Strategy
Asset Allocation
Date 12 May 2014
Long Cycles In The Bond-Equity Correlation: Where Next?
________________________________________________________________________________________________________________
Deutsche Bank Securities Inc.
Deutsche Bank does and seeks to do business with companies covered in its research reports. Thus, investors should be aware that the firm may have a conflict of interest that could affect the objectivity of this report. Investors should consider this report as only a single factor in making their investment decision. DISCLOSURES AND ANALYST CERTIFICATIONS ARE LOCATED IN APPENDIX 1. MCI (P) 148/04/2014.
Binky Chadha
Chief Strategist (+1) 212 250-4776 [email protected]
Keith Parker
Strategist (+1) 212 250-7448 [email protected]
John Tierney
Strategist (+1) 212 250-6795 [email protected]
Parag Thatte
Strategist (+1) 212 250-6605 [email protected]
Two distinct regimes in bond-equity correlations
-0.7
-0.5
-0.3
-0.1
0.1
0.3
0.5
0.7
-70%
-50%
-30%
-10%
10%
30%
50%
70%
Jan-
62
Jan-
66
Jan-
70
Jan-
74
Jan-
78
Jan-
82
Jan-
86
Jan-
90
Jan-
94
Jan-
98
Jan-
02
Jan-
06
Jan-
10
Jan-
14
Recession Correl
Avg 1978-97= +0.40
Avg post-2001 = -0.32
Bond and earnings yields
Correlation impacts portfolio allocation
0%10%20%30%40%50%60%70%80%90%100%
0%10%20%30%40%50%60%70%80%90%
100%
-50%
-40%
-30%
-20%
-10% 0% 10
%
20%
30%
40%
50%
Bond-equity correlation
Allocation for maximum Sharpe ratioEquity Bond
Avg Correl 1966-97 = 0.4
Correl = 0
Avg Correl 1998-2014 = -0.3
Two very distinct regimes of bond-equity correlation The bond-equity returns correlation is a key input to portfolio asset allocation. History provides conflicting guides as to what to factor in. In the first regime, from 1966-1997, the correlation was consistently strongly positive, averaging +0.4 in the last 20 years of the period. This positive returns correlation conformed to the traditional wisdom that higher rates mean lower equities. By contrast, in the second regime, prevailing since 1998, the correlation has been strongly negative, averaging -0.3, with higher rates associated with higher equities. The two regimes corresponded to two big macro-financial market cycles naturally suggesting they played a role in determining the regimes.
At a fundamental level, the correlation is driven by growth and inflation concerns, the Fed’s reaction function, and the equity-bond risk premium The correlation depends on trends in and shocks to the common drivers of bond and equity returns and their sensitivities to them. The 1966-1997 cycle of positive correlation was dominated by the long cycle in inflation, which rose from 2% to 10% over 16 years; then fell back over the next 17. With inflation the predominant driver of bond and earnings yields, the bond-equity returns correlation was positive and the inflation cycle explained the majority (70%) of it. Other drivers mattered, but much less so (30%). Since 1998, all of the factors have been important in driving the correlation. A key reason for the persistently negative returns correlation has been the equity-bond risk premium cycle: the late 1990s equity bubble; the prolonged de-rating after it burst and in the financial crisis; and the rerating since 2011.
Where next? Medium term, the drivers point to the returns correlation becoming less negative and approaching zero Continued declines in the unemployment rate, a rise in inflation back to 2%, the Fed moving from tapering to hiking, and continued normalization of the equity-bond risk premium, all point to a rise in the bond-equity returns correlation. From current very negative levels (-0.6), the correlation should move up close to zero by the end of 2015. This pattern would be similar to that in the 2003-2007 economic recovery.
Small changes in correlation can make large differences to asset allocation We use historical (1928-2013) excess returns and vol to calibrate the impact of correlation on bond/equity allocations that maximize risk-adjusted portfolio returns. A decline in correlation from +0.4 (average 1978-1997) to -0.3 (average post 1998) shifts the allocation in favor of bonds by 25 pp; and a rise from -0.3 to zero shifts the allocation in favor of equities by 10 pp.
Near term, we see the bond-equity correlation as having overshot As the macro data surprised negatively in January, the correlation fell from near zero, where it had been since the Fed’s taper communication, to a recession-like -0.6, which compares with our spot fair value estimate of -0.4. Implied correlations in swaps have since rebounded and are pricing a recovery in line with our estimate of fair value. We see better value in using the correlation view to cheapen directional equity and rates views using knock-in options; and expressing it in a long bond vol short equity vol trade.

12 May 2014
Asset Allocation
Page 2 Deutsche Bank Securities Inc.
Long Cycles In The Bond-Equity Correlation: Where Next?
Two very distinct regimes of bond-equity returns correlation. We focus on bond-equity return correlations since the mid-1960s as bond return volatility prior to that was essentially zero1. Since the mid 1960s there have been 2 very distinct regimes in the correlation.
Figure 1: Two regimes of bond-equity returns correlation
-0.7
-0.5
-0.3
-0.1
0.1
0.3
0.5
0.7
-0.7
-0.5
-0.3
-0.1
0.1
0.3
0.5
0.7
Jan-
62Ja
n-64
Jan-
66Ja
n-68
Jan-
70Ja
n-72
Jan-
74Ja
n-76
Jan-
78Ja
n-80
Jan-
82Ja
n-84
Jan-
86Ja
n-88
Jan-
90Ja
n-92
Jan-
94Ja
n-96
Jan-
98Ja
n-00
Jan-
02Ja
n-04
Jan-
06Ja
n-08
Jan-
10Ja
n-12
Jan-
14
Recession Bond-Equity returns correlation (daily returns, 12m window)
Average 1978-1997= +0.40
Average post-2001 = -0.32
Correlation calculated using daily US 10y bond and S&P 500 total returns over a rolling 12m window
Source: Haver, Deutsche Bank
Regime I: Consistently and strongly positive correlation from 1966-1997. From near zero, the correlation began to rise in the mid 1960s, but dipped back to zero for a brief period around the 1974 oil price shock and recession. Then rose into a +0.2 to +0.6 band where it stayed for 20 years. It is notable that this consistently positive and relatively high average correlation of +0.4 endured through a number of recession and recovery cycles.
Regime II: Strongly negative correlation since 1998, but also more volatile. In the late 1990s, the bond-equity correlation fell off sharply, turning negative in 1998. It has been predominantly negative since, averaging -0.3, but also varied more widely than in the first regime, ranging between -0.7 and +0.1. Negative extremes in the correlation obtained in 2003 as the post tech bubble de-rating of equities continued, deflation fears ran high and the Fed moved to keep policy rates well below its past average behavior (Taylor rule). As the Fed dropped its easing bias, the correlation began to rise, turning less and less negative, then briefly positive late in the recovery cycle in 2006 and continued to rise before falling hard again in 2007 as the recession and financial crisis began.
Why the break: big macro-financial market cycles? The two regimes in bond-equity returns correlation corresponded to two big macro-financial market cycles. This naturally suggests these cycles played a role in determining the correlation regimes. Regime I over 1966-1997 coincided with the big long inflation cycle. The post 1998 regime has seen a long equity risk premium cycle, which continues. The break in regimes began just as the long cycle in inflation was
1 For other analyses of the drivers and prospects for the correlation see PIMCO (The Stock-Bond Correlation, November 2 2013) and Lingfeng Li (Macroeconomic Factors and the Correlation of stock and Bond Returns, Yale November 2002).

12 May 2014
Asset Allocation
Deutsche Bank Securities Inc. Page 3
ending and the late 1990s equity bubble was beginning. The view that the two regimes were importantly driven by macro-financial market cycles is reinforced by the read of the behavior of equity earnings and bond yields. Earnings and bond yields moved very closely together from the 1960s through the late 1990s so were positively correlated. Then beginning in the late 1990s, they began to move in opposite directions. The tight positive correlation between bond yields and earnings yields in regime I and the steadiness of the bond-equity returns correlation also points to the predominance of a common driver during this period. The wide range and volatility of the correlation in regime II since the late 1990s suggests the importance of various drivers.
Figure 2: Earnings and bond yields
1%
3%
5%
7%
9%
11%
13%
15%
1%
3%
5%
7%
9%
11%
13%
15%
Jan-
62
Jan-
65
Jan-
68
Jan-
71
Jan-
74
Jan-
77
Jan-
80
Jan-
83
Jan-
86
Jan-
89
Jan-
92
Jan-
95
Jan-
98
Jan-
01
Jan-
04
Jan-
07
Jan-
10
Jan-
13
Recession 10y yield (rhs) EPS yield (rhs)
Correl1966-1997 = 0.691998-2014 = -0.82
Source: Bloomberg Finance LP, Haver, Deutsche Bank
At a fundamental level, the bond-equity correlation depends on trends and shocks to the common drivers of bond and equity returns, combined with their respective sensitivities to each of them. We identify four top-down drivers of the bond-equity correlation:
Growth concerns. We proxy these by the gap between the unemployment rate and the natural rate. Growth concerns should be associated with lower equities and lower bond yields implying a negative returns correlation;
Inflation concerns. We proxy these by the deviation of core PCE inflation from 2%, the Fed's target. Higher inflation concerns should be associated with higher bond yields and lower equities implying a positive returns correlation;
The Fed’s reaction function. We proxy this by the deviation of the Fed funds target rate from a Taylor rule. A market perceived bias to easing beyond the Fed's average historical behavior should lead for example to a bigger decline in rates on negative data surprises and a more negative correlation;
Equity-bond risk premium. We proxy this by the spread between earnings and bond yields. Medium term cycles in the relative risk premium (equity love or bond love) will create a negative correlation as movements in the relative risk premiums drive relative returns.

12 May 2014
Asset Allocation
Page 4 Deutsche Bank Securities Inc.
Positive bond-equity returns correlation regime during 1966-1997 predominantly driven by the inflation cycle. The first regime of positive correlation was dominated by the long up and down cycle in inflation. Core PCE inflation rose from 2% in 1966 to 10% by 1980 then fell back to 2% by 1997. The equity earnings yield (correlation of 0.85) and bond yields (0.58) closely followed inflation through both the up and down phases, with bond yields lagging inflation slightly in some periods. It follows that the positive correlation between bond and equity returns was driven in part by the inflation cycle. But how important was the inflation cycle in driving the positive bond-equity returns correlation? A decomposition of the bond-equity returns correlation over the period based on relative volatilities and the betas of earnings and bond yields to inflation indicates that the bulk (70%) of the correlation reflected the inflation cycle. The other drivers also had an impact, but much less so (30%).
Figure 3: The long cycle in inflation
0%1%2%3%4%5%6%7%8%9%10%11%
0%1%2%3%4%5%6%7%8%9%
10%11%
Jan-
62
Jan-
65
Jan-
68
Jan-
71
Jan-
74
Jan-
77
Jan-
80
Jan-
83
Jan-
86
Jan-
89
Jan-
92
Jan-
95
Jan-
98
Jan-
01
Jan-
04
Jan-
07
Jan-
10
Jan-
13
Recession Core PCE (yoy, lhs)
Source: BEA, Haver, Deutsche Bank
Figure 4: Equity earnings yields and inflation
3%
5%
7%
9%
11%
13%
15%
0%
2%
4%
6%
8%
10%
Jan-
62
Jan-
65
Jan-
68
Jan-
71
Jan-
74
Jan-
77
Jan-
80
Jan-
83
Jan-
86
Jan-
89
Jan-
92
Jan-
95
Jan-
98
Jan-
01
Jan-
04
Jan-
07
Jan-
10
Jan-
13
Recession Core PCE (yoy, lhs) EPS yield (rhs)
Correl1966-1997 = 0.841998-2014 = -0.14
Source: BEA, Bloomberg Finance LP, Haver, Deutsche Bank

12 May 2014
Asset Allocation
Deutsche Bank Securities Inc. Page 5
Figure 5: The 10y bond yield and inflation
1%
3%
5%
7%
9%
11%
13%
15%
0%
2%
4%
6%
8%
10%
Jan-
62
Jan-
65
Jan-
68
Jan-
71
Jan-
74
Jan-
77
Jan-
80
Jan-
83
Jan-
86
Jan-
89
Jan-
92
Jan-
95
Jan-
98
Jan-
01
Jan-
04
Jan-
07
Jan-
10
Jan-
13
Recession Core PCE (yoy, lhs) 10y yield (rhs)
Correl1966-1997 = 0.561998-2014 = 0.18
Source: BEA, Haver, Deutsche Bank
Negative correlations since 1998 reflect a combination of the four fundamental factors. Empirically, each of the four drivers played a role in driving the level and variation in the bond-equity returns correlation.
Diminished but significant role of inflation. Compared to the 1966-1997 regime inflation has been range bound between 1% and 2.5% since 1998. As the volatility of inflation has diminished, its relative importance in driving the bond-equity correlation has diminished, while the importance of the other drivers has risen. It is notable that the correlation is tightly tied to inflation in some periods but less so in others.
Figure 6: The bond-equity returns correlation and inflation since 1998
1.0%
1.2%
1.4%
1.6%
1.8%
2.0%
2.2%
2.4%
2.6%
-0.7
-0.5
-0.3
-0.1
0.1
0.3
Jan-
98O
ct-9
8Ju
l-99
Apr
-00
Jan-
01O
ct-0
1Ju
l-02
Apr
-03
Jan-
04O
ct-0
4Ju
l-05
Apr
-06
Jan-
07O
ct-0
7Ju
l-08
Apr
-09
Jan-
10O
ct-1
0Ju
l-11
Apr
-12
Jan-
13O
ct-1
3Ju
l-14
Recession Correl (lhs) Core PCE (yoy)
Correl: 0.20
Source: BEA, Haver, Deutsche Bank

12 May 2014
Asset Allocation
Page 6 Deutsche Bank Securities Inc.
Closely tied to unemployment. The bond-equity returns correlation has been closely tied to the unemployment gap. In the 2003-2007 recovery cycle, the peak and trough in the unemployment gap in 2003 and in 2007, respectively, marked the turning points in the bond-equity returns correlation. The bond-equity returns correlation has been closely tied to the unemployment gap (-0.63) over the period. In this cycle, though the unemployment gap peaked in late 2009 and has shrunk steadily since, the bond-equity returns correlation ratcheted down in the summers of 2010 and 2011, and stayed there until the Fed's taper communication last summer, implying other factors were at play, and suggesting in particular a role for Fed policies in driving the bond-equity returns correlation.
Figure 7: The bond-equity returns correlation and unemployment since 1998
-1%
0%
1%
2%
3%
4%
5%-0.7
-0.5
-0.3
-0.1
0.1
0.3
Jan-
98
Oct
-98
Jul-9
9
Apr
-00
Jan-
01
Oct
-01
Jul-0
2
Apr
-03
Jan-
04
Oct
-04
Jul-0
5
Apr
-06
Jan-
07
Oct
-07
Jul-0
8
Apr
-09
Jan-
10
Oct
-10
Jul-1
1
Apr
-12
Jan-
13
Oct
-13
Jul-1
4
Recession Correl (lhs) UE dev from natural rate (inv,rhs)
Correl: -0.63
Source: BLS, CBO, Haver, Deutsche Bank
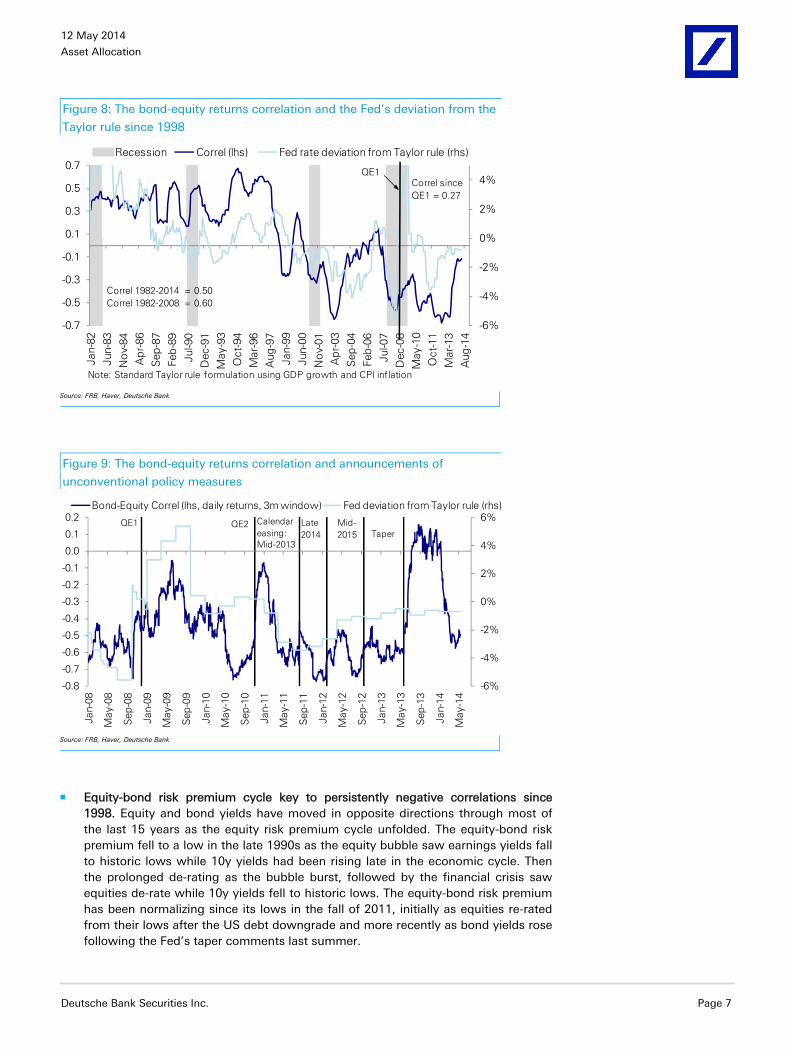
Fed reaction function added to negative correlations. Fed policy looks to have been an important driver of the bond-equity correlation since the early 1980s. Since the Fed raised interest rates in 1982 to fight inflation, all the way through the beginning of QE1 in December 2008, the relationship between the deviation of policy rates from the Taylor rule and the bond-equity returns correlation was strong (0.6). Using the same measure of the Fed’s policy bias, the Taylor rule gap, the relationship looks to have weakened (0.27) since December 2008 when QE1 was implemented. But in our view, the Fed’s reaction function has continued to be an important driver of the bond-equity returns correlation. Since December 2008, as policy rates remained at the zero floor and the Fed adopted a number of nontraditional measures (QEs, calendar rate guidance and data-dependent forward guidance), these announcements introduced additional gyrations in the correlation over and above those captured by the Taylor rule gap. So Fed policy was a driver just not as measured by the Taylor rule gap. In the summer of 2010 for example, as the market began to anticipate QE2 the bond-equity returns correlation, which had remained tied to the Taylor rule gap, plunged below as the market priced in QE2, then as QE2 was announced and implemented, the correlation rose. So in our reading the impact of the Fed’s reaction function since September 2008 has been stronger than it looks.
12 May 2014
Asset Allocation
Deutsche Bank Securities Inc. Page 7
Figure 8: The bond-equity returns correlation and the Fed’s deviation from the
Taylor rule since 1998
-6%
-4%
-2%
0%
2%
4%
-0.7
-0.5
-0.3
-0.1
0.1
0.3
0.5
0.7
Jan-
82Ju
n-83
No
v-84
Apr
-86
Sep
-87
Feb-
89Ju
l-90
Dec
-91
May
-93
Oct
-94
Mar
-96
Aug
-97
Jan-
99Ju
n-00
No
v-01
Apr
-03
Sep
-04
Feb-
06Ju
l-07
Dec
-08
May
-10
Oct
-11
Mar
-13
Aug
-14
Recession Correl (lhs) Fed rate deviation from Taylor rule (rhs)
Correl 1982-2014 = 0.50Correl 1982-2008 = 0.60
Correl sinceQE1 = 0.27
QE1
Note: Standard Taylor rule formulation using GDP growth and CPI inflation
Source: FRB, Haver, Deutsche Bank
Figure 9: The bond-equity returns correlation and announcements of
unconventional policy measures
-6%
-4%
-2%
0%
2%
4%
6%
-0.8
-0.7
-0.6
-0.5
-0.4
-0.3
-0.2
-0.1
0.0
0.1
0.2
Jan-
08
May
-08
Sep-
08
Jan-
09
May
-09
Sep-
09
Jan-
10
May
-10
Sep-
10
Jan-
11
May
-11
Sep-
11
Jan-
12
May
-12
Sep-
12
Jan-
13
May
-13
Sep-
13
Jan-
14
May
-14
Bond-Equity Correl (lhs, daily returns, 3m window) Fed deviation from Taylor rule (rhs)
QE1 QE2 Calendar easing: Mid-2013
Late2014 Taper
Mid-2015
Source: FRB, Haver, Deutsche Bank
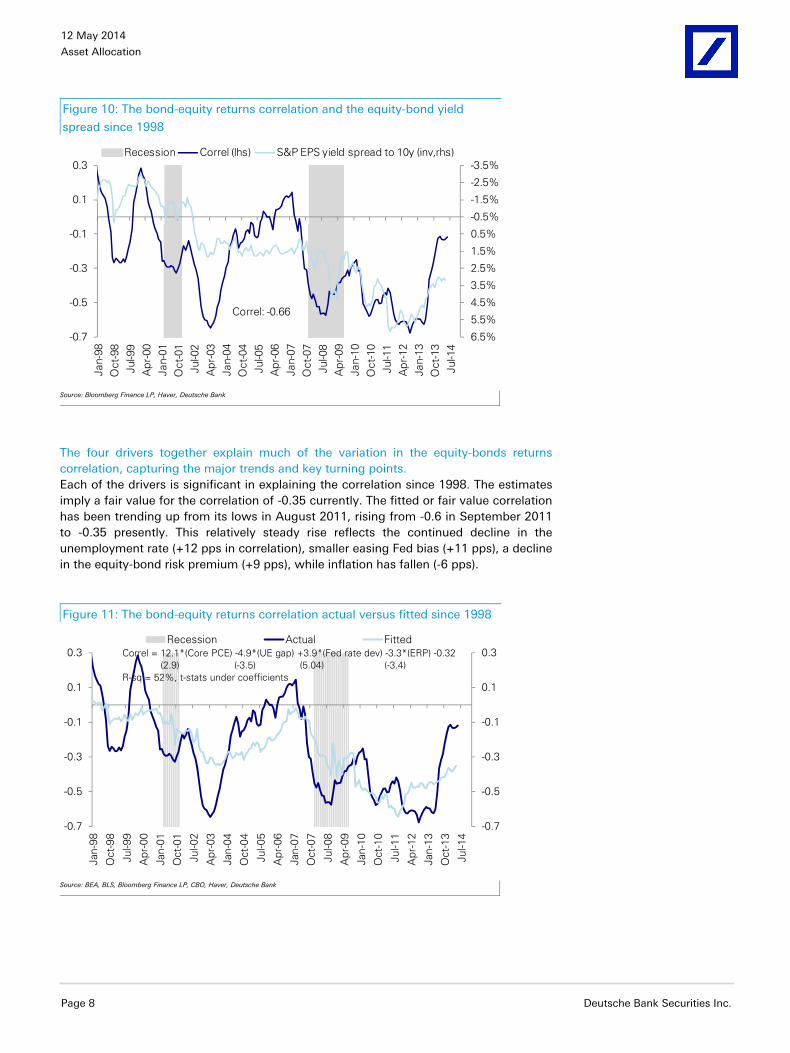
Equity-bond risk premium cycle key to persistently negative correlations since 1998. Equity and bond yields have moved in opposite directions through most of the last 15 years as the equity risk premium cycle unfolded. The equity-bond risk premium fell to a low in the late 1990s as the equity bubble saw earnings yields fall to historic lows while 10y yields had been rising late in the economic cycle. Then the prolonged de-rating as the bubble burst, followed by the financial crisis saw equities de-rate while 10y yields fell to historic lows. The equity-bond risk premium has been normalizing since its lows in the fall of 2011, initially as equities re-rated from their lows after the US debt downgrade and more recently as bond yields rose following the Fed’s taper comments last summer.
12 May 2014
Asset Allocation
Page 8 Deutsche Bank Securities Inc.
Figure 10: The bond-equity returns correlation and the equity-bond yield
spread since 1998
-3.5%
-2.5%
-1.5%
-0.5%
0.5%
1.5%
2.5%
3.5%
4.5%
5.5%
6.5%-0.7
-0.5
-0.3
-0.1
0.1
0.3
Jan-
98O
ct-9
8Ju
l-99
Apr
-00
Jan-
01O
ct-0
1Ju
l-02
Apr
-03
Jan-
04O
ct-0
4Ju
l-05
Apr
-06
Jan-
07O
ct-0
7Ju
l-08
Apr
-09
Jan-
10O
ct-1
0Ju
l-11
Apr
-12
Jan-
13O
ct-1
3Ju
l-14
Recession Correl (lhs) S&P EPS yield spread to 10y (inv,rhs)
Correl: -0.66
Source: Bloomberg Finance LP, Haver, Deutsche Bank
The four drivers together explain much of the variation in the equity-bonds returns correlation, capturing the major trends and key turning points. Each of the drivers is significant in explaining the correlation since 1998. The estimates imply a fair value for the correlation of -0.35 currently. The fitted or fair value correlation has been trending up from its lows in August 2011, rising from -0.6 in September 2011 to -0.35 presently. This relatively steady rise reflects the continued decline in the unemployment rate (+12 pps in correlation), smaller easing Fed bias (+11 pps), a decline in the equity-bond risk premium (+9 pps), while inflation has fallen (-6 pps).
Figure 11: The bond-equity returns correlation actual versus fitted since 1998
-0.7
-0.5
-0.3
-0.1
0.1
0.3
-0.7
-0.5
-0.3
-0.1
0.1
0.3
Jan-
98
Oct
-98
Jul-9
9
Apr
-00
Jan-
01
Oct
-01
Jul-0
2
Apr
-03
Jan-
04
Oct
-04
Jul-0
5
Apr
-06
Jan-
07
Oct
-07
Jul-0
8
Apr
-09
Jan-
10
Oct
-10
Jul-1
1
Apr
-12
Jan-
13
Oct
-13
Jul-1
4
Recession Actual FittedCorrel = 12.1*(Core PCE) -4.9*(UE gap) +3.9*(Fed rate dev) -3.3*(ERP) -0.32
(2.9) (-3.5) (5.04) (-3.4)R-sq = 52%, t-stats under coefficients
Source: BEA, BLS, Bloomberg Finance LP, CBO, Haver, Deutsche Bank

12 May 2014
Asset Allocation
Deutsche Bank Securities Inc. Page 9
Where next for the bond-equity returns correlation? Over the medium term, the outlook for each of the four drivers point to the bond-equities returns correlation moving higher (+30pp) and becoming less negative, close to zero but still slightly negative (-0.05) by the end of 2015. This pattern would be very similar to that observed in the last cycle.
Unemployment should continue to fall in line with the trend of 0.7pp per year, in place since its recovery began, with recent data points suggesting the pace may in fact have quickened. Unemployment falling to its natural rate of around 5.5% should raise the bond-equity returns correlation by +5pp;
Continued strength in core services inflation and an unwinding of idiosyncratic factors points to an inflation reset higher sooner rather than later. A rise in core inflation to 2% should raise correlation by +10pp;
Unemployment approaching its natural rate and an inflation reset higher should increase pressure on the Fed to raise its guidance for the path of Fed rates and bring it closer to the traditional Taylor rule, pushing correlation up by +5pp;
Finally, as the still large equity-bond risk premium continues to normalize, it will keep the returns correlation negative but less and less so as the magnitude declines. Every 1pp decline in the risk premium should see correlation +3pp higher, and a complete normalization by the end of next year would push correlation up by 10pp.
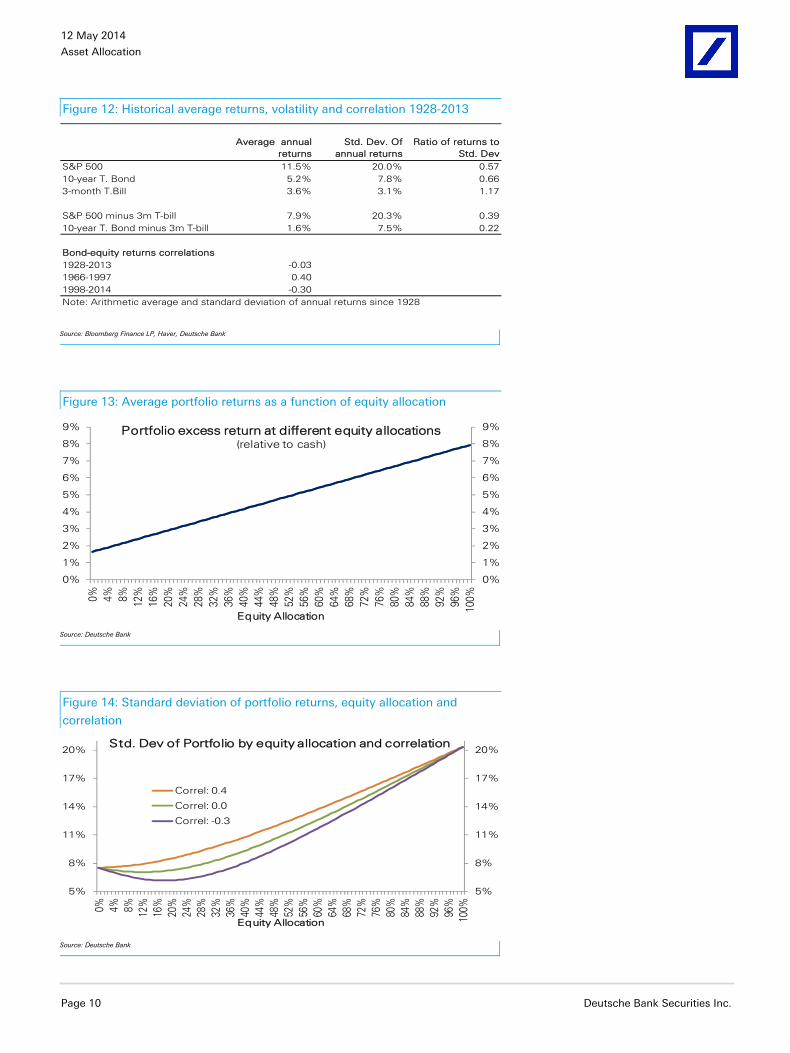
Small changes in the correlation can make large differences to asset allocation. Changes in the bond-equity returns correlation impact the vol of a portfolio and hence risk adjusted returns for all equity-bond allocations. While asset allocation does not depend only on maximum risk-reward given constraints of risk tolerance, maturity, liquidity, etc., changes in the correlation will influence the optimal bond/equity allocation at the margin. We use long run historical (1928-2013) equity and bond excess returns (relative to cash) and vol to calibrate the impact of correlation on bond/equity allocations that maximize risk adjusted returns in a stylized portfolio. The change in allocations is not linear, with the bond portfolio share falling in favor of equities slowly for correlation shifts from very negative levels to zero but very rapidly as correlation turns increasingly positive.
From regime I to regime II. A decline in the correlation from the average 1978-1997 level of +0.4 to the post 1998 average of -0.3 would raise the allocation in favor of to bonds away from equities by 25 percentage points.
To the top of the regime II range. An increase in the correlation from -0.3 to zero would lower the share of bonds in favor of equities by 10 percentage points.
Looking forward. The impact of changes in the correlation on desired asset allocation depends in general on the differential in expected risk adjusted returns. Looking forward, we expect risk adjusted returns for equities to be significantly higher than those for bonds. Median ex-recession S&P 500 returns are 17% historically, while bond returns should be constrained to about 1.4% by already low yields in a rising rates environment. Equity vol should remain close to its ex-recession average of 13%, while bond vol which has been kept near historic lows by various Fed policies and low inflation should rise.
12 May 2014
Asset Allocation
Page 10 Deutsche Bank Securities Inc.
Figure 12: Historical average returns, volatility and correlation 1928-2013
Average annual returns
Std. Dev. Of annual returns
Ratio of returns to Std. Dev
S&P 500 11.5% 20.0% 0.5710-year T. Bond 5.2% 7.8% 0.663-month T.Bill 3.6% 3.1% 1.17
S&P 500 minus 3m T-bill 7.9% 20.3% 0.3910-year T. Bond minus 3m T-bill 1.6% 7.5% 0.22
Bond-equity returns correlations1928-2013 -0.031966-1997 0.401998-2014 -0.30Note: Arithmetic average and standard deviation of annual returns since 1928
Source: Bloomberg Finance LP, Haver, Deutsche Bank
Figure 13: Average portfolio returns as a function of equity allocation
0%
1%
2%
3%
4%
5%
6%
7%
8%
9%
0%
1%
2%
3%
4%
5%
6%
7%
8%
9%
0% 4% 8% 12%
16%
20%
24%
28%
32%
36%
40%
44%
48%
52%
56%
60%
64%
68%
72%
76%
80%
84%
88%
92%
96%
100%
Equity Allocation
Portfolio excess return at different equity allocations(relative to cash)
Source: Deutsche Bank
Figure 14: Standard deviation of portfolio returns, equity allocation and
correlation
5%
8%
11%
14%
17%
20%
5%
8%
11%
14%
17%
20%
0% 4% 8% 12%
16%
20%
24%
28%
32%
36%
40%
44%
48%
52%
56%
60%
64%
68%
72%
76%
80%
84%
88%
92%
96%
100%
Equity Allocation
Std. Dev of Portfolio by equity allocation and correlation
Correl: 0.4
Correl: 0.0
Correl: -0.3
Source: Deutsche Bank

12 May 2014
Asset Allocation
Deutsche Bank Securities Inc. Page 11
Figure 15: Risk-adjusted portfolio returns, equity allocation and correlation
0.20
0.25
0.30
0.35
0.40
0.45
0.50
0.55
0.20
0.25
0.30
0.35
0.40
0.45
0.50
0.55
0% 4% 8% 12%
16%
20%
24%
28%
32%
36%
40%
44%
48%
52%
56%
60%
64%
68%
72%
76%
80%
84%
88%
92%
96%
100%
Equity Allocation
Portfolio Sharpe by equity allocation and correlation
Correl: -0.3
Correl: 0.0
Correl: 0.4
Source: Deutsche Bank
Figure 16: Risk-adjusted return maximizing portfolio shares and correlation
0%
10%
20%
30%
40%
50%
60%
70%
80%
90%
100%
0%
10%
20%
30%
40%
50%
60%
70%
80%
90%
100%
-55%
-50%
-45%
-40%
-35%
-30%
-25%
-20%
-15%
-10% -5
% 0% 5% 10%
15%
20%
25%
30%
35%
40%
45%
50%
55%
Bond-equity correlation
Allocation for maximum Sharpe ratioEquity Allocation Bond Allocation
Avg Correl 1966-1997 = 0.4
Correl = 0Avg Correl 1998-2014 = -0.3
Source: Deutsche Bank

12 May 2014
Asset Allocation
Page 12 Deutsche Bank Securities Inc.
Near term, we see the bond-equity correlation as having overshot. As the macro data began to surprise negatively in January, the 3m returns correlation fell from near zero, where it had been post the Fed’s taper communication last summer, to a recession-like -0.6, versus our estimate of fair value of -0.35 and rising. Implied correlations in swaps have since rebounded and look to be pricing a recovery broadly in line with our estimates. We see better value in using the correlation view to cheapen directional equity and rates views using knock-in options. A view on the correlation can also be expressed in the vol space with shorter term variations in the 3m correlation tied to relative bond vol versus equity vol. We see stronger data and a reset of the expected inflation trajectory prompting a re-pricing of the pace of Fed rate normalization and the ratio rising as it did last summer.
Figure 17: 3m and 12m bond-equity returns correlations
-0.8
-0.6
-0.4
-0.2
0.0
0.2
0.4
0.6
-0.8
-0.6
-0.4
-0.2
0.0
0.2
0.4
0.6
Jan-
98O
ct-9
8Ju
l-99
Apr
-00
Jan-
01O
ct-0
1Ju
l-02
Apr
-03
Jan-
04O
ct-0
4Ju
l-05
Apr
-06
Jan-
07O
ct-0
7Ju
l-08
Apr
-09
Jan-
10O
ct-1
0Ju
l-11
Apr
-12
Jan-
13O
ct-1
3Ju
l-14
Recession 12m correl 3m correl
Source: Haver, Deutsche Bank
Figure 18: Bond-equity returns correlation and the MOVE/VIX ratio
-0.3
-0.2
-0.1
0.0
0.1
0.2
0.3
0.4
0.5
0.6
2
3
4
5
6
7
8
Jan-
09
Apr
-09
Jul-0
9
Oct
-09
Jan-
10
Apr
-10
Jul-1
0
Oct
-10
Jan-
11
Apr
-11
Jul-1
1
Oct
-11
Jan-
12
Apr
-12
Jul-1
2
Oct
-12
Jan-
13
Apr
-13
Jul-1
3
Oct
-13
Jan-
14
Apr
-14
Jul-1
4
MOVE/VIX ratio (lhs) Deviation of 3m correl from fit (rhs)
Correl since 2009 = 0.58
Source: Bloomberg Finance LP, Haver, Deutsche Bank

12 May 2014
Asset Allocation
Deutsche Bank Securities Inc. Page 13
The primary author of this report, Binky Chadha, wishes to acknowledge the contributions made by Karthik Prabhu, Magesh Kumar, Manish Kothari and Prakash Chithambaram, employees of Irevna, a division of CRISIL Limited, a third-party provider of offshore research support services to Deutsche Bank

12 May 2014
Asset Allocation
Page 14 Deutsche Bank Securities Inc.
Appendix 1
Important Disclosures Additional information available upon request For disclosures pertaining to recommendations or estimates made on securities other than the primary subject of this research, please see the most recently published company report or visit our global disclosure look-up page on our website at http://gm.db.com/ger/disclosure/DisclosureDirectory.eqsr Analyst Certification
The views expressed in this report accurately reflect the personal views of the undersigned lead analyst about the subject issuers and the securities of those issuers. In addition, the undersigned lead analyst has not and will not receive any compensation for providing a specific recommendation or view in this report. Binky Chadha/Keith Parker/John Tierney/Parag Thatte Equity rating key Equity rating dispersion and banking relationships
Buy: Based on a current 12- month view of total share-holder return (TSR = percentage change in share price from current price to projected target price plus pro-jected dividend yield ) , we recommend that investors buy the stock. Sell: Based on a current 12-month view of total share-holder return, we recommend that investors sell the stock Hold: We take a neutral view on the stock 12-months out and, based on this time horizon, do not recommend either a Buy or Sell. Notes:
1. Newly issued research recommendations and target prices always supersede previously published research. 2. Ratings definitions prior to 27 January, 2007 were:
Buy: Expected total return (including dividends) of 10% or more over a 12-month period Hold: Expected total return (including dividends) between -10% and 10% over a 12-month period Sell: Expected total return (including dividends) of -10% or worse over a 12-month period
46 % 48 %
5 %
38 % 32 %
18 %0
200400600800
1000120014001600
Buy Hold Sell
Global Universe
Companies Covered Cos. w/ Banking Relationship

12 May 2014
Asset Allocation
Deutsche Bank Securities Inc. Page 15
Regulatory Disclosures
1. Important Additional Conflict Disclosures
Aside from within this report, important conflict disclosures can also be found at https://gm.db.com/equities under the "Disclosures Lookup" and "Legal" tabs. Investors are strongly encouraged to review this information before investing.
2. Short-Term Trade Ideas
Deutsche Bank equity research analysts sometimes have shorter-term trade ideas (known as SOLAR ideas) that are consistent or inconsistent with Deutsche Bank's existing longer term ratings. These trade ideas can be found at the SOLAR link at http://gm.db.com.
3. Country-Specific Disclosures
Australia and New Zealand: This research, and any access to it, is intended only for "wholesale clients" within the meaning of the Australian Corporations Act and New Zealand Financial Advisors Act respectively. Brazil: The views expressed above accurately reflect personal views of the authors about the subject company(ies) and its(their) securities, including in relation to Deutsche Bank. The compensation of the equity research analyst(s) is indirectly affected by revenues deriving from the business and financial transactions of Deutsche Bank. In cases where at least one Brazil based analyst (identified by a phone number starting with +55 country code) has taken part in the preparation of this research report, the Brazil based analyst whose name appears first assumes primary responsibility for its content from a Brazilian regulatory perspective and for its compliance with CVM Instruction # 483. EU countries: Disclosures relating to our obligations under MiFiD can be found at http://www.globalmarkets.db.com/riskdisclosures. Japan: Disclosures under the Financial Instruments and Exchange Law: Company name - Deutsche Securities Inc. Registration number - Registered as a financial instruments dealer by the Head of the Kanto Local Finance Bureau (Kinsho) No. 117. Member of associations: JSDA, Type II Financial Instruments Firms Association, The Financial Futures Association of Japan, Japan Investment Advisers Association. Commissions and risks involved in stock transactions - for stock transactions, we charge stock commissions and consumption tax by multiplying the transaction amount by the commission rate agreed with each customer. Stock transactions can lead to losses as a result of share price fluctuations and other factors. Transactions in foreign stocks can lead to additional losses stemming from foreign exchange fluctuations. "Moody's", "Standard & Poor's", and "Fitch" mentioned in this report are not registered credit rating agencies in Japan unless Japan or "Nippon" is specifically designated in the name of the entity. Reports on Japanese listed companies not written by analysts of Deutsche Securities Inc. (DSI) are written by Deutsche Bank Group's analysts with the coverage companies specified by DSI. Qatar: Deutsche Bank AG in the Qatar Financial Centre (registered no. 00032) is regulated by the Qatar Financial Centre Regulatory Authority. Deutsche Bank AG - QFC Branch may only undertake the financial services activities that fall within the scope of its existing QFCRA license. Principal place of business in the QFC: Qatar Financial Centre, Tower, West Bay, Level 5, PO Box 14928, Doha, Qatar. This information has been distributed by Deutsche Bank AG. Related financial products or services are only available to Business Customers, as defined by the Qatar Financial Centre Regulatory Authority. Russia: This information, interpretation and opinions submitted herein are not in the context of, and do not constitute, any appraisal or evaluation activity requiring a license in the Russian Federation. Kingdom of Saudi Arabia: Deutsche Securities Saudi Arabia LLC Company, (registered no. 07073-37) is regulated by the Capital Market Authority. Deutsche Securities Saudi Arabia may only undertake the financial services activities that fall within the scope of its existing CMA license. Principal place of business in Saudi Arabia: King Fahad Road, Al Olaya District, P.O. Box 301809, Faisaliah Tower - 17th Floor, 11372 Riyadh, Saudi Arabia. United Arab Emirates: Deutsche Bank AG in the Dubai International Financial Centre (registered no. 00045) is regulated by the Dubai Financial Services Authority. Deutsche Bank AG - DIFC Branch may only undertake the financial services activities that fall within the scope of its existing DFSA license. Principal place of business in the DIFC: Dubai International Financial Centre, The Gate Village, Building 5, PO Box 504902, Dubai, U.A.E. This information has been distributed by Deutsche Bank AG. Related financial products or services are only available to Professional Clients, as defined by the Dubai Financial Services Authority.

12 May 2014
Asset Allocation
Page 16 Deutsche Bank Securities Inc.
Risks to Fixed Income Positions Macroeconomic fluctuations often account for most of the risks associated with exposures to instruments that promise to pay fixed or variable interest rates. For an investor that is long fixed rate instruments (thus receiving these cash flows), increases in interest rates naturally lift the discount factors applied to the expected cash flows and thus cause a loss. The longer the maturity of a certain cash flow and the higher the move in the discount factor, the higher will be the loss. Upside surprises in inflation, fiscal funding needs, and FX depreciation rates are among the most common adverse macroeconomic shocks to receivers. But counterparty exposure, issuer creditworthiness, client segmentation, regulation (including changes in assets holding limits for different types of investors), changes in tax policies, currency convertibility (which may constrain currency conversion, repatriation of profits and/or the liquidation of positions), and settlement issues related to local clearing houses are also important risk factors to be considered. The sensitivity of fixed income instruments to macroeconomic shocks may be mitigated by indexing the contracted cash flows to inflation, to FX depreciation, or to specified interest rates – these are common in emerging markets. It is important to note that the index fixings may -- by construction -- lag or mis-measure the actual move in the underlying variables they are intended to track. The choice of the proper fixing (or metric) is particularly important in swaps markets, where floating coupon rates (i.e., coupons indexed to a typically short-dated interest rate reference index) are exchanged for fixed coupons. It is also important to acknowledge that funding in a currency that differs from the currency in which the coupons to be received are denominated carries FX risk. Naturally, options on swaps (swaptions) also bear the risks typical to options in addition to the risks related to rates movements.

David Folkerts-Landau Group Chief Economist
Member of the Group Executive Committee
Guy Ashton Global Chief Operating Officer
Research
Marcel Cassard Global Head
FICC Research & Global Macro Economics
Richard Smith and Steve Pollard Co-Global Heads Equity Research
Michael Spencer Regional Head
Asia Pacific Research
Ralf Hoffmann Regional Head
Deutsche Bank Research, Germany
Andreas Neubauer Regional Head
Equity Research, Germany
Steve Pollard Regional Head
Americas Research
International locations
Deutsche Bank AG Deutsche Bank Place Level 16 Corner of Hunter & Phillip Streets Sydney, NSW 2000 Australia Tel: (61) 2 8258 1234
Deutsche Bank AG Große Gallusstraße 10-14 60272 Frankfurt am Main Germany Tel: (49) 69 910 00
Deutsche Bank AG Filiale Hongkong International Commerce Centre, 1 Austin Road West,Kowloon, Hong Kong Tel: (852) 2203 8888
Deutsche Securities Inc. 2-11-1 Nagatacho Sanno Park Tower Chiyoda-ku, Tokyo 100-6171 Japan Tel: (81) 3 5156 6770
Deutsche Bank AG London 1 Great Winchester Street London EC2N 2EQ United Kingdom Tel: (44) 20 7545 8000
Deutsche Bank Securities Inc. 60 Wall Street New York, NY 10005 United States of America Tel: (1) 212 250 2500
Global Disclaimer The information and opinions in this report were prepared by Deutsche Bank AG or one of its affiliates (collectively "Deutsche Bank"). The information herein is believed to be reliable and has been obtained from public sources believed to be reliable. Deutsche Bank makes no representation as to the accuracy or completeness of such information.
Deutsche Bank may engage in securities transactions, on a proprietary basis or otherwise, in a manner inconsistent with the view taken in this research report. In addition, others within Deutsche Bank, including strategists and sales staff, may take a view that is inconsistent with that taken in this research report.
Opinions, estimates and projections in this report constitute the current judgement of the author as of the date of this report. They do not necessarily reflect the opinions of Deutsche Bank and are subject to change without notice. Deutsche Bank has no obligation to update, modify or amend this report or to otherwise notify a recipient thereof in the event that any opinion, forecast or estimate set forth herein, changes or subsequently becomes inaccurate. Prices and availability of financial instruments are subject to change without notice. This report is provided for informational purposes only. It is not an offer or a solicitation of an offer to buy or sell any financial instruments or to participate in any particular trading strategy. Target prices are inherently imprecise and a product of the analyst judgement.
In August 2009, Deutsche Bank instituted a new policy whereby analysts may choose not to set or maintain a target price of certain issuers under coverage with a Hold rating. In particular, this will typically occur for "Hold" rated stocks having a market cap smaller than most other companies in its sector or region. We believe that such policy will allow us to make best use of our resources. Please visit our website at http://gm.db.com to determine the target price of any stock.
The financial instruments discussed in this report may not be suitable for all investors and investors must make their own informed investment decisions. Stock transactions can lead to losses as a result of price fluctuations and other factors. If a financial instrument is denominated in a currency other than an investor's currency, a change in exchange rates may adversely affect the investment. Past performance is not necessarily indicative of future results. Deutsche Bank may with respect to securities covered by this report, sell to or buy from customers on a principal basis, and consider this report in deciding to trade on a proprietary basis.
Unless governing law provides otherwise, all transactions should be executed through the Deutsche Bank entity in the investor's home jurisdiction. In the U.S. this report is approved and/or distributed by Deutsche Bank Securities Inc., a member of the NYSE, the NASD, NFA and SIPC. In Germany this report is approved and/or communicated by Deutsche Bank AG Frankfurt authorized by the BaFin. In the United Kingdom this report is approved and/or communicated by Deutsche Bank AG London, a member of the London Stock Exchange and regulated by the Financial Conduct Authority for the conduct of investment business in the UK and authorized by the BaFin. This report is distributed in Hong Kong by Deutsche Bank AG, Hong Kong Branch, in Korea by Deutsche Securities Korea Co. This report is distributed in Singapore by Deutsche Bank AG, Singapore Branch or Deutsche Securities Asia Limited, Singapore Branch (One Raffles Quay #18-00 South Tower Singapore 048583, +65 6423 8001), and recipients in Singapore of this report are to contact Deutsche Bank AG, Singapore Branch or Deutsche Securities Asia Limited, Singapore Branch in respect of any matters arising from, or in connection with, this report. Where this report is issued or promulgated in Singapore to a person who is not an accredited investor, expert investor or institutional investor (as defined in the applicable Singapore laws and regulations), Deutsche Bank AG, Singapore Branch or Deutsche Securities Asia Limited, Singapore Branch accepts legal responsibility to such person for the contents of this report. In Japan this report is approved and/or distributed by Deutsche Securities Inc. The information contained in this report does not constitute the provision of investment advice. In Australia, retail clients should obtain a copy of a Product Disclosure Statement (PDS) relating to any financial product referred to in this report and consider the PDS before making any decision about whether to acquire the product. Deutsche Bank AG Johannesburg is incorporated in the Federal Republic of Germany (Branch Register Number in South Africa: 1998/003298/10). Additional information relative to securities, other financial products or issuers discussed in this report is available upon request. This report may not be reproduced, distributed or published by any person for any purpose without Deutsche Bank's prior written consent. Please cite source when quoting.
Copyright © 2014 Deutsche Bank AG