Embed Size (px)
Citation preview
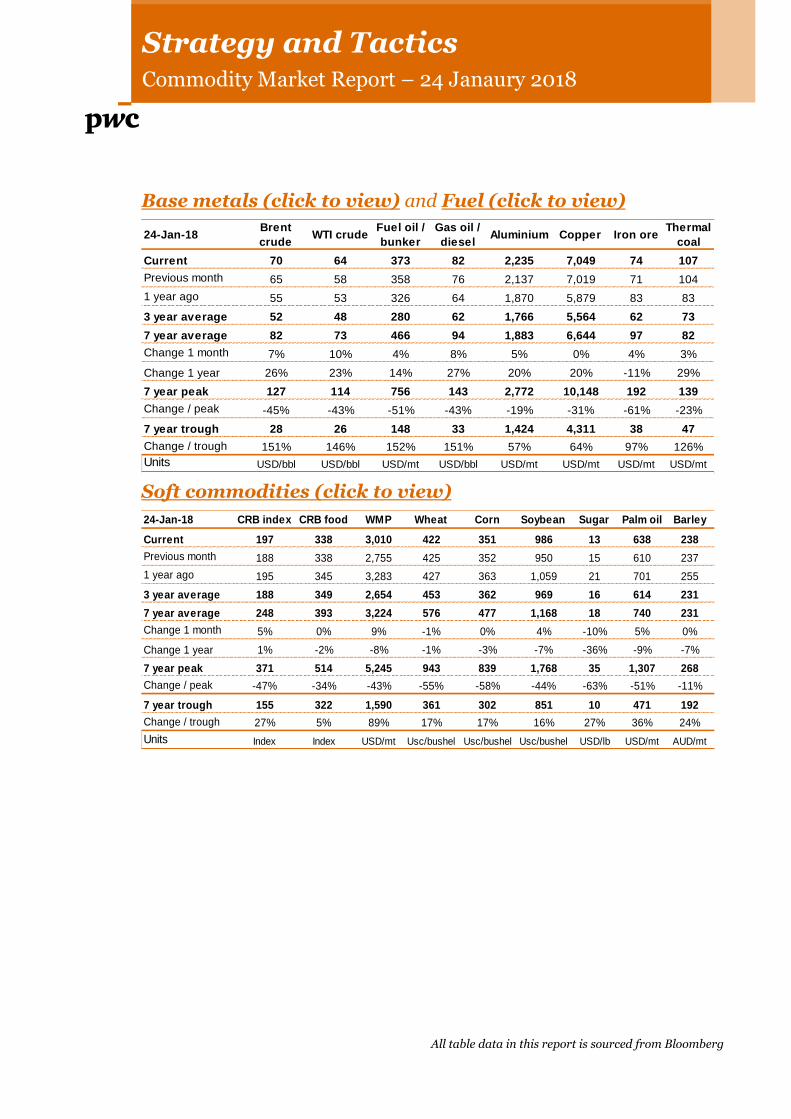
Strategy and Tactics Commodity Market Report – 24 Janaury 2018
All table data in this report is sourced from Bloomberg
Base metals (click to view) and Fuel (click to view)
Soft commodities (click to view)
24-Jan-18Brent
crudeWTI crude
Fuel oil /
bunker
Gas oil /
dieselAluminium Copper Iron ore
Thermal
coal
Current 70 64 373 82 2,235 7,049 74 107
Previous month 65 58 358 76 2,137 7,019 71 104
1 year ago 55 53 326 64 1,870 5,879 83 83
3 year average 52 48 280 62 1,766 5,564 62 73
7 year average 82 73 466 94 1,883 6,644 97 82
Change 1 month 7% 10% 4% 8% 5% 0% 4% 3%
Change 1 year 26% 23% 14% 27% 20% 20% -11% 29%
7 year peak 127 114 756 143 2,772 10,148 192 139
Change / peak -45% -43% -51% -43% -19% -31% -61% -23%
7 year trough 28 26 148 33 1,424 4,311 38 47
Change / trough 151% 146% 152% 151% 57% 64% 97% 126%
Units USD/bbl USD/bbl USD/mt USD/bbl USD/mt USD/mt USD/mt USD/mt
24-Jan-18 CRB index CRB food WMP Wheat Corn Soybean Sugar Palm oil Barley
Current 197 338 3,010 422 351 986 13 638 238
Previous month 188 338 2,755 425 352 950 15 610 237
1 year ago 195 345 3,283 427 363 1,059 21 701 255
3 year average 188 349 2,654 453 362 969 16 614 231
7 year average 248 393 3,224 576 477 1,168 18 740 231
Change 1 month 5% 0% 9% -1% 0% 4% -10% 5% 0%
Change 1 year 1% -2% -8% -1% -3% -7% -36% -9% -7%
7 year peak 371 514 5,245 943 839 1,768 35 1,307 268
Change / peak -47% -34% -43% -55% -58% -44% -63% -51% -11%
7 year trough 155 322 1,590 361 302 851 10 471 192
Change / trough 27% 5% 89% 17% 17% 16% 27% 36% 24%
Units Index Index USD/mt Usc/bushel Usc/bushel Usc/bushel USD/lb USD/mt AUD/mt
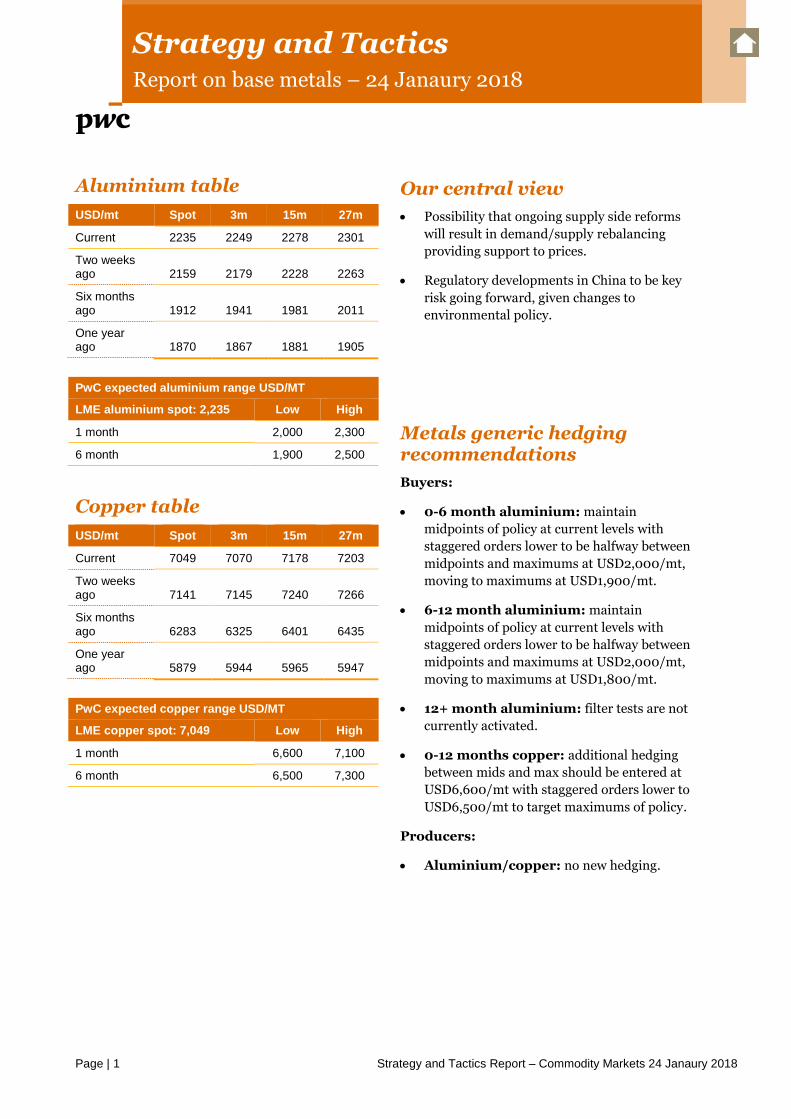
Strategy and Tactics Report on base metals – 24 Janaury 2018
Page | 1 Strategy and Tactics Report – Commodity Markets 24 Janaury 2018
Aluminium table
USD/mt Spot 3m 15m 27m
Current 2235 2249 2278 2301
Two weeks ago 2159 2179 2228 2263
Six months ago 1912 1941 1981 2011
One year ago 1870 1867 1881 1905
PwC expected aluminium range USD/MT
LME aluminium spot: 2,235 Low High
1 month 2,000 2,300
6 month 1,900 2,500
Copper table
USD/mt Spot 3m 15m 27m
Current 7049 7070 7178 7203
Two weeks ago 7141 7145 7240 7266
Six months ago 6283 6325 6401 6435
One year ago 5879 5944 5965 5947
PwC expected copper range USD/MT
LME copper spot: 7,049 Low High
1 month 6,600 7,100
6 month 6,500 7,300
Our central view
Possibility that ongoing supply side reforms
will result in demand/supply rebalancing
providing support to prices.
Regulatory developments in China to be key
risk going forward, given changes to
environmental policy.
Metals generic hedging recommendations
Buyers:
0-6 month aluminium: maintain
midpoints of policy at current levels with
staggered orders lower to be halfway between
midpoints and maximums at USD2,000/mt,
moving to maximums at USD1,900/mt.
6-12 month aluminium: maintain
midpoints of policy at current levels with
staggered orders lower to be halfway between
midpoints and maximums at USD2,000/mt,
moving to maximums at USD1,800/mt.
12+ month aluminium: filter tests are not
currently activated.
0-12 months copper: additional hedging
between mids and max should be entered at
USD6,600/mt with staggered orders lower to
USD6,500/mt to target maximums of policy.
Producers:
Aluminium/copper: no new hedging.
Strategy and Tactics Report on base metals – 24 Janaury 2018
Page | 2 Strategy and Tactics Report – Commodity Markets 24 Janaury 2018
Base metals charts of the week
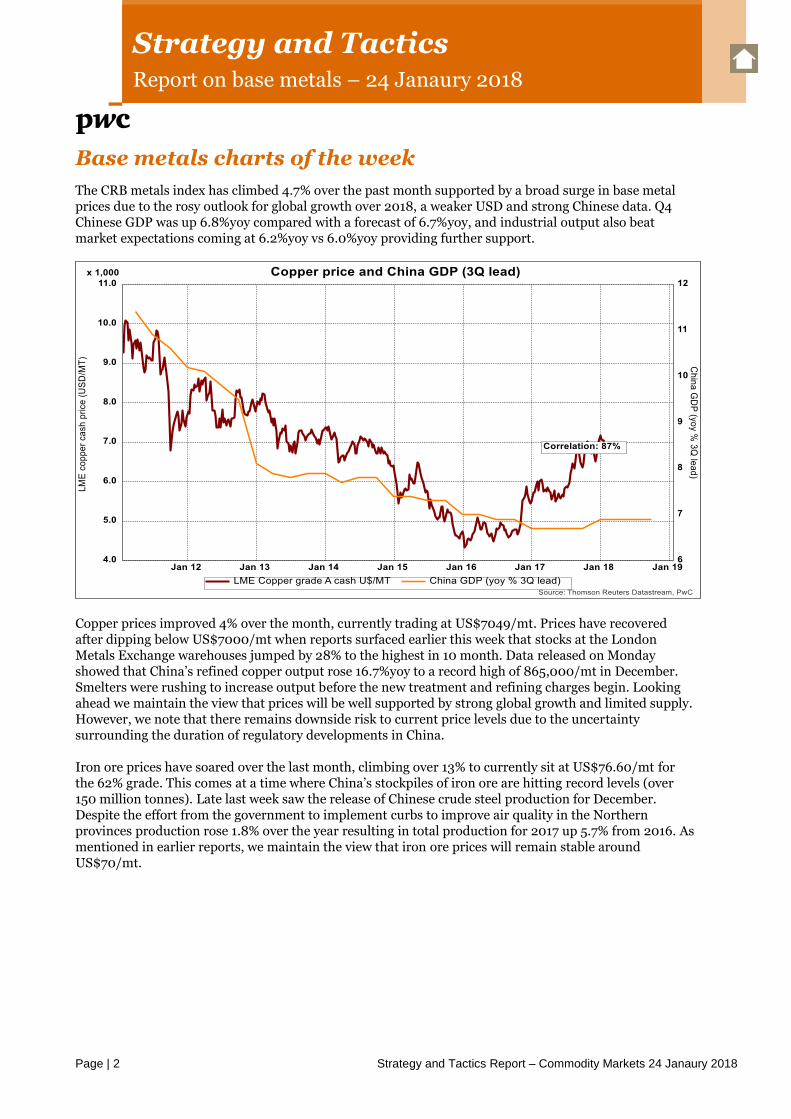
The CRB metals index has climbed 4.7% over the past month supported by a broad surge in base metal prices due to the rosy outlook for global growth over 2018, a weaker USD and strong Chinese data. Q4 Chinese GDP was up 6.8%yoy compared with a forecast of 6.7%yoy, and industrial output also beat market expectations coming at 6.2%yoy vs 6.0%yoy providing further support.
Copper prices improved 4% over the month, currently trading at US$7049/mt. Prices have recovered after dipping below US$7000/mt when reports surfaced earlier this week that stocks at the London Metals Exchange warehouses jumped by 28% to the highest in 10 month. Data released on Monday showed that China’s refined copper output rose 16.7%yoy to a record high of 865,000/mt in December. Smelters were rushing to increase output before the new treatment and refining charges begin. Looking ahead we maintain the view that prices will be well supported by strong global growth and limited supply. However, we note that there remains downside risk to current price levels due to the uncertainty surrounding the duration of regulatory developments in China.
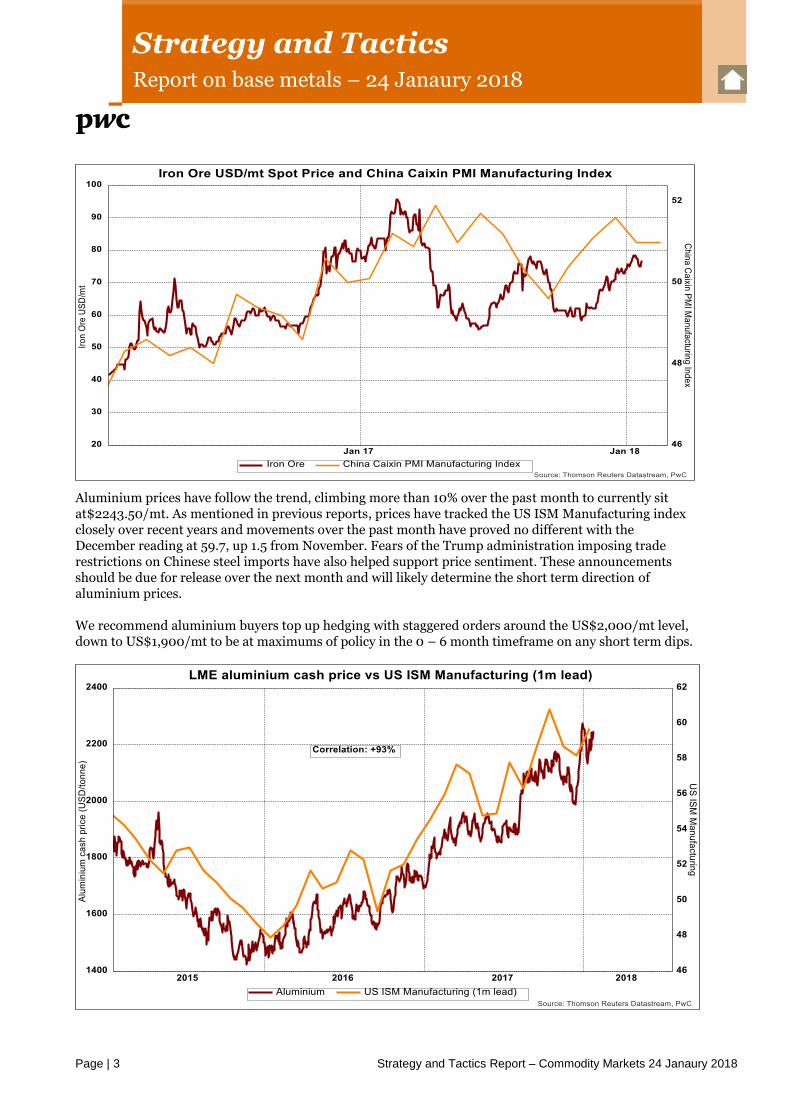
Iron ore prices have soared over the last month, climbing over 13% to currently sit at US$76.60/mt for the 62% grade. This comes at a time where China’s stockpiles of iron ore are hitting record levels (over 150 million tonnes). Late last week saw the release of Chinese crude steel production for December. Despite the effort from the government to implement curbs to improve air quality in the Northern provinces production rose 1.8% over the year resulting in total production for 2017 up 5.7% from 2016. As mentioned in earlier reports, we maintain the view that iron ore prices will remain stable around US$70/mt.
Strategy and Tactics Report on base metals – 24 Janaury 2018
Page | 3 Strategy and Tactics Report – Commodity Markets 24 Janaury 2018
Aluminium prices have follow the trend, climbing more than 10% over the past month to currently sit at$2243.50/mt. As mentioned in previous reports, prices have tracked the US ISM Manufacturing index closely over recent years and movements over the past month have proved no different with the December reading at 59.7, up 1.5 from November. Fears of the Trump administration imposing trade restrictions on Chinese steel imports have also helped support price sentiment. These announcements should be due for release over the next month and will likely determine the short term direction of aluminium prices.
We recommend aluminium buyers top up hedging with staggered orders around the US$2,000/mt level, down to US$1,900/mt to be at maximums of policy in the 0 – 6 month timeframe on any short term dips.
Strategy and Tactics Report on fuels – 24 Janaury 2018
Page | 4 Strategy and Tactics Report – Commodity Markets 24 Janaury 2018
Brent table
USD/bbl Spot 3m 6m 12m 24m
Current 70 69 68 66 62
2wks ago 69 68 67 65 61
6m ago 53 52 53 53 54
1y ago 55 56 57 57 57
Gas oil table
USD/bbl Spot 3m 6m 12m 24m
Current 74 82 81 79 77
2wks ago 81 81 79 78 76
6m ago 64 64 63 63 64
1y ago 64 66 67 68 69
LFO table
USD/bbl Spot 3m 6m 12m 24m
Current 435 453 450 439 382
2wks ago 449 451 449 441 393
6m ago 355 364 362 362 367
1y ago 378 373 376 374 371
PwC expected Brent crude range USD/bbl
Brent crude spot: 70 Low High
1 month 60 70
6 month 55 75
Our central view
Prices are expected to remain range bound
(Brent US$60/bbl – US$70/bbl) over the
coming months based on fundamentals (limited
upward pressure).
We remain sceptical over OPECs ability to
maintain compliance to the production cutting
deal and their ability to materially influence
prices over the coming months as US shale
output grows.
Concerns around US rising shale
production/non-OPEC led production and the
impact on fuel prices continue to negatively
affect market sentiment.
Fuels generic hedging recommendations
Buyers:
0-12 months; buyers maintain midpoints under
USD60/bbl, moving to maximums at USD55/bbl
in the 0-12 months’ time frame.
12-24 months; Stagger low levels of base 12-24
month hedging at prices from USD55/bbl down
to USD50/bbl.
Strategy and Tactics Report on fuels – 24 Janaury 2018
Page | 5 Strategy and Tactics Report – Commodity Markets 24 Janaury 2018
Fuels chart of the week
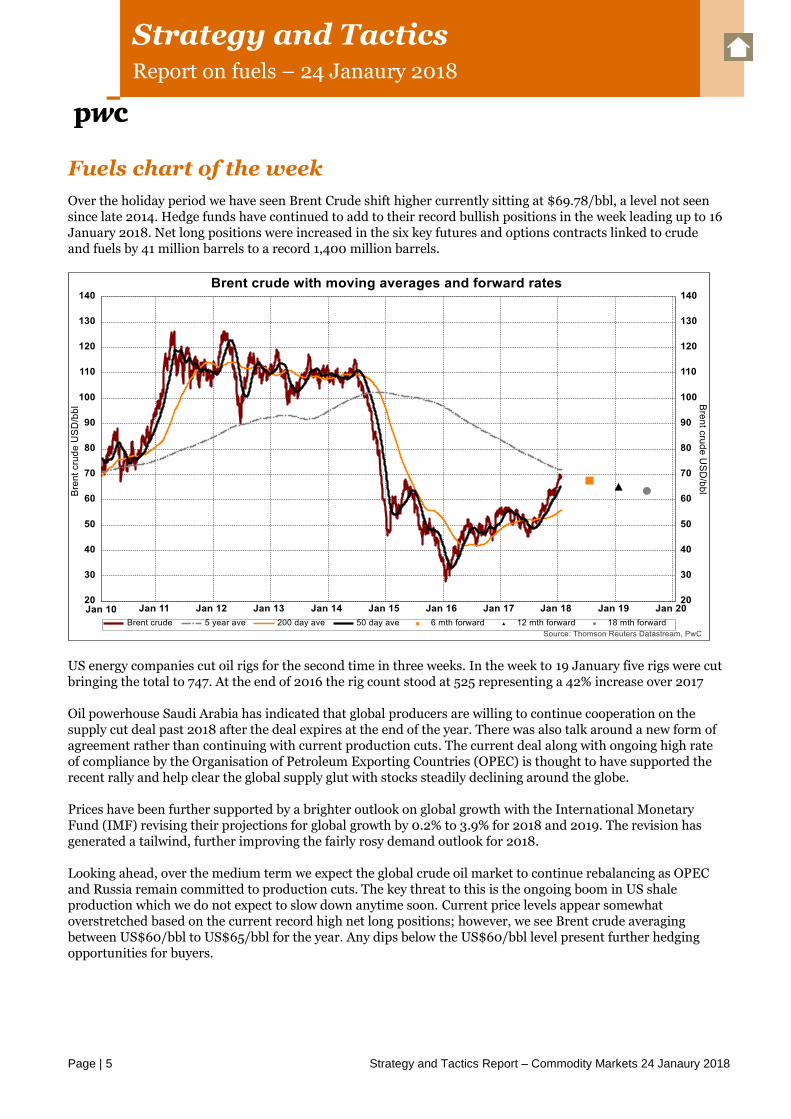
Over the holiday period we have seen Brent Crude shift higher currently sitting at $69.78/bbl, a level not seen since late 2014. Hedge funds have continued to add to their record bullish positions in the week leading up to 16 January 2018. Net long positions were increased in the six key futures and options contracts linked to crude and fuels by 41 million barrels to a record 1,400 million barrels.
US energy companies cut oil rigs for the second time in three weeks. In the week to 19 January five rigs were cut bringing the total to 747. At the end of 2016 the rig count stood at 525 representing a 42% increase over 2017
Oil powerhouse Saudi Arabia has indicated that global producers are willing to continue cooperation on the supply cut deal past 2018 after the deal expires at the end of the year. There was also talk around a new form of agreement rather than continuing with current production cuts. The current deal along with ongoing high rate of compliance by the Organisation of Petroleum Exporting Countries (OPEC) is thought to have supported the recent rally and help clear the global supply glut with stocks steadily declining around the globe.
Prices have been further supported by a brighter outlook on global growth with the International Monetary Fund (IMF) revising their projections for global growth by 0.2% to 3.9% for 2018 and 2019. The revision has generated a tailwind, further improving the fairly rosy demand outlook for 2018.
Looking ahead, over the medium term we expect the global crude oil market to continue rebalancing as OPEC and Russia remain committed to production cuts. The key threat to this is the ongoing boom in US shale production which we do not expect to slow down anytime soon. Current price levels appear somewhat overstretched based on the current record high net long positions; however, we see Brent crude averaging between US$60/bbl to US$65/bbl for the year. Any dips below the US$60/bbl level present further hedging opportunities for buyers.
Strategy and Tactics Report on softs – 24 Janaury 2018
Page | 6 Strategy and Tactics Report – Commodity Markets 24 Janaury 2018
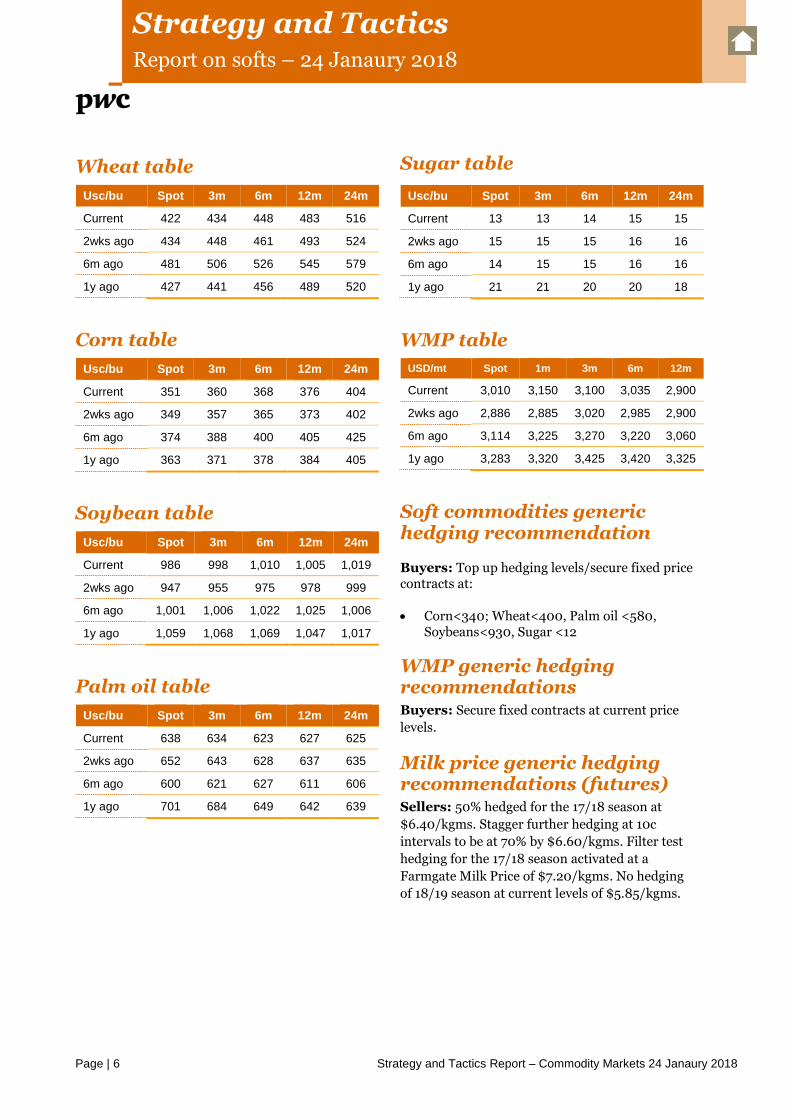
Wheat table
Usc/bu Spot 3m 6m 12m 24m
Current 422 434 448 483 516
2wks ago 434 448 461 493 524
6m ago 481 506 526 545 579
1y ago 427 441 456 489 520
Corn table
Usc/bu Spot 3m 6m 12m 24m
Current 351 360 368 376 404
2wks ago 349 357 365 373 402
6m ago 374 388 400 405 425
1y ago 363 371 378 384 405
Soybean table
Usc/bu Spot 3m 6m 12m 24m
Current 986 998 1,010 1,005 1,019
2wks ago 947 955 975 978 999
6m ago 1,001 1,006 1,022 1,025 1,006
1y ago 1,059 1,068 1,069 1,047 1,017
Palm oil table
Usc/bu Spot 3m 6m 12m 24m
Current 638 634 623 627 625
2wks ago 652 643 628 637 635
6m ago 600 621 627 611 606
1y ago 701 684 649 642 639
Sugar table
Usc/bu Spot 3m 6m 12m 24m
Current 13 13 14 15 15
2wks ago 15 15 15 16 16
6m ago 14 15 15 16 16
1y ago 21 21 20 20 18
WMP table
USD/mt Spot 1m 3m 6m 12m
Current 3,010 3,150 3,100 3,035 2,900
2wks ago 2,886 2,885 3,020 2,985 2,900
6m ago 3,114 3,225 3,270 3,220 3,060
1y ago 3,283 3,320 3,425 3,420 3,325
Soft commodities generic hedging recommendation
Buyers: Top up hedging levels/secure fixed price contracts at:
Corn<340; Wheat<400, Palm oil <580, Soybeans<930, Sugar <12
WMP generic hedging recommendations Buyers: Secure fixed contracts at current price
levels.
Milk price generic hedging recommendations (futures) Sellers: 50% hedged for the 17/18 season at
$6.40/kgms. Stagger further hedging at 10c
intervals to be at 70% by $6.60/kgms. Filter test
hedging for the 17/18 season activated at a
Farmgate Milk Price of $7.20/kgms. No hedging
of 18/19 season at current levels of $5.85/kgms.
Strategy and Tactics Report on softs – 24 Janaury 2018
Page | 7 Strategy and Tactics Report – Commodity Markets 24 Janaury 2018
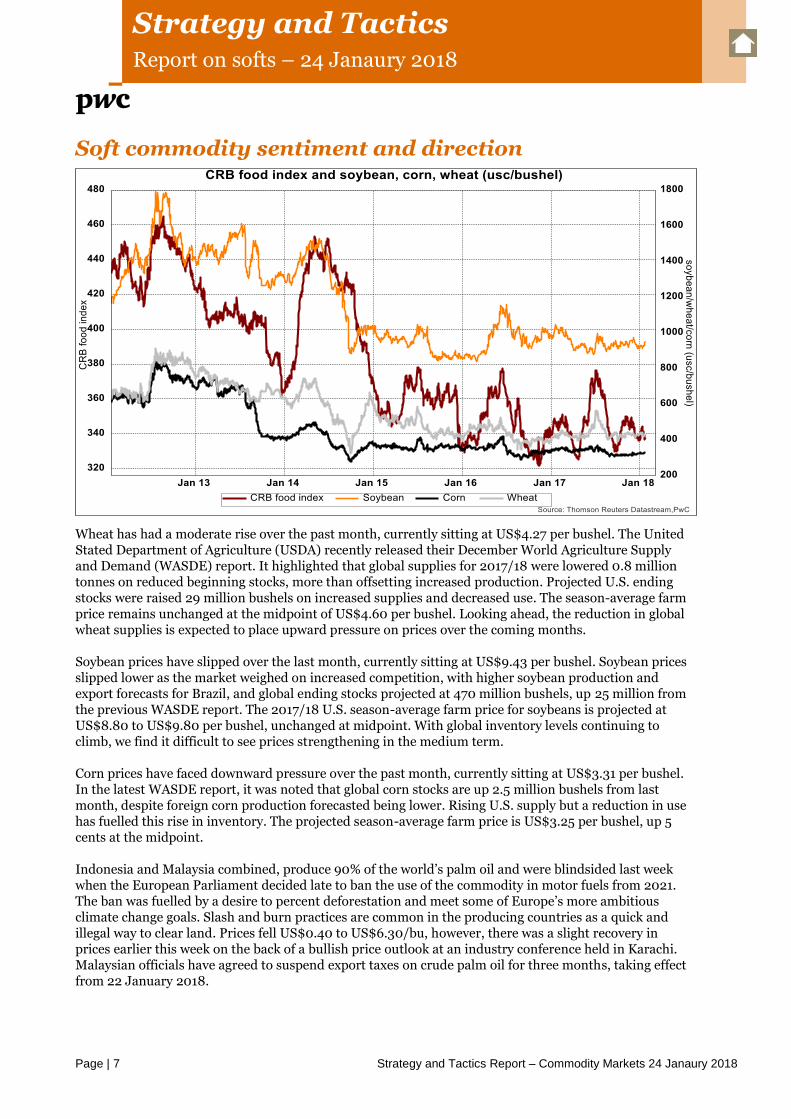
Soft commodity sentiment and direction
Wheat has had a moderate rise over the past month, currently sitting at US$4.27 per bushel. The United Stated Department of Agriculture (USDA) recently released their December World Agriculture Supply and Demand (WASDE) report. It highlighted that global supplies for 2017/18 were lowered 0.8 million tonnes on reduced beginning stocks, more than offsetting increased production. Projected U.S. ending stocks were raised 29 million bushels on increased supplies and decreased use. The season-average farm price remains unchanged at the midpoint of US$4.60 per bushel. Looking ahead, the reduction in global wheat supplies is expected to place upward pressure on prices over the coming months.
Soybean prices have slipped over the last month, currently sitting at US$9.43 per bushel. Soybean prices slipped lower as the market weighed on increased competition, with higher soybean production and export forecasts for Brazil, and global ending stocks projected at 470 million bushels, up 25 million from the previous WASDE report. The 2017/18 U.S. season-average farm price for soybeans is projected at US$8.80 to US$9.80 per bushel, unchanged at midpoint. With global inventory levels continuing to climb, we find it difficult to see prices strengthening in the medium term.
Corn prices have faced downward pressure over the past month, currently sitting at US$3.31 per bushel. In the latest WASDE report, it was noted that global corn stocks are up 2.5 million bushels from last month, despite foreign corn production forecasted being lower. Rising U.S. supply but a reduction in use has fuelled this rise in inventory. The projected season-average farm price is US$3.25 per bushel, up 5 cents at the midpoint.
Indonesia and Malaysia combined, produce 90% of the world’s palm oil and were blindsided last week when the European Parliament decided late to ban the use of the commodity in motor fuels from 2021. The ban was fuelled by a desire to percent deforestation and meet some of Europe’s more ambitious climate change goals. Slash and burn practices are common in the producing countries as a quick and illegal way to clear land. Prices fell US$0.40 to US$6.30/bu, however, there was a slight recovery in prices earlier this week on the back of a bullish price outlook at an industry conference held in Karachi. Malaysian officials have agreed to suspend export taxes on crude palm oil for three months, taking effect from 22 January 2018.
Strategy and Tactics Report on softs – 24 Janaury 2018
Page | 8 Strategy and Tactics Report – Commodity Markets 24 Janaury 2018
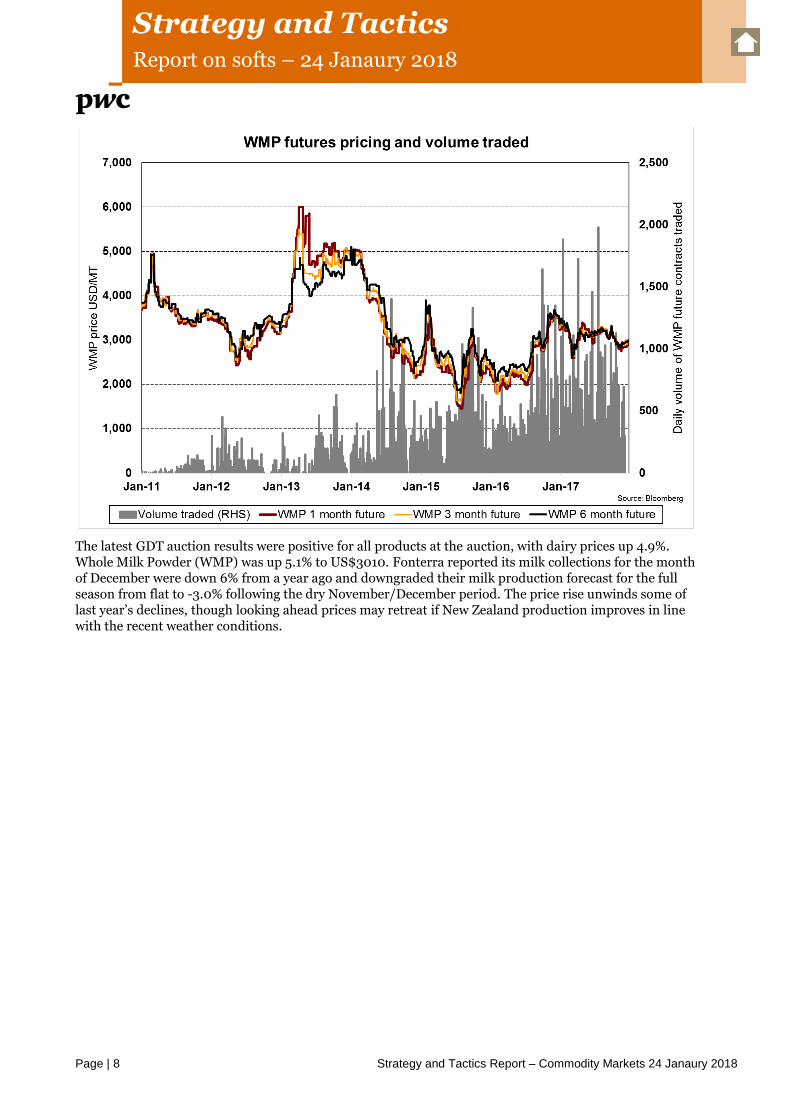
The latest GDT auction results were positive for all products at the auction, with dairy prices up 4.9%. Whole Milk Powder (WMP) was up 5.1% to US$3010. Fonterra reported its milk collections for the month of December were down 6% from a year ago and downgraded their milk production forecast for the full season from flat to -3.0% following the dry November/December period. The price rise unwinds some of last year’s declines, though looking ahead prices may retreat if New Zealand production improves in line with the recent weather conditions.

DISCLAIMER: This report is for PwC retained treasury clients and is subject to the individual agreed engagement letter and
the following restrictions. This report should not be reproduced or supplied to any other party without first obtaining our (PwC
New Zealand) written consent. We accept no responsibility for any reliance that may be placed on our report should it be
used for any purpose other than that set out below and in any event we will accept no liability to any party other than you in
respect of its contents.
The purpose of the report is to document our current financial market views and generic hedging recommendations. The
statements and opinions contained in this report are based on data obtained from the financial markets and are so contained
in good faith and in the belief that such statements, opinions and data are not false or misleading. In preparing this report, we
have relied upon information which we believe to be reliable and accurate. We reserve the right (but will be under no
obligation) to review our assessment and if we consider it necessary, to revise our opinion in the light of any information
existing at the date of this report which becomes known to us after that date. This report must be read in its entirety. Individual
sections of this report could be misleading if considered in isolation from each other.
128002243
Get in touch
Stuart Henderson Partner T: +64 9 425 0158 M:+64 21 343 423 E: [email protected]
Roger Kerr Consultant T: +64 9 355 8181 M:+64 21 935 288 E: [email protected]
Brett Johanson Partner T: +64 4 462 7234 M:+64 21 771 574 E: [email protected]
Chris Hedley Director T: +64 9 355 8183 M: +64 21 479 680 E: [email protected]
James McHardy Director T: +64 4 462 7153 M: +64 21 263 4282 E: [email protected]
Tom Lawson Associate Director T: +64 9 355 8144 M: +64 27 421 0733 E: [email protected]
Alex Wondergem Associate Director T: +64 9 355 8252 M: +64 21 041 2127 E: [email protected]
Hasthika Ekneligoda Treasury Analyst T: +64 9 355 88855 E: [email protected]
James Butler Treasury Advisor T: +64 9 355 8265 E: [email protected]
Tom North Treasury Analyst T: +64 9 355 8497 E: [email protected]
Ollie McDowell Treasury Advisor T:+64 9 355 8702 E: [email protected]
Matt Stewart Treasury Analyst T: +64 5 462 7037 E: [email protected]
www.pwc.co.nz/treasury-and-debt-advisory