Embed Size (px)
Citation preview
STRATEGIES TO MITIGATE THE RISING COST OF HEALTHCARE
January 2019
Presented by the Healthcare Task Force of the South Carolina Chamber Foundation
Contents
Introduction 01
Recommendation 1: 03Conduct Reinsurance Study
Recommendation 2: Increase Use 11 of Cost and Quality Online Tools
Recommendation 3: Prepare and
promote a “Healthcare Literacy 15 Toolkit”
Recommendation 4: Consider State Tax 16 Credits for Employer Wellness Programs
Conclusion 17

Introduction
Every year the South Carolina Chamber of Commerce conducts a survey of hundreds of
employers in the state to identify major areas of concern for their businesses or industries.
Results of the survey consistently show that the rising cost of healthcare has been and continues
to be one of the most challenging issues facing the business community. For this reason, the
South Carolina Chamber Foundation chartered a Task Force made up of state business leaders
and healthcare policy experts tasked with identifying strategies to help mitigate the rising cost of
healthcare for employers and employees. While major changes to healthcare policy are primarily
driven by federal actions, in this report the Task Force lays out specific state- and business-led
actions that will increase cost transparency and create more options for coverage, effectively
lowering healthcare costs for employees and employers.
Cause for Concern
Healthcare costs have dramatically increased in recent decades, resulting in higher employer and
employee health benefit costs and the overall costs of doing business. The graphic below vividly
illustrates this problem, depicting the annual change in total health benefit costs per employee
compared to inflation and workers’ earnings over the past 25 years. It is plain to see the alarming
rise in employee healthcare costs – well above the annual change in workers’ earnings and inflation – and this upward trend continues to cause concern for employers.
Driven mainly by the continual increase in healthcare costs, national health spending – which
includes spending by federal and state governments, the private sector and individuals – has risen
from just five percent as a share of the economy in 1960 to 17.9 percent in 2016, according to

the most recent data from the Centers for Medicare and Medicaid Services (CMS). CMS projects
health spending to rise to 19.9 percent by 2025. Private-sector employers paid nearly $665 billion
in 2016 in health-related costs, up five percent from the prior year, according to CMS data.
These rising costs are, to some extent, a reflection of tremendous investments in health-related
research and development. The emergence of new diagnostic equipment, treatment
approaches, and pharmaceutical therapies has increased life expectancy by nearly 13 percent
during the same time period. Americans can expect to live nine years longer than they did in
1960, but these advances have not been cheap.1
There are numerous drivers of rising healthcare costs, including defensive medicine, intrusive
government regulation, provider consolidation, and increasing pharmaceutical prices and
utilization. For example, a recent study found that oral anticancer drugs were six times more
expensive in 2014 than in 2010.2 Another study found that drug prices for multiple sclerosis
medications ranged between $8,000 to $11,000 per year, but now range up to $60,000 per year.3
The rise in drug companies’ list pricing has been volatile, but annual growth is still disturbingly high. Retail prescription drug spending now accounts for over 10 percent of national healthcare
spending.4 Other studies have found that drug spending totals over 16 percent of the overall
healthcare system.5 Specialty drug pricing represents a rising share of overall drug costs, with
specialty drugs accounting for 35 to 40 percent of plans’ spending on drugs; this proportion is
likely to rise to over 50 percent in the next five years.6
Drug utilization has grown as well. Between 2014 and 2015, health plans on the Affordable Care
Act exchanges are spending 15 percent more annually for prescription drugs.7 The increase is due
to several factors, including higher drug utilization and prescription drug advertisements.
Businesses recognize that pricing and utilization are beyond their direct control, so they are
seeking other ways to lower premiums for their employees and themselves.
The increasing cost of healthcare services has driven the average health insurance premium up
19 percent over the past five years to $7,000 for single coverage in 2017, and to nearly $19,000
for family coverage, according to the Kaiser Family Foundation.
1 World Bank. “World Development Indicators, 1960-2016.” 2Henry Waxman et al., “Getting to the Root of High Prescription Drug Prices,” The Commonwealth Fund, July 2017, https://www.commonwealthfund.org/sites/default/files/documents/___media_files_publications_fund_report_2 017_jul_waxman_high_drug_prices_drivers_solutions_report_la_en.pdf. 3 Daniel M. Hartung, Dennis N. Bourdette, Sharia M. Ahmed, Ruth H.Whitham, “The cost of multiple sclerosis drugs in the US and the pharmaceutical industry,” Neurology, May 2015. 4 CMS, “National Health Expenditure Projections 2017-2026,” at https://www.cms.gov/Research-Statistics-Data-andSystems/Statistics-Trends-and-Reports/NationalHealthExpendData/NationalHealthAccountsProjected.html. 5 The Brookings Institute, “Reining in Prescription Drug Prices,” (May 2, 2017) at https://www.brookings.edu/events/reining-in-prescription-drug-prices/. 6 American Patients First, U.S. Department of Health and Human Services, https://www.hhs.gov/sites/default/files/AmericanPatientsFirst.pdf 7 Id.
SC Chamber Foundation 1

Employers pay about three quarters of their workers' premiums, according to the Society for
Human Resource Management.
According to a Harris Poll commissioned by Castlight Health, approximately 90 percent of chief
financial officers surveyed agreed they could invest more in their businesses if their company’s healthcare costs were lower. More than 80 percent of CFOs surveyed by the Harris Poll said
healthcare costs drain company resources that could be better used elsewhere—including the
wages and salaries of their employees and investing in better technology.
This could be why 93 percent of respondents to the Harris Poll agree that the high cost of
healthcare in the U.S. gives foreign companies a competitive advantage. The effect on the
American business sector is clear: rising healthcare costs are hurting enterprise.
Although business owners are adjusting and staying afloat right now, rising healthcare costs
threaten to limit profitability and economic growth.
They also agree about who's responsible for helping to find solutions. It's not government. It's
not the healthcare sector. Instead, nearly all respondents acknowledged that employers must
help fix the system.
What can we do? The South Carolina Chamber Foundation’s Healthcare Task Force identified four
recommendations that South Carolina state agencies, businesses, and legislators can implement
to slow the rise in healthcare costs. The Task Force included the following business leaders,
human resource representatives and healthcare experts:
• Boyd Jones---NBSC, Regional Chief Banking Officer, Task Force Chair
• David Cole---MUSC, President
• Christian Soura--- S.C. Hospital Association, V.P., Policy & Finance
• Brad Johnson--- Milliken, Director, Benefits & Retirement
• Kelly Dawsey--- BMW, Human Resources Manager
• James D’Alessio--- BlueCross BlueShield, V.P. of Government Affairs
• Maya Pack --- S. C. Institute of Medicine & Public Health, Co-director
• Lou Kennedy--- Nephron Pharmaceuticals Corporation, CEO
The Healthcare Task Force identified these four recommendations:
• Conduct a healthcare reinsurance study;
• Increase the use of existing healthcare cost and quality transparency online tools;
• Consider incentives for the development and utilization of employer-based wellness programs; and
• Enhance employee healthcare system knowledge.
SC Chamber Foundation 2

Recommendation 1: Conduct Reinsurance Study
Reinsurance can be an important risk management tool for health insurers in the post-Affordable
Care Act (ACA) market and can directly address the “risk pool” problem embedded in the ACA.
Specifically, Section 1312 of the ACA requires a health insurer to consider “all enrollees in all
health plans…to be members of a single risk pool.”8 This requirement applies to both the
individual and small group markets.9 The underlying rationale for this requirement was to
prevent insurers from creating separate risk pools for subsidized enrollees and unsubsidized
enrollees on the health exchanges.10
However, many have argued the single risk pool requirement created more harm than good for
premium costs. Data shows that subsidized enrollees tend to be less healthy compared to
unsubsidized enrollees.11 Because the single risk pool is less healthy overall, insurance companies
are facing higher and more frequent claims. In turn, insurers are experiencing substantial losses.
To avoid losses, insurers must increase premiums on enrollees. Many states were seeing double
digit percentage increases in premiums, some as high as 67 percent.12 These extreme premium
increases drove healthy people out of the insurance market, leading to an even sicker risk pool
and more premium increases. This vicious “death cycle” has created an unstable market for insurers and enrollees alike.
High Claims Payouts
Substantial Insurer Losses
Health Premiums Increase
Healthy Enrollees
Drop Coverage
Less Healthy
Risk Pool
8 See also 42 U.S. Code §18032(c)(1)-(2) 9 Id. 10 Joel Allumbaugh & Josh Archambault, “Congress Needs to Rethink the ACA’s Single Risk Pool to ‘Stabilize’ the Individual Market” (Apr. 6, 2018) at https://www.healthaffairs.org/do/10.1377/hblog20180403.305268/full/. 11 Bob Herman, “What, me buy insurance?” (May 14, 2016) at http://www.modernhealthcare.com/article/20160514/MAGAZINE/305149980# 12 Michael Ollove, “States Adopt ‘Reinsurance Pools’ to Keep Premiums Low,” Apr. 10, 2018 at https://www.csmonitor.com/USA/2018/0410/States-adopt-reinsurance-pools-to-keep-premiums-low.
SC Chamber Foundation 3
That’s where reinsurance kicks in. Reinsurance programs help insurance companies pay the most
expensive medical claims. Health insurers can receive relief from these expensive claims and will
no longer feel pressure to increase health premiums on enrollees. By keeping premiums lower,
reinsurance incentivizes healthy individuals to stay in or re-enter the marketplace.
Impact of other groups on employer-sponsored insurance
Most Americans have reasonably comprehensive employer-sponsored health insurance,
whether due to their own work or through a spouse’s or parent’s employer. Others receive
healthcare through Medicare, Medicaid, or other public coverage, such as for active-duty military
or veterans. In South Carolina, these groups collectively represent about 84 percent of the
population.13
The other 16 percent are either uninsured (9%) or have “non-group” (7%) policies, such as those sold through the individual marketplace. There is significant interaction between these groups – a low-income worker may be eligible for an inexpensive plan through the individual marketplace,
but then lose his job and wind up uninsured for several months or even longer. During this time
in the coverage gap, he would likely delay necessary treatment. By the time he regains coverage,
his condition may have deteriorated to a point where he now needs costlier and more radical
therapy. This “churn” between the uninsured and those with individual policies can lead to higher premiums for those with individual coverage, which can deter enrollment – particularly
among the younger and healthier individuals who are the foundation of a functioning health
insurance risk pool. This scenario can be the beginning of the so-called “death spiral” discussed earlier in which rising premiums and the departure of young, healthy members from the
insurance pool both cause and are caused by each other.
On the other hand, measures that help reduce premiums and thereby promote enrollment in the
individual market can produce a virtuous cycle that can also be self-reinforcing. Stabilizing the
individual marketplace can reduce the uninsured population, cutting the amount of
uncompensated care that healthcare providers must render, and preventing those costs from
being passed through to businesses who sponsor health insurance for their employees and
dependents.
Bringing private-sector thinking to public-sector coverage
At times, the state and federal governments have used a similar approach to backstop all or a
segment of the individual market. Shifting the risk of outlier events from individual plans into a
broader reinsurance program has been found to reduce premiums, spurring higher levels of
enrollment. The federal Transitional Reinsurance Program that operated from 2014 to 2016 was
13 Kaiser Family Foundation, “Health Insurance Coverage of the Total Population.” https://www.kff.org/other/state-indicator/total-population/?currentTimeframe=0&sortModel=%7B%22colId%22:%22Location%22,%22sort%22:%22asc%22%7D
SC Chamber Foundation 4
credited by actuaries and the U.S. Department of Health and Human Services with reducing
premiums by 10-14 percent.14
Since 2017, states have been permitted to ask the federal government for special permission – a
“waiver” – that allows them to reform their individual insurance markets, such as by establishing
their own reinsurance programs. Formally styled as State Innovation Waivers, but better known
as “Section 1332 waivers” because of where they are authorized in the Social Security Act, these plans are now being used by eight states to reduce premiums and increase enrollment. Several
other states have also filed applications or are in early stages of developing their proposals.15
Unlike many other topics in health policy, Section 1332 waivers enjoy broad support from across
the political spectrum. In the words of Trish Riley, who leads the National Academy for State
Health Policy, “Reinsurance is possibly the best proven mechanism to restrain premium increases and keep health insurance affordable. The biggest plus is that it’s a tool with support across the political spectrum16.”
The Trump Administration was quick to embrace this model, with the Secretary of Health and
Human Services sending a letter to the nation’s governors in 2017 that was exclusively focused on promoting these waivers: “We welcome the opportunity to work with states on Section 1332
State Innovation Waivers, and in particular, invite states to pursue approval of waiver proposals
that include high-risk pool/state-operated reinsurance programs.17” Governors who have received these waivers range from David Ige (Hawaii) and Kate Brown (Oregon) on the left to Paul
LePage (Maine) and Scott Walker (Wisconsin) on the right. Similarly, the Senate’s 2017 proposals to expand reinsurance programs and make Section 1332 waivers easier for states to obtain was
named “Alexander-Murray” after the leading Republican and Democrat on the Senate’s Health, Education, Labor and Pensions Committee, who developed the package together. The symbolism
of this bipartisan approach was underlined when the bill was introduced with an equal number
of Democratic and Republican co-sponsors.
14 American Academy of Actuaries, “Issue Brief: Drivers of 2015 Health Insurance Premium Changes.” https://www.actuary.org/files/2015_Premium_Drivers_Updated_060414.pdf 15 Kaiser Family Foundation, “Tracking Section 1332 State Innovation Waivers.” https://www.kff.org/health-reform/fact-sheet/tracking-section-1332-state-innovation-waivers/ 16 Chicago Tribune, “States Leverage Federal Funds to Help Insurers Lower Premiums.” August 16, 2018. 17 Untitled “Dear Governor” letter from HHS Secretary, March 13, 2017. https://www.cms.gov/CCIIO/Programs-and-Initiatives/State-Innovation-Waivers/Downloads/March-13-2017-letter_508.pdf
SC Chamber Foundation 5

How “State Innovation Waivers” work
To be approved, a state’s waiver application must satisfy four federal criteria that are often referred to as the “guiderails.” The proposal must:
• cover at least as many people as would be covered without the waiver;
• offer coverage that is at least as comprehensive as what is offered through the
marketplace;
• be as affordable (considering premiums and out-of-pocket costs) as marketplace
coverage; and
• not increase the federal deficit.
States hire actuarial firms to conduct the analysis that demonstrates to the federal government
that their proposals meet these requirements. Since many states already contract with outside
actuaries in order to establish premiums for their privatized Medicaid health plans, there are
likely opportunities to leverage existing relationships and agreements.
SC Chamber Foundation 6

The federal government helps low-income individuals on the marketplace by granting them
Advance Premium Tax Credits (APTCs) that help them to afford coverage. The value of these
credits varies with an individual’s income and the cost of insurance in his or her home community. APTCs are available to those with incomes between the poverty line ($25,100 for a four-person
household in 2018) and 400 percent of the poverty line ($100,400)18. The value of the credits
diminishes as household income rises, on the assumption that those who are earning more can
afford to pay more of their own insurance costs.
By establishing a reinsurance program, states lower premiums in the individual marketplace,
which in turn reduces the cost to the federal treasury of the APTCs. Through the Section 1332
waiver process, the federal government calculates its projected savings from this mechanism and
grants that amount to the state to help support the reinsurance program. As Figure 1 shows,
these programs can have a real impact on reducing premiums and increasing enrollment, creating
both direct and indirect savings for a state’s businesses and employers.
Figure 1: Effects of State Innovation Waivers19
State Reduction in Premiums Reduction in Uninsured Rate
Alaska 20% 1.5%
Maine 9% 1.7%
Maryland 30% 5.8%
New Jersey 15% 2.7%
Wisconsin 11% 1.0%
When developing these reinsurance programs, states have used two methods. The first method
is termed a “conditions-based” model. The second method is termed an “attachment point” model.
Under the condition-based model, states target high-cost medical conditions. An insurer will cede
these conditions and their costs over to the reinsurance program while still processing and
managing claims. Alaska uses a conditions-based model, targeting 33 health conditions, such as
cancer, liver disease, and cerebral palsy. The reinsurance program reimburses insurers 100
percent of the claims for those conditions.
Under the attachment point model, states choose an amount when reinsurance starts to pay.
That amount is the “attachment point.” Once a claim reaches the attachment point amount,
18 U.S. Department of Health and Human Services, “U.S. Federal Poverty Guidelines Used to Determine Financial Eligibility for Certain Federal Programs.” https://aspe.hhs.gov/poverty-guidelines 19 Values taken from approval letters published by the U.S. Centers for Medicare and Medicaid Services. https://www.cms.gov/CCIIO/Programs-and-Initiatives/State-Innovation-Waivers/Section_1332_State_Innovation_Waivers-.html
SC Chamber Foundation 7
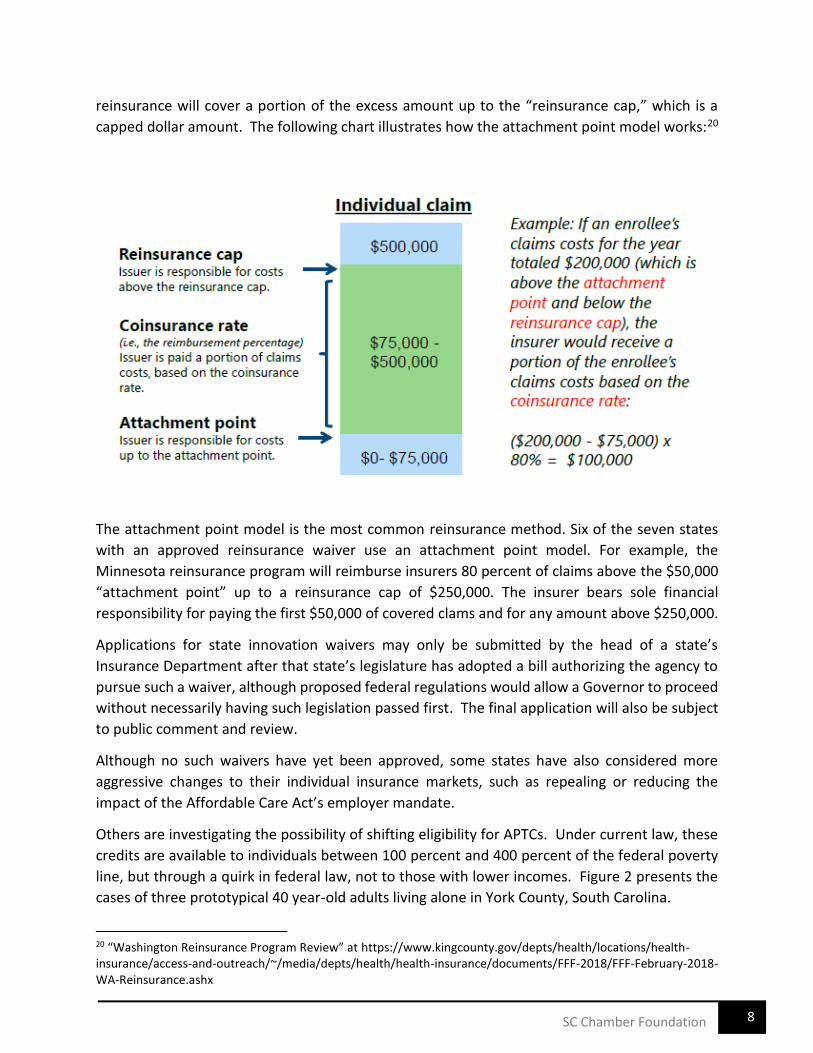
reinsurance will cover a portion of the excess amount up to the “reinsurance cap,” which is a capped dollar amount. The following chart illustrates how the attachment point model works:20
The attachment point model is the most common reinsurance method. Six of the seven states
with an approved reinsurance waiver use an attachment point model. For example, the
Minnesota reinsurance program will reimburse insurers 80 percent of claims above the $50,000
“attachment point” up to a reinsurance cap of $250,000. The insurer bears sole financial
responsibility for paying the first $50,000 of covered clams and for any amount above $250,000.
Applications for state innovation waivers may only be submitted by the head of a state’s Insurance Department after that state’s legislature has adopted a bill authorizing the agency to pursue such a waiver, although proposed federal regulations would allow a Governor to proceed
without necessarily having such legislation passed first. The final application will also be subject
to public comment and review.
Although no such waivers have yet been approved, some states have also considered more
aggressive changes to their individual insurance markets, such as repealing or reducing the
impact of the Affordable Care Act’s employer mandate.
Others are investigating the possibility of shifting eligibility for APTCs. Under current law, these
credits are available to individuals between 100 percent and 400 percent of the federal poverty
line, but through a quirk in federal law, not to those with lower incomes. Figure 2 presents the
cases of three prototypical 40 year-old adults living alone in York County, South Carolina.
20 “Washington Reinsurance Program Review” at https://www.kingcounty.gov/depts/health/locations/health-insurance/access-and-outreach/~/media/depts/health/health-insurance/documents/FFF-2018/FFF-February-2018-WA-Reinsurance.ashx
SC Chamber Foundation 8
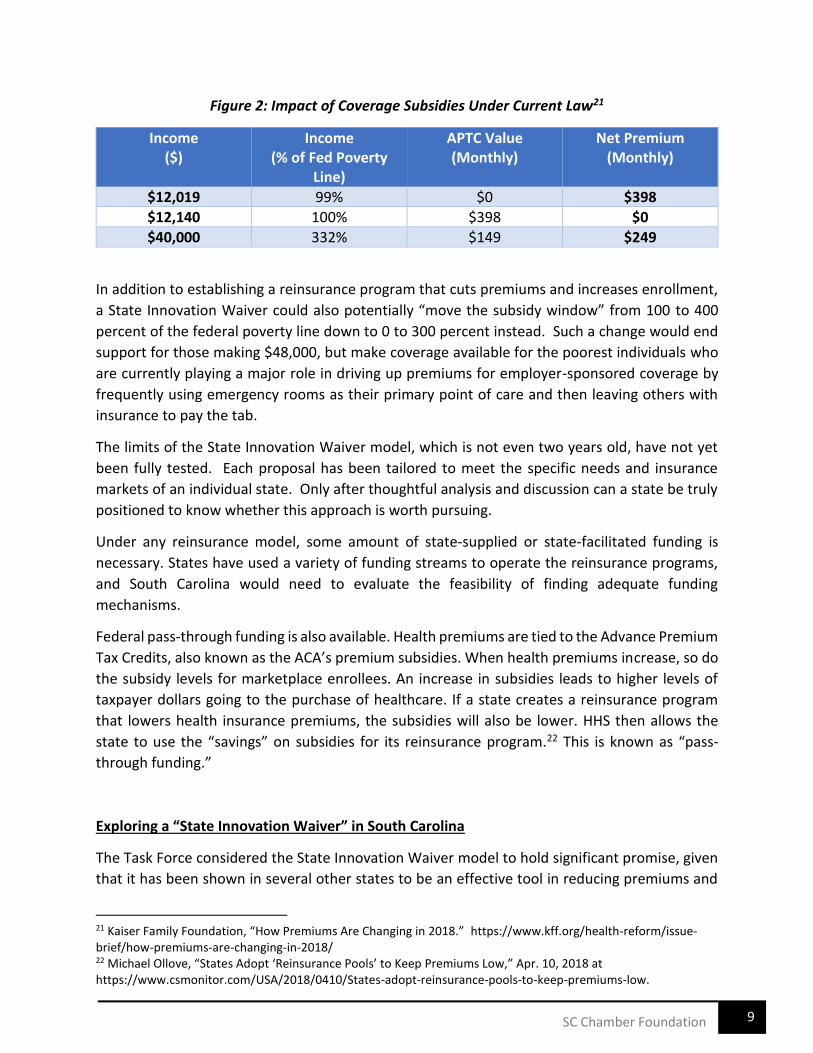
Figure 2: Impact of Coverage Subsidies Under Current Law21
Income ($)
Income (% of Fed Poverty
Line)
APTC Value (Monthly)
Net Premium (Monthly)
$12,019 99% $0 $398
$12,140 100% $398 $0
$40,000 332% $149 $249
In addition to establishing a reinsurance program that cuts premiums and increases enrollment,
a State Innovation Waiver could also potentially “move the subsidy window” from 100 to 400
percent of the federal poverty line down to 0 to 300 percent instead. Such a change would end
support for those making $48,000, but make coverage available for the poorest individuals who
are currently playing a major role in driving up premiums for employer-sponsored coverage by
frequently using emergency rooms as their primary point of care and then leaving others with
insurance to pay the tab.
The limits of the State Innovation Waiver model, which is not even two years old, have not yet
been fully tested. Each proposal has been tailored to meet the specific needs and insurance
markets of an individual state. Only after thoughtful analysis and discussion can a state be truly
positioned to know whether this approach is worth pursuing.
Under any reinsurance model, some amount of state-supplied or state-facilitated funding is
necessary. States have used a variety of funding streams to operate the reinsurance programs,
and South Carolina would need to evaluate the feasibility of finding adequate funding
mechanisms.
Federal pass-through funding is also available. Health premiums are tied to the Advance Premium
Tax Credits, also known as the ACA’s premium subsidies. When health premiums increase, so do
the subsidy levels for marketplace enrollees. An increase in subsidies leads to higher levels of
taxpayer dollars going to the purchase of healthcare. If a state creates a reinsurance program
that lowers health insurance premiums, the subsidies will also be lower. HHS then allows the
state to use the “savings” on subsidies for its reinsurance program.22 This is known as “pass-
through funding.”
Exploring a “State Innovation Waiver” in South Carolina
The Task Force considered the State Innovation Waiver model to hold significant promise, given
that it has been shown in several other states to be an effective tool in reducing premiums and
21 Kaiser Family Foundation, “How Premiums Are Changing in 2018.” https://www.kff.org/health-reform/issue-brief/how-premiums-are-changing-in-2018/ 22 Michael Ollove, “States Adopt ‘Reinsurance Pools’ to Keep Premiums Low,” Apr. 10, 2018 at https://www.csmonitor.com/USA/2018/0410/States-adopt-reinsurance-pools-to-keep-premiums-low.
SC Chamber Foundation 9
increasing enrollment in the individual insurance market. More coverage means less
uncompensated care; this in turn reduces businesses’ exposure to the stranded costs that providers otherwise distribute to paying customers. These waivers are built upon a reinsurance
model that is familiar to private-sector benefits managers, particularly those who have self-
funded plans that employ stop-loss policies.
Although more challenging to accomplish within existing federal rules, there is also the possibility
that such a waiver could be used to circumscribe or even eliminate the employer mandate.
Furthermore, a State Innovation Waiver could refocus existing subsidies onto those who have
the greatest need and are also most likely to use the credits in order to obtain coverage.
Until a proper South Carolina-specific study is completed by objective professionals, no one can
say with certainty how or whether a State Innovation Waiver could benefit our state and reduce
healthcare costs for businesses. To provide the evidence that policymakers will need in order to
make the best decision, the Taskforce recommends that:
• the Governor and/or General Assembly direct the S.C. Department of Insurance to
prepare a report that closely examines the advantages and disadvantages to South
Carolina of pursuing a State Innovation Waiver;
• the S.C. Department of Health and Human Services fund the necessary actuarial analysis
through its existing actuarial contracts or any others that may be required and supply
whatever information is required to support the actuary’s work; • the analysis consider a range of potential funding mechanisms and levels that produce
varying degrees of premium relief and anticipated enrollment increases;
• the analysis also consider competing scenarios in which the existing South Carolina Health
Insurance Pool (“high risk pool”) is or is not subsumed within the new framework;
• the analysis specifically investigate the possibility of (1) reducing or eliminating the
employer mandate and/or (2) changing eligibility for Advance Premium Tax Credits by
lowering the current income floor and ceiling; and
• the General Assembly include language in its authorization that permits the Director of
the S.C. Department of Insurance to submit a State Innovation Waiver application so that
necessary discussions with the federal government can begin, if the report is sufficiently
promising.
SC Chamber Foundation 10

Recommendation 2: Increase Use of Cost and Quality Online Tools
Using online transparency tools to compare pricing
In the past several years, there have been significant improvements in the availability of online
tools that can help individuals compare costs for certain healthcare services. These resources
can be an important part of a broader effort to control employee and employer healthcare costs,
and yet research continues to show that they are largely ignored by the public.
A new study prepared by Harvard Medical School and the Yale Schools of Management and Public
Health and published by the National Bureau of Economic Research looked closely at how
individuals with private-sector coverage make decisions about where to obtain MRI scans. The
study weighed factors such as the distance to different potential providers, physician referrals,
and the employee’s own out-of-pocket costs to use one provider vs. another (which varied
substantially). The report found that fewer than one percent of patients used available online
cost-comparison tools, even though they could have saved themselves $84 and their insurer $221
in an average case.23 Earlier research produced similar findings – that online transparency tools
can reveal savings opportunities, but that patients tend not to capitalize on them because they 24are unaware of these websites or unsure how to use them.
The same research highlights an important limitation of these tools, however, which is that the
majority of healthcare services are still not “shoppable.” Services are typically considered to be shoppable when patients have the flexibility to compare prices across multiple providers and
would enjoy the ability to determine when and where they would receive care. In 2011, only 7
percent of out-of-pocket spending was on shoppable services, although as much as 43 percent
of healthcare spending for privately-insured individuals could potentially be shoppable under the
right circumstances.25
Another important factor to consider when comparing prices for healthcare services is that the
prices published on a website may not correspond to what a particular individual might actually
pay for that service. For instance, prices for hospital services that appear on a state transparency
portal or even a hospital’s own website are likely to reflect the amount that a hospital charges for a service, which is commonly well in excess of what they would actually accept as payment.
For instance, a patient with insurance would likely pay substantially less than the gross charges
that a hospital would post online for any given procedure. Similarly, hospitals’ financial assistance policies often allow low-income individuals to receive care at a significant discount to
published rates.
23 Chernew, M., Cooper, Z., Larsen-Hallock, E., and Scott Morton, F. “Are Health Care Services Shoppable? Evidence from Lower-Limb MRI Scans.” NBER Working Paper No. 24869. July 2018. 24 Desai, S., Hatfield, L., Hicks, A., Sinaiko, A., Chernew, M., Cowling, D., Gautam, S., Wu, S., and Mehrotra, A. "Offering a Price Transparency Tool Did Not Reduce Overall Spending Among California Public Employees and Retirees," Health Affairs, 36 (2017), 1401-1407. 25 Health Care Cost Institute. “Spending on Shoppable Services in Health Care, Issue Brief #11.” March 2016.
SC Chamber Foundation 11
For individuals with insurance, it is often true that the only way to learn their own potential out-
of-pocket costs of receiving care is through their insurer. Many plans offer an online tool such as
the “Treatment Cost Estimator” from BlueCross BlueShield of South Carolina. Websites like this
allow patients to compare the total estimated cost for a procedure across several nearby
providers and can give personalized detail not just on the charges for the procedure, but also the
patient’s own financial responsibility, including deductibles and co-insurance, if applicable.
These websites also help patients understand which providers may be in-network or out-of-
network, which can affect both the employee’s and the employer’s costs.
One additional challenge of using online transparency tools to compare pricing is that not all
websites report costs the same way. Federal regulations require that some providers report their
undiscounted charges at a high level of detail, with separate line-items for discrete professional
services, consumables, or various medications. Other websites might report fully aggregated
costs for an entire “episode” of care, including the full range of costs that a patient might incur
over a period of time in association with a specific event or procedure, such as a knee
replacement or heart attack. Both reporting methods have their strengths and weaknesses, but
they can be exceptionally difficult to compare with each other.
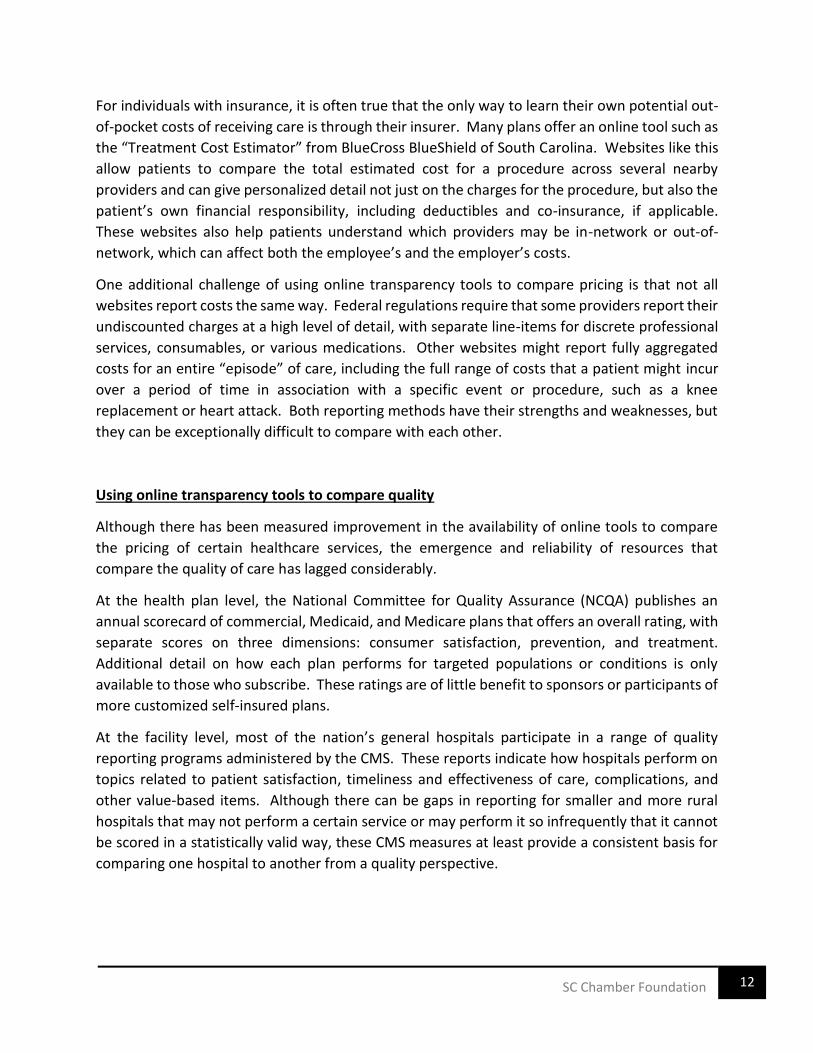
Using online transparency tools to compare quality
Although there has been measured improvement in the availability of online tools to compare
the pricing of certain healthcare services, the emergence and reliability of resources that
compare the quality of care has lagged considerably.
At the health plan level, the National Committee for Quality Assurance (NCQA) publishes an
annual scorecard of commercial, Medicaid, and Medicare plans that offers an overall rating, with
separate scores on three dimensions: consumer satisfaction, prevention, and treatment.
Additional detail on how each plan performs for targeted populations or conditions is only
available to those who subscribe. These ratings are of little benefit to sponsors or participants of
more customized self-insured plans.
At the facility level, most of the nation’s general hospitals participate in a range of quality reporting programs administered by the CMS. These reports indicate how hospitals perform on
topics related to patient satisfaction, timeliness and effectiveness of care, complications, and
other value-based items. Although there can be gaps in reporting for smaller and more rural
hospitals that may not perform a certain service or may perform it so infrequently that it cannot
be scored in a statistically valid way, these CMS measures at least provide a consistent basis for
comparing one hospital to another from a quality perspective.
SC Chamber Foundation 12

Beyond hospitals, there is relatively little for plan sponsors or beneficiaries to rely on in terms of
provider-level reporting. For instance, no website offers a reliable comparison of physician
quality or outcomes in South Carolina.
Making the most of online transparency and comparison tools
The Task Force found that online transparency tools can help employers and employees to
significantly reduce their cost of care, but they are often imperfect and incomplete resources,
can be confusing to use and interpret, and tend to have poor adoption rates. Employers, as the
sponsors of many insurance plans, can address many of these challenges for the individuals
whose coverage they support.
Although only a minority of healthcare services are “shoppable,” online tools allow patients to compare costs at nearby hospitals and potentially certain quality or outcomes data, depending
upon the diagnosed condition. The picture is more complete for hospital-based services than for
care provided in standalone physician offices or other settings. Similarly, there are better
resources available for comparing the price of care than there are for comparing its quality.
The Task Force also recognized that a patient’s financial responsibility will often be a function not just of a healthcare provider’s charges, but also of the patient’s insurance coverage. As a result, it is often the insurer instead of the provider who is best positioned to provide information that
individuals can use to compare their potential treatment costs.
Benefit managers should take the time to familiarize themselves with these available tools and
develop a strategy for sharing them, such as during the annual open enrollment period, with the
individuals whose coverage they subsidize. The savings opportunities are real – a 2018 study
found that if patients used existing online transparency tools to find the lowest-cost provider
within an hour of their homes, they could reduce their out-of-pocket costs by 44 percent, their
plan sponsors’ costs by 61 percent, and cut nationwide spending on MRIs alone by more than $1
billion annually.26
The Task Force identified the following websites as the best no-cost online comparison tools for
South Carolina, based upon their comprehensiveness and transparency:
Treatment Cost Estimator – BlueCross BlueShield of South Carolina (example)
(https://www.southcarolinablues.com/web/nonsecure/sc/Member+Home/Member+Perks/Onl
ine+Tools/My+Health+Toolkit)
• The best source of information on a patient’s own potential financial responsibility for accessing healthcare services is typically his or her own insurer. The “Treatment Cost
26 Chernew, M., Cooper, Z., Larsen-Hallock, E., and Scott Morton, F. “Are Health Care Services Shoppable? Evidence from Lower-Limb MRI Scans.” NBER Working Paper No. 24869. July 2018.
SC Chamber Foundation 13
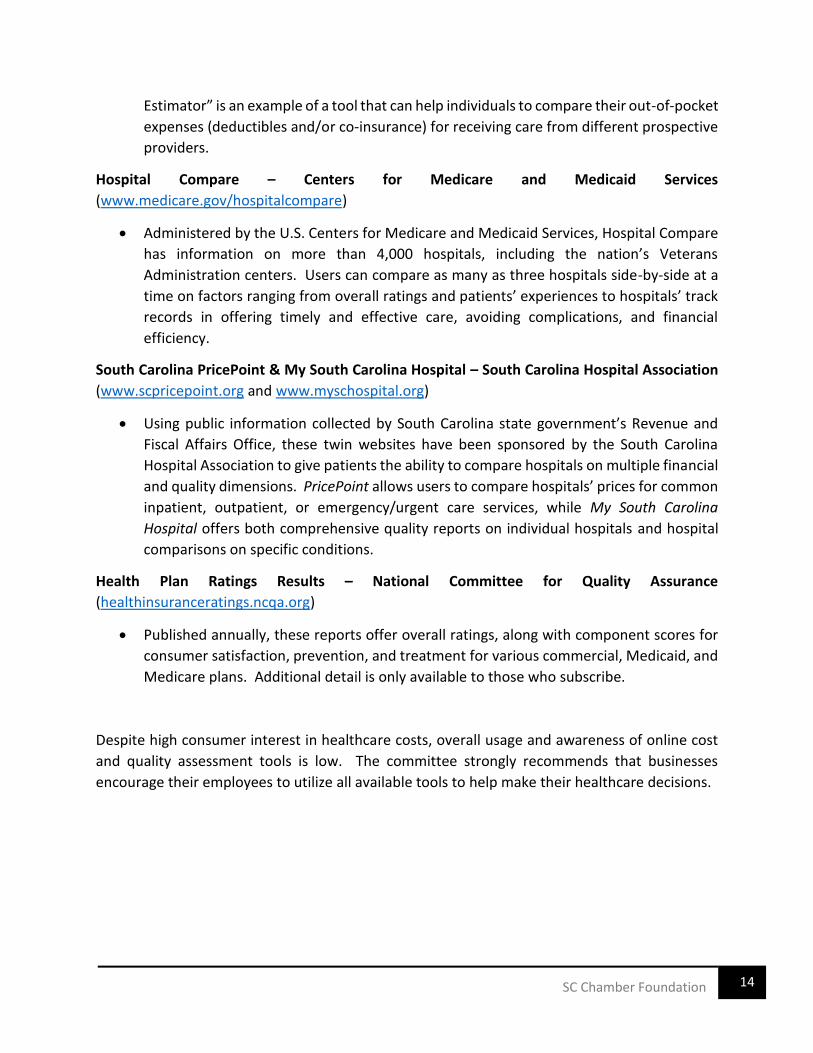
Estimator” is an example of a tool that can help individuals to compare their out-of-pocket
expenses (deductibles and/or co-insurance) for receiving care from different prospective
providers.
Hospital Compare – Centers for Medicare and Medicaid Services
(www.medicare.gov/hospitalcompare)
• Administered by the U.S. Centers for Medicare and Medicaid Services, Hospital Compare
has information on more than 4,000 hospitals, including the nation’s Veterans
Administration centers. Users can compare as many as three hospitals side-by-side at a
time on factors ranging from overall ratings and patients’ experiences to hospitals’ track records in offering timely and effective care, avoiding complications, and financial
efficiency.
South Carolina PricePoint & My South Carolina Hospital – South Carolina Hospital Association
(www.scpricepoint.org and www.myschospital.org)
• Using public information collected by South Carolina state government’s Revenue and Fiscal Affairs Office, these twin websites have been sponsored by the South Carolina
Hospital Association to give patients the ability to compare hospitals on multiple financial
and quality dimensions. PricePoint allows users to compare hospitals’ prices for common
inpatient, outpatient, or emergency/urgent care services, while My South Carolina
Hospital offers both comprehensive quality reports on individual hospitals and hospital
comparisons on specific conditions.
Health Plan Ratings Results – National Committee for Quality Assurance
(healthinsuranceratings.ncqa.org)
• Published annually, these reports offer overall ratings, along with component scores for
consumer satisfaction, prevention, and treatment for various commercial, Medicaid, and
Medicare plans. Additional detail is only available to those who subscribe.
Despite high consumer interest in healthcare costs, overall usage and awareness of online cost
and quality assessment tools is low. The committee strongly recommends that businesses
encourage their employees to utilize all available tools to help make their healthcare decisions.
SC Chamber Foundation 14
Recommendation 3: Prepare and Promote a “Healthcare Literacy Toolkit”
The Institute of Medicine defines health literacy as “the degree to which individuals can obtain, process, and understand the basic information and services they need to make appropriate
health decisions.”
According to a 2010 report by the U.S. Department of Health and Human Services, nearly nine
out of ten English-speaking adults in the United States have limited health literacy skills, which
research has shown is associated with poor health outcomes, higher rates of hospitalization, and
higher healthcare costs.27 In a 2015 study of 92,749 veterans with service utilization from 2007
to 2009, average per-patient cost for those with inadequate and marginal health literacy was
almost 46 percent higher than for those with adequate health literacy. 28
Numerous studies show that health literacy is a strong predictor of health status. Inadequate
health literacy can lead to numerous negative effects on an individual’s health and well-being,
including poor self-care, increased utilization of health services, worse outcomes, and decreased
likelihood of receiving preventive care and services. Poor communication with patients also
contributes to unnecessary readmissions and reduced patient satisfaction and engagement.
People with limited health literacy often lack knowledge or have misinformation about the body,
the nature and causes of disease, as well as how to navigate the healthcare system. 29
In response to the clear connection between low health literacy and poor health outcomes, the
federal government launched a National Action Plan in 2010 outlining the following goals and
multiple strategies to improve the rate of health literacy in the U.S. 30:
▪ develop and disseminate health and safety information that is accurate, accessible and
actionable;
▪ promote changes in the healthcare system that improve information, communication,
informed decision-making and access to services;
▪ incorporate accurate, standards-based and developmentally appropriate health and
science information and curricula in child care and education through the university level;
▪ support and expand local efforts to provide adult education, English language instruction
and culturally and linguistically appropriate health information services in the community;
27 U.S. Department of Health and Human Services, Office of Disease Prevention and Health Promotion. “National Action Plan to Improve Health Literacy.” (2010) 28 Haun, Patel, French, Campbell, Bradham, and Lapcevic, “Association between health literacy and medical care costs in an integrated healthcare system: a regional population study,” June 27, 2015, BMC Health Services Research. 29 Frank Federico, “8 Ways to Improve Health Literacy,” October 15, 2014, Institute for Healthcare Improvement; U.S. Department of Health and Human Services, Office of Disease Prevention and Health Promotion. “National Action Plan to Improve Health Literacy.” (2010) 30 U.S. Department of Health and Human Services, Office of Disease Prevention and Health Promotion. “National Action Plan to Improve Health Literacy.” (2010)
SC Chamber Foundation 15
▪ build partnerships with philanthropic, advocacy, academic, professional and other
organizations and government agencies and work with them to develop guidance and
change policies;
▪ increase basic research and the development, implementation and evaluation of
practices and interventions to improve health literacy; and
▪ increase the dissemination and use of evidence-based health literacy practices and
interventions.
One strategy for achieving the goals outlined above is to create a Health Literacy Toolkit used to
reduce the complexity of healthcare information. For example, the Agency for Healthcare
Research and Quality designed a comprehensive Universal Precautions Toolkit specifically for
healthcare providers with the purpose of simplifying communication, making the office
environment and healthcare system easier to navigate and supporting patients' efforts to
improve their health.31
Similarly, the Task Force recommends the development and promotion of an online health
literacy toolkit specifically designed for employee benefit managers to help employees make
better, more informed choices about their own and their families’ health. The toolkit should
include clear, simple and informative material about:
• preventive health opportunities, like flu shots and mammograms;
• cost and quality online tools as outlined in Recommendation 2;
• complex healthcare choices like health savings accounts versus flexible spending
accounts; and
• other health information to help employees understand the choices, consequences and
context of health information and services.
Recommendation 4: Consider State Tax Credits for Employer Wellness Programs
Most North American employers that have analyzed the return on investment (ROI) of their
wellness programs have found $1 to $3 decreases in their overall healthcare costs for every dollar
spent.32 It makes intuitive sense that a healthier, fitter workforce incurs less healthcare cost and
is more productive. A 2010 Journal of Occupational and Environmental Medicine research study
found $73.1 billion in aggregate extra healthcare cost directly attributable to overweight and
obese employees.33
31 Brega AG, Barnard J, Mabachi NM, Weiss BD, DeWalt DA, Brach C, Cifuentes M, Albright K, West, DR. AHRQ Health Literacy Universal Precautions Toolkit, Second Edition. (Prepared by Colorado Health Outcomes Program, University of Colorado Anschutz Medical Campus under Contract No. HHSA290200710008, TO#10.) AHRQ Publication No. 15-0023-EF. Rockville, MD. Agency for Healthcare Research and Quality. January 2015. 32 “A Closer Look; Workforce Wellness Outcomes.” International Foundation of Employee Benefit Plans. (2016) 33 Eric A. Finkelstein, Marco daCosta DiBonaventura, Somali M. Burgess and Brent C. Hale. “The Cost of Obesity in the Workplace,” Journal of Occupational and Environmental Medicine 52, no. 10: 971—76,
doi:10.1097/JOM.0b013e3181f274d2. October 2010.
SC Chamber Foundation 16

In what it called “the most thorough and rigorous systematic review of the literature conducted to date on the return on investment (ROI) of workplace health promotion programs,” the American Journal of Health Promotion reported an ROI of $2.38 for every dollar invested.
According to the January 2015 article, the 51 studies on which the analysis was based involved
261,901 participants and 122,242 controls from 9 industry types in 12 nations; the 51 studies
were published between 1984 and 2012 34.
In 2012 Kentucky produced a study on the value of a worksite wellness tax credit that made
strong recommendations in favor of the tax credit. The summary report can be viewed here:
http://www.healthimpactproject.org/resources/document/Home-HIA-Executive-Summary-
2012-FINAL-22212.pdf .
The purpose of the assessment was to evaluate the potential effects of a worksite wellness tax
credit on three main areas of concern for Kentucky: (1) nutrition, physical activity and obesity
levels of children whose parents receive worksite wellness services, (2) jobs and (3) social
cohesion.
The Kentucky Department for Public Health produced this report with grant funds from the
Association of State and Territorial Health Officials and technical assistance from Human Impact
Partners and Western Kentucky University. It identified extensive research showing that worksite
wellness programs benefit both employees and employers by helping to change employee health
behaviors and reducing their risk of disease. This results in reduced healthcare costs, fewer
workers’ compensation and disability claims and less absenteeism.
When South Carolina legislators develop their tax reform proposals they should consider the
effectiveness of a state tax credit for employers who implement comprehensive wellness
programs. Doing so will likely increase the number of wellness programs offered in the state and
therefore improve the health of its citizens.
Conclusion
There are many opportunities and strategies to lower healthcare costs at the state and business
level without having to entirely rely on major health policy changes at the federal level. The
recommendations developed in this report by the Chamber Foundation’s Healthcare Task Force are wide-ranging from state legislative and agency action to employer-driven health cost and
literacy education and awareness. Collectively, the implementation of these recommendations
can have a positive impact on healthcare costs and outcomes in South Carolina.
34 Michael P. O’Donnell. “What Is the ROI of Workplace Health Promotion? The Answer Just Got Simpler by Making the Question More Complicated.” American Journal of Health Promotion: July/August 2014, Vol. 28, No. 6, pp. iv-v.
SC Chamber Foundation 17