Embed Size (px)
Citation preview
packaging + printed paperstrategies to increase
recovery in connecticutPSI final presentation to connecticut DEEP
December 2015
about this project
2
Prepared by
Product Stewardship Institute, Inc. for
the Connecticut Department of Energy and Environmental Protection (DEEP)
December 2015
Acknowledgement of Funding
The funding for this study was provided by the Connecticut Department of Energy and Environmental Protection (DEEP).
Acknowledgement of Assistance
Assistance was provided by Environmental Packaging International (EPI).
Product Stewardship Institute Inc. is an affirmative action employer and provider.
meetingcontext
3
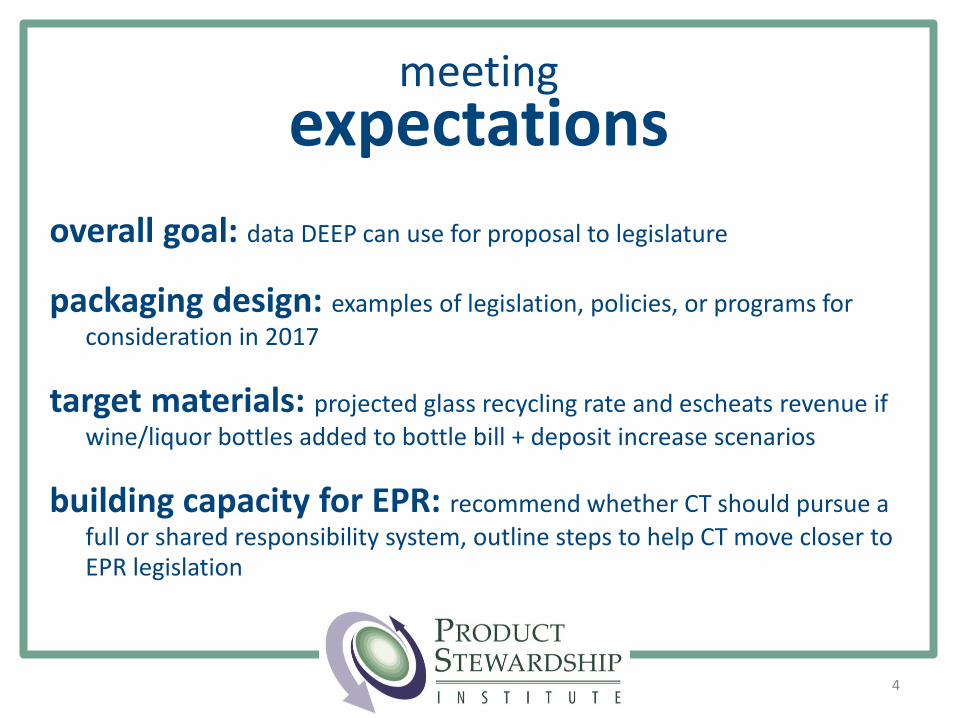
overall goal: data DEEP can use for proposal to legislature
packaging design: examples of legislation, policies, or programs for consideration in 2017
target materials: projected glass recycling rate and escheats revenue if wine/liquor bottles added to bottle bill + deposit increase scenarios
building capacity for EPR: recommend whether CT should pursue a full or shared responsibility system, outline steps to help CT move closer to EPR legislation
meeting expectations
4
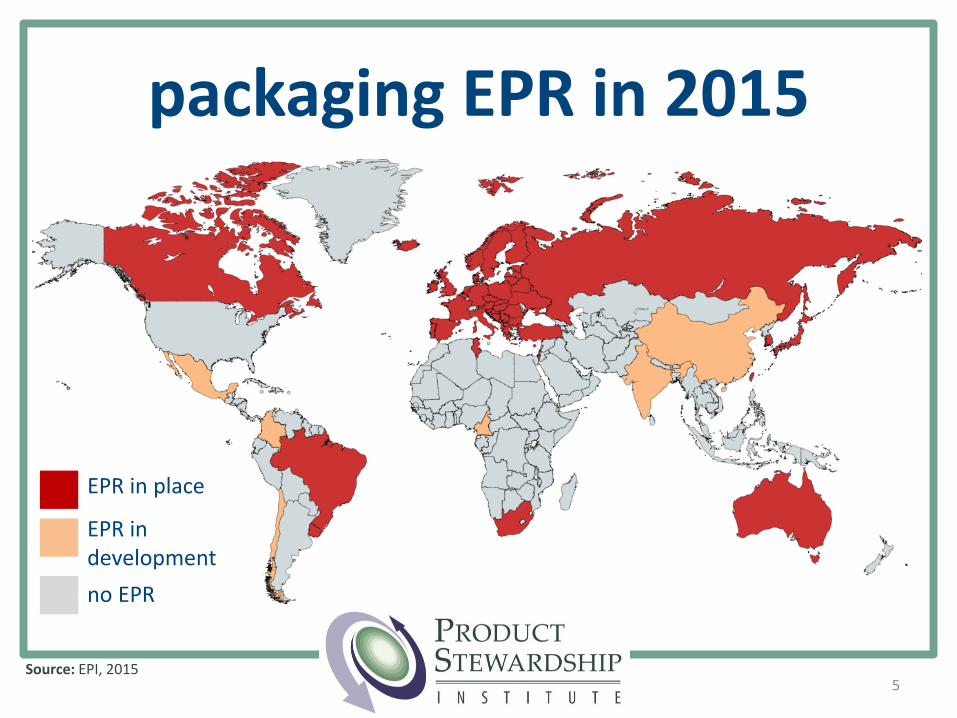
EPR in place
EPR in development
no EPR
Source: EPI, 2015
packaging EPR in 2015
5
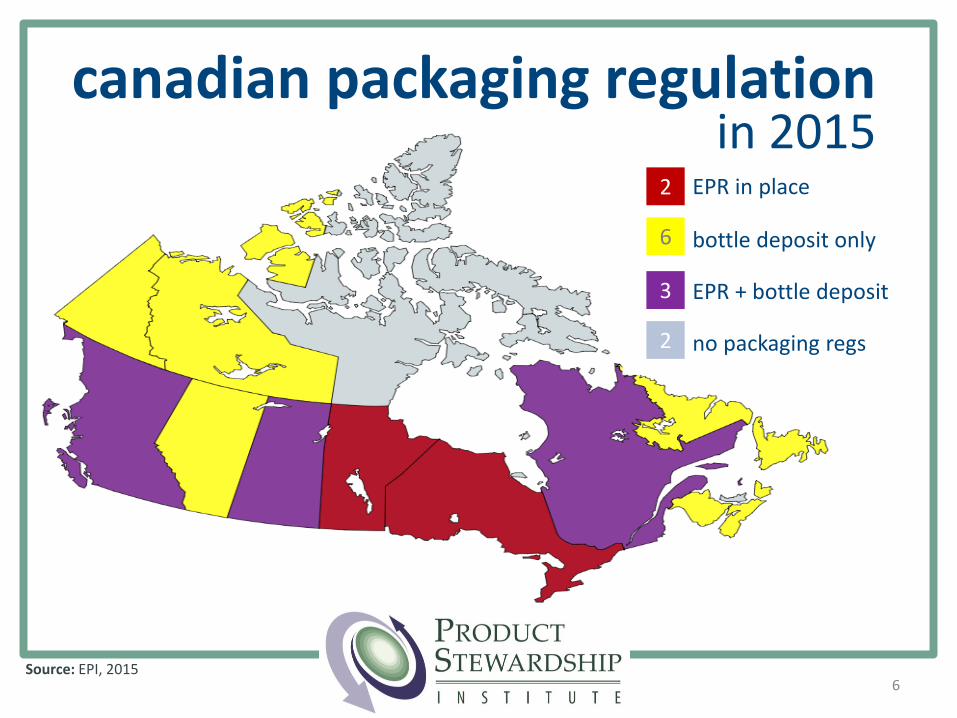
EPR in place
bottle deposit only
EPR + bottle deposit
no packaging regs
2
6
3
Source: EPI, 2015
canadian packaging regulation in 2015
6
2
packaging design policy options
7
introduction to packaging design process
8
• each manufacturer has a unique process• some have packaging design departments or divisions• some use consulting services and outsource all packaging design• some use consulting only for help with costs in the design phase
• primarily, packaging design is focused on marketing and creating brand recognition
• dependent on company values – which vary greatly
9
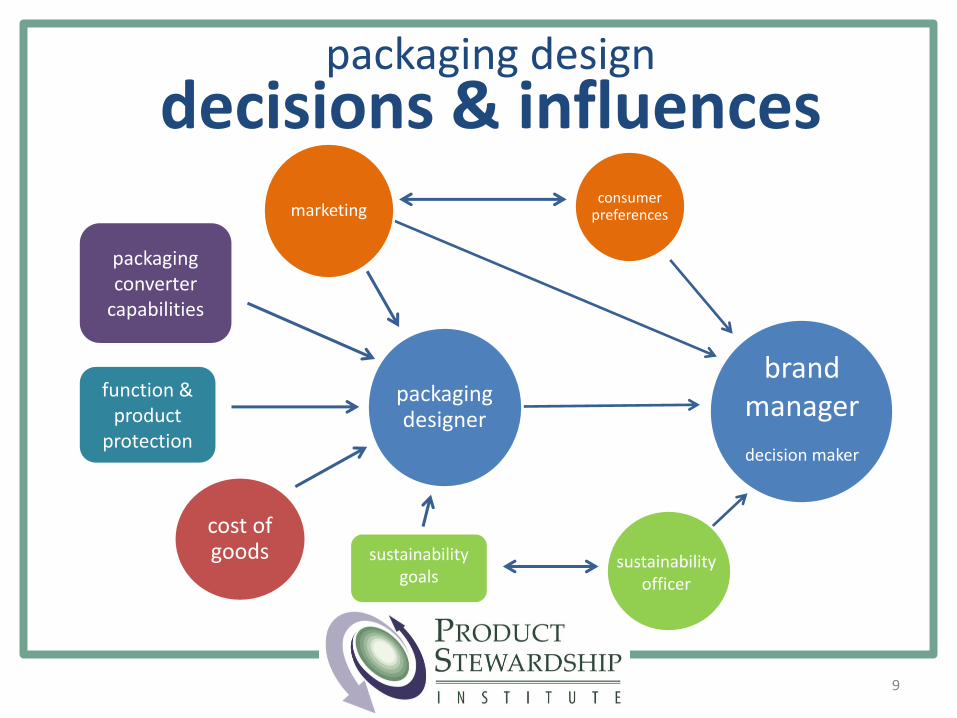
packaging design decisions & influences
packaging designer
brand manager
decision maker
packaging converter
capabilities
cost of goods
function & product
protection
consumer preferencesmarketing
sustainability goals
sustainability officer
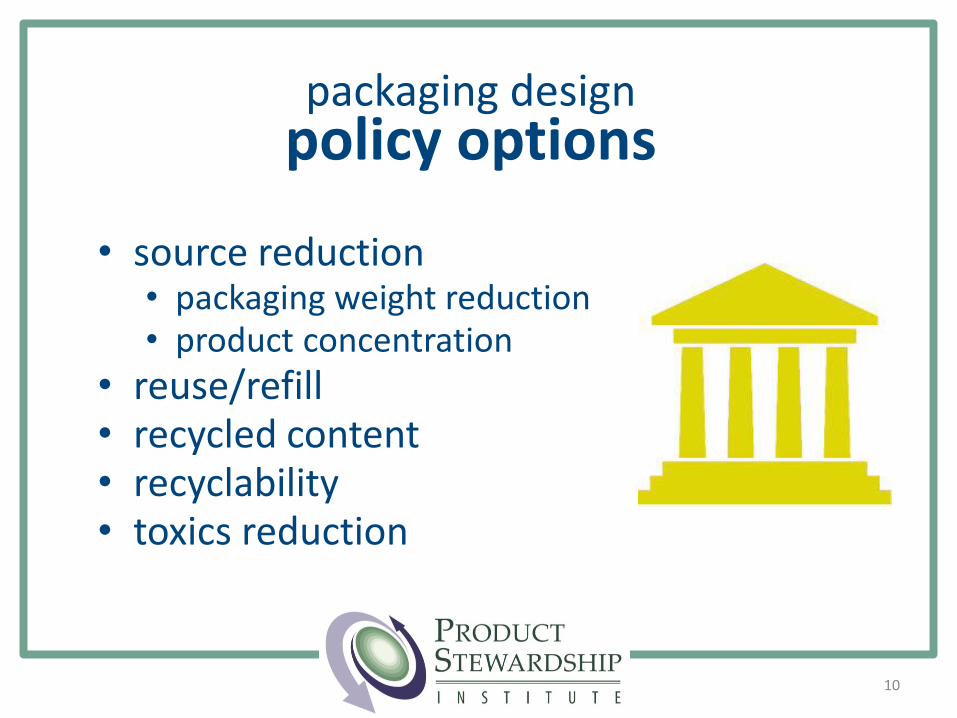
• source reduction • packaging weight reduction• product concentration
• reuse/refill• recycled content• recyclability• toxics reduction
packaging designpolicy options
10
packaging design policies without EPR
11
12
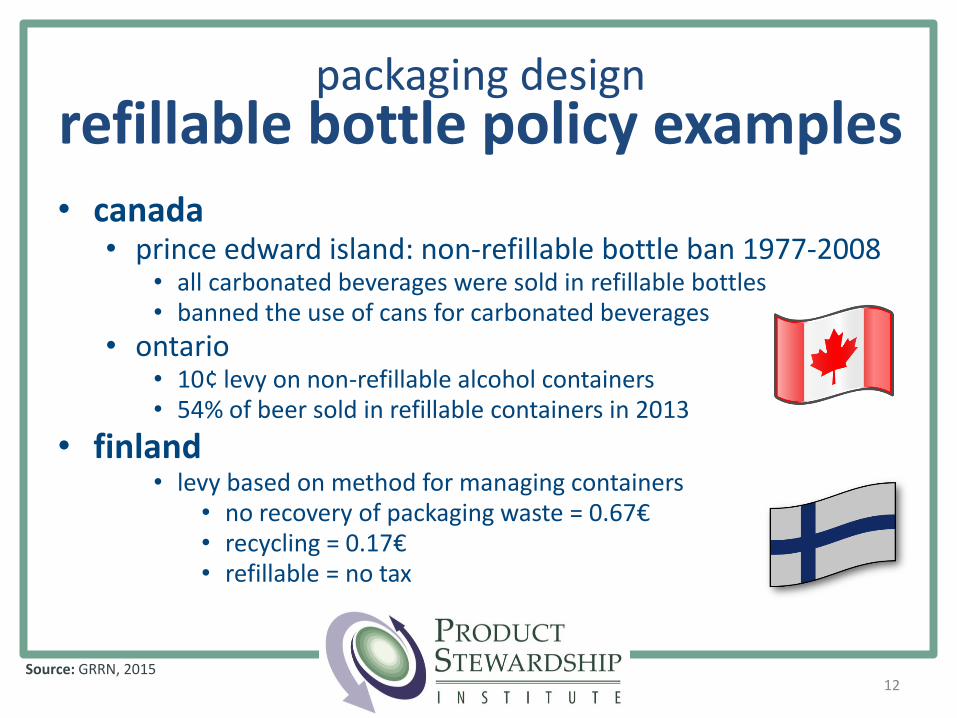
packaging designrefillable bottle policy examples• canada
• prince edward island: non-refillable bottle ban 1977-2008• all carbonated beverages were sold in refillable bottles• banned the use of cans for carbonated beverages
• ontario• 10¢ levy on non-refillable alcohol containers• 54% of beer sold in refillable containers in 2013
• finland• levy based on method for managing containers
• no recovery of packaging waste = 0.67€• recycling = 0.17€• refillable = no tax
Source: GRRN, 2015
refillable bottle policy
• refillables work best in certain contexts for small geographic areas (CT)• focus on small enterprises
• microbreweries • wineries• dairies
13
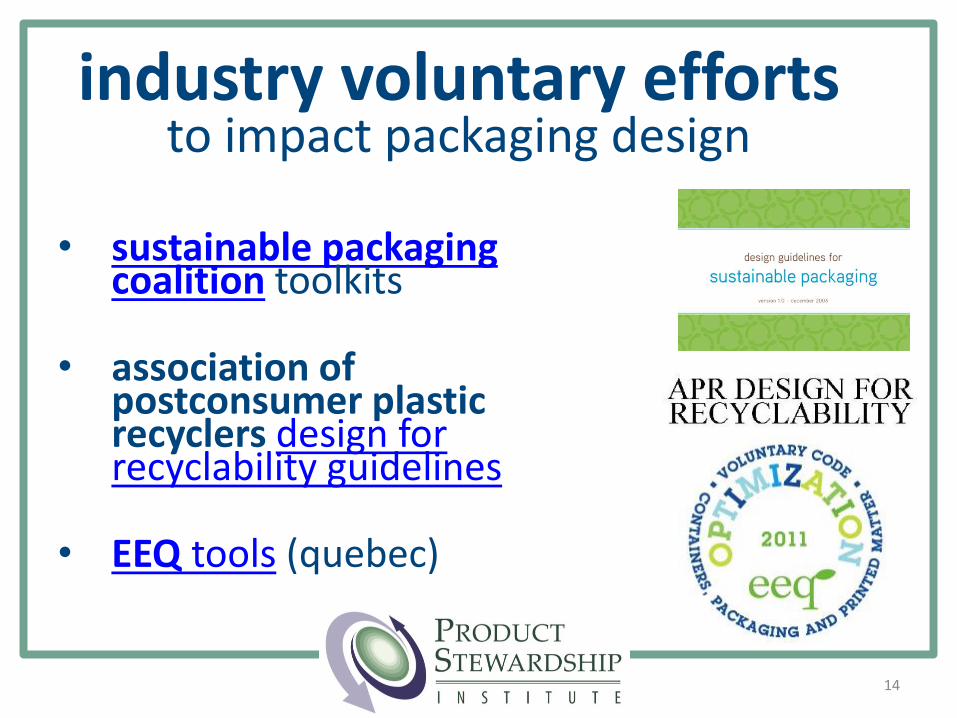
industry voluntary effortsto impact packaging design
• sustainable packaging coalition toolkits
• association of postconsumer plastic recyclers design for recyclability guidelines
• EEQ tools (quebec)
14
• mandates that all packaging sold in europe meet a set of “Essential Requirements” related to: • source reduction (mandatory)
• recovery (must meet at least one)• recyclability, organic recovery, energy recovery
• heavy metals in packaging (mandatory)
• reduction of other hazardous substances (mandatory)
• reuse (optional)
packaging designEU packaging directive
15
• packaging that does not comply with these Essential Requirements can legally be banned from EU markets
• CEN/ISO standards are the most common method for assessing & demonstrating compliance
• more enforcement coming in both Western and Eastern Europe
16
packaging designEU packaging directive
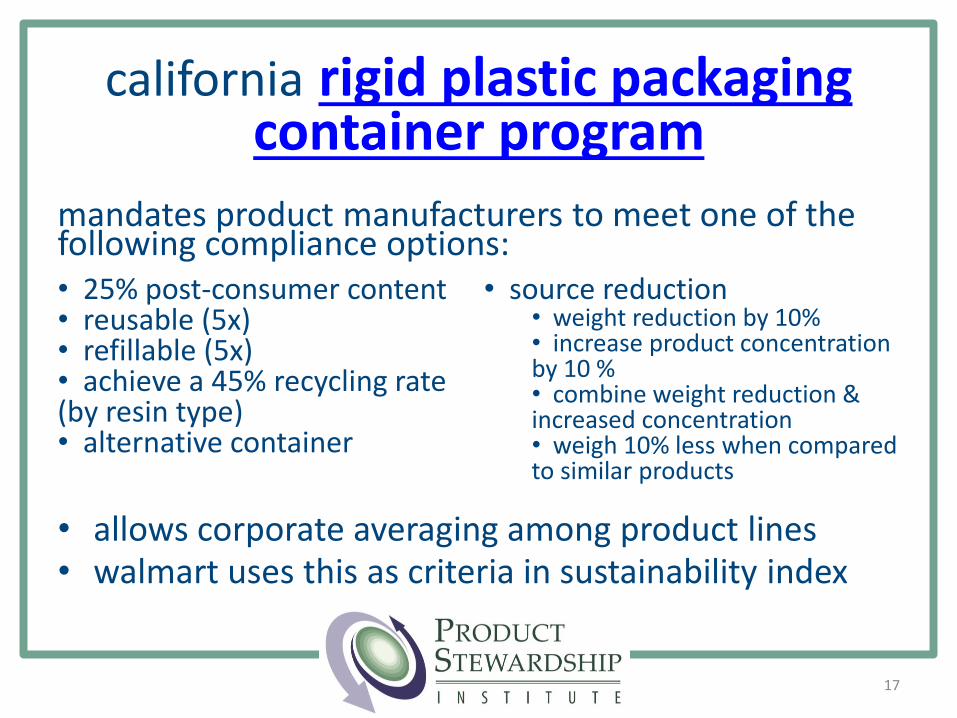
california rigid plastic packaging container program
mandates product manufacturers to meet one of the following compliance options:
17
• 25% post-consumer content• reusable (5x)• refillable (5x)• achieve a 45% recycling rate (by resin type)• alternative container
• source reduction • weight reduction by 10%• increase product concentration by 10 %• combine weight reduction & increased concentration• weigh 10% less when compared to similar products
• allows corporate averaging among product lines• walmart uses this as criteria in sustainability index
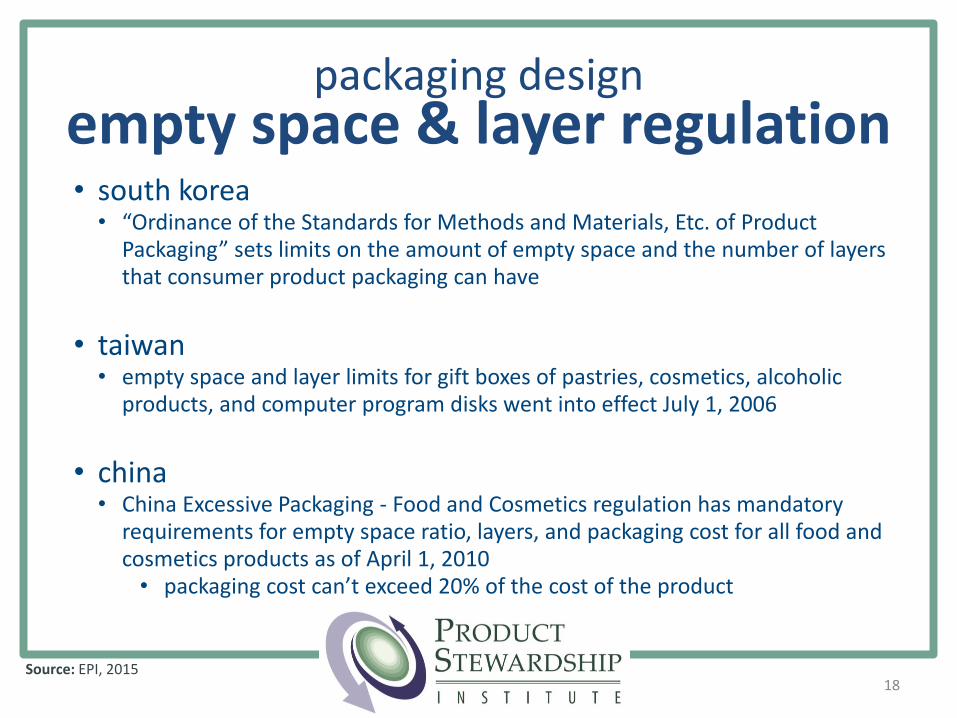
packaging designempty space & layer regulation• south korea• “Ordinance of the Standards for Methods and Materials, Etc. of Product
Packaging” sets limits on the amount of empty space and the number of layers that consumer product packaging can have
• taiwan• empty space and layer limits for gift boxes of pastries, cosmetics, alcoholic
products, and computer program disks went into effect July 1, 2006
• china• China Excessive Packaging - Food and Cosmetics regulation has mandatory
requirements for empty space ratio, layers, and packaging cost for all food and cosmetics products as of April 1, 2010• packaging cost can’t exceed 20% of the cost of the product
18Source: EPI, 2015
packaging design policiesin EPR systems
19
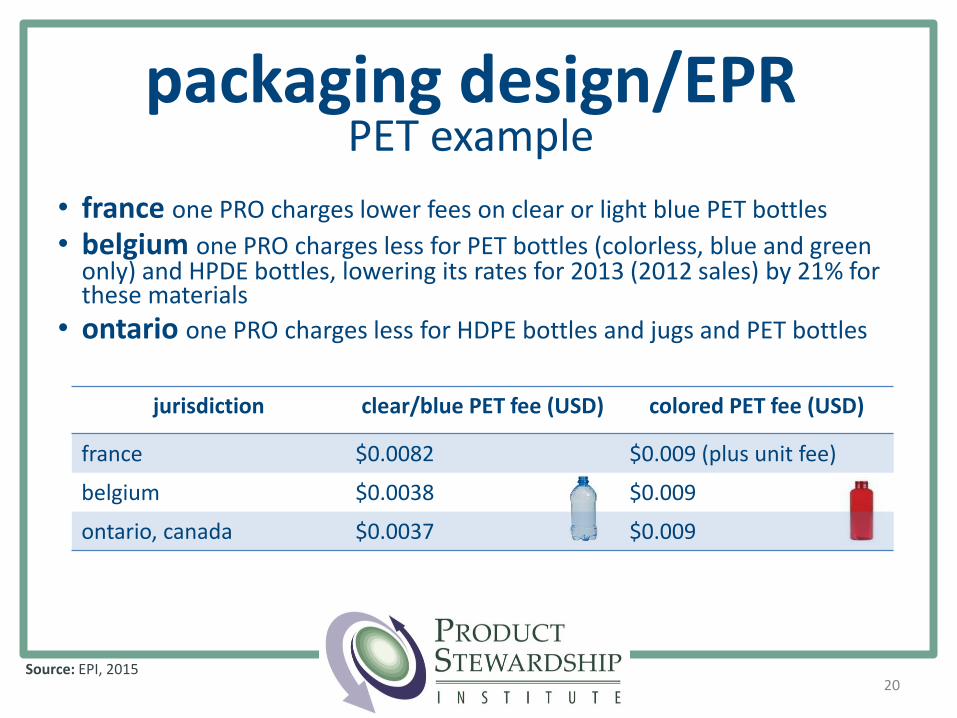
• france one PRO charges lower fees on clear or light blue PET bottles
• belgium one PRO charges less for PET bottles (colorless, blue and green only) and HPDE bottles, lowering its rates for 2013 (2012 sales) by 21% for these materials
• ontario one PRO charges less for HDPE bottles and jugs and PET bottles
Source: EPI, 2015
packaging design/EPRPET example
20
jurisdiction clear/blue PET fee (USD) colored PET fee (USD)
france $0.0082 $0.009 (plus unit fee)
belgium $0.0038 $0.009
ontario, canada $0.0037 $0.009
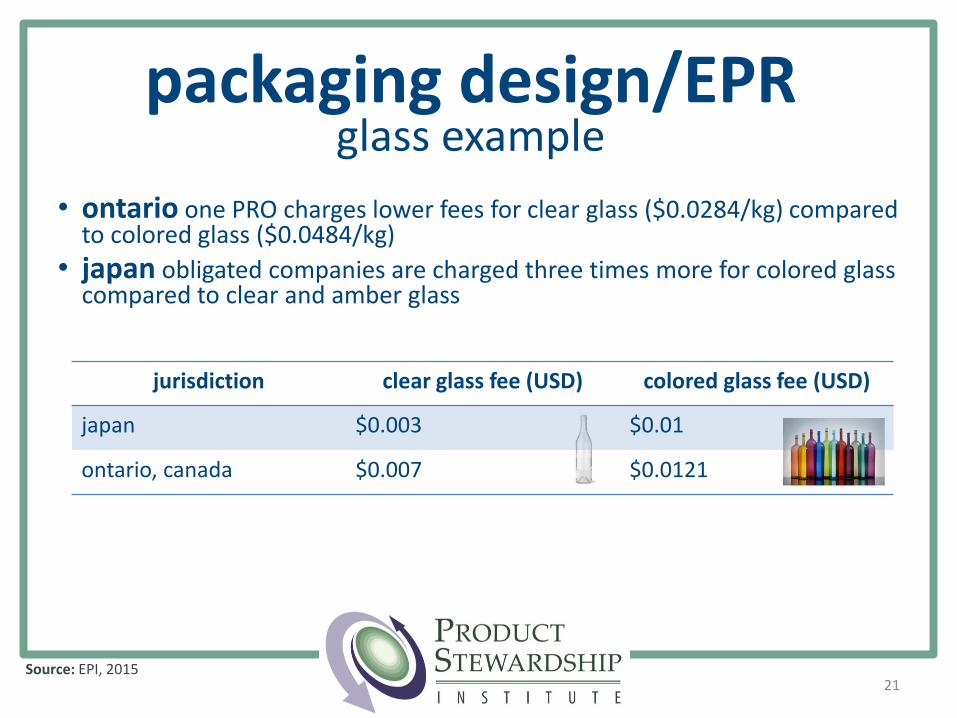
• ontario one PRO charges lower fees for clear glass ($0.0284/kg) compared to colored glass ($0.0484/kg)
• japan obligated companies are charged three times more for colored glass compared to clear and amber glass
Source: EPI, 2015
packaging design/EPRglass example
21
jurisdiction clear glass fee (USD) colored glass fee (USD)
japan $0.003 $0.01
ontario, canada $0.007 $0.0121
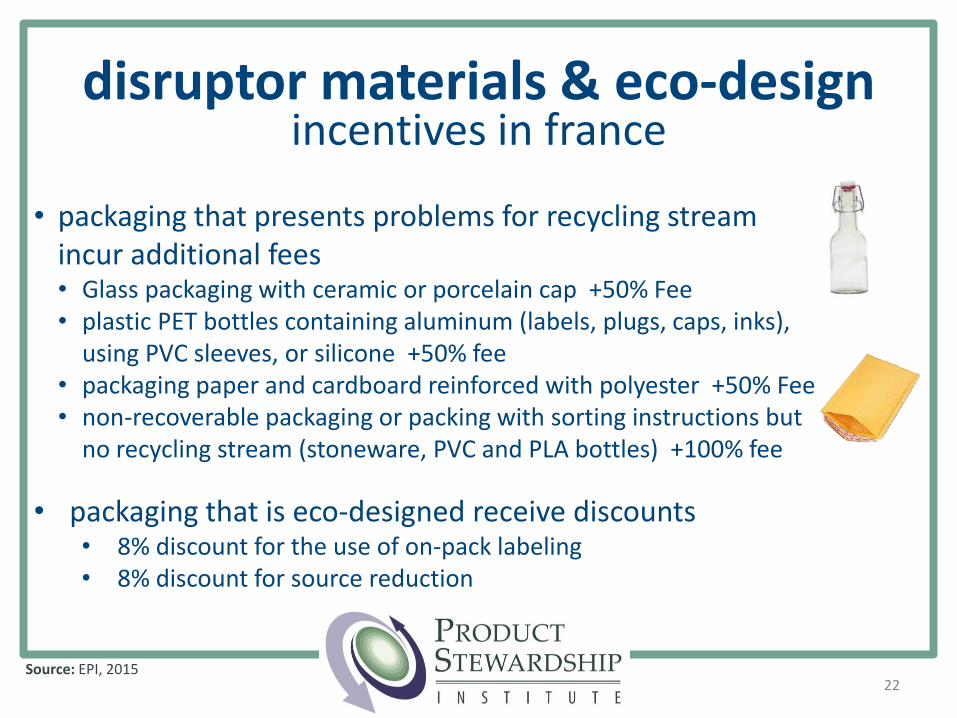
• packaging that presents problems for recycling stream incur additional fees• Glass packaging with ceramic or porcelain cap +50% Fee• plastic PET bottles containing aluminum (labels, plugs, caps, inks),
using PVC sleeves, or silicone +50% fee• packaging paper and cardboard reinforced with polyester +50% Fee• non-recoverable packaging or packing with sorting instructions but
no recycling stream (stoneware, PVC and PLA bottles) +100% fee
Source: EPI, 2015
• packaging that is eco-designed receive discounts• 8% discount for the use of on-pack labeling• 8% discount for source reduction
22
disruptor materials & eco-design incentives in france
• germany• all packaging: >95%
• france• all multi-material packaging: > 80%• if equal to or less than 80%, fees are assessed on each material
• canadian provinces thresholds vary from >50% to >95% on:• the type of packaging material and/or type of package• whether the packaging component remains attached to the
packaging when the consumer disposes of the packaging • the packaging component is an integrated part of the packaging
and is attached to the package
composite thresholdsEPR packaging design requirements
Source: EPI, 201523
24
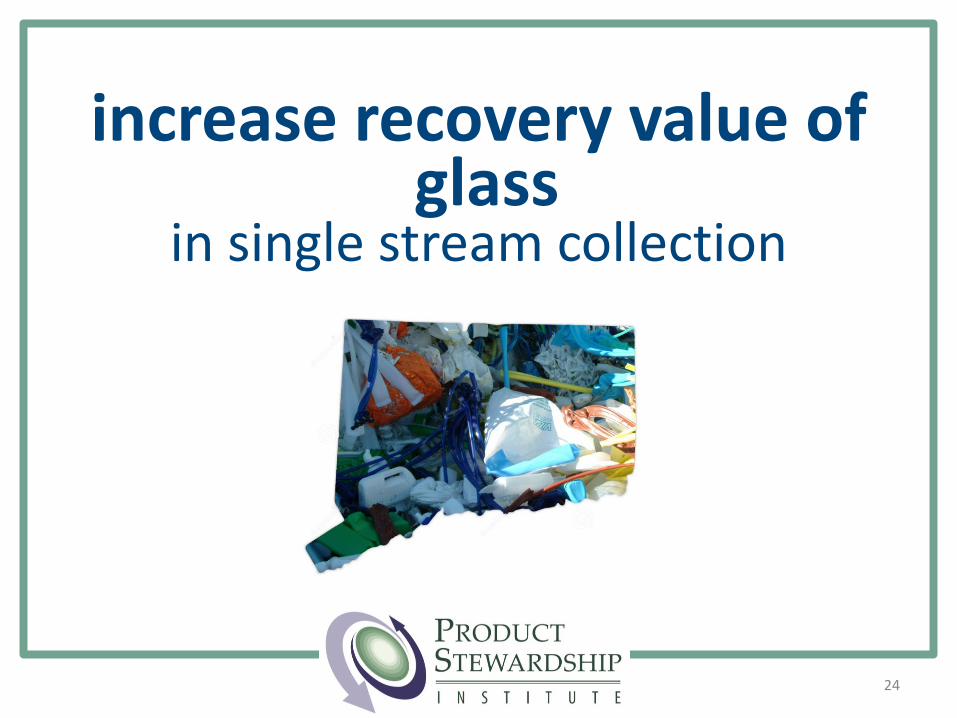
increase recovery value of glass
in single stream collection
25
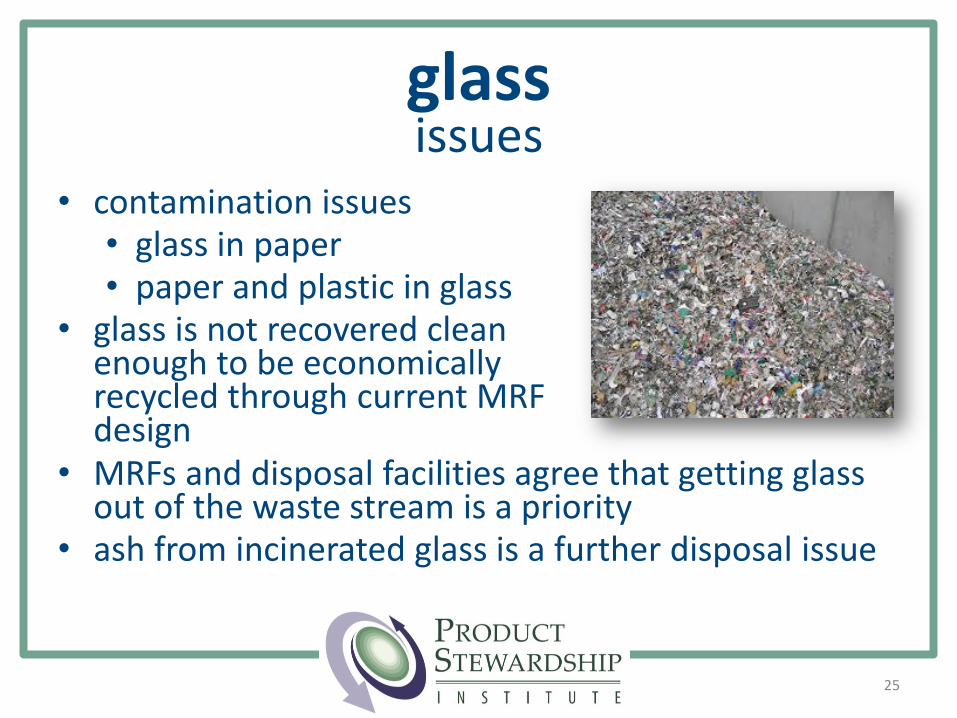
glassissues
• contamination issues• glass in paper• paper and plastic in glass
• glass is not recovered clean enough to be economically recycled through current MRF design
• MRFs and disposal facilities agree that getting glass out of the waste stream is a priority
• ash from incinerated glass is a further disposal issue
current deposit system
• 56% redemption rate (all containers)
• $39.5 million in escheats (from non-redemption)
• 74% redemption rate for glass
26Source: CRI, 2015; CT DRS Escheats Data, 2015; Macri CT Deposit System Report, 2015
27
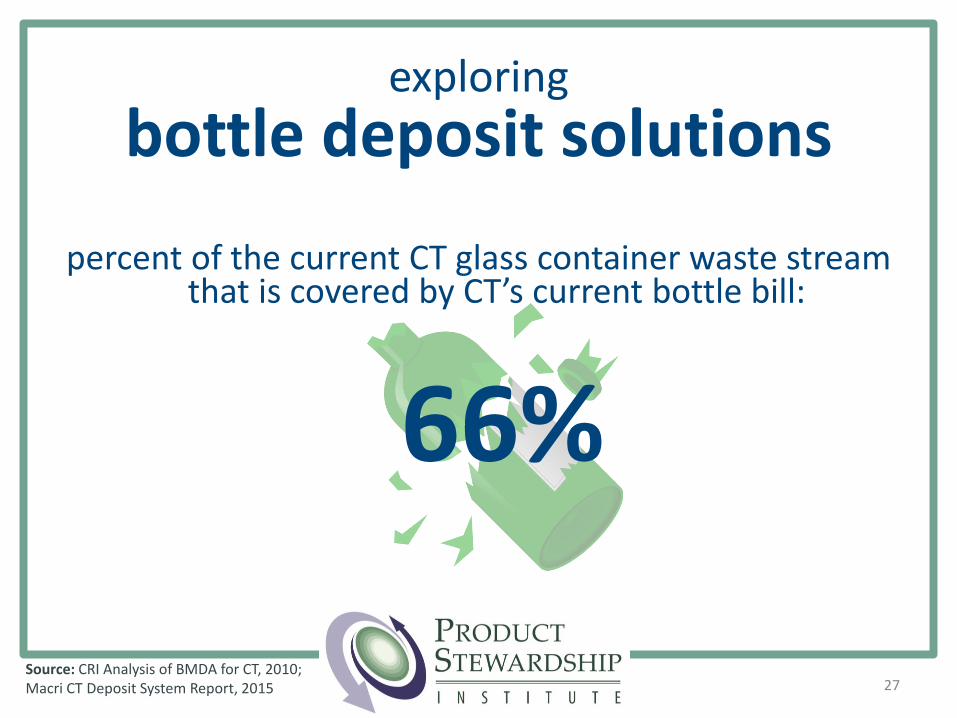
exploring
bottle deposit solutions
Source: CRI Analysis of BMDA for CT, 2010; Macri CT Deposit System Report, 2015
percent of the current CT glass container waste stream that is covered by CT’s current bottle bill:
66%
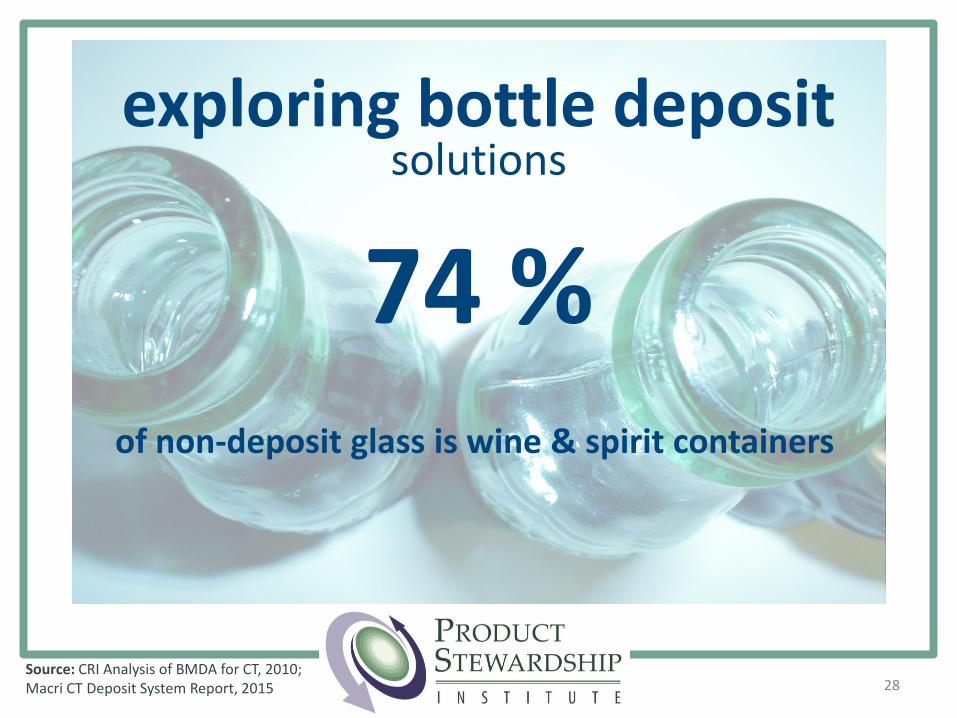
of non-deposit glass is wine & spirit containers
28
exploring bottle deposit solutions
74 %
Source: CRI Analysis of BMDA for CT, 2010; Macri CT Deposit System Report, 2015
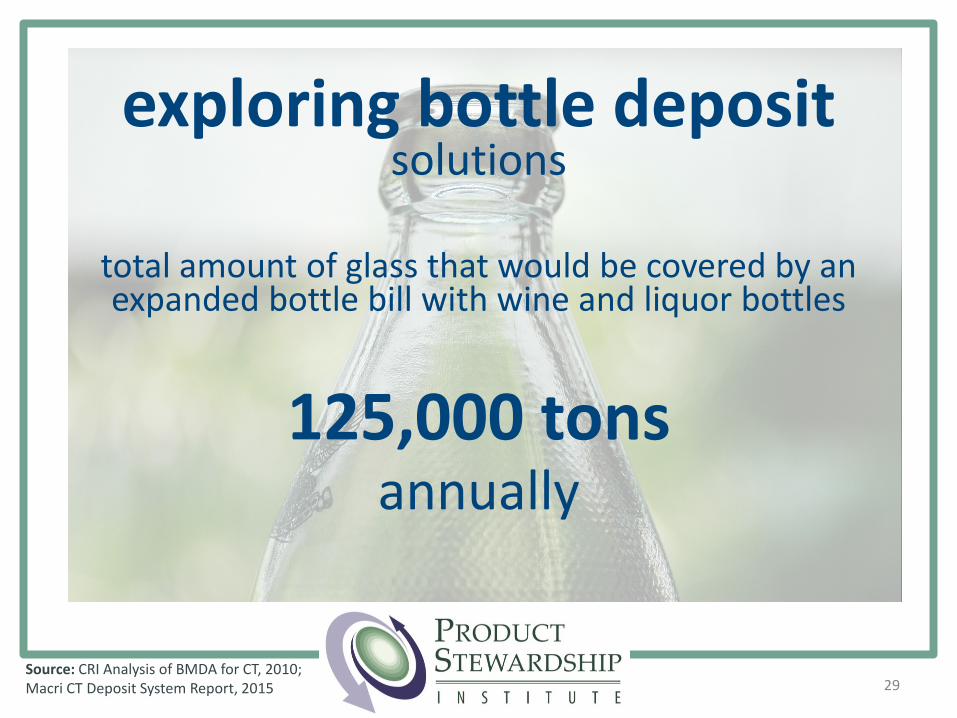
total amount of glass that would be covered by an expanded bottle bill with wine and liquor bottles
125,000 tonsannually
29Source: CRI Analysis of BMDA for CT, 2010; Macri CT Deposit System Report, 2015
exploring bottle deposit solutions
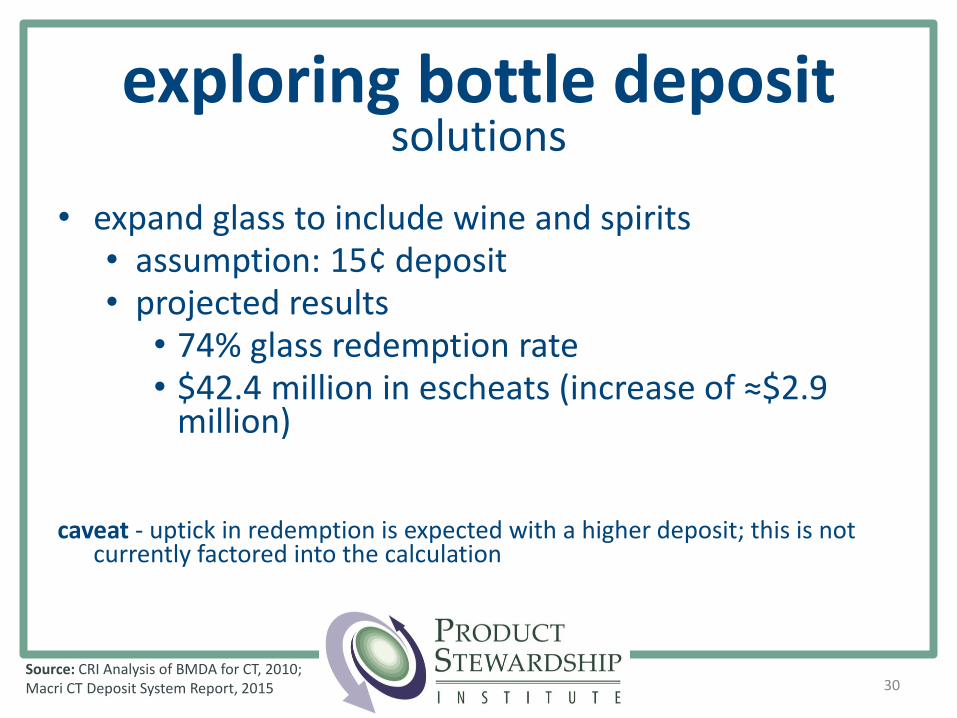
• expand glass to include wine and spirits• assumption: 15¢ deposit• projected results
• 74% glass redemption rate• $42.4 million in escheats (increase of ≈$2.9
million)
caveat - uptick in redemption is expected with a higher deposit; this is not currently factored into the calculation
30Source: CRI Analysis of BMDA for CT, 2010; Macri CT Deposit System Report, 2015
exploring bottle deposit solutions
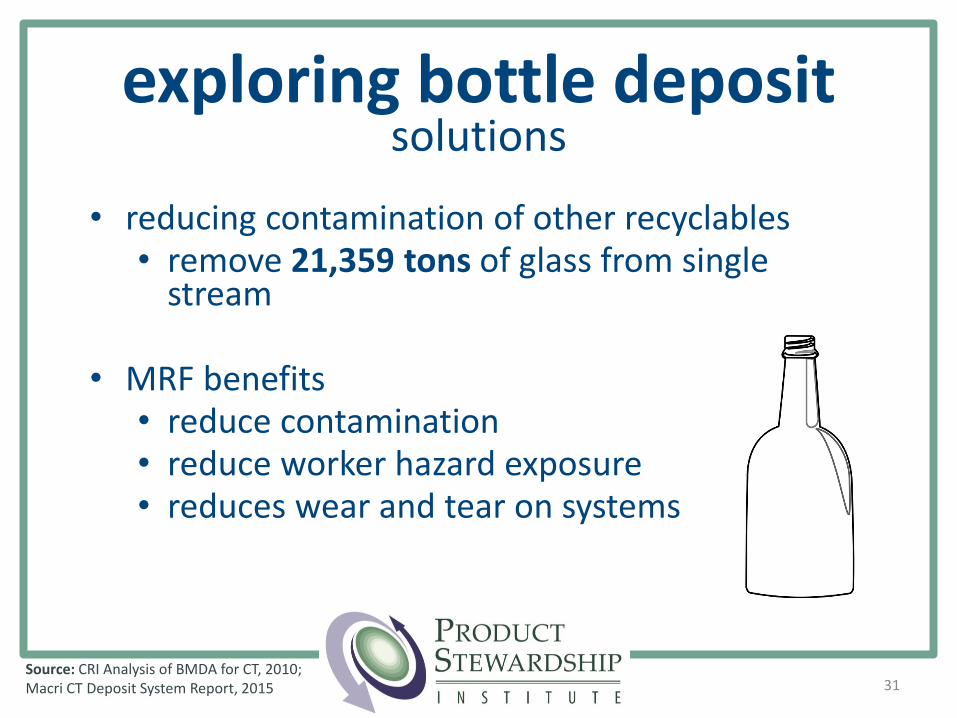
• reducing contamination of other recyclables• remove 21,359 tons of glass from single
stream
• MRF benefits• reduce contamination• reduce worker hazard exposure• reduces wear and tear on systems
31Source: CRI Analysis of BMDA for CT, 2010; Macri CT Deposit System Report, 2015
exploring bottle deposit solutions
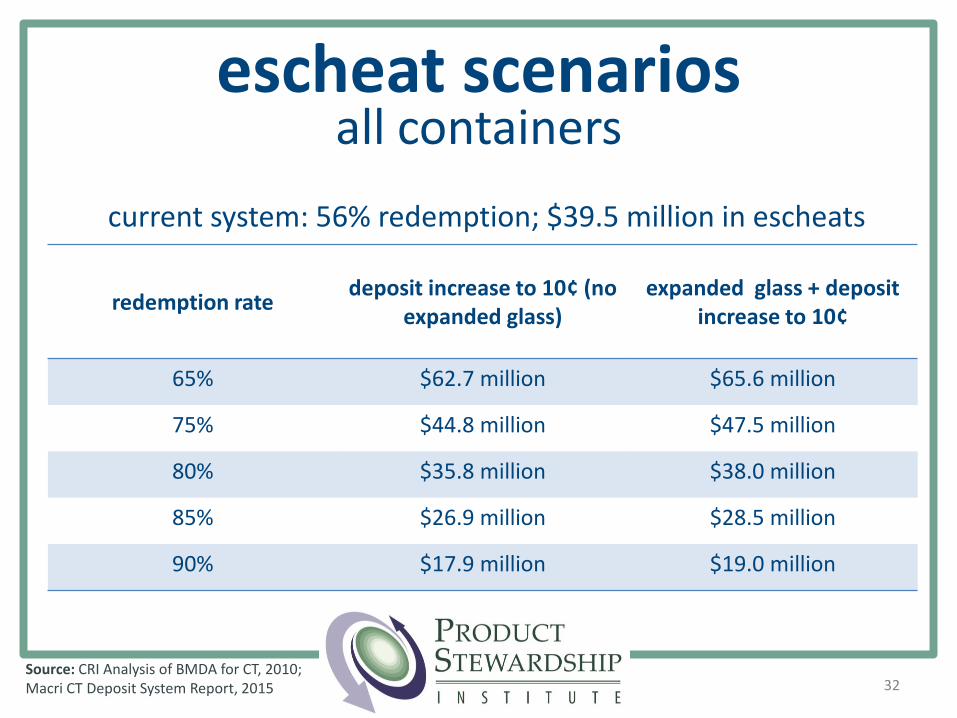
escheat scenariosall containers
redemption ratedeposit increase to 10¢ (no
expanded glass)expanded glass + deposit
increase to 10¢
65% $62.7 million $65.6 million
75% $44.8 million $47.5 million
80% $35.8 million $38.0 million
85% $26.9 million $28.5 million
90% $17.9 million $19.0 million
Source: CRI Analysis of BMDA for CT, 2010; Macri CT Deposit System Report, 2015 32
current system: 56% redemption; $39.5 million in escheats
building capacity forEPR for PPP
33
PPP scope
• no universal definition• only MSW in most cases• most european countries do not include printed paper• CT can customize materials to be included in law• US caveat – if newspapers are included as printed
paper, expect push back due to freedom of press• example - british columbia PPP definition
• all packaging generated by a residential consumer• “printed paper” includes all paper used for communication
• e.g., phonebooks included, text books excluded
34
EPR for PPPbenefits
• packaging design influence – different material fees
• increase recovery rate – up to 80% recovery
• resident convenience – standardized accepted materials
• improved quality – higher recycling rate; less contamination
• cost savings for government – 50% to 100%
• increased investment – PROs invest in infrastructure
• infrastructure efficiency – brand owners have economic
incentive to improve efficiency and gain economies of scale
35
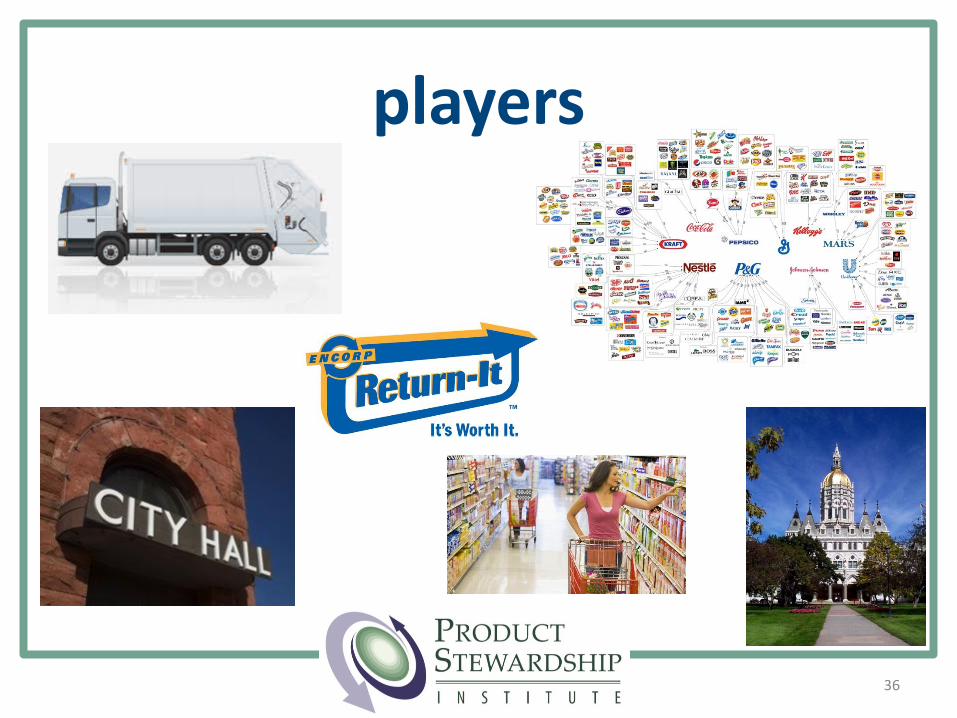
players
36
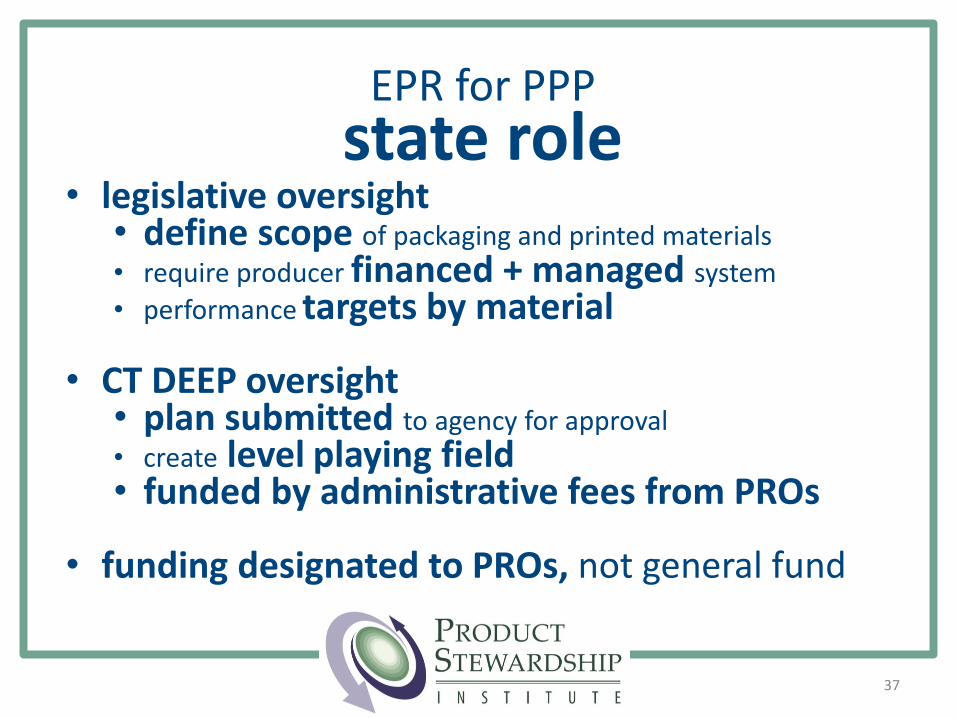
• legislative oversight• define scope of packaging and printed materials
• require producer financed + managed system
• performance targets by material
• CT DEEP oversight• plan submitted to agency for approval
• create level playing field• funded by administrative fees from PROs
• funding designated to PROs, not general fund
EPR for PPPstate role
37
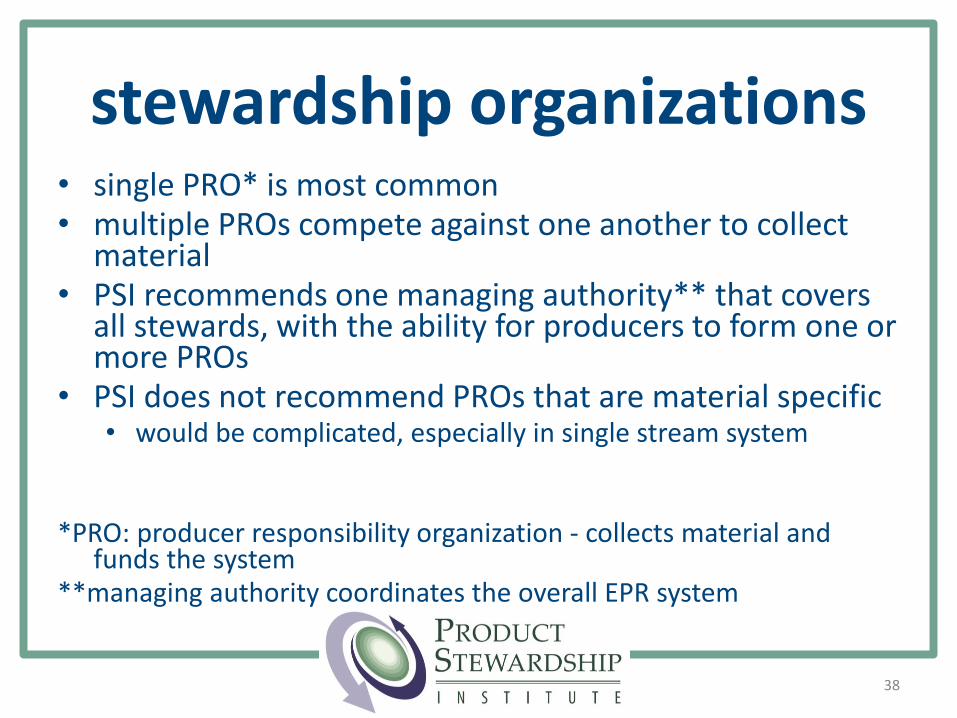
stewardship organizations• single PRO* is most common• multiple PROs compete against one another to collect
material• PSI recommends one managing authority** that covers
all stewards, with the ability for producers to form one or more PROs
• PSI does not recommend PROs that are material specific• would be complicated, especially in single stream system
*PRO: producer responsibility organization - collects material and funds the system
**managing authority coordinates the overall EPR system
38
manufacturers
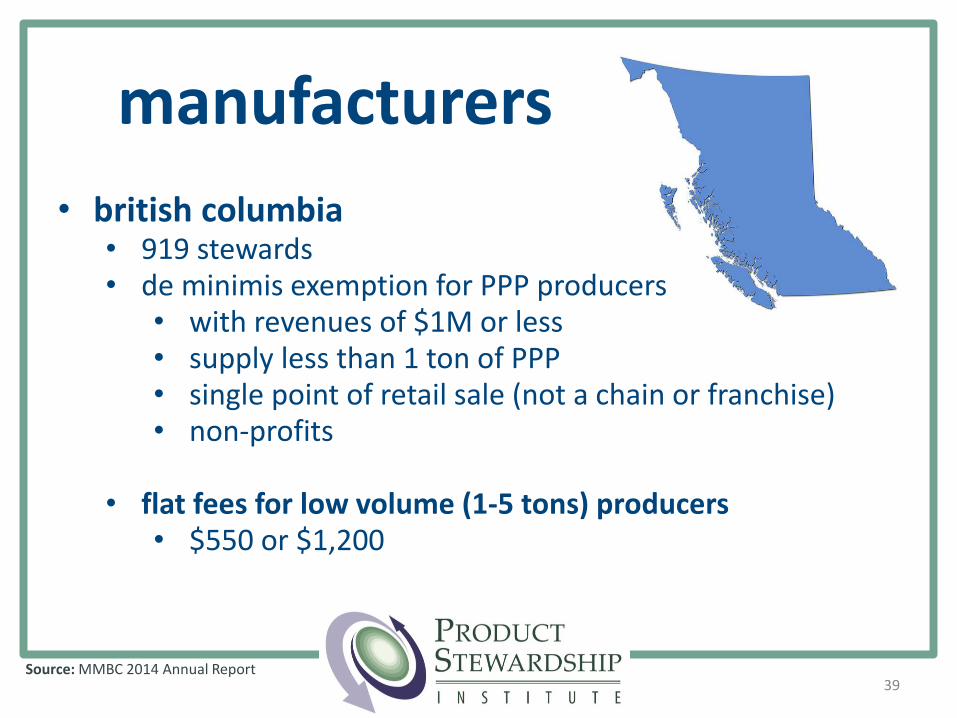
• british columbia• 919 stewards• de minimis exemption for PPP producers
• with revenues of $1M or less• supply less than 1 ton of PPP• single point of retail sale (not a chain or franchise)• non-profits
• flat fees for low volume (1-5 tons) producers• $550 or $1,200
39Source: MMBC 2014 Annual Report
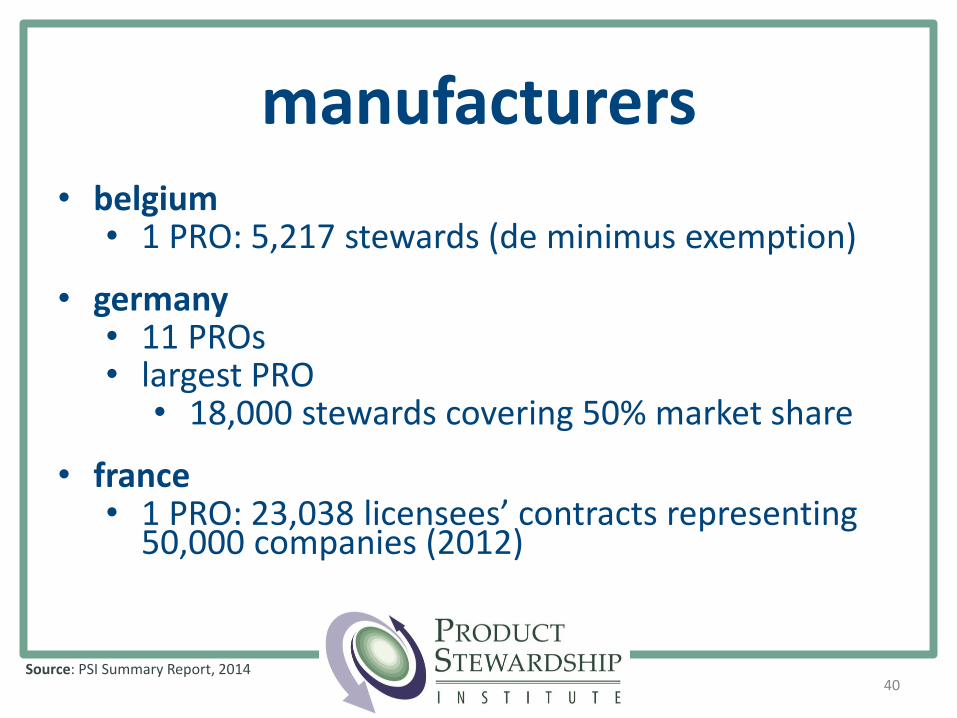
manufacturers• belgium
• 1 PRO: 5,217 stewards (de minimus exemption)
• germany• 11 PROs• largest PRO
• 18,000 stewards covering 50% market share
• france• 1 PRO: 23,038 licensees’ contracts representing
50,000 companies (2012)
40Source: PSI Summary Report, 2014
full vs. shared EPR
control and cost(control = ownership of material + decision making power)
full = producers have control and pay allex. paint & mattresses
shared = producers pay some, taxpayers pay somecontrol is divided
41
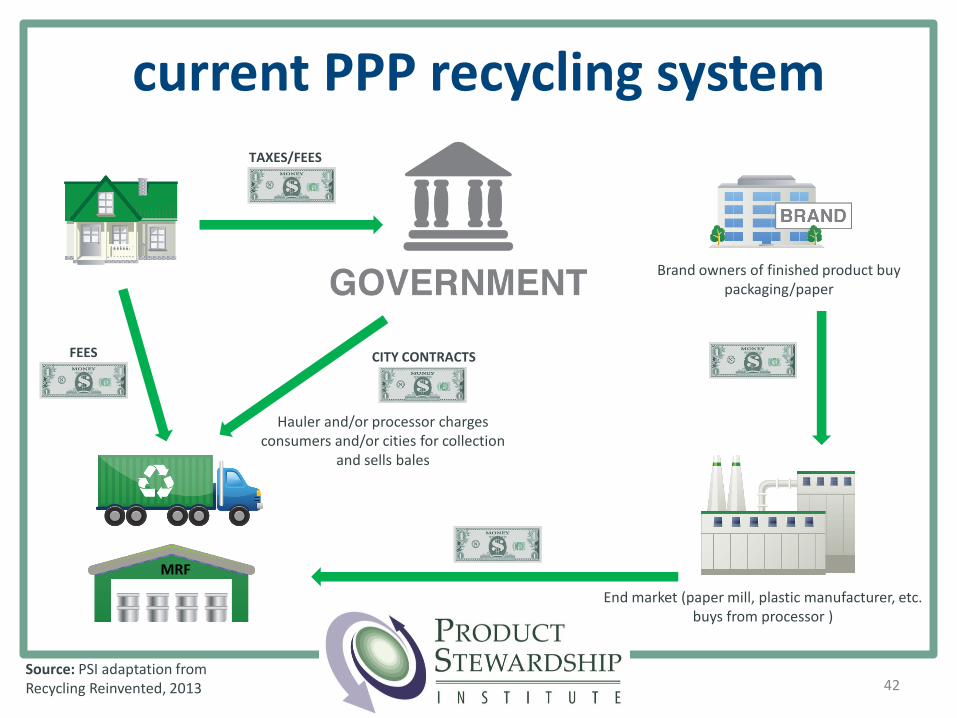
TAXES/FEES
CITY CONTRACTS
Hauler and/or processor charges consumers and/or cities for collection
and sells bales
Brand owners of finished product buy packaging/paper
End market (paper mill, plastic manufacturer, etc. buys from processor )
42
current PPP recycling system
Source: PSI adaptation from Recycling Reinvented, 2013
MRF
FEES
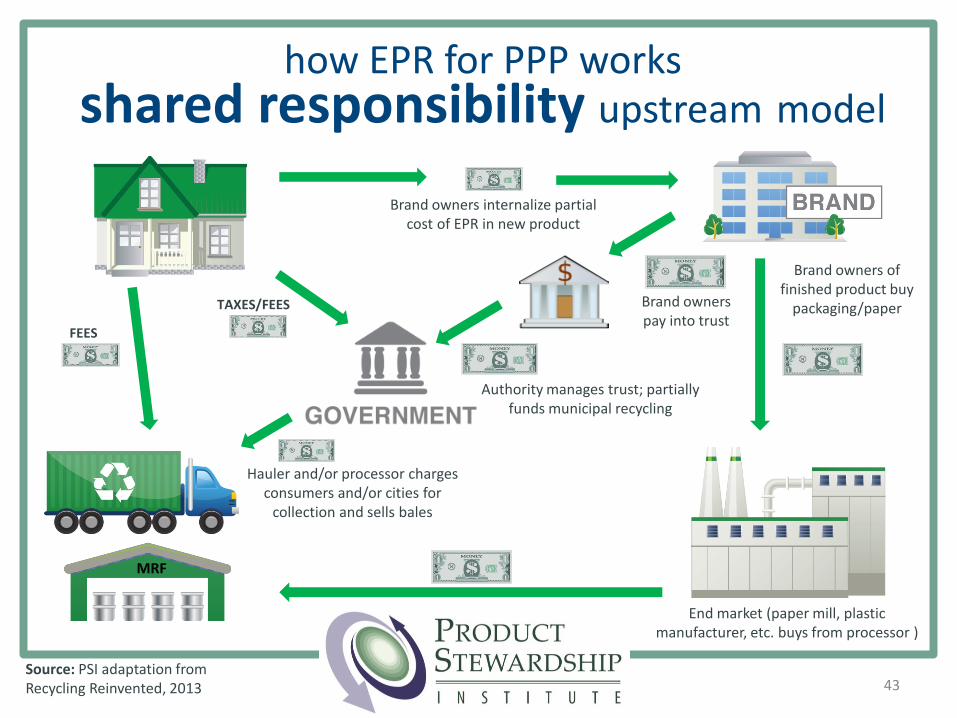
Hauler and/or processor charges consumers and/or cities for
collection and sells bales
Brand owners of finished product buy
packaging/paper
End market (paper mill, plastic manufacturer, etc. buys from processor )
Brand owners pay into trust
Brand owners internalize partial cost of EPR in new product
how EPR for PPP worksshared responsibility upstream model
43Source: PSI adaptation from Recycling Reinvented, 2013
MRF
TAXES/FEES
FEES
Authority manages trust; partially funds municipal recycling
A
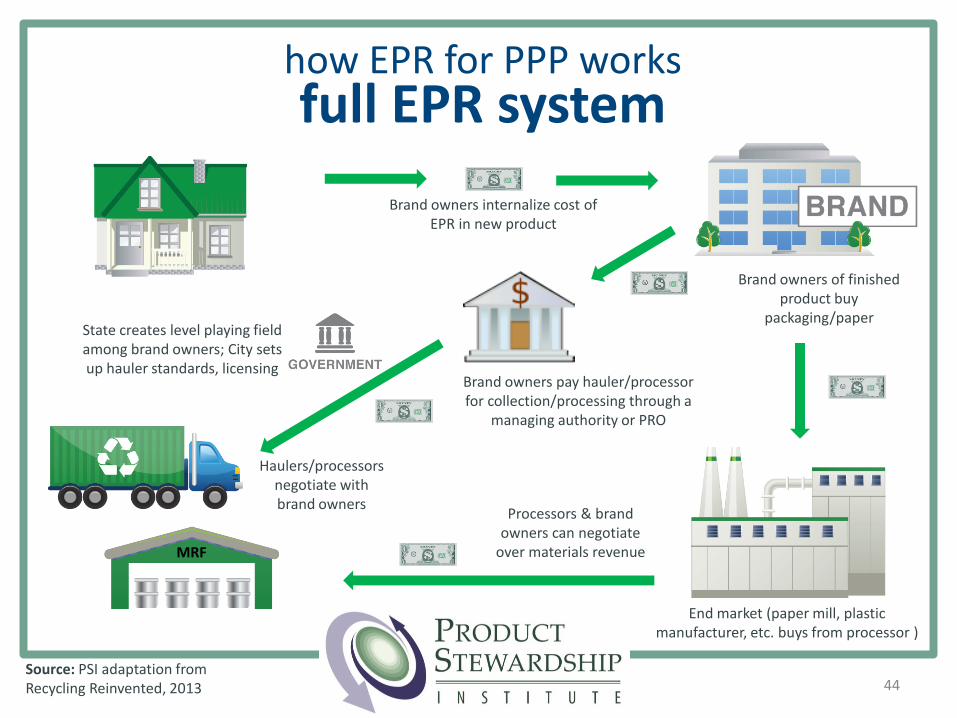
Haulers/processors negotiate with brand owners
Brand owners of finished product buy
packaging/paper
End market (paper mill, plastic manufacturer, etc. buys from processor )
Processors & brand owners can negotiate
over materials revenue
Brand owners pay hauler/processor for collection/processing through a
managing authority or PRO
Brand owners internalize cost of EPR in new product
State creates level playing field among brand owners; City sets up hauler standards, licensing
how EPR for PPP worksfull EPR system
44Source: PSI adaptation from Recycling Reinvented, 2013
MRF
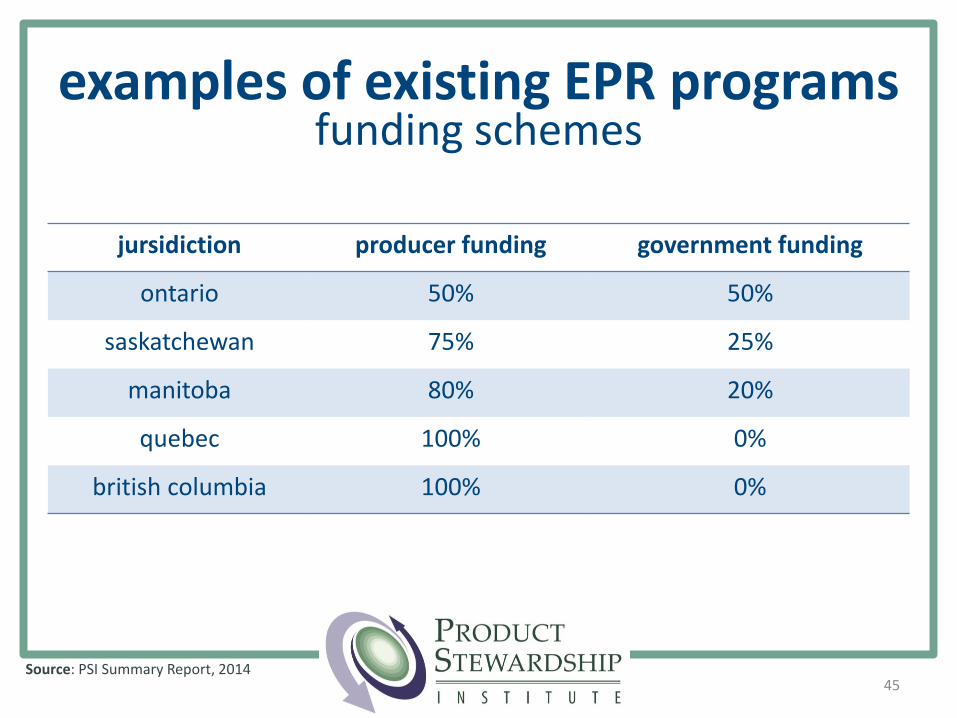
examples of existing EPR programsfunding schemes
jursidiction producer funding government funding
ontario 50% 50%
saskatchewan 75% 25%
manitoba 80% 20%
quebec 100% 0%
british columbia 100% 0%
45Source: PSI Summary Report, 2014
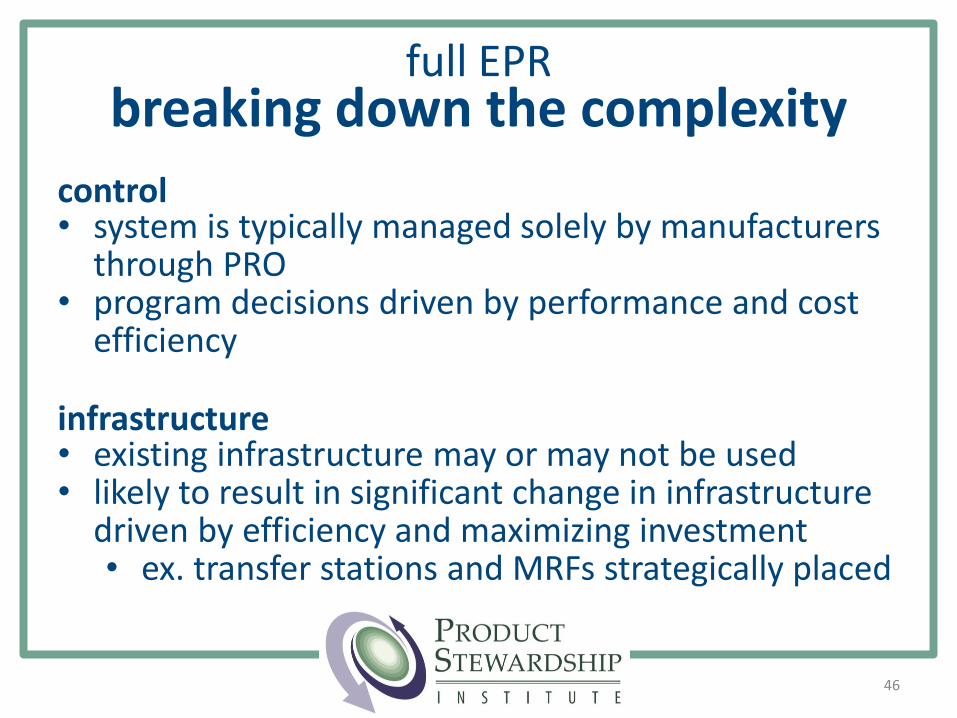
46
control• system is typically managed solely by manufacturers
through PRO• program decisions driven by performance and cost
efficiency
infrastructure• existing infrastructure may or may not be used• likely to result in significant change in infrastructure
driven by efficiency and maximizing investment• ex. transfer stations and MRFs strategically placed
full EPRbreaking down the complexity
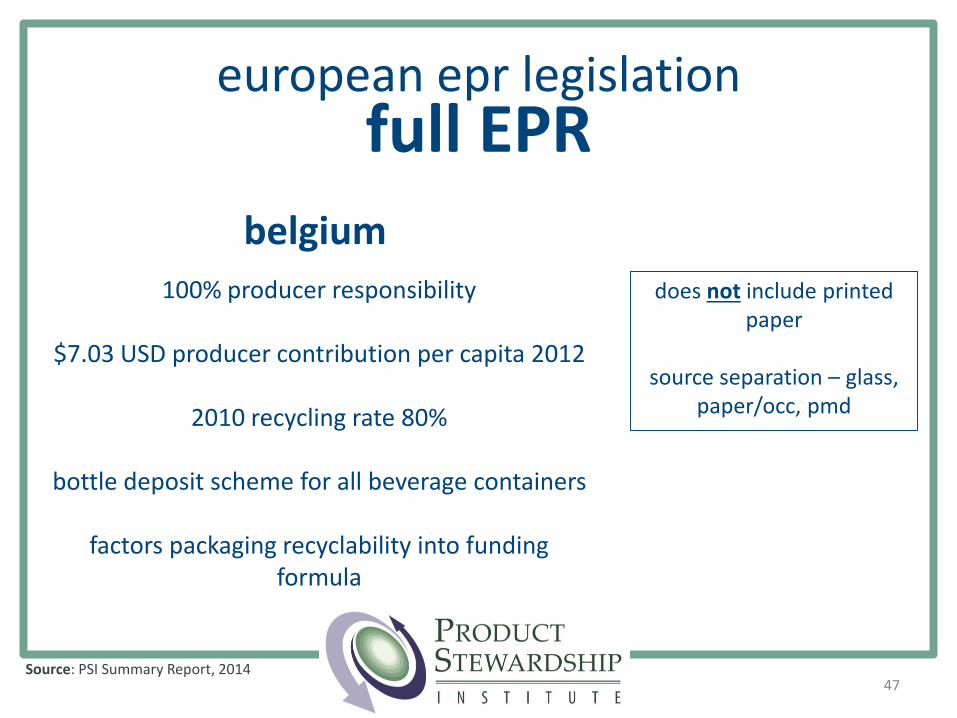
european epr legislation full EPR
100% producer responsibility
$7.03 USD producer contribution per capita 2012
2010 recycling rate 80%
bottle deposit scheme for all beverage containers
factors packaging recyclability into funding formula
47
belgium
does not include printed paper
source separation – glass, paper/occ, pmd
Source: PSI Summary Report, 2014
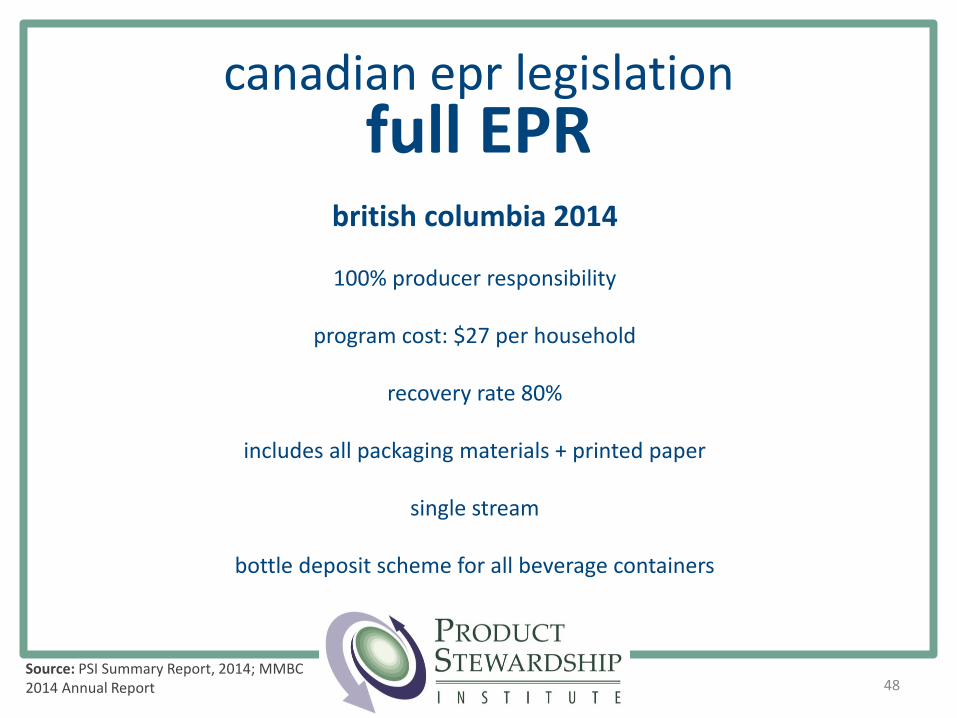
canadian epr legislationfull EPR
british columbia 2014
100% producer responsibility
program cost: $27 per household
recovery rate 80%
includes all packaging materials + printed paper
single stream
bottle deposit scheme for all beverage containers
48Source: PSI Summary Report, 2014; MMBC 2014 Annual Report
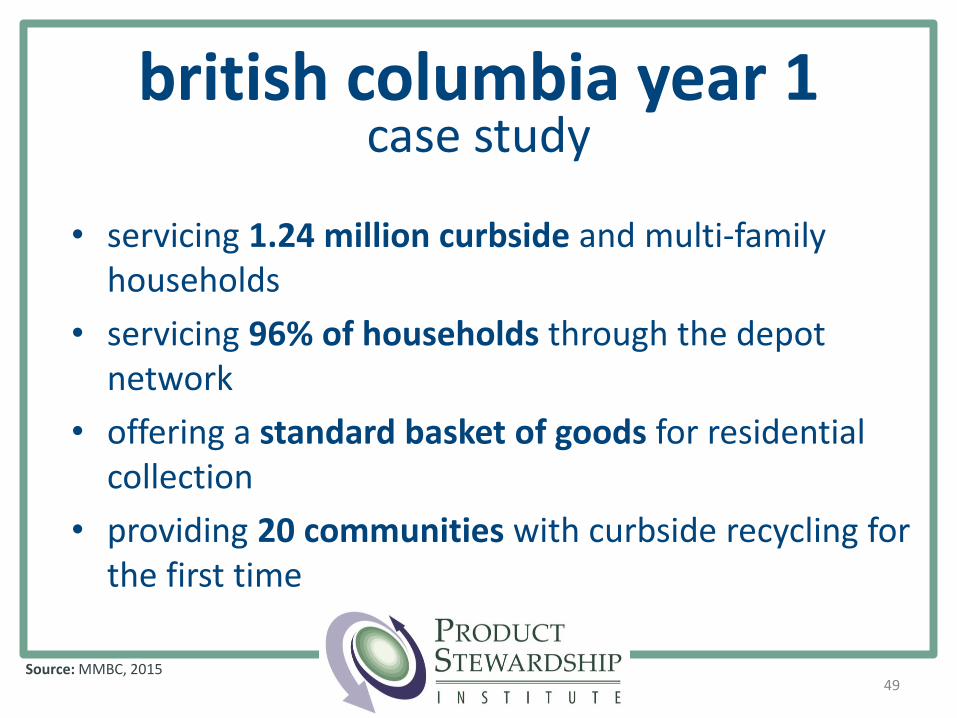
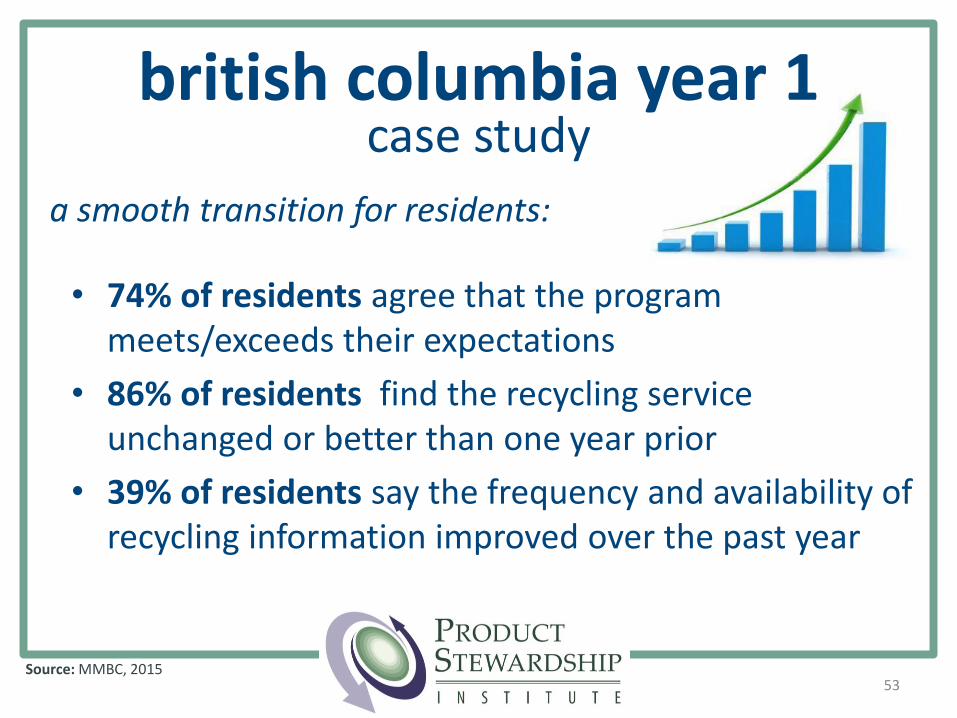
british columbia year 1case study
Source: MMBC, 201549
• servicing 1.24 million curbside and multi-family households
• servicing 96% of households through the depot network
• offering a standard basket of goods for residential collection
• providing 20 communities with curbside recycling for the first time
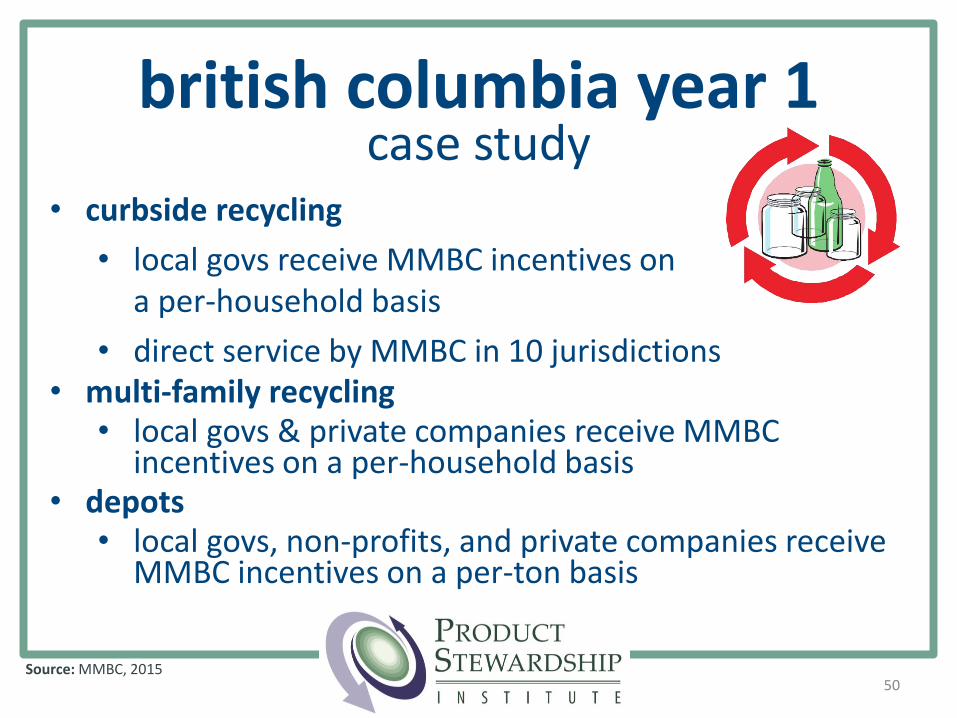
british columbia year 1case study
Source: MMBC, 201550
• curbside recycling
• local govs receive MMBC incentives on a per-household basis
• direct service by MMBC in 10 jurisdictions• multi-family recycling
• local govs & private companies receive MMBC incentives on a per-household basis
• depots• local govs, non-profits, and private companies receive
MMBC incentives on a per-ton basis
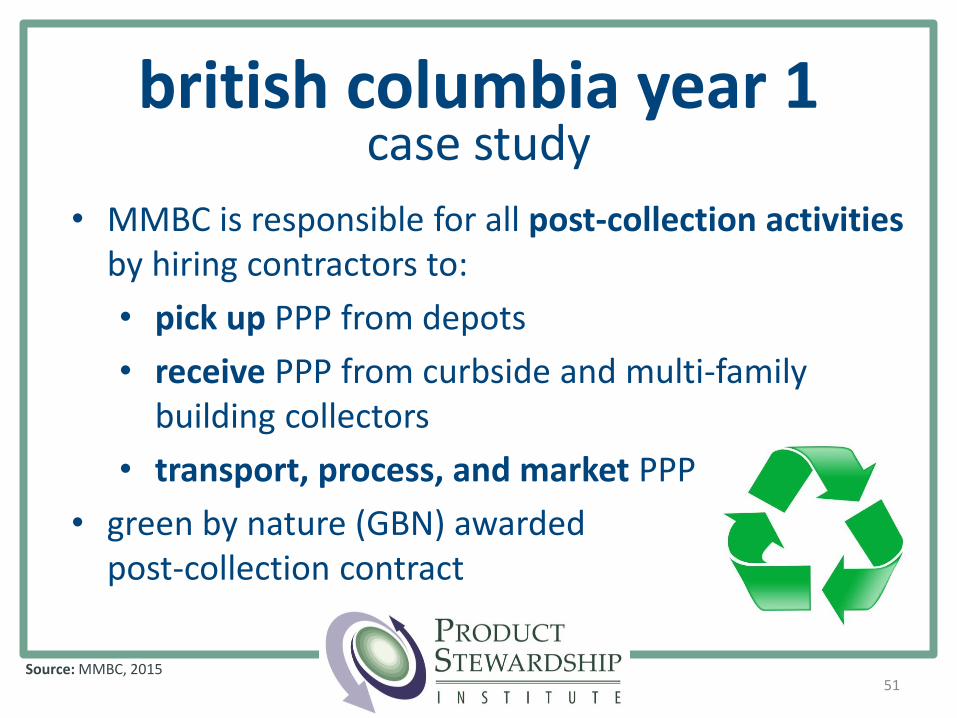
• MMBC is responsible for all post-collection activities by hiring contractors to:
• pick up PPP from depots
• receive PPP from curbside and multi-family building collectors
• transport, process, and market PPP
• green by nature (GBN) awarded post-collection contract
british columbia year 1case study
Source: MMBC, 201551
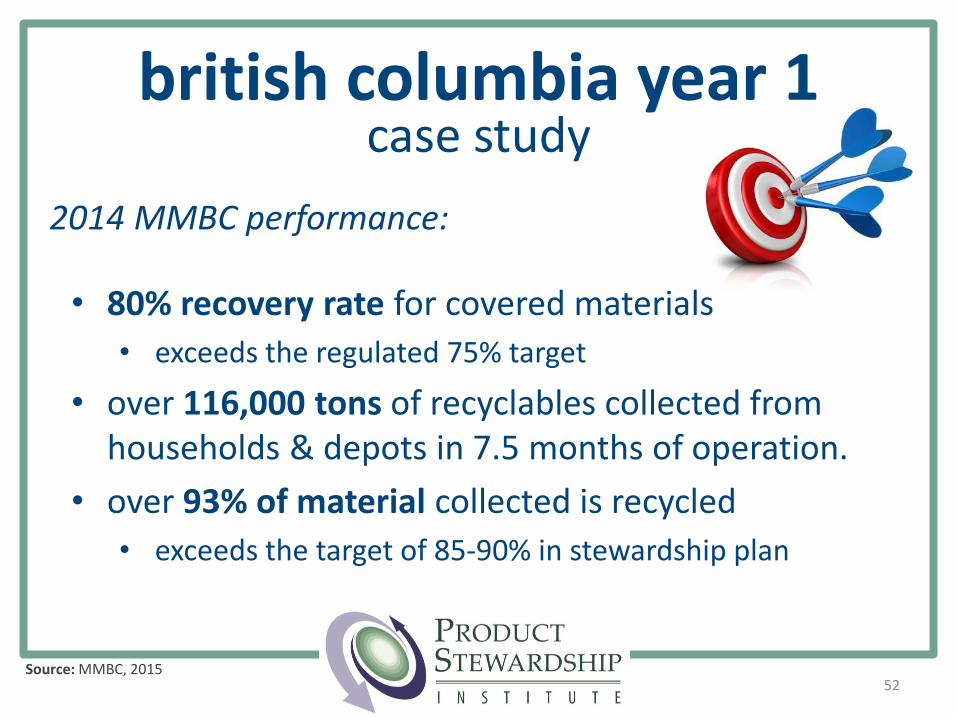
british columbia year 1case study
Source: MMBC, 201552
2014 MMBC performance:
• 80% recovery rate for covered materials
• exceeds the regulated 75% target
• over 116,000 tons of recyclables collected from households & depots in 7.5 months of operation.
• over 93% of material collected is recycled
• exceeds the target of 85-90% in stewardship plan
british columbia year 1case study
Source: MMBC, 201553
a smooth transition for residents:
• 74% of residents agree that the program meets/exceeds their expectations
• 86% of residents find the recycling service unchanged or better than one year prior
• 39% of residents say the frequency and availability of recycling information improved over the past year
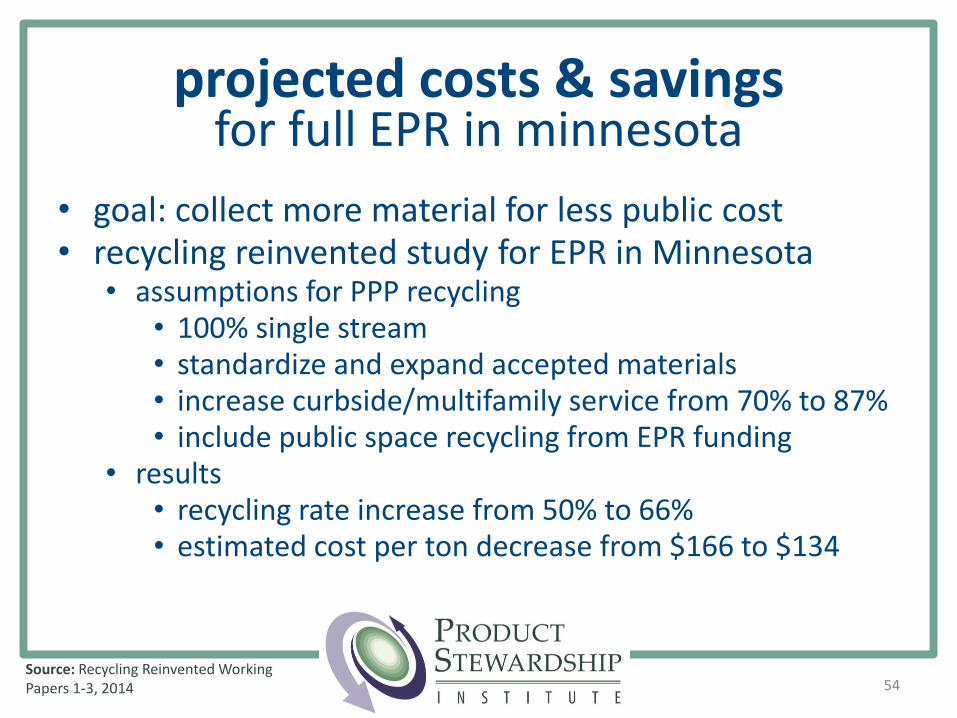
projected costs & savings for full EPR in minnesota
54
• goal: collect more material for less public cost• recycling reinvented study for EPR in Minnesota
• assumptions for PPP recycling• 100% single stream• standardize and expand accepted materials• increase curbside/multifamily service from 70% to 87%• include public space recycling from EPR funding
• results• recycling rate increase from 50% to 66%• estimated cost per ton decrease from $166 to $134
Source: Recycling Reinvented Working Papers 1-3, 2014
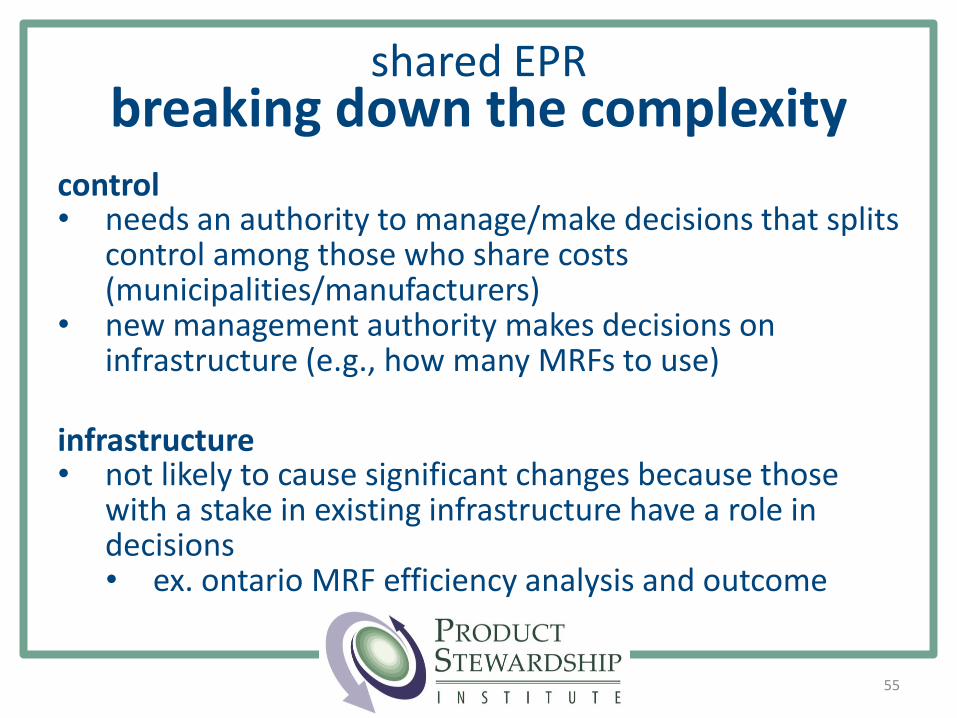
shared EPRbreaking down the complexity
55
control• needs an authority to manage/make decisions that splits
control among those who share costs (municipalities/manufacturers)
• new management authority makes decisions on infrastructure (e.g., how many MRFs to use)
infrastructure• not likely to cause significant changes because those
with a stake in existing infrastructure have a role in decisions• ex. ontario MRF efficiency analysis and outcome
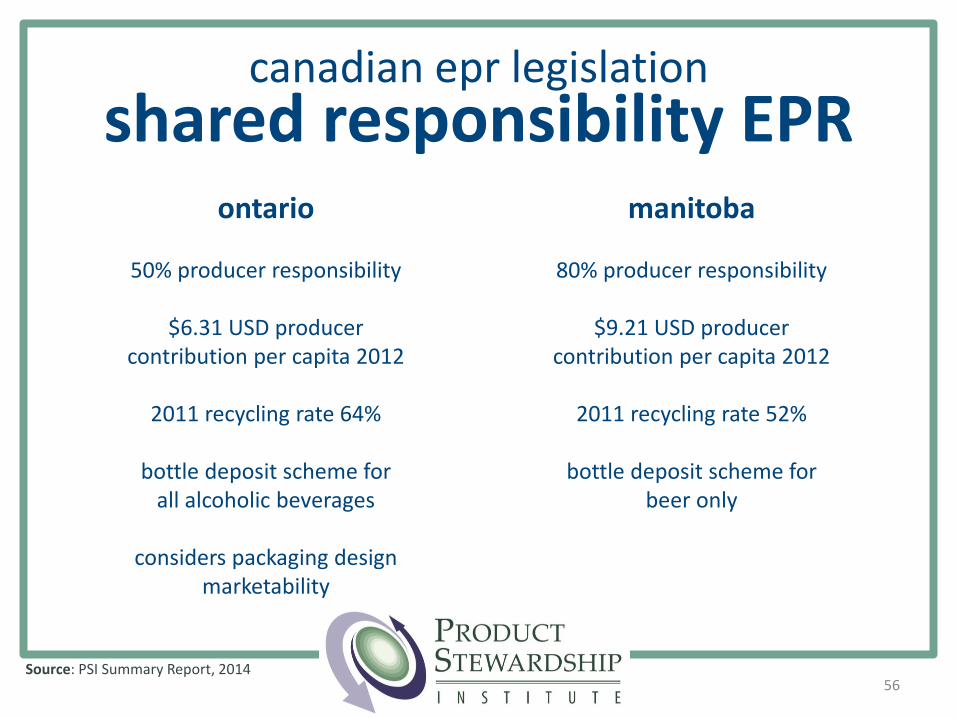
canadian epr legislationshared responsibility EPR
manitoba
80% producer responsibility
$9.21 USD producer contribution per capita 2012
2011 recycling rate 52%
bottle deposit scheme forbeer only
ontario
50% producer responsibility
$6.31 USD producer contribution per capita 2012
2011 recycling rate 64%
bottle deposit scheme forall alcoholic beverages
considers packaging design marketability
56Source: PSI Summary Report, 2014
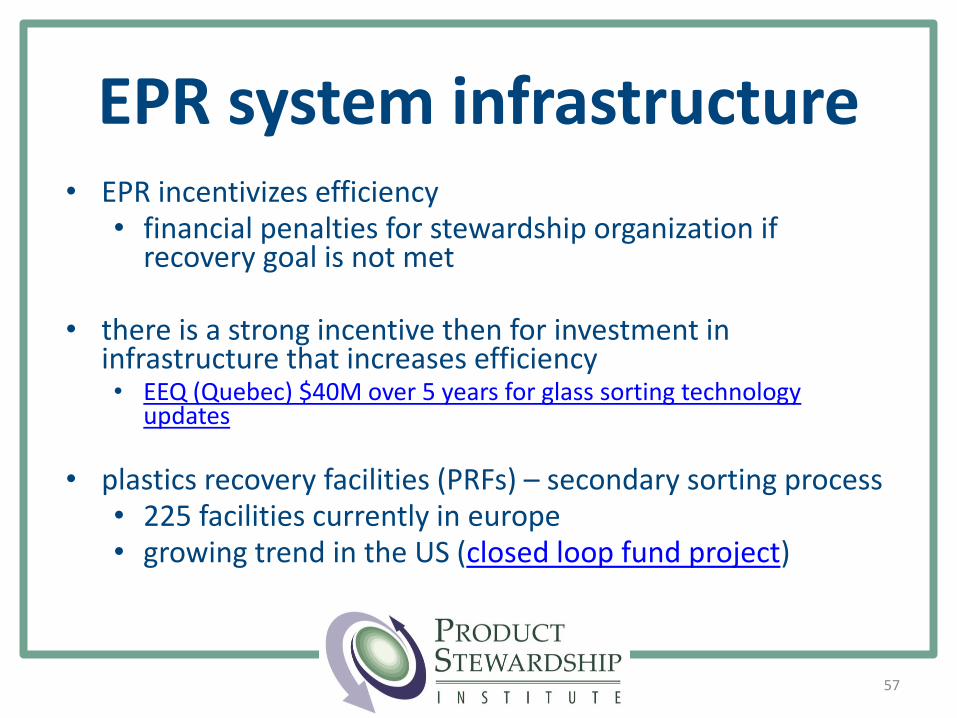
EPR system infrastructure• EPR incentivizes efficiency
• financial penalties for stewardship organization if recovery goal is not met
• there is a strong incentive then for investment in infrastructure that increases efficiency• EEQ (Quebec) $40M over 5 years for glass sorting technology
updates
• plastics recovery facilities (PRFs) – secondary sorting process• 225 facilities currently in europe• growing trend in the US (closed loop fund project)
57
producers
EPR
state government
recycling policies (+ funding)
consumer
PAYT
58
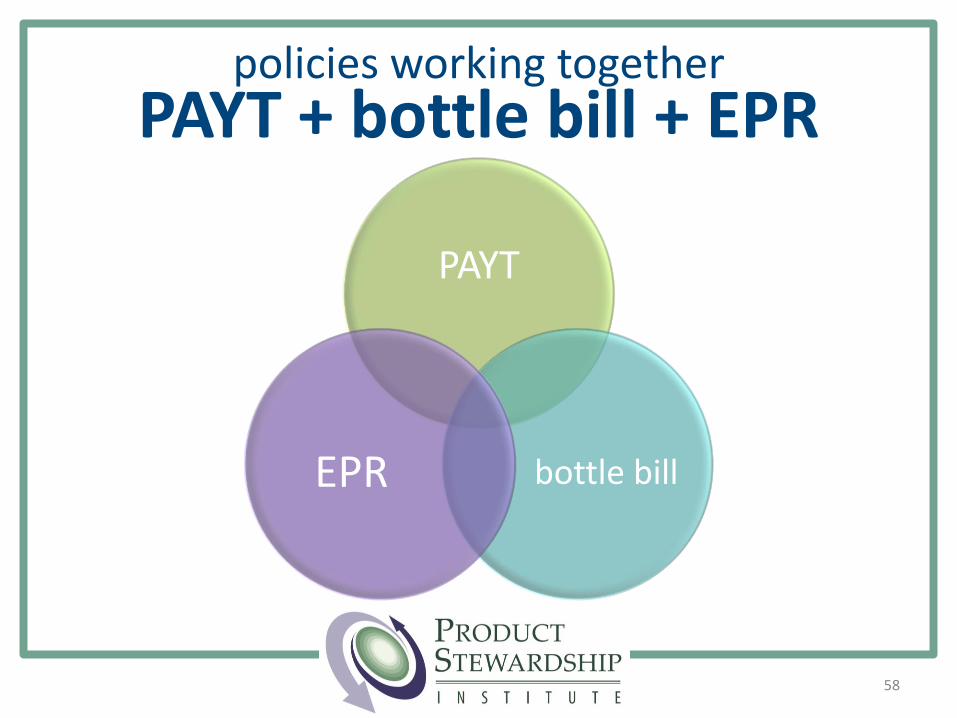
PAYT
bottle billEPR
policies working togetherPAYT + bottle bill + EPR
producers
EPR
consumer
PAYT
59
• container deposit systems implemented prior to EPR law generally remain intact
• multiple structural options on how deposit system works with EPR system• multiple PROs that interact (ex: manitoba)• designated materials within EPR scope could exempt
containers within deposit system• designated materials could include beverage containers to
pay for containers collected outside deposit redemption• areas where deposit systems and EPR work together
• austria, belgium, germany, netherlands, british columbia, quebec
policies working togetherbottle bill + EPR
producers
EPR
state government
recycling policies (+ funding)
60
• european countries with EPR + mandatory PAYT• belgium• france• germany
• PAYT incentivizes behavior to recycle, thereby increasing participating in the EPR program• residents are ultimately the ones who will help
brand owners meet their recovery goals
policies working togetherPAYT + EPR
Source: PSI Summary Report, 2014
scott casselchief executive officer & founder
www.productstewardship.us
61
contact information
references1) PSI Study of 11 Global EPR Programs, 2014
2) Recycling Reinvented Working Papers 1-3, 2014
3) Multi-Material British Columbia (MMBC) Annual Report, 2014
4) GrassRoots Recycling Network, 2015
5) Connecticut Dept. of Revenue Services Escheats Data, 2015
6) Excerpts from Connecticut Deposit System Report, Daniel Macri, 2015
7) Environmental Packaging International (EPI), personal communication with Victor Bell, 2015
8) Multi-Material British Columbia (MMBC), personal communication with Allen Langdon, 2015
9) Recycling Reinvented, 2013; personal communication with Paul Gardner, 2015
10) Container Recycling Institute (CRI) Connecticut Beverage Market Data Analysis (BMDA) , 2010
62
appendix
63
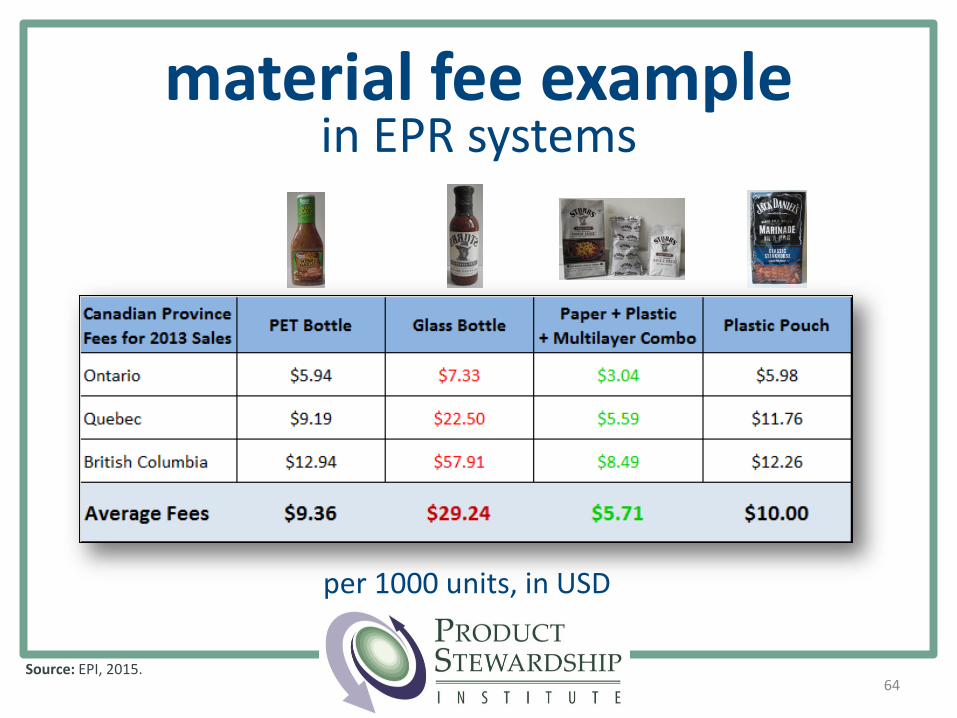
material fee examplein EPR systems
per 1000 units, in USD
64Source: EPI, 2015.