Embed Size (px)
Citation preview
BioMed CentralBMC Public Health
ss
Open AcceResearch articleStrategies to improve global influenza surveillance: A decision tool for policymakersMelinda Moore*1, Edward Chan2, Nicole Lurie1, Agnes Gereben Schaefer3, Danielle M Varda2 and John A Zambrano1Address: 1Health Unit, RAND Corporation, Arlington, Virginia, USA, 2Health Unit, RAND Corporation, Santa Monica, California, USA and 3Health Unit, RAND Corporation, Pittsburgh, Pennsylvania, USA
Email: Melinda Moore* - [email protected]; Edward Chan - [email protected]; Nicole Lurie - [email protected]; Agnes Gereben Schaefer - [email protected]; Danielle M Varda - [email protected]; John A Zambrano - [email protected]
* Corresponding author
AbstractBackground: Global pandemic influenza preparedness relies heavily on public health surveillance, but itis unclear that current surveillance fully meets pandemic preparedness needs.
Methods: We first developed a conceptual framework to help systematically identify strategies toimprove the detection of an early case or cluster of novel human influenza disease during the pre-pandemicperiod. We then developed a process model (flow diagram) depicting nine major pathways through whicha case in the community could be detected and confirmed, and mapped the improvement strategies ontothis model. Finally, we developed an interactive decision tool by building quantitative measures ofprobability and time into each step of the process model and programming it to calculate the netprobability and time required for case detection through each detection pathway. Input values for eachstep can be varied by users to assess the effects of different improvement strategies, alone or incombination. We illustrate application of the tool using hypothetical input data reflecting baseline and 12-month follow-up scenarios, following concurrent implementation of multiple improvement strategies.
Results: We compared outputs from the tool across detection pathways and across time, at baseline and12-month follow up. The process model and outputs from the tool suggest that traditional efforts to buildepidemiology and laboratory capacity are efficient strategies, as are more focused strategies within these,such as targeted laboratory testing; expedited specimen transport; use of technologies to streamline dataflow; and improved reporting compliance. Other promising strategies stem from community detection –better harnessing of electronic data mining and establishment of community-based monitoring.
Conclusion: Our practical tool allows policymakers to use their own realistic baseline values andprogram projections to assess the relative impact of different interventions to improve the probability andtimeliness of detecting early human cases or clusters caused by a novel influenza virus, a possible harbingerof a new pandemic. Policymakers can use results to target investments to improve their surveillanceinfrastructure. Multi-national planners can also use the tool to help guide directions in surveillance systemimprovements more globally. Finally, our systematic approach can also be tailored to help improvesurveillance for other diseases.
Published: 28 May 2008
BMC Public Health 2008, 8:186 doi:10.1186/1471-2458-8-186
Received: 13 February 2008Accepted: 28 May 2008
This article is available from: http://www.biomedcentral.com/1471-2458/8/186
© 2008 Moore et al; licensee BioMed Central Ltd. This is an Open Access article distributed under the terms of the Creative Commons Attribution License (http://creativecommons.org/licenses/by/2.0), which permits unrestricted use, distribution, and reproduction in any medium, provided the original work is properly cited.
Page 1 of 11(page number not for citation purposes)
BMC Public Health 2008, 8:186 http://www.biomedcentral.com/1471-2458/8/186
BackgroundAs the world confronts the extensive spread of influenzaA/H5N1 virus among animals and the growing number ofcases in humans, it has an unprecedented opportunity toprepare for the next human influenza pandemic. Manyexperts feel that the world is overdue for such a pandemic.Since the pandemics of the past century (1918, 1957,1968), the world has become more globalized in terms oftravel and trade, thus facilitating greater extent and speedof disease spread. At the same time, however, the worldhas also become more experienced in addressing emerg-ing infectious disease threats.
Among the many priority activities related to pandemicpreparedness, most experts would agree on the criticalrole played by public health surveillance, defined as "theongoing systematic collection, analysis, interpretationand dissemination of data regarding a health-relatedevent for use in public health action to reduce morbidityand mortality and to improve health" [1], or more simply:systematic information for public health action. The Insti-tute of Medicine has noted that "The importance of sur-veillance to the detection and control of emergingmicrobial threats cannot be overemphasized" [2].
In the context of pandemic preparedness, surveillance iscritical for the early detection and timely response to con-tain or limit the spread of novel human influenza virusesto which humans have no immunity, such as A/H5N1 orother strains that may yet emerge. Global preparedness isstrengthened when surveillance systems in all countriesare capable of detecting early cases of novel human influ-enza within their borders. Pandemic preparedness guid-ance from the World Health Organization (WHO) [3] andthe U.S. Government's recent National Strategy for Influ-enza Preparedness – Implementation Plan [4] both includeprominent attention to global surveillance and detection.The WHO Global Influenza Surveillance Network is alongstanding surveillance program whose traditionalfocus has been the monitoring of influenza virus strains,principally for purposes of determining the appropriateformulation for each season's influenza vaccine. How-ever, it is unclear how well this system would serve theneed for reliable early detection of novel influenza casesthat might be a harbinger of an emerging pandemic [5-7].Therefore, it makes sense to examine possible ways toimprove global influenza surveillance, specifically pre-pandemic surveillance to detect early human cases or clus-ters caused by a novel influenza virus wherever they mayoccur, before the disease spreads and triggers a pandemic.Moreover, approaches to improve global influenza sur-veillance could also have implications for surveillanceand early detection of other diseases.
This study addresses two questions: What are the key ele-ments of influenza surveillance? How might investmentsin them lead to improvements in reliable and early detec-tion? In this paper, we describe a quantitative decisiontool that we developed to help policymakers assess the rel-ative effects of improving different elements of their influ-enza surveillance system. The tool is based on a processmodel (or flow diagram) that depicts the nine major path-ways through which a novel influenza case could bedetected and confirmed. We identified potential improve-ment strategies, mapped these onto the relevant steps inthe model, built in quantitative input measures of proba-bility and time that users can vary for each step dependingon the strategy chosen, and programmed the model to cal-culate the net probability and time required for eachdetection pathway. This allows policymakers to use thetool to compare the probability and timeliness of detec-tion for each of the detections pathways, assess the impli-cations of specific elements of their surveillance system,and project realistic improvements over time. The intent isto help the user identify targeted investments to improvesurveillance. To help extend the reach of internal efforts toimprove surveillance systems, we also describe opportuni-ties for policymakers to leverage partners to help improvetheir surveillance coverage, quality and timeliness. Usingthese approaches – the decision tool and opportunities toleverage partners – we identify a number of practical waysto help improve global influenza surveillance. While thework described here was conducted for the U.S. Depart-ment of Health and Human Services to help guide its glo-bal influenza surveillance programming, our goal was todevelop a tool that is broadly applicable around theworld.
MethodsTo develop a conceptual framework that could facilitatethe identification and organization of potential improve-ments in global influenza surveillance, we first reviewedguidance published by the World Health Organization(WHO) and the U.S. Centers for Disease Control and Pre-vention to glean criteria for evaluating public health sur-veillance systems and to create a simplified frameworkrepresenting a core set of surveillance requirements. Wethen sought and reviewed published reports from any-where in the world for evidence or suggestions regardingimprovements to influenza surveillance. We searched theMEDLINE database using such search terms as "influ-enza", "surveillance", "early", "warning", and "detection",alone or in combination. Based on review of reports iden-tified through this search, we identified and organizedimprovement strategies into a conceptual frameworkaccording to three core attributes: surveillance coverage,quality and timeliness.
Page 2 of 11(page number not for citation purposes)
BMC Public Health 2008, 8:186 http://www.biomedcentral.com/1471-2458/8/186
Using process mapping, a method derived from work inengineering, we next developed a process model (or flowdiagram) to show nine different "detection paths", andthe steps for each, through which a case in the communitycould be detected and confirmed. We mapped all of theimprovement strategies from the conceptual frameworkonto the process model. We then developed an interactivetool by building in quantitative measures of probabilityand time to each step of the process model and program-ming it to calculate the net probability and total time foreach of the nine detection paths. The tool allows users toinput their own values for various program elements (cor-responding to steps in the model) and see the resultingimpact on the likelihood and timeliness of detection – viaeach different detection path – of a confirmed case ofinfluenza caused by a novel virus strain in the community.Because there is not sufficient evidence on which to baseestimates of the performance of the detection paths asthey currently exist in most countries, we use a set of plau-sible hypothetical estimates, including documented plan-ning assumptions when available, to illustrate the use ofthe tool.
ResultsConceptual framework to organize potential improvement strategiesBased on our review of the literature and guidance docu-ments [3,8-10], we identified three core surveillance sys-tem attributes that served as the basis for identifying andorganizing potential improvement strategies:
• Coverage – includes a broad range of reporting sourcesand the range of information reported
• Quality – requires accurate information based on stand-ards, trained personnel and quality-assured laboratorytesting
• Timeliness – includes rapid detection methods, dataflow, analysis, and dissemination to trigger a timely inves-tigation and response to limit or delay disease spread
From our review of published reports, we also identifiedpotential strategies to improve surveillance in these coreareas. We identified thirteen strategies in all: four toimprove surveillance coverage, three to improve qualityand six to improve timeliness (Table 1):
CoverageStrategies to improve surveillance coverage can includeincreasing the number of traditional reporting sites suchas clinics and hospitals participating in surveillancereporting [11,12], addition of new types of sites or infor-mation reported [11,12], and community-based report-ing, i.e., not from medical facilities [4,13]; increased
reporting compliance can further improve coverage fromall reporting sources.
QualityStrategies to improve surveillance quality include broadefforts to improve epidemiology and laboratory capacityfor investigation and diagnosis [10,11,14], plus targetedlaboratory testing so that potentially scarce laboratoryresources are used efficiently [11,12].
TimelinessStrategies to improve the timeliness of surveillanceinclude better use of data mining [12] such as the GlobalPublic Health Intelligence Network or GPHIN whichscours electronic media reports for clusters of bird die-offsor human deaths [15], expedited transport of specimens[4], streamlined notification and analysis [10-12], imple-mentation of active surveillance when appropriate [12],wide deployment of more accurate rapid diagnostic tests[10,14,16], and deployment of trained Rapid ResponseTeams to investigate suspicious cases or clusters [4]
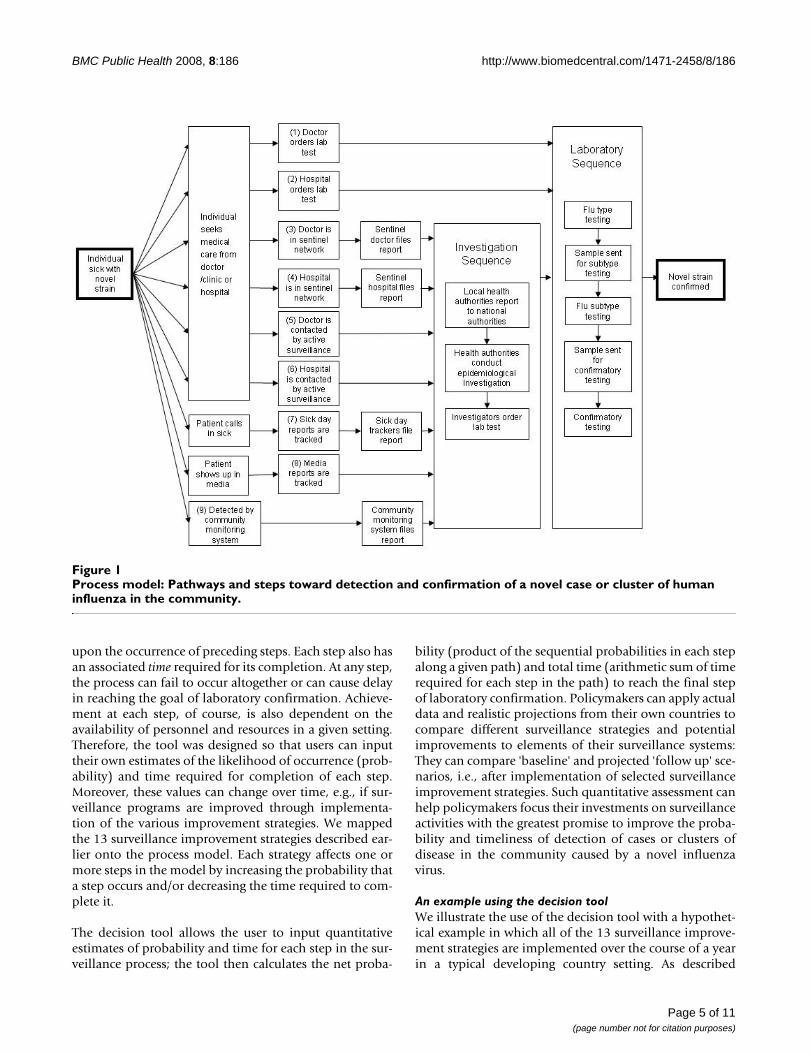
Process model identifying the paths to detection and confirmationThe sequence of steps in the process model is depicted inFigure 1. It begins with a case or cluster of disease in thecommunity caused by a novel influenza virus and endswith detection and laboratory confirmation.
We identified entry points through which a case might bedetected, which in turn lead to further steps that mustoccur so that information is passed along and the case iseventually confirmed. Impediments at any step can meanthat detection or confirmation of the case is less likely ordelayed. The first six paths begin when a sick individualseeks medical care, through either a doctor/clinic or a hos-pital; these generally reflect traditional surveillanceapproaches. The last three paths do not depend on theindividual seeking medical care.
Many of these paths lead to an 'Investigation Sequence,' aseries of activities that might be triggered by reports of sus-picious cases or clusters. For example, the InvestigationSequence may be activated when sub-national healthauthorities receive reports of influenza-like illnesses fromdoctors, hospitals, communities or other sources. They, inturn, may notify national health authorities, one or theother of which may begin an epidemiological investiga-tion, which includes the collection of a sample for testing.
All of the paths eventually lead to a 'Laboratory Sequence',a series of steps for testing that ultimately results in labo-ratory confirmation of a suspicious case. The LaboratorySequence may be triggered either by the InvestigationSequence, or may be triggered directly by a healthcare pro-
Page 3 of 11(page number not for citation purposes)
BMC Public Health 2008, 8:186 http://www.biomedcentral.com/1471-2458/8/186
vider who orders a laboratory test for an ill individual. Inthe Laboratory Sequence, the sample is first tested to iden-tify the presence of an influenza virus and possibly thevirus type. The sample may be sent for further testing at amore sophisticated laboratory or tested further at thesame laboratory.
A quantitative tool for comparing surveillance strategiesBased on this process model, we developed an interactivedecision tool (see Additional file 1). We first built inquantitative measures of probability and time: Each of thesteps along the pathways described above has an associ-ated likelihood, or probability, of occurring, conditional
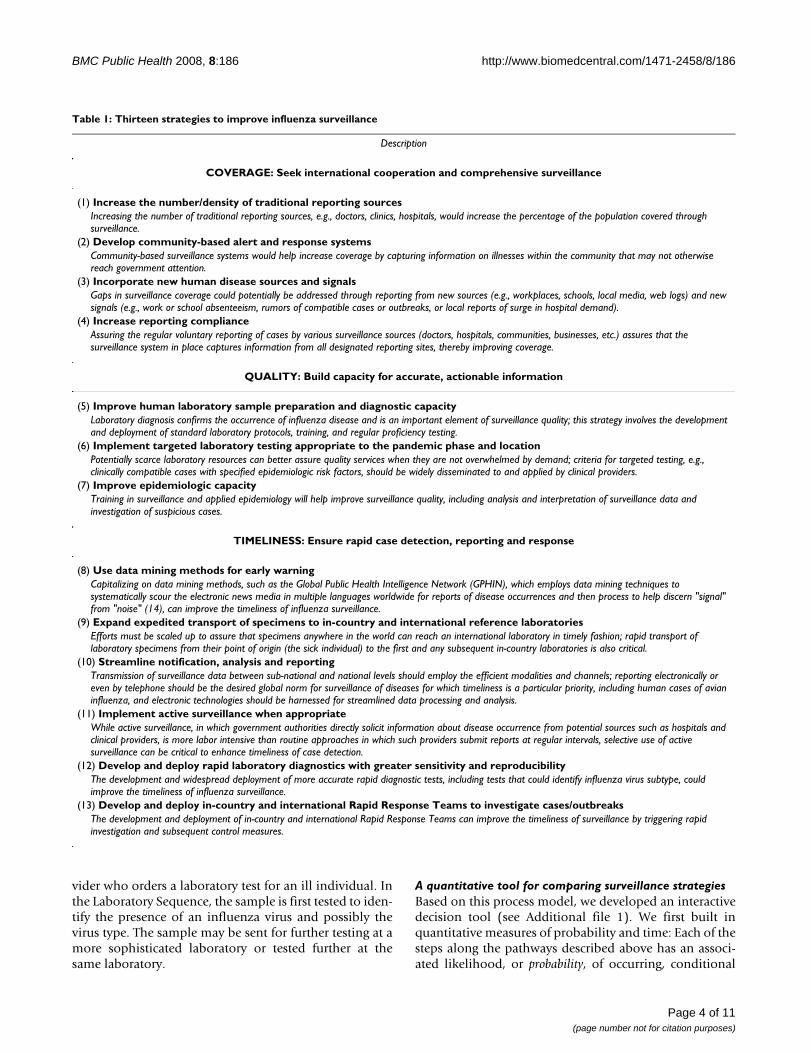
Table 1: Thirteen strategies to improve influenza surveillance
Description
COVERAGE: Seek international cooperation and comprehensive surveillance
(1) Increase the number/density of traditional reporting sourcesIncreasing the number of traditional reporting sources, e.g., doctors, clinics, hospitals, would increase the percentage of the population covered through surveillance.
(2) Develop community-based alert and response systemsCommunity-based surveillance systems would help increase coverage by capturing information on illnesses within the community that may not otherwise reach government attention.
(3) Incorporate new human disease sources and signalsGaps in surveillance coverage could potentially be addressed through reporting from new sources (e.g., workplaces, schools, local media, web logs) and new signals (e.g., work or school absenteeism, rumors of compatible cases or outbreaks, or local reports of surge in hospital demand).
(4) Increase reporting complianceAssuring the regular voluntary reporting of cases by various surveillance sources (doctors, hospitals, communities, businesses, etc.) assures that the surveillance system in place captures information from all designated reporting sites, thereby improving coverage.
QUALITY: Build capacity for accurate, actionable information
(5) Improve human laboratory sample preparation and diagnostic capacityLaboratory diagnosis confirms the occurrence of influenza disease and is an important element of surveillance quality; this strategy involves the development and deployment of standard laboratory protocols, training, and regular proficiency testing.
(6) Implement targeted laboratory testing appropriate to the pandemic phase and locationPotentially scarce laboratory resources can better assure quality services when they are not overwhelmed by demand; criteria for targeted testing, e.g., clinically compatible cases with specified epidemiologic risk factors, should be widely disseminated to and applied by clinical providers.
(7) Improve epidemiologic capacityTraining in surveillance and applied epidemiology will help improve surveillance quality, including analysis and interpretation of surveillance data and investigation of suspicious cases.
TIMELINESS: Ensure rapid case detection, reporting and response
(8) Use data mining methods for early warningCapitalizing on data mining methods, such as the Global Public Health Intelligence Network (GPHIN), which employs data mining techniques to systematically scour the electronic news media in multiple languages worldwide for reports of disease occurrences and then process to help discern "signal" from "noise" (14), can improve the timeliness of influenza surveillance.
(9) Expand expedited transport of specimens to in-country and international reference laboratoriesEfforts must be scaled up to assure that specimens anywhere in the world can reach an international laboratory in timely fashion; rapid transport of laboratory specimens from their point of origin (the sick individual) to the first and any subsequent in-country laboratories is also critical.
(10) Streamline notification, analysis and reportingTransmission of surveillance data between sub-national and national levels should employ the efficient modalities and channels; reporting electronically or even by telephone should be the desired global norm for surveillance of diseases for which timeliness is a particular priority, including human cases of avian influenza, and electronic technologies should be harnessed for streamlined data processing and analysis.
(11) Implement active surveillance when appropriateWhile active surveillance, in which government authorities directly solicit information about disease occurrence from potential sources such as hospitals and clinical providers, is more labor intensive than routine approaches in which such providers submit reports at regular intervals, selective use of active surveillance can be critical to enhance timeliness of case detection.
(12) Develop and deploy rapid laboratory diagnostics with greater sensitivity and reproducibilityThe development and widespread deployment of more accurate rapid diagnostic tests, including tests that could identify influenza virus subtype, could improve the timeliness of influenza surveillance.
(13) Develop and deploy in-country and international Rapid Response Teams to investigate cases/outbreaksThe development and deployment of in-country and international Rapid Response Teams can improve the timeliness of surveillance by triggering rapid investigation and subsequent control measures.
Page 4 of 11(page number not for citation purposes)
BMC Public Health 2008, 8:186 http://www.biomedcentral.com/1471-2458/8/186
upon the occurrence of preceding steps. Each step also hasan associated time required for its completion. At any step,the process can fail to occur altogether or can cause delayin reaching the goal of laboratory confirmation. Achieve-ment at each step, of course, is also dependent on theavailability of personnel and resources in a given setting.Therefore, the tool was designed so that users can inputtheir own estimates of the likelihood of occurrence (prob-ability) and time required for completion of each step.Moreover, these values can change over time, e.g., if sur-veillance programs are improved through implementa-tion of the various improvement strategies. We mappedthe 13 surveillance improvement strategies described ear-lier onto the process model. Each strategy affects one ormore steps in the model by increasing the probability thata step occurs and/or decreasing the time required to com-plete it.
The decision tool allows the user to input quantitativeestimates of probability and time for each step in the sur-veillance process; the tool then calculates the net proba-
bility (product of the sequential probabilities in each stepalong a given path) and total time (arithmetic sum of timerequired for each step in the path) to reach the final stepof laboratory confirmation. Policymakers can apply actualdata and realistic projections from their own countries tocompare different surveillance strategies and potentialimprovements to elements of their surveillance systems:They can compare 'baseline' and projected 'follow up' sce-narios, i.e., after implementation of selected surveillanceimprovement strategies. Such quantitative assessment canhelp policymakers focus their investments on surveillanceactivities with the greatest promise to improve the proba-bility and timeliness of detection of cases or clusters ofdisease in the community caused by a novel influenzavirus.
An example using the decision toolWe illustrate the use of the decision tool with a hypothet-ical example in which all of the 13 surveillance improve-ment strategies are implemented over the course of a yearin a typical developing country setting. As described
Process model: Pathways and steps toward detection and confirmation of a novel case or cluster of human influenza in the communityFigure 1Process model: Pathways and steps toward detection and confirmation of a novel case or cluster of human influenza in the community.
Page 5 of 11(page number not for citation purposes)
BMC Public Health 2008, 8:186 http://www.biomedcentral.com/1471-2458/8/186
above, this is a common interval for assessing publichealth program progress. Because there are very scant dataon specific country influenza surveillance systems and wecould not identify quantitative global planning assump-tions, e.g., from WHO, we inputted estimated values forprobability and time which are based on relevant docu-mentation, when available (e.g., planning assumptionsfrom the U.S. National Strategy for Pandemic InfluenzaImplementation Plan, data from U.S. sentinel surveillancesystems, U.S. data on numbers of physicians and hospi-tals, current times required for laboratory testing), and onthe views of the study team regarding plausible estimatesfor a developing country setting. The first set of input val-ues represents hypothetical 'baseline' conditions; the sec-ond reflects projected 'follow-up' values that might beobtained if all 13 improvement strategies are imple-mented over 12 months with projected quantitative tar-gets for each step in the process model. The tool can be
used both to strategically plan for implementation and todocument achievements.
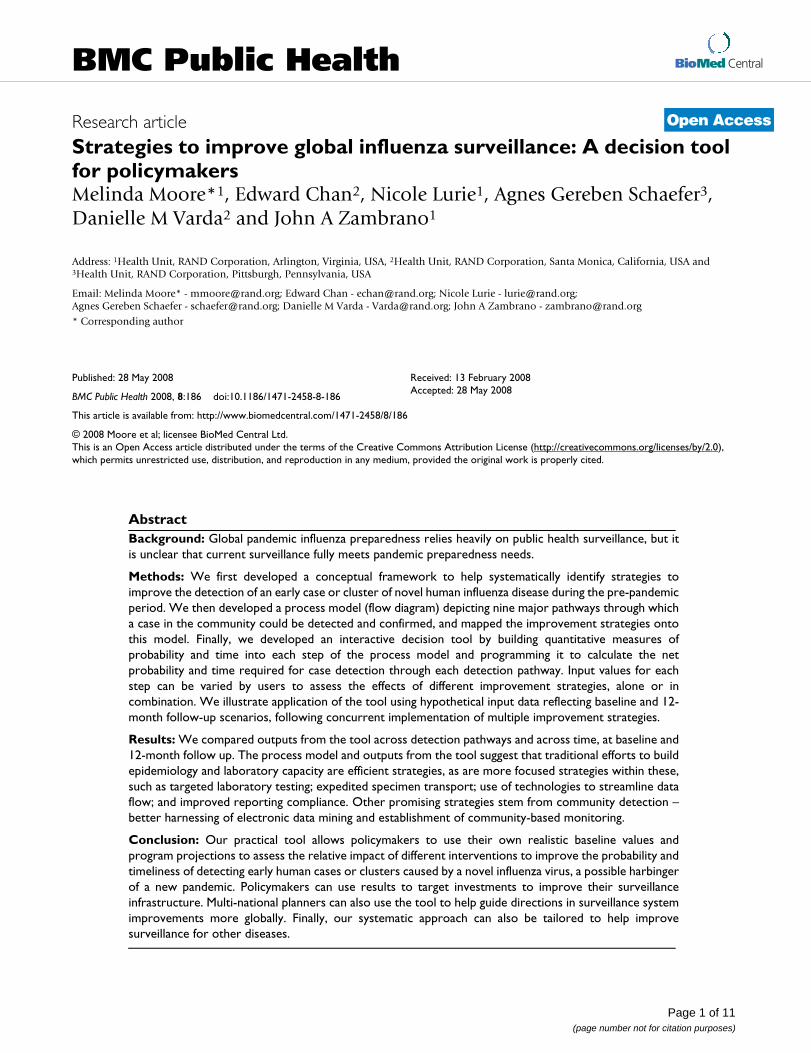
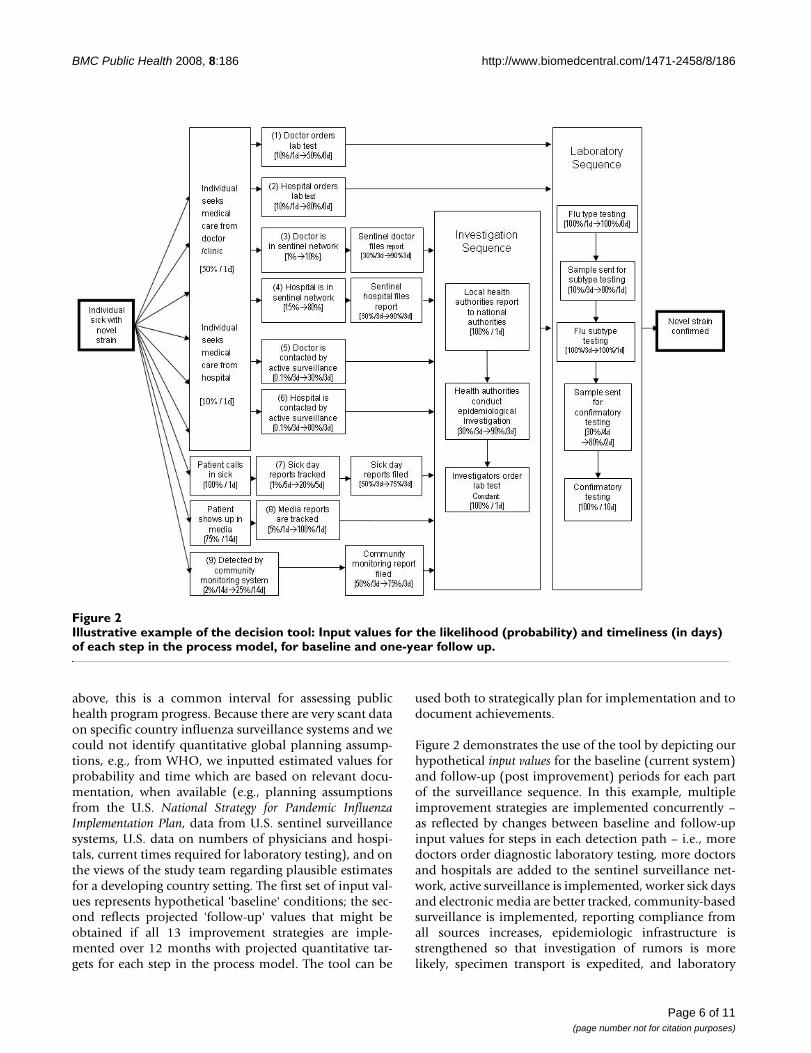
Figure 2 demonstrates the use of the tool by depicting ourhypothetical input values for the baseline (current system)and follow-up (post improvement) periods for each partof the surveillance sequence. In this example, multipleimprovement strategies are implemented concurrently –as reflected by changes between baseline and follow-upinput values for steps in each detection path – i.e., moredoctors order diagnostic laboratory testing, more doctorsand hospitals are added to the sentinel surveillance net-work, active surveillance is implemented, worker sick daysand electronic media are better tracked, community-basedsurveillance is implemented, reporting compliance fromall sources increases, epidemiologic infrastructure isstrengthened so that investigation of rumors is morelikely, specimen transport is expedited, and laboratory
Illustrative example of the decision tool: Input values for the likelihood (probability) and timeliness (in days) of each step in the process model, for baseline and one-year follow upFigure 2Illustrative example of the decision tool: Input values for the likelihood (probability) and timeliness (in days) of each step in the process model, for baseline and one-year follow up.
Page 6 of 11(page number not for citation purposes)
BMC Public Health 2008, 8:186 http://www.biomedcentral.com/1471-2458/8/186
infrastructure is strengthened so that testing is more likelyand quicker. The tool then calculates the net probabilitiesand total time for the nine detection paths, i.e., to reachthe final laboratory confirmation step through each path-way.
For purposes of demonstrating the model, we made thefollowing assumptions about baseline and follow-upinput values for selected steps in the model:
• We held constant at 50% the probability that the sickindividual will seek medical care from a doctor (4), and at10% the probability of seeking care from a hospital.
• We also held constant the delay in seeking care from adoctor or hospital, since we do not propose a strategy toincrease patient demand for services (we used a low esti-mate of a 1-day delay in seeking medical care, but this canbe held constant at a higher level, which would result inthat additional number of days through each of the rele-vant detection paths).
• Since we wished to examine the strategy related tostreamlined timing of notification rather than the level ofreporting compliance from local to national public healthauthorities, we held constant at 100% the probability ofreporting by local authorities to national authorities.
• Since such investigations routinely include laboratorytesting, we held constant at 100% the probability of order-ing of lab tests as part of case or outbreak investigations.
• Finally, since we handled the variability in probabilitiesfor laboratory testing by varying the probability that aspecimen is sent to each laboratory, we also held constantat 100% the probability that samples received by labora-tories are tested.
We also used the same baseline and follow-up values forcompliance in reporting by all local reporting sources, i.e.,the percent of designated reporting sites that submit sur-veillance reports at a pre-defined "regular" interval:
• The probability of compliance is projected to increasefrom 50% at baseline to 75% at follow-up for communityreporting sites and from 30% to 90% for clinical reportingsites
• We assume a constant 3-day delay in reporting from allsites, reflecting the average delay within a weekly report-ing system.
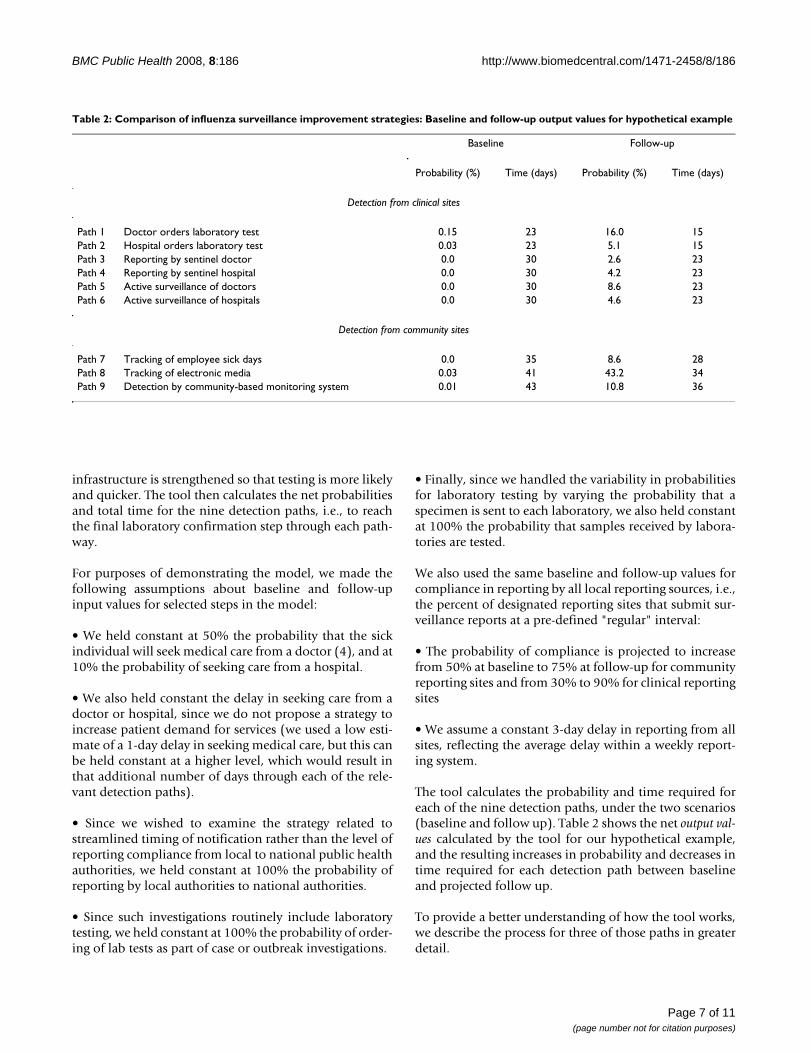
The tool calculates the probability and time required foreach of the nine detection paths, under the two scenarios(baseline and follow up). Table 2 shows the net output val-ues calculated by the tool for our hypothetical example,and the resulting increases in probability and decreases intime required for each detection path between baselineand projected follow up.
To provide a better understanding of how the tool works,we describe the process for three of those paths in greaterdetail.
Table 2: Comparison of influenza surveillance improvement strategies: Baseline and follow-up output values for hypothetical example
Baseline Follow-up
Probability (%) Time (days) Probability (%) Time (days)
Detection from clinical sites
Path 1 Doctor orders laboratory test 0.15 23 16.0 15Path 2 Hospital orders laboratory test 0.03 23 5.1 15Path 3 Reporting by sentinel doctor 0.0 30 2.6 23Path 4 Reporting by sentinel hospital 0.0 30 4.2 23Path 5 Active surveillance of doctors 0.0 30 8.6 23Path 6 Active surveillance of hospitals 0.0 30 4.6 23
Detection from community sites
Path 7 Tracking of employee sick days 0.0 35 8.6 28Path 8 Tracking of electronic media 0.03 41 43.2 34Path 9 Detection by community-based monitoring system 0.01 43 10.8 36
Page 7 of 11(page number not for citation purposes)
BMC Public Health 2008, 8:186 http://www.biomedcentral.com/1471-2458/8/186
Path 1: Doctor orders laboratory testBased on the steps and input values shown in Figure 2, atbaseline this requires an individual to:
• seek medical care (50% probability, 1 day delay),
• then for the doctor to order a diagnostic laboratory test(10% probability and 1 day delay),
• then for the laboratory sequence to unfold – sample istested for influenza type (100% probability, 1 day),
• then it is sent to the next laboratory for subtype testing(10% probability, 3 day delay),
• the subtype testing is undertaken (100% probability, 3day delay),
• then the sample is sent for confirmatory testing (30%probability, 4 day delay), and
• the confirmatory testing is completed (100% probabil-ity, 10 day delay).
The product of the sequential probabilities is: 0.5 × 0.1 ×[laboratory sequence: 1 × 0.1 × 1 × 0.3 × 1] = 0.0015, or0.15%, as reflected in Table 2. The total time for this pathat baseline is the sum of the delays or time required ateach step: 1 + 1 + [laboratory sequence: 1 + 3 + 3 + 4 + 10]= 23, also as reflected in Table 2.
For the follow-up scenario, we assume:
• Interventions to sensitize doctors to order diagnosticlaboratory tests result in an increase by 5-fold in the per-centage ordering such tests (input values increase from10% to 50%).
• Interventions to strengthen the epidemiology and labo-ratory infrastructure result in an increase in the probabil-ity that samples are tested and a decrease in the timeneeded to perform the testing.
As a result, the sequential probabilities are: 0.5 × 0.5 ×[laboratory sequence: 1 × 0.8 × 1 × 0.8 × 1] = 0.16, or 16%;and the total time is 1 + 0 [same day] + [laboratorysequence: 0 + 1 + 1 + 2 + 10] = 15. This represents anincrease from 0.15% to 16% in the probability of detect-ing the case, and a reduction in time from 23 to 15 days.
Path 3: Doctor is in sentinel networkHere, the requirements at baseline are for the individualto:
• seek medical care from a doctor (50% probability, 1 daydelay),
• for the doctor to be part of the country's sentinel surveil-lance system (1% probability),
• for the doctor to file the routine surveillance report(30% probability, 3 day delay),
• for the investigation sequence to unfold, including anepidemiologic investigation (30% probability, 3 daydelay), and then for the laboratory sequence to unfold asdescribed above.
The serial probabilities are: 0.5 × 0.01 × 0.3 × [investiga-tion sequence: 1 × 0.3 × 1] × [laboratory sequence: 1 × 0.1× 1 × 0.3 × 1] = 0.00001, or 0.001%; the total timerequired at baseline is: 1 + 3 + [1 + 3 + 1] + [1 + 3 + 3 + 4+ 10] = 30.
At follow up, after interventions to increase by 10-fold thepercentage of doctors in the sentinel surveillance network(from 1% to 10%), improve reporting compliance 3-fold(from 30% to 90%), and improve the epidemiology andlaboratory infrastructure, the probability of detectionincreases to only 2.6%.
Path 8: Tracking of electronic mediaThis path depends on information about a case or clusterin the community appearing in any electronic media orcommunications that can be tracked using electronic datamining methods such as the GPHIN system describedbelow. Here, the main change between baseline and fol-low up is a hypothesized 20-fold increase, from 5% to100%, that media reports are tracked. The serial probabil-ities of detection at baseline are: 0.75 × 0.05 × [investiga-tion sequence 0.3] × [laboratory sequence: 0.03] = 0.0003,or 0.03%; and at follow up: 0.75 × 1 × [investigationsequence 0.9] × [laboratory sequence 0.64] = 0.43, or43%. The savings in time, from 41 to 34 total days, comesexclusively from the 7 days reduced for the laboratorysequence.
These three examples highlight a number of importantobservations. First, sensitizing doctors to order diagnostictests on suspicious patients is an efficient pathway interms of assuring that the first doctor seen orders a testand also in bypassing the investigation sequence, but thispath still depends on the individual seeking medical care.Second, as shown in the Path 3 example above, traditionalsentinel surveillance has a number of important "filters"that together can impede the probability of case detectionand confirmation. Third, a community-based strategysuch as electronic data mining is not subject to the "filter"of the sick individual seeking care from and being
Page 8 of 11(page number not for citation purposes)
BMC Public Health 2008, 8:186 http://www.biomedcentral.com/1471-2458/8/186
reported by a doctor or hospital. Indeed, any pathway thatrelies on a sick individual to report to a doctor or hospitalfor medical care and subsequent reporting is subject to asubstantial early "filter" – U.S. national planning assump-tions are based on only 50% of such individuals seekingmedical care, and this figure is likely much lower in devel-oping countries. Thus, this step alone greatly reduces theprobability of detection. Seeking to increase this healthseeking behavior may overwhelm clinical facilities andmay or may not result in significant improvements in like-lihood of detection. Finally, as shown in Figure 2 andTable 2, reporting compliance for any system is also apotentially significant "filter", but potentially one that canbe addressed through targeted program efforts. In thisexample, we projected a three-fold increase in compliancefrom sentinel providers (from 30% to 90%), and a 1.5-fold increase (from 50% to 75%) from communitysources. The net probabilities of detection thus increase bythis magnitude based on this factor alone.
Examination of the logic model and outputs for all pathsin our illustrative example of the tool thus suggests anumber of potentially valuable strategies to improveinfluenza surveillance:
• Laboratory – Because all nine detection paths include theLaboratory Sequence, slow execution of this sequence orfailure of a sample to be accurately tested jeopardizes theeffectiveness of all the preceding paths. Therefore, imple-mentation of the three strategies related to improving lab-oratory diagnosis (improving laboratory diagnosisthrough training, equipping and proficiency testing; expe-diting specimen transport; and widely deploying rapiddiagnostic tests) will simultaneously improve the proba-bility and timeliness of case detection for all nine paths.
• Epidemiology – The Investigation Sequence also stemsfrom a number of detection paths (3 through 9); there-fore, the strategy to improve reporting compliance and thetwo strategies specifically related to the InvestigationSequence (improving epidemiologic capacity throughtraining in applied epidemiology; streamlining notifica-tion, analysis and reporting through use of electronic andother appropriate technologies) are all critical to increasethe probability and timeliness of case detection arisingfrom multiple detection paths.
• Tracking electronic media – Surveillance methods that donot require the sick individual to seek medical care avoidthis important "failure point" associated with the first sixpaths in our model, which reflect traditional surveillancesystems. The use of data mining methods to track the vastamount of electronic media with potentially valuableinformation about the occurrence of suspicious disease ina community greatly improves surveillance coverage and
timeliness. It is easy, quick, and inexpensive to implementbecause at least one such system currently exists (GPHIN)and can be enhanced with add-ons, e.g., to expand therange of foreign languages tracked [15].
• Targeted laboratory testing – The first six paths in ourmodel stem from a sick individual seeking medical carefrom a doctor/clinic or hospital. Targeted laboratory test-ing by the initial health care provider involves widely dis-seminating guidelines to sensitize clinical providers toorder influenza diagnostic laboratory tests for appropriateclinical cases [11,12]. This strategy is easier to implementwidely and, in our hypothetical example, produces betterprobability and timeliness of case detection compared toalternative strategies related to clinical visits, i.e., sentinelreporting or active surveillance. Also, since there are fewerhospitals than physicians and sicker patients are morelikely to go to a hospital, perhaps the first priority shouldbe to sensitize the clinicians at all hospitals to appropriateguidelines for ordering laboratory testing for suspectedcases of novel influenza.
• Community-based monitoring – Perhaps the most difficultpathway, at least in terms of public health implementa-tion, is case detection through community-based moni-toring systems. Establishing such systems is laborintensive and will require extensive mobilization and edu-cation of communities throughout a country and will alsotake more time (probably measured in years) than someof the other interventions [13]. Once established through-out a country, however, community-based monitoringsystems can provide more comprehensive surveillancecoverage for influenza, as well as for other diseases andconditions. Moreover, WHO has described the limitationsof surveillance in resource-poor settings and commentedthat "Mobilizing communities to report unusual healthevents ... is the simplest form of cluster surveillance" [17].
Seeking partnerships to improve surveillance systemsGovernment health authorities can implement the 13potential surveillance improvement strategies on theirown, drawing upon their resources as well as guidancefrom WHO. However, working with strategic partners out-side their own system provides important opportunitiesto leverage partnerships to further improve the coverage,quality and timeliness of their influenza surveillance sys-tem and thereby further increase the probability and time-liness of case detection. Specific opportunities for suchstrategic partnerships are described below.
Strategies to improve surveillance coverage are inherentlyoriented toward the local level. Therefore, organizationswhose activities are primarily at the grassroots or locallevel might be particularly well suited as strategic partnersfor national planners to help improve surveillance cover-
Page 9 of 11(page number not for citation purposes)
BMC Public Health 2008, 8:186 http://www.biomedcentral.com/1471-2458/8/186
age. Failure to leverage such partners can mean greatereffort and resources required on the part of national plan-ners, lower levels of coverage at a given time, or delays inachieving broader coverage. Examples of potential part-ners include development agencies, nongovernmentalorganizations (NGOs), and even local businesses.
Strategies to improve surveillance quality include build-ing laboratory and epidemiology capacity and targetedlaboratory testing. Technical agencies with laboratoryand/or epidemiology capacity are of potential strategicvalue to help improve international surveillance quality.Examples include academic institutions, Ministries ofHealth from other countries, development agencies, tech-nically-oriented NGOs, international laboratory net-works, and the Training in Epidemiology and PublicHealth Network. For example, the U.S. Department ofHealth and Human Services now has a formal agreementwith the Institut Pasteur to partner on improving labora-tory capacity in selected countries, beginning in SoutheastAsia [18].
Strategies to improve the timeliness of surveillanceinclude expedited transport of laboratory specimenswithin countries and from countries to reference laborato-ries, streamlined notification and analysis, and wide-spread deployment of rapid diagnostic tests.Technologically oriented businesses, academic institu-tions, and technical government agencies might be wellsuited strategic partners in this core surveillance area.
DiscussionWHO has noted that "One of the most important func-tions of surveillance is to ensure the detection of unusualclusters of cases and of the occurrence of human-to-human transmission at the earliest possible stage, whenpublic health interventions have the greatest chance toprevent or delay further national and internationalspread" [17]. Our study focused on ways to better assureearly detection of such cases. We systematically identifiedpossible strategies to improve coverage, quality and time-liness of global influenza case detection. We developed aprocess model onto which we mapped the strategies, builtin quantitative measures of probability and time and pro-grammed the model to allow users to vary input values forthese measures and to calculate serial probabilities andtotal time for each detection path. This is the decision toolthat permits comparison of different paths for case detec-tion and different strategies to improve specific surveil-lance system processes. Examination of the process modeland outputs from the tool revealed some strategies thatare consistent with traditional public health practice andothers that represent more novel approaches. These sug-gest that traditional sentinel surveillance is not designedto reliably detect early cases of a new disease in the com-
munity, and point instead to other detection paths thatmay be more suitable for pre-pandemic surveillance, espe-cially community-based approaches. However, tradi-tional efforts to build epidemiology and laboratorycapacity are worthwhile, including more focused effortswithin these, e.g., targeted laboratory testing through sen-sitization of doctors; expedited specimen transport; use oftechnologies to streamline data flow; and improvingreporting compliance. Our model and published fieldstudies suggest that rapid diagnostic tests also appearpromising for surveillance purposes [14,16]. Finally,while several previous studies have noted the importanceof early warning systems for timely case detection[12,19,20] and have described different ways to use realtime electronic data streams [10,12,21,22], the robust useof electronic data mining for surveillance early warningremains a newer approach that has not yet reached its fullpotential for public health.
This study has both limitations and strengths that shouldbe recognized. First, in our hypothetical example to illus-trate application of the decision tool, we focused onpotential improvements to surveillance systems. Weacknowledge that some changes over time can weakensurveillance systems, e.g., due to economic decline ormajor disaster. Second, in the absence of identifiable glo-bal guidance, e.g., quantitative planning assumptionsfrom WHO, or a suitable evidence base from a specificdeveloping country, we relied on planning assumptionslargely from the United States and the judgments of thestudy team to generate the hypothetical input values usedto illustrate the decision tool. Thus, the outputs suggestpotential rather than evidence-based benefits of the vari-ous surveillance approaches examined. The strengths ofthe study include our systematic approach to consider abroad range of potential improvement strategies, includ-ing traditional facility-based and newer community-basedsurveillance approaches and specific elements withinthese; and the development of a process model and deci-sion tool that permit quantitative comparisons of alterna-tive improvement strategies – improvements to specificelements in the surveillance process – implemented singlyor in combination. Our novel approach can guide influ-enza surveillance programming in new and practical waysin countries around the world. This type of approach alsocan be applied to help improve surveillance for other dis-eases.
ConclusionDecision makers can apply the tool described here to theirown programs – using baseline measures (or estimates)and planning targets – to assess the relative merits of andrealistic expectations from implementation of the differ-ent surveillance improvement strategies, and thus selectthe ones that are most promising in their own context.
Page 10 of 11(page number not for citation purposes)
BMC Public Health 2008, 8:186 http://www.biomedcentral.com/1471-2458/8/186
This information can inform program policy and guidestrategic investments to improve country surveillance sys-tems within the larger context of global pandemic prepar-edness.
Competing interestsThe authors declare that they have no competing interests.
Authors' contributionsMM conceived and led the study, developed the concep-tual framework, helped design the model and interactivetool, and drafted and revised the manuscript. EC helpeddevelop the conceptual framework, developed the processmodel and decision tool and helped to draft and reviewthe manuscript. NL participated in the design of the study,development of the conceptual framework, and review ofthe manuscript. AGS, DMV and JAZ helped develop theconceptual framework, collect and analyze information,and review the manuscript. All authors read and approvedthe final manuscript.
Additional material
AcknowledgementsThis study was supported by the Office of the Assistant Secretary for Plan-ning and Response, U.S. Department of Health and Human Services (HHS). The views expressed do not necessarily represent those of HHS.
References1. Thacker SB: Historical development. In Principles and practice of
public health surveillance Edited by: Teutsch ST, Churchill RE. NewYork: Oxford University Press; 2000:1-16.
2. Institute of Medicine: Emerging infections: microbial threats to health inthe United States Edited by: Lederberg J, Shope RF, Oaks SC Jr. Wash-ington: National Academy Press; 1992:115.
3. WHO Global Influenza Preparedness Plan: The role ofWHO and Recommendations for National Measures Beforeand During Pandemics [http://www.who.int/csr/resources/publications/influenza/WHO_CDS_CSR_GIP_2005_5.pdf]
4. National Strategy for Pandemic Influenza [http://www.whitehouse.gov/homeland/nspi.pdf]
5. Flahault A: Global monitoring of influenza: potential contribu-tion of national networks from a French perspective. ExpertReview of Anti-Infective Therapy 2006, 4(3):387-93.
6. Clothier HJ, Atkin L, Turner J, Sundararajan V, Kelly HA: A compar-ison of data sources for the surveillance of seasonal and pan-
demic influenza in Victoria. Communicable Diseases Intelligence2006, 30(3):345-9.
7. Paquet C, Coulombier D, Kaiser R, Ciotti M: Epidemic intelli-gence: a new framework for strengthening disease surveil-lance in Europe. Euro Surveillance : Bulletin Européen Sur Les MaladiesTransmissibles 2006, 11(12):212-4.
8. Centers for Disease Control and Prevention: Updated Guidelinesfor Evaluating Public Health Surveillance Systems; Recom-mendations from the Guidelines Working Group. Morbidityand Mortality Weekly Report 2001, 20(No RR-13):.
9. Centers for Disease Control and Prevention: Framework for Eval-uating Public Health Surveillance Systems for Early Detec-tion of Outbreaks; Recommendations from the CDCWorking Group. Morbidity and Mortality Weekly Report 2004,53(No RR-5):.
10. Layne SP: Human influenza surveillance the demand toexpand. Emerg Infect Dis 2006, 12(4):562-8.
11. Gensheimer KF, Fukuda K, Brammer L, Cox N, Patriarca PA, StrikasRA: Preparing for pandemic influenza: the need for enhancedsurveillance. Emerg Infect Dis 1999, 5:297-9.
12. Wagner MM, Tsui F-C, Espino JU, Dato VM, Sittig DF, Caruana RA,McGinnis LF, Deerfield DW, Durzdzel MJ, Fridsma DB: The emerg-ing science of very early detection of disease outbreaks. J Pub-lic Health Manag Pract 2001, 7(6):51-9.
13. World Health Organization, Regional Office for South-East Asia:Role of Village Health Volunteers in Avian Influenza Surveil-lance in Thailand. SEA-CD-159 2007.
14. Effler PV, Ieong MC, Tom T, Nakata M: Enhancing public healthsurveillance for influenza virus by incorporating newly avail-able rapid diagnostic tests. Emerg Infect Dis 2002, 8(1):23-8.
15. Global Public Health Intelligence Network (GPHIN) [http://www.phac-aspc.gc.ca/media/nr-rp/2004/2004_gphin-rmispbk_e.html]
16. Simmerman JM, Chittaganpitch M, Erdman D, Sawatwong P, UyekiTM, Dowell SF: Field performance and new uses of rapid influ-enza testing in Thailand. International Journal of Infectious Diseases2007, 11(2):166-71.
17. WHO consultation on priority public health interventionsbefore and during an influenza pandemic – Working Group1: Surveillance for pandemic preparedness [http://www.who.int/csr/disease/avian_influenza/Surveillance_for_pandemic%20preparedness.pdf]
18. HHS and Institut Pasteur Partner on Pandemic InfluenzaPreparedness [http://www.hhs.gov/news/press/2006pres/20060206.html]
19. Flahault A, Vergu E, Coudeville L, Grais RF: Strategies for contain-ing a global influenza pandemic. Vaccine 2006, 24(44–46):6751-5.
20. Cowen P, Garland T, Hugh-Jones ME, Shimshony A, Handysides S,Kaye D, Madoff LC, Pollack MP, Woodall J: Evaluation of ProMED-mail as an electronic early warning system for emerging ani-mal diseases: 1996 to 2004. Journal of the American Veterinary Med-ical Association 2006, 229(7):1090-9.
21. Brownstein JS, Mandl KD: Reengineering real time outbreakdetection systems for influenza epidemic monitoring. AMIAAnnual Symposium Proceedings 2006:866.
22. Marsden-Haug N, Foster VB, Gould PL, Elbert E, Wang H, Pavlin JA:Code-based syndromic surveillance for influenza like illnessby International Classification of Diseases, Ninth Revision.Emerging Infectious Diseases 2007, 13(2):207-16.
Pre-publication historyThe pre-publication history for this paper can be accessedhere:
http://www.biomedcentral.com/1471-2458/8/186/prepub
Additional file 1Excel file with four worksheets: (1) "Inputs" – allows user to vary input values for all variable parameters in the decision tool for both baseline and follow-up time periods, (2) "Outputs" – displays a composite summary table of output calculations, followed by a summary for each detection path that contains both input values and the calculated output values, (3) "Graphs" – provides graphic display of output values for each path, com-paring baseline to follow up, (4) "Notes" – provides additional notes for users.Click here for file[http://www.biomedcentral.com/content/supplementary/1471-2458-8-186-S1.xls]
Page 11 of 11(page number not for citation purposes)