Embed Size (px)
Citation preview

IN DEGREE PROJECT ENVIRONMENTAL ENGINEERING,SECOND CYCLE, 30 CREDITS
, STOCKHOLM SWEDEN 2017
Strategies of improvement of UASB reactor operation
DARIA KLESYK
KTH ROYAL INSTITUTE OF TECHNOLOGYSCHOOL OF ARCHITECTURE AND THE BUILT ENVIRONMENT


Strategies of improvement of UASB reactor operation
DARIA KLESYK
June 2017

i
©Daria Klesyk 2017 Master’s Level Degree Project In association with the research group Water, Sewage and Waste Technology Department of Land and Water Resources Engineering Royal Institute of Technology (KTH) SE-100 44 STOCKHOLM, Sweden Reference should be written as: Klesyk D., (2017) “Strategies of improvement of UASB reactor operation” SEED-EX 2017:23

ii
Dedicated to my family

iii

iv
Summary in Swedish Avloppsreningsverk letar efter nya och mer effektiva, miljövänliga och energieffektiva metoder för avloppsrening som samtidigt skulle möjliggöra effektiv avlägsning av organiskt material. UASB-reaktorn som är en av de tekniker som använder anaeroba metoder uppfyller ovanstående krav. Reaktorns arbete kräver inte hög konsumtion av el och kemikalier och det möjliggör också produktion av biogas, vilket kan användas för själva avloppsreningsverkets behov. Arbetet fokuserade på att hitta de bästa förutsättningarna för UASB-reaktorns arbete och skapa de bästa arbetsförhållandena för anaeroba bakterier. Forskningen utfördes under 5 månader vid en forskningsstation vid Henriksdals avloppsreningsverk i Stockholm. Baserat på litteraturstudier beslutades det att fokusera på hydraulisk uppehållstid, HRT. Studien var uppdelad i två perioder under vilka reaktorerna arbetade under olika HRT. Under andra perioden var HRT 20% högre jämfört med den första perioden och var 3,33 respektive 4,04 timmar. Forskningen baserades huvudsakligen på laboratorietester som utfördes 2 gånger per vecka på gripprover. De viktigaste parametrarna som analyserades var CODtot, CODsus och CODdis, parametrar som gav information om mängden organiskt material. Dessutom mättes temperatur, pH, NH4-N och alkalitet under testet som processkontrollparametrarna. Dessutom övervakades temperaturen före inlopp till reaktorn, flödet och avloppsvattnets strömningshastighet kontinuerligt med användning av sensorer och datorsystem. Förändringar relaterade till förlängningen av HRT har inte givit upphov till de förväntade resultaten, så det har föreslagits nya potentiella lösningar för avlägsnande av organiskt material och ökad biogasproduktion.

v

vi
Summary in English Sewage treatment plants are looking for new and more effective, environmentally friendly and energy efficient solutions for wastewater treatment which at the same time, it would allow for effective removal of organic matter. The UASB reactor as one of the technologies using anaerobic methods meets the above requirements. The work of the reactor does not require high consumption of electricity and chemicals and it also allows for the acquisition of biogas, which can be used for the needs of the wastewater treatment plant itself. This work was focused on finding the best conditions for the UASB reactor performance and create the best working conditions for anaerobic bacteria. The research was made during 5 months at a research station located at the wastewater treatment plant Henriksdal in Stockholm. Based on literature research, it was decided to focus on Hydraulic Retention Time, HRT. The study was divided into two periods during which the reactors worked with different HRT. In the second period HRT was 20% higher compared to the first period and was 3.33 and 4.04 hours respectively. The research was based mainly on laboratory tests performed 2 times per week on grab samples. The most important parameters analyzed were CODtot, CODsus and CODdis as parameters providing information on the amount of organic matter. In addition, temperature, pH, NH4-N and alkalinity were measured during the test as the process control parameters. In addition, the temperature before inlet to the reactor, the flow and velocity of wastewater were monitored continuously using sensors and computer systems. Changes related to the extension of HRT have not produced the expected results, so new potential solutions for the removal of organic matter and increased biogas production have been proposed.

vii

viii
Acknowledgement
This thesis project would not be accomplished without the help and support from many people. In particular, I would like to express my greatest gratitude to my project supervisor Professor Erik Levlin for and my examiner Elżbieta Płaza for all the support and valuable leads as well as the opportunity to work at the research station for my research. Without their support, I would not find the thesis project in Hammarby Sjöstadsverkwhich providesthe best opportunity to work in a sereach station and the project report would not have been the same as present here. Special thanks go to doctor Józef Trela- professor at at KTH and Jesper Karlsson for them kindly support and help let me quickly familiar with the laboratory work and facility in Hammarby Sjöstadsverk. I also want to thank everyone who made my life and study in Stockholm easier. Thank you! Stockholm, August 2017

ix

x
Acronyms and abbreviations UASB Upflow Anaerobic Sludge Blanket Q Flow CODtot Total Chemical Oxygen Demand CODdis Dissolved Chemical Oxygen Demand CODsus Suspended Chemical Oxygen Demand CODinf Chemical Oxygen Demand at inlet to the UASB reactors CODout Chemical Oxygen Demand at outlet to the UASB reactors CODanx Chemical Oxygen Demand at inlet to the IFAS reactor Ntot Total Nitrogen NH4-N Ammonium NO2-N Nitrite nitrogen NO3-N Nitrate nitrogen MLSS Mixed liquor suspended solids VSS Volatile suspended solids Ptot Total phosphorus HRT Hydraulic Retention Time OLR Organic Loading Rate SRT Sludge Retention Time

xi

xii
Table of content Summary in Swedish ............................................................................................................. iv
Summary in English .............................................................................................................. vi
Acknowledgement ................................................................................................................ viii
Acronyms and abbreviations .................................................................................................. x Table of content .................................................................................................................... xii
Abstract ................................................................................................................................... 1
1. Introduction .................................................................................................................... 1
1.1. Anaerobic wastewater treatment ............................................................................. 1
1.2. Theory of UASB reactor ........................................................................................... 2 2. Review of the literature ................................................................................................... 4
2.1. Anaerobic treatment of wastewater in UASB ........................................................ 13
2.2. Type of wastewater treated UASB technology ....................................................... 14
2.2.1. Treatment of grey water .................................................................................. 14
2.2.2. Treatment of black water ................................................................................ 14
2.2.3. Treatment of raw domestic wastewater .......................................................... 15 2.2.4. Treatment of prescreened sewage .................................................................. 15
2.2.5. Strength pre-settled sewage from the industrial area .................................... 16
2.2.6. Municipal wastewater ..................................................................................... 16
3. Aim of the study ............................................................................................................. 17
4. Material and methods ................................................................................................... 17 4.2. Hammarby Sjöstadsverk research station ............................................................. 17
4.3. Technological system ............................................................................................. 18
4.4. Experimental strategy ............................................................................................ 19
4.5. Sampling ............................................................................................................... 20
4.6. Physical analyses .................................................................................................... 21
4.6.1. Temperature ................................................................................................... 21 4.6.2. pH ................................................................................................................... 21
4.6.3. Total suspended solid ..................................................................................... 21
4.7. Chemical analyses .................................................................................................. 21
4.7.1. COD ................................................................................................................. 21
4.7.2. NH4-N ............................................................................................................. 21
4.7.3. NO3 –N ............................................................................................................ 22 4.7.4. NO2- N ............................................................................................................. 22
4.7.5. Alkalinity ......................................................................................................... 22
4.7.6. Phosphorus ..................................................................................................... 22
5. Results and discussion .................................................................................................. 22

xiii
5.2. Extended analyses .................................................................................................. 22
5.3. Organic matter removal in UASB reactor .............................................................. 24 5.3.1. CODtot ............................................................................................................ 24
5.3.2. COD dissolved ................................................................................................. 25
5.3.3. COD suspended............................................................................................... 26
5.4. pH ........................................................................................................................... 27
5.5. Alkalinity ................................................................................................................28 5.6. NH4-N .................................................................................................................... 29
5.7. Temperature ........................................................................................................... 29
5.7.1. Organic loading rate ...................................................................................... 30
5.8. The efficiency of removal of organic matter in the UASB reactor ......................... 31
5.9. Effect of HRT on UASB reactor operation ............................................................. 32
6. Effect of UASB reactor operation for IFAS reactor operation....................................... 37 6.1. Effect of COD removal in UASB reactor for IFAS reactor operation .................... 37
6.2. Dependence of removal of N from the value of alkalinity of influent wastewater ......................................................................................................................... 38
7. Conclusions ................................................................................................................... 39
8. Reference ...................................................................................................................... 40
Appendix A Characteristics of incoming sewage during extended analyses ......................... I
Appendix B Characteristics of outflow sewage during extended analyses ............................ II
Appendix C Summary of analyses results ........................................................................... III Appendix C Summary of analyses results ............................................................................ IV

1
Abstract
The Upflow Anaerobic Sludge Blanket (UASB) reactor is one from the most widely used anaerobic technology to remove organic matter from wastewater, popular mostly in countries with warm climate but use all over the world. UASB reactor have mainly advantages: during organic matter removal biogas is produced, low energy consumption and simplicity of work. This study evaluates the effect of hydraulic retention time (HRT) on CODtot removal and attempts to optimize the UASB reactor work on line 4 in Hammarby Sjöstadsverk research station in Stockholm. During the four-month study performed analyzes: CODtot, CODdis, CODsus as a measure of the amount of organic matter, pH, alkalinity, NH4, temperature of inlet and outlet wastewater. Analysis was focus on UASB reactor 1 and inlet to next step of wastewater treatment- IFAS reactor. Studies were divided into two periods during which HRT was performed. In first period (31.01-07.05.2017) UASB reactors worked at HRT of 3.33h and in the second period (08.05-16.06.2017) UASB reactor 1 worked at HRT of 4.04 h and UASB reactor 2 worked at HRT of 2.99 h. The best result was achieved during the first period and the CODtot removal efficiency in reactor 1 was 73.75% with ORL 2,3 kg CODtot/m3*d.
1. Introduction Nowadays, when we aim at minimization of pollutant emissions into the environment efficient wastewater treatment is one of the important aspects of caring for the environment. In recent years with the financial and ecological reasons have been made efforts to minimize the costs of wastewater treatment and reduce the energy consumption associated with it. For these reasons, anaerobic treatment to efficient removal of organic matter is a good alternative to the aerobic biological waste water treatment because of lower energy consumption. As a results these processes are more environmentally friendly than aerobic processes.
1.1. Anaerobic wastewater treatment Anaerobic wastewater treatment methods are complex biological processes during which organic matter is converted to methane and carbon dioxide in the absence of oxygen. In these processes there are other types of electron acceptors- for example- CO2, ferric iron, nitrate, sulphate or some organic compounds. (Gómez, 2011). Anaerobic wastewater treatment consists of processes such as hydrolysis, acidogenesis, acetogenesis and methanogenesis.

2
Fig. 1 Schematic diagram of carbon flow conversion in anaerobic digesters (adapted from
Deepanraj B. et al, 2014)
Anaerobic wastewater treatment have a lots of advantages: High removal - these processes are highly effective processes, even in the case of a process with higher load or lower temperatures. Simplicity- reactors for anaerobic processes are easy to build and processes are easy to operate. Low sludge production- in anaerobic processes sludge production is lower than in aerobic processes because of the slower growth of anaerobic bacteria. As a result, the reactors may be smaller than the reactors in which the aerobic processes are carried out. Low energy consumption- In anaerobic processes energy isn’t consumed for oxygenation and agitation, so that the energy consumption is low until no warming is required. Flexibility- These processes can be carried out in a wide range of temperatures, on sewage with different organic matter loads - from urban waste water to wastewater from brewers, dairies and other types of industry. Low dosage of chemicals - if a effluent to the reactor is stable no dosage of chemicals is required to control pH
But anaerobic systems have also some disadvantages like low pathogen and nutrient removal so after this process it is required a post-treatment to remove it. Compared to the aerobics process, the start of the process is longer due to longer growth of methanogens bacterias. During anaerobic process hydrogen sulphid is produced so odors from reactors may be problematic.
1.2. Theory of UASB reactor One method for anaerobic processes of wastewater treatment is a UASB reactor. This technology as the main biological step in wastewater treatment began to develop in

3
the early 70's. In Upflow Anaerobic Sludge Blanket Reactor sewages are introduced from the bottom and then flows through the dense sludge bed. Sludge bed is formed mainly from the incoming suspended solid and anaerobic bacteria, which tend to form granules. Thanks to the natural turbulence associated with the flow and flow of the biogas particles, the wastewater is well mixed and sewage have good contact with sludge bed. UASB reactor may replace the primary settler, anaerobic sludge digester, the aerobic step and the secondary settler of aerobic treatment plant. Because of low removal of pathogen and nutrient sewages after UASB reactor still need treatment. UASB reactor can work in different combinations with various types of post-treatment for example: UASB-SBR, UASB- biofiler system, UASB- stabilizing pond system or UASB-deamonificaion. (Seghezzo, L. et al 1998)
Fig. 2 Schematic drawing of the UASB reactor (adapted from Chong, S. et al, 2012)
There are many factors that affect the efficiency of organic matter removal and the production of biogas. These factors include: temperature, pH, ORL, HRT, velocity. Temperature- anaerobic bacteria can work under psychrophilic, mesophilic and thermophilic temperatures however, below 20°C the activity of bacteria is lower. Therefore, the treatment of the main stream of waste water in Scandinavian countries can be a challenge for the need to heat up sewage before UASB reactor. The most recommended temperature is 35°C- since this temperature removal of organic matter and biogas production are in balance but in a temperate climate, achieving that wastewater temperature at full scale would be very expensive.
4
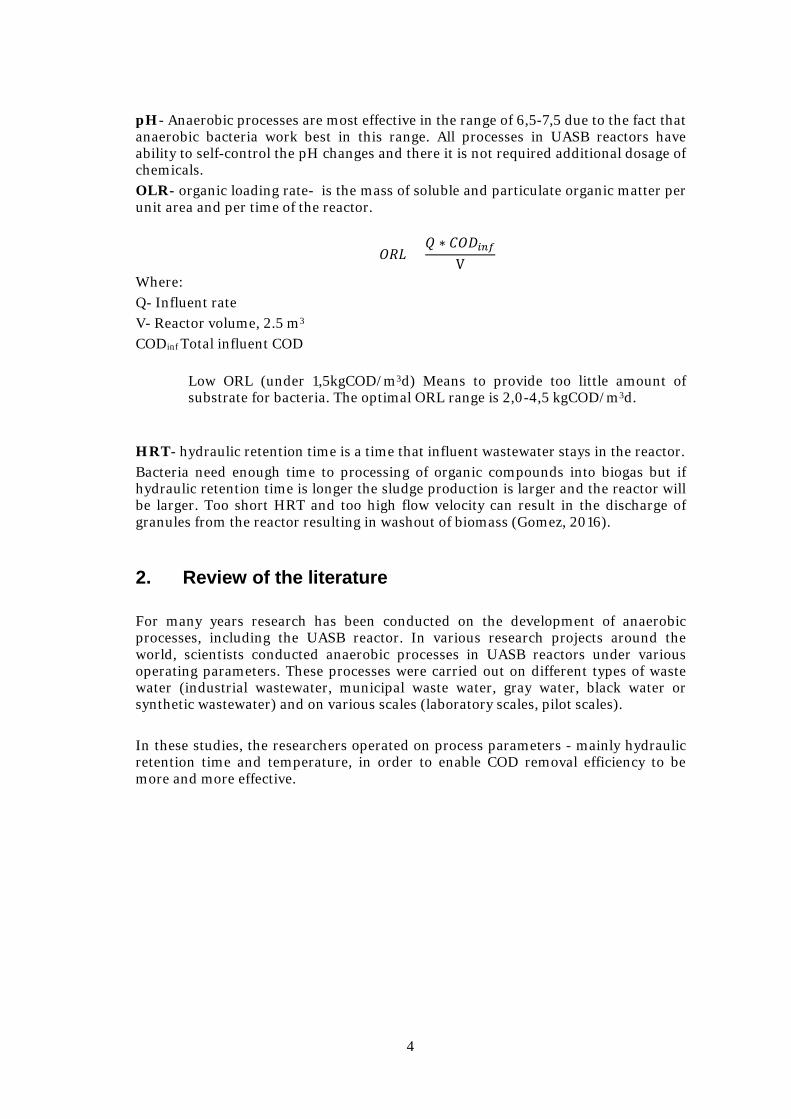
pH- Anaerobic processes are most effective in the range of 6,5-7,5 due to the fact that anaerobic bacteria work best in this range. All processes in UASB reactors have ability to self-control the pH changes and there it is not required additional dosage of chemicals. OLR- organic loading rate- is the mass of soluble and particulate organic matter per unit area and per time of the reactor.
𝑂𝑂𝑂𝑂𝐿𝐿 =𝑄𝑄 ∗ 𝐶𝐶𝑂𝑂𝐷𝐷𝑖𝑖𝑖𝑖𝑖𝑖
V
Where: Q- Influent rate V- Reactor volume, 2.5 m3
CODinf Total influent COD Low ORL (under 1,5kgCOD/m3d) Means to provide too little amount of substrate for bacteria. The optimal ORL range is 2,0-4,5 kgCOD/m3d.
HRT- hydraulic retention time is a time that influent wastewater stays in the reactor. Bacteria need enough time to processing of organic compounds into biogas but if hydraulic retention time is longer the sludge production is larger and the reactor will be larger. Too short HRT and too high flow velocity can result in the discharge of granules from the reactor resulting in washout of biomass (Gomez, 2016).
2. Review of the literature For many years research has been conducted on the development of anaerobic processes, including the UASB reactor. In various research projects around the world, scientists conducted anaerobic processes in UASB reactors under various operating parameters. These processes were carried out on different types of waste water (industrial wastewater, municipal waste water, gray water, black water or synthetic wastewater) and on various scales (laboratory scales, pilot scales). In these studies, the researchers operated on process parameters - mainly hydraulic retention time and temperature, in order to enable COD removal efficiency to be more and more effective.

5
Tab. 1a Review of literature
NR Authors Tittle PlaceTyp of
reactorV [m3]
Typ of wastewat
erHRT [h]
ORL [kg COD/m3*
d]typ of sludge
Temperature [°C]
COD [mgO2/L]
CODsol [mgO2/L]
CODss [mgO2/L]
CODcol [mgO2/L]
CODdis [mgO2/l]
BOD [mgO2/l]
TSS [mgl/l]
SRT pH
0 9digested sewage
sludge21 520-590 73-75 -
0 32-40digested sewage
sludge12-18 420-920 55-95 -
0 12 granular sludge 18-20 248-581 196-376 -
0 7-8 granular sludge 12-20 190-1180 80-300 10-700
0 4-14 granular sludge 7-18 100-900 53-474 10-700
6 9-16 granular sludge 10-18 100-900 53-475
120 2-7 granular sludge >13 391 291 10-700
20 6,2-18 granular sludge 11-19 100-90 53-476
Germany, Hamburg University
of Technolog
y,
seed-sludge from an anaerobic digester
treating primary and secondary sludge
18 (14-21) 681 (124) 268 (115) 291 (22) 134 (27)
Germany, Hamburg University
of Technolog
y,
1223 (21-24,5)
647 (137) 298 (101) 231 (86) 117 (40)
Germany, Hamburg University
of Technolog
y,
8 20 (19-21) 682 (106) 327 (64) 219 (71) 136 (33)
OPERATION PARAMETERS UASB
1
L. Seghezzo, G. Zeeman, J. B.
van Lier, H.V.M. Hamelers, G.
Lettinga
A review: the anaerobic
treatment of sewage in UASB
and EGSB reactors
Netherlands
Smal pilot scale
raw domestic sewage
- - - - - -
Full scale
2
T.A. Elmitwalli, M. Shalabi, C. Wendland and
R. Otterpohl
Grey water treatment in
UASB reactor at ambient
temperature
Smal pilot scale
0,03 m3gray
wastewater
- - - - -

6
Tab. 1b Review of literature
NR Authors Tittle Place Typ of reactor V [m3]
Typ of wastewate
rHRT [h]
ORL [kg COD/m3*
d]typ of sludge Temperatu
re [°C]COD
[mgO2/L]CODsol
[mgO2/L] CODss
[mgO2/L]CODcol
[mgO2/L]CODdis [mgO2/l]
BOD [mgO2/l]
TSS [mgl/l] SRT pH
6 3 816 566 250 496 2 555 420 135 746 1 298 216 82 1456 1 195 120 75 1156 0 92 55 37 5586 3 816 566 250 494 5 770 450 312 262 9 787 512 275 131 18 716 486 230 6
18 1 17 750 399 231 335 812 2 9 863 600 380 491 88 2 13 742 562 361 349 86 3 19 803 546 218 343 85 3 22 618 427 195 342 84 4 22 686 447 212 398 8
16 618 (130) 308(162) 177(114) 133(36)
10 647 (4,8) (353 (131) 177(81) 117(40)
6 682 (106) 310 (86) 236(90) 136(33)
103 0100 l of granular
sludge from a paper mill
5-13 1716 (261)
1201 (222)
103 0100 l of granular
sludge from a paper mill
14-17 1155 (332) 460 (151) 588 (124)
98 1 - 14-19 2897 (1199)
2428 (1220) 269 (107)
696 080 L of ludge from 1,2m3
reactor 15 9503
(6460) 8070 1433 (479)
696 0 No inoculum 20-25 12311 (7782) 10311 2001
(1209)3495 (590) 218 (97)
1589 (373) 325 (85)
OPERATION PARAMETERS UASB
- - - - - -1
strength pre-
settled sewage
12-72 1-3 - -
- - - -
0.2
7
S. Saha, N.Badhe, D. Seuntjens, S.E. Vlaeminck, R.
Biswas, T. Babdy
Effective carbon and nutrient treatment solutios for mixed
domestic-industrial wastewater in India
India pilot scale
- -
6
S. Luostarinen W. Sanders, K. Kujawa-
Roeleveld, G. Zeeman
Effect of temperature on anaerobi treatment of black water in UASB-septic tank
systems
Wageningen University, Netherlnds
pilot scale
1
black water -
grey water 30 - -
- -
5 Elmiywalli, T.A., Otterpohl, R.
Anaerobic biodegradability and treatment of grey water in
upflow anaerobic sludge blanket (UASB) reactor
Hamburg University of Technology,
Germany
labolatory scale 0.007
- 6.9–7.7
4 Lohani, S.P., Bakke, R., Khanal, S.N.
Load limit of a UASB fed septic tank-treated domestic
wastewaterpilot scale 0.25
raw domestic sewage
anaerobic slurry (no granules) obtained from
manure-fed biogas plant manure-fed
biogas plant
pre-screened sewage
anaerobic sludge discharged from a
5 m3 UASB reactor witch had been operated for
more than five years with raw
sewage with am HRT of 6h
27 °C - - -3
Leitao,R.C., Silva-Filho, J.A., Sanders,
W., van Haandel, A.C., Zeeman, G.,
Lettinga, G.
The effect of operational conditions on the
performance of UASB reactors for domestic wastewater treatment
Campina Grande city,
Brazilpilot scale 0.12

7
Tab. 1c Review of literature
NR Authors Tittle Place Typ of reactor V [m3] Typ of
wastewater HRT [h] ORL [kg COD/m3*d] typ of sludge
Temperature [°C]
COD [mgO2/L]
CODsol [mgO2/L]
CODss [mgO2/L]
CODcol [mgO2/L]
CODdis [mgO2/l]
BOD [mgO2/l]
TSS [mgl/l] SRT pH
0.416 4 2.3-4.4 30 5580.396 3.2 2.6 15-30 3410.005 24 1.9-4.4 20 4500
0.0063 6 1.5 30 376Full scale 35.113 8.5 2.1 20-24 803
0.15 6 2.1 21 5690.01 4 3.8 25 587
0.047 4 5.3-1.3Subtropical
climate temperature
541
79.2(55.2)+38.4(12.72) 0.279(0.105)+0.075(0.069) 20 875 (289) 794 (300) 15 (22) 87 (19) 220115.2 (110.4)+38.4 (6) 0.215(0.215)+0.046(0.018) 15 847 (313) 722 (298) 16 23) 107 (40) 320
105.6(100.8)+33.6(8.64) 0.301(0.155)+0.071(0.031) 10 1057 (363)
869 (375) 24 (30) 160 (75) 190
84 (43.2)+40.8(12.48) 0.179(0.058)+0.103(0.041) 20 596 (182) 320 (190) 85 (45) 182 (67) 24091.2 (26.4)+38.4(6) 0.159(0.043)+0.144(0.057) 15 554 (80) 281 (79) 60 (23) 212 (51) 32084(19.2)+24 (10.32) 0.191(0.074)+0.240(0.104) 10 690 (133) 329 (103) 101 (48) 266 (87) 400
syntetic black water
- - - -
dairy parlour wastewater
-10Luostarinen, S.A., Rintala,
J.A.
Anaerobic on-site treatment of black
water and dairy parlour wastewater in UASB-sepitc tanks at
low temperatures
labolatory scale
0.012+0.003
- - - -
Small pilot scae
- - - - - -
Brazil
9Chong, S., Sen, T.K., Kayaalp, A., Ang H.M.
The performance enhcements of upflow
anerobic sludge blanket (UASB)
reactors for domestic sludge treatment- state
of the art review
Small pilot scale
- - - - -- - - - - -
OPERATION PARAMETERS UASB
8
Chernicharo, C.A.L., van Lier, J.B., Noyola, A., Bressani Ribeiro,
T.,
Anaerobic sewage treatment: state of art.,
constraints and challenges.
India
Full scale - - - -

8
Tab. 1d Review of literature
NR Authors Tittle Place Typ of reactor V [m3]
Typ of wastewate
rHRT [h] ORL [kg COD/m3*d] typ of
sludgeTemperatu
re [°C]COD
[mgO2/L]CODsol
[mgO2/L] CODss
[mgO2/L]CODcol
[mgO2/L]CODdis [mgO2/l]
BOD [mgO2/l]
TSS [mgl/l] SRT pH
69.6+31.2 (5.2) 0.368(0.119)+0.172 (0.064) 20 104 (345) 959 (307) 23 (18) 69 (38) 281 (70)
69.6+31.2 (5.2) 0.406(0.143)+0.180( 0.086) 101161 (408)
1048 (370) 18 (17) 105 (42) 340 (66)
81.6(12.73)+31.2(5.52)
0.56 (0.147)+0.316 (0.172) 20 1888 (437)
1460 (478)
74 (35) 387 (66) 760(220)
81.6(12.73)+31.2(5.52)
0.617 (0.189)+0.460(0.293) 10 2268 (488)
1808 (446)
64 (27) 380(84) 590 (280)
26 (3.5) 1505 (354)
1030(389)
174 (89) 301 (70) 376 (148)
18 (1.6) 1650 (250)
1383(221)
157 (90) 236 (49) 417 (142)
25 (3.0) 1612 (241)
1184(258)
208 (69) 252 (75) 431 (171)
18 (2.0) 1419 (468)
1008(435)
226 (104) 292 (99) 352 (154)
23-27 22 (1.3) 1429 (344)
1005 (325)
181 (77) 303 (102) 404 (192)
municipal ww
4 386-958
domestic water
3-6 640
14La Motta, E.J., Silva, E., Bustillos, A., Padron, H.,
Luque, J.,
Combined Anaerobic/Aerobic
Secondary Municipal Wastewater Treatment:
Pilot-Plant Demonstration of the UASB/Aerobc Solids
Contact System
pilot scale 0.129 municipal ww
- 5.5 15-30.5 (20)
341 (85) - - - - - 189 (69) - -
6 958 (881) 269 (140) 443 (385)4 734 (542) 255 (179) 251 (379) 4 555 (239) 262 (112) 115 (67)4 386 (174) 206 (83) 120 (44)4 557 (135) 243 (85) 141 58)
- - -municipal
ww - - - - -15von Sperling, M., Freire,
V.H., de Lemos Chenicharo, C.A.,
Performance evaluation of a UASB-activated sludge system
treatment municipal wastewater
Brazil pilot scale 0.416
- - - - -- - - - - -13Chan, Y.J., Chong, M.F., Law Ch.L., Hassell D.G.,
A review on the anaerobic-aerobic
treatment of industrial and municipal
- - -
- - -
6023-27
1.4-1.6
60+36
black water
8-10+5-6 3.6-5.0 + 2.9-4.6
- -
- - -
black water
kitchen waste
12
Halalsheh, M., Sawajneh, Z., Zu’bi, M., Zeeman,
G., Lier, J., Fayyad, M., Lettinga, G.,
Treatment of strong domestic sewage in a 96 m3 UASB reactor operated at ambient temperatures: two-stage versus single-
stage reactor
Amman, Jordan Full scale
OPERATION PARAMETERS UASB
11Luostarinen, S.A.,
Rintala, J.A.
Anaerobic on-site treatment of kitchn
waste in combination with black water in
UASB-septic tanks at low temperatures
labolatory scale
0.012+0.003
syntetic black water
- -

9
Tab. 1e Review of literature
NR Authors Tittle CODtot [%]
CODsus [%]
CODcoll[%]
COD diss [%]
CODsol [%] TSS [%]
Alkality mg
CaCO3/lPO4-P Ortho
PO4-PParticulate PO4-P TKj-N NH4-N Particulat
e N-N
57-79 50-60 30-70
48-70 30-45 90
72 62 -30-75 20-6045-72 38-59 50-8946-60 42-48 55-7516-34 20-5131-49 23-46 -
31 (5) 61 (12) 18(13) 23 (12) 24 (8) 16 (5) 39 (8) 24 (4) 4 (28) 29 (10)
41 ( 13) 61 (20) 28 (22) 16 (16) 21,6 (9,1) 20,1 (9,9) 53 (32,2) 25,6 (2,3) 2,3 (26,1) 40,2 (6,2)
33 (7) 42 (6) 28 (27) 14 (33) 10,1 (2,9) 15,6 (2,8) 33,3 (62,8) - 8,6 (72,6) -
OPERATION RESOULTS
- -- - - -- -1
L. Seghezzo, G. Zeeman, J. B. van Lier, H.V.M. Hamelers, G.
Lettinga
A review: the anaerobic treatment of sewage in
UASB and EGSB reactors-
-2T.A. Elmitwalli, M.
Shalabi, C. Wendland and R. Otterpohl
Grey water treatment in UASB reactor at ambient
temperature- -

10
Tab. 1f Review of literature
NR Authors Tittle CODtot [%] CODsus [%] CODcoll[%] COD diss [%]
CODsol [%] TSS [%]
Alkality mg
CaCO3/lPO4-P Ortho
PO4-PParticulate PO4-P TKj-N NH4-N Particulat
e N-N
57 93 39360 91 38664 91 19753 37 15950 96 15757 93 39346 70 38344 71 39337 65 36856 72 35 6343 52 23 5746 62 32 5339 46 31 4430 37 15 3515 22 8 20
64(5,0) 83,5 (5,4) 51,7 (19,0) 50,9 (8,9)
52,3 (4,8) 79,4 (7,6) 29,2(19,8) 30,3 (7,6)
52,0 (12,0) 67,6 (17,2) 37,1 (17,5) 34,8 (20,5)
65 83 1033 59 -2470 71 5361 80 -3178 79 51
93(3) 89 (25) 6 (2)
91(6) 85 (12) 17(8)
OPERATION RESOULTS
- - - - -
- -
7
S. Saha, N.Badhe, D. Seuntjens, S.E. Vlaeminck, R.
Biswas, T. Babdy
Effective carbon and nutrient treatment solutios for mixed
domestic-industrial wastewater in India
- - - - -
- - - - - -
- - - - -
6
S. Luostarinen W. Sanders, K. Kujawa-
Roeleveld, G. Zeeman
Effect of temperature on anaerobi treatment of black water in UASB-septic tank
systems
- -
- - -
5 Tarek A. Elmiywalli, Ralf Otterpohl
Anaerobic biodegradability and treatment of grey water in
upflow anaerobic sludge blanket (UASB) reactor
- - - -
-
4Sunil Prasad Lohani,
Rune Bakke and Sanjay N. Khanal
Load limit of a UASB fed septic tank-treated domestic
wastewater- - - - - -
- - - - - -3
R.C. Leitao, J.A. Silva-Filho, W.
Sanders, A.C. van Haandel, G. Zeeman
and G. Lettinga
The effect of operational conditions on the performance of UASB reactors for domestic
wastewater treatment
- - -

11
Tab. 1g Review of literature
NR Authors Tittle CODtot [%] CODsus [%] CODcoll[%] COD diss [%]
CODsol [%] TSS [%]
Alkality mg
CaCO3/lPO4-P Ortho
PO4-PParticulate PO4-P TKj-N NH4-N Particulat
e N-N
63 7029-75 40-70
41 4744 3645 3446 4947 761 6658 4979 5965 7158 5662 5464 5172 -77 -
60 52
67 617934696743
60
63
5893 (4.0) 97 (3.0) 21 (85) 54 (17)93 (3.9) 98 (2.7) 58 (39) 70 (16)94 (3.3) 98 (2.6) 50 (32) 71 (19)84 (13) 90(11) 77(40) 70(19)86 (4.9) 91 (8.7) 66 (36) 77 (11)82 (6.3) 86 (15) 62 (24) 70 (20)
- - - -
- -
10Luostarinen, S.A.,
Rintala, J.A.
Anaerobic on-site treatment of black water and dairy parlour wastewater in UASB-sepitc tanks at low temperatures
- - - - -
- - - - - -
- - -
9Chong, S., Sen,
T.K., Kayaalp, A., Ang H.M.
The performance enhcements of upflow anerobic sludge
blanket (UASB) reactors for domestic sludge treatment-
state of the art review
- - - -
- - - - - -8
Chernicharo, C.A.L., van Lier, J.B., Noyola, A., Bressani Ribeiro,
T.,
Anaerobic sewage treatment: state of art., constraints and
challenges. - -

12
Tab. 1h Review of literature
Data in parentheses - standard deviation
91 (4.6) 98 (1.9) 11 (55) 97 (1.8)92 (3.9) 98 (2.2) 35 (45) 98 (1.3)88 (9.2) 96 (4.0) 38 (39) 95 (2.9)
91 (4.1) 98 (1.3) 28 (38) 97 (1.3)
53 (16)+4(29) 57 (22) +0.2 (54) 57 (30)+3(64) 25 (18)+3 (64)46 (22)+
4(57)
50 (13)+10 (21) 63 (12)+9 (36) 2(45)+ -13 (72)
-7 (71) + 4 (12)
41(34)+ 46 (60)
62 (8) 55 (12) 57 (23) 27 (14) 60 (19)51 (16) 50 (13) 54 (20) 23 (18) 55 (27)58 (6) 53 (14) 61 (19) 37 (17) 62 (26)
43-56
35-47
14La Motta, E.J., Silva, E., Bustillos, A., Padron, H.,
Luque, J.,
Combined Anaerobic/Aerobic Secondary Municipal Wastewater
Treatment: Pilot-Plant Demonstration of the
UASB/Aerobc Solids Contact System
34 - - - - 37 - - - - - - -
-84856968
- - -
OPERATION RESOULTS
- - - - - -
- - - -
15von Sperling, M., Freire, V.H., de Lemos Chenicharo, C.A.,
Performance evaluation of a UASB-activated sludge system treatment municipal wastewater
- - -
- - - - - -
- - - - -
13Chan, Y.J., Chong, M.F., Law
Ch.L., Hassell D.G.,
A review on the anaerobic-aerobic treatment of industrial and
municipal wastewater- -
12Halalsheh, M., Sawajneh, Z., Zu’bi, M., Zeeman, G., Lier, J., Fayyad, M., Lettinga, G.,
Treatment of strong domestic sewage in a 96 m3 UASB reactor operated at ambient temperatures:
two-stage versus single-stage reactor
- - -
- - - - - -11 Luostarinen, S.A., Rintala, J.A.
Anaerobic on-site treatment of kitchn waste in combination with black water in UASB-septic tanks
at low temperatures
- - -

13
2.1. Anaerobic treatment of wastewater in UASB In a review by Seghezzo, L. et al (1998) included research work from the Netherlands in 1983, 1986, 1992 by difference research teams. These processes were carried out both on a small scale-0,03 and 0,12 m3 and on a full scale - respectively 6, 20 and 120 m3. In each case, these processes were carried out at low temperatures below 20°C. Processes were conducted using digested sewage sludge or granular sludge. In smaller scale reactors, the COD unfiltered removal efficiency was higher than in larger scales. Also in small scale projects, the COD removal efficiency was comparable regardless of the type of precipitate used. For processes carried out in large scale COD removal efficiency was lower as compared to reactors of smaller volume. This is due to the fact that in large-scale processes many different factors affect the course of the process. In addition, in the case of the largest reactor of 120m3, the process was carried out at lower HRT- 2-7h compared to the other processes. In this case, COD removal efficiency and CODsol were lowest at 16-34% and 20-51%, respectively. In a review by Yi Jing Chan et al (2009) the advantages of using anaerobic-aerobic treatment of industrial and municipal wastewater are presented. UASB reactor is one of the anaerobic methods included in the review. In this article are show differences combination of UASB reactor with aerobic step. In table 1 point 13 are showed only for municipal and domestic wastewater as the most representative for this thesis however, a significant part of this article focuses on the treatment of industrial effluents. These effluents are characterized by many high concentrations of organic matter, among others wool acid dying wastewater -COD in inlet to reactor -499-2000 mg/L, food solid waste leachate- COD in UASB reactor inlet- 5400-20 000mg/L or starch industry wastewater 20 000 mg/L. because of this, no reference was included in the literature. In the treatment of industrial waste water treatment efficiency removal in the combination of anaerobic-aerobic treatment was very high and has reached even 98% and in UASB reactor the removal efficiency has reached even 93% with HRT equals 1 day for starch industry wastewater. In case of municipal wastewater and domestic sewage efficiency of COD removal was lower one of study (35-47%) but for second one was on high level- 69-84% which is very satisfying value. In this review operational temperature is not include Therefore, it cannot be determined whether or organic matter concentration was determinant of effectiveness in a particular study. In a review by Siewhui Chong et al (2012) is presented a comprehensive review of wastewater treatment systems in which UASB reactors are used with different solutions as a next step of wa stewater treatment- among others: SBR, activated sludge, downflow-hanging sponge, trickling filters. However, in any case was the IFAS reactor treated as a next step of wastewater treatment. Some results from this review are presented in Table 1- point 9. In a review by Chernicharo, C.A.L. et al (2015) are include studies from countries with high temperature- mainly India and Brasil. This review focuse on full-scale anaerobic sewage treatment plants treating municipal sewage. Efficiency of wastewater treatment in different parts of the world is very varied and varies in turn: in India: 29-75% of organic matter as CODtot, Brazil- 58-77%.

14
2.2. Type of wastewater treated UASB technology In previous research work in UASB reactors, satisfactory results have been achieved in the case of gray water, black water, raw domestic wastewater, pre-screened sewage and mixed wastewater (domestic and industrial wastewater). In 2.2. point is not included industrial wastewater treatment is not included due to small conetnion to pilot scale reactor discussed in this master thesis.
2.2.1. Treatment of grey water In the paper by Elmitwalli, T.A. et al (2007) the process was carried out in a UASB reactor with a volume of 0.03 m3 on gray water with was collected from the inlet sewer-pipe in first septic-tank in the settlement. The UASB reactor was operated at an HRT of 20, 12 or 8 hours for 140, 105 and 93 days, respectively. The best results were achieved with a 12-hour HRT and a temperature of 21-24.5°C. In case of longer HRT- 20 hours removal of COD removal was lower mainly because of low temperature- 14-21°C. These studies have shown that both HRT and temperature are the determinants of COD removal efficiency and will not achieve the expected results only by adjusting one of the parameters. During the experiment, the study also involved the removal of various forms of phosphorus and NH4-N. Removal efficiency of nutriens remained at a low level regardless of temperature and HRT. In paper by Elmiywalli, T.A. and Otterpohl, R. (2007) have been presented the study made at Hamburg University of Technology. The small UASB reactor (7l) was operated at HRT of 16,10 and 6h for 95,91 and 86 days, respectively and worked on gray water. UASB reactor worked in a temperature-controlled room at 30°C. The average CODtot removal efficiency ranged from 52 to 64% in UASB reactor, CODdis
removal efficiency ranged from 34,8 to 50,9% and CODsus removal efficiency ranged from 67,6 to 83,5%. The highest removal efficiency was achieved with the highest HRT = 16h. In addition, during the experiment, nutrient removal efficiency was measured. At each stage of the removal process were low. At the longest HRT (16h) the removal of NH4 and ortho-P was negative due to hydrolysis of particulate N and P.
2.2.2. Treatment of black water In paper by by S. Luostarinen et al (2005) The paper presents the results of two studies on UASB reactors working in the serial connection. Reactors worked on synthetic black water and on dairy parlour wastewater. UASB reactors worked under low temperatures- respectively 20, 15, 10°C for both kind of wastewater. Efficiency of COD removal was much higher than in previously reported for real black water, especially in temperature 10°C when usually removing of organic matter is really low. Efficiency of CODtot removal was above 90% for black water (BW) and above 80% for dairy parlour wastewater (DPWW), CODss above 95% for BW and around 90% for DPWW and CODdis respectively for BW and DPWW- between 54-71% and 70-77%. These results may suggest that prepared wastewater can contain components that allow for high efficiency even at very low temperatures.

15
In paper by S. Luostarinen et al (2007) results of research conducted in 3 UASB reactors are presented. UASB reactors had diffracts volumes and was operated on different operational parameters but all reactors worked with black water. First reactor with volume 1,2 m3 was operated more than 13 years and published research concerned the 1st and 13th years of reactor’s work. Reactors was operated with long HRT- 4,3d, 4,1d (1st reactor) and 29d (2nd and 3rd reactor). During studies at such a long HRT, the temperature had no significant effect on the efficiency of the processes. During colder periods UASB reactors work more as a settler accumulating CODsus with no biogas production but is still more effective than conventional septic tank. In article by Halalsheh, M. and others (2005) are present results of 3 years long studies on full scale UASB reactor which in first period worked as a two chamber reactor with volume of 60 and 36m3 respectively. In second and third period only first chamber of reactor worked. In each of the study periods, the results of the study were divided into periods: summer and winter. Over the whole period of time, the wastewater entering the reactor had a similar concentration of organic matter - 1419-1650 mg/L (CODtot), but in summer periods when the wastewater temperature exceeded 20 ° C, the removal of organic matter was higher. The removal efficiency was higher in the second and third periods despite the smaller reactor volume due to the longer HRT.
2.2.3. Treatment of raw domestic wastewater The paper by Lohani S.P. et al (2015) presents the results of the study on septic tank- UASB reactor combined system. This system was operated with wastewater from a girls’ dormitory and staff quarters at Kathmandu University in Nepal. Wastewater was collected in a septic tank with a volume above 13,5m3 and HRT=18h and next was pumped to UASB reactor with a volume- 250L and anaerobic slurry without granules obtained from manure-fed biogas plant manure-fed biogas plant. UASB reactor was operated at different HRTs- 18,12,8,6,5 and 4h. The reactor worked at HRT until the effectiveness of COD removal stabilized, and the steps lasted successively: ½ month (HRT=18h), 1.0 month (HRT=12h), 1.5 month (HRT=8h), 2 month (HRT=6h), 1 month (HRT=5h) and 1 month (HRT=4h). The average CODtot removal efficiency ranged from 15 to 56% in UASB reactor, CODdis removal efficiency ranged from 8 to 35% and CODsus removal efficiency ranged from 22 to 72%. The highest removal efficiency was achieved with the highest HRT = 18h. In the next stages of the experiment they had different waste temperature- it ranged from 9 to 22°C. Despite the low wastewater temperature of 9 ° C for a high HRT of 12h, the removal efficiency of COD was significantly higher than for a higher wastewater temperature (22 ° C) but HRT.
2.2.4. Treatment of prescreened sewage The paper by Leitão et al (2005) presents the results of the study in Campina Grande city, Brazil. During this experiment in pilot scale worked 8 UASB reactors with a volume of 120 L. There were inoculated with anaerobic sludge discharged from a 5m3 UASB reactor witch had been operated with raw sewage with HRT equal to 6 hours. The process was carried out at ~27 ° C. In set 1 five of them worked on the same HRT=6h under different loadings of COD and the same HRTs- 6h. In set 2 three UASB reactor were operated with approximately the same CODinf (~800mg/L) but with different HRTs (from 1 to 6h). In set 1 the best results were achieved with a

16
COD load of 298 mg COD/L-64%. Under COD loading less than 300 mgO2/L CODtot and CODsettled removal efficiency were lower than 10% compared to processes with higher load. For the second period when the processes were conducted with different HRTs, there was a large difference between the efficiency of removing COD in different reactors. In the case of a reactor operating with HRT = 6h achieved CODtot removal efficiency equal to 57% and the reactor was operating at HRT = 1h this efficiency was only 36.6%. This proves that in the case of waste water at the same temperature and for a similar load of COD higher HRT possible to achieve higher efficiency of COD removal.
2.2.5. Strength pre-settled sewage from the industrial area The paper by Saha, S., et al (2015) shows results of work of UASB reactor in pilot-scale (82,5 L). UASB reactor worked on mixed wastewater from industrial area and residential area of Nagpur city in India and obtained from an STP at Breda in The Netherlands. These wastewater had higher COD loads than domestic wastewater. COD removal efficiency in both study periods was over 90% and removal efficiency of SS was over 80%.
2.2.6. Municipal wastewater In paper by La Motta et Al (2007) are present results of UASB reactor in laboratory scale which worked with aerobic post treatment step- Aerated Solids Contact Chamber. Organic matter removal in UASB reactor was low- average removal efficiency was 34%, and TSS average removal efficiency was 36% but as anaerobic system with aerobic post treatment UASB reactor have high potential. In paper by von Speling et al (2001) are presented results of working on system UASB reactor with activated sludge. Studies was divided into 5 periods with different HRT for aerobic reactor. In case of UASB only during first period rector worked with HRT equals 6h but after this time HRT was stable and equals 4h. First period was period for adapt so results for this period was not calculated. During this studies the effectiveness of organic matter removal ranged between 68-85% and higher removal was achieved during second and third period when COD concentration was higher. In these periods efficiency achieved respectively 84 and 85% while COtot concentration was respectively 734 and 555 mg/L. As literature study showed UASB reactors have big potential Especially in combination with aerobic treatment as nest step of wastewater treatment. UASB reactors are best for cleaning industrial wastewater with high concentration of organic matter or for black water or sewage from the distribution canal (without rainwater). This kind of reactors work more efficiently at higher temperatures, however, satisfactory results are also achieved at temperatures above 20 °C. The effectiveness of the work is also influenced by the HRT, but its impact is not unequivocal. However, in most publications longer HRT has a positive impact on the work of the reactor.

17
3. Aim of the study
The aim of this study was an attempt to optimize of UASB reactor which work in low temperatures (~20°C) on wastewater from Henriksdal Wastewater Treatment Plant in Stockholm. By optimizing the reactor is meant increase of organic matter removal and increase of biogas production in case of low temperature of wastewater and low organic matter load. The aim of study was divided into five parts:
• Literature and publications study- get acquainted with the theoretical basics of anaerobic sewage treatment, UASB reactor and earlier research.
• Enhanced characteristics of the UASB reactor based on inflow and outflow sewage.
• Study on the effect of HRT on COD removal efficiency • Study on the effect of COD load on COD removal efficiency • Study of influence of UASB reactor operation on deammonification process
performance
4. Material and methods
4.2. Hammarby Sjöstadsverk research station Hammarby Sjöstadsverk is research station located in on top of Henriksdals WWTP in Stockholm. At the research station several research projects related to the new wastewater treatment processes are being carried out. The research aims at optimizing processes in Scandinavian countries and implementing environmentally friendly processes. Projects are working on sewage delivered to the sewage treatment plant in which the research station is located.

18
Fig. 3 UASB reactors, Hammarby Sjöstadsverk research station
4.3. Technological system The research was carried out on one of the technological lines existing at the research station, whose technological scheme was presented below. The study focused on two UASB reactors and the IFAS reactor, which directly affected the efficiency of the UASB reactors.

19
Fig. 4 Schematic drawing of the technological system
Raw sewage after preliminary mechanical treatment going to the flotation process and the pre-sedimentation. Next wastewater is going to two-chamber mixing tank from which wastewater goes to the reactors. Each reactor has a volume of 2.5m3 and reactors work parallel. Before each of the UASB reactors, the waste water is heated to about 20 ° C in heat exchangers. Wastewater after treatment in UASB reactor 1 goes to the filters in which the part of suspended solid flowing from the UASB reactor is removed. The filter station consists of four filters: a basket filter, two twine filters and a mesh filter. Filters were replaced 2-3 times per week depending on the quality of the waste water. Filtration effluents are sent to a 2.5 m3 averaging tank. From the averaging tank wastewater is pumped into an IFAS reactor of volume 200 liters where the forms of nitrogen are removed. Wastewater from UASB reactor 2 is not further treatment and goes to the sewer system.
4.4. Experimental strategy The study was conducted over four months: 31.01-16.06.2017. Before starting analysis UASB reactors for a long period of time working at a constant HRT equal 3.33h and constant velocity equal1.17 m/h. During the research it was decided to one operate parameters- HRT because hydraulic retention time has big effluence on efficiency of the process. Longer HRT give more time for the granules to take up organic matter from the wastewater. Additionally thanks longer HRT less sludge escape from UASB reactor due to lower velocity however sludge bed is compacted giving less mixing of granules and water. In case of shorter HRT mixing of granules and water is more effective but velocity of wastewater is higher so more granules can leave rector and granules have less time to wastewater treatment. The work of the reactors can be divided into two periods. In the period 31.01-07.05 previous reactor operating parameters were maintained and 08.05-16.06 the

20
radiators started working on another HRT of 4.04 and 2.99h for the first and second reactors in order to potentially increase the efficiency of the reactors.
4.5. Sampling The studies were conducted on grab samples taken at each stage of the process at the same time. All analyzes were done 2 times a week. Wastewater samples were collected at three collection points (fig. 3):
• Sampling point 1- effluent of the pre-settler as a effluent to UASB reactor • Sampling point 2- The highest sampling point in the reactor UASB as the
effluent of UASB reactor • Sampling point 3- Inlet into the IFAS reactor as a waste water sample after
purification in UASB reactors and after filtration.
Fig. 5 Sampling point 2
Scope of analysis in each sampling point is presented in the table below.
Tab. 2 Parameters analyzed at sampling points
Sampling point
Parameters
CODtot CODdis CODsus pH Alkalinity Nh4-N Temp
1 + + + + + + +
2 + + + + + + +
3 + + + + + + -

21
Research conducted during the work at the station can be divided into two types: • Basic research - performed twice a week, consists of analysis: temperature,
pH, CODtot, CODdis,NH4, alkalinity • Extended study – made between 17.02-10.03.2017 one times a week.
Extended study include all the basic analysis and suspended solid, total nitrogen, NO2, NO3, total phosphorus.
4.6. Physical analyses
4.6.1. Temperature The temperature of wastewater was measured on a unfiltered sample of wastewater at the inlet and outlet of the UASB reactor. For temperature measurement was used pH-meter with probe for temperature- pHmetr- WTW pH330i.
4.6.2. pH The pH of was wastewater was measure on a unfiltered sample of wastewater at the inlet and outlet of the UASB reactor and at the inlet of anammox reactor. For pH measurement was used pH-meter with probe for temperature- WTW pH330i. 4.6.3. Total suspended solid Total suspended solid was make during first 4 weeks as a part of extended studies to preliminary analysis of wastewater. TSS was measured 1 per week and made on samples at the inlet and outlet of the reactor. Samples were filtered on 40 mm diameter glass filters. During each analysis, two samples of the total suspended solid were made and on the basis of this two samples the average was made. After filtration, the filtrate were dried at 105 °C for 5 hours. After drying the samples and re-weighing the sample, a total suspended solid is calculated.
4.7. Chemical analyses During all analyzes the results were read using WTW photoLab 6600 UV-VI9 spectrophotometer. During COD analyses was also used Thermoreactors Merck Spectroquant TR320.
4.7.1. COD COD as a measure of the amount of organic compounds contained in wastewater was measured in a sample filtered and unfiltered at the inlet and outlet of the UASB reactor and at the entrance to the IFAS reactor. We used for the analysis WTW cuvette tests for COD in the range 10-150 ml and 25-1500 mgO2/l. CODtot is COD measured in unfiltered sample, CODdis is COD measured in the filtrate of filtered sample and CODsus is CODtot minus CODdis.
4.7.2. NH4-N NH4-N was measured in a filtered sample and at the inlet and outlet of the UASB reactor and at the entrance to the IFAS reactor. Analyzes was make with WTW cuvette tests for NH4-N in the range 4-80 mg/l NH4-N.

22
4.7.3. NO3 –N NO3-N was measured in a filtered sample and at the inlet and outlet of the UASB reactor and at the entrance to the IFAS reactor. Analyzes was make with WTW cuvette tests for NO3-N in the range 0.10 – 3.0 mg/l NO3-N. NO3-N was analyzes only during extended analyzes.
4.7.4. NO2- N NO2- N was measured in a filtered sample and at the inlet and outlet of the UASB reactor and at the entrance to the IFAS reactor. Analyzes was make with WTW cuvette tests for NO2- N in the range 0.01 – 0.7 mg/l NO2- N. NO2- N was analyzes only during extended analyzes.
4.7.5. Alkalinity Alkalinity was measured in a filtered sample and at the inlet and outlet of the UASB reactor and at the entrance to the IFAS reactor. analyzes was make with WTW cuvette tests for NH4-N in the range 0.4-8 mmol/l.
4.7.6. Phosphorus Phosphorus was measured in a filtered sample and at the inlet and outlet of the UASB reactor and at the entrance to the IFAS reactor. Analyzes was make with WTW cuvette tests for Ptot. Phosphorus was analyzes only during extended analyzes.
5. Results and discussion
5.2. Extended analyses During one month at the beginning of the conducted study- between 17.02-10.03 was make extended wastewater analysis, which included, in addition to standard analyzes, additional analyses allowing full characterization of wastewater. Extended analysis was make one time per week. During extended analysis the wastewater entering the UASB reactors was characterized by a relatively constant composition. In extended studies, the sample at the outlet of the reactors was collected before the inlet to the filter station.

23
Fig. 6 Variability of COD removal efficiency during extended
CODtot concentration varied between 240-324 mgO2/L and average concentration of CODtot was 281 mgO2/L standard deviation was 35.71. CODdis concentration varied between 122-170 mgO2/L and average concentration of CODdis was 141.5 mgO2/L standard deviation was 19.2. CODsus concentration varied between 92-182 mgO2/L and average concentration of CODsus was 139.5 mgO2/L standard deviation was 33.03. During this period, the variability of organic matter concentrations, particularly in the case of unfiltered wastewater, was mainly related to the dilution of sewage by melting snow flowing into the sewer. In the case of nitrogen compounds both the variability of total nitrogen concentrations and the other forms of nitrogen is maintained at a relatively constant level. Ntot average concentration was:41.25 mg N/L, standard deviation: 3.49 mg N/L, minimum value: 37.00 mgN/L and maximum value: 46 mg N/L. NH4-N average concentration:34.40 mg NH4-N/L, standard deviation 3.91 mg NH4-N/L, minimum value: 28.80 mgNH4-N/L maximum value: 39.30 mg NH4-N/L. NO2-N and NO3-N compounds represent a negligible percentage of total nitrogen and their average concentrations in the influent were respectively 0.08 mgNO2-N/L and 0.08mgNO3-N/L. Also, the concentration of phosphorus in the wastewater entering the reactor was maintained at a constant level and the average phosphorus concentration in that period was 3.95 mg PO4-P/L (with standard deviation 0.35 PO4-P/L). Also, the other analyzed parameters did not show higher variability in the analyzed period - the average value of the total suspended solid remained at the level 82.80 mg/L (SD 9.74 mg/L), pH-8.20 (SD 0.18), temperature 15.08°C (SD 0.69°C), alkalinity 4.48mmol/L (SD 0.19 mmol/L).
0
10
20
30
40
50
60
70
80
90
100
16-02 21-02 26-02 3-03 8-03
Rem
oval
effi
cien
cy [%
]
Time CODtot CODsus CODdis

24
The efficiency of removal of organic compounds expressed as CODtot maintained at an average level 50.85% and the values varied between values 38.33-67.53% (SD 10.97). The efficiency of removal of dissolved organic compounds expressed as CODdis maintained at an average level 36.85% and the values varied between values 31.97-41.27% (SD 3.78). The efficiency of removal of dissolved organic compounds expressed as CODsus maintained at an average level 62.78% and the values varied between values 35.87-85.71% (SD 18.75). The efficiency of removal of organic compounds was variable, especially removal of CODsus however, this is related to the problem of the granules escaping from the reactors.
Tab. 3 The efficiency of removal of organic compounds during extended studies
.
Date Removal efficiency [%]
CODtot CODdis CODsus
17.02.2017 53.09 34.71 73.38
24.02.2017 67.53 41.27 85.71
03.03.2017 38.33 39.86 35.87
10.03.2017 44.44 31.97 56.15
Average 50.85 36.95 62.78 Min 38.33 31.97 35.87 Max 67.53 41.27 85.71 SD 10.97 3.78 18.75
In the reactors there was an increase in some analyzed parameters Ntot and NH4, alkalinity, , temperature and total suspended solid. Increase of TSS is common with granulators escaping from the reactors. The increase in temperature and the decrease in pH are related to the efficient operation of UASB reactors.
5.3. Organic matter removal in UASB reactor Studies on the efficiency of organic removal included studies of the first UASB reactor and the UASB reactor and filter stations as inlet to next step of treatment. Results in this two places were made due to the differences in suspended organic matter. These differences result from the filtration of suspended organic matter on the on the filters.
5.3.1. CODtot CODtot analyzes were made between 17.02-16.06.2017 for a sample at the inlet to the UASB reactor and an inlet to the IFAS reactor and from 17.03 for the outlet sample directly from the first UASB reactor. Concentration of CODtot at the inlet to the UASB reactor varied between values 240-548 mgO2/L and average value was 369.3 mgO2/L and standard deviation was 65.4 mgO2/L . In the period 17.02-31.03 when average value of CODtot was 317 mgO2/L the concentration of organic matter in wastewater was lower than the later period 1.04-16.06 (average value 402 mgO2/L). This is due to the higher dilution of wastewater during first period due to the higher snowfall and rainfall, which resulted in larger inflows of rainwater to the sewage system. The highest value- 548 mgO2/L It is much higher than the other values which can

25
suggest a mistake resulting from measurement mistake eg. from improper mixing of the sample before sampling. Quality to reach waste water according to the effectiveness of previous processes and weather conditions.
Fig. 7 Variability of COD concentrations in unfiltrated samples
Concentration of CODtot at the outlet to the UASB reactor varied between values 84-324 mgO2/L, and average value was 187.3 mgO2/L (SD 51.5 mgO2/L). In the first period the average value at the outflow was 179 mgO2/L and in second one 199 mgO2/L so the second period was less advantageous in this respect. Concentration of CODtot at the inlet to the IFAS reactor varied between values 70-237 mgO2/L and average value was 145 mgO2/L (SD 32.5 mgO2/L). The variability of the amount of organic matter at the outlet of the UASB reactor and the inlet of the IFAS reactor was influenced by the efficiency of the reactor and filter station. It is not possible, however, to unequivocally quote values at the outlet of the UASB reactor to the value at the inlet to the IFAS reactor because the samples tested were grabe samples and the filter station removes some of the organic matter.
5.3.2. COD dissolved CODdis analyzes were made between 31.01-16.06.2017 for a sample at the inlet to the UASB reactor and an inlet to the IFAS reactor and from 17.03 for the outlet sample directly from the first UASB reactor. Concentration of CODdis at the inlet to the UASB reactor varied between values 120-262 mgO2/L and average value was 178.1 mgO2/L (SD-37.7 mgO2/L). Concentration of CODdis at the outlet from the UASB reactor varied between values 48-133 mgO2/L, and average value was 77.7 mgO2/L (SD 17.3 mgO2/L). In the first period the average value at the outflow was 73 mgO2/L and in second one 84 mgO2/L so the second period was less advantageous in this respect. Concentration of CODdis at the inlet to the IFAS reactor varied between values 54-111 mgO2/L and average value was 86.7 mgO2/L (SD 14 mgO2/L). Values at the outlet of
0
100
200
300
400
500
600
25-01 14-02 6-03 26-03 15-04 5-05 25-05 14-06 4-07
COD
[mg/
l]
Time
CODinf CODanx CODout

26
the reactor and at the inlet of the IFAS reactor were low variability irrespective of the amount of organic matter at the inlet to UASB reactor.
Fig.8 Variability COD concentrations in filtrated samples
5.3.3. COD suspended CODsus analyzes were made between 17.02-16.06.2017 for a sample at the inlet to the UASB reactor and an inlet to the IFAS reactor and from 17.03 for the outlet sample directly from the first UASB reactor. CODsus was not analyzed directly but was calculated on the basis of the difference between CODtot and CODdis. Concentration of CODsus at the inlet to the UASB reactor varied between values 35-302 mgO2/L and average value was 190.3 mgO2/L and the standard deviation was 50.5 mgO2/L. Concentration of CODsus at the outlet from the UASB reactor varied between values 20-230 mgO2/L, and average value was 109.6 mgO2/L (SD 50 mgO2/L). In the first period (HRT=3.33h) the average value at the outflow was 106 mgO2/L and in second one 115 mgO2/L so the second period as in earlier cases was less advantageous. Concentration of CODsus at the inlet to the IFAS reactor varied between values 4-143 mgO2/L and average value was 59.2 mgO2/L (SD 28.5 mgO2/L).
Suspended COD was characterized by the biggest variability among all analyzed forms of COD what shows graph above. In the case of wastewater at the UASB reactor outlet and inlet to the IFAS reactor, this is mainly related to the problem of irregular granules effluent from the UASB reactor which increases the efficiency of the process and increases the concentration of the organic suspension in the effluent. Some of the granules from the UASB reactors are filtered on the filters, but some of them come to the IFAS reactor. The lowest value CODsus at the inlet to the IFAS reactor- 4 mgO2/L is very low value and it is most likely related to a mistake made during this analyze.
0
50
100
150
200
250
300
5-01 25-01 14-02 6-03 26-03 15-04 5-05 25-05 14-06 4-07
COD
[mg/
l]
Time CODinf CODout CODanx

27
Fig.9 Variability of suspended COD concentrations
5.4. pH The pH analyzes were made between 31.01-16.06.2017 for a sample at the inlet to the UASB reactor and an inlet to the IFAS reactor and from 17.03 for the outlet sample directly from the first UASB reactor. The pH at the inlet to the UASB reactor varied between values 7.3-8.6 and average value was 8.00 and the standard deviation was 0.4. pH at the outlet to the UASB reactor varied between values 6.0-7.8, and average value was 7.2 (SD 0,4). The pH at the inlet to the IFAS reactor varied between values 6.3-8.5 and average value was 7.7 (SD 0.4).
Fig. 10 Variability of pH in analyzed samples
0
50
100
150
200
250
300
350
25-01 14-02 6-03 26-03 15-04 5-05 25-05 14-06 4-07
COD
[mg
O2/
L]
Time CODout CODinf CODanx
5,5
6,0
6,5
7,0
7,5
8,0
8,5
9,0
5-01 25-01 14-02 6-03 26-03 15-04 5-05 25-05 14-06 4-07
pH
Time UASBinf UASBout ANXinf

28
The pH at the inlet to the reactor was partially outside the optimum range for the process (optimum range for process: 6.5-7.5.) However, this parameter was not adjusted in any way. To the pH of the sewage entering the reactor which indicates that the process is proceeding correctly. During both- the first and the second study periods, the averages pH values were 7. During the study period, there was a problem with the calibration of the pH meter and some of the measurements could have been overstated also, several times the value of the measurement could not be measured.
5.5. Alkalinity The alkalinity analyzes were made between 31.01-16.06.2017 for a sample at the inlet to the UASB reactor and an inlet to the IFAS reactor and from 17.03 for the outlet sample directly from the first UASB reactor. The alkalinity at the inlet to the UASB reactor varied between values 3.1-6.1 mmol/L and average value was 5.0 and the standard deviation was 0.6 mmol/L. The alkalinity at the outlet to the UASB reactor varied between values 4.6-7.5 mmol/L, and average value was 6.5 mmol/L (SD 0,8 mmol/L). The alkalinity at the inlet to the IFAS reactor varied between values 2.9-8.3 mmol/L and average value was 6.7 mmol/L (SD 1.0 mmol/L). The UASB-reactor processes there is an increase alkalinity of wastewater. Only in one case- when the value was the lowest UASB outlet (4.6 mmol/L) this value was lower than the alkalinity at the inlet to the reactor. In this case, it was possible to make a mistake. Also on the last day of the analyses-16.06, the values at the inlet to the UASB reactor and the inlet to the IFAS reactor were very low, deviating from the average values despite several analyses.
Fig. 11 Variability of alkanity in analyzed samples
3
4
5
6
7
8
9
5-01 25-01 14-02 6-03 26-03 15-04 5-05 25-05 14-06 4-07
Alka
linity
[mm
ol/l]
Time
UASBinf ANXinf UASBeff

29
5.6. NH4-N
Fig.12 Variability of NH4-N in analyzed samples
The NH4-N analyzes were made between 31.01-16.06.2017 for a sample at the inlet to the UASB reactor and an inlet to the IFAS reactor and from 17.03 for the outlet sample directly from the first UASB reactor. Ammonium at the inlet to the UASB reactor varied between values 26.4-50.80 NH4-N/L and average value was 38.9 NH4-N/L and the standard deviation was 5.8 NH4-N/L. The NH4-N at the outlet to the UASB reactor varied between values 23.4-45.9 NH4-N/L, and average value was 39.1 NH4-N/L (SD 6.6 mmol/L). Ammonium at the inlet to the IFAS reactor varied between values 30.0-53.2 NH4-N/L and average value was 46.9 NH4-N/L (SD 4.5 NH4-N/L). As a result of reactions occurring in the UASB reactor, NH4-N is produced therefore, another wastewater treamtent step is required to remove the nitrogen compounds.
5.7. Temperature Temperature was measured in two points, at the inlet to the UASB reactor and outlet from the first UASB reactor. Temperature was measured at the inlet to the UASB reactor from 17.02 and from 14.03 at the outlet from reactor. In period 17.02-13.03 temperature was measured before filter station. The temperature at the inlet to the UASB reactor varied between values 14.10-20.80°C and average value was 17.70°C and the standard deviation was 1.9 °C. The temperature at the outlet to the UASB reactor varied between values 18.4-27.2°C, and average value was 20.7 (SD 1.7°C).
20
25
30
35
40
45
50
55
60
5-01 25-01 14-02 6-03 26-03 15-04 5-05 25-05 14-06
NH4
[mg/
L]
Time UASBinf UASBeff ANXinf

30
Fig.13 Variability of temperature in analyzed samples
Wastewater flowing into the reactor have a lower temperature than wastewater in reactor because of this, the wastewater was heated up before the UASB reactor. Since the beginning of May, sewage at the reactor inlet has higher temperatures and no warming is required. The higher temperature at the reactor inlet is more advantageous for the process and reduces the energy consumption needed to warm the sewage to the required temperature, so the process is more economical in the spring and summer. Although the process is more efficient at higher temperatures which has been proven in many studies temperature in the reactor was kept on constant level around 20°C due o of the process optimization for real temperatures in Scandinavian countries with the lowest energy consumption.
5.7.1. Organic loading rate OLR was calculated based on the content of organic matter expressed as CODtot and flow values according to the formula:
𝑂𝑂𝐿𝐿𝑂𝑂 =𝑄𝑄 ∗ 𝐶𝐶𝑂𝑂𝐷𝐷𝑖𝑖𝑖𝑖𝑖𝑖
V
OLR was analyses on inlet and outlet of the UASB reactor.
10
12
14
16
18
20
22
24
26
28
30
25-01 14-02 6-03 26-03 15-04 5-05 25-05 14-06 4-07
Tem
pera
ture
[°C
]
Time Influent Outflow

31
Fig.14 Variability of OLR in analyzed samples
Analyses was made between 17.02-16.06.2017 for inlet to UASB reactor and between 17.03-16.06 for outlet from the reactor. Average value for inlet was 2.8 𝑘𝑘𝑘𝑘𝑘𝑘𝑘𝑘𝑘𝑘
𝑚𝑚3∗𝑑𝑑 and the
minimum and maximum values were consecutive 1.7 and 3.9 𝑘𝑘𝑘𝑘𝑘𝑘𝑘𝑘𝑘𝑘𝑚𝑚3∗𝑑𝑑
. Standard
deviation was 5.8 𝑘𝑘𝑘𝑘𝑘𝑘𝑘𝑘𝑘𝑘𝑚𝑚3∗𝑑𝑑
. Average value for outlet was 1.3 𝑘𝑘𝑘𝑘𝑘𝑘𝑘𝑘𝑘𝑘𝑚𝑚3∗𝑑𝑑
and the minimum
and maximum values were consecutive 0.6 and 2.0 𝑘𝑘𝑘𝑘𝑘𝑘𝑘𝑘𝑘𝑘𝑚𝑚3∗𝑑𝑑
. Standard deviation was
0.3 𝑘𝑘𝑘𝑘𝑘𝑘𝑘𝑘𝑘𝑘𝑚𝑚3∗𝑑𝑑
. The lowest values of OLR at inlet were recorded in the winter when wastewater was most diluted.
5.8. The efficiency of removal of organic matter in the UASB reactor Analyses was made between 17.03-16.06.2017. The efficiency of organic matter removal expressed as efficiency of organic CODtot removal in the first UASB reactor ranged between 18.4-73.8% and average removal of 51.7% (SD=12.0%). On average, 200.8 mgO2/L was removed. This efficiency was very variable during research, big impact on the variability of efficiency was the problem with the escaping from the reactor granules, which affected the efficiency of removal of suspended organic matter and consequently the efficiency of dissipation of organic matter was lower on days when the problem of outflow occurred granules. The efficiency of dissolved organic matter removal (CODdis) ranged between 21.7 and 74.4% (removed between 26-195 mgO2/L) and average value was 57.8%. The efficiency of suspended organic matter removal (CODsus) ranged between -17.3-87.3% and average value was 42.9%. Standard deviation for this organic matter fraction really high- 26.3%. It shows that despite the long HRT under stable conditions the efficiency of removing this fraction
0
1
1
2
2
3
3
4
4
25-01 14-02 6-03 26-03 15-04 5-05 25-05 14-06 4-07
OLR
[kgC
OD/
m3*
d]
Time OLRout OLRin

32
is very irregular. During two analyses efficiency of organic matter removal was negative due to significant outflow of granules from the reactor.
Fig.15 The efficiency of organic matter removal in the first UASB reactor
5.9. Effect of HRT on UASB reactor operation
Tab. 4 Effect on influence of HRT on COD removal efficiency
Period 1 Period 2 Date 17.03-07.05 8.05-16.06
HRT [h] 3.33 4.04 CODtot removal [%] 52.27 50.81 CODdis removal [%] 62.67 51.20
CODsus removal [%] 38.97 48.26 During the study HRT was changed, which is one of the factors influencing the efficiency of organic matter removal. In period 2 increases the retention time by 20% from 3.33 h to 4.04 h. In the first period, the average CODtot removal efficiency was 52.27% and for the second period 50.81% and in case of CODdis removal efficiency was 62.67% in first period and 51.20% in second one. Only in the case of CODsus removal efficiency has the efficiency of removal removed from 38.97% to 48.26%. With is probably due to lower flow rates and greater settling of granules in the reactor. In period 2, a decrease in CODdis removal efficiency was observed as a result of a decrease in flow velocity which resulted in a deterioration in mixing of the granules in the reactor. During 2 period CODsus removal efficiency increase from 38.97 to 45.42%.
0
10
20
30
40
50
60
70
80
90
100
6-03 26-03 15-04 5-05 25-05 14-06 4-07
Effc
ienc
y [%
]
Time CODtot CODdis CODsus

33
The increase in this efficiency is due to the reduced velocity so that the granules a more settling in the reactor and less granules effluent from the reactor.
Fig.16 The efficiency of organic matter removal in the first UASB reactor
The average amount of organic matter that reaches to the UASB reactor in the second period was greater by 13.36% compared to the first period (increase from 353.70 to 401.91 mgO2/L) while in case of dissolved organic matter decreased with 1.16%. However, a significant increase of suspended part of organic matter was noted- from 173.57 to 225.27 mgO2/L that is up to nearly 30%. CODsus participation in CODtot increased from 49.07% in the period 1 to 56.05 $in the 2 period what is also presented in table 5. Treatment in UASB reactor can be divided in two steps- in first step suspended organic matter is converted to dissolved organic matter and in second step dissolved organic matter is converted into biogas. A summary of removal efficiency results of both steps of treatment in both periods is given in Table 5 above. The removal in first step increase from 37.32% to 54.29% from period 1 to period 2 but removal in step 2 was on constant level- during the first and second turns were 71.53 and 71.41%. Small decrease in CODtot removal from 52.27% in period 1 from 50.81 in period 2 is mainly caused by the large increase of CODsus percentage from 49% to of CODtot in period 1 to 56% of CODtot in period 2.
0
10
20
30
40
50
60
70
Effe
cien
cy re
mov
al
Period 1 HRT=3.33h Period 2 HRT=4.04h

34
Tab. 5 The effect of HRT on the efficiency of organic matter removal
Total Period 1 Period 2
Date 31.01-16.06
31.01-08.05
9.05-16.06
HRT [h] - 3.33 4.04 CODtot in [mgO2/L] 369.29 353.70 401.91
CODdis in [mgO2/L] 178.13 178.71 176.64
Part of CODtot [% ] 48.23 50.53 43.95
CODsus in [mgO2/L] 190.29 173.57 225.27
Part of CODtot [% ] 51.53 49.07 56.05
CODtot removal [mgO2/L] 200.81 199.00 203.27
Removal efficiency [%] 51.65 52.27 50.81
CODdis removal [mgO2/L] 111.27 124.73 92.91
Removal efficiency [%] 57.82 62.67 51.20
CODsus removal [mgO2/L] 89.54 74.27 110.36
Step 1 removal [mgO2/L] 89.54 74.27 110.36
Removal efficiency [%] 44.59 37.32 54.29
Step 2 in [mgO2/L] 267.67 252.98 287.00
Step 2 removal [mgO2/L] 200.81 199.00 203.27
Removal efficiency [%] 72.48 71.53 71.41
The increase in CODsus removal from 37.32% to 54.29% is a result of longer HRT with gives the microorganisms longer time to dissolve organic matter. The step 2 removed is not so much affected (71.53% in period 1 to 71.41% in second one) what shows the conversion of CODdis to biogas by the granuls is not so much deteriorated.

35
Fig.17 Amount of removal organic matter
In the analyzed periods there were also differences in the concentrations of wastes discharged into the wastewater what was involved among others with varying amounts of rainfall. As shown in Figure 18 the average load size in the second period was higher than the first period (successively 2.55kg/m3*d and 3.29kg/m3*d for period 1 and period 2). Based on literature data, higher organic removal efficiencies could be expected I this situation due to the fact that UASB reactors achieved higher efficiency for more concentrated wastewater. However, due to the change of HRT this regularity did not occur.
0
10
20
30
40
50
60
70
80
Rem
oval
effc
ienc
y [%
]
Step 1 Step 2 Period 1 HRT=3.33h Period 2 HRT=4.04h

36
Fig 18 Balance of loads in wastewater in period 1 and 2

37
6. Effect of UASB reactor operation for IFAS reactor operation The IFAS reactor inflow is outflow from UASB reactor after filtration on filters for this reason it was analyzed COD values at the inlet to the IFAS reactor.
6.1. Effect of COD removal in UASB reactor for IFAS reactor operation
Fig.19 COD values UASB effluent as a IFAS influent
The efficiency of organic matter removal in the UASB + system is higher than the removal efficiency in the UASB reactor due to the filtration of suspended organic matter on the filters. The IFAS reactor has an average inflow of CODtot 145 mgO2/L, ranging between 70-237 mgO2/L (standard deviation- 32.5 mgO2/L). Average inflow of CODdis 86.7 mgO2/L, ranging between 54-111 mgO2/L (standard deviation- 14 mgO2/L). Average value of CODsus 59.2 mgO2/L, ranging between 4-143 mgO2/L (standard deviation- 28.5 mgO2/L). In the UASB + system an average of 59.7% CODtot, 49.3% CODdis and 61.8% CODdis was removed. The minimum removal efficiency of CODtot was 36.4% and maximum 81.8% and for CODdis, the minimum value was 21.7% and the maximum was 78.6%. In case of CODsus removal ranging between -160-98.4% Very large variabilty of the CODsus removal efficiency were probably due to insufficiently efficient filtration and part of the granules from the UASB reactor is coming to IFAS reactor. The dependence of the efficiency of removing total nitrogen from the efficiency of organic matter removal in the UASB + reactor system is shown in the below graph. With the increase in the efficiency of organic matter removal in the UASB reactor and the reduction of organic matter loads, the efficiency of removing of total nitrogen in IFAS reactor is increasing. Due to the retention time in the IFAS reactor (11.-17.86h depending on the test period) the variability of the total nitrogen removal efficiency is shifted over time.
0
50
100
150
200
250
300
5-01 25-01 14-02 6-03 26-03 15-04 5-05 25-05 14-06 4-07
Org
anic
mat
ter [
mgO
2/L]
TIme
CODtot CODdis CODsus

38
Fig.20 The efficiency of organic matter removal in the first UASB reactor+filters
6.2. Dependence of removal of N from the value of alkalinity of influent wastewater
Fig. 21 Dependence of removal of N from the value of alkalinity of influent wastewater
0
10
20
30
40
50
60
70
80
90
25-01 14-02 6-03 26-03 15-04 5-05 25-05 14-06
Effic
ienc
y [%
]
Time
CODtot removal TotN removal CODdisremoval
R² = 0,6226
10
15
20
25
30
35
40
5 6 6 7 7 8 8 9
NH4
-N [m
g/L]
alkalinity [mmol/L]

39
Base on the analyzes, the correlation between alkalinity of wastewater influent to IFAS reactor (ie, outflow from the UASB reactor+filters) and the removal efficiency of total nitrogen in the IFAS reactor were determined. As can be seen in the graph above, the higher alkalinity of sewage entering the reactor, the higher the removal efficiency of the nitrogen compounds. Alkalinity is related to the pH of waste water so the optimal level of alkalinity (~ 7.25-8.0 mmol/L) is related with an optimal pH level for anammox process in IFAS reactor.
7. Conclusions Literature study and experimental results presented in this master thesis shows the UASB reactor work during 4 months, effect of HRT changes on UASB reactors operation and impact of removal efficiency of organic matter in the UASB reactor for the removal efficiency of total nitrogen in IFAS reactor.
• There was no significant increase in process efficiency following increased HRT in the UASB 1 by ~ 20% (from 3,33 h to 4,04 h). The lower efficiency of organic matter removal was related to settling of granules in the reactor and less contact of wastewater with bacterial granules. For these reactors, it is recommended to return to an earlier HRT,
• Long HRT promotes dissolution of organic matter particels converting CODsus
to CODdis what results better CODsus removal • As one of the most important factors affecting the efficiency of UASB reactors
is the temperature. Consider heating the waste water to a higher temperature in existing heat exchangers. However, there should consider the financial issues involved also,
• The effectiveness of removing organic matter in the UASB reactor influences the efficiency of the IFAS reactor. It is therefore desirable to optimize the efficiency of the UASB reactor in order to facilitate the optimum efficiency of the IFAS reactor and receive wastewater with the lowest pollutant on outlet from WWTP,
• ORL of influent wastewater is in the range of 1.8-3.9 kgCOD/m3d so the majority of cases is in optimal ORL range for anaerobic processes in UASB reactor (optimal ORL range- 0-4,5 kgCOD/m3d, Gomez, 2016).
• pH is a good parameter to control correct operation of the reactor. Stable pH value and lower pH value on outlet from reactor prove the correct operation of the reactor,
• In earlier research, more satisfactory results have been achieved in the case of more polluted wastewater (especially black water, industrial waste water). In the future, the effect of the change in the quality of the influent stream coming into the UASB reactors in can be analyzed (change of wastewater for wastewater with higher organic matter concentrations).
• Based on previous literature, I can suggest a raise in temperature, which resulting in higher organic removal efficiency, which is also related to an increase in biogas production.
• One solution to the future could also be to increase HRT but not by reducing the flow velocity in the reactor and expanding the entire system and adding a pump to recycle part of the wastewater into the reactor so that can be re-treatment

40
8. Reference Chan, Y.J., Chong, M.F., Law Ch.L., Hassell D.G., (2009), A review on the anaerobic-aerobic treatment of industrial and municipal wastewater, Chemical Engineering Journal 155: 1-18
Chernicharo, C.A.L., van Lier, J.B., Noyola, A., Bressani Ribeiro, T., (2015), Anaerobic sewage treatment: state of art., constraints and challenges. Reviews in Environmental Science and Bio/Technology 14: 649-679 Chong, S., Sen, T.K., Kayaalp, A., Ang, H. M., (2012) The performance enhancements of upflow anaerobic sludge blanket (UASB) reactors for domestic sludge treatmente A State-of-the-art review, Water Research 46: 3434-3470. Elmiywalli, T.A., Otterpohl, R.,(2007), Anerobic biodegradabilty and treatment of grey water in upflow anerobic sludge blanket (UASB) reactor, Water Research 41: 1379-1387 Elmitwalli, T.A., Shalabi, M., Wendland, C., Otterpohl, R., (2007) Grey water treatment in UASB reactor at ambient temperature. Water Science & technology Vol 55 No 7 pp 173-180
Gomez, R. R. (2016) Closing the Loop by Combining UASB reactor and reactive bed filter technologies for wastewater treatment, PhD Thesis Land and Water Resources Engineering, KTH Royal Institute of Technology, TRITA-LWR PHD-2016:02. Halalsheh, M., Sawajneh, Z., Zu’bi, M., Zeeman, G., Lier, J., Fayyad, M., Lettinga, G., (2005), Treatment of strong domestic sewage in a 96 m3 UASB reactor operated at ambient temperatures: two-stage versus single-stage reactor. Bioresource Technology 96: 577-585
La Motta, E.J., Silva, E., Bustillos, A., Padron, H., Luque, J., (2007), Combined Anaerobic/Aerobic Secondary Municipal Wastewater Treatment: Pilot-Plant Demonstration of the UASB/Aerobc Solids Contact System, Journal of Environmental Engineering, 133(4): 397-403,
Leitao,R.C., Silva-Filho, J.A., Sanders, W., van Haandel, A.C., Zeeman, G., Lettinga, G., (2005) The effect of operational conditions on the performance of UASB reactors for domestic wastewater treatment, . Water Science & Technology Vol 52 No 1-2 pp 299-305 Lohani, S.P., Bakke, R., Khanal, S.N., (2015), Load limit of a UASB fed septic tank-treated domestic wastewater, . Water Science & Technology 72.8 1455-1461
Luostarinen, S.A., Rintala, J.A., (2005), Anaerobic on-site treatment of black water and dairy parlour wastewater in UASB-sepitc tanks at low temperatures, Bioresource Technology 39: 439-448

41
Luostarinen, S.A., Rintala, J.A. (2007), Anaerobic on-site treatment of kitchen waste in combination with black water in UASB-septic tanks at low temperatures, Bioresource Technology 98: 1734-1740
Luostarinen, S., Sanders, W., Kujawa-Roeleveld, K., Zeeman, G., (2007) Effect of temperature on anaerobic treatment of black water in UASB-septic tank systems, Bioresource Technology 98: 980-986
Saha, S., Badhe, N., Seuntjens, D., Vlaeminck, S.E., Biswas, R., Babdy, T., (2015) Effective carbon and nutrient treatment solutios for mixed domestic-industrial wastewater in India, Water Science & Technology 72.4 651-657 Seghezzo, L., Zeeman, G., Lier, J.B., Hamelersm H.V.M., and Lettinga, G. (1998)A Review:The Anaerobic Treatment of Swage in UASB and EGSB Reactors. Bioresource Technology. 65:175-190. Velmurugan, S., Deepanraj, B., Simon Jayaraj, S., (2014) Biogas Generation through Anaerobic Digetsion Process – An Overview, Research Journal of Chemistry and Environment 18(5):80-94 von Sperling, M., Freire, V.H., de Lemos Chenicharo, C.A., (2001), Performance evaluation of a UASB-activated sludge system treatment municipal wastewater, Water Science & Technology Vol 43 No 11 pp 323-328


I
Appendix A Characteristics of incoming sewage during extended analyses UASB IN
Date Q CODtot CODdis CODsus Ntot NH4-N NO2-N NO3-N TSS VSS pH Temp alkality P
- [m3/h] [mgO2/l] [mgO2/l] [mgO2/l] [mg N/l]
[mg NH4-N]
[mg NO2-N]
[mg NO3-N] [mg/l]
[mg sm/l] - [°C]
[mg PO4-P/l]
17.02.2017 0,75 324 170 154 46 39,3 0,02 <0,1 76,2 1 8,12 15,9 4,75 4,5 24.02.2017 0,75 308 126 182 43 36,4 0,15 0,07 94 1,5 8,48 14,8 4,55 4 03.03.2017 0,75 240 148 92 39 33,1 0,03 0,06 70,5 0,5 8,2 15,5 4,26 3,7 10.03.2017 0,75 252 122 130 37 28,8 0,12 0,11 90,5 6,5 8 14,1 4,36 3,6
Average 0,75 281,00 141,50 139,50 41,25 34,40 0,08 0,08 82,80 2,38 8,20 15,08 4,48 3,95 Min 0,75 240,00 122,00 92,00 37,00 28,80 0,02 0,06 70,50 0,50 8,00 14,10 4,26 3,60 Max 0,75 324,00 170,00 182,00 46,00 39,30 0,15 0,11 94,00 6,50 8,48 15,90 4,75 4,50 SD 0,00 35,71 19,20 33,03 3,49 3,91 0,06 0,02 9,74 2,41 0,18 0,69 0,19 0,35

II
Appendix B Characteristics of outflow sewage during extended analyses UASB OUT
Date Q CODtot CODdis CODsus Ntot NH4-N NO2-N NO3-N TSS VSS pH Temp alkality P
- [m3/h] [mgO2/l] [mgO2/l] [mgO2/l] [mg N/l] [mg
NH4-N] [mg
NO2-N] [mg
NO3-N] [mg/l] [mg
sm/l] - [°C] [mg PO4P/l]
17.02.2017 0,75 152,00 111,00 41,00 54,00 48,00 0,02 <0,1 86,00 1,50 7,84 17,90 6,61 5,60
24.02.2017 0,75 100,00 74,00 26,00 46,00 42,20 0,02 0,01 78,50 2,50 7,57 17,90 5,41 4,90
03.03.2017 0,75 148,00 89,00 59,00 51,00 46,00 0,02 0,05 86,50 3,00 8,20 17,80 6,00 5,40
10.03.2017 0,75 140,00 83,00 57,00 50,00 46,50 0,02 <0,1 241,00 33,79 7,98 16,30 7,28 5,90 Average 0,75 135,00 89,25 45,75 50,25 45,68 0,02 0,03 123,00 10,20 7,90 17,48 6,33 5,45
Min 0,75 100,00 74,00 26,00 46,00 42,20 0,02 0,01 78,50 1,50 7,57 16,30 5,41 4,90 Max 0,75 152,00 111,00 59,00 54,00 48,00 0,02 0,05 241,00 33,79 8,20 17,90 7,28 5,90 SD 0,00 20,66 13,65 13,37 2,86 2,14 0,00 0,02 68,20 13,63 0,23 0,68 0,70 0,36

III
Appendix C Summary of analyses results
CODtot CODdis CODsus pH Alkalinity NH4-N Temp ORL CODtot CODdis CODsus pH Alkalinity NH4-N Temp ORL CODtot CODdis CODsus pH Alkalinity NH4-N
mg O2/L mg O2/L mg O2/L - mmol/L mg NH4-N/L st. C
[kg COD/m3*d
]mg O2/L mg O2/L mg O2/L - mmol/L mg NH4-N/L st. C
[kg COD/m3
*d]mg O2/L mg O2/L mg O2/L - mmol/l mg NH4-N/L
31-01 - 159 - 8.17 4.62 38.5 - - - - - - - - - - - 84 - 7.93 5.96 45.43-02 - 172 - 4.25 34.2 - - - - - - - - - - - 102 - 6.45 48.97-02 - 192 - 5.01 43.9 - - - - - - - - - - - 94 - 6.12 49.0
10-02 - 152 - 8.04 4.92 44.7 - - - - - - - - - - - 95 - 7.59 6.32 48.514-02 - 186 - 7.90 4.06 38.0 - - - - - - - - - - - 87 - 7.66 6.33 45.617-02 324 170 154 8.12 4.75 39.3 15.9 2.3 - - - - - - - - 152 111 41 7.84 6.61 48.021-02 362 192 170 8.50 4.45 38.1 15.1 2.6 - - - - - - - - 123 92 31 7.65 5.59 43.224-02 308 126 182 8.48 4.55 36.4 14.8 2.2 - - - - - - - - 100 74 26 7.57 5.41 42.228-02 288 134 154 8.01 4.33 34.3 14.9 2.1 - - - - - - - - 116 82 34 7.83 5.52 41.03-03 240 148 92 8.20 4.26 33.1 15.5 1.7 - - - - - - - - 148 89 59 8.20 6.00 46.07-03 308 128 180 8.05 5.28 38.5 15.1 2.2 - - - - - - - - 196 91 105 7.32 7.20 46.0
10-03 252 122 130 8.00 4.36 28.8 14.1 1.8 - - - - - - - - 140 83 57 7.98 7.28 46.514-03 384 154 230 7.93 5.43 43.5 16.3 2.8 - - - - - 20.00 - 140 94 46 7.29 5.74 46.817-03 345 150 195 8.20 4.79 30.0 16.2 2.5 124 74 50 7.48 - - 19.10 0.89 112 99 13 7.78 8.32 30.021-03 320 162 158 8.36 3.91 31.2 16.6 2.3 84 64 20 7.75 - - 19.10 0.60 116 58 58 8.47 6.73 45.624-03 364 150 214 8.55 5.40 43.2 16.9 2.6 144 61 83 7.75 - - 19.10 1.04 128 72 56 8.47 6.26 45.928-03 336 193 143 7.58 5.58 37.5 17.7 2.4 241 79 162 7.04 - - 20.40 1.74 175 87 88 7.50 7.88 49.131-03 287 252 35 7.86 5.25 34.2 15.9 2.1 158 133 25 7.20 - - 19.00 1.14 145 54 91 7.34 7.97 48.34-04 548 246 302 7.53 5.4 43.7 19.6 3.9 187 75 112 7.23 - - 21.1 1.35 168 78 90 7.88 7.4 47.27-04 375 213 162 7.48 5.30 36.0 17.8 2.7 218 81 137 7.06 7.50 44.30 21.00 1.57 162 86 76 7.57 7.70 49.211-04 321 159 162 7.78 4.85 34.8 18.0 2.3 188 66 122 6.02 7.17 38.80 19.90 1.35 174 108 66 7.80 6.55 47.713-04 339 182 157 7.67 4.96 32.8 16.8 2.4 194 58 136 7.38 6.09 33.60 20.20 1.40 142 92 50 7.79 7.32 46.819-04 398 212 186 8.32 5.72 43.1 18.8 2.9 190 82 108 7.46 7.00 37.90 20.00 1.37 155 74 81 7.96 7.48 43.021-04 404 205 199 8.09 5.67 50.8 17.6 2.9 153 85 68 7.26 6.66 42.10 24.80 1.10 167 77 90 7.88 7.19 47.825-04 426 211 215 8.02 5.73 31.3 15.4 3.1 208 54 154 7.56 5.47 27.90 18.40 1.50 138 83 55 8.12 7.24 46.728-04 312 176 136 7.78 5.02 36.1 17.5 2.2 117 48 69 7.35 4.56 25.10 27.20 0.84 128 81 47 7.65 6.78 46.53-05 498 262 236 8.5 5.54 44.1 18.9 3.6 257 67 190 7.53 7.13 41.6 20.3 1.85 179 82 97 7.54 7.41 48.95-05 396 196 200 8.56 5.31 50.7 19.8 2.9 221 71 150 7.64 6.5 45.5 20.8 1.59 90 61 29 7.85 7.1 50.69-05 416 182 234 8.03 6.06 44.1 19.0 3.3 128 75 53 7.18 7.15 42.8 19.5 0.77 90 69 21 8.02 6.61 52.3
12-05 360 120 240 8.09 5.39 43.8 18.9 2.9 168 94 74 6.39 6.39 45.9 20.9 1.02 140 94 46 7.88 6.39 53.016-05 384 132 252 7.72 5.77 44.5 19.2 3.1 148 51 97 7.08 7.53 44.7 20.8 0.90 70 66 4 7.66 6.5 53.219-05 449 215 234 7.49 5.05 44.4 20.5 3.6 246 94 152 7.03 6.76 43.30 21.00 1.49 158 105 53 7.30 7.32 53.223-05 454 209 245 7.45 5.71 43.0 19.8 3.6 239 92 147 7.06 7.23 45.40 20.60 1.45 170 102 68 7.26 7.26 51.626-05 393 209 184 4.91 38.5 19.7 3.2 192 94 98 6.39 42.50 20.40 1.16 153 102 51 7.30 7.16 51.331-05 383 155 228 7.56 5.51 39.8 19.8 3.1 195 83 112 6.95 6.86 34.70 20.10 1.18 237 94 143 7.18 6.80 47.22-06 397 201 196 8.10 5.96 43.9 19.7 3.2 324 94 230 7.50 6.82 42.30 19.80 1.96 173 100 73 7.80 7.20 49.3
WEEK 19 9-06 452 195 257 7.52 5.45 40.3 20.4 3.6 219 80 139 7.04 6.19 42 21.4 1.32 139 97 42 7.31 6.43 43.513-06 332 134 198 7.48 4.22 26.4 19.7 2.7 127 84 43.00 7.14 5.2 23.4 21.4 0.77 132 89 43 7.38 5.2 39.616-06 401 191 210 7.34 3.14 37.4 20.8 3.2 199 80 119.00 7 6.17 38.4 21.8 1.20 175 92 83 6.34 2.86 42.8
369.3 178.1 190.3 8.0 5.0 38.9 17.7 2.8 187.3 77.7 109.6 7.2 6.5 39.1 20.7 1.3 145.0 86.7 59.2 7.7 6.7 46.9240.0 120.0 35.0 7.3 3.1 26.4 14.1 1.7 84.0 48.0 20.0 6.0 4.6 23.4 18.4 0.6 70.0 54.0 4.0 6.3 2.9 30.0548.0 262.0 302.0 8.6 6.1 50.8 20.8 3.9 324.0 133.0 230.0 7.8 7.5 45.9 27.2 2.0 237.0 111.0 143.0 8.5 8.3 53.265.4 37.7 50.5 0.4 0.6 5.8 1.9 0.5 51.5 17.3 50.0 0.4 0.8 6.6 1.7 0.3 32.5 14.0 28.5 0.4 1.0 4.5
MaxSD
AverageMin
WEEK 7
WEEK 18
WEEK 20
WEEK 12
WEEK 13
WEEK 14
WEEK 15
WEEK 16
WEEK 17
WEEK 8
WEEK 9
WEEK 10
WEEK 11
WEEK 1
WEEK 2
WEEK 3
WEEK 6
WEEK 5
UASB OUTFLOW FROM REACTOR 1UASB INFLUENT
WEEK 4
INFLUENT OF DEAMMONIFICATION
DATE

IV
Appendix C Summary of analyses results
CODtot CODtot CODdis CODdis CODsus CODsus ORL ORL CODtot CODtot CODdis CODdis CODsus CODsus alkanity NH4-N Q HRT V Q HRT V
[mg O2/L] [%] [mg O2/L] [%] [mg O2/L] [%] [kg COD/m3*d] [%] [mg O2/L] [%] [mg O2/L] [%] [mg O2/L] [%] [%] [%] [m3/h] [h] [m/h] [m3/h] [h] [m/h]
- - - - - - - - - 75.00 47.17 - - 22.48 15.20 0.75 3.33 1.17 0.75 3.33 1.17 31-01- - - - - - - - - 70.00 40.70 - - 34.11 30.06 0.75 3.33 1.17 0.75 3.33 1.17 3-02- - - - - - - - - 98.00 51.04 - - 18.14 10.41 0.75 3.33 1.17 0.75 3.33 1.17 7-02- - - - - - - - - 57.00 37.50 - - 22.15 7.84 0.75 3.33 1.17 0.75 3.33 1.17 10-02- - - - - - - - - 99.00 53.23 - - 35.86 16.67 0.75 3.33 1.17 0.75 3.33 1.17 14-02- - - - - - - 172.00 53.09 59.00 34.71 113.00 73.38 28.14 18.13 0.75 3.33 1.17 0.75 3.33 1.17 17-02- - - - - - - 239.00 66.02 100.00 52.08 139.00 81.76 20.39 11.81 0.75 3.33 1.17 0.75 3.33 1.17 21-02- - - - - - - 208.00 67.53 52.00 41.27 156.00 85.71 15.90 13.74 0.75 3.33 1.17 0.75 3.33 1.17 24-02- - - - - - - 172.00 59.72 52.00 38.81 120.00 77.92 21.56 16.34 0.75 3.33 1.17 0.75 3.33 1.17 28-02- - - - - - - 92.00 38.33 59.00 39.86 33.00 35.87 29.00 28.04 0.75 3.33 1.17 0.75 3.33 1.17 3-03- - - - - - - 112.00 36.36 37.00 28.91 75.00 41.67 26.67 16.30 0.75 3.33 1.17 0.75 3.33 1.17 7-03- - - - - - - 112.00 44.44 39.00 31.97 73.00 56.15 40.11 38.06 0.75 3.33 1.17 0.75 3.33 1.17 10-03- - - - - - - 244.00 63.54 60.00 38.96 184.00 80.00 5.40 7.05 0.75 3.33 1.17 0.75 3.33 1.17 14-03
221.00 64.06 76.00 50.67 145.00 74.36 1.59 64.06 233.00 67.54 51.00 34.00 182.00 93.33 42.43 0.00 0.75 3.33 1.17 0.75 3.33 1.17 17-03236.00 73.75 98.00 60.49 138.00 87.34 1.70 73.75 204.00 63.75 104.00 64.20 100.00 63.29 41.90 31.58 0.75 3.33 1.17 0.75 3.33 1.17 21-03220.00 60.44 89.00 59.33 131.00 61.21 1.58 60.44 236.00 64.84 78.00 52.00 158.00 73.83 13.74 5.88 0.75 3.33 1.17 0.75 3.33 1.17 24-0395.00 28.27 114.00 59.07 0.68 28.27 161.00 47.92 106.00 54.92 55.00 38.46 29.19 23.63 0.75 3.33 1.17 0.75 3.33 1.17 28-03
129.00 44.95 119.00 47.22 10.00 28.57 0.93 44.95 142.00 49.48 198.00 78.57 -56.00 -160.00 34.13 29.19 0.75 3.33 1.17 0.75 3.33 1.17 31-03361.00 65.88 171.00 69.51 190.00 62.91 2.60 65.88 380.00 69.34 168.00 68.29 212.00 70.20 27.03 7.42 0.75 3.33 1.17 0.75 3.33 1.17 4-04157.00 41.87 132.00 61.97 25.00 15.43 1.13 41.87 213.00 56.80 127.00 59.62 86.00 53.09 31.17 26.83 0.75 3.33 1.17 0.75 3.33 1.17 7-04133.00 41.43 93.00 58.49 40.00 24.69 0.96 41.43 147.00 45.79 51.00 32.08 96.00 59.26 25.95 27.04 0.75 3.33 1.17 0.75 3.33 1.17 11-04145.00 42.77 124.00 68.13 21.00 13.38 1.04 42.77 197.00 58.11 90.00 49.45 107.00 68.15 32.24 29.91 0.75 3.33 1.17 0.75 3.33 1.17 13-04208.00 52.26 130.00 61.32 78.00 41.94 1.50 52.26 243.00 61.06 138.00 65.09 105.00 56.45 23.53 -0.23 0.75 3.33 1.17 0.75 3.33 1.17 19-04251.00 62.13 120.00 58.54 131.00 65.83 1.81 62.13 237.00 58.66 128.00 62.44 109.00 54.77 21.14 -6.28 0.75 3.33 1.17 0.75 3.33 1.17 21-04218.00 51.17 157.00 74.41 61.00 28.37 1.57 51.17 288.00 67.61 128.00 60.66 160.00 74.42 20.86 32.98 0.75 3.33 1.17 0.75 3.33 1.17 25-04195.00 62.50 128.00 72.73 67.00 49.26 1.40 62.50 184.00 58.97 95.00 53.98 89.00 65.44 25.96 22.37 0.75 3.33 1.17 0.75 3.33 1.17 28-04241.00 48.39 195.00 74.43 46.00 19.49 1.74 48.39 319.00 64.06 180.00 68.70 139.00 58.90 25.24 9.82 0.75 3.33 1.17 0.75 3.33 1.17 3-05175.00 44.19 125.00 63.78 50.00 25.00 1.26 44.19 306.00 77.27 135.00 68.88 171.00 85.50 25.21 -0.20 0.75 3.33 1.17 0.75 3.33 1.17 5-05288.00 69.23 107.00 58.79 181.00 77.35 2.56 76.82 326.00 78.37 113.00 62.09 213.00 91.03 8.32 15.68 0.63 4.04 0.99 0.84 2.99 1.34 9-05192.00 53.33 26.00 21.67 166.00 69.17 1.87 64.84 220.00 61.11 26.00 21.67 194.00 80.83 15.65 17.36 0.63 4.04 0.99 0.84 2.99 1.34 12-05236.00 61.46 81.00 61.36 155.00 61.51 2.19 70.96 314.00 81.77 66.00 50.00 248.00 98.41 11.23 16.35 0.63 4.04 0.99 0.84 2.99 1.34 16-05203.00 45.21 121.00 56.28 82.00 35.04 2.12 58.72 291.00 64.81 110.00 51.16 181.00 77.35 31.01 16.54 0.63 4.04 0.99 0.84 2.99 1.34 19-05215.00 47.36 117.00 55.98 98.00 40.00 2.20 60.33 284.00 62.56 107.00 51.20 177.00 72.24 21.35 16.67 0.63 4.04 0.99 0.84 2.99 1.34 23-05201.00 51.15 115.00 55.02 86.00 46.74 1.99 63.19 240.00 61.07 107.00 51.20 133.00 72.28 31.42 24.95 0.63 4.04 0.99 0.84 2.99 1.34 26-05188.00 49.09 72.00 46.45 116.00 50.88 1.89 61.64 146.00 38.12 61.00 39.35 85.00 37.28 18.97 15.68 0.63 4.04 0.99 0.84 2.99 1.34 31-0573.00 18.39 107.00 53.23 1.23 38.51 224.00 56.42 101.00 50.25 123.00 62.76 17.22 10.95 0.63 4.04 0.99 0.84 2.99 1.34 2-06
233.00 51.55 115.00 58.97 118.00 45.91 2.30 63.49 313.00 69.25 98.00 50.26 215.00 83.66 15.24 7.36 0.63 4.04 0.99 0.84 2.99 1.34 WEEK 19 9-06205.00 61.75 50.00 37.31 155.00 78.28 1.90 71.18 200.00 60.24 45.00 33.58 155.00 78.28 18.85 33.33 0.63 4.04 0.99 0.84 2.99 1.34 13-06202.00 50.37 111.00 58.12 91.00 43.33 2.02 62.61 226.00 56.36 99 51.832 127.00 60.48 -9.79 12.62 0.63 4.04 0.99 0.84 2.99 1.34 16-06200.8 51.7 111.3 57.8 99.2 47.8 1.7 56.8 224.3 59.7 91.5 49.3 131.1 61.8 23.6 16.873.0 18.4 26.0 21.7 10.0 13.4 0.7 28.3 92.0 36.4 26.0 21.7 -56.0 -160.0 -9.8 -6.3361.0 73.8 195.0 74.4 190.0 87.3 2.6 76.8 380.0 81.8 198.0 78.6 248.0 98.4 42.4 38.157.4 12.0 34.1 11.0 51.5 21.0 0.5 12.0 67.4 10.7 41.4 13.3 59.3 41.7 10.4 10.8
WEEK 1
WEEK 2
WEEK 3
WEEK 4
WEEK 5
WEEK 6
WEEK 7
WEEK 8
WEEK 9
WEEK 10
WEEK 11
WEEK 12
WEEK 13
MaxSD
WEEK 17
WEEK 18
AverageMin
WEEK 14
WEEK 15
WEEK 16
WEEK 20
REMOVAL EFFCIENCY IN UASB REACTOR 1 VALUE INCREASE OPERARTIONAL PARAMTERS
OPERARTIONAL PARAMTERS REMOVAL EFFCIENCY UASB1+UASB2+FILTERS
DATE


TRITA SEED-EX 2017:23
www.kth.se