Embed Size (px)
Citation preview
1
TO: CDM SMITH
FROM: BOB GEDERT, DAVID STEAD
DATE: FEBRUARY 27, 2018
RE: NASHVILLE STRATEGIES FOR PURSUING ZERO WASTE – ABOVE 75%
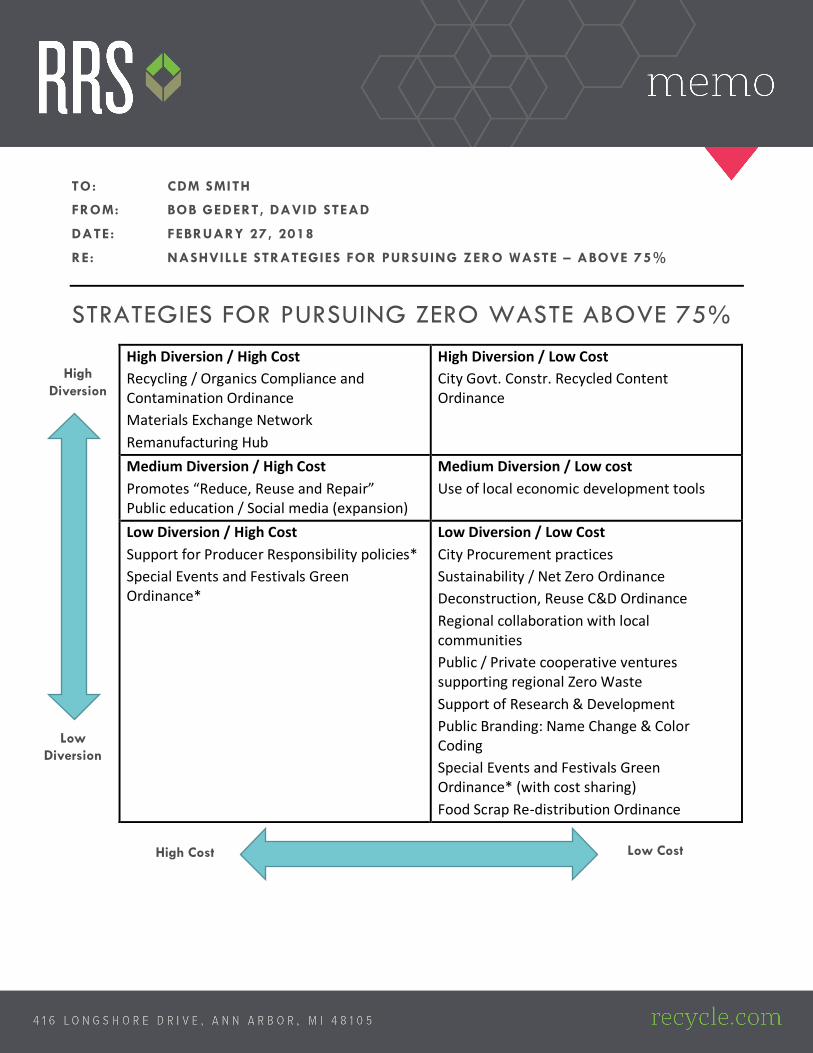
STRATEGIES FOR PURSUING ZERO WASTE ABOVE 75%
High Diversion / High Cost Recycling / Organics Compliance and Contamination Ordinance Materials Exchange Network Remanufacturing Hub
High Diversion / Low Cost City Govt. Constr. Recycled Content Ordinance
Medium Diversion / High Cost Promotes “Reduce, Reuse and Repair” Public education / Social media (expansion)
Medium Diversion / Low cost Use of local economic development tools
Low Diversion / High Cost Support for Producer Responsibility policies* Special Events and Festivals Green Ordinance*
Low Diversion / Low Cost City Procurement practices Sustainability / Net Zero Ordinance Deconstruction, Reuse C&D Ordinance Regional collaboration with local communities Public / Private cooperative ventures supporting regional Zero Waste Support of Research & Development Public Branding: Name Change & Color Coding Special Events and Festivals Green Ordinance* (with cost sharing) Food Scrap Re-distribution Ordinance
High Cost Low Cost
Low Diversion
High Diversion
Page 2 of 15
These high performance strategies are designed to be implemented to gain diversion above and beyond 75%. This list of strategies is in a menu format. If all strategies are chosen, and implemented with full success, in theory Nashville Metro will reach true Zero Waste with 90+% diversion. However, such a scenario may be unrealistic as it requires nearly 100% citizen participation, capturing of all available materials for diversion, and with full investment of government and private sector funds to pay for all the selected collection and processing programs.
More realistically, a priority selection process is necessary, utilizing public funds judicially to gain the most diversion through strategies that are embraced by the citizens. This process will require analysis of the potential diversion capacity of each strategy, the acceptance of the public, and the expense required to fully implement and maintain the selected diversion programs. The goal is to reach 90% diversion within a reasonable expense factor, and this strategy matrix will allow for a public discussion of the type of acceptance level for certain types of diversion requirements needed to reach high performance toward Zero Waste.
In addition, these strategies require legislative authority to adopt universal requirements in both the GSD and USD districts. The tonnage and diversion calculations are based on the assumption that all residents and businesses in both the USD and GSD are fully engaged and under the same requirements and regulations. This is essential to strive toward the stated Zero Waste goals.
If the adoption of universal requirements for both GSD and USD districts are not attained, the proposed city policies and programs could be implemented through a series of negotiated contracts with professional service providers. This may likely cause an uneven application of regulations city-wide, thereby reducing the estimated volumes of material collected toward the diversion goals.
This document assumes the adoption of universal city-wide application of policies across the GSD and USD districts. The following strategies are offered to gain diversion above and beyond 75%:
City Council Policies / Ordinances Ordinances and polices adopted by City Council that support local zero waste initiatives can create diversion of material from the landfill through the creation of new programs. These new programs will require city staffing and resource dedication.
Phase One Strategies (initiated 2019-2021):
1.1 City Procurement practices that support buying recycling content and minimizes waste 5 Action; Review and monitor all city purchasing practices and establish an Environmentally Preferable Product (EPP) procurement program on electronic purchases, office supplies, office furniture reuse and surplus disposition and policies. Additional procurement mandates as needed (e.g. use of 100% recycled content paper in all copiers) Financial Impact; One new position (Finance Specialist) $52,200 salary plus $26,100 benefits = $78,300 1, plus $50,000 annually in program expenses. 3 Low Diversion Impact; up to 10 tons per year diversion (waste reduction), negligible diversion impact 4
Page 3 of 15
1.2 Net Zero / Sustainability Ordinance 5 Action; Require city departments to prevent waste, maximize recycling, maximize energy and water efficiency, and appoint a Net Zero Coordinator to lead these efforts. This action integrates Zero Waste efforts with the larger city goal of sustainability and resiliency in reaction to climate change.. Require City departments to develop Resiliency Action Plans that encourage waste reduction and offer preparedness toward climate induced natural disaster situations. (e.g. alternative fuel vehicles, flexible work schedules, renewable energy sources, rain water gardens, convention center food waste composting, centralized recycling collection, etc.) Financial Impact; $0 new salaries, incorporate in existing department sustainability efforts2; coordinated by Finance Specialist noted above, plus $50,000 annually in program expenses. 3 Low Diversion Impact; up to 10 tons per year diversion (City department office recycling), negligible diversion impact 4
1.3 Regional collaboration with local communities toward regional Zero Waste support 6 Action; Develop and implement Interlocal agreements with adjoining communities to create a regional zero waste education effort in the greater Nashville media market and regional school systems. Coordinated social media messaging through local communities and schools. (In addition to existing school education program.) Financial Impact; $0 new salaries2, supported through existed department leadership and staff, plus $50,000 annually in program expenses. 3 Low Diversion Impact; 10 tons per year diversion, negligible diversion impact 4
1.4 City Government Construction Recycled Content Ordinance 7 Action; Develop recycled content requirements for materials to be used in public works and improvement projects. Develop engineered standards for beneficial reuse of glass, concrete, asphalt, and residual plastic in road and sidewalk projects. Develop requirements for use of compost materials on roadside side embankments and highway projects. Financial Impact; $0 new salaries2, incorporate in existing department sustainability efforts; coordinated by Finance Specialist noted above, plus $50,000 annually in program expenses. 3 Develop engineering specs through existing state and federal studies funded from EPA and DOT grants, and in collaboration with County Engineer Office. High Diversion Impact; 40,000 tons per year diversion, 2.39% diversion impact 4
1.5 Special Events and Festivals Green Ordinance 8 Action; Require all special events and festivals that currently require a city permit to achieve “green” sustainability standards such as providing recycling and organics collection, regulating vendor food service-ware and collateral, reducing litter, and other means to increase diversion toward making it a Zero Waste event. Create a recognition program to reward events that reach Zero Waste and showcase their success on the city website. Consider model programs such as Alameda County CA, City of LA, Seattle, Austin, NY City, and other major city event greening programs. Activity creates very high
Page 4 of 15
zero waste awareness that translates to better recycling habits at the home and office. (*Possible fee revenue to offset expenses) Financial Impact; Financial Impact; Six new positions (Program Specialist 1) $198,588 salary plus $99,294 benefits = $297,882 1, plus $150,000 annually in program expenses. 3 Low Diversion Impact; 100 tons per year diversion, negligible diversion impact 4
1.6 Food Scrap Capture and Re-distribution Ordinance 9
Action; Develop and implement an ordinance that supports a food rescue and donation program based on the research supported by the NRDC study Estimating Quantities And Types Of Food Waste At The City Level (2017). Establish a food rescue task force to research food waste in commercial restaurants, food caterers and home settings, and implement recommendations from the study. Some of the recommendations from NRDC include: Streamlining and disseminating City Health Department guidance on donating food safely, Training and engaging health inspectors to encourage food donation, Raising awareness among area businesses about food insecurity issues and the potential benefits of donating food, Providing grants and other assistance to increase food recovery infrastructure in the community, Provide education on issues of food waste, Provide tips for reducing food waste, Make it possible to buy food in smaller portions in stores and restaurants, especially for small households. Financial Impact; $0 new salaries, utilizing the Business Development Officer in coordination with business economic development activities 2, plus $50,000 annually in program expenses. 3 Low Diversion Impact; 100 tons per year diversion, negligible diversion impact 4
Phase Three Strategies (initiated 2024-2025):
3.3 Recycling / Organics Compliance and Contamination Ordinance 10 Action; Enforcement provisions regarding previous requirements for recycling and the collection of yard trimmings & food waste at all Single-Family, Multi-Family units, food prep businesses and restaurants, commercial buildings, and cafeterias serving food in office buildings. Develop rules for universal implementation (e.g Austin as model). Secure and monitor commercial composting contract and end markets for final material (e.g. city parks, private nurseries, road construction projects, etc.). Establish routine route monitoring of participation and contamination checks of recyclables and composting collection through all sector services (Single Family, Multi-Family, Commercial, Industrial, Institutional), including food waste collection at food prep businesses and restaurants, for the purpose of increasing diversion quantity, quality (reduced contamination), increasing recycling education, and increasing public awareness of Zero Waste. Inspect containers routinely, issue warnings and fines for violations, and provide education materials. Financial Impact; Financial Impact; Five (5) new positions (Env Compliance Officer 1) $196,810 salary plus $98,405 benefits = $295,215 1, plus $150,000 annually in program expenses. 3
Page 5 of 15
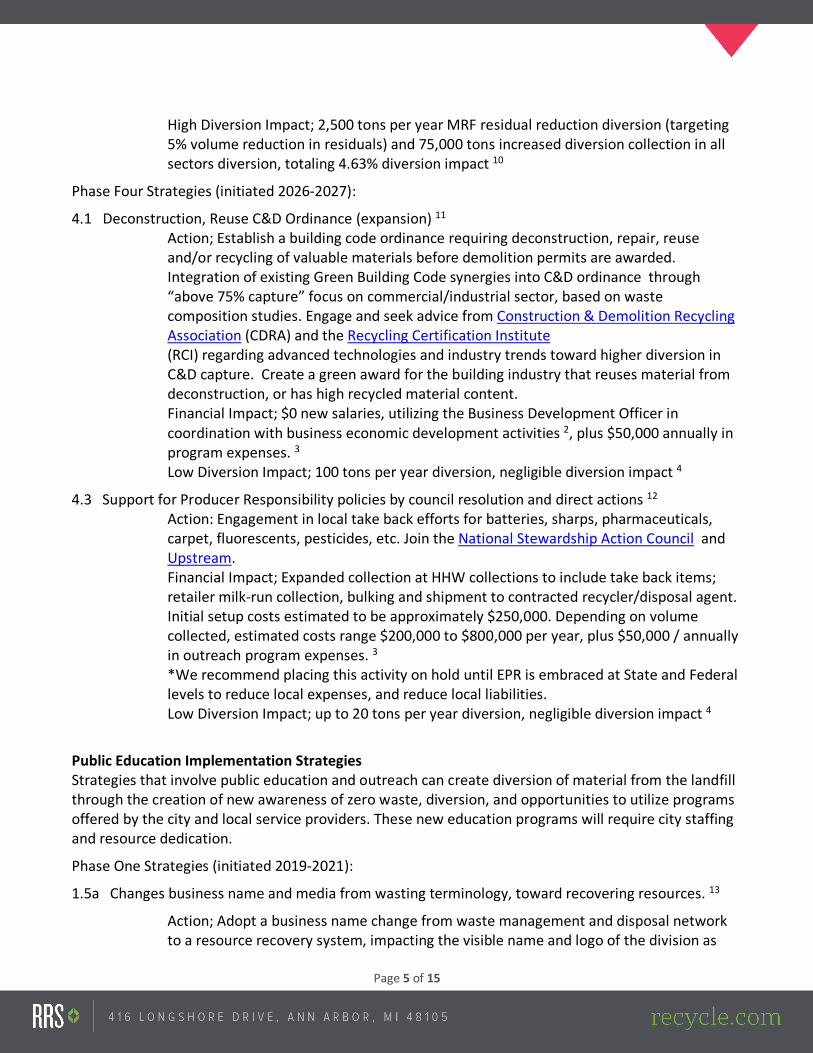
High Diversion Impact; 2,500 tons per year MRF residual reduction diversion (targeting 5% volume reduction in residuals) and 75,000 tons increased diversion collection in all sectors diversion, totaling 4.63% diversion impact 10
Phase Four Strategies (initiated 2026-2027):
4.1 Deconstruction, Reuse C&D Ordinance (expansion) 11 Action; Establish a building code ordinance requiring deconstruction, repair, reuse and/or recycling of valuable materials before demolition permits are awarded. Integration of existing Green Building Code synergies into C&D ordinance through “above 75% capture” focus on commercial/industrial sector, based on waste composition studies. Engage and seek advice from Construction & Demolition Recycling Association (CDRA) and the Recycling Certification Institute (RCI) regarding advanced technologies and industry trends toward higher diversion in C&D capture. Create a green award for the building industry that reuses material from deconstruction, or has high recycled material content. Financial Impact; $0 new salaries, utilizing the Business Development Officer in coordination with business economic development activities 2, plus $50,000 annually in program expenses. 3 Low Diversion Impact; 100 tons per year diversion, negligible diversion impact 4
4.3 Support for Producer Responsibility policies by council resolution and direct actions 12 Action: Engagement in local take back efforts for batteries, sharps, pharmaceuticals, carpet, fluorescents, pesticides, etc. Join the National Stewardship Action Council and Upstream. Financial Impact; Expanded collection at HHW collections to include take back items; retailer milk-run collection, bulking and shipment to contracted recycler/disposal agent. Initial setup costs estimated to be approximately $250,000. Depending on volume collected, estimated costs range $200,000 to $800,000 per year, plus $50,000 / annually in outreach program expenses. 3 *We recommend placing this activity on hold until EPR is embraced at State and Federal levels to reduce local expenses, and reduce local liabilities. Low Diversion Impact; up to 20 tons per year diversion, negligible diversion impact 4
Public Education Implementation Strategies Strategies that involve public education and outreach can create diversion of material from the landfill through the creation of new awareness of zero waste, diversion, and opportunities to utilize programs offered by the city and local service providers. These new education programs will require city staffing and resource dedication.
Phase One Strategies (initiated 2019-2021):
1.5a Changes business name and media from wasting terminology, toward recovering resources. 13
Action; Adopt a business name change from waste management and disposal network to a resource recovery system, impacting the visible name and logo of the division as
Page 6 of 15
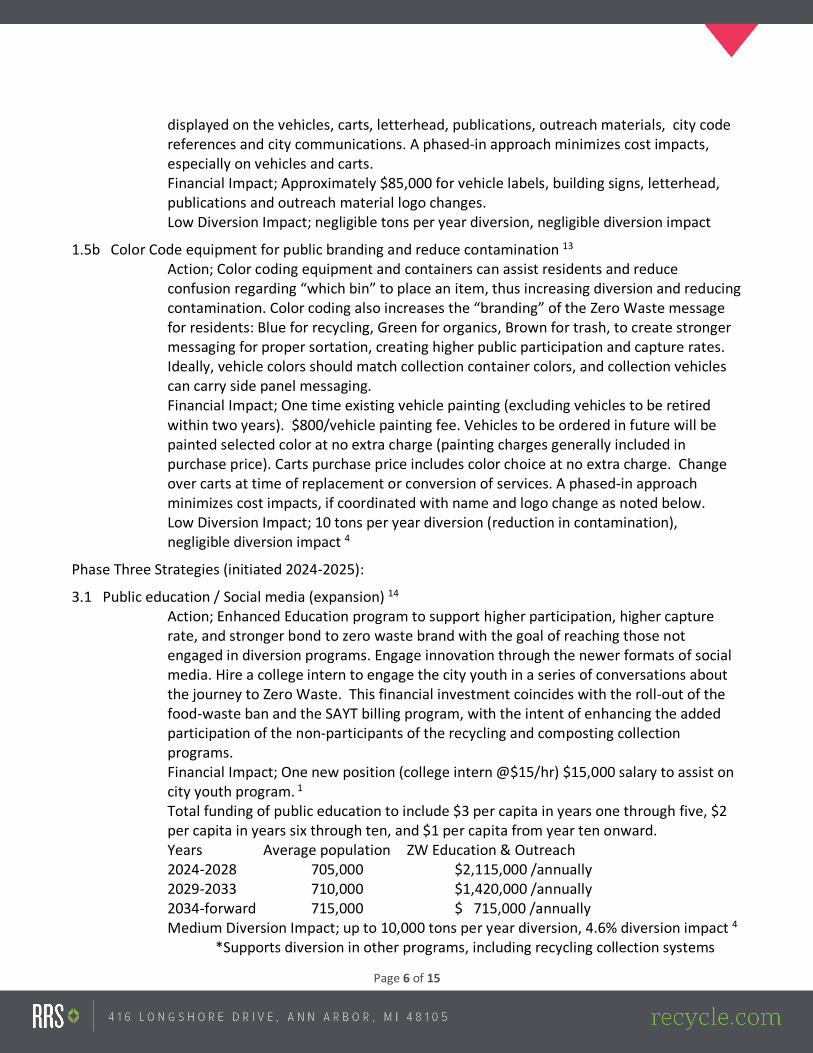
displayed on the vehicles, carts, letterhead, publications, outreach materials, city code references and city communications. A phased-in approach minimizes cost impacts, especially on vehicles and carts. Financial Impact; Approximately $85,000 for vehicle labels, building signs, letterhead, publications and outreach material logo changes. Low Diversion Impact; negligible tons per year diversion, negligible diversion impact
1.5b Color Code equipment for public branding and reduce contamination 13 Action; Color coding equipment and containers can assist residents and reduce confusion regarding “which bin” to place an item, thus increasing diversion and reducing contamination. Color coding also increases the “branding” of the Zero Waste message for residents: Blue for recycling, Green for organics, Brown for trash, to create stronger messaging for proper sortation, creating higher public participation and capture rates. Ideally, vehicle colors should match collection container colors, and collection vehicles can carry side panel messaging. Financial Impact; One time existing vehicle painting (excluding vehicles to be retired within two years). $800/vehicle painting fee. Vehicles to be ordered in future will be painted selected color at no extra charge (painting charges generally included in purchase price). Carts purchase price includes color choice at no extra charge. Change over carts at time of replacement or conversion of services. A phased-in approach minimizes cost impacts, if coordinated with name and logo change as noted below. Low Diversion Impact; 10 tons per year diversion (reduction in contamination), negligible diversion impact 4
Phase Three Strategies (initiated 2024-2025):
3.1 Public education / Social media (expansion) 14 Action; Enhanced Education program to support higher participation, higher capture rate, and stronger bond to zero waste brand with the goal of reaching those not engaged in diversion programs. Engage innovation through the newer formats of social media. Hire a college intern to engage the city youth in a series of conversations about the journey to Zero Waste. This financial investment coincides with the roll-out of the food-waste ban and the SAYT billing program, with the intent of enhancing the added participation of the non-participants of the recycling and composting collection programs. Financial Impact; One new position (college intern @$15/hr) $15,000 salary to assist on city youth program. 1 Total funding of public education to include $3 per capita in years one through five, $2 per capita in years six through ten, and $1 per capita from year ten onward. Years Average population ZW Education & Outreach 2024-2028 705,000 $2,115,000 /annually 2029-2033 710,000 $1,420,000 /annually 2034-forward 715,000 $ 715,000 /annually Medium Diversion Impact; up to 10,000 tons per year diversion, 4.6% diversion impact 4
*Supports diversion in other programs, including recycling collection systems
Page 7 of 15
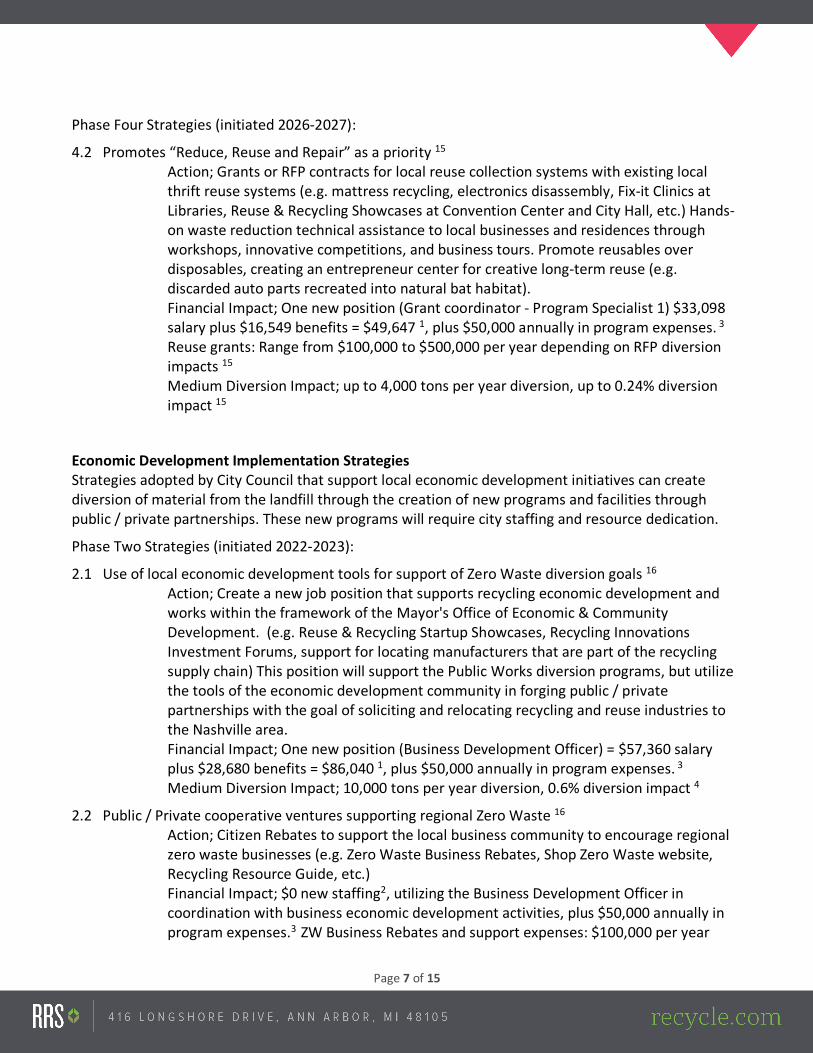
Phase Four Strategies (initiated 2026-2027):
4.2 Promotes “Reduce, Reuse and Repair” as a priority 15 Action; Grants or RFP contracts for local reuse collection systems with existing local thrift reuse systems (e.g. mattress recycling, electronics disassembly, Fix-it Clinics at Libraries, Reuse & Recycling Showcases at Convention Center and City Hall, etc.) Hands-on waste reduction technical assistance to local businesses and residences through workshops, innovative competitions, and business tours. Promote reusables over disposables, creating an entrepreneur center for creative long-term reuse (e.g. discarded auto parts recreated into natural bat habitat). Financial Impact; One new position (Grant coordinator - Program Specialist 1) $33,098 salary plus $16,549 benefits = $49,647 1, plus $50,000 annually in program expenses. 3 Reuse grants: Range from $100,000 to $500,000 per year depending on RFP diversion impacts 15 Medium Diversion Impact; up to 4,000 tons per year diversion, up to 0.24% diversion impact 15
Economic Development Implementation Strategies Strategies adopted by City Council that support local economic development initiatives can create diversion of material from the landfill through the creation of new programs and facilities through public / private partnerships. These new programs will require city staffing and resource dedication.
Phase Two Strategies (initiated 2022-2023):
2.1 Use of local economic development tools for support of Zero Waste diversion goals 16 Action; Create a new job position that supports recycling economic development and works within the framework of the Mayor's Office of Economic & Community Development. (e.g. Reuse & Recycling Startup Showcases, Recycling Innovations Investment Forums, support for locating manufacturers that are part of the recycling supply chain) This position will support the Public Works diversion programs, but utilize the tools of the economic development community in forging public / private partnerships with the goal of soliciting and relocating recycling and reuse industries to the Nashville area. Financial Impact; One new position (Business Development Officer) = $57,360 salary plus $28,680 benefits = $86,040 1, plus $50,000 annually in program expenses. 3 Medium Diversion Impact; 10,000 tons per year diversion, 0.6% diversion impact 4
2.2 Public / Private cooperative ventures supporting regional Zero Waste 16 Action; Citizen Rebates to support the local business community to encourage regional zero waste businesses (e.g. Zero Waste Business Rebates, Shop Zero Waste website, Recycling Resource Guide, etc.) Financial Impact; $0 new staffing2, utilizing the Business Development Officer in coordination with business economic development activities, plus $50,000 annually in program expenses.3 ZW Business Rebates and support expenses: $100,000 per year
Page 8 of 15
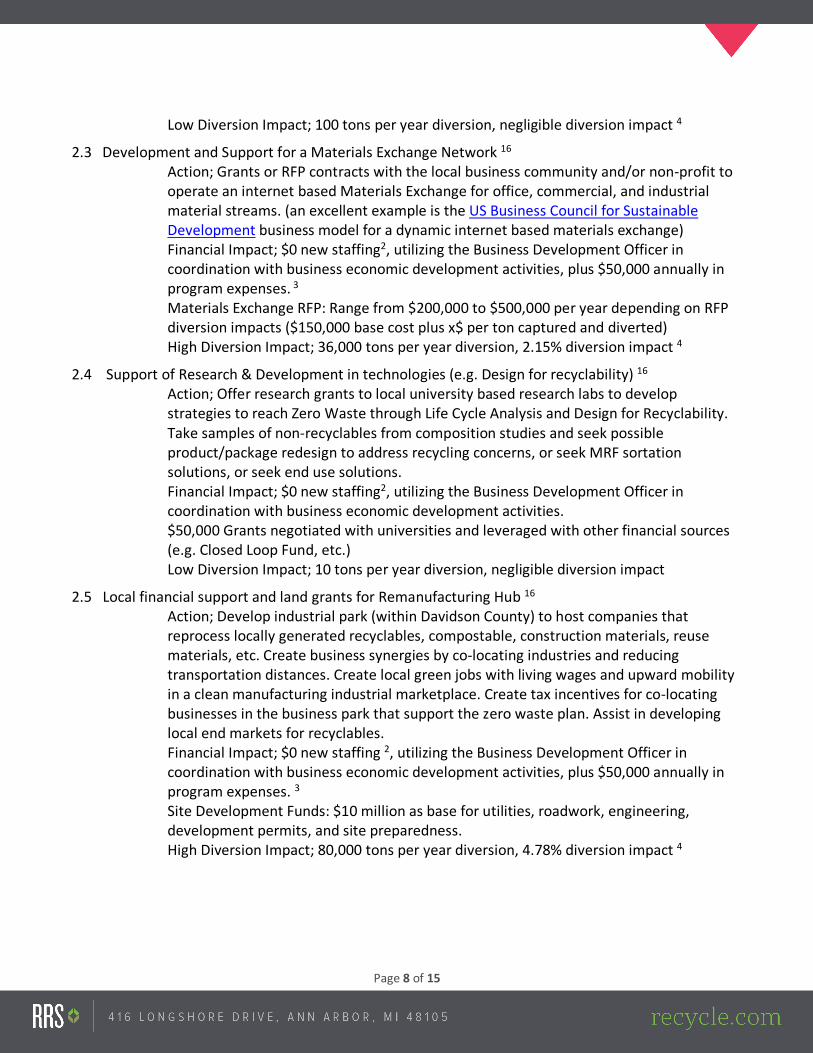
Low Diversion Impact; 100 tons per year diversion, negligible diversion impact 4
2.3 Development and Support for a Materials Exchange Network 16 Action; Grants or RFP contracts with the local business community and/or non-profit to operate an internet based Materials Exchange for office, commercial, and industrial material streams. (an excellent example is the US Business Council for Sustainable Development business model for a dynamic internet based materials exchange) Financial Impact; $0 new staffing2, utilizing the Business Development Officer in coordination with business economic development activities, plus $50,000 annually in program expenses. 3 Materials Exchange RFP: Range from $200,000 to $500,000 per year depending on RFP diversion impacts ($150,000 base cost plus x$ per ton captured and diverted) High Diversion Impact; 36,000 tons per year diversion, 2.15% diversion impact 4
2.4 Support of Research & Development in technologies (e.g. Design for recyclability) 16 Action; Offer research grants to local university based research labs to develop strategies to reach Zero Waste through Life Cycle Analysis and Design for Recyclability. Take samples of non-recyclables from composition studies and seek possible product/package redesign to address recycling concerns, or seek MRF sortation solutions, or seek end use solutions. Financial Impact; $0 new staffing2, utilizing the Business Development Officer in coordination with business economic development activities. $50,000 Grants negotiated with universities and leveraged with other financial sources (e.g. Closed Loop Fund, etc.) Low Diversion Impact; 10 tons per year diversion, negligible diversion impact
2.5 Local financial support and land grants for Remanufacturing Hub 16 Action; Develop industrial park (within Davidson County) to host companies that reprocess locally generated recyclables, compostable, construction materials, reuse materials, etc. Create business synergies by co-locating industries and reducing transportation distances. Create local green jobs with living wages and upward mobility in a clean manufacturing industrial marketplace. Create tax incentives for co-locating businesses in the business park that support the zero waste plan. Assist in developing local end markets for recyclables. Financial Impact; $0 new staffing 2, utilizing the Business Development Officer in coordination with business economic development activities, plus $50,000 annually in program expenses. 3 Site Development Funds: $10 million as base for utilities, roadwork, engineering, development permits, and site preparedness. High Diversion Impact; 80,000 tons per year diversion, 4.78% diversion impact 4
Page 9 of 15
Vision/Mission Strategies The vision and mission of an organization directs its staff and finances toward a pathway in support of its goals. If Zero Waste is the adopted Goal of the City through its sustainability efforts, then it must follow that the Department should adopt supporting vision and mission statements. In addition, the following strategies can also support the mission and vision of zero waste.
Phase one Strategies (initiated 2019-2021)
Practices Highest and Best Use Hierarchy Action; Adopt the Highest and Best Use Hierarchy and incorporate its principles in department practices and all collection programs.
Utilizes the Sustainable Materials Management (SMM) framework where applicable for the waste management sectors serviced
Action; Adopt the SMM model of managing materials generated and recovered for secondary reuse, recycling or compost.
Total Diversion from “Above 75% Strategies” offers approximately 257,970 tons diversion annually, creating 15.40% diversion assuming a total waste generation of 1.675 million tons. Combined with the strategies to reach the 75% level, these programs when fully implemented will offer 90% diversion.
Assumptions:
1. Salaries quoted are from Nashville and Davidson County HR Office, Classifications and Positions, effective July 1, 2017. Positions quoted assumed to be the most appropriate for the workload assignment. Benefits quoted are assumed to be 50% of salary, and include all retirement, SS, Medicare, and other city paid benefits.
2. Some programs share same staff leads, as noted in descriptions. 3. Program expenses, unless otherwise noted, include general office expenses, copying expenses,
postage, mailing expenses, parking fees, program brochure printing, and other annual program administrative expenses.
4. Diversion first measured by tons diverted, then divided by 1.6 million tons total generation as base. Assumes diversion activity will increase proportionally to generation tonnage increases, primarily due to population increases over time.
5. City Procurement and Sustainability/Net Zero practices requires City Council ordinances, new procurement policies, new staff position, and implementation of policies within city/county government. Modeled from the Indiana State Government Greening of the Government.
6. Regional collaboration assumes that local communities and school systems will join through inter-local agreements and cost-sharing agreements to create a unified central zero waste branding and messaging campaign. Assumes existing staff and minimal diversion impact, but augments the ZW branding efforts city-wide.
7. City Government Construction Recycled Content Ordinance incorporates city council ordnance and contract language that requires beneficial reuse and reporting through road construction contractors as well as public building contractors (e.g. fire and police stations, libraries).

Page 10 of 15
Tonnage diversion based on City of Austin road construction model. Sample contract language available.
8. Special Events and Festivals Green Ordinance assumes development of new city standards for special events with enforcement procedures on city permits, six new positions that offer technical assistance as well as enforcement to permit holders, and assumes distribution restrictions for event vendors. Diversion assumptions based zero waste collection programming at special events, modeled from Alameda County, LA County, City of San Antonio, City of Austin.
9. Food scrap capture and redistribution assumes cooperation and compliance with Health Department rules and regulations. Federal “Good Samaritan Rule” offers reduced liability to corporations offering food donations. USEPA food hierarchy and website as well as NRDC offers significant assistance.
10. Recycling/Composting Compliance and Contamination Ordinance assumes universal distribution and access, and through this ordinance requires usage, and fines for contamination. Also requires food waste collection at food prep and restaurants, and establishes inspections program. Assumes collection program moves from voluntary to mandatory usage, for purposes of increased diversion capture. Expenses related to mandatory inspections. Diversion estimates based on City of Austin program, scaled to Nashville household counts.
11. Deconstruction, Reuse C&D Ordinance assumes there is an existing C&D ordinance and existing C&D processing infrastructure. This ordinance is an expansion to capture deconstruction and reuse requirements. Assumes lower diversion yield than original ordinance, but captures “higher and best use” philosophy of zero waste through reuse and augments historical value of antique capture in deconstruction. Assumes existing staff and minimal startup costs and implementation costs. Assumes implementation overlaps existing regulations. Diversion is difficult to evaluate as it is case-by-case per deconstruction situation.
12. Producer Responsibility policies often are legislated at the state and national level (CA, MN, CT as models), however municipalities can lead with takeback programs through the expansion of their HHW collection networks (San Luis Obispo model). Costs estimates are noted in a wide range based on collection volumes and types of material collected. More research needed to better price out program.
13. Color Coding equipment and Changing Business Name for public branding assumes public confidence and practice is linked to the “color branding” of each commodity collected, as demonstrated through the City of Austin Zero Waste program, and modeled from modern business corporate advertising business practices. Assumption that with higher public confidence in the collection programs carries higher participation and capture rates, and reduced cross contamination rates through the use of color coding identification. Cost assumptions based on City of Austin phased in approach over five years.
14. Public Education / Social Media (expansion) based on assumption that increased effective education will increase public education and capture rates. Major Zero Waste cities (Oakland, San Francisco, Seattle, Austin) have demonstrated modeling of enhanced and innovative education and social media platforms. Assumption includes phasing high investment in first five years, and phasing down investment toward an annual maintenance level by year 10. Assumes best measure of investment is per capita spending, although some cities have explored per
Page 11 of 15
housing unit as a measure. Diversion impact based on City of Fresno discussions with CSUF Psychology Department regarding social persuasion impacts, and City of Austin staff research.
15. Promotes Reduce, Reuse and Repair assumes embracement of Highest and Best Use Hierarchy and funding availability for reuse and waste reduction systems. Modeled from Goodwill electronics disassembly program, SpringBack mattress recycling program, various city Fix-it Clinics, Austin Reuse & Recycling Showcases, Alameda County publications on waste reduction and reuse. Costs estimates are noted in a wide range based on collection volumes and types of material collected. More research needed to better price out program. Diversion estimate based on electronics and mattress collection.
16. Economic Development tools to support Zero Waste, including the Materials Exchange Network, Research & Development, Public/Private cooperative ventures, and Remanufacturing Hub, require coordination and support through the Mayor’s Office of Economic & Community Development, the hiring of a Business Development Officer, and strong financial support. Job growth and diversion calculations based on research performed by the City of Phoenix, the City of Austin, and the city of Edmonton.
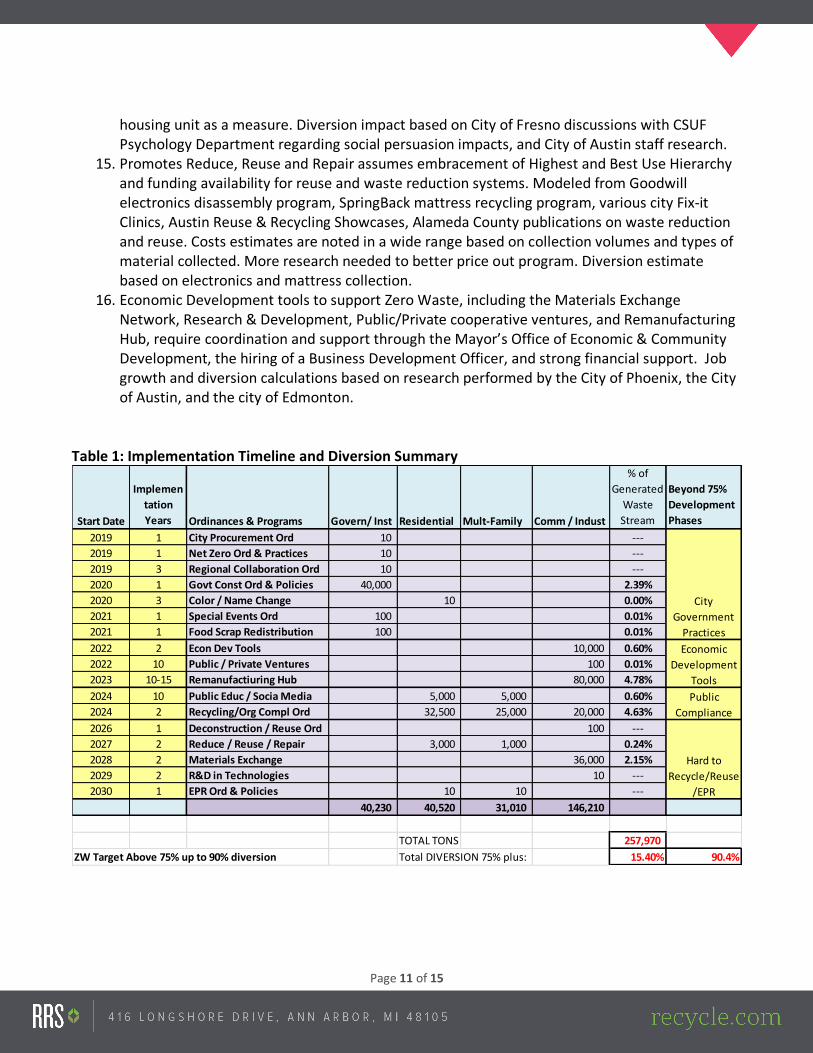
Table 1: Implementation Timeline and Diversion Summary
Start Date
Implementation Years Ordinances & Programs Govern/ Inst Residential Mult-Family Comm / Indust
% of Generated
Waste Stream
Beyond 75% Development Phases
2019 1 City Procurement Ord 10 ---2019 1 Net Zero Ord & Practices 10 ---2019 3 Regional Collaboration Ord 10 ---2020 1 Govt Const Ord & Policies 40,000 2.39%2020 3 Color / Name Change 10 0.00%2021 1 Special Events Ord 100 0.01%2021 1 Food Scrap Redistribution 100 0.01%2022 2 Econ Dev Tools 10,000 0.60%2022 10 Public / Private Ventures 100 0.01%2023 10-15 Remanufactiuring Hub 80,000 4.78%2024 10 Public Educ / Socia Media 5,000 5,000 0.60%2024 2 Recycling/Org Compl Ord 32,500 25,000 20,000 4.63%2026 1 Deconstruction / Reuse Ord 100 ---2027 2 Reduce / Reuse / Repair 3,000 1,000 0.24%2028 2 Materials Exchange 36,000 2.15%2029 2 R&D in Technologies 10 ---2030 1 EPR Ord & Policies 10 10 ---
40,230 40,520 31,010 146,210
TOTAL TONS 257,970 ZW Target Above 75% up to 90% diversion Total DIVERSION 75% plus: 15.40% 90.4%
City Government
PracticesEconomic
Development ToolsPublic
Compliance
Hard to Recycle/Reuse
/EPR
Page 12 of 15
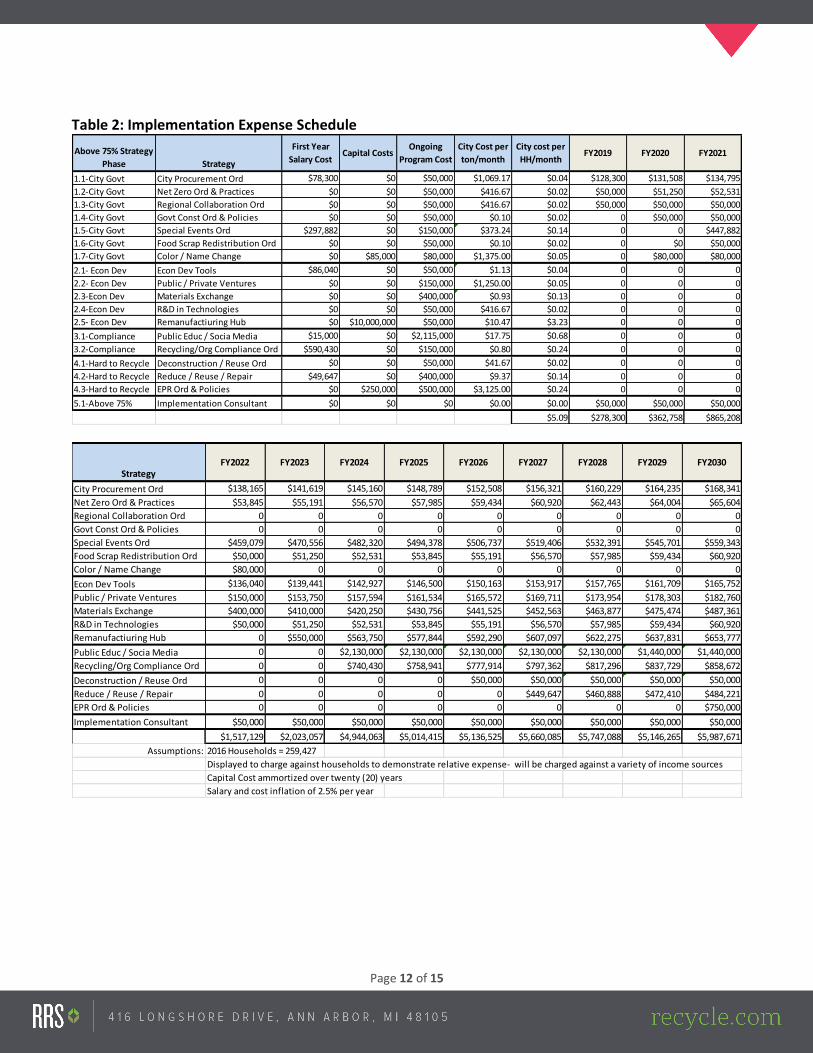
Table 2: Implementation Expense Schedule
Above 75% Strategy Phase Strategy
First Year Salary Cost
Capital CostsOngoing
Program Cost City Cost per ton/month
City cost per HH/month
FY2019 FY2020 FY2021
1.1-City Govt City Procurement Ord $78,300 $0 $50,000 $1,069.17 $0.04 $128,300 $131,508 $134,7951.2-City Govt Net Zero Ord & Practices $0 $0 $50,000 $416.67 $0.02 $50,000 $51,250 $52,5311.3-City Govt Regional Collaboration Ord $0 $0 $50,000 $416.67 $0.02 $50,000 $50,000 $50,0001.4-City Govt Govt Const Ord & Policies $0 $0 $50,000 $0.10 $0.02 0 $50,000 $50,0001.5-City Govt Special Events Ord $297,882 $0 $150,000 $373.24 $0.14 0 0 $447,8821.6-City Govt Food Scrap Redistribution Ord $0 $0 $50,000 $0.10 $0.02 0 $0 $50,0001.7-City Govt Color / Name Change $0 $85,000 $80,000 $1,375.00 $0.05 0 $80,000 $80,0002.1- Econ Dev Econ Dev Tools $86,040 $0 $50,000 $1.13 $0.04 0 0 02.2- Econ Dev Public / Private Ventures $0 $0 $150,000 $1,250.00 $0.05 0 0 02.3-Econ Dev Materials Exchange $0 $0 $400,000 $0.93 $0.13 0 0 02.4-Econ Dev R&D in Technologies $0 $0 $50,000 $416.67 $0.02 0 0 02.5- Econ Dev Remanufactiuring Hub $0 $10,000,000 $50,000 $10.47 $3.23 0 0 03.1-Compliance Public Educ / Socia Media $15,000 $0 $2,115,000 $17.75 $0.68 0 0 03.2-Compliance Recycling/Org Compliance Ord $590,430 $0 $150,000 $0.80 $0.24 0 0 04.1-Hard to Recycle Deconstruction / Reuse Ord $0 $0 $50,000 $41.67 $0.02 0 0 04.2-Hard to Recycle Reduce / Reuse / Repair $49,647 $0 $400,000 $9.37 $0.14 0 0 04.3-Hard to Recycle EPR Ord & Policies $0 $250,000 $500,000 $3,125.00 $0.24 0 0 05.1-Above 75% Implementation Consultant $0 $0 $0 $0.00 $0.00 $50,000 $50,000 $50,000
$5.09 $278,300 $362,758 $865,208
StrategyFY2022 FY2023 FY2024 FY2025 FY2026 FY2027 FY2028 FY2029 FY2030
City Procurement Ord $138,165 $141,619 $145,160 $148,789 $152,508 $156,321 $160,229 $164,235 $168,341Net Zero Ord & Practices $53,845 $55,191 $56,570 $57,985 $59,434 $60,920 $62,443 $64,004 $65,604Regional Collaboration Ord 0 0 0 0 0 0 0 0 0Govt Const Ord & Policies 0 0 0 0 0 0 0 0 0Special Events Ord $459,079 $470,556 $482,320 $494,378 $506,737 $519,406 $532,391 $545,701 $559,343Food Scrap Redistribution Ord $50,000 $51,250 $52,531 $53,845 $55,191 $56,570 $57,985 $59,434 $60,920Color / Name Change $80,000 0 0 0 0 0 0 0 0Econ Dev Tools $136,040 $139,441 $142,927 $146,500 $150,163 $153,917 $157,765 $161,709 $165,752Public / Private Ventures $150,000 $153,750 $157,594 $161,534 $165,572 $169,711 $173,954 $178,303 $182,760Materials Exchange $400,000 $410,000 $420,250 $430,756 $441,525 $452,563 $463,877 $475,474 $487,361R&D in Technologies $50,000 $51,250 $52,531 $53,845 $55,191 $56,570 $57,985 $59,434 $60,920Remanufactiuring Hub 0 $550,000 $563,750 $577,844 $592,290 $607,097 $622,275 $637,831 $653,777Public Educ / Socia Media 0 0 $2,130,000 $2,130,000 $2,130,000 $2,130,000 $2,130,000 $1,440,000 $1,440,000Recycling/Org Compliance Ord 0 0 $740,430 $758,941 $777,914 $797,362 $817,296 $837,729 $858,672Deconstruction / Reuse Ord 0 0 0 0 $50,000 $50,000 $50,000 $50,000 $50,000Reduce / Reuse / Repair 0 0 0 0 0 $449,647 $460,888 $472,410 $484,221EPR Ord & Policies 0 0 0 0 0 0 0 0 $750,000Implementation Consultant $50,000 $50,000 $50,000 $50,000 $50,000 $50,000 $50,000 $50,000 $50,000
$1,517,129 $2,023,057 $4,944,063 $5,014,415 $5,136,525 $5,660,085 $5,747,088 $5,146,265 $5,987,671Assumptions: 2016 Households = 259,427
Displayed to charge against households to demonstrate relative expense- will be charged against a variety of income sourcesCapital Cost ammortized over twenty (20) yearsSalary and cost inflation of 2.5% per year
Page 13 of 15
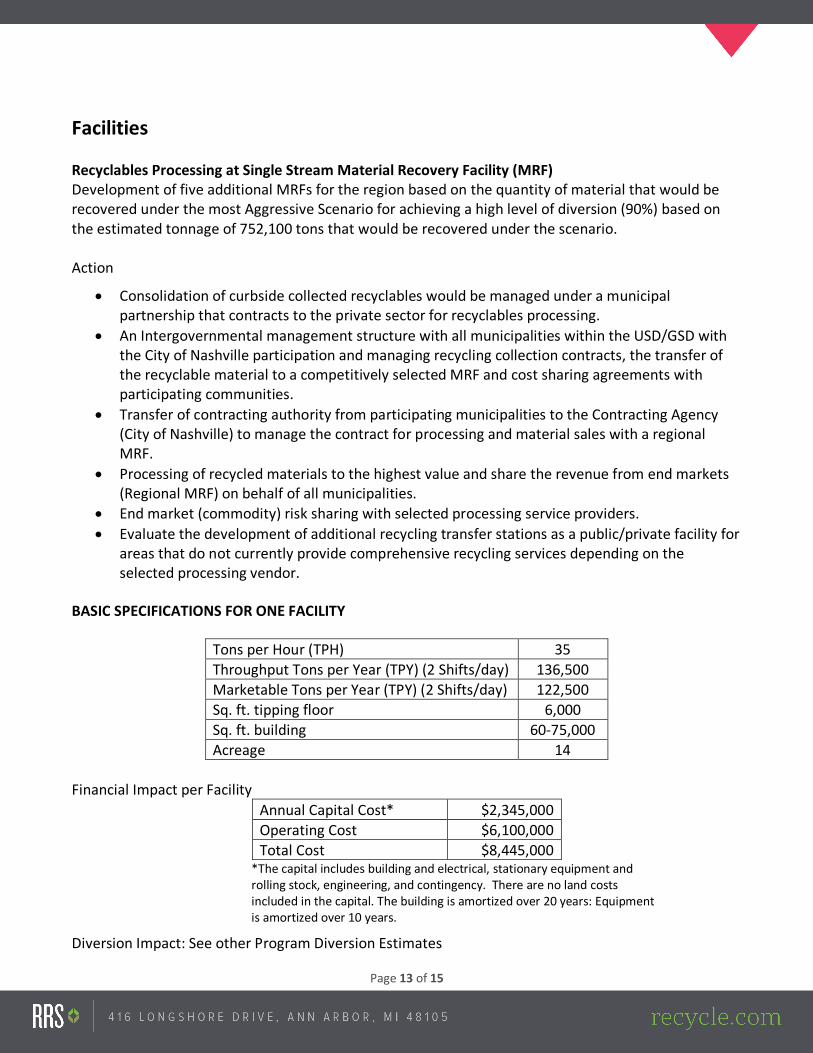
Facilities Recyclables Processing at Single Stream Material Recovery Facility (MRF) Development of five additional MRFs for the region based on the quantity of material that would be recovered under the most Aggressive Scenario for achieving a high level of diversion (90%) based on the estimated tonnage of 752,100 tons that would be recovered under the scenario. Action
• Consolidation of curbside collected recyclables would be managed under a municipal partnership that contracts to the private sector for recyclables processing.
• An Intergovernmental management structure with all municipalities within the USD/GSD with the City of Nashville participation and managing recycling collection contracts, the transfer of the recyclable material to a competitively selected MRF and cost sharing agreements with participating communities.
• Transfer of contracting authority from participating municipalities to the Contracting Agency (City of Nashville) to manage the contract for processing and material sales with a regional MRF.
• Processing of recycled materials to the highest value and share the revenue from end markets (Regional MRF) on behalf of all municipalities.
• End market (commodity) risk sharing with selected processing service providers. • Evaluate the development of additional recycling transfer stations as a public/private facility for
areas that do not currently provide comprehensive recycling services depending on the selected processing vendor.
BASIC SPECIFICATIONS FOR ONE FACILITY
Tons per Hour (TPH) 35 Throughput Tons per Year (TPY) (2 Shifts/day) 136,500 Marketable Tons per Year (TPY) (2 Shifts/day) 122,500 Sq. ft. tipping floor 6,000 Sq. ft. building 60-75,000 Acreage 14
Financial Impact per Facility
Annual Capital Cost* $2,345,000 Operating Cost $6,100,000 Total Cost $8,445,000
*The capital includes building and electrical, stationary equipment and rolling stock, engineering, and contingency. There are no land costs included in the capital. The building is amortized over 20 years: Equipment is amortized over 10 years.
Diversion Impact: See other Program Diversion Estimates
Page 14 of 15
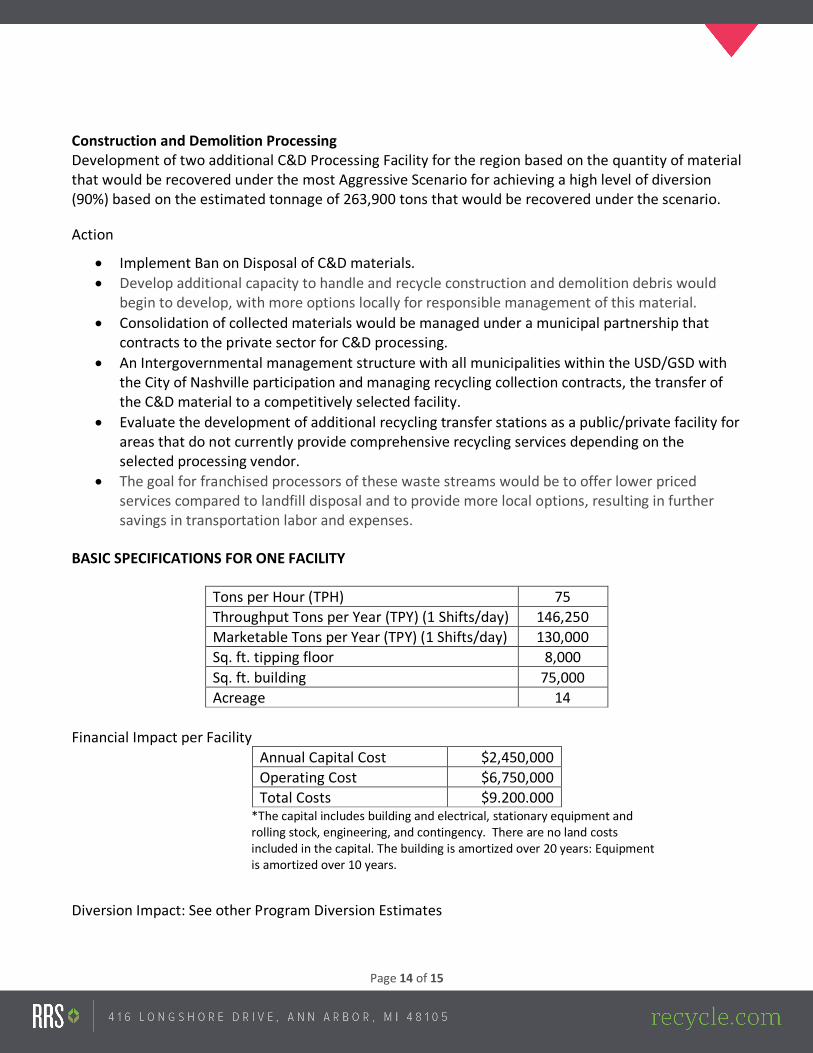
Construction and Demolition Processing Development of two additional C&D Processing Facility for the region based on the quantity of material that would be recovered under the most Aggressive Scenario for achieving a high level of diversion (90%) based on the estimated tonnage of 263,900 tons that would be recovered under the scenario. Action
• Implement Ban on Disposal of C&D materials. • Develop additional capacity to handle and recycle construction and demolition debris would
begin to develop, with more options locally for responsible management of this material. • Consolidation of collected materials would be managed under a municipal partnership that
contracts to the private sector for C&D processing. • An Intergovernmental management structure with all municipalities within the USD/GSD with
the City of Nashville participation and managing recycling collection contracts, the transfer of the C&D material to a competitively selected facility.
• Evaluate the development of additional recycling transfer stations as a public/private facility for areas that do not currently provide comprehensive recycling services depending on the selected processing vendor.
• The goal for franchised processors of these waste streams would be to offer lower priced services compared to landfill disposal and to provide more local options, resulting in further savings in transportation labor and expenses.
BASIC SPECIFICATIONS FOR ONE FACILITY
Tons per Hour (TPH) 75 Throughput Tons per Year (TPY) (1 Shifts/day) 146,250 Marketable Tons per Year (TPY) (1 Shifts/day) 130,000 Sq. ft. tipping floor 8,000 Sq. ft. building 75,000 Acreage 14
Financial Impact per Facility
Annual Capital Cost $2,450,000 Operating Cost $6,750,000 Total Costs $9.200.000
*The capital includes building and electrical, stationary equipment and rolling stock, engineering, and contingency. There are no land costs included in the capital. The building is amortized over 20 years: Equipment is amortized over 10 years.
Diversion Impact: See other Program Diversion Estimates
Page 15 of 15
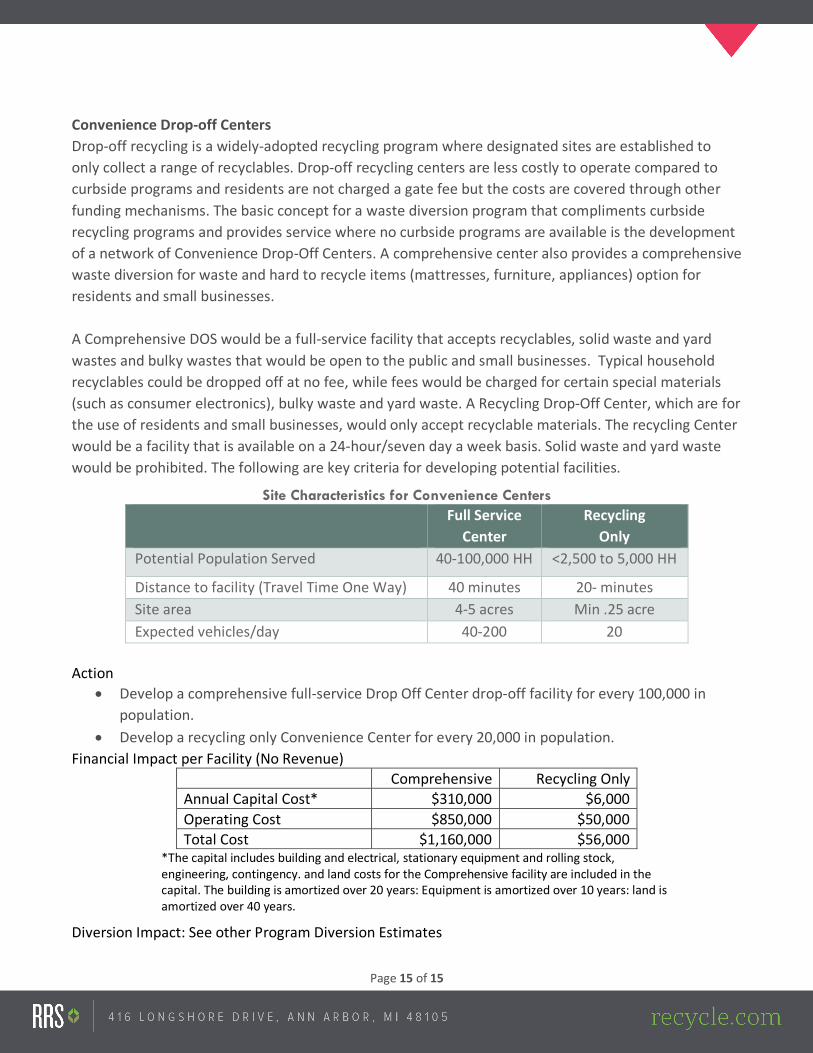
Convenience Drop-off Centers Drop-off recycling is a widely-adopted recycling program where designated sites are established to only collect a range of recyclables. Drop-off recycling centers are less costly to operate compared to curbside programs and residents are not charged a gate fee but the costs are covered through other funding mechanisms. The basic concept for a waste diversion program that compliments curbside recycling programs and provides service where no curbside programs are available is the development of a network of Convenience Drop-Off Centers. A comprehensive center also provides a comprehensive waste diversion for waste and hard to recycle items (mattresses, furniture, appliances) option for residents and small businesses. A Comprehensive DOS would be a full-service facility that accepts recyclables, solid waste and yard wastes and bulky wastes that would be open to the public and small businesses. Typical household recyclables could be dropped off at no fee, while fees would be charged for certain special materials (such as consumer electronics), bulky waste and yard waste. A Recycling Drop-Off Center, which are for the use of residents and small businesses, would only accept recyclable materials. The recycling Center would be a facility that is available on a 24-hour/seven day a week basis. Solid waste and yard waste would be prohibited. The following are key criteria for developing potential facilities.
Site Characteristics for Convenience Centers
Full Service Center
Recycling Only
Potential Population Served 40-100,000 HH <2,500 to 5,000 HH
Distance to facility (Travel Time One Way) 40 minutes 20- minutes Site area 4-5 acres Min .25 acre Expected vehicles/day 40-200 20
Action
• Develop a comprehensive full-service Drop Off Center drop-off facility for every 100,000 in population.
• Develop a recycling only Convenience Center for every 20,000 in population. Financial Impact per Facility (No Revenue)
Comprehensive Recycling Only Annual Capital Cost* $310,000 $6,000 Operating Cost $850,000 $50,000 Total Cost $1,160,000 $56,000
*The capital includes building and electrical, stationary equipment and rolling stock, engineering, contingency. and land costs for the Comprehensive facility are included in the capital. The building is amortized over 20 years: Equipment is amortized over 10 years: land is amortized over 40 years.
Diversion Impact: See other Program Diversion Estimates