Embed Size (px)
Citation preview

Laura Cervera Garcia
Francesc Gòdia CasablancasM. Mercedes Segura
Directores
Tesis doctoral
Departament de Química
Strategies for improving production levels of HIV-1 VLPs by transient
transfection of HEK 293 suspension cultures

Abstract

Virus-like particles (VLPs) offer great potential as candidates for new vaccine
production. In this work, the development and optimization of an HIV-1 Gag VLP
production protocol by transient gene expression in HEK 293 suspension cultures is
presented. Transient transfection enables a rapid generation of recombinant proteins of
sufficient quantity and quality to perform pre-clinical trials, and it is particularly
interesting in the early development phases. This work is divided in four main chapters.
In the first chapter, the serum-free commercial medium Freestyle 293 is optimized using
non-animal derived components as supplements. The use of chemically defined animal
derived component free media and supplements is a basic requirement for any further
use of a vaccine for humans. The maximum cell density attained using the optimized
medium (supplemented with 0.9X of Lipid mixture, 19.8 mg/L of r-insulin and 1.6
mg/L of r- transferrin) was 5.4 × 10⁶ cells/mL in batch mode, almost double of that
observed using the unsupplemented medium (2.9×10⁶ cells/mL). Moreover, after the
medium optimization, the transfection protocol is also improved. Best production
performance is attained when cells were transfected at mid-log phase (2–3 × 10⁶
cells/mL) with medium exchange at the time of transfection using 1 μg/(mL of culture)
of plasmid DNA and 2 μg/(mL of culture) of polyethylenimine. By using this protocol,
VLP titers are increased 2.4-fold, obtaining 2.7 × 10⁹ VLPs/mL. The optimized medium
and transfection protocol defined in this chapter are used in the rest of the work.
In chapter two, the kinetics of the transient transfection process is studied with the aim
to characterize and understand the complete process at intracellular level leading to the
VLP production, and to determine important time points to drive process improvement.
Polyplexes start to interact with the cell membrane just after addition to the culture.

After 1.5 hpt complexes are detected in the cytoplasm of the cells and reach the nucleus
around 4 hours post transfection. After 10 hours post transfection GFP fluorescence is
detected inside the cells, but generalized budding of VLPs from the cells is not observed
until 48 hours post transfection. The optimal harvest time is determined as 72 hpt as
VLP production is highest while high viability of the culture is maintained.
In chapter three, the enhancement of VLP production using specific compounds is
studied. Two main groups of transfection enhancers are tested, selected on the basis that
they can either facilitate the entry of PEI/DNA transfection complexes into the cell or
nucleus or they can increase the levels of gene expression. Among the eight
transfection-enhancers tested (Trichostatin A, Valproic acid, Sodium Butyrate, DMSO,
Lithium Acetate, Caffeine, Hydroxiurea and Nocodazole) an optimal combination of
compounds exhibiting the greatest effect on gene expression is subsequently identified.
The addition of 20 mM Lithium Acetate, 3.36 mM of Valproic Acid and 5.04 mM of
Caffeine increases production levels by 4 fold, while maintaining cell culture viability at
94 %.
As transient gene expression (TGE) is based on episomal plasmid DNA expression,
conventional TGE is limited to a short production period of usually about 96 h,
therefore limiting productivity. In chapter four, a novel gene expression approach
termed extended gene expression (EGE) is proposed. The aim of EGE is to prolong the
production period by the combination of medium exchange and repeated transfection of
cell culture with plasmid DNA to improve overall protein production. The benefit of
this methodology is evaluated for the production of three model recombinant products:
intracellular GFP, secreted GFP, and a Gag-GFP virus-like particle (VLP). Using this

novel EGE strategy, the production period is prolonged between 192 and 240 h with a
4–12-fold increase in production levels, depending on the product type considered.


Introduction


1. Vaccines
1.1 Vaccine history and the impact of vaccination
Vaccination has been without a doubt one of the greatest medical interventions in
human history. The origins of vaccination date back to 1796, when Edward Jenner
observed that milkmaids who were exposed to cowpox developed a mild form of variola
but were immune to smallpox. Dr. Jenner decided to inoculate an 8-year old boy with
the fluid of a cowpox blister from a milkmaid and later challenged him with smallpox
demonstrating that this treatment which was called vaccination provided the boy
protection against deadly variola virus (Hilleman, 2000). In the nineteenth century,
vaccination became a cause of national prestige and the first vaccination laws were
passed. The development of vaccines reached its golden age during the twentieth
century with the implementation and widespread use of many successful vaccines. As a
result, smallpox has been eradicated and many other infectious diseases that have
threatened humanity for centuries have virtually disappeared (Ulmer et al., 2006) (Table
1). Today vaccines are used for nearly thirty out of more than seventy known human
infectious diseases.
Disease 20th century annual morbidity* 2010 reported cases** %
Decrease Smallpox 29,500 0 100%
Dipheteria 21,053 0 100% Pertussis 200,752 21,291 89% Tetanus 580 8 99%
Polio (paralytic) 16,316 0 100% Measles 530,217 61 <99% Mumps 162,344 2,528 98% Rubella 47,745 6 <99%
CRS 152 0 100% H.Influenzae b 20,000 270 99%
*(Roush and Murphy, 2007) ** CDC. MMWR January 7, , 2011;59(52);1704-1716

1.2 Types of vaccines
Vaccination is the administration of a biological preparation that helps the body fighting
infectious pathogens. A vaccine typically contains an agent (generally known as
antigen) that resembles the structure of the pathogen the vaccine is intended for. The
agent acts as bait that is recognized as foreign by the recipient´s immune system and
attacked. This first encounter between the agent and the immune system generates
“memory” and allows, upon a second encounter, a fast and effective immune response
that quickly eliminates the pathogen. The better the vaccine mimics the natural infection
the more effective it will be.
In addition to preventive vaccines, there are also therapeutic vaccines. These are
vaccines that are designed to treat people who already have a disease. Some scientists
prefer to refer to therapeutic vaccines as “therapeutic immunogens.” Currently, there is
only one FDA-approved therapeutic vaccine for advanced prostate cancer in men
(Cheever and Higano, 2011).
The great majority of vaccines available today are based on laboratory grown
microorganisms (Table 2). Live-attenuated vaccines are obtained by selecting a
weakened mutated version of a wild-type microorganism (Ulmer et al., 2006). These
vaccines are very efficient at inducing a potent immune response (both humoral and
cellular) since they mimic very well the natural infection and typically require only a
single dose. However, due to their ability to replicate in the host (although limited) they
may induce adverse reactions particularly in immunosuppressed hosts. In addition, it is
not always possible to identify a sufficiently attenuated strain and there is a minor but
realistic risk of reversion to a virulent strain, which precludes the use of these vaccines
for life-threatening infections (Mäkelä, 2000). Inactivated vaccines represent a step
forward towards safety since the microorganism is killed, typically by a chemical

treatment, at the end of the production process (Plotkin, 2014; Ulmer et al., 2006).
Unfortunately, the latter may result in the loss of fidelity of the antigens. Besides, due to
the nature of the vaccine, cellular immunity is not effectively induced (Mäkelä, 2000).
Overall, these vaccines are less immunogenic than the live-attenuated vaccines and need
to be administered in several doses along with adjuvants. A third type of vaccine that is
widely used consists in purified subunits of the pathogen such as toxoids,
polysaccharides or proteins (Mäkelä, 2000; Plotkin, 2014; Ulmer et al., 2006). These
protective antigens are purified from the whole organisms after their amplification.
Even though this type of vaccine is very safe, it is usually the least immunogenic
requiring higher amounts of antigen and a greater number of doses to attain the same
level of protection.
There is a continuous need for new vaccines, not only to prevent diseases for which
vaccines are still not available, but also to improve the potency, quality and safety of the
existing ones. As opposed to the conventional vaccines described above, nowadays the
trend is to evolve towards recombinant vaccines benefiting from advances in
recombinant DNA technology. This avoids the risks related to the manipulation of
infectious pathogens in the laboratory making them a safer and more attractive option
for vaccine manufacturers. Furthermore, the vaccine is generated under more controlled
conditions and thus, better characterized.
Among the most promising new generation vaccines are recombinant subunit vaccines,
DNA vaccines, viral vectors and virus-like particles (Table 2). Recombinant subunit
vaccines, even though produced under safer and more controlled conditions, present the
same limitations as already described for purified subunits in terms of immunogenicity

(Ulmer et al., 2006). Other modern but still highly experimental approaches are DNA
vaccines and viral vectors. Both of these strategies, also termed gene-based strategies,
rely on the patient’s own cellular machinery to produce the antigens in vivo following
the introduction of foreign genes coding for such antigens into the cells. The main
difference resides in the way DNA is delivered. Plasmid DNA delivery needs to be
forced by physical methods to give rise to acceptable antigen expression levels;
whereas, viral vectors use their own sophisticated delivery machinery that has improved
throughout the course of evolution to efficiently introduce their genetic payload into
cells. As a result, viral vector vaccines tend to induce a stronger immune response than
do DNA vaccines (Donnelly et al., 1997). From the manufacturing point of view, DNA
vaccines are very simple to produce using bacterial cultures, and since DNA is stable,
the transport and storage of the final product is easy and low cost (Donnelly et al.,
1997). On the other hand, viral vector manufacturing is far more challenging as
producer cell lines, vector design, stability, production, purification and characterization
techniques need to be established on a per case basis (Bråve et al., 2007; Draper et al.,
2008).
The concept of VLPs derives from the finding of subviral particles in the blood of
patients with Hepatitis B (HBV) in the 1980’s. When administered to healthy
individuals, these plasma-derived subviral particles provided protection against HBV
giving rise to the first VLP-based vaccine (Lua et al., 2014; Roldão et al., 2010). This
vaccine was later replaced by a safer recombinant version. The success of this vaccine
motivated further research on VLP vaccines over the past twenty years. As a result, a
vaccine for Human Papilloma virus is licensed today for human use and many more
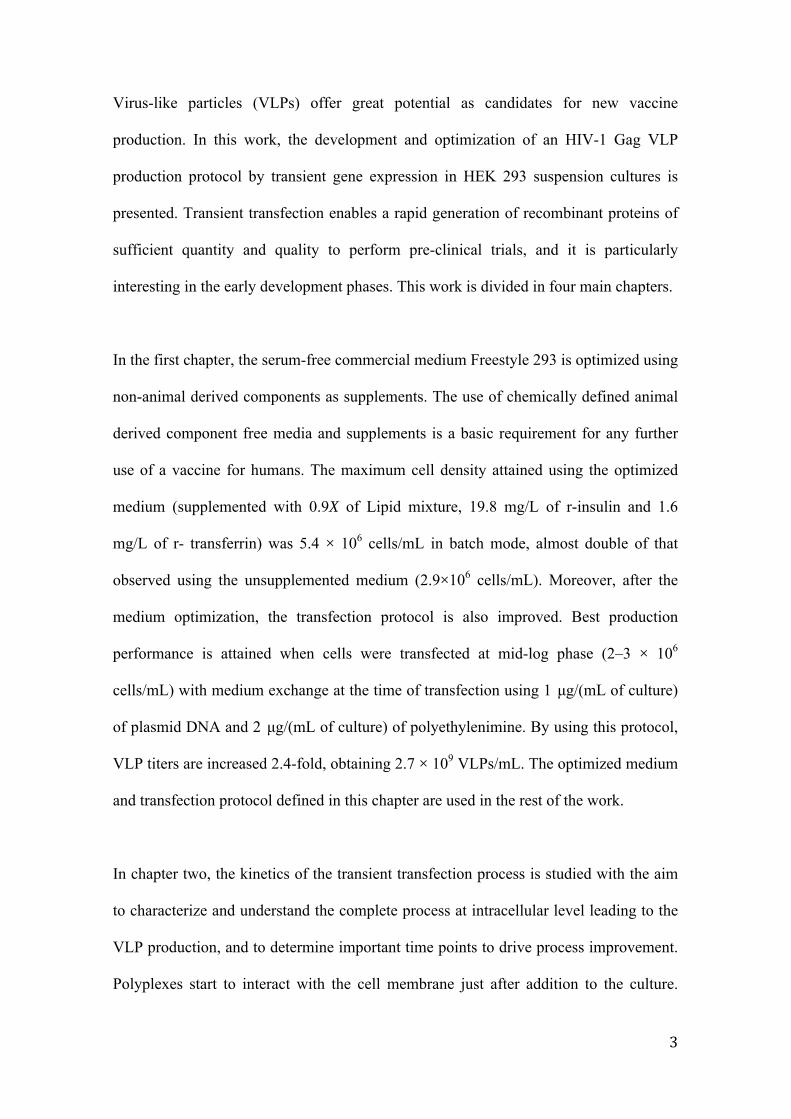
preventive VLP vaccines are in advanced clinical trials (Roldão et al., 2010). Virus-like
particles are self-assembled particles that mimic the virus structure. However, they do
not contain the virus genome and are thus non-infective virus particles. Due to their
repetitive organized structure and particulate nature, they are very efficiently uptaken by
antigen-presenting cells giving rise to a potent immune response with stimulation of
both arms of the immune system: humoral and cellular. The latter is often not achieved
using conventional vaccines and is essential to combat chronic infections and diseases
(Berzofsky et al., 2004). These unique VLP properties make them appealing in many
aspects as an alternative to the existing vaccines and are therefore the subject of
intensive research and represent an advanced vaccine technology platform (Grgacic and
Anderson, 2006; Ludwig and Wagner, 2007; Noad and Roy, 2003).

1.3 Types of virus-like particles
VLPs are composed of one or more recombinantly produced structural viral proteins,
which upon expression self-assembles into particles. The simplest VLP structure is
represented by a non-enveloped single protein particle such as the HPV. In this case, the
expression of a single major capsid protein (L1) is sufficient to generate the VLP
(Kirnbauer et al., 1992). However, in other cases production of VLP is not so
straightforward. For instance, members of the Reoviridae family (i.e. rotavirus) are
Vaccine type Selected disease target Live attenuated viruses Smallpox
Yellow fever Tuberculosis Polio Chickenpox Rotavirus Influenza Measles Mumps Rubella Varicella
Inactivated viruses Polio Influenza Typhoid fever Plague Rabies Whooping cough Hepatitis A
Purified subunit Diphteria (toxoid) Pneumococcus (toxoid) Meningococcus Tetanus Haemophilus influenzae B Pertussis Anthrax
Recombinant subunit Borrelia burgdorferi (recombinant Osp A) Viral vectors Under evaluation in clinical trials DNA Vaccine Under evaluation in clinical trials
(some veterinary vaccines licenced) Virus-like particles Hepatitis B
HPV

formed by a viral capsid made up of concentric interacting layers of different capsid
proteins (O’Neal et al., 1997). Assembly of multilayered, multiprotein VLPs can be
achieved by co-expression of 2 to 4 capsid proteins (depending on the virus) either from
multiple genes or a single gene coding for a polyprotein. VLPs for viruses with a lipid
envelope such as Influenza and HIV-1 represent a more complex structure to produce
(Roy and Noad, 2008). In this case the choice of the producer cell line is crucial.
Indeed, enveloped VLPs bud from host cells incorporating in their structure part of the
host cell membrane including anchored cellular components. The budding efficiency
may vary depending on the producer cell system used (mammalian, insect, yeast, etc)
and this will determine the quantity of VLPs produced, if any (Doan et al., 2005). Aside
from the simple VLPs described above, that imitate the structure of the corresponding
virus the vaccine is intended for, VLPs can be used as carriers to present foreign
epitopes to the immune system to either vaccinate against completely unrelated
pathogens or treat chronic diseases such as cancer (Deml et al., 2005). Carrier VLPs are
generated through modification of the VLP capsid gene sequence to form a fusion
protein or by chemically conjugating foreign epitopes to pre-formed VLPs. Of note, the
generation of carrier chimeric VLP based on non-enveloped viruses may be problematic
as the fused peptide may interfere with particle self-assembly, the length of the fused
antigen is typically restricted and folding of the introduced antigen inside the capsid
structure may render it inaccessible to the immune system. Although little has been
published, the generation of carrier VLPs based on an enveloped virus model may be a
more interesting vaccine platform.

2. HIV
The human immunodeficiency virus (HIV) infects cells of the immune system such as
helper T-cells (CD4+), macrophages and dendritic cells. The viral infection leads to a
severe reduction of CD4+ T-cells provoking that the cell-mediated immune response is
compromised in the infected individuals, leading to the development of the acquired
immunodeficiency syndrome (AIDS) (Douek et al., 2009).
HIV is a lentivirus, member of the family of Retroviridae. Two types of HIV virus have
been differentiated: HIV-1 and HIV-2. HIV-1 is highly infective and is globally spread
while HIV-2 is less infective, virulent, transmissible and restricted to West Africa
(Girard et al., 2006). HIV-1 can be divided into three groups: major (M), outlier (O) and
non-M non-O (N). The majority of HIV-1 belongs to group M. This group has evolved
into 10 genetic subtypes and 13 circulating recombinant forms (CRF). HIV is an
enveloped virus with a positive stranded RNA genome that is converted to double-
stranded DNA and integrates into the host genome. The viral RNA consists of 9 genes
(gag, pol, env, tat, rev, nef, vif, vpr and vpu) encoding 15 proteins (Young et al., 2006).
Gag, pol and env encode essential proteins for the generation of new viral particles
(Leitner et al., 2008). Gag generates the structural proteins, pol encodes the enzymes for
the replication of the virus and env encode the receptor binding proteins (Leitner et al.,
2008). Tat and rev are regulatory gens and nef, vif, vpr and vpu are accessory genes
required for the correct replication and maturation of the virus. The structural
composition of the mature virion consists of a conical capsid that is formed by the
single protein p24. The RNA interacts with the protein p7 and the capsid is surrounded
by the protein p17. The capsid encloses two strands of viral RNA, the replication
enzymes, proteases, ribonuclease, integrase and cellular proteins (Young et al., 2006).

The envelope encloses the matrix and is composed by a host cell lipidic bilayer and the
Env protein that in turn is formed by the external subunit gp120 and the transmembrane
subunit gp41. Gp120 binds to CD4 receptors of the surface of the cells and gp41 is
involved in the fusion between the cell membrane and the virus. A detailed review of
the insights of the replication cycle can be found in (Engelman and Cherepanov, 2012).
Figure 2. HIV-1 genome (Young et al., 2006).
HIV-1 has infected over 60 million people since 1981 with a rate of annually new
infections of 5 million people. Therefore, HIV/AIDS has become a global epidemic
with 35.3 million people infected globally and 1.8 million deaths. Most of the HIV
cases occurred in sub-Saharan Africa with a prevalence of 5% of the population
(www.unaids.org).
The current treatment for AIDS is restricted to highly active antiretroviral therapy
(HAART). Administration of HAART to HIV patients prolongs their lifespan, however,
these treatments are not curative and extremely expensive. Therefore, developing an
effective and affordable vaccine against HIV-1 is a major health issue (Chhatbar et al.,
2011).

HIV-1 has several special characteristics that must be considered in any potential
vaccine development. HIV-1 can initiate the infection breaking the mucosa barrier or
infecting T-cells and the virus generates changes in the genome in ever replication
(Letvin, 2006). A successful vaccine must elicit both humoral and cellular responses
(Ross et al., 2010). Classical approaches have become unsuccessful for HIV-1. Live
attenuated HIV-1 approach, although showed good protective effects in monkeys, has
been discarded due to safety reasons, as it might be an option for the virus to recover the
pathogenic activity. On the other hand, whole inactivated viruses and recombinant
proteins showed low capacity to elicit CD8+ T cell response. Therefore, novel
approaches have to be considered in developing an HIV vaccine (Barouch, 2008).
Those new strategies include plasmid DNA vaccines and live recombinant vectors that
are modified to express HIV-1 antigens. Plasmid DNA vaccines are expected to
decrease the virus burden by reducing the virus replication. Recombinant vectors
consist of a live viral non-replicative vector that encodes viral antigens. Different
vectors have been studied such as adenovirus and poxvirus vector (Girard et al., 2006).
An alternative strategy is the use of lentiviral viral-like particles (VLPs) containing Gag
and Env to form a pseudovirus that mimics the complete virus. The administration of
VLP vaccine may be good candidates to elicit immune response against HIV-1 (Young
et al., 2006).
3. Gag virus-like particles
Gag is known as “the particle-forming machine” as, in the absence of any other viral
protein or genome, it is able to self-assemble in the vicinity of the plasma membrane
and bud forming VLPs (Deml et al., 2005; Young et al., 2006). During the budding
process, Gag virus particles acquire their lipid envelope from the producer cell.

Gag virus-like particles are virtually identical to the wild-type HIV-1 particles but carry
an immature protein core and lack the Env-protein spikes on the surface and the genome
inside the core (Figure 3).
Gag-based VLPs could consist an ideal platform for the generation of vaccine
candidates. First, Gag-based VLPs are based on the HIV-1 virion, one of the best
characterized virus particles of all times. Much is known about the biology, structure
and immunogenicity of HIV-1. This scientific knowledge could be exploited for the
generation of stable and immunogenic Gag-based VLPs vaccines. In fact, this
knowledge has already been used for the development of HIV-1 based viral vectors
(lentiviral vectors), which are among the most used gene transfer tools in gene therapy.
Second, co-expression of Gag and the HIV-1 own Env-protein would generate a VLP
for HIV-1 against which there is no effective vaccine yet available. Third, Gag-based
VLPs could be used as carriers for the presentation of foreign antigens. The Gag particle
is particularly well-suited for the incorporation of foreign antigens on the surface

4. Production methods
4.1 Expression systems
A wide range of expression systems is available to produce recombinant proteins or
viral vectors. These systems include bacteria, yeast, baculovirus mediated insect cell
expression systems and mammalian cells. Each expression system offers advantages
and disadvantages referred in relation to cost, easy of use, and post-translational
modification profiles.
4.1.1 Bacteria
Bacteria although being the most widely used expression system for the production of
recombinant protein is not the first choice in VLP production due to numerous factors

such as the absence of mammalian-like post-translational modifications. Nevertheless,
bacteria are used to produce non-enveloped VLPs based on components of a pathogen
with the ability to self-assemble into the host or as fusions of vaccine target antigens to
bacteriophage surface proteins (Kushnir et al., 2012).
4.1.2 Yeast
Yeast is a well-established, robust, easily scalable and cost-efective platform for
recombinant protein expression and continues to be used for VLP production, since two
licensed VLP-based vaccines: Recombivax HB® and Gardasil® (Merk, USA) are using
this platform. Despite these successful results, yeast differ from mammalian cells in
post-translational modification patterns, concretely in protein glycosylation, so this
system is generally limited to the production of non-enveloped VLPs (Kushnir et al.,
2012). Nevertheless, production of enveloped HIV- Pr55Gag VLPs in yeast, using
Saccharomyces cerevisiae spheroplasts, has been reported (Sakuragi et al., 2002). In
this case, despite it has been demonstrated to activate dendritic cells in vitro and CD8 +
memory cell response, some specific Gag-specific T cell populations remained
unresponsive (Tsunetsugu-Yokota et al., 2003).
4.1.3 Baculovirus-Insect cell expression system
Another system widely used in VLP production is the baculovirus-insect cell expression
system. Insect cells have been used to produce a number of VLP-based vaccines. In
particular, High Five™ is the cell line used to produce one of the current HPV vaccines,
Cervarix ® (Douglas R. Lowy and John T. Schiller, 2006). Insect cell system possesses
eukaryotic–type post-translational modifications including glycosylation, accumulates
high-level of foreign proteins and lacks mammalian pathogens. Large amounts of
correctly folded VLPs are easily attained in high-density culture conditions. Concerning

the immunogenicity of the insect cell derived VLP, host-derived or baculovirus-derived
components may act as vaccine adjuvants. On the other hand, this extra immunogenicity
may mask the immune response against the desired epitope and the contamination of the
product with co-produced enveloped baculovirus particles is the main limitation in this
system. Insect cell expression system has been also studied for the generation of HIV
vaccine, concretely expressing Pr55 Gag VLP (Kushnir et al., 2012).
4.1.4 Mammalian cells
As compared to insect cells, glycosylation in mammalian cells has the most similar
pattern to human cells, which is an important aspect in terms of immunogenicity and
safety. Mammalian cells are a widely extended expression platform for the production
of recombinant proteins but also viruses since these cells are closely related to their
natural hosts and thus typically perform appropriate post-translational modifications and
authentic assembly of viral particles. The only caveat of this system is that the cost of
production is higher than non-mammalian systems.
A number of mammalian cell lines have been used for protein expression with the most
common one being HEK 293 (Human embryonic kidney) and CHO (Chinese hamster
ovary).
4.1.4.1 CHO cell line
The first mammalian cell line approved for the production of recombinant protein was
the CHO-derived cells for the production of tissue plasminogen activator (tPA) in 1986
which revolutionized medicine and opened the field of mammalian cell lines as
expression systems (Lai et al. 2013). Nowadays, CHO cell line remains the first choice
for the production of biopharmaceuticals owing to the capability to grow in suspension,
low risk of contamination by human viruses, ability to grow in serum-free and

chemically defined media and finally their capacity to perform post-translational
modifications to the recombinant proteins which make them compatible and bioactive in
humans (Lai et al. 2013).
4.1.4.2 HEK 293
HEK 293 cells are also a widely and currently used mammalian-based expression
system. This cell line is easy to grow, relatively easy to transfect, and it is also widely
used in both research and production scale for the production of recombinant proteins
and is the first choice for the production of viral vectors. HEK 293 is advantageous
when human post-translation modifications, as opposed to those observed in hamster
cells, confer beneficial properties to the product (Dietmair et al., 2012). This proved to
be the case for human activated protein C, marketed as Xigris®, which required certain
human post-translational modifications to maintain its biological activity (Durocher and
Butler, 2009).
This cell line was generated in the early '70s from the co-culture of human embryonic
kidney cells and adenovirus in the laboratory of Alex Van der Eb in Leiden, the
Netherlands. Human cells were obtained from a single healthy fetus legally aborted.
The original culture of kidney cells was carried out by van der Eb, while transformation
with the adenovirus was performed in the laboratory Fran Graham van der Eb (Graham
et al., 1977). Since the human kidney contains many kinds of cell types, it could not be
determined the exact cell type from which HEK 293 were derived.
Of the available mammalian cells, the cell of choice for this work is HEK 293, as
murine cells do not support efficient assembly and release of HIV-1 virions. This
assembly defect may result from a failure of the Gag polyprotein to target to the cell
membrane. This preclude the use of CHO cell line to produce Gag virus-like particles
(Chen et al., 2001; Reed et al., 2002).

4.2. Stable cell lines and transient transfection
The production of recombinant proteins is usually achieved by two main approaches:
stable gene expression (SGE) and transient gene expression (TGE).
SGE is characterized by the generation of a cell line which has the codified DNA of the
recombinant protein integrated in its genome. The process to establish a stable cell line
can be costing and time consuming, and it is normally difficult to obtain a high-titter
production in the case of toxic products, as retrovirus or lentivirus (Pluta and Kacprzak,
2009).
On the other hand, TGE is based on episomal plasmid DNA expression. The plasmid is
introduced into the cells by using a transfection reagent and the product is harvested
normally after 48-72 hours post transfection (hpt).

Stable cell lines are used, therefore, in industrial processes, while transient transfection
is used in the development stages, where it is necessary to have a minimum amount of
product faster and easier, although this production is not applied in large quantities. For
that reason, TGE is especially suitable for pre-clinical or structural studies of the
obtained product. In many cases, both expression systems are combined, using the TGE
in the development phase to generate prove of concept of the activity of the molecule
under study, and the SGE in establishing the industrial production process.
SGE TGE
Genetic selection Yes No Time from DNA to
product 6-12 months Weeks
Specific productivity (pg/cell/day) Up to 50 Below 10
Volumetric productivity (g/L) Up to 5 0.02-0.08
Scalabillity Up to 20.000 L Small-scale production
Application Large scale production of therapeutic recombinant
protein
Small-scale production of protein for research

4.2.1. Methods of transfection
There are several complexing agents of DNA used to perform transient transfection,
such as cationic lipids, calcium phosphate or cationic polymers.
4.2.1.1 Cationic lipids
There are several commercially available cationic lipids such as Lipofectamine 2000™
(Invitrogen) in adherent cultures and 293fectin™ (Invitrogen) and Fugene HD™
(Roche Diagnostics) for suspension cultures, all of them very effective in terms of
transfection efficiency but very expensive which precludes its use in large-scale
processes (Geisse, 2009).
4.2.1.2 Calcium phosphate
Calcium phosphate has been the most widely used method for transient transfection
during the last 30 years (Batard et al., 2001; Jordan et al., 1996; Meissner et al., 2001).
The method is easy and consist in mixing the DNA with a calcium chloride solution and
then add a phosphate solution to form the Ca-Pi complexes. After incubation, when the
complexes have reached an optimal size, they are added to the culture (Pham et al.,
2006). This method is cost-effective and has been used for large-scale transfections. Its
only drawback is its incompatibility when serum-free media, with low-calcium content
used to prevent cell aggregation, are used (Geisse, 2009; Jordan and Wurm, 2004).
4.2.1.3 Cationic polymers
Polyethylenimine (PEI) was discovered as an efficient non-viral gene transfer in
cultured and in-vivo cells (Boussif et al., 1995) and firstly gained attention in the
context of gene therapy approaches (Lungwitz et al., 2005).

There are several types of PEI, linear or branched, with different molecular weights and
with derivatized chemical groups. In TGE approaches the most widely used is the 25kD
linear PEI, both in CHO and HEK 293 cultures (Carpentier et al., 2007; Derouazi et al.,
2004; Durocher et al., 2002a). Furthermore, it is an economical method for transient
transfection (Tait et al., 2004).
PEI ionically condenses DNA through amino-phosphate interactions between PEI and
DNA forming positively charged polyplexes that protect the DNA from digestion by
nucleases. Then the negatively charged glycoproteins and proteoglycans in the cell
membrane interact with the polyplexes and finally the cell internalizes the polyplexes
through endocytosis, which are later found in endosomes inside the cytoplasm (Bieber et
al., 2002; Godbey et al., 1999).
The exact mechanism by which the PEI is able to escape from the vesicles has not yet being
well defined nonetheless it is suggested that the presence of protonable amino nitrogen in
PEI structure may act as buffer (proton sponge effect) of the endosomal environment that
may delay the fusion with the lysosomes (Boussif et al., 1995) (Akinc et al., 2005), and
ultimately lead to an osmotic swelling and rupture of some vesicles, releasing the
polyplexes into the cytoplasm. Once the polyplexes are released into the cytosol they have
to be internalized to the nucleus by a process not yet elucidated. One proposed mechanism
suggests that the polyplexes may enter into the nucleus during the break down of the
nuclear membrane during cell division (Grosse et al., 2006; Tait et al., 2004).
Alternatively, a second mechanism postulates that the polyplexes are transferred to the
nucleus by active transport through the nuclear envelope, independently of cell division
(Han et al., 2009). The transfer of PEI–DNA complexes to the nucleus is a limiting step
in cell transfection, as only a very small fraction od plasmid delivered into the cell is

finally translocated into the nucleus and transcribed (Bieber et al., 2002; Carpentier et
al., 2007; Cohen et al., 2009).
For the purpose of this study, the transfection agent of choice is polyethylenimine (PEI)
since calcium phosphate is not effective in serum-free media and lipofectamine is
expensive, what makes it inadequate for scale up approaches.
5. Methods to improve the process
5.1 Serum free media
The need of serum removal from bioprocess was recognized decades ago. First attempts
in serum free media (SFM) development included components of animal origin that
tried to mimic the components supplied by the serum, such as insulin, transferrin and

lipids of animal origin as well as other poorly defined mixtures (extracts, hydrolysates)
(Keenan et al., 2006). Currently, the overall trend in SFM formulation is to avoid
completely any animal-derived components to avoid any possible contact with new
viruses or prion strains. The increasing number of animal-derived component free
(ADCF) and chemically defined (CD) media formulations available in the market and
the relatively recent commercial availability of recombinant versions of key serum
proteins produced in Escherichia coli or yeast (e.g. albumin and transferrin), as well as
supplements of plant origin or synthetic nature should facilitate the switch to efficient
animal-derived component-free production processes.
5.2 Strategies to increase production
5.2.1 Cell lines/plasmids
A key point in the recombinant protein expression is the stability of the plasmid within
the cell. To increase plasmid persistence a successful strategy developed has been the
constitutive expression of the large T antigen of simian virus 40 (SV40) in 293-T,
CHO-T or CAP-T cell lines, increasing therefore the replication of vectors containing
the SV40 origin of replication (Baldi et al., 2007; Berntzen et al., 2005; Van
Craenenbroeck et al., 2000; Durocher et al., 2002b; Geisse, 2009).
Another genetic element engineered for the optimization in mammalian cells, is the
addition of EBNA-1 gene of the Epstein –Barr virus in conjunction with its replication
origin, oriP, when provided in trans are claimed to boost protein expression plasmids.
Furthermore, EBNA-1 appears to act as a transcriptional enhancer in human as well as
rodent cells (Van Craenenbroeck et al., 2000; Durocher et al., 2002b; Geisse, 2009;
Meissner et al., 2001; Young et al., 1988).
5.2.2 Additives to increase transient transfection and protein production

Several additives have been tested to enhance transient transfection efficiency. Lithium
acetate and DMSO are used to increase cell membrane porosity to increase the capacity
of the polyplexes to enter the cell (Ye et al., 2009). One of them is Nocodazole that acts
in terms of cell cycle arrest in the G2/M phase which is thought to enhance nuclear
uptake of the DNA/PEI complexes when the nuclear membrane dissolves during
mitosis (Tait et al., 2004).
Once the DNA is in the nucleus another group of additives used to increase production
has also proven to be efficient in several cases. Sodium butyrate (Ansorge et al., 2009;
Backliwal et al., 2008c; Damiani et al., 2013; Jiang and Sharfstein, 2008; Mimura et al.,
2001; Palermo et al., 1991; Rodrigues Goulart et al., 2010; Sung et al., 2004), Valproic
acid (Backliwal et al., 2008a; Backliwal et al., 2008b; Backliwal et al., 2008c; Fan et al.,
2005; Wulhfard et al., 2010) and Trichostatin A (Backliwal et al., 2008c; Fan et al.,
2005; Spenger et al., 2004) are used to inhibit histone (HDAC), resulting in
hyperacetylation of histones and consequently, alterations in DNA transcription
(Rodrigues Goulart et al., 2010).
Hydroxyurea is used to block cell cycle in the G1 phase of the cell cycle which also
leads to an increase in production (Fussenegger et al., 1999; Suzuki and Ollis, Tait et
al., 2004).
Caffeine is a well established inhibitor of several kinases, including ATM (ataxia
telangiectasia mutated), ATR (ataxia telangiectasia and Rad3-related protein), and
DNA-PKcs (DNA-dependent protein kinase catalytic subunit), which are important
signaling proteins involved in the repair of DNA double-stranded breaks (Block et al.,
2004; Hall-Jackson et al., 1999; Sarkaria et al., 1999). This feature is able to increase
lentivirus titer in HEK 293 cells (Ellis et al., 2011).

5.2.3 Cell culture modes
The system used for production of recombinant proteins by transient transfection play a
central role to increase the yield of the protein of interest. Optimization processes
carried out in fed-batch and perfusion systems have been reported. Perfusion was
successfully used to increase titers of adherent H6–18 cells (derived from HEK 293 T)
immobilized on microcarriers to produce Drosophila cytokine Spätzle (Cheeks et al.,
2009) and for producing lentiviral particles using a suspensión adapted HEK 293 and an
acoustic filter to retain cells in the bioreactor (Ansorge et al., 2009). Productivity has
been also enhanced by medium feeding post transfection of HEK 293 EBNA for the
production of GFP and secreted alkaline phosphatase (SEAP) (Pham et al., 2005) or
GFP and erythropoietin (EPO) (Sun et al., 2006).
5.2.4 Use of anti-apoptotic genes
Another strategy to increase transient transfection yields include engineering cells to
express anti-apoptotic proteins such as Bcl-xL (Majors et al., 2008) or another Bcl-2
family protein, Mcl-1 (Majors et al., 2009), resulting in higher yields and culture
viabilities. A different approach has focused on knock-down of the pro-apoptotic genes
Bax and Bak involved in the permeabilization of the mithocondrial membrane and
trigger of caspase cascade activation (Macaraeg et al., 2013).
6. Scalability of the transient transfection process
Although TGE has been typically used at low and medium scale, during the past decade
significant effort has been made towards developing large-scale TGE protocols.
However since the average amount of DNA per one million transfected cells is 1 μg, the
DNA cost is a factor that should be taken into consideration when selecting TGE for
large-scale process. Large-scale production using both PEI and CaPi transfection

reagents has been demonstrated at production scales ranging from 1 to 110 L (Baldi et
al., 2005). For instance, successful generation of IgG antibody by TGE at 10 L scale in
Wave bioreactors and 50 and 100 L scale in stirred tank bioreactors has been reported
(Tuvesson et al., 2008). Titers exceeding 1 g/L have been attained by TGE (Backliwal
et al., 2008b).
The manufacturing of clinical grade complex biopharmaceuticals such as viral gene
therapy vectors by TGE for human clinical trials has also been described (e.g.,
retroviral, lentiviral, and adeno-associated viral vectors) (Ausubel et al., 2012; Ayuso et
al., 2010; Cornetta et al., 2008; Merten et al., 2011; Wright, 2008; Wright, 2009).

Akinc A, Thomas M, Klibanov AM, Langer R. 2005. Exploring polyethylenimine-mediated DNA transfection and the proton sponge hypothesis. J. Gene Med. 7:657–663.
Ansorge S, Lanthier S, Transfiguracion J, Durocher Y, Henry O, Kamen A. 2009. Development of a scalable process for high-yield lentiviral vector production by transient transfection of HEK293 suspension cultures. J. Gene Med. 11:868–876.
Ausubel LJ, Hall C, Sharma A, Shakeley R, Lopez P, Quezada V, Couture S, Laderman K, McMahon R, Huang P, Hsu D, Couture L. 2012. Production of CGMP-Grade Lentiviral Vectors. Bioprocess Int. 10:32–43. http://www.pubmedcentral.nih.gov/articlerender.fcgi?artid=3374843&tool=pmcentrez&rendertype=abstract.
Ayuso E, Mingozzi F, Bosch F. 2010. Production , Purification and Characterization of Adeno-Associated Vectors:1–14.
Backliwal G, Hildinger M, Chenuet S, DeJesus M, Wurm FM. 2008a. Coexpression of acidic fibroblast growth factor enhances specific productivity and antibody titers in transiently transfected HEK293 cells. N. Biotechnol. 25:162–166.
Backliwal G, Hildinger M, Chenuet S, Wulhfard S, De Jesus M, Wurm FM. 2008b. Rational vector design and multi-pathway modulation of HEK 293E cells yield recombinant antibody titers exceeding 1 g/l by transient transfection under serum-free conditions. Nucleic Acids Res. 36:e96. http://www.pubmedcentral.nih.gov/articlerender.fcgi?artid=2528171&tool=pmcentrez&rendertype=abstract.
Backliwal G, Hildinger M, Kuettel I, Delegrange F, Hacker DL, Wurm FM. 2008c. Valproic Acid : A Viable Alternative to Sodium Butyrate for Enhancing Protein Expression in Mammalian Cell Cultures. Biotechnology 101:182–189. http://dx.doi.org/10.1002/bit.21882.
Baldi L, Hacker DL, Adam M, Wurm FM. 2007. Recombinant protein production by large-scale transient gene expression in mammalian cells: State of the art and future perspectives. Biotechnol. Lett. 29:677–684.
Baldi L, Muller N, Picasso S, Jacquet R, Girard P, Huy PT, Derow E, Wurm FM. 2005. Transient gene expression in suspension HEK-293 cells: Application to large-scale protein production. Biotechnol. Prog. 21:148–153.
Barouch DH. 2008. Challenges in the development of an HIV-1 vaccine. Nature 455:613–619.
Batard P, Jordan M, Wurm F. 2001. Transfer of high copy number plasmid into mammalian cells by calcium phosphate transfection. Gene 270:61–68.
Berntzen G, Lunde E, Flobakk M, Andersen JT, Lauvrak V, Sandlie I. 2005. Prolonged and increased expression of soluble Fc receptors, IgG and a TCR-Ig fusion protein

by transiently transfected adherent 293E cells. J. Immunol. Methods 298:93–104. http://www.ncbi.nlm.nih.gov/pubmed/15847800.
Berzofsky JA, Berzofsky JA, Ahlers JD, Ahlers JD, Janik J, Janik J, Morris J, Morris J, Oh S, Oh S, Terabe M, Terabe M, Belyakov IM, Belyakov IM. 2004. Progress on new vaccine strategies against chronic viral infections. J. Clin. Invest. 114:450–62. http://www.ncbi.nlm.nih.gov/pubmed/15314679.
Bieber T, Meissner W, Kostin S, Niemann A, Elsasser H-P. 2002. Intracellular route and transcriptional competence of polyethylenimine–DNA complexes. J. Control. Release 82:441–454. http://www.sciencedirect.com/science/article/pii/S0168365902001293.
Block WD, Merkle D, Meek K, Lees-Miller SP. 2004. Selective inhibition of the DNA-dependent protein kinase (DNA-PK) by the radiosensitizing agent caffeine. Nucleic Acids Res. 32:1967–72. http://www.pubmedcentral.nih.gov/articlerender.fcgi?artid=390360&tool=pmcentrez&rendertype=abstract.
Boussif O, Lezoualc’h F, Zanta MA, Mergny MD, Scherman D, Demeneix B, Behr JP. 1995. A versatile vector for gene and oligonucleotide transfer into cells in culture and in vivo: polyethylenimine. Proc. Natl. Acad. Sci. 92:7297–7301. http://www.pnas.org/content/92/16/7297.short.
Bråve A, Ljungberg K, Wahren B, Liu MA. 2007. Vaccine delivery methods using viral vectors. Mol. Pharm.
Carpentier E, Paris S, Kamen AA, Durocher Y. 2007. Limiting factors governing protein expression following polyethylenimine-mediated gene transfer in HEK293-EBNA1 cells. J. Biotechnol. 128:268–280.
Cervera L, Gutiérrez-Granados S, Martínez M, Blanco J, Gòdia F, Segura MM. 2013. Generation of HIV-1 Gag VLPs by transient transfection of HEK 293 suspension cell cultures using an optimized animal-derived component free medium. J. Biotechnol. 166:152–165.
Cheeks MC, Edwards AD, Arnot CJ, Slater NKH. 2009. Gene transfection of HEK cells on supermacroporous polyacrylamide monoliths: A comparison of transient and stable recombinant protein expression in perfusion culture. N. Biotechnol. 26:289–299.
Cheever MA, Higano CS. 2011. PROVENGE (Sipuleucel-T) in prostate cancer: the first FDA-approved therapeutic cancer vaccine. Clin. Cancer Res. 17:3520–6. http://clincancerres.aacrjournals.org/content/17/11/3520.short.
Chen BK, Rousso I, Shim S, Kim PS. 2001. Efficient assembly of an HIV-1/MLV Gag-chimeric virus in murine cells. Proc. Natl. Acad. Sci. U. S. A. 98:15239–15244.

Chhatbar C, Mishra R, Kumar A, Singh SK. 2011. HIV vaccine: Hopes and hurdles. Drug Discov. Today 16:948–956. http://dx.doi.org/10.1016/j.drudis.2011.08.013.
Cohen RN, van der Aa MAEM, Macaraeg N, Lee AP, Szoka FC. 2009. Quantification of plasmid DNA copies in the nucleus after lipoplex and polyplex transfection. J. Control. Release 135:166–74. http://www.pubmedcentral.nih.gov/articlerender.fcgi?artid=2765102&tool=pmcentrez&rendertype=abstract.
Cornetta K, Reeves L, Cross S. 2008. Production of retroviral vectors for clinical use. Methods Mol. Biol. 433:17–32.
Van Craenenbroeck K, Vanhoenacker P, Haegeman G. 2000. Episomal vectors for gene expression in mammalian cells. Eur. J. Biochem. 267:5665–5678.
Damiani R, Almeida BE, Oliveira JE, Bartolini P, Ribela MTCP. 2013. Enhancement of human thyrotropin synthesis by sodium butyrate addition to serum-free CHO cell culture. Appl. Biochem. Biotechnol. 171:1658–72. http://www.ncbi.nlm.nih.gov/pubmed/23996121.
Deml L, Speth C, Dierich MP, Wolf H, Wagner R. 2005. Recombinant HIV-1 Pr55gag virus-like particles: potent stimulators of innate and acquired immune responses. Mol. Immunol. 42:259–277.
Derouazi M, Girard P, Van Tilborgh F, Iglesias K, Muller N, Bertschinger M, Wurm FM. 2004. Serum-free large-scale transient transfection of CHO cells. Biotechnol. Bioeng. 87:537–545.
Dietmair S, Hodson MP, Quek L-E, Timmins NE, Gray P, Nielsen LK. 2012. A multi-omics analysis of recombinant protein production in Hek293 cells. PLoS One 7:e43394. http://www.pubmedcentral.nih.gov/articlerender.fcgi?artid=3427347&tool=pmcentrez&rendertype=abstract.
Doan LX, Li M, Chen C, Yao Q. 2005. Virus-like particles as HIV-1 vaccines. Rev. Med. Virol. 15:75–88. http://www.ncbi.nlm.nih.gov/pubmed/15484204.
Donnelly JJ, Ulmer JB, Shiver JW, Liu MA. 1997. DNA vaccines. Annu. Rev. Immunol. 15:617–648.
Douek DC, Roederer M, Koup RA. 2009. Emerging Concepts in the Immunopathogenesis of AIDS. Annu. Rev. Med. 60:471–484. http://www.ncbi.nlm.nih.gov/pmc/articles/PMC2716400/.
Douglas R. Lowy and John T. Schiller. 2006. Prophylactic human papillomaviurs vaccines. J. Clin. Invest. 116:1167–1173. http://www.jci.org/articles/view/28607.

Draper SJ, Moore AC, Goodman AL, Long CA, Holder AA, Gilbert SC, Hill F, Hill AVS. 2008. Effective induction of high-titer antibodies by viral vector vaccines. Nat. Med. 14:819–821.
Durocher Y, Butler M. 2009. Expression systems for therapeutic glycoprotein production. Curr. Opin. Biotechnol. 20:700–707.
Durocher Y, Perret S, Kamen A. 2002a. High-level and high-throughput recombinant protein production by transient transfection of suspension-growing human 293-EBNA1 cells. Nucleic Acids Res. 30:E9.
Durocher Y, Perret S, Kamen A. 2002b. High-level and high-throughput recombinant protein production by transient transfection of suspension-growing human 293-EBNA1 cells. Nucleic Acids Res. 30:E9. http://www.pubmedcentral.nih.gov/articlerender.fcgi?artid=99848&tool=pmcentrez&rendertype=abstract.
Ellis BL, Potts PR, Porteus MH. 2011. Creating higher titer lentivirus with caffeine. Hum. Gene Ther. 22:93–100. http://www.pubmedcentral.nih.gov/articlerender.fcgi?artid=3025180&tool=pmcentrez&rendertype=abstract.
Engelman A, Cherepanov P. 2012. The structural biology of HIV-1: mechanistic and therapeutic insights. Nat. Rev. Microbiol. 10:279–290. http://dx.doi.org/10.1038/nrmicro2747.
Fan S, Maguire CA, Ramirez SH, Bradel-Tretheway B, Sapinoro R, Sui Z, Chakraborty-Sett S, Dewhurst S. 2005. Valproic acid enhances gene expression from viral gene transfer vectors. J. Virol. Methods 125:23–33.
Fussenegger M, Bailey JE, Hauser H, Mueller PP. 1999. Genetic optimization of recombinant glycoprotein production by mammalian cells. Trends Biotechnol.
Geisse S. 2009. Reflections on more than 10 years of TGE approaches. Protein Expr. Purif. 64:99–107. http://yadda.icm.edu.pl/yadda/element/bwmeta1.element.elsevier-2c624441-0114-3ab5-b656-c15352038a09.
Girard MP, Osmanov SK, Kieny MP. 2006. A review of vaccine research and development: the human immunodeficiency virus (HIV). Vaccine 24:4062–4081.
Godbey WT, Wu KK, Mikos AG. 1999. Tracking the intracellular path of poly(ethylenimine)/DNA complexes for gene delivery. Proc. Natl. Acad. Sci. 96:5177–5181. http://www.pnas.org/content/96/9/5177.short.
Graham FL, Smiley J, Russell WC, Nairn R. 1977. Characteristics of a human cell line transformed by DNA from human adenovirus type 5. J. Gen. Virol. 36:59–74.

Grgacic EVL, Anderson DA. 2006. Virus-like particles: Passport to immune recognition. Methods 40:60–65.
Grosse S, Thévenot G, Monsigny M, Fajac I. 2006. Which mechanism for nuclear import of plasmid DNA complexed with polyethylenimine derivatives? J. Gene Med. 8:845–51. http://www.ncbi.nlm.nih.gov/pubmed/16685744.
Hall-Jackson CA, Cross DA, Morrice N, Smythe C. 1999. ATR is a caffeine-sensitive, DNA-activated protein kinase with a substrate specificity distinct from DNA-PK. Oncogene 18:6707–13. http://www.ncbi.nlm.nih.gov/pubmed/10597277.
Han X, Fang Q, Yao F, Wang X, Wang J, Yang S, Shen BQ. 2009. The heterogeneous nature of polyethylenimine-DNA complex formation affects transient gene expression. Cytotechnology. http://www.pubmedcentral.nih.gov/articlerender.fcgi?artid=2780544&tool=pmcentrez&rendertype=abstract.
Hilleman MR. 2000. Vaccines in historic evolution and perspective: a narrative of vaccine discoveries. Vaccine 18:1436–1447. http://www.sciencedirect.com/science/article/pii/S0264410X9900434X.
Jiang Z, Sharfstein ST. 2008. Sodium butyrate stimulates monoclonal antibody over-expression in CHO cells by improving gene accessibility. Biotechnol. Bioeng. 100:189–194.
Jordan M, Schallhorn A, Wurm FM. 1996. Transfecting Mammalian Cells: Optimization of Critical Parameters Affecting Calcium-Phosphate Precipitate Formation. Nucleic Acids Res. 24:596–601. http://nar.oxfordjournals.org/content/24/4/596.short.
Jordan M, Wurm F. 2004. Transfection of adherent and suspended cells by calcium phosphate. Methods 33:136–43. http://www.sciencedirect.com/science/article/pii/S1046202303003050.
Kirnbauer R, Booy F, Cheng N, Lowy DR, Schiller JT. 1992. Papillomavirus L1 major capsid protein self-assembles into virus-like particles that are highly immunogenic. Proc. Natl. Acad. Sci. U. S. A. 89:12180–12184.
Kushnir N, Streatfield SJ, Yusibov V. 2012. Virus-like particles as a highly efficient vaccine platform: Diversity of targets and production systems and advances in clinical development. Vaccine.
Leitner T, Hahn B, Foundation HMJ, Kuiken C, Foley B, Marx P, Wolinsky S, Lo C, Macke J, Szinger JJ, Thurmond J, Yoon H, Zhang M. 2008. HIV Sequence Compendium 2008 Editors.
Letvin NL. 2006. Progress and obstacles in the development of an AIDS vaccine. Nat. Rev. Immunol. 6:930–939.

Lua LHL, Connors NK, Sainsbury F, Chuan YP, Wibowo N, Middelberg APJ. 2014. Bioengineering virus-like particles as vaccines. Biotechnol. Bioeng.
Ludwig C, Wagner R. 2007. Virus-like particles-universal molecular toolboxes. Curr. Opin. Biotechnol.
Lungwitz U, Breunig M, Blunk T, Göpferich A. 2005. Polyethylenimine-based non-viral gene delivery systems. Eur. J. Pharm. Biopharm. 60:247–66. http://www.sciencedirect.com/science/article/pii/S0939641105000147.
Macaraeg NF, Reilly DE, Wong AW. 2013. Use of an anti-apoptotic CHO cell line for transient gene expression. Biotechnol. Prog. 29:1050–8. http://www.ncbi.nlm.nih.gov/pubmed/23794499.
Majors BS, Betenbaugh MJ, Pederson NE, Chiang GG. 2008. Enhancement of transient gene expression and culture viability using Chinese hamster ovary cells overexpressing Bcl-x(L). Biotechnol. Bioeng. 101:567–78. http://www.ncbi.nlm.nih.gov/pubmed/18727128.
Majors BS, Betenbaugh MJ, Pederson NE, Chiang GG. 2009. Mcl-1 overexpression leads to higher viabilities and increased production of humanized monoclonal antibody in Chinese hamster ovary cells. Biotechnol. Prog. 25:1161–8. http://www.ncbi.nlm.nih.gov/pubmed/19551877.
Mäkelä PH. 2000. Vaccines, coming of age after 200 years. FEMS Microbiol. Rev.
Meissner P, Pick H, Kulangara A, Chatellard P, Friedrich K, Wurm FM. 2001. Transient gene expression: recombinant protein production with suspension-adapted HEK293-EBNA cells. Biotechnol. Bioeng. 75:197–203. http://www.ncbi.nlm.nih.gov/pubmed/11536142.
Merten O-W, Charrier S, Laroudie N, Fauchille S, Dugué C, Jenny C, Audit M, Zanta-Boussif M-A, Chautard H, Radrizzani M, Vallanti G, Naldini L, Noguiez-Hellin P, Galy A. 2011. Large-scale manufacture and characterization of a lentiviral vector produced for clinical ex vivo gene therapy application. Hum. Gene Ther. 22:343–356.
Mimura Y, Lund J, Church S, Dong S, Li J, Goodall M, Jefferis R. 2001. Butyrate increases production of human chimeric IgG in CHO-K1 cells whilst maintaining function and glycoform profile. J. Immunol. Methods 247:205–216.
Noad R, Roy P. 2003. Virus-like particles as immunogens. Trends Microbiol.
O’Neal CM, Crawford SE, Estes MK, Conner ME. 1997. Rotavirus virus-like particles administered mucosally induce protective immunity. J. Virol. 71:8707–8717.
Palermo DP, DeGraaf ME, Marotti KR, Rehberg E, Post LE. 1991. Production of analytical quantities of recombinant proteins in Chinese hamster ovary cells using sodium butyrate to elevate gene expression. J. Biotechnol. 19:35–47.

Pham PL, Perret S, Cass B, Carpentier E, St.-Laurent G, Bisson L, Kamen A, Durocher Y. 2005. Transient gene expression in HEK293 cells: Peptone addition posttransfection improves recombinant protein synthesis. Biotechnol. Bioeng. 90:332–344.
Pham PL, Kamen A, Durocher Y. 2006. Large-scale transfection of mammalian cells for the fast production of recombinant protein. Mol. Biotechnol. 34:225–237.
Plotkin S. 2014. History of vaccination. Proc. Natl. Acad. Sci. U. S. A. 2014:1–5. http://www.ncbi.nlm.nih.gov/pubmed/25136134.
Pluta K, Kacprzak MM. 2009. Use of HIV as a gene transfer vector. Acta Biochim. Pol. 56:531–595.
Reed M, Mariani R, Sheppard L, Pekrun K, Landau NR, Soong N-W. 2002. Chimeric human immunodeficiency virus type 1 containing murine leukemia virus matrix assembles in murine cells. J. Virol. 76:436–443.
Rodrigues Goulart H, Arthuso F dos S, Capone MVN, de Oliveira TL, Bartolini P, Soares CRJ. 2010. Enhancement of human prolactin synthesis by sodium butyrate addition to serum-free CHO cell culture. J. Biomed. Biotechnol. 2010:405872. http://www.researchgate.net/publication/45167875_Enhancement_of_human_prolactin_synthesis_by_sodium_butyrate_addition_to_serum-free_CHO_cell_culture.
Roldão A, Mellado MCM, Castilho LR, Carrondo MJT, Alves PM. 2010. Virus-like particles in vaccine development. Expert Rev. Vaccines 9:1149–1176.
Ross AL, Bråve A, Scarlatti G, Manrique A, Buonaguro L. 2010. Progress towards development of an HIV vaccine: Report of the AIDS Vaccine 2009 Conference. Lancet Infect. Dis.
Roush SW, Murphy T V. 2007. Historical comparisons of morbidity and mortality for vaccine-preventable diseases in the United States. JAMA 298:2155–63. http://jama.jamanetwork.com/article.aspx?articleid=209448.
Roy P, Noad R. 2008. Virus-like particles as a vaccine delivery system: Myths and facts. Hum. Vaccin.
Sakuragi S, Goto T, Sano K, Morikawa Y. 2002. HIV type 1 Gag virus-like particle budding from spheroplasts of Saccharomyces cerevisiae. Proc. Natl. Acad. Sci. U. S. A. 99:7956–7961.
Sarkaria JN, Busby EC, Tibbetts RS, Roos P, Taya Y, Karnitz LM, Abraham RT. 1999. Inhibition of ATM and ATR kinase activities by the radiosensitizing agent, caffeine. Cancer Res. 59:4375–82. http://www.ncbi.nlm.nih.gov/pubmed/10485486.

Spenger A, Ernst W, Condreay JP, Kost TA, Grabherr R. 2004. Influence of promoter choice and trichostatin a treatment on expression of baculovirus delivered genes in mammalian cells. Protein Expr. Purif. 38:17–23.
Sun X, Goh PE, Wong KTK, Mori T, Yap MGS. 2006. Enhancement of transient gene expression by fed-batch culture of HEK 293 EBNA1 cells in suspension. Biotechnol. Lett. 28:843–848.
Sung YH, Song YJ, Lim SW, Chung JY, Lee GM. 2004. Effect of sodium butyrate on the production, heterogeneity and biological activity of human thrombopoietin by recombinant Chinese hamster ovary cells. J. Biotechnol. 112:323–335.
Suzuki E, Ollis DF. Enhanced antibody production at slowed growth rates: experimental demonstration and a simple structured model. Biotechnol. Prog. 6:231–6. http://www.ncbi.nlm.nih.gov/pubmed/1366616.
Tait AS, Brown CJ, Galbraith DJ, Hines MJ, Hoare M, Birch JR, James DC. 2004. Transient production of recombinant proteins by Chinese hamster ovary cells using polyethyleneimine/DNA complexes in combination with microtubule disrupting anti-mitotic agents. Biotechnol. Bioeng. 88:707–721.
Tsunetsugu-Yokota Y, Morikawa Y, Isogai M, Kawana-Tachikawa A, Odawara T, Nakamura T, Grassi F, Autran B, Iwamoto A. 2003. Yeast-derived human immunodeficiency virus type 1 p55(gag) virus-like particles activate dendritic cells (DCs) and induce perforin expression in Gag-specific CD8(+) T cells by cross-presentation of DCs. J. Virol. 77:10250–10259.
Tuvesson O, Uhe C, Rozkov A, Lüllau E. 2008. Development of a generic transient transfection process at 100 L scale. Cytotechnology 56:123–136.
Ulmer JB, Valley U, Rappuoli R. 2006. Vaccine manufacturing: challenges and solutions. Nat. Biotechnol. 24:1377–1383.
Wright JF. 2008. Manufacturing and characterizing AAV-based vectors for use in clinical studies. Gene Ther. 15:840–848.
Wright JF. 2009. Transient transfection methods for clinical adeno-associated viral vector production. Hum. Gene Ther. 20:698–706.
Wulhfard S, Baldi L, Hacker DL, Wurm F. 2010. Valproic acid enhances recombinant mRNA and protein levels in transiently transfected Chinese hamster ovary cells. J. Biotechnol. 148:128–132.
Ye J, Kober V, Tellers M, Naji Z, Salmon P, Markusen JF. 2009. High-level protein expression in scalable CHO transient transfection. Biotechnol. Bioeng. 103:542–551.
Young JM, Cheadle C, Foulke JS, Drohan WN, Sarver N. 1988. Utilization of an Epstein-Barr virus replicon as a eukaryotic expression vector. Gene 62:171–185.

Young KR, McBurney SP, Karkhanis LU, Ross TM. 2006. Virus-like particles: designing an effective AIDS vaccine. Methods 40:98–117.


Objectives


The main objective of this work is to develop a process for Gag-GFP VLPs production
using HEK 293 cells by transient transfection. In more detail, the following specific
objectives can be outlined:
1. Select and optimize a cell culture medium for cell growth and transient
transfection, based on the use of commercial serum-free and chemically defined
medium with further supplementation of non-animal derived components as
additives to maximize cell growth, transient transfection and protein production.
2. Establish a transient transfection method for the production of Gag-GFP VLPs
using PEI as transfection reagent, by evaluating the key variables affecting
transient transfection efficiency such as cell concentration, DNA concentration
and cell cycle phase of the culture.
3. Characterize the transient transfection process at intracellular level in order to
first understand the process and second, determine relevant times related to the
kinetics of transfection that can help in process optimization.
4. Optimize the production of Gag-GFP VLPs using additives to enhance
transfection efficiency and production.
5. Develop a novel gene expression approach to prolong the production period by
the combination of medium exchange and repeated transfection of cell cultures
with plasmid DNA to improve overall protein production.


Results


Generation of HIV-1 Gag VLPs by transient transfection of HEK 293 suspension cell
cultures using an optimized animal-derived component free medium
Laura Cervera1, Sonia Gutiérrez1, Marta Martínez1, Julià Blanco2, Francesc Gòdia1 and
María Mercedes Segura1
1. Grup d'Enginyeria Cellular i Tissular, Escola d'Enginyeria, Universitat Autònoma de,
Barcelona, Campus de Bellaterra, Cerdanyola del Vallès, 08193 Barcelona, Spain.
2. IrsiCaixa AIDS Research Institute-HIVACAT, Hospital Universitari Germans Trias i
Pujol, Badalona, Spain.


Journal of Biotechnology 166 (2013) 152– 165
Contents lists available at SciVerse ScienceDirect
Journal of Biotechnology
jou rn al hom ep age: www.elsev ier .com/ locate / jb io tec
Generation of HIV-1 Gag VLPs by transient transfection of HEK 293suspension cell cultures using an optimized animal-derivedcomponent free medium
Laura Cerveraa, Sonia Gutiérrez-Granadosa, Marta Martíneza, Julià Blancob,Francesc Gòdiaa, María Mercedes Seguraa,∗
a Departament d’Enginyeria Química, Universitat Autònoma de Barcelona, Campus Bellaterra, Cerdanyola del Vallès 08193, Barcelona, Spainb IrsiCaixa AIDS Research Institute – HIVACAT, Hospital Universitari Germans Trias i Pujol, Badalona, Spain
a r t i c l e i n f o
Article history:
Received 3 January 2013
Received in revised form 29 April 2013
Accepted 2 May 2013
Available online xxx
Keywords:
Animal cell culture
Media supplementation
Design of experiments (DoE)
Virus-like particles (VLP)
HIV-1 vaccine
Transient gene expression (TGE)
a b s t r a c t
Virus-like particles (VLPs) offer great promise as candidates for new vaccine strategies. Large-scale
approaches for the manufacturing of HIV-1 Gag VLPs have mainly focused on the use of the baculovirus
expression system. In this work, the development and optimization of an HIV-1 Gag VLP production
protocol by transient gene expression in mammalian cell suspension cultures is reported. To facilitate
process optimization, a Gag-GFP fusion construct enabling the generation of fluorescent VLPs was used.
The great majority of Gag-GFP present in cell culture supernatants was shown to be correctly assembled
into virus-like particles of the expected size and morphology consistent with immature HIV-1 particles.
Medium optimization was performed using design of experiments (DoE). Culture medium supplemen-
tation with non-animal derived components including recombinant proteins and lipids of synthetic or
non-animal-derived origin resulted in improved HEK 293 cell growth and VLP production. The maximum
cell density attained using the optimized Freestyle culture medium was 5.4 × 10⁶ cells/mL in batch mode,
almost double of that observed using the unsupplemented medium (2.9 × 10⁶ cells/mL). Best produc-
tion performance was attained when cells were transfected at mid-log phase (2–3 × 10⁶ cells/mL) with
medium exchange at the time of transfection using standard amounts of plasmid DNA and polyethylen-
imine. By using an optimized production protocol, VLP titers were increased 2.4-fold obtaining 2.8 �g of
Gag-GFP/mL or 2.7 × 10⁹ VLPs/mL according to ELISA and nanoparticle tracking quantification analyses,
respectively.
© 2013 Elsevier B.V. All rights reserved.
1. Introduction
Upon expression in heterologous systems, the human immu-nodeficiency virus type 1 (HIV-1) Gag polyprotein is able toself-assemble giving rise to non-infectious VLPs in the absenceof any other viral protein or virus RNA (Buonaguro et al., 2001;Rovinski et al., 1995; Sakuragi et al., 2002). HIV-1 Gag VLPs haveshown great promise as platforms for the presentation of envelopeantigens (Deml et al., 2005). However, the complexities associatedwith their manufacturing have hindered their evaluation beyondearly-pre-clinical testing (Hammonds et al., 2007). Large-scaleapproaches for the manufacturing of HIV-1 Gag VLPs have mainlyfocused on the use of the baculovirus-expression system (Cruz et al.,1998; Pillay et al., 2009; Visciano et al., 2011). The generation of
∗ Corresponding author. Tel.: +34 93 581 4794; fax: +34 93 581 2013.
E-mail addresses: [email protected], [email protected]
(M.M. Segura).
HIV-1 Gag VLPs using mammalian cells is less reported in the lit-erature (Hammonds et al., 2007; Jalaguier et al., 2011), with noreports describing their production in suspension cell cultures.
The development of a scalable HIV-1 Gag VLP production strat-egy in human embryonic kidney 293 (HEK 293) suspension cellcultures is reported in this work. An improved culture mediumsupplemented with non-animal derived components was devel-oped. The need for removal of serum from industrial manufacturingprocesses was recognized decades ago. In order to ensure cellline growth and productivity, early developments in serum-freemedia (SFM) resulted in formulations containing components nor-mally supplied by serum such as insulin, transferrin and lipids ofanimal origin as well as other poorly defined mixtures (extracts,hydrolysates) (Keenan et al., 2006). However, during the past fewdecades there has been increasing safety concerns associated tothe emergence of new viruses and prion strains prompting reg-ulatory authorities to recommend the use of not only SFM butalso animal-derived component free (ADCF) media formulationsfor the manufacture of biopharmaceutical products. The increasing
0168-1656/$ – see front matter © 2013 Elsevier B.V. All rights reserved.http://dx.doi.org/10.1016/j.jbiotec.2013.05.001

L. Cervera et al. / Journal of Biotechnology 166 (2013) 152– 165 153
number of ADCF and chemically defined (CD) media formulationsavailable in the market and the relatively recent commercial avail-ability of recombinant versions of key serum proteins produced inEscherichia coli or yeast (e.g. albumin and transferrin), as well assupplements of plant origin or synthetic nature should facilitatethe switch to efficient animal-derived component-free productionprocesses.
Design of experiments (DoE) has been chosen as a valuable toolfor medium optimization. Statistically relevant information can beextracted from experimental designs with a minimum number ofexperiments. Non-animal derived additives evaluated in this workinclude three recombinant proteins (r-albumin, r-transferrin andr-insulin) and an in-house designed animal-component free lipidmixture containing synthetic cholesterol and fatty acids. A two-phase experimental design was used. Screening of componentswas performed in a first phase using a Plackett–Burman experi-mental design (Plackett and Burman, 1946). In a second phase, aresponse surface methodology (Box–Behnken design) was used todetermine optimal concentration levels for each component show-ing a significant effect on HEK 293 cell growth (Box and Behnken,1960). The performance of the optimized cell culture medium forthe production of HIV-1 Gag VLPs was evaluated.
The selected production method was transient gene expression(TGE) as it offers a convenient means for the generation of recombi-nant products for pre-clinical and early clinical phases (Baldi et al.,2007; Geisse, 2009; Pham et al., 2006). TGE becomes particularlyattractive when a large number of product variants needs to betested and/or in cases where the expression of cytotoxic genescomplicate the generation of stable cell clones, which is the casefor HIV-1 VLPs. Considerable progress has been made in the pastseveral years toward establishing large-scale transient transfectionprotocols (Backliwal et al., 2008a; Durocher et al., 2002; Geisse andHenke, 2005; Pham et al., 2003; Tuvesson et al., 2008). HEK 293is the preferred host system due to the many industrially relevantfeatures this cell line offers including ease of genetic manipulation,ability to grow in suspension culture, ability to grow to high cellulardensities and adaptation to serum-free culture conditions. In addi-tion, the HEK 293 cell line and its variants (e.g. HEK 293T, HEK 293E)are used for the production of many virus-based products includingviral vaccines and most viral vectors (Durocher et al., 2007; Ghaniet al., 2006; Kamen and Henry, 2004; Le Ru et al., 2010; Segura et al.,2007). Moreover, HEK 293 cells are rapidly gaining industry accep-tance as they have been approved for the production of the firstadenovirus-based gene therapy product (Gendicine®) in China anda therapeutic recombinant protein (Xigris®) by FDA and EMA.
2. Materials and methods
2.1. Cell line, media and culture conditions
The cell line used in this work is a serum-free suspension-adapted HEK 293 cell line (HEK293SF-3F6) kindly provided by Dr.Amine Kamen at the National Research Council of Canada (Mon-treal, Canada). It was derived from a cGMP master cell bank thatis available for manufacturing of clinical material. Five commercialserum-free media formulations for HEK 293 were tested for cellgrowth, transfection efficiency and VLP production. These includeHyQ SFM4 Transfx293 from HyClone Thermo Scientific (Logan, UT,USA), ExCell 293 from SAFC Biosciences (Hampshire, UK), Freestyle293, CD 293 and 293 SFM II from Invitrogen (Carlsbad, CA, USA).All formulations were supplemented with GlutaMAXTM (4–6 mM)(Invitrogen, Paisley, UK) with the exception of Freestyle 293 mediathat already contains GlutaMAXTM in its formulation. Freestyle293 medium and 293 SFM II medium were also supplementedwith 0.1% Pluronic® (Invitrogen). Cell cultures were pre-adapted
to each formulation prior to experimentation. An YSI 7100 MBSglucose/lactate/glutamine analyzer (YSI, Yellow Springs, OH, USA)was used to measure the concentrations of the major nutrientsand by-products in cell culture supernatants. Cells were routinelymaintained in 125-mL disposable polycarbonate Erlenmeyer flasks(Corning, Steuben, NY, USA) in 20 mL of culture medium. Flaskswere shaken at 110 rpm using an orbital shaker (Stuart, Stone, UK)placed in an incubator maintained at 37 ◦C in a humidified atmo-sphere of 5% CO2 in air. Cell count and viability were determinedusing trypan blue and a microscope counting chamber.
2.2. Transient transfection
The pGag-EGFP plasmid used in this work codes for a Rev-independent HIV-1 Gag protein fused in frame to the enhanced GFP(Hermida-Matsumoto and Resh, 2000). The plasmid from the NIHAIDS Reagent Program (Cat 11468) was constructed by cloning theGag sequence from pCMV55M1-10 (Schwartz et al., 1992) into thepEGFP-N1 plasmid (Clontech, Palo Alto, CA, USA). The plasmid wasprepared and purified as previously described (Segura et al., 2007).HEK 293 suspension cells were transiently transfected using 25-kDa linear polyethylenimine (PEI) (PolySciences, Warrington, PA,USA). Transfections were performed using a final DNA concentra-tion of 1 �g/mL of media unless otherwise stated and a DNA to PEImass ratio of 1:2. PEI/DNA complexes were formed by adding PEIto plasmid DNA diluted in fresh culture media (10% of the totalvolume of the culture to be transfected). The mixture was incu-bated for 15 min at room temperature to allow complex formationprior to its addition to the cell culture. The percentage of GFP posi-tive cells was assessed using a BD FACS Canto flow cytometer (BDBiosciences, San Jose, CA, USA) at different hours post-transfection(hpt).
2.3. Fluorescence confocal microscopy
The visualization of VLP producer cells was achieved using aFluoview® FV1000 confocal microscope (Olympus, Tokyo, Japan).Transfected cells were mixed with 0.1% of Hoechst (Invitrogen,Eugene, OR, USA) and 0.1% of CellMaskTM (Invitrogen) in orderto stain the cell nucleus and lipid membrane, respectively. Twowashes were performed by centrifuging the cells at 300 × g for5 min and resuspending the pellets in PBS. Samples were placed in35 mm glass bottom petri dishes with 14 mm microwell (MatTekCorporation, Ashland, MA, USA) for visualization.
2.4. Transmission electron microscopy
Gag-GFP VLP samples were prepared by air-dried negative stain-ing method at the Servei de Microscòpia (UAB, Spain). Briefly, 5 �Lof the mixture were placed on carbon-coated copper grids and incu-bated at room temperature for 5 min. Excess sample was carefullydrained off the grid with the aid of filter paper. Samples were neg-atively stained with 5 �L of uranyl acetate (2%) by incubation for1 min at room temperature. Excess stain was drained off as beforeand grids were dried for a minimum of 50 min at room temperaturebefore the examination in a Jeol JEM-1400 transmission electronmicroscope equipped with a Gatan ES1000W Erlangshen CCD Cam-era (Model 785).
2.5. VLP quantitation
The concentration of Gag-GFP VLPs was assessed by fluorime-try using an in-house developed and validated quantification assay(Gutiérrez-Granados et al., 2013). VLP containing supernatantswere recovered by cell culture centrifugation at 1000 × g for 5 min.Green fluorescence was measured at room temperature using a

154 L. Cervera et al. / Journal of Biotechnology 166 (2013) 152– 165
Table 1
HEK 293 growth kinetics and PEI compatibility in various commercially available serum-free media formulations.
Medium Chemical definition Max cell density (cells/mL) Viability at max cell density (%) t1/2 (h) PEI compatibility
HyQ SFM4 Transfx 293 ADCF 2.9 × 10⁶ 90 33.6 Yes
Excell 293 ADCF 4.5 × 10⁶ 91 36.3 No
Freestyle 293 CD 2.9 × 10⁶ 92 33.1 Yes
SFM II 293 ADCF 2.8 × 10⁶ 99 52.0 No
CD 293a CD – – – n.a.
Abbreviations: Max: maximum; t1/2: duplication time; PEI: polyethilenimine; ADCF: animal-derived component free; CD: chemically defined; n.a.: not applicable.a The HEK 293 suspension cell line used in this work could not be grown in CD293 medium.
Cary Eclipse Fluorescence Spectrophotometer (Agilent Technolo-gies, Santa Clara, CA, USA) set as follows: �ex = 488 nm (slit 5 nm),�em = 510 nm (slit 10 nm). Relative fluorescence units values (RFU)were calculated by subtracting fluorescence units (FU) values ofuntransfected negative control samples. There is a linear corre-lation between fluorescence intensity and p24 values determinedusing the INNOTEST ELISA HIV antigen mAb (Innogenetics NV, Gent,Belgium). RFU values can be converted to Gag-GFP concentrationvalues using the following equation:
Gag − GFP (ng/mL) = (3.245 × RFU − 1.6833) × 36 (1)
where Gag-GFP is the estimated concentration of polyprotein andRFU is the measured GFP fluorescence intensity in the samples.The first term is the correlation equation between fluorescencevalues and p24 concentrations determined by ELISA and 36 isa correction factor that takes into account the difference inmolecular weight between p24 and Gag-GFP and an underesti-mation arising from using the p24 ELISA to estimate p55 Gagconcentrations.
2.6. VLP recovery from cell culture supernatants
VLPs were isolated from cell culture supernatants follow-ing a standard procedure used for retrovirus particle separationconsisting on virus pelleting by ultracentrifugation followed bysize-exclusion chromatography (SEC) (Transfiguracion et al., 2003).Briefly, clarified VLP supernatants were obtained by low speedcentrifugation (500 × g for 15 min at 4 ◦C) of cell cultures har-vested 48 hpt. Viral pellets were obtained by ultracentrifugationthrough a 30% sucrose cushion (3 mL) at 26,000 rpm (115,254 × g)for 3 hours at 4 ◦C using a SW32 rotor and a Optima L100XP Beck-man ultracentrifuge. The pellets were resuspended in pre-chilledPBS (250 �L/tube) and incubated at 4 ◦C for 2 h. For residual nucleicacid removal, samples were subjected to Benzonase® (Merck Mil-lipore, Germany) treatment for 1 h at room temperature using anenzyme concentration of 200 U/mL. The concentrated VLPs wereanalyzed by SEC using an ÄKTA ExplorerTM 100 low-pressureliquid chromatography system controlled by UNICORN software(GE Healthcare, Sweden). For this purpose, Sepharose 6FF resin(GE Healthcare) was packed into a XK 16/70 column (GE Health-care) to a final bed volume of 130 mL. The void volume of thecolumn was determined using Blue Dextran 2000 (HMW cali-bration kit, GE Healthcare). Prior to VLP separation, the columnwas washed with 3 column volumes of degassed Milli-Q waterand equilibrated with 1 CV of PBS pH 7.4 at 2 mL/min (60 cm/h).Concentrated VLPs obtained by ultracentrifugation (3 mL) werefiltered through 0.45 �m pore-size syringe-mounted filters andloaded into the column. Isocratic elution in PBS (pH 7.4) wascarried out at a flow rate of 2 mL/min (60 cm/h). Absorbanceat 280 nm and 260 nm was measured on-line. Fractions (2.5 mL)were collected using a Frac 950 fraction collector (GE Health-care) throughout the chromatography run and further analyzed byfluorometry.
2.7. Cell cycle analysis
Freshly harvested cells were pelleted by centrifugation, rinsed,re-suspended in PBS and fixed with cold ethanol (70%) for a mini-mum of 2 h at −20 ◦C. For cell cycle analysis, cells were stained withpropidium iodide (PI) (Sigma) for 30 min at room temperature priorto data acquisition using a FACSCalibur (BD Biosciences, San Jose,CA, USA). The Modfit software (Verity Software House, Topsham,ME, USA) was used for data analysis.
2.8. Medium optimization using statistically designedexperiments
Non-animal derived media components used for mediumsupplementation (DoE variables) included 3 recombinant proteins(albumin, transferrin and insulin) (Merck Millipore, Kankakee, IL,USA) and an in-house lipid mixture. The lipid mixture was preparedin a 100-fold concentrated stock containing synthetic cholesterol(100× Synthecol, Sigma), fatty acids (100× F7050, Sigma), tocoph-erol acetate (0.2 mg/mL T1157, Sigma) and the emulsifying agentpolysorbate 80 (2.5 mg/mL P4780, Sigma). In order to determinemaximum cell density attainable (DoE response) under each exper-imental condition analyzed, HEK 293 cells were seeded at a densityof 0.3 × 10⁶ cells/mL and their growth kinetics were analyzed dur-ing 10 days as the maximum cell density time differed for eachcondition.
2.8.1. Plackett–Burman designA fractional factorial Plackett–Burman design was used to iden-
tify supplements with a significant effect on HEK 293 cell growthand screen out irrelevant variables. The four selected variables werescreened at two levels: a low level (no additive) coded as −1 and ahigh level coded as +1 as indicated in Table 2. High levels for eachvariable were defined based on pre-existing knowledge extractedfrom the literature (Keenan et al., 2006).
The main effects of independent variables on HEK 293 cellgrowth were calculated using the following equation:
Eij = ˙Yj(+)
n/2− ˙Yj(−)
n/2(2)
where Eij is the effect of the variable i on the response Yj when thevariable is used at its high level Yj(+) or low level Yj(−), and n is thenumber of experimental runs.
Plackett–Burman experimental results were fitted to a first-order polynomial function described below by regression analysis:
Y = ˇ0 +∑
ˇiXi (3)
where Y is the response (in million cells/mL), ˇ0 is the model inter-cept and ˇi is the linear coefficient for the independent variableXi.
2.8.2. Box–Behnken designIn order to define the optimal concentration for each supple-
ment selected in the previous step, a Box–Behnken design was used.

L. Cervera et al. / Journal of Biotechnology 166 (2013) 152– 165 155
The three significant variables were screened at three levels: a lowlevel coded as −1, a medium level coded as 0 and a high level codedas +1 as indicated in Table 3. Box–Behnken experimental resultswere fitted to a second-order polynomial equation described belowby non-linear regression analysis:
Y = ˇ0 +∑
ˇiXi +∑
ˇiiX2i +
∑ˇijXiXj (4)
where Y is the response (in million cells/mL), ˇ0 is the offset term,ˇi the linear coefficient, ˇii the quadratic coefficient, ˇij the inter-action coefficient and Xi and Xj are the independent variables. Thisequation was used to predict the optimum values of the indepen-dent variables using the solver feature of Microsoft Excel 2007.Three-dimensional surface plots were generated to facilitate modelinterpretation.
2.8.3. Statistical analysesStatistical analyses of the models were performed using Sigma
Plot 11.0 (Systat Software Inc.) or Design-Expert® 8 Software (Stat-Ease, Inc.). The quality of the fit of the model equation is expressedby the coefficient R2 obtained by regression analysis. Additionally,a lack of fit test was performed in order to compare the exper-imental error to the prediction error. The overall significance ofthe model was determined by analysis of variance (ANOVA) F-test,whereas the significance of each coefficient was determined by thecorresponding t-test.
2.9. Quantification of Gag-GFP VLPs by nanoparticle trackinganalysis (NTA)
Quantification of VLPs was performed using a NanoSight®
LM20 device (NanoSight Ltd., Amesbury, UK) at the Institut deCiència de Materials de Barcelona (ICMAB, CSIC, Campus UAB).NanoSight® NTA 2.2 software was employed for analyses. Sampleswere diluted in 0.22 �m-filtered PBS prior to injection in the devicechamber in order to obtain samples with a concentration around108 particles/mL. Three injections of the sample and three inde-pendent analyses were carried out. Videos of 60 s were recordedand subsequently, particles were identified and tracked by theirBrownian motion at room temperature. NTA software alloweddetermining the number of VLPs/mL from the tracking data. As theaverage statistical mode obtained was 154 nm, only nanoparticlesin the range of 100 and 200 nm were quantified.
3. Results
3.1. Identification of basal serum-free medium forsupplementation
Five serum-free commercially available formulations specificfor HEK 293 suspension growth were selected with the aid ofthe “good cell culture” interactive online database (Brunner et al.,2010). All formulations tested are also free of supplements of ani-mal origin. According to the degree of chemical definition theycan be classified either as ADCF or CD (Table 1). The latter donot contain hydrolysates or components of unknown composi-tion and therefore are completely defined regarding their chemicalcomposition. Nonetheless, the exact composition of the media isproprietary to the manufacturers. In preliminary experiments, HEK293 growth kinetics in batch culture in the different formulationswas evaluated (Fig. 1A). HEK 293 cells were subcultured directlyinto HyQ SFM4 Transfx293 (HyQ), Excell 293 (Excell), Freestyle293 (Freestyle) and 293 SFM II (SFM II) media formulations requir-ing little or no adaptation. Cells maintained a high viability (>90%)and showed a doubling time of 33–52 h during the exponentialgrowth phase (Table 1 and Fig. 1A). The maximum cell density
Fig. 1. Growth kinetics of HEK 293 in batch culture in different culture media.
(A) Exponentially growing cells were seeded at 0.3 × 10⁶ cells/mL in 125-mL flasks.
Cell density and viability in each culture media were determined every 24 h. Mean
values ± standard deviation of triplicate experiments are represented. (B) and (C)
Generation of VLPs by transient transfection in different culture media. Exponen-
tially growing HEK 293 cells were seeded at 0.5 × 10⁶ cells/mL in 125-mL flasks the
day before transfection. HEK 293 transfection efficiency (B) and VLP fluorescence
intensity (C) in cell culture supernatants were measured. Mean values ± standard
deviation of triplicate experiments are represented.
156 L. Cervera et al. / Journal of Biotechnology 166 (2013) 152– 165
Fig. 2. Transient expression and assembly of Gag-GFP into VLPs. (A) Confocal image of HEK 293 cells transfected in Freestyle medium (72 hpt). Cell nucleus was stained
with Hoechst (blue) (IV) and the lipid membrane with CellMaskTM (red) (II). Gag-GFP is observed in green. The Gag-GFP was found accumulated in close proximity to the
plasma membrane and in specific points inside the cell (III). Co-localization of Gag-GFP (green) and lipid membrane (red) is observed in yellow in the merged image (I). (B)
Fluorescence intensity of cell culture supernatants from untransfected (C−) and transfected (C+) cultures 48 hpt and ultracentrifugation fractions. P is the pellet and S is the
supernatant resulting from ultracentrifugation. Mean values ± standard deviation of triplicate experiments are represented. (C) SEC profile of purified VLP samples obtained
by ultracentrifugation. Samples were loaded onto a 130-mL Sepharose 6FF packed column. Viral particles were eluted from the column by isocratic elution in PBS buffer.
Optical density at 260 and 280 nm and green fluorescence intensity were monitored throughout the run. (D) and (E) Negative stain electron microscopy image of Gag-GFP
VLPs. (D) Gag-GFP VLPs (full arrows) and latex beds used for quantitation purposes (empty arrows) are indicated. (E) High magnification images showing roughly spherical
virus particles of ∼140 nm in diameter surrounded by a lipid envelope and containing electrodense material. (For interpretation of the references to color in this figure legend,
the reader is referred to the web version of the article.)
reached varied with the different formulations, being highest inExcell medium (4.5 × 10⁶ cells/mL) but also high in the other threemedia (∼3 × 10⁶ cells/mL). When cell viability started to decrease,the availability of glucose and glutamine was not limiting (glu-cose > 1.2 g/L, glutamine > 1.16 mM) and lactate production did not
exceed 1.8 g/L in any media tested (data not shown). Curiously, thecells did not grow in CD 293 and this medium was not included infurther experiments. While HyQ and Freestyle medium supportedefficient transfection (50 and 70%, respectively, 48 hpt), and conse-quently Gag-GFP production, no transfection was achieved in Excell

L. Cervera et al. / Journal of Biotechnology 166 (2013) 152– 165 157
and SFM II culture media under the conditions tested (Fig. 1B andC). As Freestyle medium has shown to be superior to HyQ in termsof transfection efficiency and Gag-GFP production (as assessed byGFP intensity in cell culture supernatants), it was selected as basalmedium for further optimization by DoE.
3.2. Transient expression and assembly of Gag-GFP into VLPs
A confocal image of HEK 293 producer cells in Freestyle basemedium 72 hpt is shown (Fig. 2A). Upon transfection, Gag-GFPconcentrates in close proximity to the plasma membrane of theproducer cell, site at which the budding process takes place. Addi-tionally, specific sites of Gag-GFP accumulation inside the cell canbe observed (Fig. 2AIII). This result is consistent with the puncti-form distribution of Gag described by Jalaguier et al. (2011) andwith the observation that in epithelial-like 293 cells, HIV-1 assem-bles and buds both at the plasma membrane and in endosomes(Grigorov et al., 2006). Correct assembly of Gag-GFP into VLPs wasconfirmed by isolation of Gag-GFP VLPs from cell culture super-natants. The isolation procedure consisted in VLP pelleting byultracentrifugation followed by further isolation and analysis bySEC. Fluorescence analyses of the fractions obtained upon ultracen-trifugation is shown in Fig. 2B. Following ultracentrifugation, greenfluorescence intensity in the pellet fraction significantly increases.In contrast, the fluorescence intensity in the supernatant fractionobtained after centrifugation is reduced to levels comparable tonegative controls. These results provide a first indication that Gag-GFP in the cell culture supernatant is correctly assembled into virusparticles of the expected size and density as they can be pelletedusing ultracentrifugation procedures commonly used for the sep-aration of retrovirus particles. The composition of the viral pelletwas further analyzed by SEC. The chromatography profile is shownin Fig. 2C. VLPs eluted in a single peak at the SEC column void vol-ume (44 mL) as expected due to their large size. The peak showed acharacteristic OD260/OD280 ratio >1 observed with retrovirus par-ticles. Offline measurement of fluorescence intensity in the elutedfractions allowed detection of a fluorescent peak overlapping withthat observed by UV online monitoring (Fig. 2C). This result indi-cated that the concentrated pellet obtained by ultracentrifugationcontained fluorescent nanoparticles and was essentially free of sig-nificant protein or nucleic acid contamination. Examination of theultra concentrated material by electron microscopy revealed thepresence of multiple roughly spherical particles of 141 ± 22 nm(n = 100) in diameter consistent with Gag VLPs (Fig. 2D). In highermagnification micrographs it can be observed that the VLPs aresurrounded by a lipid envelope (Fig. 2E).
3.3. Medium optimization using design of experiments
3.3.1. Screening of non-animal derived supplements usingPlackett–Burman design
The potential beneficial effect of non-animal derived sup-plements on HEK 293 cell growth was investigated using aPlackett–Burman design of experiments. Non-animal derived addi-tives evaluated included three recombinant proteins (r-albumin,r-transferrin and r-insulin) and an in-house designed animal-component free lipid mixture composed of synthetic cholesterol,fatty acids, tocopherol acetate and tween 80. The experimentaldesign matrix in coded values, response and statistical analysis areshown in Table 2. Estimation of the main effect for each variableaccording to Eq. (2) indicated that the in-house developed lipidmixture had the greatest positive effect on cell growth (Fig. 3A).Recombinant insulin and transferrin also showed a pronouncedpositive effect on cell growth, whereas r-albumin had no effect.The ANOVA F test associated p-value for each regression coefficientcan also be used as an indicator of the statistical significance of the
Table 2
Matrix design, response and ANOVA analysis for Plackett–Burman design.
Exp no. X X1 X2 X3 Response a Response b
1 +1 +1 +1 +1 4.84 5.04
2 −1 +1 −1 +1 4.84 4.16
3 −1 −1 +1 −1 3.72 3.84
4 +1 −1 −1 +1 3.84 3.72
5 −1 +1 −1 −1 4.00 3.24
6 −1 −1 +1 −1 2.76 3.04
7 −1 −1 −1 +1 4.00 4.35
8 +1 −1 −1 −1 3.00 2.88
9 +1 +1 −1 −1 3.24 3.06
10 +1 +1 +1 −1 4.40 4.45
11 −1 +1 +1 +1 4.48 5.20
12 +1 −1 +1 +1 4.65 4.40
Coefficient t-Value p-Value
Constant 3.96500 52.0840 <0.001
X −0.00458 −0.0602 0.953
X1 0.28100 3.6950 0.002
X2 0.27000 3.5530 0.002
X3 0.49500 6.5080 <0.001
All variables were studied at two levels: a low level (no additive) coded as −1 and
a high level coded as +1 being 1 g/L for r-albumin (X), 10 mg/L for r-insulin (X1),
10 mg/L for r-transferrin (X2) and 1X for the lipid mixture (X3). Responses a and b
are maximum cell density values from duplicate experiments in millions of cells/mL.
Abbreviations: Exp. no.: experiment number; r-: recombinant.
factors. Variables with a p-value lower than 0.05 were acceptedas significant factors affecting HEK 293 growth. These include r-insulin and r-transferrin with p < 0.005 and the lipid mixture witha p < 0.001. The effect of r-albumin was not statistically significant(p > 0.10). The three components showing a significant effect onHEK 293 cell growth were selected for further optimization exper-iments.
3.3.2. Optimizing the concentration of non-animal derivedsupplements using Box–Behnken design
A three-factor, three-level Box–Behnken experimental designwas used to further optimize the concentrations of r-insulin, r-transferrin and lipid mixture in the culture medium. Table 3outlines the experimental design matrix in coded values, responseand statistical analysis of the method. These data were fitted to thesecond-order polynomial Eq. (4) by non-linear regression analysis.The generated model equation is:
Y = 4.53 + 0.63X1 − 0.17X2 − 0.41X3 − 0.68X1X2 + 0.02X1X3
−0.07X2X3 − 0.18X21 − 0.45X2
2 − 1.02X23
where Y is the maximum cell density (in million cells/mL), X1 is thecoded value for r-insulin, X2 the coded value for r-transferrin andX3 the coded value for lipid mixture.
Regression analysis showed that the model was adequate with acoefficient R2 of 0.8408. This indicates that the model is consistentwith 84% of the variability in the data. The correlation betweenthe experimental and predicted responses is observed in Fig. 3B.The lack of fit parameter is p = 0.0893, as it is not significant at0.05 level, the prediction error is less than the experimental errorand the model is consistent with the data. The statistical signifi-cance of the model was confirmed by ANOVA analysis. The Fisher’sF-test associated p-value of <0.0001 indicated the model was sig-nificant. The second-order polynomial model was used to calculateoptimal factor levels and construct response surface graphs. Bysolving the model equation, optimum concentrations of r-insulin, r-transferrin and lipid mixture in Freestyle medium were calculatedas 19.8 mg/L, 1.6 mg/L and 0.9X, respectively. Under these condi-tions the predicted response was 5.4 × 10⁶ cells/mL, almost doublethe cell density attained using unsupplemented Freestyle medium.Three-dimensional plots were constructed for visual observation

158 L. Cervera et al. / Journal of Biotechnology 166 (2013) 152– 165
Fig. 3. Medium optimization by design of experiments. (A) Main effect of non-animal derived supplements on HEK 293 cells growth in Freestyle medium according to
Plackett–Burman DoE Eq. (2). (B) Correlation between the experimental and Box–Behnken model predicted cell densities in million cells/mL. Response surface graphs based
on Box–Behnken experimental results. These 3D graphs were constructed by depicting two variables at a time while keeping the third one at its middle level. HEK 293
maximum cell density as a function of the concentrations of (C) lipid mixture (X) vs. r-transferrin (mg/L), (D) lipid mixture (X) vs. r-insulin (mg/L) and (E) r-transferrin (mg/L)
vs. r-insulin (mg/L). Cell density values presented are in millions of cells/mL.
of the trend of maximum responses and the interactive effects ofthe significant variables on the response (Fig. 3C–E). Evaluationof the response over the experimental region indicates that theoptimum level of lipid mixture is in the middle of the evaluated con-centration range, whereas optimal concentrations of r-transferrinand r-insulin are toward the edge of the range of concentrationstested. This was in agreement with the calculations obtained withthe model.
3.3.3. Validation of the modelIn order to validate the model, a verification experiment was car-
ried out. Under the optimal culture medium conditions predictedby the model, a maximum cell density of 5.4 ± 0.3 × 10⁶ cells/mLwas reached (n = 3) (Fig. 4), just as predicted, confirming the modeladequacy. An additional experiment was carried out to ensure thatthe optimal concentration of r-insulin was well established. HEK293 growth kinetics in the presence of 20, 40 or 60 mg/L of r-insulin was evaluated (n = 3). The concentration of r-transferrinand lipid mixture was kept at optimal levels in all experiments.All growth curves were similar to the one shown in Fig. 4, regard-less of the concentration of insulin used (data not shown). Thisindicated that increasing the concentration of r-insulin would notresult in further media improvement. It is worth mentioning thateven though formation of small cell clumps (4–6 cells/clump) wastypically observed at high cellular densities (2–3 × 10⁶ cells/mL)when growing cells in unsupplemented Freestyle medium, no cell
aggregation was observed in the presence of the supplement mix-ture, even at high cellular densities.
3.4. Evaluating the performance of the supplemented medium
3.4.1. Effect of cell density on transfection efficiency and VLPproduction
The production of VLPs by PEI-mediated transient transfectionin the supplemented cell culture medium was evaluated. Accord-ing to TEM, the additives had no obvious effect on VLP structure asthe size and morphology were preserved (data not shown). Fig. 5shows the % of GFP transfected cells and the fluorescence intensityof supernatants from cultures transfected at different cell densitiesin unsupplemented Freestyle medium (Fig. 5A and B) and sup-plemented Freestyle medium (Fig. 5C and D). In general terms,it was observed that both the percentage of GFP positive cellsand fluorescence intensity in supernatants increased over time.In addition, the percentage of GFP positive cells declined as thecell density at the time of transfection increased. Compared tothe unsupplemented medium, transfection efficiency was usuallylower in the supplemented medium, although only a minor dif-ference (∼10%) was observed (Fig. 5A and C). However, in terms ofVLP production, the supplemented Freestyle medium showed to besuperior. Best results in unsupplemented Freestyle were obtainedwhen transfecting cells at 1 × 10⁶ cells/mL (10.3 ± 0.5 F.U., 48 hpt),whereas the optimal concentration in supplemented Freestyle

L. Cervera et al. / Journal of Biotechnology 166 (2013) 152– 165 159
Table 3
Matrix design, response and ANOVA analysis for Box–Behnken experimental design.
Exp. no. X1 X2 X3 Response a Response b
1 −1 −1 0 3.08 3.12
2 +1 −1 0 5.92 5.04
3 −1 +1 0 3.68 3.68
4 +1 +1 0 3.00 3.68
5 −1 0 −1 3.20 3.08
6 +1 0 −1 4.32 4.92
7 −1 0 +1 2.12 1.88
8 +1 0 +1 3.32 3.80
9 0 −1 −1 3.52 2.88
10 0 +1 −1 3.76 3.16
11 0 −1 +1 2.64 2.96
12 0 +1 +1 3.12 2.40
13 0 0 0 4.88
13 0 0 0 4.88
13 0 0 0 3.84
Coefficient t-Value p-Value
Constant 4.5333 16.8051 <0.0001
X1 0.6350 5.4362 <0.0001
X2 −0.1675 −1.4340 0.1697
X3 −0.4125 −3.5314 0.0026
X1·X2 −0.6800 −4.1164 0.0007
X1·X3 0.0200 0.1211 0.9051
X23
−1.0242 −5.2089 <0.0001
X2·X3 −0.0750 −0.4540 0.6556
X21
−0.1792 −0.9112 0.3749
X22
−0.4542 −2.3099 0.0337
All variables were studied at 3 levels: a low level coded as −1, a medium level coded
as 0 and a high level coded as +1 being 1, 10 and 20 mg/L for r-insulin (X1), 1, 10 and
20 mg/L for r-transferrin (X2) and 0.1, 1 and 2X for the lipid mixture (X3). Responses
a and b are maximum cell density values from duplicate experiments (runs 1–12)
in millions of cells/mL. Run 13 was performed in triplicate because it was the center
point.
Abbreviations: Exp. no.: experiment number; r-: recombinant.
Fig. 4. Model validation. HEK 293 cell growth in Freestyle medium supplemented
with the optimal levels of non-animal derived supplements were seeded at
0.3 × 10⁶ cells/mL in 125 mL flasks. Cell density, viability, glucose, glutamine and
lactic acid concentrations were determined daily. Mean values ± standard deviation
of triplicate experiments are represented.
was 2 × 10⁶ cells/mL (16.8 ± 0.4 F.U., 48 hpt) (Fig. 5B and D) rep-resenting an improvement of 1.6-fold. The best producing celldensity coincides with the mid-log phase density in each cul-ture medium since cells grow up to 2.9 × 10⁶ cells/mL in Freestyleand 5.4 × 10⁶ cells/mL in supplemented Freestyle medium. There-fore, production in supplemented Freestyle medium was increasedproportionally to the improvement in cell growth (1.9-fold). Athigh cell densities (beyond the mid-log phase point), VLP produc-tion decreases drastically. This decrease in production efficiency athigher cell densities is accompanied with a decrease in transfectionefficiency observed at higher cell concentrations. In an attempt toovercome this problem, a medium exchange just prior to transfec-tion was performed (Fig. 5E and F). VLP production was significantlyimproved with medium exchange at all cell densities. However, interms of transfection efficiency a significant increase was observedat high cell densities (3–5 × 10⁶ cells/mL) whereas transfectionefficiency was negatively affected by medium exchange at lowcell densities (0.5–2 × 10⁶ cells/mL). The best production perfor-mance in supplemented Freestyle media with medium exchangewas also achieved at mid-log phase between 2 and 3 × 10⁶ cells/mL(23.8 ± 1.0 F.U. and 25.0 ± 0.7 F.U. respectively, 48 hpt). This equalsto 2.8 �g of Gag-GFP/mL according to the in-house validated Gag-GFP VLP quantitation method (Eq. (1)). VLP concentrations obtainedunder optimal conditions were also determined using nanoparticletracking analysis (NTA) giving a total of 2.7 × 10⁹ VLPs/mL. Consid-ering both values and the molecular weight of Gag-GFP, a roughestimation of ∼7700 Gag-GFP copies/VLP was obtained, which iswithin the expected range according to published literature (Briggset al., 2004; Carlson et al., 2008; Chen et al., 2009). This productionis 1.5-fold higher than that observed without medium exchange.Overall, by using supplemented Freestyle medium with mediumexchange, production of VLPs was increased 2.4-fold.
3.4.2. Effect of DNA/PEI complex concentration on transfectionefficiency and VLP production
Since the experiments described above were carried out usingstandard transient transfection conditions (1 �g of DNA/mL of cul-ture and a DNA to PEI ratio of 1:2) optimized for transfecting1 × 106 cells/mL (Geisse et al., 2005; Tom et al., 2008) the pos-sibility that the DNA/PEI complex concentration was insufficientto efficiently transfect higher cell densities was investigated. Asboth PEI and HIV-1 Gag have known cytotoxic effects at high con-centrations (Ansorge et al., 2009; Aravindan et al., 2009; Gebhartand Kabanov, 2001; Hammonds et al., 2007), the effect of DNA/PEIcomplex concentrations on cell density and viability was evalu-ated 48 hpt (Fig. 6A). Cells were transfected at a concentration of1 × 106 cells/mL. In the absence of DNA/PEI complex or the presenceof very low amounts (0.1 �g of DNA/mL, data not shown), cells grewfrom 1 to almost 3 × 10⁶ cells/mL while maintaining high viability(Fig. 6A). However, cell density and viability drop in a dose depend-ent manner when the complex concentration is increased. Over3 �g of DNA/mL, cells present a viable density lower than at the timeof transfection, indicating a high DNA/PEI toxicity. Transfectionefficiency is maintained around 50–60% regardless of the concen-tration of complex used (Fig. 6B). However, the concentration ofVLPs in harvested supernatants gradually declines with increasingDNA/PEI concentrations (Fig. 6B), in agreement with the cytotoxic-ity observed. To test whether transfection efficiency, particularly atcell densities over 1 × 10⁶ cells/mL, could be improved by increas-ing the amount of DNA/PEI used for transfection, cells were seededfrom 0.5 × 10⁶ to 4 × 10⁶ cells/mL and transfected with increas-ing complex concentrations (1–3 �g of DNA/mL). No significantimprovement in the transfection efficiency nor the VLP produc-tion was observed with higher concentrations of DNA/PEI complex(Fig. 6C and D) at any cell density tested. As previously observed

160 L. Cervera et al. / Journal of Biotechnology 166 (2013) 152– 165
Fig. 5. Effect of the cell density on transfection efficiency and VLP production. HEK 293 cells were seeded at 0.3 × 10⁶ cells/mL in 125-mL flasks and allowed to grow to the
desired cell concentration. Cell densities ranged between 0.5 and 3 × 10⁶ cells/mL for Freestyle medium (A and B) and between 0.5 and 5 × 10⁶ cells/mL for supplemented
Freestyle medium either without (C and D) or with (E and F) medium exchange performed before transfection. Cells were transfected with 1 �g of DNA/mL of culture and
a DNA to PEI mass ratio of 1:2. HEK 293 transfection efficiency (A, C and D) and VLP fluorescence intensity (B, D and F) in cell culture supernatants were measured. Mean
values ± standard deviation of triplicate experiments are represented.
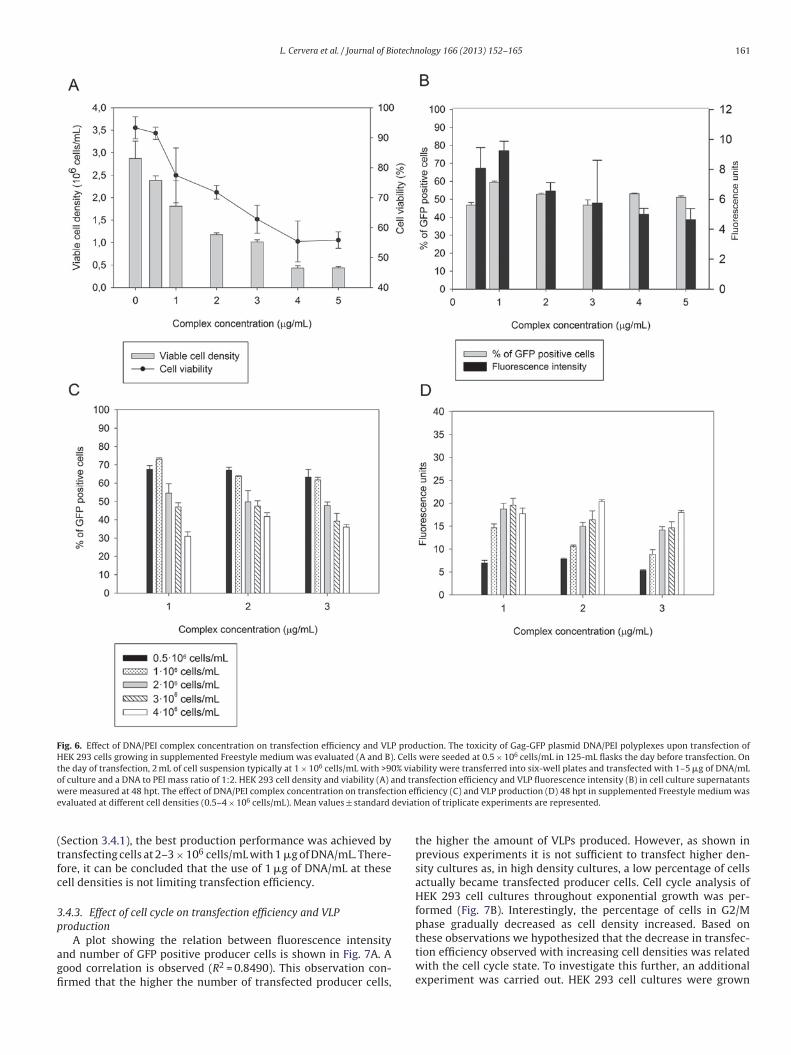
L. Cervera et al. / Journal of Biotechnology 166 (2013) 152– 165 161
Fig. 6. Effect of DNA/PEI complex concentration on transfection efficiency and VLP production. The toxicity of Gag-GFP plasmid DNA/PEI polyplexes upon transfection of
HEK 293 cells growing in supplemented Freestyle medium was evaluated (A and B). Cells were seeded at 0.5 × 10⁶ cells/mL in 125-mL flasks the day before transfection. On
the day of transfection, 2 mL of cell suspension typically at 1 × 10⁶ cells/mL with >90% viability were transferred into six-well plates and transfected with 1–5 �g of DNA/mL
of culture and a DNA to PEI mass ratio of 1:2. HEK 293 cell density and viability (A) and transfection efficiency and VLP fluorescence intensity (B) in cell culture supernatants
were measured at 48 hpt. The effect of DNA/PEI complex concentration on transfection efficiency (C) and VLP production (D) 48 hpt in supplemented Freestyle medium was
evaluated at different cell densities (0.5–4 × 10⁶ cells/mL). Mean values ± standard deviation of triplicate experiments are represented.
(Section 3.4.1), the best production performance was achieved bytransfecting cells at 2–3 × 10⁶ cells/mL with 1 �g of DNA/mL. There-fore, it can be concluded that the use of 1 �g of DNA/mL at thesecell densities is not limiting transfection efficiency.
3.4.3. Effect of cell cycle on transfection efficiency and VLPproduction
A plot showing the relation between fluorescence intensityand number of GFP positive producer cells is shown in Fig. 7A. Agood correlation is observed (R2 = 0.8490). This observation con-firmed that the higher the number of transfected producer cells,
the higher the amount of VLPs produced. However, as shown inprevious experiments it is not sufficient to transfect higher den-sity cultures as, in high density cultures, a low percentage of cellsactually became transfected producer cells. Cell cycle analysis ofHEK 293 cell cultures throughout exponential growth was per-formed (Fig. 7B). Interestingly, the percentage of cells in G2/Mphase gradually decreased as cell density increased. Based onthese observations we hypothesized that the decrease in transfec-tion efficiency observed with increasing cell densities was relatedwith the cell cycle state. To investigate this further, an additionalexperiment was carried out. HEK 293 cell cultures were grown

162 L. Cervera et al. / Journal of Biotechnology 166 (2013) 152– 165
Fig. 7. Effect of cell cycle on transfection efficiency and VLP production. Correlation between the number of GFP positive producer cells and VLP fluorescence 48 hpt as
obtained from data presented in Fig. 6C and D. The number of GFP positive cells was calculated as viable cell density times the % of GFP positive cells (A). Percentage of cells
in G2/M phase throughout cell culture growth (B). Cells were seeded at 0.25 × 10⁶ cells/mL in 125-mL shake flasks. Cell density, cell viability and percentage of cells in G2/M
phase were monitored until the culture reached 4 × 10⁶ cells/mL. Cell cycle analysis of the cells grown up to 1 × 10⁶ cells/mL or 4 × 10⁶ cells/mL (C). Percentage GFP positive
cells 24 hpt of cultures grown to 1 × 10⁶ cells/mL (control early log phase) and the same cells concentrated to 4 × 10⁶ cells/m and cultures grown to 4 × 10⁶ cells/mL (control
late log phase) and the same cells diluted to 1 × 10⁶ (D). In all cases a complete medium exchange prior to transfection was performed.
to 1 × 10⁶ cells/mL (early log-phase) or 4 × 10⁶ cells/mL (late log-phase). Following medium exchange, cells were re-suspended infresh medium to either 1 or 4 × 10⁶ cells/mL and transfected withGag-GFP plasmid. As expected, the percentage of cells in G2/Mphase at the time of transfection was lower for cells derived fromcultures in late log-phase (grown to 4 × 10⁶ cells/mL) (12.1%) thancells in early log-phase (grown to 1 × 10⁶ cells/mL) (23.9%) (Fig. 7C).Transfection efficiencies were analyzed 24 hpt and results areshown in Fig. 7D. As previously observed, transfection efficiency24 hpt was around 50% for cells in early log-phase transfectedat 1 × 10⁶ cells/mL but low (∼18%) for cells in late log-phasetransfected at 4 × 10⁶ cells/mL. Unexpectedly, transfection effi-ciency of cells in early log-phase, concentrated and transfected at4 × 106 cells/mL was significantly lower than 50% (∼30%). Addi-tionally, transfection efficiency of cells in late log-phase, dilutedand transfected at 1 × 10⁶ cells/mL was significantly higher than18% (∼30%). These results suggest that besides the percentage ofcells in G2/M phase, other factors related to the cellular density
influence cell transfection efficiencies. These aspects will be furtherinvestigated in future work.
4. Discussion
HIV-1 Gag VLPs represent an attractive platform for the genera-tion of particulate vaccine candidates. Although there are a numberof reports describing the generation of HIV-1 Gag VLPs using thebaculovirus expression system, to the best of our knowledge theproduction of these VLPs using an industrially relevant suspen-sion adapted mammalian cell line, such as the GMP-compliantHEK 293 used in this work, has not yet been reported. The use ofmammalian as opposed to insect cell systems may be preferredfor a number of reasons. For instance, the incorporation of insectproteins or baculovirus-derived proteins, such as the gp64, in thelipid envelope of HIV-1 Gag VLPs is known to provoke a strongimmune response that can potentially mask the response againstthe desired envelope antigen (Deml et al., 2005; Hammonds et al.,

L. Cervera et al. / Journal of Biotechnology 166 (2013) 152– 165 163
2007). In addition, removal of contaminating baculovirus parti-cles during downstream processing is challenging as these virusesshare similar physicochemical properties with VLPs (Deml et al.,2005; Hammonds et al., 2007). Moreover, the post-translationaland proteolytic capabilities of insect cells are not identical to thoseof mammalian cells, which results in VLP structures that do notaccurately mimic authentic HIV-1 particles (Deml et al., 2005;Hammonds et al., 2007).
The use of a culture media devoid of any animal-derived com-pound is critical for the acceptability of vaccine products. SeveralADCF and CD media formulations are commercially available forculture of HEK 293 suspension cells. Our results showed that mostof these media can efficiently support the growth of the HEK 293clone used in this work (HEK293SF-3F6). Similar growth propertieswere observed by other authors working with HEK 293 EBNA cells(Geisse et al., 2005), although they were able to grow this cell linein CD 293 medium. The inability for HEK 293SF-3F6 cells to grow inCD293 (despite repeated attempts) was not investigated, yet, it maybe related with highly specific nutritional requirements that can beencountered with different clones of the same cell line and even dif-ferent sources of the same clone (Butler, 2005). Importantly, not allculture media can be used for PEI-mediated transient transfectionas shown in this work and previously by others (Geisse et al., 2005;Pham et al., 2003; Tom et al., 2008). It has been speculated that thepresence of anti-clumping agents such as heparin or dextran sulfatepolyanions (frequently added to suspension culture media formu-lations to prevent cells from aggregating) interfere with DNA/PEIcomplex entry. More recently, Geng et al. (2007) have shown that, atthe concentrations used in Excell medium, dextran sulfate is able tocompletely inhibit transfection. It has also been reported that thisinhibition can be overcome by using higher amounts of complexthan usual (Backliwal et al., 2008b).
During process development, the use of reporter proteins andmarker genes is extremely common to facilitate quantitation andmonitoring of a product of interest. In this work, we have madeuse of this approach by expressing a Gag-GFP fusion protein thatenabled the generation of fluorescent VLPs that were easily trackedand quantified in cell culture supernatants. The great majorityof Gag-GFP present in cell culture supernatants have shown tobe correctly assembled into virus-like particles as verified in thiswork by isolation of assembled fluorescent Gag-GFP VLPs by ultra-centrifugation followed by subsequent analyses of the pellet andsupernatant fractions by fluorometry and SEC. The fluorescenceintensity in supernatants obtained after ultracentrifugation wasunder the limit of detection confirming the absence or low con-tamination of harvested cell culture supernatants with Gag-GFPmonomers. It should be noted that in the absence of viral pro-tease, HIV-1 maturation (process by which the Gag polyproteinis cleaved into its distinct subunits and the virus particle struc-ture is reorganized) does not take place. Viral particles generatedwere of the expected size (∼140 nm) and morphology as deter-mined by electron microscopy and NTA, consistent with immatureHIV-1 particles (Briggs et al., 2004; Valley-Omar et al., 2011).
The design of a supplemented culture medium for improvedHEK 293 cell growth is reported here. A well established and provenstatistical method for medium optimization was employed. BothHEK 293 cell growth and VLP production were increased in aproportional manner. Further VLP production improvement wasachieved by complete medium replacement at the time of transfec-tion. A similar positive effect of medium exchange on productionhas previously been reported (Backliwal et al., 2008b). The supplyof nutrients in fresh culture medium that might be exhausted in theconditioned medium may contribute to this effect. Notably, the pro-duction improvement is more remarkable at higher cell densitiesand it is accompanied by higher transfection efficiencies suggest-ing potential removal of metabolism by-products present in the
conditioned medium that could interfere with transfection as pre-viously reported (Durocher et al., 2002; Schlaeger and Christensen,1999; Tom et al., 2008). Metabolism by-products are expected tobe more concentrated in conditioned medium of high rather thanlow cell density cultures. A negative effect of medium exchange ontransfection efficiency at low cell densities (0.5–2 × 10⁶ cells/mL)was even observed, which may be attributed to centrifugation (Tomet al., 2008). The overall production improvement was 2.4-fold.This should result in a considerable reduction of the manufacturingcosts considering that the supplements added to the base serum-free medium represent only a small fraction of the medium cost(approximately 25%), not to mention other savings in manufactur-ing expenses associated with the production scale. Although it isrelatively easy to perform discontinuous medium exchange (batchreplacement) at scales of a few liters by centrifugation in the lab-oratory, this operation is not desirable at scales of hundreds tothousands of liters in the industrial setting. At these large scales itis more convenient to use a perfusion process (Altaras et al., 2005).For instance, the medium can be continuously exchanged duringthe cell growth phase prior to transfection by introducing perfusionelements as previously shown (Ansorge et al., 2009).
Further VLP production improvement was limited by a signif-icant loss in transfection efficiency observed at cellular densitiesbeyond the mid-log phase point (2–3 × 10⁶ cells/mL). As transfec-tion efficiency seemed to be critical for any additional processimprovement, the role of several parameters on transfectionefficiency and VLP production were analyzed in this work. No signif-icant improvement in transfection efficiency or VLP production wasobserved by increasing the amount of DNA/PEI used for transfec-tion indicating that DNA/PEI complex concentrations of 0.3–0.5 �gof DNA/million cells are sufficient to efficiently transfect cells. Thisis in line with the concentrations recommended by others work-ing with high cell density cultures (0.4–0.6 �g of DNA/million cells)(Ansorge et al., 2009; Rajendra et al., 2011; Sun et al., 2008; Swiechet al., 2011). These results are also in agreement with those reportedby Carpentier et al. (2007) who concluded that successful trans-gene expression is more likely to depend on a “cellular competentstate” than on the quantity of plasmid DNA delivered per cell. Inthis sense, Brunner and collaborators have indicated that transfec-tion efficiency is strongly dependent on the cell cycle stage at thetime of transfection, with cells in the G2/M phase giving greater lev-els of transfection than G1 cells (Brunner et al., 2000). The authorshave hypothesized that transport of DNA into the nucleus is a veryinefficient process and that transfection of cells shortly before theirnext cell division (close to M phase) is facilitated by nuclear mem-brane breakdown. In support of these studies, Tait et al. (2004) haveshown that both transfection efficiency and protein expression canbe enhanced by arresting cells in G2/M phase using nocodazole.In light of these reports, a further attempt to understand the lossin transfection efficiency observed at high cell densities was car-ried out in this work. In agreement with reported results, it wasobserved that cells grown beyond the mid-log point had a lowerpercentage of cells in G2/M phase. However, this did not seem tobe the only factor controlling transfection efficiency.
To conclude, an optimized HIV Gag VLP production strategyis outlined in this work. The strategy consists in growth of HEK293 cells up to 2–3 × 10⁶ cells/mL (mid-log phase point) in supple-mented Freestyle medium and subsequent transfection with 1 �gof DNA/mL of culture and a DNA to PEI mass ratio of 1:2 after acomplete medium exchange. The strategy should facilitate the gen-eration of sufficient VLP material for pre-clinical studies. By using aGMP-compliant suspension adapted cell line and a culture mediumdevoid of animal-derived components, a fast translation into clini-cal trials is envisioned. It is expected that the ability to transfect aneven higher number of HEK 293 cells should result in further VLPproduction improvement. This may be accomplished by growing
164 L. Cervera et al. / Journal of Biotechnology 166 (2013) 152– 165
cells in fed-batch or perfusion as opposed to batch mode (Ansorgeet al., 2009; Sun et al., 2008) or by arresting cells in G2/M (e.g. usingnocodazole) (Tait et al., 2004) in order to attain a higher number ofVLP producer cells.
Conflict of interest
No conflict of interest to declare.
Acknowledgements
The authors wish to thank Dr. Amine Kamen (NRC, Montreal,Canada) for valuable discussions and for providing the HEK 293cell line used in this study. The following reagent was obtainedthrough the NIH AIDS Reagent Program, Division of AIDS, NIAID,NIH: pGag-EGFP (Cat#11468) from Dr. Marilyn Resh. We wouldalso like to thank Dr. Jorge Carrillo at IrsiCaixa (Badalona, Spain)and Gavin Whissell for helpful advice and comments. The help ofManuela Costa from Institut de Biotecnologia i Biomedicina withFACS analyses and Dr. Salvador Bartolomé from Departament deBioquímica i de Biologia Molecular is appreciated. The recombi-nant albumin was a generous gift from Merck Millipore. This workis supported by a grant of Ministerio de Innovación y Ciencia ofSpain (MICIN BIO2011-2330). Laura Cervera is a recipient of a PIFscholarship from UAB.
References
Altaras, N.E., Aunins, J.G., Evans, R.K., Kamen, A., Konz, J.O., Wolf, J.J., 2005. Productionand formulation of adenovirus vectors. Advances in Biochemical Engineer-ing/Biotechnology 99, 193–260.
Ansorge, S., Lanthier, S., Transfiguracion, J., Durocher, Y., Henry, O., Kamen, A., 2009.Development of a scalable process for high-yield lentiviral vector production bytransient transfection of HEK293 suspension cultures. Journal of Gene Medicine11, 868–876.
Aravindan, L., Bicknell, K.A., Brooks, G., Khutoryanskiy, V.V., Williams, A.C., 2009.Effect of acyl chain length on transfection efficiency and toxicity of polyethylen-imine. International Journal of Pharmaceutics 378, 201–210.
Backliwal, G., Hildinger, M., Chenuet, S., Wulhfard, S., De Jesus, M., Wurm, F.M.,2008a. Rational vector design and multi-pathway modulation of HEK 293E cellsyield recombinant antibody titers exceeding 1 g/l by transient transfection underserum-free conditions. Nucleic Acids Research 36, e96.
Backliwal, G., Hildinger, M., Hasija, V., Wurm, F.M., 2008b. High-density transfectionwith HEK-293 cells allows doubling of transient titers and removes need for apriori DNA complex formation with PEI. Biotechnology and Bioengineering 99,721–727.
Baldi, L., Hacker, D.L., Adam, M., Wurm, F.M., 2007. Recombinant protein productionby large-scale transient gene expression in mammalian cells: state of the art andfuture perspectives. Biotechnology Letters 29, 677–684.
Box, G.E.P., Behnken, D.W., 1960. Some new three-level designs for the study ofquantitative variables. Technometrics 2, 455–475.
Briggs, J.A., Simon, M.N., Gross, I., Krausslich, H.G., Fuller, S.D., Vogt, V.M., John-son, M.C., 2004. The stoichiometry of Gag protein in HIV-1. Nature Structural& Molecular Biology 11, 672–675.
Brunner, D., Frank, J., Appl, H., Schoffl, H., Pfaller, W., Gstraunthaler, G., 2010. Serum-free cell culture: the serum-free media interactive online database. ALTEX 27,53–62.
Brunner, S., Sauer, T., Carotta, S., Cotten, M., Saltik, M., Wagner, E., 2000. Cell cycledependence of gene transfer by lipoplex, polyplex and recombinant adenovirus.Gene Therapy 7, 401–407.
Buonaguro, L., Buonaguro, F.M., Tornesello, M.L., Mantas, D., Beth-Giraldo, E., Wag-ner, R., Michelson, S., Prevost, M.C., Wolf, H., Giraldo, G., 2001. High efficientproduction of Pr55(gag) virus-like particles expressing multiple HIV-1 epitopes,including a gp120 protein derived from an Ugandan HIV-1 isolate of subtype A.Antiviral Research 49, 35–47.
Butler, M., 2005. Animal cell cultures: recent achievements and perspectives in theproduction of biopharmaceuticals. Applied Microbiology and Biotechnology 68,283–291.
Carlson, L.A., Briggs, J.A., Glass, B., Riches, J.D., Simon, M.N., Johnson, M.C., Muller,B., Grunewald, K., Krausslich, H.G., 2008. Three-dimensional analysis of buddingsites and released virus suggests a revised model for HIV-1 morphogenesis. CellHost & Microbe 4, 592–599.
Carpentier, E., Paris, S., Kamen, A.A., Durocher, Y., 2007. Limiting factors gover-ning protein expression following polyethylenimine-mediated gene transfer inHEK293-EBNA1 cells. Journal of Biotechnology 128, 268–280.
Chen, Y., Wu, B., Musier-Forsyth, K., Mansky, L.M., Mueller, J.D., 2009. Fluorescencefluctuation spectroscopy on viral-like particles reveals variable gag stoichiom-etry. Biophysical Journal 96, 1961–1969.
Cruz, P.E., Cunha, A., Peixoto, C.C., Clemente, J., Moreira, J.L., Carrondo, M.J., 1998.Optimization of the production of virus-like particles in insect cells. Biotechnol-ogy and Bioengineering 60, 408–418.
Deml, L., Speth, C., Dierich, M.P., Wolf, H., Wagner, R., 2005. Recombinant HIV-1Pr55gag virus-like particles: potent stimulators of innate and acquired immuneresponses. Molecular Immunology 42, 259–277.
Durocher, Y., Perret, S., Kamen, A., 2002. High-level and high-throughput recombi-nant protein production by transient transfection of suspension-growing human293-EBNA1 cells. Nucleic Acids Research 30, E9.
Durocher, Y., Pham, P.L., St-Laurent, G., Jacob, D., Cass, B., Chahal, P., Lau, C.J., Nal-bantoglu, J., Kamen, A., 2007. Scalable serum-free production of recombinantadeno-associated virus type 2 by transfection of 293 suspension cells. Journal ofVirological Methods 144, 32–40.
Gebhart, C.L., Kabanov, A.V., 2001. Evaluation of polyplexes as gene transfer agents.Journal of Controlled Release 73, 401–416.
Geisse, S., 2009. Reflections on more than 10 years of TGE approaches. ProteinExpression and Purification 64, 99–107.
Geisse, S., Henke, M., 2005. Large-scale transient transfection of mammalian cells: anewly emerging attractive option for recombinant protein production. Journalof Structural and Functional Genomics 6, 165–170.
Geisse, S., Jordan, M., Wurm, F.M., 2005. Large-scale transient expression of ther-apeutic proteins in mammalian cells. Methods in Molecular Biology 308, 87–98.
Geng, Z.H., Nudson, W., Davis, L., Luo, S., Etchberger, K., 2007. Optimizing mediumfor transient transfection. In: Smith, R. (Ed.), Cell Technology for Cell Products.Proceedings of the 19th ESACT Meeting. Harrogate, UK. Springer, pp. 53–55.
Ghani, K., Garnier, A., Coelho, H., Transfiguracion, J., Trudel, P., Kamen, A., 2006.Retroviral vector production using suspension-adapted 293GPG cells in a 3 Lacoustic filter-based perfusion bioreactor. Biotechnology and Bioengineering 95,653–660.
Grigorov, B., Arcanger, F., Roingeard, P., Darlix, J.L., Muriaux, D., 2006. Assembly ofinfectious HIV-1 in human epithelial and T-lymphoblastic cell lines. Journal ofMolecular Biology 359, 848–862.
Gutiérrez-Granados, S., Cervera, L., Gòdia, F., Carrillo, J., Segura, M.M., 2013. Devel-opment and validation of a quantitation assay for fluorescently tagged HIV-1virus-like particles. Journal of Virological Methods, PMID: 23707924 (Epubahead of print).
Hammonds, J., Chen, X., Zhang, X., Lee, F., Spearman, P., 2007. Advances in methodsfor the production, purification, and characterization of HIV-1 Gag-Env pseu-dovirion vaccines. Vaccine 25, 8036–8048.
Hermida-Matsumoto, L., Resh, M.D., 2000. Localization of human immunodeficiencyvirus type 1 Gag and Env at the plasma membrane by confocal imaging. Journalof Virology 74, 8670–8679.
Jalaguier, P., Turcotte, K., Danylo, A., Cantin, R., Tremblay, M.J., 2011. Efficient produc-tion of HIV-1 virus-like particles from a mammalian expression vector requiresthe N-terminal capsid domain. PLoS One 6, e28314.
Kamen, A., Henry, O., 2004. Development and optimization of an adenovirus pro-duction process. Journal of Gene Medicine 6 (Suppl. 1), S184–S192.
Keenan, J., Pearson, D., Clynes, M., 2006. The role of recombinant proteins in thedevelopment of serum-free media. Cytotechnology 50, 49–56.
Le Ru, A., Jacob, D., Transfiguracion, J., Ansorge, S., Henry, O., Kamen, A.A., 2010.Scalable production of influenza virus in HEK-293 cells for efficient vaccinemanufacturing. Vaccine 28, 3661–3671.
Pham, P.L., Kamen, A., Durocher, Y., 2006. Large-scale transfection of mammaliancells for the fast production of recombinant protein. Molecular Biotechnology34, 225–237.
Pham, P.L., Perret, S., Doan, H.C., Cass, B., St-Laurent, G., Kamen, A., Durocher, Y., 2003.Large-scale transient transfection of serum-free suspension-growing HEK293EBNA1 cells: peptone additives improve cell growth and transfection efficiency.Biotechnology and Bioengineering 84, 332–342.
Pillay, S., Meyers, A., Williamson, A.L., Rybicki, E.P., 2009. Optimization of chimericHIV-1 virus-like particle production in a baculovirus-insect cell expression sys-tem. Biotechnology Progress 25, 1153–1160.
Plackett, R.L., Burman, J.P., 1946. The design of optimum multifactorial experiments.Biometrika 34, 255–272.
Rajendra, Y., Kiseljak, D., Baldi, L., Hacker, D.L., Wurm, F.M., 2011. A simplehigh-yielding process for transient gene expression in CHO cells. Journal ofBiotechnology 153, 22–26.
Rovinski, B., Rodrigues, L., Cao, S.X., Yao, F.L., McGuinness, U., Sia, C., Cates, G.,Zolla-Pazner, S., Karwowska, S., Matthews, T.J., et al., 1995. Induction of HIVtype 1 neutralizing and env-CD4 blocking antibodies by immunization withgenetically engineered HIV type 1-like particles containing unprocessed gp160glycoproteins. AIDS Research and Human Retroviruses 11, 1187–1195.
Sakuragi, S., Goto, T., Sano, K., Morikawa, Y., 2002. HIV type 1 Gag virus-like par-ticle budding from spheroplasts of Saccharomyces cerevisiae. Proceedings ofthe National Academy of Sciences of the United States of America 99, 7956–7961.
Schlaeger, E.J., Christensen, K., 1999. Transient gene expression in mammalian cellsgrown in serum-free suspension culture. Cytotechnology 30, 71–83.
Schwartz, S., Campbell, M., Nasioulas, G., Harrison, J., Felber, B.K., Pavlakis, G.N., 1992.Mutational inactivation of an inhibitory sequence in human immunodeficiencyvirus type 1 results in Rev-independent gag expression. Journal of Virology 66,7176–7182.

L. Cervera et al. / Journal of Biotechnology 166 (2013) 152– 165 165
Segura, M.M., Garnier, A., Durocher, Y., Coelho, H., Kamen, A., 2007. Production oflentiviral vectors by large-scale transient transfection of suspension culturesand affinity chromatography purification. Biotechnology and Bioengineering 98,789–799.
Sun, X., Hia, H.C., Goh, P.E., Yap, M.G., 2008. High-density transient gene expressionin suspension-adapted 293 EBNA1 cells. Biotechnology and Bioengineering 99,108–116.
Swiech, K., Kamen, A., Ansorge, S., Durocher, Y., Picanco-Castro, V., Russo-Carbolante,E.M., Neto, M.S., Covas, D.T., 2011. Transient transfection of serum-free sus-pension HEK 293 cell culture for efficient production of human rFVIII. BMCBiotechnology 11, 114.
Tait, A.S., Brown, C.J., Galbraith, D.J., Hines, M.J., Hoare, M., Birch, J.R., James, D.C.,2004. Transient production of recombinant proteins by Chinese hamster ovarycells using polyethyleneimine/DNA complexes in combination with micro-tubule disrupting anti-mitotic agents. Biotechnology and Bioengineering 88,707–721.
Tom, R., Bisson, L., Durocher, Y., 2008. Transfection of HEK293-EBNA1 cells in sus-pension with linear PEI for production of recombinant proteins. CSH Protocols,pdb.prot4977.
Transfiguracion, J., Jaalouk, D.E., Ghani, K., Galipeau, J., Kamen, A., 2003. Size-exclusion chromatography purification of high-titer vesicular stomatitis virus Gglycoprotein-pseudotyped retrovectors for cell and gene therapy applications.Human Gene Therapy 14, 1139–1153.
Tuvesson, O., Uhe, C., Rozkov, A., Lullau, E., 2008. Development of a generictransient transfection process at 100 L scale. Cytotechnology 56, 123–136.
Valley-Omar, Z., Meyers, A.E., Shephard, E.G., Williamson, A.L., Rybicki, E.P., 2011.Abrogation of contaminating RNA activity in HIV-1 Gag VLPs. Virology Journal8, 462.
Visciano, M.L., Diomede, L., Tagliamonte, M., Tornesello, M.L., Asti, V., Bomsel, M.,Buonaguro, F.M., Lopalco, L., Buonaguro, L., 2011. Generation of HIV-1 virus-likeparticles expressing different HIV-1 glycoproteins. Vaccine 29, 4903–4912.

Intracellular characterization of VLP production by transient transfection in HEK
293 cells.
Laura Cervera1, Irene González1, Maria Mercedes Segura2 and Francesc Gòdia1.
1. Grup d'Enginyeria Cellular i Tissular, Escola d'Enginyeria, Universitat Autònoma de,
Barcelona, Campus de Bellaterra, Cerdanyola del Vallès, 08193 Barcelona, Spain.
2. bluebird bio Pharmaceutical Sciences, Process Development group, 150 2nd
Street Cambridge, MA 02141 339-499-9300-USA.

Abstract
Transient Gene Expression is a widely used technique to introduce foreign DNA into
mammalian cells. It is a very suitable technique to produce enough quantities of
biomaterial to perform pre-clinical studies and the scalability of the process has been
demonstrated in recent years. Even though it is a very widespread technique, less is
known about the transfection process at its cellular level. The aim of this work is to
study the process by which DNA crosses the cell membrane and reaches the nucleus
after transfection using PEI as transfection reagent in a process in which Gag-GFP
VLPs are produced. Flow cytometry assays show that DNA:PEI polyplexes start to
interact with the cells from the very beginning and a linear increase in transfection
efficiency is observed until 60 minutes of contact between the cells and the complexes.
No change in transfection efficiency is obtained afterwards. The same profile is
observed when fluorescence in the supernatant is analyzed. When cells are observed
under confocal microscopy, it can be observed the DNA/PEI complexes seem to be
attached to the plasma membrane since the moment that the culture is transfected. After
1.5 hpt complexes are detected in the cytoplasm of the cells and reach the nucleus
around 4 hours post transfection. After 10 hours post transfection GFP fluorescence is
detected inside the cells, but generalized budding of VLPs from the cells is not observed
until 48 hours post transfection. The optimal harvest time is determined as 72 hpt as
VLP production is highest while high viability of the culture is maintained.

1. Introduction
Transient gene expression (TGE) is a methodology to introduce foreign DNA to cells.
TGE has been routinely used in laboratory for mechanistic studies. Nowadays, the
interest of the industry has focused on TGE as it facilitates rapid production of
biopharmaceuticals in early development phases for characterization assays and pre-
clinical studies. Apart from the electroporation methods used to introduce DNA into the
cells, several transfection agents have been proven effective to complex with the
plasmid DNA to transfect the cells. Cationic lipids, such as Lipofectamine 2000™
(Invitrogen), have shown high efficiency of transfection, but its high price precludes its
use in large-scale processes (Geisse, 2009). One of the most extended complexing
agents is Calcium phosphate as it has been used at large-scale, is easy to use and cost-
effective (Batard et al., 2001; Jordan et al., 1996; Meissner et al., 2001). The only
inconvenient of Calcium phosphate is that cannot be used with serum-free media, as the
low-calcium concentration of these media used to avoid cell clumping, interfere with
calcium-phosphate transfection (Geisse, 2009; Jordan and Wurm, 2004). A third group
of complexing agents are the cationic polymers. Polyethylenimine (PEI) has gained
interest in recent years due to its easy use, low price and good performance in
suspension CHO and HEK 293 cells when serum-free media is used. PEI was
discovered to efficiently introduce DNA into the cells by (Boussif et al., 1995) showing
good transfection efficiencies both in vitro and in vivo. PEI is known to complex the
DNA resulting in positive charged polyplexes that interact with the negative charged
parts of the cell membrane such as heparin sulfate proteoglycans (Kopatz et al., 2004).
After interaction, polyplexes are up-taken by the cells through endocytosis into acidified
endosomal compartments (Godbey et al., 1999). After the introduction to the cells PEI
acts as a buffer and through its known “proton sponge” effect is able to escape from the
endosomes and liberate the polyplexes to the cytoplasm, preventing them of enzymatic
decradation of DNA (Boussif et al., 1995). Then polyplexes have to reach the nucleus
and enter, which is thought to be the limiting step in cell transfection, as only a very
small fraction od plasmid delivered into the cell is finally translocated into the nucleus
and transcribed (Bieber et al., 2002; Carpentier et al., 2007; Cohen et al., 2009). The
way polyplexes enter the nucleus is the less characterized step of gene delivery. One
proposed mechanism suggests that the polyplexes may enter into the nucleus during the
break down of the nuclear membrane during cell division (Grosse et al., 2006; Tait et
al., 2004). Alternatively, a second mechanism postulates that the polyplexes are
transferred to the nucleus by active transport through the nuclear envelope,
independently of cell division (Han et al., 2009).
Transient transfection can be carried out to produce viral vectors, recombinant proteins
and antibodies. In the present work, the product of interest is HIV-1 virus-like particles.
Virus-like particles are promising as new generation vaccines, because while they
mimic the native virus structure, they lack of genetic material, which makes them very
safe both for patients and manufacturers involved in their production (Deml et al., 2005;
Young et al., 2006). One of the intrinsic characteristics of HIV-1 VLPs is that, like the
virus itself, they are enveloped VLPs. During the budding process, Gag virus particles
acquire their lipid envelope from the producer cell.
In this work, the focus is on the kinetics of the different steps involved in this process,
which has been divided in the following steps: a) Polyplexes/cell interaction, b)
Polyplexes penetration into the cytoplasm, c) Polyplexes penetration into the nucleus, d)
Initiation of gene expression, e) VLP budding from the cells and f) Optimal harvest
time. This time points are considered of high importance in process optimization as its

knowledge can lead to better understanding and identification of checkpoints to make
the transient transfection process more efficient.

2. Materials and Methods
2.1 Cell line, media and culture conditions
The cell line used in this work is a serum-free suspension-adapted HEK 293 cell line
(HEK293SF-3F6) kindly provided by Dr. Amine Kamen from the BRI of National
Research Council of Canada (Montreal, Canada). It was derived from a cGMP master
cell bank that is available for manufacturing of clinical material. Cells were cultured in
Freestyle 293 medium (Invitrogen, Carlsbad, CA, USA) supplemented with 0.1%
Pluronic® (Invitrogen). Medium was also supplemented with 1.6 mg/L of r-transferrin
(Merck Millipore, Kankakee, IL, USA), 19.8 mg/L of r-insulin (FeF Chemicals/Novo
Nordisk, Køge, Denmark.) and 0.9X of an in-house lipid mixture to maximize cell
growth (Cervera et al., 2013). Cells were routinely maintained in 125-mL disposable
polycarbonate erlenmeyer flasks (Corning, Steuben, NY, USA) in 20 mL of culture
medium. Flasks were shaken at 110 rpm using an orbital shaker (Stuart, Stone, UK)
placed in an incubator maintained at 37ºC in a humidified atmosphere of 5% CO2 in air.
Cell count and viability were determined using Nucleocounter NC-3000 (Chemometec,
Allerod, Denmark).
2.2 Plasmids
The pGag-EGFP plasmid used in this work codes for a Rev-independent HIV-1 Gag
protein fused in frame to the enhanced GFP (Hermida-Matsumoto and Resh, 2000). The
plasmid from the NIH AIDS Reagent Program (Cat 11468) was constructed by cloning
the Gag sequence from pCMV55M1-10 (Schwartz et al., 1992) into the pEGFP-N1
plasmid (Clontech).
The plasmids were prepared and purified as previously described (Segura et al., 2007).
2.3 Transient transfection

HEK 293 suspension cells were transiently transfected using 25-kDa linear
polyethilenimine (PEI) (PolySciences, Warrington, PA, USA). Transfections were
performed using a final DNA concentration of 1 µg/mL of medium. PEI/DNA
complexes were formed by adding PEI to plasmid DNA diluted in fresh culture media
(10% of the total volume of the culture to be transfected). The mixture was incubated
for 15 min at room temperature to allow complex formation prior to its addition to the
cell culture.
2.4 DNA labeling
To study the kinetics of the PEI-DNA complexes entrance into the cell, the plasmid
Gag-GFP was labeled with the fluorochrome Cys3 ™. This marker absorbs at 649 nm
and emits at 670 nm so it has a red fluorescent color. The labeled DNA was generated
using the Label IT® Traker ™ Kit (Mirus Bio Technology) following manufacturer’s
instructions. The plasmid was quantified using NanoDrop 1000 (Thermo Scientific,
Wilmington, Delaware, USA) and diluted to a concentration of 100 μg/mL using MiliQ
water.
2.5 VLP quantitation
The concentration of Gag-GFP VLPs was assessed by fluorometry using an in-house
developed and validated quantification assay (Gutiérrez-Granados et al., 2013).VLP
containing supernatants were recovered by cell culture centrifugation at 1000×g for 5
min. On the other hand, Gag-GFP containing cell lysates were prepared by subjecting
cell pellets to 3 freeze-thaw cycles followed by centrifugation at 13.800 × g for 20 min
to eliminate cell debris.
Green fluorescence was measured at room temperature using a Cary Eclipse
Fluorescence Spectrophotometer (Agilent Technologies, Santa Clara, CA, USA) set as

follows: λex= 488 nm (slit 5 nm), λem= 510 nm (slit 10 nm). Relative fluorescence
units values (RFU) were calculated by subtracting fluorescence units (FU) values of
untransfected negative control samples. There is a linear correlation between
fluorescence intensity and p24 values determined using the INNOTEST ELISA HIV
antigen mAb (Innogenetics NV, Gent, Belgium). RFU values can be converted to Gag-
GFP concentration values using the following equation:
where Gag-GFP is the estimated concentration of polyprotein and RFU is the measured
GFP fluorescence intensity in the samples. The first term is the correlation equation
between fluorescence values and p24 concentrations determined by ELISA and 36 is a
correction factor that takes into account the difference in molecular weight between p24
and Gag-GFP and an underestimation arising from using the p24 ELISA to estimate p55
Gag concentrations.
2.6 Confocal microscopy
In order to study the kinetics of the transient transfection system, the visualization of
VLP producer cells was performed by Flouview® FV100 confocal microscope
(Olympus, Tokyo, Japan). Firstly, HEK 293 cells were dyed with CellMask™ 10
mg/mL (Life Technologies, Masachussets, USA), which stains the plasma membrane in
a deep red color and with Hoechst 33342, Trihydrochloride, Trihydrate 10 mg/mL (Life
Technologies, Masachussets, USA), which stains the nuclear DNA in blue cyan color.
The excitation/emission parameters of each dye used for Confocal Microscopy were
649nm/ 666nm for Cell Mask™, 649nm/670nm for Cys 3 ™, 350nm/461nm for
Hoescht and 488nm/510nm for Gag-GFP VLPs.
( ) 36 1.6833)RFU(3.245ng/mLGFPGag ×−×=−

1 µL of each dye was added to 1000 µL of cell culture, after 10 minutes of incubation at
room temperature and protected from light, the mixture was centrifuged at 300g for 5
minuts and cell pellet was resuspended with fresh medium. Then, the transient
transfection with Cys3™ labeled DNA was performed. Samples were placed in glass
bottom dishes (MatTek, Massachusetts, USA) for visualization under the microscope.
Final images were processed using LAS AF™ software (Leica Microsystems,Weztlar,
Germany).
2.7 Flow citometry
The percentage of GFP positive cells and the percentage of cells united to DNA/PEI
polyplexes was assessed using a BD FACS Canto flow cytometer (BD Biosciences, San
Jose, CA, USA).

3. Results and discussion
3.1 Study of the kinetics of DNA/PEI polyplexes penetration into the cells.
As it can be observed in figure 1A, polyplexes can be found localized on the cell
membrane since the first moment after addition to the cell culture. At 30 minutes post
transfection the polyplexes are still attached to the external surface of the cell
membrane, while after 90 minutes post transfection, polyplexes are detected inside the
cell (figure 2B).

Figure 1 Confocal images of HEK 293 cells taken at 30 minutes post addition (A) and 90 minutes post addition (B).
In order to establish the exact moment when DNA/PEI polyplexes enter into the cells,
an experiment was performed to study the effect of different contact times between
polyplexes and cells. Cells were transfected using the standard transfection protocol and
after 0 minutes post adition of the polyplexes, samples were taken every 5 minutes and
centrifuged at 300xg and 5 minutes. After centrifugation, cells were seeded again in 6
well plates with fresh media. During the period from 45 minutes post transfection to 2
hours post transfection, samples were taken every 15/30 minutes. The percentage of
transfection efficiency was analyzed at 24 and 48 hours post transfection and
fluorescence in the supernatant (concentration of VLPs) was analyzed at 48 hours post
transfection.
Figure 2 A and B shows the results of the kinetics of the penetration of the PEI/DNA
polyplexes into the cells as obtained in this experiment, and reflected in the percentage
of GFP positive cells. It can be observed a clear saturation type kinetics. The interaction
between PEI/DNA polyplexes starts just when the complexes are added to the culture,
at almost a constant rate, that further decreases with time. After 60 minutes, the
percentage of transfected cells (both measured at 24 and 48 hours post transfection) as
well as the fluorescence in the supernatant, reaches a plateau. These kinetics shows that
1 hour of contact is enough to transfect the maximum number of cells, or from another
point of view, that the entrance of the DNA/PEI polyplexes into the cells takes 1 hour.
Taking into consideration this kinetics and the previous observations with confocal
microscopy, it can be deduced, that during the first hour post transfection, the
interaction of the cells with the polyplexes becomes stronger until the complex enters
into the cell, which happens around 1 hour post transfection.

% of GFP positive cells 24 hpt
% of GFP positive cells 48 hpt
Time (mpt)
% o
f G
FP
po
siti
ve c
ells
A
B
Time (hpt)
Re
lati
ve fl
uo
resc
en
ce u
nit
s (R
.F.U
.)
Relative fluorescence units 24 hpt

The next step pursued to observe the kinetics of transfection and also the kinetics of
production and the release of the VLPs from the cell by the budding process. To this
respect, cells were transfected with a mixture of labeled and not-labeled DNA. Cells
were transfected using the standard protocol, but with 0.5 µg/mL of labeled DNA and
0.5 µg/mL non-labeled DNA, mixed together and then complexed with the PEI to form
the polyplexes. By this approach, the transfection process can be followed by flow
cytometry. In figure 3 A it can be observed that after 20 minutes post transfection more
than 95% of the cells have a complex either inside or interacting with the cell
membrane. The comparison between this experiment, in which the interaction of
polyplexes with the cells is observed, and the experiment in which the transfection
efficiency was evaluated, can lead to the following conclusion. In relation to the
observation that the difference between cell interaction with a complex at one hour post
transfection was 98%, while the percentage of GFP positive cells that have been in
contact with the polyplexes for the same time was 60 % at 48 hpt. These results suggest
that in the 38% of the cells the polyplexes that have interacted with the cell are not able
to express the protein, even because of the DNA did not reach the nucleus or once in the
nucleus the protein was not expressed.
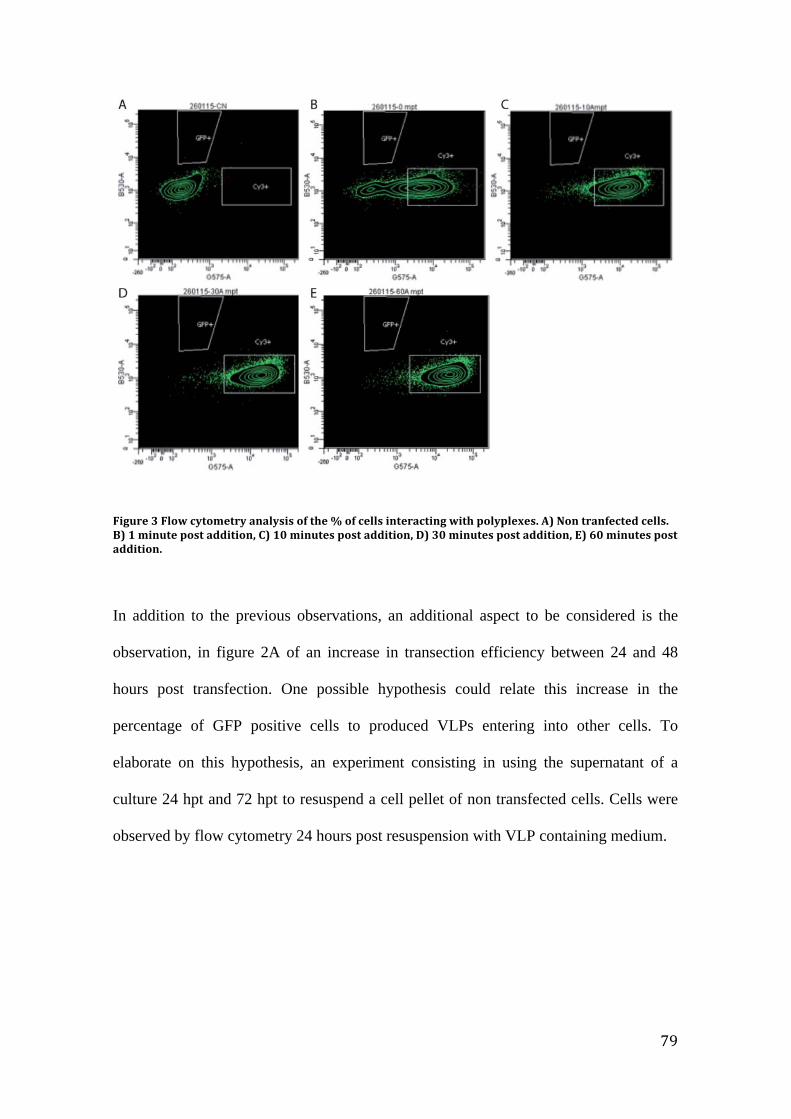
In addition to the previous observations, an additional aspect to be considered is the
observation, in figure 2A of an increase in transection efficiency between 24 and 48
hours post transfection. One possible hypothesis could relate this increase in the
percentage of GFP positive cells to produced VLPs entering into other cells. To
elaborate on this hypothesis, an experiment consisting in using the supernatant of a
culture 24 hpt and 72 hpt to resuspend a cell pellet of non transfected cells. Cells were
observed by flow cytometry 24 hours post resuspension with VLP containing medium.

Figure 4 Percentage of GFP positive cells after 48 hours of resuspension with medium containing supernatant with VLPs collected at 24hpt (A) and 72 hpt (B)
As it is shown in figure 4 A and B no retransfection with produced VLPs can be
observed, and for this reason the observed increase in transfection efficiency between
24 and 48 hpt might be related to additional polyplexes nuclear uptake, due to the fact
that not all the cells pass mitosis at the same time, or due to late expression.
3.2. Gag-GFP production kinetics
An experiment following the expression of Gag-GFP was performed by taking samples
to analyze the fluorescence in the supernatant, the fluorescence in the lysate (cell pellet
plus supernatant), transfection efficiency and cell culture viability (Figure 5). It can be
observed that the Gag-GFP VLPs assembly and budding process is a limiting step in
Gag-GFP VLP production as there is fluorescence inside the cells that is excreted out
the cell. On the other hand, it can be observed that once the cell viability of the culture
starts decreasing, there is a degradation of the protein inside the cell. From this
observation it can be determined that the time of harvest should be 72hpt since the

fluorescence in the supernatant does not further increase and the culture has a viability
of 89%.
The kinetics of Gag-GFP expression was also studied using flow cytometry (Figure 6).
Samples taken at different time points after transfection were analyzed and as can be
observed in figure 6, at 4 hpt no expression of Gag-GFP can be detected. At 10 hours
post transfection 11% of the cells are expressing the protein and the % increases at 24
hpt (43.5%) and at 48 hpt (61.7%). Interstingly the percentage of Cy3 positive
population decreases over time, suggesting a lost of the plasmid in dividing cells. On
the other hand there can not be observed cells expressing Gag-GFP, without having a
complex inside, wich is in agreement with the results presented above were no
retransfection of cells with released VLPs was observed.
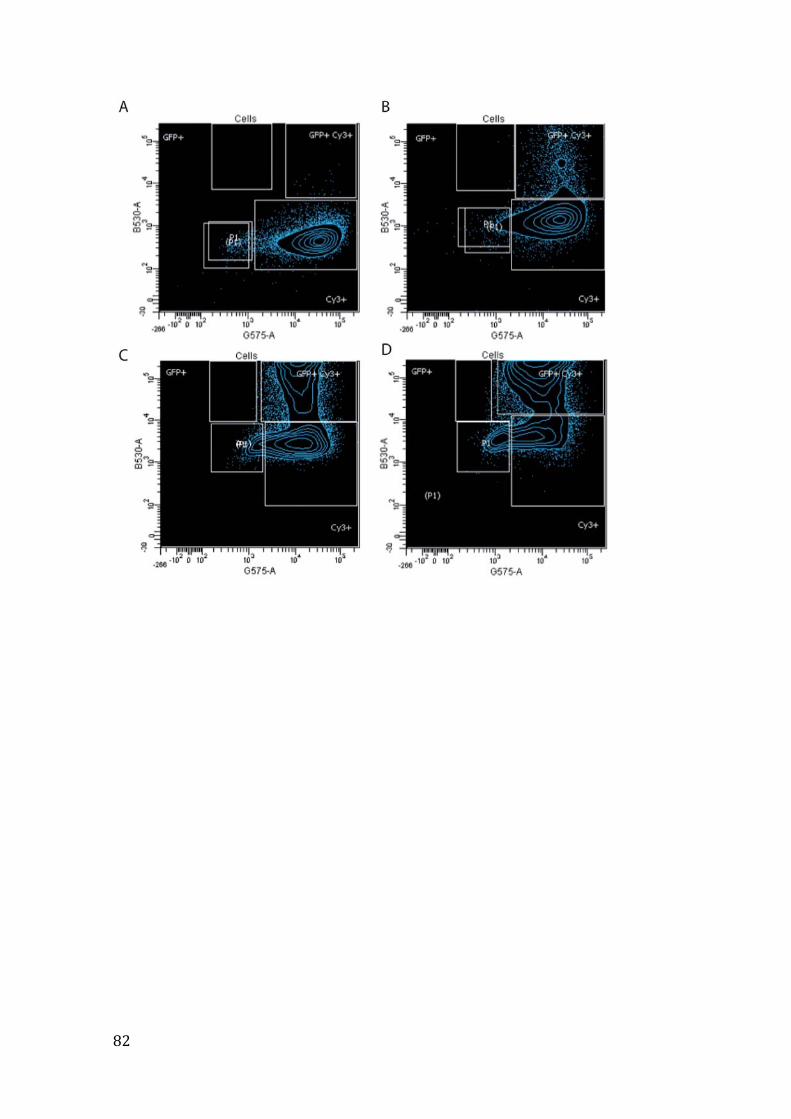

Kinetics of Gag-GFP expression by flow citometry. Images of flow cytometry analysis a different time points. A) 4 hpt, B) 10 hpt, C) 24 hpt, D) 48hpt and E) Graph representing the percentages of cells Cy3 positive, expressing Gag-GFP and Cy3 positive and only expressing Gag-GFP.
In confocal images taken 24 hours post transfection (Figure 6A), it can be observed that
almost all the cells have a complex inside even though not all the cells express the Gag-
GFP protein. In the majority of the cells no colocalization of the VLPs with the cell
membrane can be observed, suggesting that the budding process starts after this time,
which is in agree with figure 5, were the fluorescence in the supernatant was only 6.5
R.F.U. at 24hpt. On the other hand, colocalization of Gag-GFP VLPs budding from the
cells can be observed in the cells at 48 hpt. Colocalization was confirmed representing
the intensity of the different channels. No overlapping of the red channel (cell
membrane) and green chanel (Gag-GFP) was observed at 24 hpt, but clear overlapping
can be observed at 48 hpt.
Perc
enta
ge o
f pos
itive
cel
ls (%
)

4. Discussion
The work performed first focused on the polyplexes uptake kinetics. It was observed
that 5 minutes after the addition of DNA-PEI complexes, the interaction between cells
and polyplexes is already evidenced. The maximum interaction was found at 30 minutes
post transfection (as observed by confocal microscopy). The complexes were located in
the cell membrane (Figure 1A), and cannot be detached by centrifugation as shown in
Figure 2), this meaning that the DNA/PEI polyplexes are truly internalized in the cell
membrane after this period of time. This result was corroborated using flow cytometry
as all the cells interacted with polyplexes at 30 minutes post addition (Cy3 positive in
figure 3D). Confocal microscopy images showed that at 90 minutes post transfection
almost all observed cells have a complex inside (Figure 1B).
Inte
nsi
ty
0 50 100 150 200 250 3000
500
1000
1500
2000
2500
3000
3500
4000
4500
Gag-GFP NucleusDNA/PEI polyplex Membrane
Length ( μm)
Length ( μm)
0 50 100 150 200 250 300 350 400
Inte
nsi
ty
0
50
100
150
200
250
Gag-GFP NucleusDNA/PEI polyplex Membrane
A B
DC

Several authors have already observed that the vast majority of the cells internalize
polyplexes (Carpentier et al., 2007; Doyle and Chan, 2007; Han et al., 2009). For
example, internalization of polyplexes was observed at 4 hpt independently of the cell
cycle while only 1.8% of cells were expressing GFP at this time (Han et al., 2009).
However, it is noteworthy that approximately half of the cells with complexes inside
failed to express the protein at 20hpt (Han et al., 2009). These results are in agreement
with the observations done in this work, indicating that all the cells internalize
polyplexes, but only 60% of them are GFP-positive after 24 hpt (Figure 2).In the same
direction, Doyle and Chan (Doyle and Chan, 2007) observed that polyplexes could be
found in the cytoplasmatic periphery after 1 hpt, with evidence of polyplex aggregation
in specific areas of the cell surface. They also noted that 92.23% of the cells internalized
polyplexes after 2 hours, and, within 4 hours, significant localization within the nuclear
proximity was observed. Carpentier (Carpentier et al., 2007), also found that 24 hours
post transfection the fluorescence derived from DNA was homogenously distributed in
expressing and non-expressing cells. These results suggested that polyplex uptake by
the cells is a very efficient mechanism, and one or several of the next steps that proceed
or preceded protein expression is the limiting step.
Godbey (Godbey et al., 2000) showed that complexation with PEI provided DNA
protection from DNases and that endosomes, after endocytosis, did not fuse with
lysosomes. They also showed that complexes appeared at the cell surface at 30 minutes
post transfection. Endosome is formed between 2-3hpt, at 3.5 hpt endocytotic vesicles
are larger and more numerous, and that complex starts to enter inside the nucleus by
3.5-4.5 hpt (Godbey et al., 1999). Although some DNA/PEI polyplexes are dissociated
in the cytoplasm, it has been reported that, when DNA is complexed with PEI it mostly

enters the nucleus as a complex (Godbey et al., 1999; Godbey et al., 2000; Grosse et al.,
2006).
The increase in transfection efficiencies observed between 24 ad 48 hours post
transfection is related to cells that between this two-time points have the chance to pass
through mitosis and incorporate the plasmid DNA into the nucleus. This phenomenon
has been already suggested by Brunner (Brunner et al., 2000), who also proposed that
this increase was low due to the inactivation or degradation of plasmid DNA. In this
direction, (Lechardeur et al., 2005) showed that after 4h, 25% of the complexed DNA
was degraded in the cytosol. This hypothesis is also reinforced by the fact that the
increase in the percentage of transfected cells is not due to previously produced VLP
entrance to the cells as shown in figure 4.
The expression of Gag-GFP protein starts between 4 and 10 hpt and there is an
accumulation of intracellular protein, as it can be observed in Figure 5. In confocal
images it is observed that at 24 hpt the fluorescence is homogenously distributed in the
cytoplasm of the cell (Figure 6 A, B), but at 48 hpt Gag-GFP is accumulated at the
vicinity of the cell membrane where colocalization of the cell membrane and VLPs
during the budding process can be observed.
The kinetics of the transient transfection process was studied with the aim to
characterize and understand the complete process at intracellular level leading to the
VLP production, and to determine important time points to drive process improvement.
Polyplexes start to interact with the cell membrane just after addition to the culture.
After 1.5 hpt complexes are detected in the cytoplasm of the cells and reach the nucleus
around 4 hours post transfection. After 10 hours post transfection GFP fluorescence is

detected inside the cells, but generalized budding of VLPs from the cells is not observed
until 48 hours post transfection. The optimal harvest time is determined as 72 hpt as
VLP production is highest while high viability of the culture is maintained.
Two limiting steps in VLP production could be identified in this work, as polyplexes
entry into the nucleus and VLP budding.
References
Batard P, Jordan M, Wurm F. 2001. Transfer of high copy number plasmid into mammalian cells by calcium phosphate transfection. Gene 270:61–68.
Bieber T, Meissner W, Kostin S, Niemann A, Elsasser H-P. 2002. Intracellular route and transcriptional competence of polyethylenimine–DNA complexes. J. Control. Release 82:441–454. http://www.sciencedirect.com/science/article/pii/S0168365902001293.
Boussif O, Lezoualc’h F, Zanta MA, Mergny MD, Scherman D, Demeneix B, Behr JP. 1995. A versatile vector for gene and oligonucleotide transfer into cells in culture and in vivo: polyethylenimine. Proc. Natl. Acad. Sci. 92:7297–7301. http://www.pnas.org/content/92/16/7297.short.
Carpentier E, Paris S, Kamen AA, Durocher Y. 2007. Limiting factors governing protein expression following polyethylenimine-mediated gene transfer in HEK293-EBNA1 cells. J. Biotechnol. 128:268–280.
Cervera L, Gutiérrez-Granados S, Martínez M, Blanco J, Gòdia F, Segura MM. 2013. Generation of HIV-1 Gag VLPs by transient transfection of HEK 293 suspension cell cultures using an optimized animal-derived component free medium. J. Biotechnol. 166:152–165.
Cohen RN, van der Aa MAEM, Macaraeg N, Lee AP, Szoka FC. 2009. Quantification of plasmid DNA copies in the nucleus after lipoplex and polyplex transfection. J. Control. Release 135:166–74. http://www.pubmedcentral.nih.gov/articlerender.fcgi?artid=2765102&tool=pmcentrez&rendertype=abstract.
Deml L, Speth C, Dierich MP, Wolf H, Wagner R. 2005. Recombinant HIV-1 Pr55gag virus-like particles: potent stimulators of innate and acquired immune responses. Mol. Immunol. 42:259–277.
Doyle SR, Chan CK. 2007. Differential intracellular distribution of DNA complexed with polyethylenimine (PEI) and PEI-polyarginine PTD influences exogenous gene expression within live COS-7 cells. Genet. Vaccines Ther. 5:11.
Geisse S. 2009. Reflections on more than 10 years of TGE approaches. Protein Expr. Purif. 64:99–107. http://yadda.icm.edu.pl/yadda/element/bwmeta1.element.elsevier-2c624441-0114-3ab5-b656-c15352038a09.
Godbey WT, Barry MA, Saggau P, Wu KK, Mikos AG. 2000. Poly(ethylenimine)-mediated transfection: a new paradigm for gene delivery. J. Biomed. Mater. Res. 51:321–8. http://www.ncbi.nlm.nih.gov/pubmed/10880073.

Godbey WT, Wu KK, Mikos AG. 1999. Tracking the intracellular path of poly(ethylenimine)/DNA complexes for gene delivery. Proc. Natl. Acad. Sci. 96:5177–5181. http://www.pnas.org/content/96/9/5177.short.
Grosse S, Thévenot G, Monsigny M, Fajac I. 2006. Which mechanism for nuclear import of plasmid DNA complexed with polyethylenimine derivatives? J. Gene Med. 8:845–51. http://www.ncbi.nlm.nih.gov/pubmed/16685744.
Gutiérrez-Granados S, Cervera L, Gòdia F, Carrillo J, Segura MM. 2013. Development and validation of a quantitation assay for fluorescently tagged HIV-1 virus-like particles. J. Virol. Methods 193:85–95.
Han X, Fang Q, Yao F, Wang X, Wang J, Yang S, Shen BQ. 2009. The heterogeneous nature of polyethylenimine-DNA complex formation affects transient gene expression. Cytotechnology. http://www.pubmedcentral.nih.gov/articlerender.fcgi?artid=2780544&tool=pmcentrez&rendertype=abstract.
Hermida-Matsumoto L, Resh MD. 2000. Localization of human immunodeficiency virus type 1 Gag and Env at the plasma membrane by confocal imaging. J. Virol. 74:8670–8679.
Jordan M, Schallhorn A, Wurm FM. 1996. Transfecting Mammalian Cells: Optimization of Critical Parameters Affecting Calcium-Phosphate Precipitate Formation. Nucleic Acids Res. 24:596–601. http://nar.oxfordjournals.org/content/24/4/596.short.
Jordan M, Wurm F. 2004. Transfection of adherent and suspended cells by calcium phosphate. Methods 33:136–43. http://www.sciencedirect.com/science/article/pii/S1046202303003050.
Kopatz I, Remy J-S, Behr J-P. 2004. A model for non-viral gene delivery: through syndecan adhesion molecules and powered by actin. J. Gene Med. 6:769–76. http://www.ncbi.nlm.nih.gov/pubmed/15241784.
Meissner P, Pick H, Kulangara A, Chatellard P, Friedrich K, Wurm FM. 2001. Transient gene expression: recombinant protein production with suspension-adapted HEK293-EBNA cells. Biotechnol. Bioeng. 75:197–203. http://www.ncbi.nlm.nih.gov/pubmed/11536142.
Schwartz S, Campbell M, Nasioulas G, Harrison J, Felber BK, Pavlakis GN. 1992. Mutational inactivation of an inhibitory sequence in human immunodeficiency virus type 1 results in Rev-independent gag expression. J. Virol. 66:7176–82. http://www.pubmedcentral.nih.gov/articlerender.fcgi?artid=240411&tool=pmcentrez&rendertype=abstract.
Segura MM, Garnier A, Durocher Y, Coelho H, Kamen A. 2007. Production of lentiviral vectors by large-scale transient transfection of suspension cultures and

affinity chromatography purification. Biotechnol. Bioeng. 98:789–99. http://www.ncbi.nlm.nih.gov/pubmed/17461423.
Tait AS, Brown CJ, Galbraith DJ, Hines MJ, Hoare M, Birch JR, James DC. 2004. Transient production of recombinant proteins by Chinese hamster ovary cells using polyethyleneimine/DNA complexes in combination with microtubule disrupting anti-mitotic agents. Biotechnol. Bioeng. 88:707–721.
Young KR, McBurney SP, Karkhanis LU, Ross TM. 2006. Virus-like particles: designing an effective AIDS vaccine. Methods 40:98–117.

Selection and optimization of transfection enhancer additives for increased virus-like
particle production in HEK293 suspension cell cultures
Laura Cervera1, Javier Fuenmayor1, Irene González1, Sonia Gutiérrez-Granados1,
Maria Mercedes Segura2 and Francesc Gòdia1.
1. Grup d'Enginyeria Cellular i Tissular, Escola d'Enginyeria, Universitat Autònoma de,
Barcelona, Campus de Bellaterra, Cerdanyola del Vallès, 08193 Barcelona, Spain.
2. bluebird bio Pharmaceutical Sciences, Process Development group, 150 2nd
Street Cambridge, MA 02141 339-499-9300-USA.


Abstract
The manufacturing of biopharmaceuticals in mammalian cells typically relies on the use
of stable producer cell lines. However, in recent years transient gene expression has
emerged as a suitable technology for rapid production of biopharmaceuticals. Transient
gene expression is particularly well suited for early developmental phases, where
several therapeutic targets need to be produced and tested in vivo. As a relatively new
bioprocessing modality, a number of opportunities exist for improving cell culture
productivity upon transient transfection. For instance, several compounds have shown
positive effects on transient gene expression. These transfection enhancers either
facilitate entry of PEI/DNA transfection complexes to the cell or nucleus or increase
levels of gene expression. In this work, we evaluated the potential of combining
transfection enhancers to increase Gag-based virus-like particle production levels upon
transfection of suspension-growing HEK293 cells. Using Plackett-Burman design of
experiments, we first tested the effect of eight transfection enhancers: Trichostatin A,
Valproic acid, Sodium Butyrate, DMSO, Lithium Acetate, Caffeine, Hydroxyurea and
Nocodazole. An optimal combination of compounds exhibiting the greatest effect on
gene expression levels were subsequently identified using a surface response
experimental design. The optimal consisted on the addition of 20 mM Lithium Acetate,
3.36 mM Valproic Acid and 5.04 mM Caffeine which increased production levels 3.8
fold, while maintaining cell culture viability at 94%.
1. Introduction
The number of approved biopharmaceuticals produced in mammalian cell cultures
continues to increase over time. The interest in mammalian cell culture bioprocesses is
associated with the need to generate complex biopharmaceuticals that require the post-
translational machinery exclusively available in eukaryotic cells. The manufacturing of

biopharmaceuticals in mammalian cells typically relies on the use of stable producer
cell lines. However, in recent years transient gene expression (TGE) has emerged as a
suitable technology for rapid production of biopharmaceuticals. TGE is particularly
suited for early stages of development, where several therapeutic targets are produced at
small to medium scale for structural characterization and in vivo studies.
As an early bioprocessing modality, a number of opportunities exist for improving TGE
in order to increase productivity of transfected suspension mammalian cells.
Optimization of media composition [1] and process parameters [2–5] is one way to
attain higher titers. In addition, a number of compounds have shown positive effect in
cell productivity upon TGE. These compounds, also known as transfection enhancers,
can be classified into those that facilitate the transfection complex entry into the cell or
nucleus including Lithium Acetate (LiAc), Dimethyl sulfoxide (DMSO) and
Nocodazole and those that increase the level of transient gene expression such as
Valproic acid (VPA) Sodium Butyrate (NaBut), Caffeine (Caf.), Hydroxyurea (HU) and
Trichostatin A (Tricho) (Table 1).
Among those compounds described in the first group, LiAc and DMSO are used to
improve the porosity of the cell membrane facilitating the entry of DNA/PEI complexes
inside the cell. DMSO improves electroporation capacity of different mammalian cell
lines probably due to its capacity for making the cell membrane more porous [6]. LiAc
has been widely used in yeast [7–9] and bacterium transformation [10]. LiAc and
DMSO used in combination have shown to significantly increase transient expression
levels in mammalian CHO cell cultures[11]. Nocodazole is known to arrest cell cycle in
G2/M phase, which facilitates DNA entry into the nucleus as the nuclear membrane

brakes down during mitosis. It has shown to increase transfection efficiency to 94% and
correspondingly, the production of the reporter protein SEAP and IgG4 by 2-fold [12].
Among the additives described to improve protein expression levels, hydroxyurea acts
by blocking the cell cycle in G1 which increases cell productivity [12–14]. Caffeine has
shown to enhance the production of lentiviral vectors in HEK 293 suspension cultures.
The effect of caffeine was improved even further by combining it with 1mM of Butyric
acid, yielding an 8-fold increase of functional Lentivirus titer [15].The mechanism of
action of caffeine has been described as inhibition of several kinases, including ATM
(ataxia telangiectasia mutated), ATR (ataxia telangiectasia and Rad3-related protein),
and DNA-PKcs (DNA-dependent protein kinase catalytic subunit), which are important
signaling proteins involved in the repair of DNA double-stranded breaks [16–18].
Another group of additives that can increase transient expression levels includes the
inhibitors of histone deacetylases (HDAC), which includes NaBut, VPA and
Trichostatin A. Hyperacetylation of histones is thought to open up the usually highly
compacted nucleosome, allowing the transcription machinery to come into contact with
the DNA template enabling gene transcription.[19]. The ability of NaBut to improve
transient gene expression has been demonstrated in a wide range of cell lines and
products such as Human Prolactin [19], Human Thyrotropin [20], Human
Thrombopoietin [21], IgG [22,23], t-Pa [24] and lentiviral vectors [3]. Similarly, VPA
has been reported to increase recombinant protein production levels in several cell lines
and products as IgG [23,26–28] and LacZ [29]. The increase in protein production has
shown to correlate with an increase in the relative steady-state levels of mRNAs and a
decrease in cell growth and viability. VPA does not measurably affect pDNA uptake
and/or stability following PEI-mediated transfection [26]. Additional HDAC inhibitors
tested for transient transfection improvement include Trichostatin A which has shown

to enhance LacZ [29], IgG [23] and GFP and Luciferase expression using both plasmid
DNA and a BacMam virus DNA templates. Responses observed were different for
different promoters and cell lines tested [30].
Table 1 Additives used to improve gene expression levels
Additive Mechanism of action References
Trichostatin A (TSA) Inhibition of histone deacetylases [23,29,30]
Valproic acid (VPA) Inhibition of histone deacetylases [23,26–29]
Sodium Butyrate (NaBut) Inhibition of histone deacetylases [3,19–25]
DMSO Increases cell membrane porosity [6,11]
Lithium Acetate (LiAc) Increases cell membrane porosity [7–11]
Caffeine Inhibition of DNA-PKcs (and probably ATM, ATR) [15]
Hydroxyurea Arrest cells in the G1 phase of the cell cycle [12–14]
Nocodazole Arrest cells in the G2/M phase of the cell cycle [12]
The effect of several transfection enhancers on the production of Gag-based virus-like
particles (VLPs) in HEK 293 cultures is investigated in this work using Design of
experiments methodology. The VLPs are purposely modified and include a GFP marker
to facilitate their quantitation by fluorescence measurements. The proposed approach
focuses first on the identification of the compounds with the highest impact on
production levels and second on the identification of the most effective combination of
compounds and the optimization of their relative concentrations to achieve the highest
level of gene expression possible.

2. Materials and Methods
2.1 Cell line, media and culture conditions
The cell line used in this work is a serum-free suspension-adapted HEK 293 cell line
(HEK293SF-3F6) kindly provided by Dr. Amine Kamen from the BRI of National
Research Council of Canada (Montreal, Canada). It was derived from a cGMP master
cell bank that is available for manufacturing of clinical material. Cells were cultured in
Freestyle 293 medium (Invitrogen, Carlsbad, CA, USA) supplemented with 0.1%
Pluronic® (Invitrogen). Medium was also supplemented with 1.6 mg/L of r-transferrin
(Merck Millipore, Kankakee, IL, USA), 19.8 mg/L of r-insulin (FeF Chemicals/Novo
Nordisk, Køge, Denmark.) and 0.9X of an in-house lipid mixture to maximize cell
growth and productivity [1].
Cells were routinely maintained in 125-mL disposable polycarbonate erlenmeyer flasks
(Corning, Steuben, NY, USA) in 20 mL of culture medium. Flasks were shaken at 110
rpm using an orbital shaker (Stuart, Stone, UK) placed in an incubator maintained at
37ºC in a humidified atmosphere of 5% CO2 in air. Cell count and viability were
determined using Nucleocounter NC-3000 (Chemometec, Allerod, Denmark).
2.2 Plasmids
The pGag-EGFP plasmid used in this work codes for a Rev-independent HIV-1 Gag
protein fused in frame to the enhanced GFP [31]. The plasmid from the NIH AIDS
Reagent Program (Cat 11468) was constructed by cloning the Gag sequence from
pCMV55M1-10 [32] into the pEGFP-N1 plasmid (Clontech). The plasmids were
prepared and purified as previously described [33].
2.2 Cell Cycle analysis

Freshly harvested cells were pelleted by centrifugation, rinsed, re-suspended in PBS and
fixed with cold ethanol (70%) for a minimum of 2 h at −20°C. For cell cycle analysis,
cells were stained with propidium iodide (PI) (Sigma) for 30 min at room temperature
prior to data acquisition using a FACSCalibur (BD Biosciences, San Jose,CA, USA).
The Modfit software (Verity Software House, Topsham,ME, USA) was used for data
analysis.
2.3 MTT assay
MTT assay is based on colorimetric assay, which detect the viability of cell culture.
MTT (tetrazolium) is reduced in presence of viable cells in the sample. MTT precipitate
and generate the formazan, which is responsible for the purple color. In this work, MTT
assay is used to study the toxicity of the different additives. 96-well plates were used to
analyze the toxicity of each component. Each well was filled with 100µL of HEK293
cells at 0.5·106 cells/mL with 10 µL of different concentrations of the component to be
tested. The 96-well plate was incubated at 37ºC and 110 rpm for 48 hours. A calibration
curve was generated at the time of analysis with 100 µL of HEK 293 with
concentrations ranging from 0 to 2·106cells/mL. 20 µL of the MTT reagent was added
to every well and incubated at 37ºC at 110 rpm during 1 hour. Absorbance at 490 nm
was measured with an spectrophotometer Victor3 Plate Reader (PerkElmer,
Massachusetts, USA).
2.4 Transient transfection
HEK 293 suspension cells were transiently transfected using 25-kDa linear
polyethilenimine (PEI) (PolySciences, Warrington, PA, USA). Transfections were
performed using different concentrations of DNA and PEI to find the optimal
concentration and ratio. PEI/DNA complexes were formed by adding PEI to plasmid

DNA diluted in fresh culture media (10% of the total volume of the culture to be
transfected). The mixture was incubated for 15 min at room temperature to allow
complex formation prior to its addition to the cell culture. The percentage of GFP
positive cells was assessed using a BD FACS Canto flow cytometer (BD Biosciences,
San Jose, CA, USA) at different hours post-transfection (hpt).
2.5 VLP quantitation
The concentration of Gag-GFP VLPs was assessed by fluorimetry using an in-house
developed and qualified quantification assay [34]. VLP-containing supernatants were
recovered by cell culture centrifugation at 1000×g for 5 min. Green fluorescence was
measured at room temperature using a Cary Eclipse Fluorescence
Spectrophotometer (Agilent Technologies, Santa Clara, CA, USA) set as follows: λex=
488 nm (slit 5 nm), λem= 510 nm (slit 10 nm). Relative fluorescence units values (RFU)
were calculated by subtracting fluorescence units (FU) values of untransfected negative
control samples. There is a linear correlation between fluorescence intensity and p24
values determined using the INNOTEST ELISA HIV antigen mAb (Innogenetics NV,
Gent, Belgium). RFU values can be converted to Gag-GFP concentration values using
the following equation:
where Gag-GFP is the estimated concentration of polyprotein and RFU is the measured
GFP fluorescence intensity in the samples. The first term is the correlation equation
between fluorescence values and p24 concentrations determined by ELISA and 36 is a
correction factor that takes into account the difference in molecular weight between p24

and Gag-GFP and an underestimation arising from using the p24 ELISA to estimate p55
Gag concentrations.
2.6 Additive concentration optimization using statistically designed experiments
The additives used in this work to optimize VLP production were Nocodazole (M1404,
Sigma, Saint Louis, MO, USA), Lithium Acetate (62393, Sigma), DMSO (D2438,
Sigma), Valproic acid (P4543, Sigma), Sodium Butyrate (B103500, Sigma), Caffeine
(C0750, Sigma), Hydroxyurea (H8627, Sigma) and Trichostatin A (T1952, Sigma).
2.6.1 Plackett-Burman design
A fractional factorial Plackett-Burman design was used to identify supplements with a
significant effect on transfection efficiency and VLP production and screen out
irrelevant compounds. The eight selected compounds were screened at two levels: a low
level (no additive) coded as -1 and a high level coded as +1 as indicated in Table 2.
High levels for each compound were defined based on pre-existing knowledge extracted
from the literature and toxicity assays.
The main effects of independent variables (in this case, compounds tested) were
calculated using the following equation:
where is the effect of the variable i on the response when the variable is used at its
high level or low level , and n is the number of experimental runs.
Plackett-Burman experimental results were fitted to a first-order polynomial function
described below by regression analysis:

where is the response (in percentage of GFP positive cells), is the model intercept
and is the linear coefficient for the independent variable .
2.6.2 Box-Behnken design
In order to define the optimal combination and concentration for each additive selected
in the previous step, a Box-Behnken design was used. Compounds with significant
effect on transient transfection and VLP production were screened at three levels: a low
level coded as -1, a medium level coded as 0 and a high level coded as +1 as indicated
in Table 4 and 5. Box-Behnken experimental results were fitted to a second-order
polynomial equation described below by non-linear regression analysis:
where is the response (in relative fluorescence units, R.F.U. at 48 hpt), is the offset
term, the linear coefficient, the quadratic coefficient, the interaction
coefficient and Xi and Xj are the independent variables (i.e. tested compounds). This
equation was used to predict the optimum concentration values of the independent
variables using R project for statistical computing. Three-dimensional surface plots
were generated to facilitate model interpretation.
2.6.3 Statistical analyses
Statistical analyses of the models were performed using R project for statistical
computing. The quality of the fit of the model equation is expressed by the coefficient
R2 obtained by regression analysis. The overall significance of the model and
coefficients was determined by analysis of variance (ANOVA) F-test.


3 Results and discussion 3.1 Preliminary tests to define key experimental conditions 3.1.1 PEI/DNA ratio optimization
The DNA/PEI ratio used for transient transfection was first optimized using Central
Composite Design of experiments (CCD). Five levels for each variable were established
as shown in Table 2, taking the standard concentration of DNA and PEI used as central
point [1]. The resulting matrix consisted in 13 experiments and the percentage of GFP
positive cells was analyzed 48 hours post-transfection (hpt) (Table 2). The results
obtained were fitted to a second order polynomial (equation 5).
(5)
where %GFP is the percentage of GFP positive cells at 48 hpt, DNA is the
concentration of plasmid Gag-GFP and PEI is the concentration of PEI both in μg/ml of
culture.
Regression analysis showed that the model was adequate with a coefficient R2 of 0.753,
indicating that the model is consistent with 75.3% of the variability in the data. The
statistical significance of the model was confirmed by ANOVA analysis (Table 2). The
Fisher's F-test associated p-value of 0.0421 indicated that the model had a level of
confidence of 95.8%. The response surface graph generated from the obtained results
(Figure 1) allows observing the effect of each variable on the transfection efficiency in
terms of percentage of GFP positive cells.

The second-order polynomial model was used to calculate optimum concentrations of
DNA and PEI, being 1 μg of DNA/ml of culture and 3 μg of PEI/mL of culture. Under
these conditions the predicted response was 73% of GFP positive cells at 48 hpt.
Figure 1. Transfection efficiency optimization by design of experiments. Response
surface graphs based on central composite design experimental results show the
percentage of GFP positive cells as a function of the concentrations of DNA (μg/mL)
and PEI (μg/mL).
−1.0−0.5
0.0 0.5 1.0−1.0
−0.50.0
0.51.0
−20
0
20
40
60
% o
f G
FP
po
siti
ve c
ells
DN
A
PEI

Table 2 Code levels, matrix design, response and regression coefficients for central
composite experimental design
°
a Responses are percentage of GFP positive cells at 48 hpt. Abbreviations: N°, experiment number
3.1.2 Time of additive addition
The time of additive addition to the cell culture relative to the time of culture
transfection with PEI/DNA complex addition was established prior to conducting the
design of experiments. LiAc and DMSO were added to cell cultures 3 hours prior to

transfection as described in the literature [11]. The best time for addition of Nocodazole
is less well defined in the current literature and can be cell line dependent. Therefore, a
kinetic study was performed to ensure that the maximum number of HEK293 cells
would be arrested at G2/M phase at the time of transfection (section 3.1.2.1.
Determination of Nocodazole action kinetics). The rest of the additives evaluated in this
work were added 4 hours post-transfection in accordance to the published literature
[23,28].
3.1.2.1 Determination of Nocodazole action kinetics
Nocodazole is known to arrest cells in the G2/M phase of the cell cycle resulting in
enhanced transfection efficiency, as cells are more receptive to the uptake of foreign
DNA into the cell nucleus. An experiment was carried out to determine at which time
nocodazole would cause the maximum effect. In a first experiment, different
concentrations of nocodazole were tested. Best results were obtained with a
concentration of 2 μg of Nocodazol/mL of culture, which resulted in 50% of cells
arrested at G2/M phase at 12 hours after Nocodazol addition (figure 2A). This
concentration was used in a second experiment consisting of a kinetics study in which
the percent of cells at different cell cycle phases was monitored during 24 hours to
determine the time necessary to reach the maximum percentage of cells in G2/M phase.
Figure 2B shows that in the absence of nocodazole, the percentage of cells in G2/M
ranges between 7 to 16.6% during the 24 hours. When nocodazole is added to the
culture (Figure 2C), the percent of cells arrested in the G2/M phase of the cell cycle
continuously increases over time from 13% at time of nocodazol addition until they
reach a plateau 23 hours after, with a percentage of cells at G2/M phase of 71%. It is
also remarkable that the percentage of cells in G0/G1 phase was zero after 23 hours of

nocodazole exposure. It can be concluded from these experiments that cells should be
exposed to nocodazole 24 hours before transient transfection in order to observe the
maximum effect of nocodazole.
Figure 2. Toxicity assays. Viable cell density (106 cells/mL) attained after 72 hours of
seeding analyzed using MTT assay in response to different concentrations of
Nocodazole (μg/mL) (A), DMSO (V/V) (B), Lithium Acetate (mM) (C), Valproic acid
Nocodazole (μg/mL)
G1
SG2/M
Time (hours)
% o
f ce
lls a
t e
ach
ce
ll cy
cle
ph
ase
0
10
0 5 20 251510
20
30
40
50
60
70
80
90
100G1SG2/M
% o
f ce
lls a
t e
ach
ce
ll cy
cle
ph
ase
Time (hours)
0 5 20 251510
G1SG2/M
% o
f ce
lls a
t e
ach
ce
ll cy
cle
ph
ase
0
10
20
30
40
50
60
70
80
90
100
0
10
20
30
40
50
60
70
0 0.2 2 5
B
C
A

(mM) (D), Sodium butyrate (mM) (E), Trichostatin A (mM) (F), Caffeine (mM) (G)
and Hydroxyurea (μM) (H).
3.1.3 Toxicity assays
To avoid cytotoxic effect elicited by compounds being tested in the design of
experiments, a maximum and a minimum concentration for the different tested
compounds were established. In order to define the maximum level of each additive
while maintaining a high viable cell count, a toxicity assay using the MTT assay was
carried out. The results of the toxicity assays are shown in Figure 3. Experimental
ranges for the Plackett-Burman design were determined based on these results (Table
3). The maximum additive concentration to be used in the experiments was that
resulting in no less than 50% cell density compared to that reached by the negative
control cell culture in which no additive was added.
Table 3. Code levels, matrix design and regression coefficients for Plackett-Burman
experimental design.

Abbreviations: EXP N°, experiment number

Figure 3. Cell growth arrest kinetics. Percentage of cells at each phase of the cell cycle
depending on Nocodazole concentration (A). Percentage of cells at each phase of the
Via
ble
cel
l den
sity
(10
cel
ls/m
L)
0 5 10 15
6
20 250.0
0.5
1.0
1.5
2.0
2.5
Nocodazole (μg/mL) DMSO (V/V)
Valproic acid (mM)
Sodium butyrate (mM) Trichostatin A (μM)
Lithium acetate (mM)
Caffeine (mM) Hydroxyurea (μM)
Via
ble
cel
l den
sity
(10
cel
ls/m
L)
0.0
0.5
1.0
1.5
2.0
2.5
Via
ble
cel
l den
sity
(10
cel
ls/m
L)
0.0
0.5
1.0
1.5
2.0
2.5
Via
ble
cel
l den
sity
(10
cel
ls/m
L)
0.0
0.5
1.0
1.5
2.0
2.5
Via
ble
cel
l den
sity
(10
cel
ls/m
L)
0.0
0.5
1.0
1.5
2.0
2.5
Via
ble
cel
l den
sity
(10
cel
ls/m
L)
0.0
0.5
1.0
1.5
2.0
2.5
3.0
0 200 400 600 120010008000 2 4 6 8 10 12
Via
ble
cel
l den
sity
(10
cel
ls/m
L)
1.8
1.6
0.0
0.2
0.4
0.6
0.8
1.0
1.2
1.4
0 155 10 20 25 30 35
Via
ble
cel
l den
sity
(10
cel
ls/m
L)
1.8
1.6
0.0
0.2
0.4
0.6
0.8
1.0
1.2
1.4
0 155 10 20 25 30 35
10 2 3 4 5 6 7
0 10 20 30 40 50 60
10 2 3 4 5 6
A BA
C D
E F
G H

cell cycle followed during 24 hours when no additive is added to the culture (B) and
when exposed to 2 (μg/mL) of Nocodazole (C).
3.2 Optimization of Gag-GFP VLP production using additives.
The optimization of the production was performed using a two-step design of
experiments methodology. In the first step, a Plackett-Burman design was performed to
evaluate the main effect of each additive and discard those not having any effect of gene
expression or even having a negative effect. Subsequently, a Box-Behnken experiment
was performed with the selected additives to find the optimal concentration of each of
them to reach maximum levels of gene expression.
3.2.1 Screening additives using Plackett-Burman design of experiments
A statistically designed experiment arranged according to the Plackett-Burman design
was carried out to decipher which additives had a significant effect on VLP production
as described in the materials and methods section. The experimental design matrix in
coded values, response and statistical analysis are shown in Table 3.
For the performance of the Plackett-Burman design, 24 hours in advance cells were split
in 12 shake flasks and Nocodazole was only added to those flasks coded as +1 (high
level of the additive) as indicated in Table 3. Three hours before the experiment, DMSO
and LiAc were also added to the flasks with high level of these compounds. Just before
transfection, a complete medium exchange was performed to all the flasks and finally,
four hours post transfection, the remaining additives were added as indicated in Table 3.
Samples were taken at 48 and 72 hpt and cell density, viability, % of GFP positive cells
and fluorescence in the supernatant was analyzed. Fluorescence in the supernatant and

transfection efficiency at 48 hpt were used as DoE responses. Fluorescence was
adjusted to a first order polynomi (Equation 2).
(2)
The regression analysis showed that the model was adequate for the experimental data
with a coefficient R2=0.972 indicating that the model is consistent with 97.2% of the
variability of the data. The statistical significance of the model was confirmed by
ANOVA analysis (Table 3). The Fisher's F-test associated p-value of 0.029 indicated
that the model had a level of confidence of 97,1%.
Observing the main effects of each variable (Figure 4B) it can be concluded that the
components with clear positive effect on fluorescence are Sodium butyrate, Valproic
acid and Caffeine. Therefore, these supplements were selected for further optimization.
Lithium acetate was also selected, as it showed a great effect in transfection efficiency
and there is a possibility of interaction with the other components that leads to an
overall improvement in Gag-GFP VLP production levels.

Figure 4. Main effect of non-animal derived supplements on HEK 293 cells growth in
Freestyle medium according to Plackett–Burman DoE. Taking relative fluorescence (A)
and transfection efficiency (B) as a response
Noco
Re
lati
ve
flu
ore
sce
nce
un
its
(R.F
.U.)
−1 1
DMSO LiAc NaBut VPA Trico Caf HU
81
82
01
21
41
61
0
−1 1 −1 1 −1 1 −1 1 −1 1 −1 1 −1 1
A
70
−1 1 −1 1 −1 1 −1 1 −1 1 −1 1 −1 1 −1 1
60
50
40
30
20
Noco DMSO LiAc NaBut VPA Trico Caf HU
% o
f G
FP
po
siti
ve
ce
lls
B

3.2.2 Optimization of the concentration of the additives used in combination using Box-
Behnken design of experiments
For the Box-Behnken design of experiments, three levels of concentrations of each
additive were needed, a minimum, a medium and a maximum level (Table 4), all within
the limits of minimal toxicity for each component.
values, response and statistical analysis of the method are outlined in Table 4. A
total of 27 experiments were required to perform the Box-Behnken design (BB1).
Samples were taken 48 and 72 hpt and cell density, viability, percentage of GFP
positive cells and fluorescence in the supernatant were analyzed. Three shake-flasks
without any component addition were used as control and included to the design of
experiments matrix.
Fluorescence in the supernatant at 48 hpt was measured and the response and was
adjusted to a second order polynomial (Equation 3).
Regression analysis showed that the model was adequate with a coefficient R2 of 0.956.
This indicates that the model is consistent with 95.6% of the variability in the data. The
statistical significance of the model was confirmed by the Fisher´s F-test. An associated
p-value of <0.0001 indicated the model is significant. The significance of each
regression coefficient was analyzed by student´s t-test (Table 4).
The general trend of the observed experimental responses and the interactive effects on
the response can be observed in the three-dimensional plots presented in Figure 5. In

general it can be observed that the level of lithium acetate is optimal at its center value
independently of the other compounds used and that production increases as the
concentration of sodium butyrate does. In Figure 5A, B, C, it can be observed that as the
concentration of sodium butyrate increases, less valproic acid has to be used, possibly
because they complement each other as they have a similar mechanism of action. In
Figure 5 D, E and F, it can be observed that caffeine optimum corresponds to its highest
level when butyric acid is at its lowest level, but once butyric acid concentration
increases, the optimal level of caffeine drops to its lowest level, which would also
suggest some kind of complementation between both compounds. In Figures 5 G, H, I,
it can be observed that as the concentration of butyric acid increases, the effect of
caffeine and valproic acid is negative.
Table 4. Code levels, matrix design, response and regression coefficients for Box-
Behnken experimental design (BB1).

a Responses are percentage fluorescence at 48 hpt. Abbreviations: N°, experiment
number

By solving the model equation, optimum concentrations of Lithium Acetate, Valproic
Acid, Butyric Acid and Caffeine were calculated as 5.14 mM, 0.66 mM, 5 mM and 0
mM, respectively. One relevant aspect to be considered in the previous series of
experiments is the negative interactions observed between Sodium butyrate with the rest
of compounds studied and the low cell viability observed when butyric acid is used.
Indeed, the negative effects of Sodium butyrate on cells viability have also been
observed by other authors, reporting that the positive effect of Sodium butyrate in terms
of production is accompanied by an evident deleterious effect on cell growth triggering
cell arrest and apoptosis [19,25]. Consequently, a second Box-Behnken design (BB2) is
proposed, in which butyric acid is excluded, with the aim to investigate if the effects on
cell viability could be mitigated while preserving the obtained production enhancement.
Therefore, this second optimization experiment (BB2) is performed with Lithium
Acetate, Valproic Acid and Caffeine. The experimental design matrix in coded values,
response and statistical analysis of the method are outlined in Table 5.

Figure 5. Response surface graphs based on Box–Behnken (BB1) experimental results.
These 3D graphs were constructed by depicting two variables at a time while keeping
the third one at its lowest level. The increase in the concentration of Sodium Butyrate is
studied for each combination. Relative fluorescence units as a function of the
concentrations of Lithium acetate (mM) vs. Valproic acid (mM) (A, B, C), of Lithium
acetate (mM) vs. Caffeine (mM) (D, E, F) and Valproic acid (mM) vs. Caffeine (mM)
(G, H, I).
VPA−1.0−0.5
0.00.5
1.0
LiAc
−1.0
−0.50.0
0.51.020
30
40
50
Slice at NaBut = −1, Caffeine = −1
−1.0−0.5
0.00.5
1.0
−1.0
−0.50.0
0.51.035
40
45
50
Slice at NaBut = 0, Caffeine= −1
−1.0−0.5
0.00.5
1.0
−1.0
−0.50.0
0.51.0
40
45
50
55
60
65
Slice at NaBut = 1, Caffeine = −1
−1.0−0.5
0.00.5
1.0
−1.0
−0.50.0
0.51.0
20
25
Slice at NaBut = −1, VPA = −1
Caffeine−1.0
−0.50.0
0.51.0
−1.0
−0.50.0
0.51.0
30
35
40
Slice at NaBut = 0, VPA = −1
−1.0−0.5
0.00.5
1.0
−1.0
−0.50.0
0.51.0
4045
50
55
60
65
Slice at NaBut= 1, VPA = −1
−1.0−0.5
0.00.5
1.0
−1.0
−0.50.0
0.51.020
25
30
35
40
45
Slice at NaBut = −1, LiAc = −1
−1.0−0.5
0.00.5
1.0
−1.0
−0.50.0
0.51.0
30
35
40
45
Slice at NaBut = 0, LiAc = −1
−1.0−0.5
0.00.5
1.0
−1.0
−0.50.0
0.51.020
30
40
50
60
Slice at NaBut = 1, LiAc = −1
R.F
.U.
R.F
.U.
LiAc
LiAcVPA VPA
R.F
.U.
CaffeineCaffeine
LiAc
LiAc
LiAc
R.F
.U.
R.F
.U.
R.F
.U.
Caffeine
R.F
.U.
R.F
.U.
R.F
.U.
CaffeineCaffeine
VPA
VPA
VPA
A
D
G
B
E
H
C
F
I

A total of 15 experiments were carried out, samples were obtained at 48 and 72 hpt and
cell density, viability, percentage of GFP positive cells and fluorescence in the
supernatant were analyzed (Table 5). Fluorescence in the supernatant at 48 hpt was
adjusted to a second order polynomial (Equation 4).
Regression analysis showed that the model was adequate with a coefficient R2 of .
This indicates that the model is consistent with 96.0% of the variability in the data. The
Fisher´s F-test confirmed the statistical significance of the model. An associated p-value
of 0.0004 indicated the model is significant. The significance of each regression
coefficient was analyzed by student´s t-test (Table 5).
Table 5. Code levels, matrix design, response and regression coefficients for Box-
Behnken experimental design (BB2).

a Responses are relative fluorescence units at 48 hpt. Abbreviations: N°, experiment numbers
Three-dimensional plots were constructed for visual observation of the trend of
maximum responses and the interactive effects of the significant variables on the
response (Figure 6). Upon close evaluation of the behavior of the response over the

experimental region it can be observed that the optimum level of Valproic acid and
Caffeine is in the middle of the evaluated concentration range, whereas optimal
concentration of lithium acetate is towards the edge of the range of concentrations
tested.
By solving the model equation, optimum concentrations of Lithium Acetate, Valproic
Acid and Caffeine, were calculated as 20 mM, 3.36 mM and 5.04 mM, respectively.
Figure 6. Response surface graphs based on Box–Behnken (BB6) experimental results.
These 3D graphs were constructed by depicting two variables at a time while keeping
the third one at its middle level. Relative fluorescence units as a function of the
concentrations of Lithium acetate (mM) vs. Valproic acid (mM) (A), of Lithium acetate
(mM) vs. Caffeine (mM) (B) and Valproic acid (mM) vs. Caffeine (mM) (C).
3.2.3 Validation of the model.
In order to validate the results, an experiment using the optimal concentrations of the
additives was performed. The results obtained in BB1 (LiAc: 5.14 mM, VPA: 0.66 mM,
NaBut: 5 mM) and in BB2 (LiAc: 20 mM, VPA: 3.36 mM and Caffeine: 5.04 mM)
were validated. Other two conditions were also tested, one using the optimal
−1.0−0.5
0.00.5
1.0
−1.0
−0.50.0
0.51.0
30
40
50
60
Slice at Caffeine=0
−1.0−0.5
0.00.5
1.0
−1.0
−0.50.0
0.51.0404550
55
60
65
Slice at VPA=0
−1.0−0.5
0.00.5
1.0
−1.0
−0.50.0
0.51.010
20
30
40
50
Slice at LiAc=0
VPA
LiAc
LiAc
CaffeineCaffeine
VPA
R.F
.U.
R.F
.U.
R.F
.U.
A B C

concentration of NaBut founded in a lineal experiment (data not shown) and a control
using no additives (Figure 7),
It can be observed that results obtained in terms of fluorescence by using the optimal
concentration found in BB1 and the results obtained using only Sodium Butyrate at 48
hpt are equivalent and 88.8. R.F.U. (2.94×10¹⁰VLPs/mL), with viabilities of 81% and
71% respectively. These results suggest that by adding Lithium Acetate and Valproic
Acid to Butyric Acid the viability of the culture increases 10% higher. The results using
BB2 were slightly lower than when butyric acid is used, 69.1 R.F.U.
(2.3×10¹⁰VLPs/mL), but the viability of the culture is the highest of all the conditions
tested (94%), even higher than when no additives are added to the culture. When
fluorescence is compared with the negative control the increase when BB1 or butyric
acid by its own is 4.9 fold, and the increase when the combination when BB2 is used is
3.8 fold.

Figure 7. Model validation. Production of Gag-GFP VLPs using the optimal
concentration of additives. An experiment with only Sodium butyrate and a control
without additives were added for comparison. Mean values ± standard deviation of
triplicate experiments are represented.
0 24
240
48 720
10
30
20
40
50
60
70
80
90
100
0
1
2
3
4
5
6
7
8
Time (hpt)
% o
f v
iab
ility
Via
ble
ce
ll d
en
sity
(1
0 c
ells
/mL)
6
BB2 BB1 NaBut
048 72
Time (hpt)
20
40
60
80
100
120
Control ControlviabilityBB2viability BB1viability NaButviability
BB2 BB1 NaBut Control
Re
lati
ve F
luo
resc
en
ce u
nit
s (R
.F.U
.)
A
B

One consideration to be made is on the observed differences in final viability among the
different protocols and their potential impact on the corresponding downstream process
for the final purification of the VLPs, since a lower viability would imply a higher
amount of cellular debris and the release of intracellular components making more
difficult and expensive the production of the final VLP preparation. Additionally,
considering that enveloped VLPs are exported out from the cell through a budding
process, a decrease in culture viability can lead to a decrease of properly assembled and
enveloped VLPs. For this reasons the optimum concentrations of additives obtained in
BB2 should be considered the best option.
Conclusions
Taking into consideration the results obtained in this work, it can be concluded that a
methodology has been developed for the optimization of production of HIV-1 Gag-GFP
VLPs by transient transfection of HEK 293 cells using specific additives as enhancers
of VLPs production. The optimal methodology proposed is: Transfect exponencially
growing cells at 2×10⁶ cells/mL, using 1 μg of DNA/(ml of culture) and 3 μg of
PEI/(mL of culture). Add Lithium acetate to a concentration of 20mM, 3 hours prior
transfection and add Valproic acid to a concentration of 3.36 mM and 5.04 mM of
Caffeine, 4 and hours post transfection.
One very relevant characteristic of this methodology is that it can be performed
preserving cell viability at high concentrations.

References
[1] Cervera L, Gutiérrez-Granados S, Martínez M, Blanco J, Gòdia F, Segura MM. Generation of HIV-1 Gag VLPs by transient transfection of HEK 293 suspension cell cultures using an optimized animal-derived component free medium. J Biotechnol 2013;166:152–65.
[2] Cervera L, Gutiérrez-Granados S, Berrow NS, de Las Mercedes Segura M, Gòdia F. Extended gene expression by medium exchange and repeated transient transfection for recombinant protein production enhancement. Biotechnol Bioeng 2014.
[3] Ansorge S, Lanthier S, Transfiguracion J, Durocher Y, Henry O, Kamen A. Development of a scalable process for high-yield lentiviral vector production by transient transfection of HEK293 suspension cultures. J Gene Med 2009;11:868–76.
[4] Pham PL, Perret S, Cass B, Carpentier E, St.-Laurent G, Bisson L, et al. Transient gene expression in HEK293 cells: Peptone addition posttransfection improves recombinant protein synthesis. Biotechnol Bioeng 2005;90:332–44.
[5] Sun X, Goh PE, Wong KTK, Mori T, Yap MGS. Enhancement of transient gene expression by fed-batch culture of HEK 293 EBNA1 cells in suspension. Biotechnol Lett 2006;28:843–8.
[6] Melkonyan H, Sorg C, Klempt M. Electroporation efficiency in mammalian cells is increased by dimethyl sulfoxide (DMSO). Nucleic Acids Res 1996;24:4356–7.
[7] Gietz RD, Schiestl RH, Willems AR, Woods RA. Studies on the transformation of intact yeast cells by the LiAc/SS-DNA/PEG procedure. Yeast 1995;11:355–60.
[8] Gietz D, St Jean A, Woods RA, Schiestl RH. Improved method for high efficiency transformation of intact yeast cells. Nucl Acid Res 1992;20:1425.
[9] Gietz RD, Schiestl RH. Applications of high efficiency lithium acetate transformation of intact yeast cells using single-stranded nucleic acids as carrier. Yeast 1991;7:253–63.
[10] Papagianni M, Avramidis N, Filioussis G. High efficiency electrotransformation of Lactococcus lactis spp. lactis cells pretreated with lithium acetate and dithiothreitol. BMC Biotechnol 2007;7:15.
[11] Ye J, Kober V, Tellers M, Naji Z, Salmon P, Markusen JF. High-level protein expression in scalable CHO transient transfection. Biotechnol Bioeng 2009;103:542–51.
[12] Tait AS, Brown CJ, Galbraith DJ, Hines MJ, Hoare M, Birch JR, et al. Transient production of recombinant proteins by Chinese hamster ovary cells using

polyethyleneimine/DNA complexes in combination with microtubule disrupting anti-mitotic agents. Biotechnol Bioeng 2004;88:707–21.
[13] Fussenegger M, Bailey JE, Hauser H, Mueller PP. Genetic optimization of recombinant glycoprotein production by mammalian cells. Trends Biotechnol 1999;17:35–42.
[14] Suzuki E, Ollis DF. Enhanced antibody production at slowed growth rates: experimental demonstration and a simple structured model. Biotechnol Prog 6:231–6.
[15] Ellis BL, Potts PR, Porteus MH. Creating higher titer lentivirus with caffeine. Hum Gene Ther 2011;22:93–100.
[16] Hall-Jackson CA, Cross DA, Morrice N, Smythe C. ATR is a caffeine-sensitive, DNA-activated protein kinase with a substrate specificity distinct from DNA-PK. Oncogene 1999;18:6707–13.
[17] Sarkaria JN, Busby EC, Tibbetts RS, Roos P, Taya Y, Karnitz LM, et al. Inhibition of ATM and ATR kinase activities by the radiosensitizing agent, caffeine. Cancer Res 1999;59:4375–82.
[18] Block WD, Merkle D, Meek K, Lees-Miller SP. Selective inhibition of the DNA-dependent protein kinase (DNA-PK) by the radiosensitizing agent caffeine. Nucleic Acids Res 2004;32:1967–72.
[19] Rodrigues Goulart H, Arthuso F dos S, Capone MVN, de Oliveira TL, Bartolini P, Soares CRJ. Enhancement of human prolactin synthesis by sodium butyrate addition to serum-free CHO cell culture. J Biomed Biotechnol 2010;2010:405872.
[20] Damiani R, Almeida BE, Oliveira JE, Bartolini P, Ribela MTCP. Enhancement of human thyrotropin synthesis by sodium butyrate addition to serum-free CHO cell culture. Appl Biochem Biotechnol 2013;171:1658–72.
[21] Sung YH, Song YJ, Lim SW, Chung JY, Lee GM. Effect of sodium butyrate on the production, heterogeneity and biological activity of human thrombopoietin by recombinant Chinese hamster ovary cells. J Biotechnol 2004;112:323–35.
[22] Mimura Y, Lund J, Church S, Dong S, Li J, Goodall M, et al. Butyrate increases production of human chimeric IgG in CHO-K1 cells whilst maintaining function and glycoform profile. J Immunol Methods 2001;247:205–16.
[23] Backliwal G, Hildinger M, Kuettel I, Delegrange F, Hacker DL, Wurm FM. Valproic Acid : A Viable Alternative to Sodium Butyrate for Enhancing Protein Expression in Mammalian Cell Cultures. Biotechnology 2008;101:182–9.

[24] Palermo DP, DeGraaf ME, Marotti KR, Rehberg E, Post LE. Production of analytical quantities of recombinant proteins in Chinese hamster ovary cells using sodium butyrate to elevate gene expression. J Biotechnol 1991;19:35–47.
[25] Jiang Z, Sharfstein ST. Sodium butyrate stimulates monoclonal antibody over-expression in CHO cells by improving gene accessibility. Biotechnol Bioeng 2008;100:189–94.
[26] Wulhfard S, Baldi L, Hacker DL, Wurm F. Valproic acid enhances recombinant mRNA and protein levels in transiently transfected Chinese hamster ovary cells. J Biotechnol 2010;148:128–32.
[27] Backliwal G, Hildinger M, Chenuet S, DeJesus M, Wurm FM. Coexpression of acidic fibroblast growth factor enhances specific productivity and antibody titers in transiently transfected HEK293 cells. N Biotechnol 2008;25:162–6.
[28] Backliwal G, Hildinger M, Chenuet S, Wulhfard S, De Jesus M, Wurm FM. Rational vector design and multi-pathway modulation of HEK 293E cells yield recombinant antibody titers exceeding 1 g/l by transient transfection under serum-free conditions. Nucleic Acids Res 2008;36:e96.
[29] Fan S, Maguire CA, Ramirez SH, Bradel-Tretheway B, Sapinoro R, Sui Z, et al. Valproic acid enhances gene expression from viral gene transfer vectors. J Virol Methods 2005;125:23–33.
[30] Spenger A, Ernst W, Condreay JP, Kost TA, Grabherr R. Influence of promoter choice and trichostatin a treatment on expression of baculovirus delivered genes in mammalian cells. Protein Expr Purif 2004;38:17–23.
[31] Hermida-Matsumoto L, Resh MD. Localization of human immunodeficiency virus type 1 Gag and Env at the plasma membrane by confocal imaging. J Virol 2000;74:8670–9.
[32] Schwartz S, Campbell M, Nasioulas G, Harrison J, Felber BK, Pavlakis GN. Mutational inactivation of an inhibitory sequence in human immunodeficiency virus type 1 results in Rev-independent gag expression. J Virol 1992;66:7176–82.
[33] Segura MM, Garnier A, Durocher Y, Coelho H, Kamen A. Production of lentiviral vectors by large-scale transient transfection of suspension cultures and affinity chromatography purification. Biotechnol Bioeng 2007;98:789–99.
[34] Gutiérrez-Granados S, Cervera L, Gòdia F, Carrillo J, Segura MM. Development and validation of a quantitation assay for fluorescently tagged HIV-1 virus-like particles. J Virol Methods 2013;193:85–95.


Selection and optimization of transfection enhancer additives for increased virus-like particle production in HEK293 suspension cell cultures
Laura Cervera1, Sonia Gutiérrez-Granados1, Nicholas Simon Berrow2, Maria
Mercedes Segura3 and Francesc Gòdia1.
1. Grup d'Enginyeria Cellular i Tissular, Escola d'Enginyeria, Universitat Autònoma de,
Barcelona, Campus de Bellaterra, Cerdanyola del Vallès, 08193 Barcelona, Spain.
2. Protein Expression Core Facility, Institute for Research in Biomedicine (IRB)
Barcelona, Spain
3. bluebird bio, Pharmaceutical Sciences, Process Development group, 150 2nd
Street Cambridge, MA 02141 339-499-9300-USA.


Extended Gene Expression by Medium Exchangeand Repeated Transient Transfection forRecombinant Protein Production EnhancementLaura Cervera,1 Sonia Gutierrez-Granados,1 Nicholas Simon Berrow,2
Maria Mercedes Segura,3 Francesc Godia1
1Grup d’Enginyeria Cellular i Tissular, Escola d’Enginyeria, Universitat Autonoma deBarcelona, Campus de Bellaterra, Cerdanyola del Valles, 08193, Barcelona, Spain;telephone: þ34 935814790; fax: þ34 935812013; e-mail: [email protected] Expression Core Facility, Institute for Research in Biomedicine (IRB) Barcelona,Barcelona, Spain3bluebird bio, Pharmaceutical Sciences, Process Development group, Cambridge,Massachusetts
ABSTRACT: Production of recombinant products in mammaliancell cultures can be achieved by stable gene expression (SGE) ortransient gene expression (TGE). The former is based on theintegration of a plasmid DNA into the host cell genome allowingcontinuous gene expression. The latter is based on episomalplasmid DNA expression. Conventional TGE is limited to a shortproduction period of usually about 96 h, therefore limitingproductivity. A novel gene expression approach termed extendedgene expression (EGE) is explored in this study. The aim of EGE is toprolong the production period by the combination of mediumexchange and repeated transfection of cell cultures with plasmidDNA to improve overall protein production. The benefit of thismethodology was evaluated for the production of three modelrecombinant products: intracellular GFP, secreted GFP, and a Gag-GFP virus-like particles (VLPs). Productions were carried out inHEK 293 cell suspension cultures grown in animal-derivedcomponent free media using polyethylenimine (PEI) as transfectionreagent. Transfections were repeated throughout the productionprocess using different plasmid DNA concentrations, intervals oftime, and culture feeding conditions in order to identify the bestapproach to achieve sustained high-level gene expression. Usingthis novel EGE strategy, the production period was prolongedbetween 192 and 240 h with a 4–12-fold increase in productionlevels, depending on the product type considered.Biotechnol. Bioeng. 2014;9999: 1–13.� 2014 Wiley Periodicals, Inc.
KEYWORDS: HEK 293; transient transfection; recombinantproteins; VLPs; production optimization
IntroductionIndustrial production of recombinant therapeutics in mammaliancell cultures is routinely accomplished by stable gene expression(SGE). This manufacturing approach is based on the use of a cellline that, upon stable integration of a DNA sequence into the hostcell genome, enables continuous gene expression. The process toestablish a stable producer cell line involves transfection of cellswith plasmid DNA and subsequent selection of cells that have stablyintegrated the plasmid using a selection marker. Cells are thenclonally separated for identification of the highest producer cellclones, which are subsequently screened for optimal attributes suchas cell growth capacity, specific productivity, product quality (e.g.,glycosylation pattern), etc. (Wurm, 2004). This process is tedious,costly, and typically takes several months depending on thedifficulty to express the protein of interest (Baldi et al., 2007). Inaddition, the establishment of stable producer cell lines expressingcytotoxic genes and/or multiple genes for the generation of complexbiopharmaceuticals is challenging (Pluta and Kacprzak, 2009).
Transient gene expression (TGE) is based on episomal DNAexpression. Plasmid DNA entry to cells is facilitated by the use oftransfection reagents including inorganic compounds such ascalcium phosphate (CaPi), cationic polymers such as polyethyle-nimine (PEI), and cationic lipids such as lipofectamine
1
(Geisse,2009; Geisse and Fux, 2009; Pham et al., 2006). The product istypically harvested between 48 and 72 h post-transfection (hpt)(Cervera et al., 2013). This production approach is straightforwardand allows for the generation of sufficient quantities ofbiotherapeutics to conduct pre-clinical and clinical studies insome cases.
Correspondence to: F. GŒdiaContract grant sponsor: SEIDI - Ministerio de EconomUa y CompetitividadContract grant number: BIO2012-31251Contract grant sponsor: Generalitat de CatalunyaContract grant number: 2009 SGR 1038Received 5 September 2014; Revision received 11 November 2014; Accepted 18November 2014Accepted manuscript online xx Month 2014;Article first published online in Wiley Online Library(wileyonlinelibrary.com).DOI 10.1002/bit.25503
ARTICLE
� 2014 Wiley Periodicals, Inc. Biotechnology and Bioengineering, Vol. 9999, No. xxx, 2014 1
The application of TGE for production of recombinant proteinshas been reviewed (Geisse, 2009; Pham et al., 2006; Wurm, 2004].TGE is particularly suitable in early phases of development whenseveral product candidates need to be screened for clinical studies.The manufacturing of clinical grade complex biopharmaceuticalssuch as viral gene therapy vectors by TGE for trials in humans hasalso been described (e.g., retroviral, lentiviral, and adeno-associated viral vectors) (Ausubel et al., 2012; Cornetta et al.,2008; Merten et al., 2011; Wright, 2009).
Although TGE has been typically used at low and mediumscale, during the past 10 years significant effort has been madetowards developing large-scale TGE protocols. Large-scaleproduction using both PEI and CaPi transfection reagents hasbeen demonstrated at production scales ranging from 1 to 110 L(Baldi et al., 2005). For instance, successful generation of IgGantibody by TGE at 10 L scale in Wave bioreactors and 50 and100 L scale in stirred tank bioreactors has been reported(Tuvesson et al., 2008). Titers exceeding 1 g/L have been attainedby TGE (Backliwal et al., 2008).
While the most commonly used host cell for SGE is the ChineseHamster Ovary (CHO) cell line due to its extensive characterizationand well-established history of regulatory approvals, the predom-inant cell line for TGE is the Human Embryonic Kidney 293 (HEK293) cell line, mainly due to its unparalleled ability to becometransfected. Nonetheless, both TGE using CHO cells and SGE usingHEK 293 cells have also been successfully shown (Derouazi et al.,2004; Thomas and Smart, 2005). The latter is advantageous whenhuman post-translation modifications, as opposed to thoseobserved in hamster cells, confer beneficial properties to theproduct (Dietmair et al., 2012). This proved to be the case forhuman activated protein C, marketed as Xigris1, which requiredcertain human post-translational modifications to maintain itsbiological activity (Durocher and Butler, 2009).
Compared with SGE, TGE allows for rapid production ofbiopharmaceuticals, but product titer is usually lower (Dietmairet al., 2012). One of the intrinsic limits of TGE is that episomal DNAis lost as cells divide (Chiou et al., 2014; Middleton and Sugden,1994; Wade-Martins et al., 1999). As a result, the production time isshort, typically less than 96 hpt, which in turn limits the overallproduction capacity. Several specific cell lines have been developedin an attempt to maximize TGE production time. The most popularone is the HEK 293 T cell line that constitutively expresses the largeT antigen of the simian virus 40 (SV40). The protein allowsreplication of vectors containing the SV40 origin of replication inmammalian cells, thus augmenting episomal persistence (Baldiet al., 2007; Berntzen et al., 2005; Durocher et al., 2002; Geisse, 2009;Van Craenenbroeck et al., 2000;). Based on the same strategy, CHO-T and recently CAP-T cells have also been developed and used forTGE (Agrawal et al., 2013; Fischer et al., 2012; Kunaparaju et al.,2005). Similarly, the HEK 293 EBNA cell line that constitutivelyexpresses the Epstein Barr virus nuclear antigen 1 (EBNA1)supports the extra chromosomal amplification of plasmids carryingthe EBVorigin of replication (Durocher et al., 2002; Geisse and Fux,2009; Meissner et al., 2001; Van Craenenbroeck et al., 2000; Younget al., 1988). For all these cell lines, improved production isattributed to an increased plasmid copy number in the transfectedcell population throughout the production phase.
In order to extend TGE time, a novel gene expression approachtermed extended gene expression (EGE) was evaluated in this work.The aim of this production methodology is to prolong theproduction period by repeatedly transfecting HEK 293 suspensioncell cultures combined with repeated medium exchange. Theimpact of this approach on production time and overall productionyield for 3 model products, including an intracellular and secretableversion of GFP and complex virus-like particles (VLPs) labeled withGFP, was evaluated.
Materials and Methods
Cell Line, Media, and Culture Conditions
The cell line used in this work is a serum-free suspension-adaptedHEK 293 cell line (HEK 293SF-3F6) kindly provided by Dr. AmineKamen from the BRI of National Research Council of Canada(Montreal, Canada). It was derived from a cGMP master cell bankthat is available for manufacturing of clinical material. Cells werecultured in Freestyle 293 medium (Invitrogen, Carlsbad, CA)supplemented with 0.1% Pluronic
1
(Invitrogen). Medium was alsosupplemented with 1.6 mg/L of r-transferrin (Merck Millipore,Kankakee, IL), 19.8 mg/L of r-insulin (FeF Chemicals/NovoNordisk, Køge, Denmark.) and 0.9X of an in-house developedlipid mixture to maximize cell growth (Cervera et al., 2013). Cellswere routinely maintained in 125-mL disposable polycarbonateerlenmeyer flasks (Corning, Steuben, NY) in 20 mL of culturemedium. Flasks were shaken at 110 rpm using an orbital shaker(Stuart, Stone, UK) placed in an incubator maintained at 37 �C in ahumidified atmosphere of 5% CO2 in air. Cell count and viabilitywere determined using trypan blue staining followed by cellcounting using a hematocytometer.
Plasmids
The pGag-EGFP plasmid used in this work codes for a Rev-independent HIV-1 Gag protein fused in frame to the enhanced GFP(Hermida-Matsumoto and Resh, 2000). The plasmid from the NIHAIDS Reagent Program (Cat 11468) was constructed by cloning theGag sequence from pCMV55M1–10 (Schwartz et al., 1992) into thepEGFP-N1 plasmid (Clonthec, Mountain View, CA).
The expression plasmids pOPINEeGFP, pOPINECherry, andpOPINGeGFP used in this study were generated in the ProteinExpression Core Facility of the Institute for Research in Biomedicine(IRB) in Barcelona. Briefly, eGFP and Cherry fluorescent proteingenes, originally derived from pEGFP-N1 and pmCherry-N1(Clontech, Mountain View, CA), were amplified using the followingprimer pair: N-HiseGFP fwd: ataccatggcacaccatcaccaccatcacag-cagcggtatggtgagcaagggcgaggag, 3CFPrev: Cgacggtaccctgaaaca-gaacttccagaccgctgctcttgtacagctcgtccatg, the PCR products digestedwith NcoI and KpnI and ligated into NcoI-KpnI cut pOPINE(Berrow et al., 2007) to produce pPEU2 and pPEU3 respectively. Forsecreted proteins, eGFP was amplified from pEGFP-N1 using thefollowing primer pair: pOPINGFPfwd: GCGTAGCTGAAACCGG-CATGGTGAGCAAGGGCGAGGAG pOPINE/GFP rev: GTGATGGT-GATGTTTCTTGTACAGCTCGTCCATGCC. The resulting PCRproducts were cloned by In-Fusion cloning (Clontech, Mountain
2 Biotechnology and Bioengineering, Vol. 9999, No. xxx, 2014

View, CA) into vector pOPING (Berrow et al., 2007) linearised withKpnI and PmeI to produce pOPINGeGFP. Plasmids were preparedand purified as previously described (Segura et al., 2007).
Transient Transfection
HEK 293 suspension cells were transiently transfected using 25-kDalinear polyethylenimine (PEI) (PolySciences, Warrington, PA). HEK293 cells were seeded at 0.3� 106 cells/mL in 125-mL disposableflasks, grown to 2� 106 cells/mL and transfected with 1mg of DNA/mL or 0.5mg/mL of culture and a DNA to PEI mass ratio of 1:2 aftera complete medium exchange. PEI/DNA complexes were formed byadding PEI to plasmid DNA diluted in fresh culture media (10% ofthe total volume of the culture to be transfected). The mixture wasincubated for 15 min at room temperature to allow complexformation prior to its addition to the cell culture. The percentage ofGFP and Cherry positive cells was assessed using a BD FACS Cantoflow cytometer (BD Biosciences, San Jose, CA) at different hourspost-transfection (hpt). Mock transfected samples were included asnegative control in every experiment and served to adjust the flowcytometry gates.
Fluorescence Confocal Microscopy
The visualization of fluorescent producer cells was achieved using aFluoview
1
FV1000 confocal microscope (Olympus, Tokyo, Japan).Samples were placed on 14 mm microwells from 35 mm glass bottompetri dishes (MatTek Corporation, Ashland, MA) for visualization.
Fluorescence-based product Quantitation
For intracellular GFP and Cherry, cell lysates were prepared bysubjecting cell pellets to 3 freeze-thaw cycles followed bycentrifugation at 13.800� g for 20 min to eliminate cell debris.Green and cherry fluorescence were measured at room temperatureusing a Cary Eclipse Fluorescence Spectrophotometer (AgilentTechnologies, Santa Clara, CA) using the following sets for GFPprotein: lex¼ 488 nm (slit 5 nm), lem¼ 510 nm (slit 10 nm) andfor Cherry protein: lex¼ 587 nm (slit 5 nm), lem¼ 610 nm (slit10 nm). In the case of secreted GFP, supernants were clarified by cellculture centrifugation at 1000� g for 5 min. Relative fluorescenceunits values (R.F.U.) were calculated by subtracting fluorescenceunits (F.U.) values of untransfected negative control samples. Theconcentration of Gag-GFP VLPs was assessed by fluorometry usingan in-house developed and validated quantification assay (Gutiérrez-Granados et al., 2013). VLP containing supernatants were recoveredby cell culture centrifugation at 1000� g for 5 min. There is a linearcorrelation between fluorescence intensity and p24 values deter-mined using the INNOTEST p24 ELISA HIV antigen mAb(Innogenetics NV, Gent, Belgium). RFU values can be converted toGag-GFP concentration values using the following equation:
Gag � GFPngmL
� �¼ 3:245 � R:F:U:� 1:6833ð Þ � 36 ð1Þ
where Gag-GFP (ng/mL) is the estimated concentration ofpolyprotein and R.F.U. is the measured GFP fluorescence intensity
in the samples. The first term is the correlation equation betweenfluorescence values and p24 concentrations determined by ELISAand 36 is a correction factor that takes into account the difference inmolecular weight between p24 and Gag-GFP and an under-estimation arising from using the p24 ELISA to estimate p55 Gagconcentrations (Gutiérrez-Granados et al., 2013). For intracellularGFP and Cherry, cell lysates were prepared by subjecting cell pelletsto 3 freeze-thaw cycles followed by centrifugation at 13,800� g for20 min to eliminate cell debris. For the quantification of Cherryprotein, Cary Eclipse Fluorescence Spectrophotometer (AgilentTechnologies, Santa Clara, CA), was set as: lex¼ 587 nm (slit5 nm), lem¼ 610 nm (slit 10 nm).
Results and Discussion
Establishing an Extended Gene Expression Methodology
The proposed production strategy consisted in performing repeatedrounds of transfection to achieve a sustained level of geneexpression over time as opposed to the conventional TGE approachwhich entails a single transfection round. The initial transfectionround was performed at 2� 106 cells/mL using 1mg of plasmidDNA/mL of cell culture using a standard TGE protocol describedpreviously (Cervera et al., 2013). Retransfection rounds were thenperformed using various plasmid DNA concentrations, intervals oftime, and culture feeding conditions in order to identify the bestapproach to maintain gene expression over time. Since themethodology proposed comprised a medium exchange each time aretransfection was performed, a medium exchange negative control(ME) was included in the studies. In these ME control cultures, afterthe first transfection round, a complete medium exchange (but noDNA addition) was performed every 48 h.
To achieve extended gene expression (EGE), a complete mediumexchange followed by retransfection of cell cultures using aconcentration of 1mg of plasmid DNA/mL of cell culture every 48 hwas initially carried out. In an attempt to reduce the potentialtoxicity caused by the addition of the PEI/DNA complexes, twoalternative approaches were evaluated. The first approach wascarried out as described for EGE but after the first round oftransfection, cell cultures were re-transfected with only 0.5mg ofplasmid DNA/mL of cell culture (0.5 EGE). The alternative approachconsisted in retransfection rounds that were spaced in time.Therefore, cell cultures were treated as described for EGE with amedium exchange every 48 h but the addition of DNA (1mg ofplasmid DNA/mL of cell culture) was only performed every 96 h(96 h EGE).
All three EGE approaches described above were evaluated forproduction of three recombinant products with increasing levels ofexpression difficulty: (1) a green fluorescent protein (GFP)expressed intracellularly; (2) a GFP secreted to the culture medium;and (3) a fluorescently labeled HIV-1 Gag Virus-Like Particle (Gag-GFP VLP). The latter is a macromolecular complex of proteins andlipids that resemble virions but are devoid of genetic material andare therefore, incapable of replication. This feature makes VLPs verypromising vaccine candidates (Doan et al., 2005). The Gag-GFPpolyprotein self-assembles into a particle core inside the producercell and is released to the supernatant through a budding process.
Cervera et al.: Extended Gene Expression 3Biotechnology and Bioengineering

Gag-GFP VLPs are rounded structures measuring approximately140 nm and enveloped with the lipid membrane taken from theproducer cell (Briggs et al., 2004; Gutiérrez-Granados et al., 2013;Valley-Omar et al., 2011). Of note, all three products can bemonitored by detecting green fluorescence. GFP is among the mostwidely used reporter proteins. Its use in these studies enabledstraightforward determination of the transfection efficiency by flowcytometry and protein production levels by fluorometry.
Results obtained using the five transfection experimentsdescribed above (standard TGE, ME, EGE, 0.5 EGE, and 96hEGE) are shown in Figure 1 (intracellular GFP), Figure 2 (secretedGFP), and Figure 3 (Gag-GFP VLP). Cell culture growth behavior, asassessed by cellular density and cell culture viability at differenttimes post transfection, are shown in Figures 1A, 2A, and 3A,respectively, whereas Figures 1B, 2B, and 3B show the percentage ofGFP positive cells in cell cultures and Figures 1C, 2C, and 3C showfluorescence levels over time for the three products, respectively.
Extended Gene Expression for Intracellular GFP
As expected, GFP expression using the standard TGE approach islimited to a period of 96 hpt. During this time, cell culture viabilitywas maintained high (>80%). However, a pronounced decrease incell density and viability was observed in the cultures beyond96 hpt, with only 5% of the culture remaining viable 144 hpt(Fig. 1A). In contrast, both the ME control and all three EGEapproaches allowed for maintenance of cell density around 6� 106
cells/mL with viabilities over 50% for an extended time span of240 hpt. These results are clearly due to the medium exchangeperformed every 48 h in all cases.
Significant differences between the various transfection protocolswere observed for transfection efficiency (Fig. 1B) and proteinproduction levels (Fig. 1C). In contrast with the traditional TGEapproach in which the cell culture was unviable at 144 hpt, ME andall EGE approaches allowed for sustained and maximum levels ofGFP positive cells and lysate fluorescence intensity at all timestested after 144 hpt, showing that production time can besuccessfully extended for a minimum of 240 hpt. Of note, themaximum percentage of GFP positive cells was clearly observedusing the EGE and 0.5 EGE transfection approaches, whichperformed comparably (Fig. 1B). More importantly, this resultcorrelated with GFP expression levels (Fig. 1C) further confirmingthat the percentage of GFP positive producer cells correlate withexpression levels as shown previously (Cervera et al., 2013).Production performance for the ME and 96 h EGE procedures wassimilar indicating that addition of DNA needs to be performedfrequently enough (every 48 h as opposed to 96 h) in order to keepplasmid DNA copy number and high expression levels.
The maximum percentage of transfected cells for the classicalTGE approach reached 32% at 96 hpt with a maximum fluorescencelevel of 57 R.F.U. By using the proposed EGE production strategy,not only production time was extended beyond 96 hpt, but also thelevels of protein expression reached were far superior with amaximum of 344 R.F.U. at 192 hpt (six-fold higher, Table I)correlating with a higher percentage of GFP positive cells (over50%) at all times during the production process. Comparatively, theME approach resulted in a lower percentage of GFP positive cells
(maximum of 38% at 96 hpt) and a lower protein expression level(maximum 127 R.F.U., 144 hpt). This result was expected as the MEprocess is only benefited by medium but not DNA re-feeding.Moreover, it clearly indicates that addition of nutrients and removalof by-products as would take place in a perfusion cell cultureprocess, is not the only factor responsible for the high proteinproduction levels achieved by EGE. This initial set of experimentsconfirmed the potential of the EGE proposed strategy as it wasefficient not only for maintaining cell growth and viability, but alsomaintaining cells transfected throughout the process, andconsequently, expressing GFP with a concomitant increase inprotein production yields.
Extended Gene Expression of Secreted GFP
The benefits of using the EGE strategy for the production ofsecreted GFP were subsequently evaluated. A general observationfor this second study was that cells consistently achieved highercell densities and viabilities for all conditions tested whencompared to the cultures expressing intracellular GFP protein.This may be related with a lower toxicity or metabolic burdenassociated with the expression of secreted as opposed tointracellular GFP (Fig. 2A). For the standard TGE condition, cellconcentration and viability was maximum at 96 hpt and sharplydecreased thereafter. In contrast, cell density and viability washigher for all the other conditions tested allowing for extension ofthe process up to 240 hpt. These results are similar to thoseobserved for intracellular GFP.
Significant differences were also observed in the percentage ofcells transfected over time (Fig. 2B) and GFP expression kinetics(Fig. 2C) depending on the transfection protocol followed. Of note,as the GFP protein studied in this set of experiments was secreted tothe cell culture supernatant, we harvested GFP at each mediumexchange and results were based on calculated accumulated proteinproduction (Fig. 2C). As observed previously, standard TGE showeda limited time span of 144 hpt compared to the rest of thetransfection strategies involving periodic medium exchanges,which extended the process to 240 hpt. The EGE protocol clearlyshowed to be superior to any other protocol tested including the 0.5EGE and 96 h EGE. The latter resulted in comparable percentage oftransfected cells throughout production and accumulated proteinlevels as the negative control protocol (ME) implying that aminimum amount of DNA (besides a minimum time between DNAadditions as observed before) is required to keep high plasmid copynumber and attain sustained high level gene expression. The highercell growth rate observed in cultures expressing secretable GFP asopposed to the intracellular GFP version may be related to the needfor higher amounts of DNA addition.
The accumulated fluorescence obtained using the conventionalTGE approach was 2707 R.F.U. at 144 hpt. Whereas using ME, 0.5EGE, and 96 h EGE the accumulated fluorescence obtained wasaround 7000 R.F.U. (6694, 7697, and 7082 R.F.U., respectively) at theend of the production phase. The best performance was obtainedwith the EGE protocol, in which 11676 R.F.U. can be obtained at240 h after the first transfection. The improvement obtained byusing the extended gene expression when compared to the standardgene expression protocol is 4.3 fold (Table I).
4 Biotechnology and Bioengineering, Vol. 9999, No. xxx, 2014

Figure 1. Performance of the different production protocols for intracellular GFP. Five different production protocols were evaluated in parallel including a standard TGE, acontrol medium exchange every 48 h (ME), retransfections with 1mg/mL of DNA every 48 h (EGE), retransfections with 0.5mg/mL of DNA every 48 h (0.5 EGE) and retransfections with1mg/mL if DNA every 96h (96 h EGE). HEK 293 cell density and viability (A), transfection efficiency (B), and fluorescence intensity in harvested cell suspension lysates (C) weremeasured every 48 h during 10 days. Mean values� standard deviation of triplicate experiments are represented.
Cervera et al.: Extended Gene Expression 5Biotechnology and Bioengineering

Figure 2. Performance of the different production protocols for secretable GFP. Five different production protocols were evaluated in parallel including a standard TGE, acontrol medium exchange every 48 h (ME), retransfections with 1mg/mL of DNA every 48 h (EGE), retransfections with 0.5mg/mL of DNA every 48 h (0.5 EGE) and retransfections with1mg/mL if DNA every 96 h (96h EGE). HEK 293 cell density and viability (A), transfection efficiency (B), and accumulated fluorescence intensity in harvested supernatants (C) weremeasured every 48 h during 10 days. Mean values� standard deviation of triplicate experiments are represented.
6 Biotechnology and Bioengineering, Vol. 9999, No. xxx, 2014

Figure 3. Performance of the different production protocols for Gag-GFP VLPs. Five different production protocols were evaluated in parallel including a standard TGE, acontrol medium exchange every 48 h (ME), retransfections with 1mg/mL of DNA every 48 h (EGE), retransfections with 0.5mg/mL of DNA every 48 h (0.5 EGE), and retransfectionswith 1mg/mL if DNA every 96 h (96h EGE). HEK 293 cell density and viability (A), transfection efficiency (B), and accumulated VLPs in harvested supernatants (C) were measuredevery 48 h during 10 days. Mean values� standard deviation of triplicate experiments are represented.
Cervera et al.: Extended Gene Expression 7Biotechnology and Bioengineering

Extended Gene Expression of HIV-1 Gag-GFP Virus-likeParticles
Finally, the EGE approach was tested for the production of anenveloped virus-like-particle (Gag-GFP VLPs) representing acomplex product candidate. Interestingly, cell culture viability forall conditions tested in the case of Gag-GFP VLP (Fig. 3A) was lowerthan for the intracellular and secretable GFP proteins. The reasonfor this effect is unclear but may be related to cytotoxic effects ofGag gene expression and/or the budding process. Using theconventional TGE approach, cell density and viability reached amaximum at 48 hpt and then suffered a sharp decrease forcing Gag-GFP VLP harvest at an earlier time point (48–72 hpt) comparedwith the other products evaluated in order to avoid massivesupernatant contamination with intracellular components and celldebris. Cell concentration and viability profiles for all otherprotocols tested, showed to be comparable. The cell density roughlydoubled that observed for TGE reaching approximately 4� 106 cells96 hpt and was maintained high until the end of the productionphase. In addition, as opposed to the TGE approach in which the cellculture was unviable at 144 hpt, cell viability was maintained for alonger period up to 240 hpt with viabilities over 50%. This is inagreement with the medium exchange benefits observed with theother two products evaluated (intracellular and secreted GFP).
The percentage of transfected cells (Fig. 3B) is maintained high(above 50%) until the end of the process (240 hpt) for all protocolstested with the exception of ME, for which there is no retransfectionand therefore the percentage of transfected cells decreases withtime, as expected. It has to be highlighted that the performance ofEGE and 0.5 EGE protocols in terms of transfection efficiency is verysimilar.
The accumulated production of VLPs with all the EGE protocolsis remarkably higher than that of standard TGE (Fig. 3C). The bestproduction performance is achieved by EGE and 0.5 EGE, with nostatistically significant difference between these two protocols. Inboth cases, the accumulated VLP production is in the order of1� 1012, a marked improvement with respect to the data obtainedusing the conventional TGE approach for Gag VLP production thatresulted in 8.7� 1010 VLPs representing a 12-fold increase inproduction.
As in the 0.5 EGE approach, the amount of DNA added duringretransfections is half of the DNA added for the EGE, this is theprotocol proposed for the production of VLPs. The generation ofGag-GFP VLPs by EGE was further investigated in this work with thescope of further optimizing the production protocol by gainingadditional understanding on the retransfection steps.
Dynamics of Cell Culture Retransfection
To elucidate the dynamics of cell culture retransfection, anexperiment consisting of two sequential transfection rounds usingplasmids coding for two different fluorescent proteins wasperformed. The first transfection was performed with Cherryprotein coding plasmid DNA at 0 h, and the second was performedwith GFP protein coding plasmid DNA at 48 h. Flow cytometryanalysis of the cell culture was conducted 96 h after the first roundof transfection. Results indicated that the majority of cells (76.9%)expressed only the product coded by the plasmid transfected in thefirst round (Cherry), while 16.8% of the cells expressed only theplasmid transfected in the second round (GFP). Only a smallfraction of the cells expressed both plasmids (6.3%). Thisexperiment confirmed that the vast majority of the cells initiallytransfected with the first plasmid (Cherry) maintained the
Table I. Comparison of production level attained by applying different transfection protocols relative to standard TGE production levels for variousrecombinant products.
Fold production level increase relative to levels obtained by Standard TGE (best EGE strategy in Bold)
ME EGE 0.5 EGE 96h EGE Additional gain from retransfection with respect to ME
Intracellular GFP 2.2 6 4.7 2.7 2.7Secreted GFP 2.5 4.3 2.8 2.6 1.7Gag-GFP VLPs 8.1 12 12 9.7 1.5
Figure 4. Analysis of the dynamics of retransfection by sequential introduction ofplasmids coding for two different fluorescent proteins. Exponentially growing HEK 293cells at 2� 106 cells/mL resuspended in fresh cell culture medium were transfectedwith 1mg of pCherry DNA/mL of culture in a first round and 0.5mg of pGFP DNA /mL ofculture in a second round that took place 48 h after the initial transfection. Confocalimage showing green fluorescent cells (expressing GFP), red fluorescent cells(expressing Cherry), and cells overlaying green and red fluorescence signal(expressing both GFP and Cherry).
8 Biotechnology and Bioengineering, Vol. 9999, No. xxx, 2014

expression of the transgene. In addition, the experiment indicatedthat primarily non-transfected cells were taking up the secondplasmid (GFP) as only a fraction of cells already transfected with thefirst plasmid showed double positivity. Therefore, retransfectionsseem to preferentially affect non-transfected cells, while those cellsthat are already transfected seem more refractory to be transfecteda second time.
These results were verified by microscopic observation of the cellculture 96 hpt using confocal microscopy. Figure 4 shows a largepopulation of Cherry positive cells, an intermediate population ofGFP positive cells, and a small population of double positive(yellow) cells expressing both Cherry and GFP proteins (Fig. 4).These results support the utility of the EGE approach by confirmingit is possible to increase the number of producer cells by
implementing retransfection rounds targeting new populations ofcells that were not transfected in the first round.
Previous work demonstrated higher transfection efficiency incells undergoing G2/M phase rather G1, showing a closedependency between transfection and cell cycle phase (Brunneret al., 2000; Cervera et al., 2013). Brunner et al. also suggest thattransfection of cells shortly before the next cell division (close to Mphase) is facilitated by nuclear membrane breakdown. Wehypothesize that the capacity of transfecting a new subpopulationof cells that were not transfected in the first round can be due to achange in the cell cycle phase or another cellular parameter thatchanges with time after the first transfection.
It is widely accepted that plasmid DNA copies are lost upon celldivision following transient transfection (Middleton and Sugden,
Figure 5. Evaluation of the effect of plasmid DNA addition in different EGE transfection rounds on transfection efficiency and protein production. Exponentially growing HEK 293cells at 2� 106 cells/mL resuspended in fresh cell culture medium were transfected with 1mg of DNA /mL of culture in a first round and 0.5mg of DNA /mL of culture in subsequentrounds of transfection every 48 h using the pGFP or the pCherry when indicated. The bar plots show the percentage of GFP positive cells (A) and green fluorescence intensity in cellculture lysates (B) attained at different times post-transfection. Mean values� standard deviation of three experiments are presented.
Cervera et al.: Extended Gene Expression 9Biotechnology and Bioengineering

1994; Wade-Martins et al., 1999). In fact, several authors make useof genetically modified cells containing viral elements that allowplasmid episomal persistance to improve production of biotechno-logical products by transient transfection (i.e., HEK 293 T and HEK293 EBNA cell lines). An advantage of the proposed approach overthe use of HEK 293 T or HEK 293 EBNA cell lines for production isthat the need for demonstrating clearance of undesired genomicsequences (i.e., SV40 large T antigen) from the final product iscircumvented. The retransfection of cells that may have lost theplasmid DNA during cell division is proposed here as a potentialadditional mechanism by which the EGE approach is achievinghigher gene expression levels over time besides the transfection ofcell populations originally not transfected.
Evaluation of the Effect of Plasmid DNA Addition inDifferent Rounds of Transfection on TransfectionEfficiency and Protein Production
To complete the evaluation of the EGE protocol, the effect of each one ofthe multiple transfection rounds was analyzed, with respect to theircontribution to the percentage of transfected cells and overallproduction. The objective of this experiment was to determine if anyround of retransfection was not significantly contributing to the overallproductivity and therefore could be eliminated with the consequentsimplification of the protocol. To this end, the 0.5 EGE protocol wasfollowed in five experiments. In each of these experiments, a given stepof retransfection, normally performed using the GFP coding plasmid,was substituted by addition of the Cherry coding plasmid. Using thisapproach, analysis of the percentage of GFP positive cells and GFPexpression levels in each one of these experiments could be comparedto those obtained in a control experiment performed using the pGFPfor all rounds of retransfection.
Figure 5A shows how the percentage of GFP positive cells isaffected by the omission of pGFP DNA addition at different rounds
in the EGE protocol. When comparing the percentage of transfectedGFP positive cells at any given point, for example at 240 hpt, it canbe observed that when all transfections are performed using thepGFP (complete 0.5 EGE), the percentage of transfected cells ismaximum at 32%. When the first transfection was performed usingthe pCherry instead of pGFP (but all the following with pGFP) thepercentage of transfected cells drops by 59%, further emphasizingthat the first round of transfection is key to achieve a highpercentage of transfected cells that is sustained throughout theprocess. When the second and the third retransfections wereperformed using pCherry instead of pGFP, the percentage oftransfected cells decreased by 31%, which indicated that, the secondand the third retransfection rounds also contribute to increasing thepopulation of transfected cells. When the pGFP of the fourth and thefifth retransfections were substituted with pCherry, the percentageof GFP positive cells was equivalent to that of the complete 0.5 EGE,thus suggesting that the fourth and fifth retransfections did notsignificantly impact the percent of GFP positive cells.
As expected, results for the GFP production levels (Fig. 5B) parallelthat of percent GFP positive cells (Fig. 5A). When the first transfectionis not performed with the pGFP, GFP expression levels were very low(29 R.F.U.). When the second and the third retransfections wereperformed with pCherry instead of pGFP, only 110 and 115 R.F.U.were attained at 144 hpt. When the pGFP of the fourth and the fifthretransfections were substituted with the pCherry, the GFPproduction levels were nearly unchanged. These results furtherascertain that the last two retransfections do not add any substantialimprovement to the process and thus could be eliminated with nodetrimental effect on production in the final optimized protocol.
Validation of the Optimized EGE Protocol
In order to validate the previous results, production of VLPs wascarried out using the complete 0.5 EGE strategy and the 0.5 EGE
Figure 6. Validation of the optimized 0.5 EGE production protocol for VLPs. To validate the performance of the proposed optimized EGE protocol, the normal EGE, and optimizedEGE protocols lacking the last two retransfections were run in parallel. Mean values of accumulated VLPs� standard deviation of triplicate experiments are represented. A P-valueof 0.33 confirms that there is no statistically significant difference between them.
10 Biotechnology and Bioengineering, Vol. 9999, No. xxx, 2014

excluding the last two rounds of retransfection. As it can beobserved in Figure 6, production performance in both cases is verysimilar with total accumulated number of 1� 1012 and 9.2� 1011
VLPs, respectively. The calculated P-value of 0.33 indicates thatthere is no statistically significant difference between both results.
Table II summarizes the results obtained using the standard TGEVLP production approach and the proposed optimized EGE. It canbe concluded that the optimized EGE protocol offers clearadvantages in terms of total accumulated VLPs, final concentration,accumulated VLPs production, and volumetric productivitycompared to standard TGE. The concentration of VLPs obtainedwith every medium exchange is equal or higher than that obtainedby standard transient transfection (Fig. 7). This is relevant forsubsequent downstream processing operations as no additionalpredict concentration steps would be required using the optimizedapproach. During the time in which one EGE is performed onlythree TGE can be performed considering a two-day stop forcleaning, sterilization, and cell amplification are required. If onewere to use the standard TGE approach to attain the same amount ofVLPs generated by the proposed EGE approach, it would requirethree-fold the time (30 instead of 10 days), two-fold the media (10
instead of 5 volumes) and five-fold the amount of plasmid DNA(200 instead of 40mg). These parameters have a significantinfluence in the process cost and highlight the relevance of theremarkable improvements associated to the EGE approachpresented here.
The results obtained in the proposed methodology are inagreement with previously reported literature. For instance, anincrease in transfection efficiency was observed in adherent CMTcells (a derivative of COS cell line) when cells were transfected twotimes (Ishikawa and Homcy, 1992). Also, in attempt to increasetransfection efficiency, HEK 293 T adherent cells were transfectedup to five times every 6 h (Yamamoto et al., 1999). Best results wereachieved by transfecting adherent cell cultures three times, leadingto an increase in transfection efficiency from 40 to 74%. Thepositive effect of medium supplementation on transient trans-fection is well documented. Improvements in protein productionmade by fed-batch or perfusion after transient transfection havebeen reported. Perfusion was successfully used to increase titers ofadherent H6–18 cells (derived from HEK 293 T) immobilized inmicrocarriers to produce Drosophila cytokine Spätzle (Cheeks et al.,2009) and for producing lentiviral particles using a suspensionadapted HEK 293 and an acoustic filter to retain cells in thebioreactor (Ansorge et al., 2009). Productivity has been alsoenhanced by medium feeding post-transfection of HEK 293 EBNAfor the production of GFP and secreted alkaline phosphatase(SEAP) (Pham et al., 2005) or GFP and erythropoietin (EPO) (Sunet al., 2006).
ConclusionIn this work, we present a transient transfection methodology thatallows extended gene expression at higher levels for a variety of
Figure 7. Comparison between the standard TGE and optimized EGE production strategies. A plot comparing VLP titers achieved by TGE and EGE is presented. Theconcentration of VLPs reached throughout the production phase using the EGE protocol is equivalent or higher than that reached using the TGE protocol. Two TGE runs can becarried out during the time an EGE run is performed.
Table II. Comparison of standard TGE and optimized EGE transfectionprocess performance
Accumulated VLPs Standard TGE 8.7E10Optimized EGE 9.2E11
VLP concentration (VLPs/mL) Standard TGE 4.3E09Optimized EGE 9.2E09
Accumulated production (VLPs/h) Standard TGE 1.8E09Optimized EGE 3.8E09
Volumetric productivity(VLPs/h*Vreactor)
Standard TGE 9.0E07Optimized EGE 1.9E08
Cervera et al.: Extended Gene Expression 11Biotechnology and Bioengineering

bioproducts. Depending on the protein produced, the improvementmade by the EGE protocol is mainly due to medium exchange or byrepeated transfection of the cell culture (Table I). An optimized EGEprotocol for generation of Gag-GFP VLP has shown to extend theproduction phase from 48 to 240 h resulting in a 12-fold increase inthe amount of VLPs generated compared to the classical TGEproduction approach (Table I). This EGE manufacturing approachhas also shown to extend the time of secreted (144–240 h) andintracellular (96–192 h) GFP expression that resulted in a four tosix-fold increase in the recombinant protein production levelscompared to the classical TGE approach. To conclude, the developedextended gene expression protocol provides a novel means forimproving transient transfection process yields.
The authors wish to thank Dr. Amine Kamen (NRC, Montreal, Canada) forvaluable discussions and for providing the HEK 293 cell line used in this study.We would also like to thank Dr. Julià Blanco at IRSI Caixa (Badalona, Spain) forproviding the plasmid construct for Gag-GFP and for helpful comments. Thecontribution of Manuela Costa (Institut de Biotecnología i Biomedicina UAB)with FACS analyses is deeply appreciated. The support of Dr. SalvadorBartolomé (Departament de Bioquímica i de Biología Molecular UAB) influorometry analysis and Meritxell Vendrell (Servei de Microscòpia UAB) inconfocal microscopy is recognized. Gavin Whissell provided generous help inthe revision of the manuscript. This work is supported by a grant of SEIDI -Ministerio de Economía y Competitividad of Spain (BIO2012-31251) andGeneralitat de Catalunya (2009 SGR 1038). Laura Cervera is a recipient of a PIFscholarship from UAB. Sònia Gutiérrez-Granados is a recipient of a FPU grantfrom the Ministerio de Educación y Deportes of Spain.
References
Agrawal V, Yu B, Pagila R, Yang B, Simonsen C, Beske O. 2013. A high-yielding, CHO-K1–based transient transfection system. BioProcess Int Int 11:28–35.
Ansorge S, Lanthier S, Transfiguracion J, Durocher Y, Henry O, Kamen A. 2009.Development of a scalable process for high-yield lentiviral vector production bytransient transfection of HEK293 suspension cultures. J Gene Med 11:868–876.
Ausubel LJ, Hall C, Sharma A, Shakeley R, Lopez P, Quezada V, Couture S, LadermanK, McMahon R, Huang P, Hsu D, Couture L. 2012. Production of CGMP-gradelentiviral vectors. Bioprocess Int 10:32–43. http://www.pubmedcentral.nih.gov/articlerender.fcgi?artid.
Backliwal G, Hildinger M, Chenuet S, Wulhfard S, De Jesus M, Wurm FM. 2008.Rational vector design and multi-pathway modulation of HEK 293E cells yieldrecombinant antibody titers exceeding 1g/l by transient transfection underserum-free conditions. Nucleic Acids Res 36(15):e96.
Baldi L, Hacker DL, Adam M, Wurm FM. 2007. Recombinant protein production bylarge-scale transient gene expression in mammalian cells: State of the art andfuture perspectives. Biotechnol Lett 29:677–684.
Baldi L, Muller N, Picasso S, Jacquet R, Girard P, Huy PT, Derow E, Wurm FM. 2005.Transient gene expression in suspension HEK-293 cells: Application to large-scale protein production. Biotechnol Prog 21:148–153.
Berntzen G, Lunde E, Flobakk M, Andersen JT, Lauvrak V, Sandlie I. 2005. Prolongedand increased expression of soluble Fc receptors, IgG and a TCR-Ig fusionprotein by transiently transfected adherent 293E cells. J Immunol Methods298:93–104. http://www.ncbi.nlm.nih.gov/pubmed/15847800.
Berrow NS, Alderton D, Sainsbury S, Nettleship J, Assenberg R, Rahman N, Stuart DI,Owens RJ. 2007. A versatile ligation-independent cloning method suitable forhigh-throughput expression screening applications. Nucleic Acids Res 35:e45.http://nar.oxfordjournals.org/content/35/6/e45.short.
Briggs JAG, Simon MN, Gross I, Kräusslich H-G, Fuller SD, Vogt VM, Johnson MC.2004. The stoichiometry of Gag protein in HIV-1. Nat Struct Mol Biol 11:672–675. http://dx.doi.org/10.1038/nsmb785.
Brunner S, Sauer T, Carotta S, Cotten M, Saltik M, Wagner E. 2000. Cell cycledependence of gene transfer by lipoplex, polyplex and recombinant adenovirus.Gene Ther 7:401–407.
Cervera L, Gutiérrez-Granados S, Martínez M, Blanco J, Gòdia F, Segura MM. 2013.Generation of HIV-1 Gag VLPs by transient transfection of HEK 293 suspensioncell cultures using an optimized animal-derived component free medium. JBiotechnol 166:152–165.
Cheeks MC, Edwards AD, Arnot CJ, Slater NKH. 2009. Gene transfection of HEK cellson supermacroporous polyacrylamide monoliths: A comparison of transientand stable recombinant protein expression in perfusion culture. N Biotechnol26:289–299.
Chiou HC, Vasu S, Liu CY, Cisneros I, Jones MB, Zmuda JF. 2014. Scalable transientprotein expression. Methods Mol Biol 1104:35–55. http://www.ncbi.nlm.nih.gov/pubmed/24297408.
Cornetta K, Reeves L, Cross S. 2008. Production of retroviral vectors for clinical use.Methods Mol Biol 433:17–32.
Van Craenenbroeck K, Vanhoenacker P, Haegeman G. 2000. Episomal vectors forgene expression in mammalian cells. Eur J Biochem 267:5665–5678.
Derouazi M, Girard P, Van Tilborgh F, Iglesias K, Muller N, Bertschinger M, WurmFM. 2004. Serum-free large-scale transient transfection of CHO cells. BiotechnolBioeng 87:537–545.
Dietmair S, Hodson MP, Quek L-E, Timmins NE, Gray P, Nielsen LK. 2012. A multi-omics analysis of recombinant protein production in Hek293 cells. PLoS One 7:e43394. http://www.pubmedcentral.nih.gov/articlerender.fcgi?artid.
Doan LX, Li M, Chen C, Yao Q. 2005. Virus-like particles as HIV-1 vaccines. Rev MedVirol 15:75–88. http://www.ncbi.nlm.nih.gov/pubmed/15484204.
Durocher Y, Butler M. 2009. Expression systems for therapeutic glycoproteinproduction. Curr Opin Biotechnol 20:700–707.
Durocher Y, Perret S, Kamen A. 2002. High-level and high-throughput recombinantprotein production by transient transfection of suspension-growing human293-EBNA1 cells. Nucleic Acids Res 30:E9. http://www.pubmedcentral.nih.gov/articlerender.fcgi?artid.
Fischer S, Charara N, Gerber A, Wölfel J, Schiedner G, Voedisch B, Geisse S. 2012.Transient recombinant protein expression in a human amniocyte cell line: theCAP-T1 cell system. Biotechnol Bioeng 109:2250–2261. http://www.ncbi.nlm.nih.gov/pubmed/22488157.
Geisse S. 2009. Reflections on more than 10 years of TGE approaches. Protein ExprPurif 64:99–107. http://yadda.icm.edu.pl/yadda/element/bwmeta1.element.elsevier-2c624441–0114 -3ab5-b656-c15352038a09.
Geisse S, Fux C. 2009. Recombinant protein production by transient gene transferinto Mammalian cells. Methods Enzymol 463:223–238.
Gutiérrez-Granados S, Cervera L, Gòdia F, Carrillo J, Segura MM. 2013. Developmentand validation of a quantitation assay for fluorescently tagged HIV-1 virus-likeparticles. J Virol Methods 193:85–95.
Hermida-Matsumoto L, Resh MD. 2000. Localization of human immunodeficiencyvirus type 1 Gag and Env at the plasma membrane by confocal imaging. J Virol74:8670–8679.
Ishikawa Y, Homcy CJ. 1992. High efficiency gene transfer into mammalian cells by adouble transfection protocol. Nucleic Acids Res. 20:4367. http://www.pubmedcentral.nih.gov/articlerender.fcgi?artid.
Kunaparaju R, Liao M, Sunstrom N-A. 2005. Epi-CHO, an episomal expressionsystem for recombinant protein production in CHO cells. Biotechnol Bioeng91:670–677. http://www.ncbi.nlm.nih.gov/pubmed/15948170.
Meissner P, Pick H, Kulangara A, Chatellard P, Friedrich K, Wurm FM. 2001.Transient gene expression: Recombinant protein production with suspension-adapted HEK293-EBNA cells. Biotechnol Bioeng 75:197–203. http://www.ncbi.nlm.nih.gov/pubmed/11536142.
Merten O-W, Charrier S, Laroudie N, Fauchille S, Dugué C, Jenny C, Audit M, Zanta-Boussif M-A, Chautard H, Radrizzani M, Vallanti G, Naldini L, Noguiez-Hellin P,Galy A. 2011. Large-scale manufacture and characterization of a lentiviralvector produced for clinical ex vivo gene therapy application. Hum Gene Ther22:343–356.
Middleton T, Sugden B. 1994. Retention of plasmid DNA in mammalian cells isenhanced by binding of the Epstein-Barr virus replication protein EBNA1. JVirol 68:4067–4071.
Pham PL, Perret S, Cass B, Carpentier E, St.,-Laurent G, Bisson L, Kamen A,Durocher Y. 2005. Transient gene expression in HEK293 cells: Peptone additionposttransfection improves recombinant protein synthesis. Biotechnol Bioeng90:332–344.
Pham PL, Kamen A, Durocher Y. 2006. Large-scale transfection of mammalian cellsfor the fast production of recombinant protein. Mol Biotechnol 34:225–237.
12 Biotechnology and Bioengineering, Vol. 9999, No. xxx, 2014

Pluta K, Kacprzak MM. 2009. Use of HIV as a gene transfer vector. Acta Biochim Pol56:531–595.
Schwartz S, Campbell M, Nasioulas G, Harrison J, Felber BK, Pavlakis GN. 1992.Mutational inactivation of an inhibitory sequence in human immunodeficiencyvirus type 1 results in Rev-independent gag expression. J Virol 66:7176–7182.http://www.pubmedcentral.nih.gov/articlerender.fcgi?artid.
Segura MM, Garnier A, Durocher Y, Coelho H, Kamen A. 2007. Production oflentiviral vectors by large-scale transient transfection of suspension culturesand affinity chromatography purification. Biotechnol Bioeng 98:789–799.http://www.ncbi.nlm.nih.gov/pubmed/17461423.
Sun X, Goh PE, Wong KTK, Mori T, Yap MGS. 2006. Enhancement of transient geneexpression by fed-batch culture of HEK 293 EBNA1 cells in suspension.Biotechnol Lett 28:843–848.
Thomas P, Smart TG. 2005. HEK293 cell line: A vehicle for the expression ofrecombinant proteins. J Pharmacol Toxicol Methods 51:187–200. http://www.sciencedirect.com/science/article/pii/S1056871905000110.
Tuvesson O, Uhe C, Rozkov A, Lüllau E. 2008. Development of a generic transienttransfection process at 100L scale. Cytotechnology 56:123–136.
Valley-Omar Z, Meyers AE, Shephard EG, Williamson A-L, Rybicki EP. 2011.Abrogation of contaminating RNA activity in HIV-1 Gag VLPs. Virol J 8:462.http://www.virologyj.com/content/8/1/462.
Wade-Martins R, Frampton J, James MR. 1999. Long-term stability of large insertgenomic DNA episomal shuttle vectors in human cells. Nucleic Acids Res27:1674–1682.
Wright JF. 2009. Transient transfection methods for clinical adeno-associated viralvector production. Hum Gene Ther 20:698–706.
Wurm FM. 2004. Production of recombinant protein therapeutics in cultivatedmammalian cells. Nat Biotechnol 22:1393–1398.
Yamamoto M, Okumura S, Schwencke C, Sadoshima J, Ishikawa Y. 1999. High efficiencygene transfer by multiple transfection protocol. Histochem J 31:241–243.
Young JM, Cheadle C, Foulke JS, Drohan WN, Sarver N. 1988. Utilization of anEpstein-Barr virus replicon as a eukaryotic expression vector. Gene 62:171–185.
Cervera et al.: Extended Gene Expression 13Biotechnology and Bioengineering


General discussion and further directions


HIV-1 Gag VLPs represent an attractive platform for the generation of new generation
vaccine candidates. Virus-like particles are self-assembled particles that mimic the virus
structure. Due to their repetitive organized structure and particulate nature, they are very
efficiently uptaken by antigen-presenting cells giving rise to a potent immune response.
The use of VLPs for vaccination confers an ideal candidate, as they are very safe both
for the vaccinated individual and for the manufacturers, due to the lack virus genome
making them non-infective virus particles.
The production of HIV-1 Gag VLPs was previously reported using the baculovirus-
insect cell expression system. The use of insect cell production platform has been
widely used, even though it has some drawbacks when compared to the cell line used in
this work, HEK 293-3F6 GMP compliant cell line. Since HIV-1 Gag VLPs are
enveloped VLPs, they take part of the cell membrane during the budding process from
the host cell. Consequently, when they are produced using insect cells, they incorporate
insect or baculovirus-derived proteins, such as the gp64, in the lipid envelope, which is
known to provoke a strong immune response that can potentially mask the response
against the desired envelope antigen (Deml et al., 2005; Hammonds et al., 2007). In
addition, removal of contaminating baculovirus particles during downstream processing
is challenging as these viruses share similar physicochemical properties with VLPs
(Deml et al., 2005; Hammonds et al., 2007). Moreover, the post-translational and
proteolytic capabilities of insect cells are not identical to those of mammalian cells,
which results in VLP structures that do not accurately mimic authentic HIV-1 particles
(Deml et al., 2005; Hammonds et al., 2007).
The use of animal derived component free and chemically defined media is essential for
rapid translation from the small-scale laboratory work to large-scale industry
manufacture and also for human vaccine approval. For this reason, all the serum-free

and chemically defined media existing in the market at the time of performing this work
for HEK 293 suspension cells, were tested to screen for better cell culture growth and
productivity. The selected medium (Freestyle 293, Invitrogen, Carlsbad, CA) allows
both cell growth and PEI-mediated transient transfection. The medium was further
optimized using non-animal derived components as supplements, and cell growth was
increased by 2.4 fold. As the best moment to transfect the culture is before the mid-log
phase, the increase in maximum cell density attained by medium optimization led to a
proportional increase in HIV-1 Gag VLPs production. The production was further
optimized by complete medium exchange just before transfection. This medium
exchange allows the supply of nutrients that might be exhausted in the conditioned
medium (Backliwal et al., 2008b) and the removal of by-products in the conditioned
medium that could interfere with the PEI mediated transfection (Durocher et al., 2002;
Schlaeger and Christensen, 1999; Tom et al., 2008). This optimal transfection protocol
lead to a final concentration of 2.7 × 10⁹ VLPs/mL.
No significant improvement in transfection efficiency or VLP production was observed
by increasing the amount of DNA/PEI used for transfection indicating that DNA/PEI
complex concentrations of 0.3–0.5 μg of DNA/million cells are sufficient to efficiently
transfect HEK 293 cells.
A further attempt to understand the loss in transfection efficiency observed at high cell
densities was carried out. In agreement with reported results (Brunner et al., 2000;
Carpentier et al., 2007) it was observed that cells grown beyond the mid-log point had a
lower percentage of cells in G2/M phase. However, this did not seem to be the only
factor controlling transfection efficiency, and the understanding of this situation would

require further investigation.
The kinetics of the transient transfection process has been studied with the aim to
characterize the different intracellular steps and determine important time points that
can guide process optimization conditions. In this direction it has been demonstrated
that one hour of contact between PEI/DNA polyplexes and cells is enough to ensure
efficient transient transfection. The time at which the protein starts to be produced has
been determined to be between 4 and 10 hpt. This is very valuable information to
determine the most appropriate moment to add additives to enhance protein production.
The optimal harvest time after transfection in batch mode of operation has been
determined as 72 hours post transfection, as it gives maximum production and the
culture still has high viability. In general, it is considered a desirable trend in the
process that viability is high at the harvest, since this will certainly favor to have a final
product with higher purity to start the corresponding downstream processing. It has
also been observed that between 48 and 72 hpt, the number of cells that do not have any
interaction with polyplexes increases, what could be read as a sign of plasmid loss
during cell division.
On the other hand it was observed a 20% of increase in the percentage of cells
expressing Gag-GFP between 24 and 48 hours post transfection. We demonstrated by
adding VLP containing medium to an untransfected culture that this increase was not
related to entrance of already produced VLPs inside non-transfected cells. This increase
in the percentage of transfected cells could be related to that between this two time
points, when the cells pass the G2/M phase of the cell cycle, they have the chance to
incorporate complexes through mitosis. For this reason further investigation on the

relation of cell cycle phase and transfection efficiency could lead to better and more
reproducible transfections.
Three alternatives are proposed in this work on the use of supplements to enhance VLP
production. Positive results have been obtained in all case, with relative differences in
terms of the level of production improvement and final viability of the culture. The
observed differences in final viability among the different protocols could have a
significant impact on the corresponding downstream process for the final purification of
the VLPs, since a lower viability would imply a higher amount of cellular debris and the
release of intracellular components making more difficult and expensive the purification
of the final VLP preparation. Additionally, considering that enveloped VLPs are
exported out from the cell through a budding process, a decrease in culture viability can
lead to a decrease of properly assembled and enveloped VLPs. For this reasons, among
the three best combinations obtained, it is considered that the optimum concentrations
of enhancers are 20 mM of LiAc, 3.36 mM of VPA and 5.04 mM Caffeine, since they
imply a significant improvement of the final VLP production (3.8 fold when compared
with the negative control) while maintaining cell culture viability as high as 94%.
Design of experiments (DoE) has been used systematically as a valuable tool for
medium supplementation and transfection/production enhancers optimization. This tool
enables to obtain statistically relevant information from experimental designs with a
minimum number of experiments. It also allows identifying interactive effects of many
factors that could affect the response. The traditional one-factor-at-a-time approach for
optimization is time-consuming and assumes that the different variables studied do not
interact, which could induce to error when defining optima. In the results presented in
this work, it has been very useful to first screen the variables with significant and
positive effect using the Plackett-Burman design and optimize the concentration using
the Box-Behnken design.
As transient transfection is based on episomal DNA expression it has a limited time
span, normally of 96 hours. With the aim to prolong the production period while
mainaining high gene expression, a novel process strategy named extended gene
expression (EGE) has been developed by the combination of medium exchange and
repeated transfection of cell cultures with plasmid DNA to improve overall protein
production. Taking as starting point the observation that between 24 and 48 hours post
transfection appears a population of cells that has not interaction with DNA/PEI
polyplexes, and that after this point no further increase in transfection efficiency is
observed and the viability starts to slightly decrease, the first attempt for EGE was
medium exchange and retransfections performed every 48 hours post transfection. In
order to avoid possible toxicity from PEI/DNA polyplexes, one attempt with half of the
DNA at each retransfection and another one retransfectiong only every 96 hours were
also tried to find the best approach to achieve sustained high-level gene expression. The
benefits of EGE were demosntrated for the production of three recombinant proteins,
intracellular GFP, secreted GFP and Gag-GFP VLPs. Best results for VLP production
were found with medium exchange every 48 hours and retransfection with half of the
standard DNA concentration at 48 and 96 hours post transfection. For the production of
intracellular GFP and for secreted GFP, best results were obtained using all DNA at
each retransfection. In the case of secreted GFP, the results could be even improved as it
can be observed that transfecting every 48 hours with 1ug/mL is not enough to maintain
the percentage of transfected cells as the cell growth and viability is very high when this
protein is produced. Using this novel EGE strategy, the production period was

prolonged between 192 and 240 h with a 4–12-fold increase in production levels,
depending on the product type considered.
Taking into consideration the remarkable results obtained with the extended gene
expression approach at laboratory scale, it would be important to study the scale-up to
bioreactors as future work within this research. In this respect, the data obtained about
the time of contact required for complexes to transfect the cells is a very relevant
variable to consider. Using this data it can be determined that perfusion will need to be
stopped during one hour after each retransfection to allow its success. Better results in
extended gene expression using perfusion in bioreactors could be expected in
comparison to the results obtained by discontinuous medium exchange, as in the last
case medium had to be exchanged by centrifugation which can damage the cells, and
the physiological state of the cells is crucial for good transfection efficiencies. On the
other hand the perfusion rate will be a very important variable to optimize as one have
to take in account that conditioned medium can interfere with PEI mediated
transfection.
It could also be very interesting to analyze the combined benefits of extended gene
expression and the use of the optimal levels of production enhancers determined in this
work. As the viability of the culture after the addition of the optimal concentration of
additives is even higher than the viability of the culture with no additives, this is the
ideal combination to be used for extended gene expression, where keeping high viability
of the culture as long as possible is a crucial aspect.

In addition to quantity, VLP quality is even as relevant for the final application of
vaccine products, especially when intended for human applications. In those terms, one
interesting aspect to further study would be the possible RNA content in VLPs. As
published by (Rulli et al., 2007), assembly of retrovirus particles normally entails the
selective encapsidation of viral genomic RNA. In absence of packageable viral RNA,
assembly is still effective, as it takes cellular mRNAs. A second relevant aspect
regarding quality is potential contamination with cellular exosomes due to their
similarities (Sokolova et al., 2011). This is a key factor in VLP production using HEK
293, as exosomes elute at the same fraction when ultracentrifugation and size exclusion
chromatography is performed to purify VLPs. An efficient method to separate
exosomes from VLPs should be investigated to have better purified VLPs to increase
the percentage of VLPs in respect to total protein in order to have more reliable results
in pre-clinical studies.
In this work, a quantification method developed and validated within the research
group, based on fluorescence (Gutiérrez-Granados et al., 2013) has been used to
substitute the very expensive and time consuming standard method to quantify HIV-1
VLPs by ELISA. The only drawback of this method, that have in common with ELISA
determinations, is that it cannot differentiate between proper assembled and enveloped
VLPs and free Gag-GFP polyprotein. This highlights the importance of maintaining
high percentage of viability throughout production to minimize contamination with free
Gag-GFP species. For this reason it would be interesting to deeply study particle
quantification, as one of the techniques used to quantify and characterize the VLP
concentration, Nanoparticle tracking analysis gives high variability when measuring
virus-like particles, and further efforts in using new nanobiotechnology methodologies

would certainly provide new insights in this critical part for proper characterization of
VLPs as products
It would be also interesting to increase the basic understanding of the governing factors
of transient transfection variability, probably one of its main drawbacks. The
predominant cell cycle phase in the culture, appears to be a crucial factor to have a
successful transfection. As the cell cycle arrest did not gave good results using
Nocodazole, Thymidine could be used as alternative or also cell sorting could be tried to
separate the cells in the different phases, and analyze deeply the relationship between
cell cycle and transfection efficiency.
Finally, the use of antiapoptotic additives could help to increase cell viability in the
culture which could improve even further the results obtained in a single batch, but
more importantly the results obtained by extended gene expression strategiy. This could
be done engineering the cells by introducing anti-apoptotic members of the Bcl-2 family
(Bcl-2, Bcl-xL (Majors et al., 2008), Mcl-1 (Majors et al., 2009)) or alternatively
downregulating pro-apoptotic members of the same family (such as Bax, Bak)
(Macaraeg et al., 2013). Both approaches are focused on delaying mitocondrial
permeabilizaiton and activation of caspase dependant apoptosis. Co-transfecting the
cells with p18 and p21 (Backliwal et al., 2008a)., also has given good results improving
culture viability, length and production.

Backliwal G, Hildinger M, Chenuet S, Wulhfard S, De Jesus M, Wurm FM. 2008a. Rational vector design and multi-pathway modulation of HEK 293E cells yield recombinant antibody titers exceeding 1 g/l by transient transfection under serum-free conditions. Nucleic Acids Res. 36:e96. http://www.pubmedcentral.nih.gov/articlerender.fcgi?artid=2528171&tool=pmcentrez&rendertype=abstract.
Backliwal G, Hildinger M, Hasija V, Wurm FM. 2008b. High-density transfection with HEK-293 cells allows doubling of transient titers and removes need for a priori DNA complex formation with PEI. Biotechnol. Bioeng. 99:721–727.
Brunner S, Sauer T, Carotta S, Cotten M, Saltik M, Wagner E. 2000. Cell cycle dependence of gene transfer by lipoplex, polyplex and recombinant adenovirus. Gene Ther. 7:401–407.
Carpentier E, Paris S, Kamen AA, Durocher Y. 2007. Limiting factors governing protein expression following polyethylenimine-mediated gene transfer in HEK293-EBNA1 cells. J. Biotechnol. 128:268–280.
Deml L, Speth C, Dierich MP, Wolf H, Wagner R. 2005. Recombinant HIV-1 Pr55gag virus-like particles: potent stimulators of innate and acquired immune responses. Mol. Immunol. 42:259–277.
Durocher Y, Perret S, Kamen A. 2002. High-level and high-throughput recombinant protein production by transient transfection of suspension-growing human 293-EBNA1 cells. Nucleic Acids Res. 30:E9.
Gutiérrez-Granados S, Cervera L, Gòdia F, Carrillo J, Segura MM. 2013. Development and validation of a quantitation assay for fluorescently tagged HIV-1 virus-like particles. J. Virol. Methods 193:85–95.
Hammonds J, Chen X, Zhang X, Lee F, Spearman P. 2007. Advances in methods for the production, purification, and characterization of HIV-1 Gag-Env pseudovirion vaccines. Vaccine 25:8036–48. http://www.sciencedirect.com/science/article/pii/S0264410X07010389.
Macaraeg NF, Reilly DE, Wong AW. 2013. Use of an anti-apoptotic CHO cell line for transient gene expression. Biotechnol. Prog. 29:1050–8. http://www.ncbi.nlm.nih.gov/pubmed/23794499.
Majors BS, Betenbaugh MJ, Pederson NE, Chiang GG. 2008. Enhancement of transient gene expression and culture viability using Chinese hamster ovary cells overexpressing Bcl-x(L). Biotechnol. Bioeng. 101:567–78. http://www.ncbi.nlm.nih.gov/pubmed/18727128.
Majors BS, Betenbaugh MJ, Pederson NE, Chiang GG. 2009. Mcl-1 overexpression leads to higher viabilities and increased production of humanized monoclonal antibody in Chinese hamster ovary cells. Biotechnol. Prog. 25:1161–8. http://www.ncbi.nlm.nih.gov/pubmed/19551877.

Rulli SJ, Hibbert CS, Mirro J, Pederson T, Biswal S, Rein A. 2007. Selective and nonselective packaging of cellular RNAs in retrovirus particles. J. Virol. 81:6623–31. http://jvi.asm.org/content/81/12/6623.short.
Schlaeger EJ, Christensen K. 1999. Transient gene expression in mammalian cells grown in serum-free suspension culture. Cytotechnology 30:71–83. http://www.pubmedcentral.nih.gov/articlerender.fcgi?artid=3449952&tool=pmcentrez&rendertype=abstract.
Sokolova V, Ludwig A-K, Hornung S, Rotan O, Horn PA, Epple M, Giebel B. 2011. Characterisation of exosomes derived from human cells by nanoparticle tracking analysis and scanning electron microscopy. Colloids Surf. B. Biointerfaces 87:146–50. http://www.ncbi.nlm.nih.gov/pubmed/21640565.
Tom R, Bisson L, Durocher Y. 2008. Transfection of HEK293-EBNA1 Cells in Suspension with Linear PEI for Production of Recombinant Proteins. CSH Protoc. 2008:pdb.prot4977. http://cshprotocols.cshlp.org/content/2008/3/pdb.prot4977.full.

Conclusions


From the results obtained in this PhD thesis, the following conclusions can be
highlighted:
1. The production of HIV-1 Gag-GFP VLPs has been reported, for the first time, using
an industrially relevant suspension adapted mammalian cell line, such as the GMP-
compliant HEK 293 used in this work.
2. Culture medium was optimized using non-animal derived media supplemented with
recombinant compounds, which ensures safety and easies rapid transfer to potential
clinical studies. The optimal conditions obtained for cell growth were supplementation
with 0.9X Lipid mixture, 19.8 mg/L r-insulin and 1.6 mg/L r-transferrin leading to a
maximum cell concentration of 5.4 × 10⁶ cells/mL in batch mode, almost double of that
observed using the unsupplemented medium (2.9 × 10⁶ cells/mL).
3. A protocol for transient transfection was defined. Cells were transfected at mid-log
phase (2–3 × 10⁶ cells/mL) with medium exchange at the time of transfection using 1
μg/(mL of culture) of plasmid DNA and 2 μg/(mL of culture) of polyethylenimine.
Leading to a production of 2.7 × 10⁹ VLPs/mL.
3. The study performed using several techniques to characterize the process of
internalization of the DNA-PEI complexes into the cells and its further processing to
produce VLPs through the membrane budding process, has enable to identify that the
time required for the complexes to penetrate into the cells is 90 minutes post addition,
and after 10 hours post transfection GFP fluorescence is detected inside the cells.
Generalized budding of VLPs from the cells is not observed until 48 hours post

transfection and the optimal harvest time is determined as 72 hpt as VLP production is
highest while high viability of the culture is maintained.
4. Further improvement has been achieved by the use of transfection and production
enhancers as additional supplements to the culture medium at transfection. Using the
optimal concentrations of the tested additives (20 mM Lithium Acetate, 3.36 mM
Valproic Acid and 5.04 mM Caffeine) the production could be enhanced 3.8 fold with a
viability of 94%
5. A novel process approach named as extended gene expression has been developed
and proven for the production of three recombinant proteins of increasing difficulty,
intracellular GFP, secreted GFP and Gag-GFP VLPs. Using this novel EGE strategy,
the production period was prolonged between 192 and 240 h with a 4–12-fold increase
in production levels, depending on the product considered. This approach consists in
performing the standard transient transfection process as developed initially for a first
step, and after perform a complete medium exchange every 48 hours followed by re-
transfection of cell cultures using a concentration of 0.5 µg of plasmid DNA/mL of cell
culture at 48 hpt and 96 hpt.
6. Several further work lines of interest to pursue the work presented have been
identified, and will serve as a basis of future work within the research group. This
approaches are: characterization of the VLP quality, combination of EGE methodology
and production enhancers addition, and use of antiapoptotic genes to improve culture
viability.