Embed Size (px)
Citation preview

Strategic Environmental Assessment (SEA) for Industry Sector Himachal Pradesh, India
Draft Final Report
Disaster Risk Management & Climate Change Unit
South Asia Sustainable Development Department
The World Bank, Washington
December 2013 (version 23/12/13)
Draft report for internal use only. Do not cite.
Pub
lic D
iscl
osur
e A
utho
rized
Pub
lic D
iscl
osur
e A
utho
rized
Pub
lic D
iscl
osur
e A
utho
rized
Pub
lic D
iscl
osur
e A
utho
rized

Confidential Draft – Do Not Cite
HP Industry SEA Page ii December 2013 (Draft 23/12/13)
Copyright © 201# The International Bank for Reconstruction and Development/The World Bank 1818 H Street, N.W. Washington, D.C. 20433, U.S.A. All rights reserved
Manufactured in _____ First Printing: ____ 201# printed on recycled paper
[Standard text and additional disclaimers will come here along the following lines: World Bank Country Studies, Strategic Environmental Assessments, and similar diagnostic studies are among the many reports originally prepared for internal use as part of the continuing analysis by the Bank of the economic and related conditions of its developing member countries and to facilitate its dialogs with the governments. Some of the reports are published in this series with the least possible delay for the use of governments, and the academic, business, financial, and development communities. The manuscript of this paper therefore has not been prepared in accordance with the procedures appropriate to formally edited texts. Some sources cited in this paper may be informal documents that are not readily available. The findings, interpretations, and conclusions herein are those of the author(s) and do not necessarily reflect the views of the International Bank for Reconstruction and Development/The World Bank and its affiliated organizations, or those of the Executive Directors of The World Bank or the governments they represent. The World Bank does not guarantee the accuracy of the data included in this work. The boundaries, colors, denominations and other information shown on any map in this work do not imply any judgment on the part of The World Bank of the legal status of any territory, or the endorsement or acceptance of such boundaries. The material in this publication is copyrighted. Copying and/or transmitting portions or all of this work without permission may be a violation of applicable law. The International Bank for Reconstruction and Development/The World Bank encourages dissemination of its work and will normally grant permission promptly to reproduce portions of the work. For permission to photocopy or reprint any part of this work, please send a request with complete information to the Copyright Clearance Centre, Inc., {insert correct address and contacts} All other queries on rights and licenses, including subsidiary rights, should be addressed to the Office of the Publisher, The World Bank, 1818 H Street NW, Washington, DC 20433 USA {insert correct contacts}] LC Cataloging-‐in-‐Publication Data

Confidential Draft – Do Not Cite
HP Industry SEA Page iii December 2013 (Draft 23/12/13)
Acknowledgements The World Bank Task Team for this SEA work includes Muthukumara S. Mani (TTL), Camille Bann, Cynthia Cartier, Jack Ruitenbeek, and Vaideeswaran Sankaran.1 This work was undertaken over the
period April-‐December 2013, including extensive consultations and interactions with stakeholders in Himachal Pradesh, India. The SEA Team gratefully acknowledges the presence of all those participating in workshops and information sessions. Specifically, contributions from the following
are acknowledged, who provided leadership and guidance during those events and subsequent data gathering exercises: Mr Mohan Chauhan (Director, Department of Industry); Dr Rajinder Chauhan
(Sr. Industrial Advisor, Department of Industry); Dr SS Negi (Director, Environment, Department of Environment, Science and Technology – DEST); Mr Suresh Attri (DEST); Mr Vineet Kumar (IFS & Member-‐Secretary, HP State Pollution Control Board – SPCB, Shimla); Mr Sanjay Sood (IFS & Former
Member-‐Secretary, HP SPCB, Shimla); Mr Chetan Joshi (Senior Environmental Engineer, HP SPCB, Baddi); Mr Brij Bhushan (HP SPCB, Una); Mr Shandil SK (HP SPCB, Shimla); Mr Gopal Gautam (HP SPCB, Shimla); Mr Chetan Joshi (SPCB, Baddi); Mr Rajender Guleria (Chair, Baddi Barotiwala Nalagarh
Industrial Association – BBNIA); and, Pyush Dogra (Senior Environmental Specialist, World Bank, Delhi). The SEA Team is also appreciative of the assistance of the following in Baddi-‐Barotiwala-‐Nalagarh during the site visits: Mr Rajeshwar Goel (Additional CEO, Baddi Barotiwala Nalagarh
Development Authority – BBNDA); Mr Keshav Chandel (CEO, Baddi Infrastructure, BBNIA); and, Mr Ashok Kumar Sharma (CEO, Shivalik Solid Waste Management Ltd).
1 Contacts: Muthukumara S Mani ([email protected]); Camille Bann ([email protected]); Cynthia Cartier ([email protected]); Jack Ruitenbeek ([email protected]); Vaideeswaran Sankaran ([email protected]).

Confidential Draft – Do Not Cite
HP Industry SEA Page iv December 2013 (Draft 23/12/13)
Abbreviations AGiSAC Aryabhatta Geo-‐informatics & Space
Application Centre API Active Pharmaceutical Ingredients BBNDA Baddi Barotiwala Nalagarh Development
Authority BBNIA Baddi Barotiwala Nalagarh Industrial
Association BOD Biochemical Oxygen Demand CAC Command and Control CBA Cost Benefit Analysis CDM Clean Development Mechanism CEA Cost Effectiveness Analysis CEPI Comprehensive Environmental Pollution
Index CER Certified Emission Reduction CETP Common Effluent Treatment Plant CO2e carbon dioxide equivalent COD Chemical Oxygen Demand COPD Chronic Obstructive Pulmonary Disease CPCB Central Pollution Control Board CREP Corporate Responsibility for
Environmental Protection CTE Consent to Establish CTO Consent to Operate DALY Disability Adjusted Life Year DEST Department of Environment and Science
and Technology DOI Department of Industry DPL Development Policy Loan DPR Detailed Project Report EIA Environmental Impact Assessment EIRR economic internal rate of return EMP Environment Master Plan ESS Environment Surveillance Scheme FIRR financial internal rate of return GDP gross domestic product GHG greenhouse gas GoHP Government of Himachal Pradesh GOI Government of India HP Himachal Pradesh HSD High Speed Diesel IGG Inclusive Green Growth IPPS Industrial Pollution Projection System ISO International Organization for
Standardization KLPD kilo liter per day LADF Local Area Development Fund MBI Market Based Instrument
MINARS Monitoring of Indian National Aquatic Resources
MINAS Minimum National Standards MLD millions of liters a day MOEF Ministry of Environment and Forests MoUD Ministry of Urban Development MSME Micro, Small and Medium Enterprise MSW Municipal Solid Waste MT metric tonnes NAAQM National Air Quality Monitoring NGT National Green Tribunal NOx nitrous oxides NPV Net Present Value OECD Organisation for Economic Cooperation
and Development PES Payment for Ecosystem Services PIL Public Interest Litigation PM10 Particulate Matter ≤10 micrometers ppm parts per million RPM respirable particulate matter SCM supply chain management SEA Strategic Environmental Assessment SEAC State Expert Appraisal Committee SEIAA State Environmental Impact Assessment
Authority SIDBI Small Industries Development Bank of
India SME small or medium enterprise SOx sulphur oxides SPCB State Pollution Control Board SPM Suspended Particulate Matter SSI Small Scale Industry SWCM Single Window Clearance and Monitoring SWF Social Welfare Function SWM solid waste management TA Technical Assistance TDS Total Dissolved Solids TEV Total Economic Value TPD tonnes per day TSDF Treatment Storage and Disposal Facilities ULB Urban Local Body VOC volatile organic compound WAVES Wealth Accounting & Valuation of
Ecosystem Services WTAC Willingness to Accept Compensation WTP Willingness to Pay WWTP Wastewater Treatment Plant

Confidential Draft – Do Not Cite
HP Industry SEA Page v December 2013 (Draft 23/12/13)
Table of Contents Acknowledgements ............................................................................................................................................... iii Abbreviations ......................................................................................................................................................... iv Table of Contents .................................................................................................................................................... v
EXECUTIVE SUMMARY ..................................................................................................... vii §1 Introduction .................................................................................................................................................. 1
Part I FOUNDATIONS ....................................................................................................... 8 §2 Institutional Review ...................................................................................................................................... 9 §3 Pollution Hotspots & Priority Polluting Industries ...................................................................................... 18 §4 Health & Environmental Impacts of Industrial Pollution in Himachal Pradesh ........................................... 28 §5 Economic Instruments for Environmental Management in Himachal Pradesh .......................................... 32
Part II DIAGNOSTICS ....................................................................................................... 38 §6 MSME Scheme – Mid-‐Study Recommendation Report .............................................................................. 39 §7 Background to the Case Studies ................................................................................................................. 51 §8 Case Study 1 – Pharmaceuticals .................................................................................................................. 61 §9 Case Study 2 – Stone Crushing .................................................................................................................... 65 §10 Case Study 3 – Food Processing ................................................................................................................ 74 §11 Cost Effectiveness ..................................................................................................................................... 77
PART III WAY FORWARD ............................................................................................... 84 §12 Summary of Recommendations ................................................................................................................ 85
ANNEXES ......................................................................................................................... 89 Annex A References ......................................................................................................................................... 90 Annex B Key Meetings & Participants .............................................................................................................. 94 Annex C Supplementary Data – Industries & Criteria Pollutants ..................................................................... 95 Annex D Supplementary Valuation Sources & Information ........................................................................... 101 Annex E Economic Instruments Framework .................................................................................................. 105 Annex F Supplementary Data – Miscellaneous & Case Studies ..................................................................... 111 Annex G Cost Effectiveness Templates .......................................................................................................... 131 Annex H Maps (placeholder) ......................................................................................................................... 135 Internal Confidential Notes (remove before publication) ................................................................................. 143

Confidential Draft – Do Not Cite
HP Industry SEA Page vi December 2013 (Draft 23/12/13)
Map ES.1. Himachal Pradesh, India is a mountainous state in Northern India with an area of 55,673 km² and a population of 6,856,509 (2011 census). Main industrial corridors are developing along the border with Punjab and Haryana, where most of the urban population lives. The Districts of Solan, Sirmour and Kangra are of particular high priority due to current industrial concentrations, future growth prospects, and identified pollution concerns associated with both water and air pollution.

Confidential Draft – Do Not Cite
HP Industry SEA Page vii December 2013 (Draft 23/12/13)
EXECUTIVE SUMMARY
Background Himachal Pradesh (HP) is a rapidly industrializing
mountain state in northern India that also depends on its abundant natural and environmental resources as a basis for broad-‐based tourism and provision of services to its population of about 7 million people (Map ES.1). The HP Strategic Environmental Assessment (SEA) is a
technical assistance (TA) to identify priority industrial pollutants and economic instruments to minimize industrial waste. The TA involved a consultative process to obtain feedback on priority industries and pollutants, and to assist in information collection. The SEA complements a World Bank Development Policy Loan (DPL) that addresses “Inclusive Green Growth”: the DPL seeks to provide policy and programmatic support to promote environmentally sustainable industrial development by reducing pollution of existing industrial plants and to promote cleaner sources of economic growth. The specific objectives of the SEA are achieved
through a combination of research and analytical work based on secondary data and feedback from stakeholders in HP. The process has included priority-‐setting workshops, development of case studies, and advice on appropriate measures that can be taken to support the DPL through identifying options for implementing economic instruments that encourage cleaner production in the state’s micro-‐, small and medium enterprise (MSME) sector. In support of this, the SEA also conducted a best international practice review of economic instrument systems, and conducted selected economic valuations of potential health and environmental effects of pollution in HP. The SEA also updated existing institutional reviews to
provide a basis for recommendations relating to ongoing capacity building associated with any new policies. The capacity building is associated with greater integration of environmental economic methods into state policies: this ranges from use of cost-‐effectiveness analyses that reflect environmental costs, to development of better statistical infrastructure to conduct valuation, to enhanced training of local stakeholders in the use of such tools.
Himachal Pradesh can be a national leader in the adoption and implementation of modern methods
of pollution abatement and management.
Industrial Pollution Hotspots HP industrial development policies will result in
potentially significant contributions and growth from industries in the pharmaceutical and agro-‐processing sectors: while these will have potentially significant environmental impacts, addressing these through best-‐available practice at an early stage can improve overall economic efficiency and environmental sustainability. With the incentivized investment climate in HP, the
numbers of both small-‐scale industries (SSI), and medium and large-‐scale industries have increased dramatically. Since 2003 investment in SSI increased by 632% and a 60% increase in SSI employment. In medium and large-‐scale industry sectors, investment increased by 354% for a 148% increase in the number of medium and large-‐scale units.
Air, water and hazardous wastes from industries can generally be managed through best available technologies in larger industries. A significant challenge is the proliferation of micro and small enterprises engaged in, or allied to, chemical and textile production. Industry generates about one-‐quarter of GHGs in the
State and this share could rise in the absence of pro-‐active efforts. Such efforts could focus on enterprise energy efficiency, adoption of best available technologies for process design, and green building design mandated through building codes.
Industrial growth has been significant in Himachal Pradesh, largely in response to targeted incentives, with industrial hotspots arising in the Districts of
Solan, Sirmour, and Kangra.
Institutional Opportunities & Constraints The DEST (DEST) and State Pollution Control Board
(SPCB) are maturing into important policy and regulatory players in Himachal Pradesh. Recent initiatives have also culminated in 2013 in the development of an Environment Master Plan for HP, and notification of policies associated with Payment for Ecosystem Services (PES). Weaknesses in institutional monitoring capacity still
result in information gaps that hinder effective selection of optimal regulatory policies. Main gaps are associated with the scale and types of industrial sectors operating in the hotspots, and up-‐to-‐date pollution information and concentration data from these sectors. The existing information can, however, help guide the design of efficient economic instruments that can be tested in some of these hotspots and sectors. Recent initiatives have shown that DEST can work in
partnership with industry for proactive environmental management. Also, a commitment to multi-‐stakeholder collaboration can inform the development of State Environmental Policy.
Priority Sectors Of 17 priority traditionally high polluting industries in
India, 11 are currently present in Himachal Pradesh. Three of these industries (pharmaceutical, fermentation, sugar) have recently enjoyed some status as “thrust” industries in HP; pollution mitigation in these sectors is possible but will require coordinated efforts to ensure that human and ecosystem health is not compromised. Some polluting industries on the negative list (e.g.,
those associated with dyes and tanneries) will be more difficult to address due to their high cost of intervention if they persist at a small scale. The use of thrust and negative lists is a useful means
for documenting and potentially regulating industries, but it should be recognized that even negative industries might grow and require regulation.
Incentives used to encourage thrust industries may also be directed more aggressively to those industries that have a potentially positive
environmental footprint: ecotourism, biotech, and nanotech are examples.
Confidential Draft – Do Not Cite
HP Industry SEA Page viii December 2013 (Draft 23/12/13)
Health Linkages Industrial pollution will have negative impacts on
human and ecosystem health if not mitigated. Air pollution from PM10 is a leading cause of the disease burden in urban areas of HP; most water pollution disease burden is more associated with non-‐industrial sources. Benefits (including human and environmental health)
are still relevant in comparing pollutants but finding a common denominator in money or physical terms is problematic. Interventions for most pollutants are most cost effective if they are preventative – targeting future developments. In addition, especially for air pollution, they need to be restorative to address the pollution impacts from existing facilities. Economic valuation suggests that annual economic
losses associated with pollution in Himachal Pradesh may approach Rs 315 million (US$5.2 million) for air pollution and Rs 175 million (US$2.9 million) for water pollution in urban areas. These values are based on detailed India-‐wide work on direct impacts transferred using appropriate methods to Himachal Pradesh; they are regarded as lower-‐bound estimates due to the use of conservative methodologies. Beyond these direct impacts, however, it is generally acknowledged that indirect impacts on the state’s tourism potential would further increase these figures significantly.
Economic Instruments – General Findings Command and Control (CAC) and Market-‐Based
Instruments (MBIs) both incentivize industry to control pollution: either or both can make policy sense in a given institutional context. A mix of CACs and MBIs can address different goals:
cost-‐effectiveness, pollution reduction, and revenue generation. Historical developments can generate a sub-‐optimal mix of approaches, implying that the first steps in policy involve reforming or changing “perverse incentives” that have unintended negative environmental impacts. India and Himachal Pradesh already have experience
with a number of CAC and MBIs; future initiatives in the State can build effectively on this experience. All of these approaches do, however, require well-‐developed institutional capacity to enforce or oversee the relevant instruments. Only voluntary mechanisms require relatively less institutional capacity, but even these benefit from complementary state programs that can support private initiatives. Not possible at this stage to conduct cost
effectiveness of different regulatory regimes as there is no information on compliance or transaction costs either within industry or within the regulatory setting. Comparisons of the cost effectiveness of different regulatory regimes require specific data on transactions, monitoring and compliance costs borne by industry and regulators in Himachal Pradesh. A number of approaches hold particular promise
including: ü Increased use of industrial parks within spatial zoning &
planning. ü Increased reliance on user fees/charges for treatment
with modifications to remove existing distortions and inefficiencies.
ü Increased reliance on budget neutral environmental taxation, including over the longer term a carbon (GHG) tax.
ü Aggressive incentives for net positive impact industries (e.g., biotech, nanotech) or activities.
ü Facilitate organization of small-‐scale industries to take advantage of branding opportunities and collective responsibility arrangements.
Ongoing support for awareness building and transparency in support of Public Interest Litigation is a cost effective means for addressing industrial
pollution.
New Sectoral Insights Case studies based on detailed data collection and
interviews of regulators and 18 firms (out of a potential >300) in Himachal Pradesh revealed a series of important insights, which inform future policy design.
ü Regulators in the Baddi SPCB regard incentive to individual firms as too difficult to monitor given current resources; they prefer that any incentives be given to common effluent treatment plants.
ü Voluntary certification programs can generate marketing benefits, decreased costs through better waste management, and greater environmental compliance. In the food processing survey, companies have already accessed ISO 22000 (a general derivative of the ISO 9000 system particular to the food safety industry) and ISO 14001; others are considering certification under ). A few companies are considering seeking ISO 900, ISO 14001 and OHSAS18001 certification.
ü Simple classification distortions can block effective use eligibility for incentives; stone crushers are not classified as an “industry” therefore do not enjoy the same benefits that others might.
New Approach for MSMEs Based on a survey of methods used in ten countries,
the SEA describes a hybrid scheme intended to improve control of pollution from MSMEs in Himachal Pradesh. The recommended scheme comprises elements of
five different economic instruments: ü environmental fee tied to operating permits (on pollution
discharge with exemptions) ü capital grant provisions for environmental technology ü soft loan scheme for MSME support ü accountability instruments ü economic incentives associated with supply-‐chain
management The final hybrid of these is a collection of options
described as the “Himachal Pradesh SME Green Incentive Scheme.” Flexibility permits targeting and phasing of politically sensitive elements; its design is such that it can be budget neutral, and altered to fit budget constraints.
Summary of Recommendations {to be completed – refer to action matrix Table ES.1} Elaborate/reiterate listing in §12, including among
others: MSME mechanism (as above) [short-‐medium term] Scaling of MSME mechanism [long term] Statistical infrastructure/Capacity building. [ASAP] Activities complementing PES notification. [ASAP] Closing statement of this SEA as resource for future
learning.

Confidential Draft – Do Not Cite
HP Industry SEA Page ix December 2013 (Draft 23/12/13)
Page intentionally left blank.
[insert recommendation action matrix Table ES.1: Theme, element, SML term priority & indication of budgetary needs
refer to §12 for full descriptions]
Confidential Draft – Do Not Cite
HP Industry SEA Page 1 December 2013 (Draft 23/12/13)
§1 Introduction
Context for SEA This SEA is a technical piece intended to assist in the current and future identification of priority industrial pollutants and economic instruments to minimize industrial waste. This industrial sector
SEA is one of six pieces of technical support envisioned by the HP Inclusive Green Growth (IGG) Development Policy Loan (DPL)2 to fill knowledge gaps and strengthen operational success of the DPL. The DPL acknowledges that industrial development is an important economic driver within HP,
and that such development must be consistent with maintaining the integrity of other natural resource assets on which human health depend. Moreover, maintenance of environmental integrity also supports policy aspirations for promoting tourism development as another economic driver.
The 4th Objective and Goal of the IGG DPL promotes environmentally sustainable industrial
development by reducing pollution of existing industrial plants and promoting cleaner sources of economic growth. The associated DPL 1 Prior Action requires a HP Cabinet amendment to the Industrial Policy (2004) that promotes cleaner production and environmental management systems,
disincentives to polluting industries, and public disclosure of the status of polluting units and clusters. The associated DPL 2 Trigger is the design and pilot by the State Department of Industrial Development of economic instruments for industrial pollution control for selected priority
pollutants. This SEA for the Industrial Sector is consistent with this objective of the IGG DPL, by providing guidance to facilitate selection of an appropriate DPL 2 Trigger.
Role of SEA The general objectives of the SEA Study are: (i) to assist in identification of priority pollutants and industries; (ii) to review existing institutional structures that address these pollutants; (iii) to identify and recommend potential reform options through the introduction of new policy approaches; and,
(iv) to identify complementary institutional support necessary to implement such a program. The work focuses on delivering insights and recommendations along the following broad themes.
Theme 1: Identification and diagnostic of key environmental issues in the industrial sector of HP, including identification of priority pollutants and polluters based on available information. This
includes listing and prioritization of primary polluting sources (i.e., industries and sectors), based in turn on a listing of contaminants of concern related to the industrial processes, industrial waste (solid and liquid) disposal practices and infrastructure and assessment of the key environmental and
health impacts. A large number of pollution problems have serious economic costs in terms of health, production costs, tourism, quality of life and ecology that exceed the alternative cost of pollution control; however, there is little prioritization of these problems in terms of their economic
impacts. Therefore, limited financial and institutional resources are dissipated and do not achieve the greatest possible effect. The SEA thus summarizes available economic valuations of selected environmental and health costs associated with pollutants with the aim to inform the identification
and rank of priority polluting industries and sectors. It should be noted that much of the ranking has already been undertaken through political processes that recognize the importance of various
2 World Bank. 2012. Development Policy Loan (DPL) to Promote Inclusive Green Growth and Sustainable Development in Himachal Pradesh. August 6.

Confidential Draft – Do Not Cite
HP Industry SEA Page 2 December 2013 (Draft 23/12/13)
industries, while also reflecting physical impacts on human health and environment; putting forward the economic values thus complements the information base on which these decisions are made
and priorities are set.
Theme 2: Identification and assessment of appropriate policy alternatives. New economic conditions require a reform of industrial pollution policies toward a more collaborative approach with industry, building on the synergy between more flexible regulation with effective enforcement on one hand,
and market driven incentives for improved environmental management systems, on the other hand. The SEA thus assesses various options in the context of HP to address the priority pollutants, including (i) economic instruments, (ii) command and control instruments, (iii) public disclosure
instruments, and (iv) other methods.3,4 Other methods are generally at a higher policy level and might include, for example, incentives for attracting cleaner industries or extending the negative list to other categories of industries. Given the continued environmental degradation of HP’s fragile
ecosystem it is pertinent to revisit the negative list and align incentives accordingly for both clean and dirty sectors. The SEA considers the pros and cons of different policy alternatives based on a series of general assessments that rely on experience internationally and within India, and upon
local institutional considerations.
Theme 3: Recommendations for institutional reforms to implement the suggested policy changes. This relies on a review of institutional frameworks governing the environmental aspects of the industrial sector in HP, including assessment of capacity for implementation and effectiveness of
implementation. The review is based on secondary sources and is intended to categorize and assess the relevance and effectiveness of existing institutional arrangements; the review builds on a comprehensive assessment undertaken in 2009. The institutional considerations are intended to
identify: (i) resources that will be required to address existing gaps in achieving effective environmental management; (ii) appropriate recommendations that can be implemented in the
short, medium and long term; (iii) identify potential opportunities and challenges to the implementation of such recommendations; and (iv) identify institutional roles and responsibilities for implementation. The recommendations also incorporate initiatives related to general
institutional capacity building within HP.
Approach The SEA was undertaken from April to December 2013 based on secondary data collection, existing
literature (Annex A), various consultative meetings with key stakeholders (Annex B), and diagnostic analyses of this information. The main elements of the SEA included the following.
3 The literature shows that economic instruments such as pollution taxes for environmental policy are the most efficient but their design requires significant amounts of primary data and a vast institutional capacity to implement. Introduction of pollution taxes may also require legal and institutional reforms, besides capacity to measure and monitor pollution. There are also risks that they invite rent seeking (corruption) as shown in the literature. The SEA thus examines the use of potential economic instruments that will be examined in the HP context to address industrial pollution issues in the broader context of efficacy, efficiency and sustainability. As HP is gearing up to adopt a Goods and Services Tax regime, it is also an appropriate time for addressing environmental considerations. 4 Public release and dissemination of emissions data and environmental performance ranking can be a powerful tool to promote pollution control. Programs of public disclosure of emissions aim to promote compliance with pollution regulations and reward good performance. Examples of such schemes include PROPER (Program for Pollution Control, Evaluation and Rating), which has been used in Indonesia and other similar schemes that have been used for monitoring and increased transparency of information that have been used for example, in Colombia and Ghana. There is an increasing appetite in HP to introduce public disclosure building on their existing online monitoring of pollution from key industrial sources.
Confidential Draft – Do Not Cite
HP Industry SEA Page 3 December 2013 (Draft 23/12/13)
Initial consultation meetings were held in Himachal Pradesh in June 2013 and included a broad range of stakeholders. In preparation for these consultations, key issues were initially identified by the SEA
Team based on desk reviews of data and literature. This provided a basis for outlining preliminary priorities and for narrowing down further analyses and associated information requirements.
The purpose of the consultations was to discuss the findings, issues and preliminary directions suggested by the desk reviews (presented in a power point presentation), and to initiate a work plan
for amassing additional information. These meetings also kicked off a broader consultative process, recognizing that GoHP has already embodied a consultative philosophy within its environmental policy program. It should be noted that the consultations paralleled preparation for appraisal of the
DPL.
The SEA Team worked closely with the State Pollution Control Board (SPCB) and the Department of Industry to collect available data and information to inform the SEA. Information collection involved those data routinely collected by the SPCB, as well as a series of case studies of priority polluting
industries. The case studies were selected in consultation with the Industry Department and the SPCB: those chosen covered the pharmaceutical industry in Baddi (Solan District), and the stone crushing and food processing industries in Una District. Cost effectiveness were subsequently
considered within these same industries but at a state wide level; information constraints relating to industrial compliance costs and institutional costs (described in this report) limit the scope and application of cost effectiveness analyses at this stage but the SEA does provide selected examples
and pro-‐forma templates that can potentially be used during ongoing institutional information collection and capacity building within HP. Such capacity building is regarded as a core requirement for moving forward and is described more fully in the recommendations arising from this SEA.
To help guide the selection of an economic instrument for pollution control to meet the DPL requirements in HP a literature review of existing practices and experiences across ten countries in Asia and South and Central America was undertaken. This experience was summarized within a mid-‐
study recommendation report to relevant stakeholders to assist in the design of an appropriate instrument for the DPL trigger.
The SEA has included participatory approaches to ensure that proposed policy changes are designed and implemented in a way that is responsive to the different segments of HP society. During the
course of the work, the SEA Team worked collaboratively in collecting industry information and providing quality control on that information. Various databases were collected, reviewed, and corrected to address issues associated with anomalies such as improper classification and
completeness. Feedback was also provided by the SEA Team through ongoing discussions relating to the design of an appropriate economic instrument specifically targeted to small and medium enterprises: these recommendations were subsequently validated within the context of this SEA and
form a core part of the overall recommendations arising from this study. The SEA also provides information aimed at enhancing future social learning processes through the use of case studies to permit evaluation of policy directions. A key aspect of this is the elaboration of a series of three case
studies – relating to the pharmaceutical, stone crushing and food processing sectors – and a preliminary review of cost-‐effectiveness considerations within these sectors. In this way, the SEA seeks to promote long-‐term sustainability of public policies beyond the mitigation of short-‐term
environmental impacts.

Confidential Draft – Do Not Cite
HP Industry SEA Page 4 December 2013 (Draft 23/12/13)
Country Context India’s gross domestic product (GDP) growth is likely to remain lower than what it was before the global financial crisis but high in international comparison. India’s GDP growth slowed to 6.5 percent in FY2011-‐12 from 8.4 percent during the two previous years. The slowdown was led by lower
investment, which reached 5.5 percent in FY2011-‐12 compared to 7.5 percent in the previous year. Over the next two years, GDP is expected to stay around 7 percent.
Most environmental indicators in India suggest that economic growth is extracting an increasing toll on the country's natural resources -‐ water, land, forests, soils and biodiversity -‐ and leaving a large
pollution footprint. India is highly vulnerable to climate change; cyclones, floods and droughts are happening with increasing frequency, and the Himalayan glaciers that feed India‘s largest rivers may be vulnerable to retreat. Indeed, climate change will impact India first and foremost through its
water resources. Rising temperatures will also affect agricultural yields, forests, and marine and coastal biodiversity. India will need to better manage these resources (particularly water) and reduce the burden that environmental degradation is imposing on the population, particularly on
the most vulnerable groups.
A World Bank (2013) diagnostic report estimated that environmental degradation costs India about US$80 billion a year, nearly 6% of its GDP. The biggest problems are air pollution, land degradation and poor water and sanitation. The study suggests that reducing PM10 particles by 30% would cut
average GDP growth by 0.04 percent, but would save US$47–US$105 billion in health costs annually [tbv if annual & check specific reference].
The World Bank support for the Himachal Pradesh Inclusive Green Growth (IGG) DPL breaks new ground, which could have significant demonstration effects in promoting the green growth agenda
throughout India.5 HP’s resource base and pro-‐active policy stance places it in a position to show leadership at the state level.
State Context – HP as Leader The Government of Himachal Pradesh (GoHP) has embarked on a program to make a transformational shift toward a model of environmentally sustainable economic growth, at the core of which is the objective to become carbon neutral by 2020. The State’s mountain environment
embodies the connectivity between different economic sectors; industry, together with energy, rural development and tourism sectors, is one of the key engines of economic growth in the state of Himachal Pradesh.6
Himachal Pradesh has witnessed exponential growth in industry development. From a modest base
of 22 large and medium enterprises and 6,969 small-‐scale industries in 1979-‐80, by 2012 the sector had accelerated to over 487 large and medium enterprises and about 38,220 small-‐scale industries,
5 The India/World Bank Country Assistance Strategy (CAS: Report No. 46509-‐IN), 2009-‐12, recognizes that while India needs to grow to reduce poverty and create employment, it has an opportunity to do so in a way that is sustainable and preserves the country‘s natural heritage. CAS identifies the following priorities for engagement: sustainable management of natural resources, climate change, and the inclusive green growth and sustainable development agenda. The CAS provides a framework to deal with the challenges of achieving rapid, inclusive growth, ensuring sustainable development, and improving service delivery, with a cross-‐cutting focus on improving the effectiveness of public spending and achieving monitorable results. The CAS suggests that special strategies are required for the Northeastern and Himalayan States. 6 GoHP is in the process of preparing a new Industrial Strategy, a draft of which was received and reviewed by the SEA Team in September. [If this is finalized, we need to add a proper reference and check it against statements in this SEA and add some text later in this Chapter.]
Confidential Draft – Do Not Cite
HP Industry SEA Page 5 December 2013 (Draft 23/12/13)
with direct employment of about 266,000 persons. To facilitate the establishment of new industries, a State Level Single Window Clearance and Monitoring Authority was constituted to clear projects
and ensure speedy approval from various departments. Additionally 41 Industrial Areas and 15 Industrial Estates were built to provide infrastructural facilities to the sector.
Industrial growth in HP has been fueled by incentives provided by the central and state governments. In the 1980s, subsidies and concessions were introduced to promote investment,
particularly by firms utilizing local raw materials and labor and compensate for the high costs of difficult terrain and inadequate industrial infrastructure. The approach however soon became unsustainable – as the experience with infant industry support has demonstrated globally. GoHP
recognizes that tax breaks and fiscal incentives have often led to creation of uncompetitive industries, and that its role in spurring industrial development should gradually shift from providing subsidies to creating a robust business environment with a level playing field.
Furthermore, rapid industrialization in HP has led to industrial clusters where environmental quality
(air and water pollution) is rapidly deteriorating and causing hazardous conditions for neighboring communities. While the State Pollution Control Board (SPCB) is mandated with the regulation of environmental compliance of industries and identification of interventions for areas which have
become “pollution hot spots”, the Industries Department promotes overall industrial development in the state with limited information on the environmental quality of the various industrial clusters. Further, communities themselves have little information on environmental performance of
neighboring facilities, so stakeholder monitoring pressures are absent.
The GoHP 2004 Industrial Policy and its 2006 amendments continue to provide an impetus to industrialization. The Policy includes a wide range of incentives aimed at boosting the investment
climate by creating and upgrading the existing infrastructure, rationalizing the provision of incentives and streamlining rules/procedures including the provision of land banks, cheap commercial power, skilled manpower, local labor, roads and transport accessibility, and information
technology access with good network penetration in the interiors. Priority industries that were deemed Clean (such as: environmentally sustainable tourism, information technology, bio-‐technology and fruit processing) are encouraged and financial incentives are available for investing
in end-‐of-‐pipe pollution control equipment and cleaner technologies.
Given the thrust on rapid industrial development, the inclusion of green elements and incentives in the 2006 amended Industrial Policy has been minimally effective for attracting cleaner industries and adoption of cleaner technologies. Recognizing the need for reducing the environmental
footprint of industrial growth, GoHP has agreed to create a joint government-‐industry body to review and update industrial policy focusing on environmental sustainability and clean production. In addition, GoHP recognizes the need to strengthen collaboration between the Industries
Department, the Department of Environment, Science and Technology and the State Pollution Control Board to reduce pollution from industrial sources, while also enhancing industrial competitiveness. Government agencies and the private sector have agreed to jointly review the
Industrial Policy 2004 in order to determine policy approaches to catalyze or accelerate climate-‐smart industrialization in the state. [If review is complete, describe and reference here; cf. Footnote earlier this chapter.]

Confidential Draft – Do Not Cite
HP Industry SEA Page 6 December 2013 (Draft 23/12/13)
Environmental degradation is particularly impacting the region’s natural tourism attractions and has become an impediment to HP achieving its full tourism potential. A major challenge has been lack of
coordination between the Tourism Department and the Departments of Urban Development, Town and Country Planning, Environment, Irrigation and Public Health in formulating a coherent strategy for improving tourism potential. While these problems are already evident, they are set to become
more severe and widespread without urgent actions and adequate planning.
The State‘s unique and fragile hill ecosystem, including its protected areas, supports many of the State‘s most popular tourist activities, including trekking, skiing, angling, mountaineering, rafting, and watching of flora and fauna. Pollution from wastewater and solid wastes, as well as unplanned
urban growth, not only threaten the fragile ecosystem, but also reduce the attractiveness of the natural and pristine areas that tourists travel to visit. The tourism sector has shown remarkable resilience despite over-‐crowding in some areas and has the potential to become one of Himachal
Pradesh’s main drivers of economic growth. In 2008, Himachal Pradesh received 9.37 million domestic tourists (1.6 percent of total domestic tourists in India) and 377 thousand international tourists (6.7 percent of total international tourists in India). Among Indian states, Himachal Pradesh
was the 10th most visited by international tourists and 12th most visited by domestic tourists. Between 2001 and 2008, visits by domestic tourists grew by 8.9 percent and those of international tourists by 20.9 percent.
Outline This Final Report is broadly presented in three parts. Part I forms a foundation for focusing subsequent diagnostic work by providing more extensive detail on the institutional context,
pollution situation, health and environmental linkages, and opportunities for using economic instruments. Part II performs additional diagnostic analyses to inform the core recommendations relating to options for new economic instruments, institutional reforms and capacity building; these
recommendations are presented in Part III (Chapter 12).
Part I “Foundations” continues in Chapter 2 with an institutional review and then in Chapter 3 presents a summary of findings relating to the industrial pollution hotspots, industries and criteria pollutants relevant to the prioritization exercise in Himachal Pradesh. The institutional review builds
on a detailed diagnostic first conducted in 2009, and was informed by participatory workshops and meetings conducted during the SEA and through parallel activities associated with the DPL. The work
relating to pollution hotspots and industries relies on secondary statistics collected by government and on validation through the stakeholder workshops. A discussion of health linkages in Chapter 4 is intended to provide background information on key health concerns that would come up in any
industrial context; this chapter also introduces findings of the valuation work related to human health and environmental quality in the context of the various pollutants. Chapter 5 introduces the framework for considering different types of economic instruments for environmental management;
it also highlights experience with such instruments in HP.
Part II “Diagnostics” commences in Chapter 6 with the mid-‐study recommendation report relating to options for developing an incentive system to improve environmental performance of MSMEs. Chapter 7 commences with the results of the quality-‐controlled and corrected information
assessment exercise conducted of all industry pollution and operational information for Himachal Pradesh; it subsequently provides more specific background information on the context for the case

Confidential Draft – Do Not Cite
HP Industry SEA Page 7 December 2013 (Draft 23/12/13)
studies. Chapters 8, 9 and 10 provide a separate discourse on each of the three case studies for the pharmaceutical, stone crushing and food processing sectors. Chapter 11 concludes with a diagnostic
of cost effectiveness issues addressed in this SEA.
Various Annexes provide supplementary information tables and background material.

Confidential Draft – Do Not Cite
HP Industry SEA Page 8 December 2013 (Draft 23/12/13)
Part I FOUNDATIONS
§2 Institutional Review
§3 Pollution Hotspots & Priority Polluting Industries
§4 Health & Environmental Impacts of Industrial Pollution in Himachal Pradesh
§5 Economic Instruments for Environmental Management in Himachal Pradesh
[insert photo]

Confidential Draft – Do Not Cite
HP Industry SEA Page 9 December 2013 (Draft 23/12/13)
§2 Institutional Review
Introduction This chapter summarizes the institutional structure for environmental management. An environmental institutional assessment was conducted to inform the Inclusive Green Growth DPL,
and to help operationalize the Department of Environment, Science, and technology (DEST), which was formed under the (now closed) Fiscal DPL. To ease capacity constraints, various institutional recommendations are contained in the IGG DPL (based on the institutional assessment done in
20097). This chapter thus summarizes and updates the state of institutional capacity: potential pollution control interventions will need to be considered in light of the institutional capacity for their implementation. This will provide guidance as to the practicality of different policy alternatives,
given the existing and evolving environmental governance capacity in the country. The chapter commences with a description of the current structure, including the main players and existing policy initiatives. The chapter then turns to the 2009 institutional assessment, which also provided a
series of recommendations for HP: the chapter indicates to what extent these have been implemented or the reasons for delay or rejection.
Current Structure
The main environmental players: DEST and SPCB The State Pollution Control Boards (SPCBs) were created as a part of the national legislation whereas the state governments, to protect the particular interests of the state, create the state departments of environment. The HP Department of Environment, Science and Technology (DEST) is responsible
for overall environmental management in the state, while the SPCB is the main implementing agency of pollution regulations in the state. DEST exercises administrative oversight to the functioning of the HP SPCB.
The HP DEST is relatively young. It was created in April 2007, in accordance with the TOR provided by
the GOI MOEF for setting-‐up a state DOE. The first World Bank DPL assisted in its capacity development, and the second DPL continues that assistance. The DEST mandate includes implementing all environmental legislation that the SPCB cannot implement. Hence its mandate
includes: (i) environment and pollution control; (ii) development/modification/adaptation and dissemination of new technologies for state development needs; and, (iii) formulation and implementation of a state biotechnology policy.
Under its environment and pollution control mandate, DEST is responsible for implementing the
Environmental Impact Assessment and monitoring associated Environmental Management Plans prepared by project proponents. DEST is responsible for certain categories of industries that require mandatory state-‐level environmental clearance. In accordance with the GOI EIA mechanism, the
State Environmental Impact Assessment Authority (SEIAA) and the State Expert Appraisal Committee (SEAC) have been established within DEST. DEST collaborates with the SPCB to implement national EIA legislation.
7 World Bank. 2009. Institutional Assessment – Environmental Sector. Part A: Issues – Priorities and their Management. A Report Draft Version. March; and Part B: Organizational Assessment. A Report. May. Prepared by Environment Team SASDI. New Delhi.

Confidential Draft – Do Not Cite
HP Industry SEA Page 10 December 2013 (Draft 23/12/13)
DEST is responsible for taking punitive action against industries that are in contravention of pollution laws, rules, or notification. It is DEST that directs water and electricity utilities to stop service to non-‐
compliant industrial units. In the case of PIL actions, DEST is the GoHP respondent to the High and Supreme Courts of India.
The DEST mandate also includes public awareness and educations programs, pro-‐active disclosure of environmental monitoring information and environmental management practice by project
proponents and regulators. DEST would be the body providing the Environmental Information System (ENVIS) node for the MOEF.
The SPCBs are the main implementing agency for both national and state prescribed pollution norms and standards. The CPCB sets environmental standards, and with the assistance of the SPCBs,
monitors environmental performance and develops and facilitates abatement and pollution control for all parts of the country. Although DEST provides administrative oversight to the SPCB, the latter functions as an autonomous body, financially independent from DEST. The SPCB relies on Consent
Fees and revenue from the water cess to cover its budget.
There are 10 regional SPCB offices in HP that:
• Monitor pollution sources and industries to ensure that the conditions of the Consent to
Establish (CTE) and Consent to Operate (CTO) are being met (see Chapter 5 on Economic Instruments). During 2010/11 the SPCB granted 355 CTE and 332 CTO.
• Conduct “surprise inspections” as per the Environment Surveillance Scheme (ESS) for the 17
categories of highly polluting industries.
• Conduct public hearings associated with EIA processes that are mandatory for certain categories of projects. During 2010/11, the SPCB was involved in 5 EIA processes.
• Respond to public complaints and mediate between industry and the public.
• Assess and collect the water cess.
• Monitor the generation and disposal and/or storage of biomedical and hazardous waste.
• Regulate the establishment of Sewage Treatment Plants and solid waste disposal sites.
The 2009 institutional assessment of the SPCB found that it was operating with three-‐quarters of its
staff positions filled.
Interaction between DEST, SPCB and Industries Department The HP Industries Department implements HP’s Industrial Policy (2004). It plans industrial belts, informed by a Zoning Atlas8 developed by the HP SPCB. DEST can provide the industrial sector with
incentives for cleaner production technologies or better pollution abatement technologies, or it can provide disincentives for dirtier, older technologies. Depending on the type of enterprise, it will need environmental clearance and/or an EIA from the SPCB, DEST, or the MOEF.
8 The Zoning Atlas provides information as to the carrying capacity of different regions.
Confidential Draft – Do Not Cite
HP Industry SEA Page 11 December 2013 (Draft 23/12/13)
Both DEST and SPCB will have input to the relevant “negative list” and “thrust list” of industries in HP. As described in Chapter 3, most of the industries on the “Negative” list are those identified by
the GOI in the national industrial policy; HP has added a couple more to the list. These industries are not banned, but are generally not eligible for subsidies and are scrutinized for environmental impacts and mitigation measures. They have to renew periodically their Consents to Operate, after
demonstrating their compliance with the relevant environmental standards. It is the responsibility of the SPCB to ensure that required renewals are undertaken.
Ministry of Micro, Small and Medium Enterprises The GOI Ministry of Micro, Small and Medium Enterprises (MSME) the MSME Development Act,
2006, which defines these three tiers of enterprises. The Ministry of MSME facilitates industrial growth throughout the country. The Act also provides a legal framework, a statutory consultative mechanism, and funds, schemes, and services for MSME promotion, development, and enhanced
competitiveness. Among the schemes to reduce the environmental impacts of MSMEs is the Micro and Small Enterprises Cluster Development Program where a number of service facilities are provided to clusters of MSMEs.
Environment Policy Guidelines
The HP Environmental Policy Guidelines have been developed as a precursor to the eventual formulation of a State Environmental Policy. The Guidelines summarize the issues in different environment and economic sectors, and for each, provide a list of required actions.
Environment Master Plan (EMP)
The formulation of an EMP was initiated in October 2008 and completed in 2013. It is based on vulnerability assessments and the identification of ecologically fragile zones. It is a tool intended to
guide strategic development planning, to promote interagency and community engagement, and to aid in monitoring regional and national environmental performance.
Main elements of the EMP (based on version dated __ 2013) reflect the following. ____ ____ ____ ________ ________ ________ ________ ________ ________ ________ ________ ________
________ ________ [brief summary to be inserted based on most recent version available] ____
Corporate Responsibility for Environmental Protection (CREP) The MOEF GOI launched the CREP program in March 2003 to provide a means for bringing government and industry together to develop measures for pollution reduction that go beyond
simple regulatory compliance. Within the CREP program, Action Plans to meet agreed pollution targets are to be developed for the 17 highly polluting industrial sectors. Sector-‐specific National Task Forces are constituted to monitor the implementation of each Action Plan. The CPCB tracks the
progress of the CREP.
Expeditious Clearance HP has established Single Window Clearance and Monitoring (SWCM) Agencies and a State-‐level SWCM Authority to ensure rapid clearances of industrial projects. The Agencies and the umbrella
Authority provide a forum where government authorities from different departments and agencies meet periodically to examine industry project proposals. Five SWCM Agencies were established in the industrial areas of Parwanoo, Baddi, Paonta Sahib, Kala Amb, and Golthai.
Confidential Draft – Do Not Cite
HP Industry SEA Page 12 December 2013 (Draft 23/12/13)
The 2009 Institutional Assessment In 2009 the World Bank undertook an Institutional Assessment in Himachal Pradesh9 as part of the ongoing Fiscal DPL. The draft findings of the Institutional Assessment were shared with the Principal Secretary (Environment) and with the DEST of GoHP. The report was not finalized due to other
priorities, however, it served as a reference point in the preparation of the State’s Environmental Master Plan 2013 (EMP) and, more importantly, as a basis for creating new positions within the DEST.
The following is a summary of recommendations arising from the Himachal Pradesh 2009
Institutional Review (Parts A & B) related to the Department of Industry and to DEST, and an update on these recommendations as of November 2013.
Industry Department – Update of 2009 Review Given that it had been difficult to ensure proper environmental management in the existing industrial development zones, the Institutional Assessment 2009 recommended that the Industry Department should outline a clear policy that eco-‐sensitive areas and its surroundings / vicinities will
be outside the purview of industries.
Currently the state operates a Single Window Clearance system for industry. The Principal Secretary (Environment) is a member and the PCB is a special invitee on the Single Window Clearance committee. If a project is located in an eco-‐sensitive area or its surroundings / vicinities, it is not
cleared. Further, as per the EIA notification 2006, any industry project located in eco-‐sensitive areas requires the permission of the MOEF to operate. The state level environmental clearance authority, the State Environment Impact Assessment Authority (SEIAA), cannot provide this clearance. The
implementation of both of these requirements was streamlined in 2009.
The 2009 Institutional Assessment found that Environmental laws addressed end-‐of-‐the-‐pipe pollution issues but did not encourage cleaner manufacturing. It was therefore recommended that the Industry Department provided a policy of disincentives for old, polluting dirty technologies and
incentives for cleaner technologies, production processes and practices. Industries in HP should be urged, facilitated and encouraged towards cleaner manufacturing and encouraged, through the upfront adoption of better approaches, to adopt the “polluter internalizes principle”. It was
recommended to explore the establishment of a Cleaner Technology Centre within the Industry Department with support from DEST. Given the major negative environmental impacts caused by mining, it was advised to select the mining sector to pilot cleaner manufacturing initiatives.
Incentives for cleaner technologies, production processes and practices were included as a trigger
for the DPL II. It is expected that the Industrial Policy will be suitably amended to include the incentive policy by early 2014 [check status].
DEST – Update of 2009 Review The specific recommendations of the 2009 Institutional Assessment for the DEST and subsequent related actions are provided below.
9 World Bank. 2009, Institutional Assessment – Environmental Sector. Part A: Issues – Priorities and their Management. A Report. Draft Version. March; and Part B: Organizational Assessment. A Report. May. Prepared by Environment Team SASDI. New Delhi.

Confidential Draft – Do Not Cite
HP Industry SEA Page 13 December 2013 (Draft 23/12/13)
Implementation Responsibility The 2009 Institutional Assessment recommended that DEST should assume a policy formulation, co-‐
ordination / facilitation / advisory, monitoring and compliance role without any implementation responsibility. If implementation experience is needed to enhance its advisory role, then it should be no more than at laboratory or pilot scale. Since 2009, the roles of the DEST have been streamlined.
All implementation initiatives related to environmental management are now being carried out by other organizations, e.g. Aryabhatta Geo-‐Informatics Space Application Centre (AGiSAC).
Multi-‐disciplinary Collaboration The 2009 Institutional assessment recommended the creation of multi-‐disciplinary working teams at
the operational level to promote integration and better enable cross-‐sector issues to be addressed. Initially, three working teams were recommended covering the following cross-‐sectoral issues: (i) urban, industry, transport and tourism; (ii) hydropower and roads; and, (iii) rural development,
agriculture and horticulture. Working teams should include representatives from the respective departments, and not only oversee activities such as studies initiated by DEST but also be proactive, through field visits and media about activities and practices that have environmental implications.
Their role should therefore be more hands-‐on than is customary of inter-‐departmental committees. The working teams should ensure that an integrated approach is developed in the short-‐term, which leads to a better prioritization of resource allocation and utilization in the medium term.
To date, multi-‐disciplinary teams have been created under the Climate Change Centre, which is an
organization under the Science and Technology Council. This has resulted in cross-‐sector issues being better addressed, which is critical in the context of climate change. Also, in the recently approved Environmental Master Plan, three broad sectors – Infrastructure, Natural Resources
Management and Services, encompassing 18 sub-‐sectors, are covered10. Guidelines based on socio-‐environmentally vulnerability assessment are in place. Implementation of these guidelines will
require a multi-‐disciplinary approach.
State of Environment Reporting The 2009 Assessment recommended that the periodic state of environment report (SOER) be expanded. Apart from addressing the environmental status issues, it should include a chapter on
institutional issues. It should also include: (i) information on the activities, outputs & outcomes achieved against pre-‐determined performance indicators and the priorities outlined for the future; and, (ii) the environmental sector’s contribution to the state’s GDP and the employment generation.
The last SOER was published in 2010. The next SOER is under preparation and planned for release in
2014; it includes a chapter on institutional actions, efforts and initiatives. This will include information on the activities, outputs and outcomes achieved against pre-‐determined performance indicators and the priorities outlined for the future, and the environment sector’s contribution to
the state’s GDP and employment generation.
10 Infrastructure includes – Road and transport, hydropower, tourism and ecotourism, industry, mining and geology, irrigation and public health, health, market infrastructure, rural and urban planning. Natural Resource Management includes – agriculture, horticulture, animal husbandry livestock, forest, wildlife and wetlands and fisheries. Services include – education and vocational training, IT and telecom, livelihoods, waste disposal.
Confidential Draft – Do Not Cite
HP Industry SEA Page 14 December 2013 (Draft 23/12/13)
Cumulative Impact Assessment It was recommended in the 2009 Assessment that DEST should identify specific geographical areas,
which are environmental problem areas. Essentially, these are areas where the cumulative effects have far exceeded the carrying capacity. In these problem areas, DEST should have in place enhanced monitoring and should focus on the containment of pollution. This enhanced monitoring
should include third-‐party involvement, preferably community monitoring or through community committees.
This is being implemented in relation to the key environmental issue in the state, i.e. river basin management. To determine the specific environmental problems and carrying capacity constraints,
cumulative impact assessments have been mandated and are underway in each of the river basins.
Extended Responsibility of Polluter The 2009 Assessment recommended that compliance penalties went beyond closures to making the polluter responsible for rectifying the pollution created, i.e. the polluter-‐internalizes principle. The
polluter must pay to rectify or clean up the negative outcomes of pollution. To date there has been no initiative taken in this regard, and no situations have arisen for the state to implement such compliance penalties.
Work Quality
The 2009 Assessment recommended the creation of additional special purpose vehicles / societies under DEST to strengthen and improve the quality of work. As a Government department, DEST is always under pressure to meet the day-‐to-‐day needs of the Government. However, this does not
promote a mindset for executing other Government responsibilities that require focused attention and commitment over a prolonged period of time. Special purpose vehicles or societies can address
this by providing financial resources as well as good technical assistance through collaborative partnerships with expert organizations. The day-‐to-‐day activities and management of these new organizations should be independent of the DEST but leverage on their linkages with DEST and the
GoHP to implement state-‐of-‐the art activities. In 2009 there were two special purpose vehicles under the DEST functioning at a limited scale. It was recommended that DEST expand the work of these special purpose vehicles to include new areas such as climate change. The mandate of these
new organizations should be large and be modeled based on the best-‐in-‐class organizations globally. Possible organizations along with their mandates for consideration cited in the 2009 Assessment were: (a) HP Environmental Assets Development Corporation – land availability and development for
environmental enhancements; (b) HP Climate Change Institute – adaptation and mitigation; (c) HP Environmental Management Institute – proactive facilitation, training and demonstration projects in Industry, Urban and Construction sectors; and, (d) HP Environmental Information & Awareness
Institute – a single-‐window information clearinghouse on environmental issues and promoting awareness on a regular basis in all sections of society.
Creation of special purpose vehicles is the approach adopted by the DEST since 2009. Two specific examples are the HP Climate Change Centre and the Aryabhatta Geo-‐Informatics Space Application
Centre (AGiSAC). Both these organizations have been established by the DEST through the State Council for Science & Technology.

Confidential Draft – Do Not Cite
HP Industry SEA Page 15 December 2013 (Draft 23/12/13)
Payment for Ecosystem Services (PES) The 2009 Assessment recommended that DEST initiate a feasibility analysis on raising additional
financial resources for environmental management in HP. DEST should be proactive in raising funds from bilateral and multilateral sources, as well as from innovative mechanisms such as carbon-‐linked revenue sources and payment for ecosystem services (PES). Financial resources should be used to
conserve the environmental assets of the state and mitigate the environmental impacts of developmental activities.
Currently, a PES initiative is being developed as a part of the DPL. A cross-‐department team of technical experts from the Forest Department has worked to produce an assessment of water
regulation and soil retention services of forests for hydropower generation. Also, the GoHP piloted a Payment for Environmental Services (PES) scheme in Palampur and provided for PES in the current Catchment Area Treatment Plan Implementation Guidelines, which includes a provision for PES. A
GoHP policy on PES was notified in November 201311. Among its objectives, the notification calls for a sustained flow of ecosystem services, and enabling experimentation and pilots that inform and refine ecosystem service approaches; incentives are linked to the sustained flow of ecosystem
services. Immediate priority elements of the PES program include quantification of ecosystem service flows; (ii) stakeholder identification; (iii) stakeholder engagement; (iv) determination of institutional arrangements; (v) determination of types and levels of payments; and,
(vi) incorporating the ecosystem approach into decision-‐making.
Public Feedback The 2009 Assessment recommended that DEST evolve as one of the departments that act as a conduit for public opinion and feedback to the GOHP. To begin with, DEST should have a division
that specializes in seeking public and stakeholder opinion in relation to various initiatives (e.g. DEST work or major public investments). This division should network with key non-‐governmental
organizations and community groups across various districts in the state. Through this network, this division should be capable of obtaining public and stakeholder opinion and feedback as required, and to communicate this to the GoHP. DEST should also maintain excellent documentation,
preferably electronic and web-‐based, and should operationalize a transparent form of governance.
There have been no follow-‐up initiatives pertaining to this recommendation. However, work under the DPL II on public disclosure should improve the documentation of information and data and facilitate communications between stakeholders.
DEST Structure – Functions
The 2009 Assessment recommended that DEST’s environment division be organized along functional lines. The three main functions are policy, advisory and co-‐ordination. The Business of GoHP (Allocation) Rules, 1971 for the DEST Environment Division covers all these activities. However, when
these rules were to be next revised, the 2009 Assessment found that it would be preferable to structure it as per the above functions. In addition, the 2009 Assessment asserted that DEST Environment Division needed an internal systems and procedural manual that outlined work flow
and work prioritization.
11 Government of Himachal Pradesh Department of Forests. Notification number FFE-‐B-‐C (15)-‐3/2005-‐11. 2 November 2013.

Confidential Draft – Do Not Cite
HP Industry SEA Page 16 December 2013 (Draft 23/12/13)
Finally, the 2009 Assessment recommended retaining a healthy balance among different functions. For instance, the DEST Environment Division should not solely focus on the regulatory functions and
become a “policing” department, but work with the other line departments to resolve environmental issues proactively through its Advisory and Co-‐ordination functions. It should not degenerate to only providing clearances, monitoring environmental compliance and participating in
litigations on behalf of the State Government.
The functions-‐based organizational restructuring of the DEST Environment Division was considered but was not implemented, as it was not viewed as a priority. As restructuring did not happen, there was also no direct initiative to create a “balanced” structure. However, the roles, responsibilities and
authorities of each position in DEST have been clearly laid out since 2009 and there are no implementation overlaps.
DEST Structure – Staffing The 2009 Assessment recommended that DEST create limited staff positions initially, and that DEST
adopt a needs-‐based growth informed by periodic performance effectiveness reviews. At the outset, one Division leader and two staff for each function were recommended.
Also, the 2009 Assessment recommended that dual staff positions be avoided, given the workload for the proposed positions in the DEST Environment Division. For instance, the activities started
under the Society for Environment Protection and Sustainable Development should be managed by separate staff and should not become a part-‐time activity of the staff of the DEST Environment Division. Strict avoidance of dual roles has two benefits: (i) full attention of the appointed staff on
the management aspects of the three functions; and, (ii) more individuals are involved in addressing the growing environmental problems and issues confronting the state. If the same individuals are
involved in more than one role, then there are two concerns: (i) conflict of interest situations; and, (ii) fewer people involved in addressing environmental problems and issues, when the involvement of a larger number of core people is required.
In 2010, 9 entry-‐level positions were created (in addition to the Director, PSO, SSO-‐Planning and
Environment Engineer positions). Of these 9 positions, 5 appointments have been made. For the remaining 4 positions, DEST is still seeking the right candidate. The creation of middle-‐level positions was not approved. Also, dual roles involving day-‐to-‐day functions no longer exist. Certain
supervisory responsibilities continue, e.g. Director, DEST is also the Member-‐Secretary of the State Council of Science & Technology. This is found to be necessary to ensure co-‐ordination.
DEST Structure – Role Attribution The 2009 Assessment recommended that the DEST Environment Division focus on the management
aspects of the three functions: policy, advisory and co-‐ordination. Hence information and awareness and research & development functions should continue with the State Council for Science & Technology. In addition, DEST Environment Division should only have oversight of the Society for
Environment Protection and Sustainable Development, which engages in consulting type activities beyond the proposed mandate of the DEST Environment Division.
In line with these recommendations a clear distinction of roles has been in place since 2009. The State Council for Science & Technology handles scientific research activities and is under the Joint
Member-‐Secretary who manages it independently. There is no overlap in implementation with the
Confidential Draft – Do Not Cite
HP Industry SEA Page 17 December 2013 (Draft 23/12/13)
DEST Environment Division. The same is the case with the Society for Environment Protection and Sustainable Development, which engages in monitoring and third party evaluation activities. The
Society has 6 positions (3 are in place currently) and their activities are independent of DEST. The Climate Change Centre and AGiSAC, are also independent of the DEST.
DEST Structure – Implementation Activities The 2009 Assessment recommended that DEST Environment Division should not become involved in
implementation. Specifically, it should not directly administer GOI schemes on environmental issues or take up the actual execution and implementation of any initiatives. This would allow it to focus on its policy, advisory and co-‐ordination functions.
Implementation activities are no longer being done by the DEST. All its activities pertain to policy,
advisory and co-‐ordination functions.
DEST Structure – New Organizations The 2009 Assessment recommended the aggressive creation of new organizations. DEST Environment Division had already taken the first step in creating a Society for Environment
Protection and Sustainable Development to carry out initiatives that assist in the implementation of environmental management plans and related actions. Other suggestions included: (a) HP Environmental Assets Development Corporation – land availability and development for
environmental enhancements, (b) HP Climate Change Institute – adaptation and mitigation, (c) HP Environmental Management Institute – Focus proactive facilitation, training and demonstration projects in Industry, Urban and Construction sectors; and, (d) HP Environmental Information &
Awareness Institute – an information clearinghouse. It was recommended that DEST should deliberate on which of these organizations were a priority and initiate necessary action. It was
regarded as vitally important to have and build more technical manpower resources to address the growing environmental concerns. The DEST Environment Division – Co-‐ordination function should be given the responsibility for creating and establishing these new organizations.
This recommendation has been addressed through the establishment of four functioning
organizations, i.e. the Climate Change Centre, the Biodiversity Board, AGiSAC and the Society for Environment Protection and Sustainable Development.
Closing Remark – From Himachal Pradesh This closing remark regarding institutional capacity and aspirations is provided by an active
participant in the consultations in Himachal Pradesh. According to Dr SS Negi (Director, Environment – DEST), the current structures and regulations are not enough to control pollution and there is a
need to incentivize and change behavior. There is a limit to strict regulatory (Command and Control) approaches, as it is not possible to monitor all sites all of the time. The Department of Environment, Science and Technology is therefore looking for ‘the next level’ of pollution control management.

Confidential Draft – Do Not Cite
HP Industry SEA Page 18 December 2013 (Draft 23/12/13)
§3 Pollution Hotspots & Priority Polluting Industries
Introduction “Air polluting industries should not be allowed to be set up in the future at Baddi industrial area, Parwanoo industrial area, Kala Amb industrial area, and Gondpur industrial area (Paonta Sahib).”
– HP Pollution Control Board, Annual Report, 2010/11, p28.
Any prioritization exercise starts by necessity with basic information of what, where, how much and
by whom. In the context of this SEA, this essentially and ideally involves an inventory of all industries, their location, their scale, and their pollution loads associated with air, water and hazardous waste pollution. Such detail is at this stage scarce, and in any event changes quickly in an
environment of rapid and diversified growth. One advantage of a rapidly growing industrial sector is that the inclusion of best available technology at the design stage can often address both economic efficiency and environmental sustainability. This is most notable with greenhouse gas (GHG)
emissions: such emissions are highly dependent on energy usage and the adoption of energy conservation technologies in process design, motor specifications, and building design can have significant impacts on energy savings and GHG footprints. The approach of the SEA is therefore to
use best available information using local data (relating to scale, location, and industrial mix) as well as national and regional level information for informing the types of pollutants and their impacts (see Annex C for selected summary tables, for example, of pollutants).
This Chapter commences with looking at industrial growth trends in HP, then considers the
“hotspots” geographically where such growth is expected to be most pronounced. Priority industries are then considered within the historical context of “Thrust” and “Negative List” industries, which formed the basis for incentivizing certain activities. From these industries, stakeholders in HP
assisted in the selection of three priority sectors, which are dealt with in greater detail through case studies (Chapters 7–10). Also, the prioritization exercise resulted in a decision that the DPL trigger should be associated with an economic incentive scheme applied to micro-‐, small-‐ and medium-‐scale
enterprises (Chapter 6): these smaller scale operations are among the most difficult to bring into compliance with modern environmental norms yet are also among the most polluting. Finally, the chapter provides a look at the sector’s contribution to GHGs, acknowledging that GHG regulation is
not a direct priority (and responsibility) at the State level.
Industrial Profile of HP Efforts to develop industry in Himachal Pradesh started in the 1980s. Up until that time, there was
little industrial activity apart from the Mohan Meakins Brewery (Solan district) and Nahan Foundry (Sirmour district), and cottage industries employing traditional skills. Industrial development in the state had been hampered by lack of access to markets, poor transportation and communication
infrastructure, shortage of capital and skills, and mineral resources of limited commercial interest.
Since the late 1990s, industry in HP has accelerated due to the development of infrastructure and the provision of economic incentives from both the state and central governments. Industrial sector growth was particularly high after 2003 when the GOI Special Industrial Policy for HP was introduced
The Special Policy, which provided a number of incentives to industry in HP, was expected to run for a 10-‐year period to 2013, but it was ended in March 2010. However, the State government continues to provide many incentives to industries through its own policy.
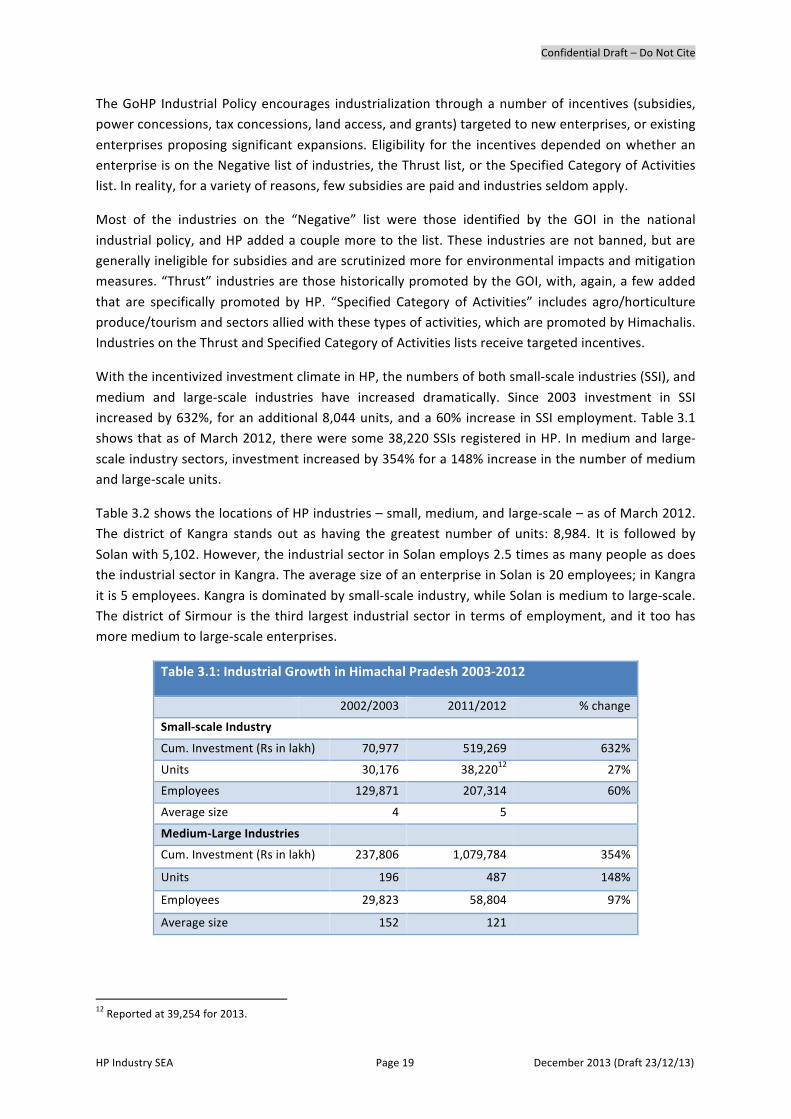
Confidential Draft – Do Not Cite
HP Industry SEA Page 19 December 2013 (Draft 23/12/13)
The GoHP Industrial Policy encourages industrialization through a number of incentives (subsidies, power concessions, tax concessions, land access, and grants) targeted to new enterprises, or existing
enterprises proposing significant expansions. Eligibility for the incentives depended on whether an enterprise is on the Negative list of industries, the Thrust list, or the Specified Category of Activities list. In reality, for a variety of reasons, few subsidies are paid and industries seldom apply.
Most of the industries on the “Negative” list were those identified by the GOI in the national
industrial policy, and HP added a couple more to the list. These industries are not banned, but are generally ineligible for subsidies and are scrutinized more for environmental impacts and mitigation measures. “Thrust” industries are those historically promoted by the GOI, with, again, a few added
that are specifically promoted by HP. “Specified Category of Activities” includes agro/horticulture produce/tourism and sectors allied with these types of activities, which are promoted by Himachalis. Industries on the Thrust and Specified Category of Activities lists receive targeted incentives.
With the incentivized investment climate in HP, the numbers of both small-‐scale industries (SSI), and
medium and large-‐scale industries have increased dramatically. Since 2003 investment in SSI increased by 632%, for an additional 8,044 units, and a 60% increase in SSI employment. Table 3.1 shows that as of March 2012, there were some 38,220 SSIs registered in HP. In medium and large-‐
scale industry sectors, investment increased by 354% for a 148% increase in the number of medium and large-‐scale units.
Table 3.2 shows the locations of HP industries – small, medium, and large-‐scale – as of March 2012. The district of Kangra stands out as having the greatest number of units: 8,984. It is followed by
Solan with 5,102. However, the industrial sector in Solan employs 2.5 times as many people as does the industrial sector in Kangra. The average size of an enterprise in Solan is 20 employees; in Kangra
it is 5 employees. Kangra is dominated by small-‐scale industry, while Solan is medium to large-‐scale. The district of Sirmour is the third largest industrial sector in terms of employment, and it too has more medium to large-‐scale enterprises.
Table 3.1: Industrial Growth in Himachal Pradesh 2003-‐2012
2002/2003 2011/2012 % change
Small-‐scale Industry
Cum. Investment (Rs in lakh) 70,977 519,269 632%
Units 30,176 38,22012 27%
Employees 129,871 207,314 60%
Average size 4 5
Medium-‐Large Industries
Cum. Investment (Rs in lakh) 237,806 1,079,784 354%
Units 196 487 148%
Employees 29,823 58,804 97%
Average size 152 121
12 Reported at 39,254 for 2013.
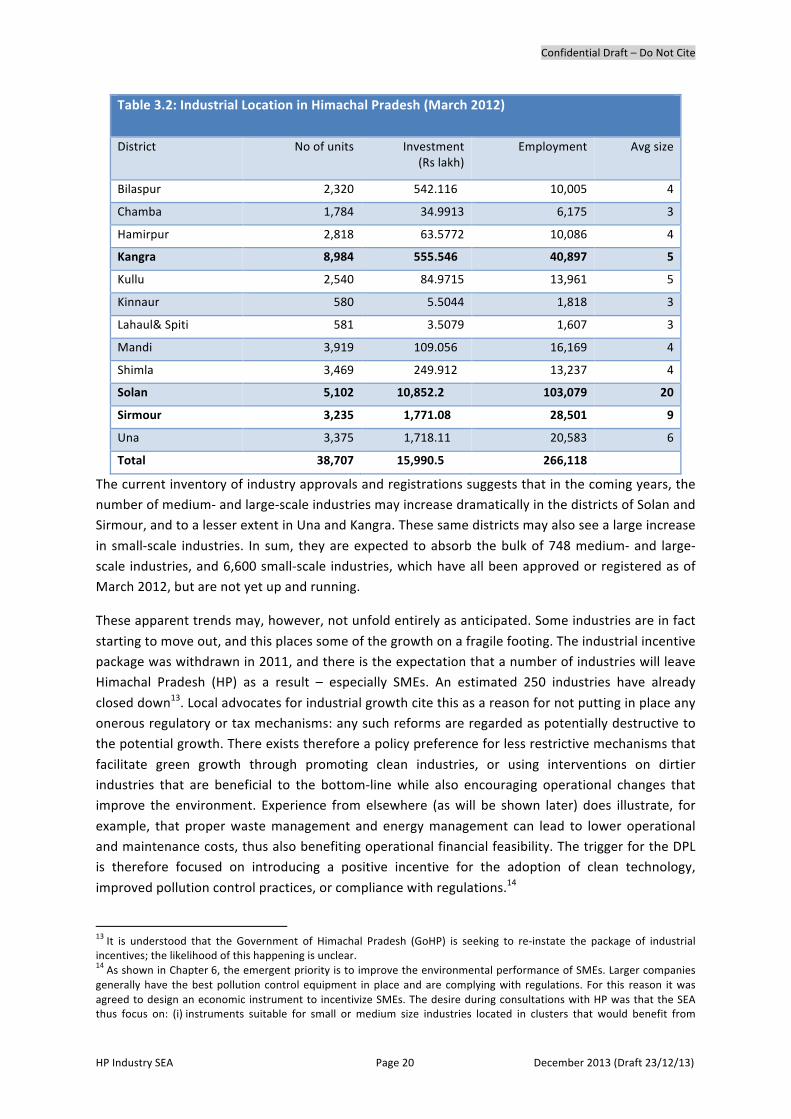
Confidential Draft – Do Not Cite
HP Industry SEA Page 20 December 2013 (Draft 23/12/13)
Table 3.2: Industrial Location in Himachal Pradesh (March 2012)
District No of units Investment (Rs lakh)
Employment Avg size
Bilaspur 2,320 542.116 10,005 4
Chamba 1,784 34.9913 6,175 3
Hamirpur 2,818 63.5772 10,086 4
Kangra 8,984 555.546 40,897 5
Kullu 2,540 84.9715 13,961 5
Kinnaur 580 5.5044 1,818 3
Lahaul& Spiti 581 3.5079 1,607 3
Mandi 3,919 109.056 16,169 4
Shimla 3,469 249.912 13,237 4
Solan 5,102 10,852.2 103,079 20
Sirmour 3,235 1,771.08 28,501 9
Una 3,375 1,718.11 20,583 6
Total 38,707 15,990.5 266,118
The current inventory of industry approvals and registrations suggests that in the coming years, the number of medium-‐ and large-‐scale industries may increase dramatically in the districts of Solan and Sirmour, and to a lesser extent in Una and Kangra. These same districts may also see a large increase
in small-‐scale industries. In sum, they are expected to absorb the bulk of 748 medium-‐ and large-‐scale industries, and 6,600 small-‐scale industries, which have all been approved or registered as of March 2012, but are not yet up and running.
These apparent trends may, however, not unfold entirely as anticipated. Some industries are in fact
starting to move out, and this places some of the growth on a fragile footing. The industrial incentive package was withdrawn in 2011, and there is the expectation that a number of industries will leave Himachal Pradesh (HP) as a result – especially SMEs. An estimated 250 industries have already
closed down13. Local advocates for industrial growth cite this as a reason for not putting in place any onerous regulatory or tax mechanisms: any such reforms are regarded as potentially destructive to the potential growth. There exists therefore a policy preference for less restrictive mechanisms that
facilitate green growth through promoting clean industries, or using interventions on dirtier industries that are beneficial to the bottom-‐line while also encouraging operational changes that improve the environment. Experience from elsewhere (as will be shown later) does illustrate, for
example, that proper waste management and energy management can lead to lower operational and maintenance costs, thus also benefiting operational financial feasibility. The trigger for the DPL is therefore focused on introducing a positive incentive for the adoption of clean technology,
improved pollution control practices, or compliance with regulations.14
13 It is understood that the Government of Himachal Pradesh (GoHP) is seeking to re-‐instate the package of industrial incentives; the likelihood of this happening is unclear. 14 As shown in Chapter 6, the emergent priority is to improve the environmental performance of SMEs. Larger companies generally have the best pollution control equipment in place and are complying with regulations. For this reason it was agreed to design an economic instrument to incentivize SMEs. The desire during consultations with HP was that the SEA thus focus on: (i) instruments suitable for small or medium size industries located in clusters that would benefit from
Confidential Draft – Do Not Cite
HP Industry SEA Page 21 December 2013 (Draft 23/12/13)
Hotspots Solan district has the largest industrial sector in HP, and industry approvals for Solan indicate that it will maintain that status. Forty-‐five percent of the total approvals since 2003, for all industries regardless of size, are for Solan district. Its rapid industrial growth is responsible for reports of high
levels of pollution.
The industrial sector of Solan district is concentrated in two general areas: (i) a belt that runs along the south-‐south-‐east border of HP with Haryana, from Parwanoo in the south to Nalagarh in the north; and, (ii) another area that runs north-‐east from Parwanoo towards Solan city, the capital of
the district.
Both Parwanoo and Baddi-‐Barotiwala-‐Nalagarh (BBN) are fast-‐growing industrial areas. Eighty percent of Parwanoo’s population is engaged in industry. Located on National Highway 22, it borders Panchkula in Haryana district, and has good connections to both Chandigarh and Solan. BBN, to the
northwest of Parwanoo, is considered Asia’s largest pharmaceutical hub. Baddi has adequate power resources, but it lacks infrastructure and efficient interstate connectivity. Its fast industrial growth has drawn a large migrant labor force, but chaotic development has resulted in a shortage of
housing, hospitals, and roads. There are plans for a Chandigarh-‐Baddi rail link, but its construction is reportedly stalled.
The Parwanoo industrial estates, and the BBN industrial belt, are well known to be areas suffering from air pollution. Air pollution of PM10 is reported to be at “critically high” levels for both
Parwanoo and Baddi, while Nalagarh is reported to be at a “high” level of PM10.15 These findings are consistent with anecdotal reports from local citizens and health professionals that complain of toxic fumes and increasing incidents of respiratory aliments. Industrial fires have become frequent in
Parwanoo. Care must be taken in attributing the PM10 levels all to industry: some is attributable to the transport sector due to vehicle emissions or suspension of particulates due to unpaved roads.
Both are also known to have stretches of severe water pollution. The HP State of Environment Report (SOER: check and provide table reference) 2007 indicates that overall water quality is very
poor in the Solan district industrial areas (Parwanoo to Nalagarh and Parwanoo to Solan city). The Central Pollution Control Board (CPCB) found that areas of the Sirsa River are heavily polluted by industrial and domestic effluent from Baddi, Nalagarh and Barotiwala, and the quality of the
Sukhana River is very poor from both industrial and domestic effluent from Parwanoo.
Sirmour district currently ranks third in terms of industrial sector employment, and its industries, like those in the Solan district, tend to be on the medium to large scale. Also, like Solan district, a
large number of new industries have been approved for Sirmour, so the industrial growth in this district will continue to be very strong. The district’s industrial area is concentrated in the extreme south, in the border cities of Kala Amb and Paonta Sahib, both of which are known to have high
levels of pollution.
common treatment facilities; and (ii) economic instruments suitable for isolated small and medium size industries for whom it is not economical or technically feasible to connect to common treatment facilities. 15 Global Burden of Disease Workshop. Presentation by CSE 13 February 2013. Gulmohar Hall, India Habitat Centre, New Delhi; CPCB (2009); and HP SPCB. State of the Environment.
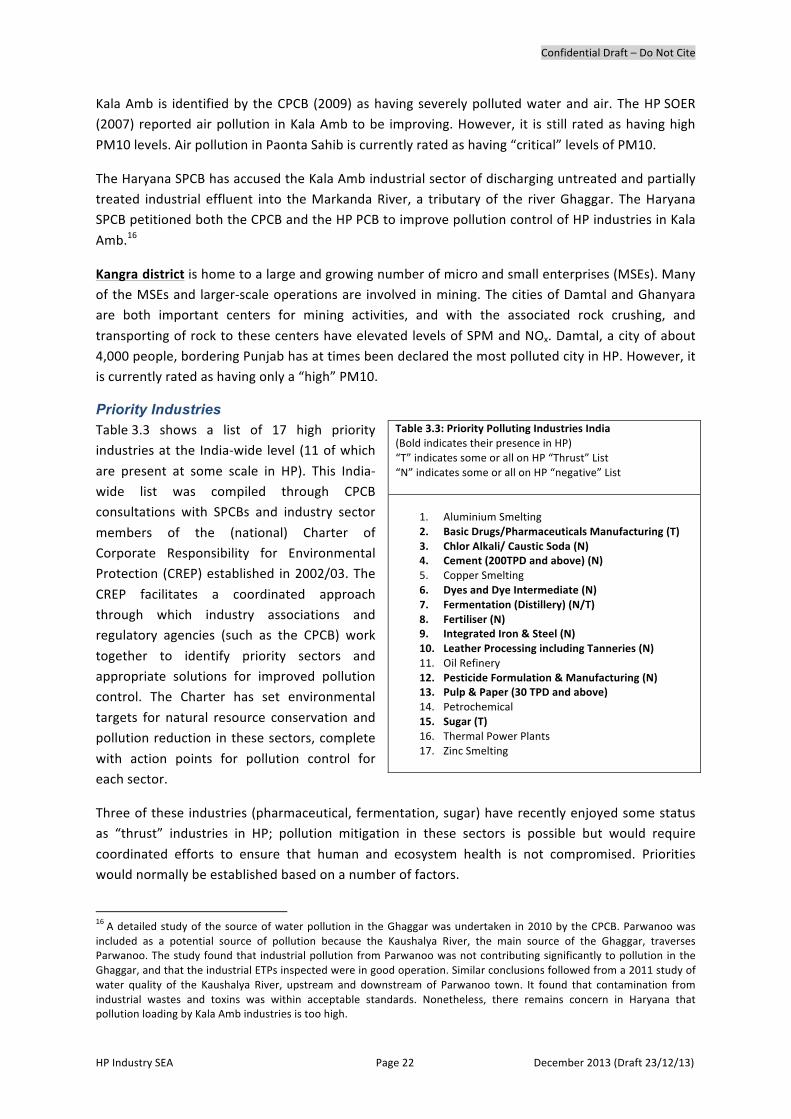
Confidential Draft – Do Not Cite
HP Industry SEA Page 22 December 2013 (Draft 23/12/13)
Kala Amb is identified by the CPCB (2009) as having severely polluted water and air. The HP SOER (2007) reported air pollution in Kala Amb to be improving. However, it is still rated as having high
PM10 levels. Air pollution in Paonta Sahib is currently rated as having “critical” levels of PM10.
The Haryana SPCB has accused the Kala Amb industrial sector of discharging untreated and partially treated industrial effluent into the Markanda River, a tributary of the river Ghaggar. The Haryana SPCB petitioned both the CPCB and the HP PCB to improve pollution control of HP industries in Kala
Amb.16
Kangra district is home to a large and growing number of micro and small enterprises (MSEs). Many of the MSEs and larger-‐scale operations are involved in mining. The cities of Damtal and Ghanyara are both important centers for mining activities, and with the associated rock crushing, and
transporting of rock to these centers have elevated levels of SPM and NOx. Damtal, a city of about 4,000 people, bordering Punjab has at times been declared the most polluted city in HP. However, it is currently rated as having only a “high” PM10.
Priority Industries Table 3.3 shows a list of 17 high priority industries at the India-‐wide level (11 of which
are present at some scale in HP). This India-‐wide list was compiled through CPCB consultations with SPCBs and industry sector
members of the (national) Charter of Corporate Responsibility for Environmental Protection (CREP) established in 2002/03. The
CREP facilitates a coordinated approach through which industry associations and regulatory agencies (such as the CPCB) work
together to identify priority sectors and appropriate solutions for improved pollution control. The Charter has set environmental
targets for natural resource conservation and pollution reduction in these sectors, complete
with action points for pollution control for each sector.
Three of these industries (pharmaceutical, fermentation, sugar) have recently enjoyed some status as “thrust” industries in HP; pollution mitigation in these sectors is possible but would require
coordinated efforts to ensure that human and ecosystem health is not compromised. Priorities would normally be established based on a number of factors.
16 A detailed study of the source of water pollution in the Ghaggar was undertaken in 2010 by the CPCB. Parwanoo was included as a potential source of pollution because the Kaushalya River, the main source of the Ghaggar, traverses Parwanoo. The study found that industrial pollution from Parwanoo was not contributing significantly to pollution in the Ghaggar, and that the industrial ETPs inspected were in good operation. Similar conclusions followed from a 2011 study of water quality of the Kaushalya River, upstream and downstream of Parwanoo town. It found that contamination from industrial wastes and toxins was within acceptable standards. Nonetheless, there remains concern in Haryana that pollution loading by Kala Amb industries is too high.
Table 3.3: Priority Polluting Industries India (Bold indicates their presence in HP) “T” indicates some or all on HP “Thrust” List “N” indicates some or all on HP “negative” List
1. Aluminium Smelting 2. Basic Drugs/Pharmaceuticals Manufacturing (T) 3. Chlor Alkali/ Caustic Soda (N) 4. Cement (200TPD and above) (N) 5. Copper Smelting 6. Dyes and Dye Intermediate (N) 7. Fermentation (Distillery) (N/T) 8. Fertiliser (N) 9. Integrated Iron & Steel (N) 10. Leather Processing including Tanneries (N) 11. Oil Refinery 12. Pesticide Formulation & Manufacturing (N) 13. Pulp & Paper (30 TPD and above) 14. Petrochemical 15. Sugar (T) 16. Thermal Power Plants 17. Zinc Smelting
Confidential Draft – Do Not Cite
HP Industry SEA Page 23 December 2013 (Draft 23/12/13)
Briefly, these factors would include:
• Current level of industrial activity without full mitigation.
• Scale of potential growth from the given industry.
• Significance of impacts of pollutants from the source, if they are released into the environment.
• Potential for reducing releases through applying best available or best practicable technology.
• Net costs of abatement.
Each of these can be applied on the basis of detailed inventory data and knowledge of the industry.
For example, Table 3.3 shows just the presence of selected industries in Himachal Pradesh (see greater detail in the assessment in Annex C). But the cement industry would rank as a high priority because it is also expected to see ongoing growth from industrial demand throughout India and it
has significant health impacts from air-‐borne pollutants; experience elsewhere, however, has shown that relatively low cost methods can be used through electrostatic precipitators, for example, to reduce substantially the air pollution. Moreover, proper land-‐use planning can reduce the mitigation
costs even more. Market-‐based incentives can also play a role in such circumstances.
Whether industries are part of a “Thrust” list or a “Negative” list (Annex C) would also have a bearing on the priorities: the “Thrust” industries are expected to have strong future growth while those in the “Negative” list are (presumably) associated with more significant impacts. Sugar industry, for
example, is currently present, is regarded as a high potential polluter nationally, and is treated historically as a Thrust industry in HP. Also, as previously noted, pharmaceuticals are also historically a Thrust industry. It is important to note that some Negative list industries may still see substantial
growth; they simply do not qualify for the same levels of incentives and subsidies enjoyed by the Thrust industries. Also, industries not currently present in HP may at one point be developed: there are unexploited copper deposits in Kangra District for example.
Data gaps are primarily associated with ensuring that an up-‐to date inventory of firms is available,
and secondly that the degree of unmitigated pollution from these industries is known. At this point, it is also important to highlight that some industries appear on the Thrust list and normally have very low environmental footprints. Ecotourism is an obvious case in point, but selected biotech and
nanotech initiatives would also fall into these categories. In effect, such industries can add value in the economic supply chain while also contributing positively to overall environmental quality. HP officials are open to this idea: a Biotechnology Park has been proposed (March 2013) by
Government to be set up at Nalagarh (Solan District).17 Also, a Nanotechnology Park has been proposed on a 400-‐acre site near the Biotechnology Park at Aduwal near Nalagarh.
The following high priority sectors were identified by the Department of Industry and the State Pollution Control Board: Pharmaceuticals, Mini Steel Plants, Small cement plants, Stone crushing and
food processing. Their numbers and location are summarized in Table 3.4. Of these, pharmaceuticals, stone crushing and food processing plants were selected for detailed study within the SEA (Chapters 7–10).
17 India Brand Equity Foundation. 2013 (March). Himachal Pradesh – The Abode of Gods. [PowerPoint presentation, accessed April 2013, http://www.ibef.org/download/Himachal-‐Pradesh-‐110313.pdf] 57pp.
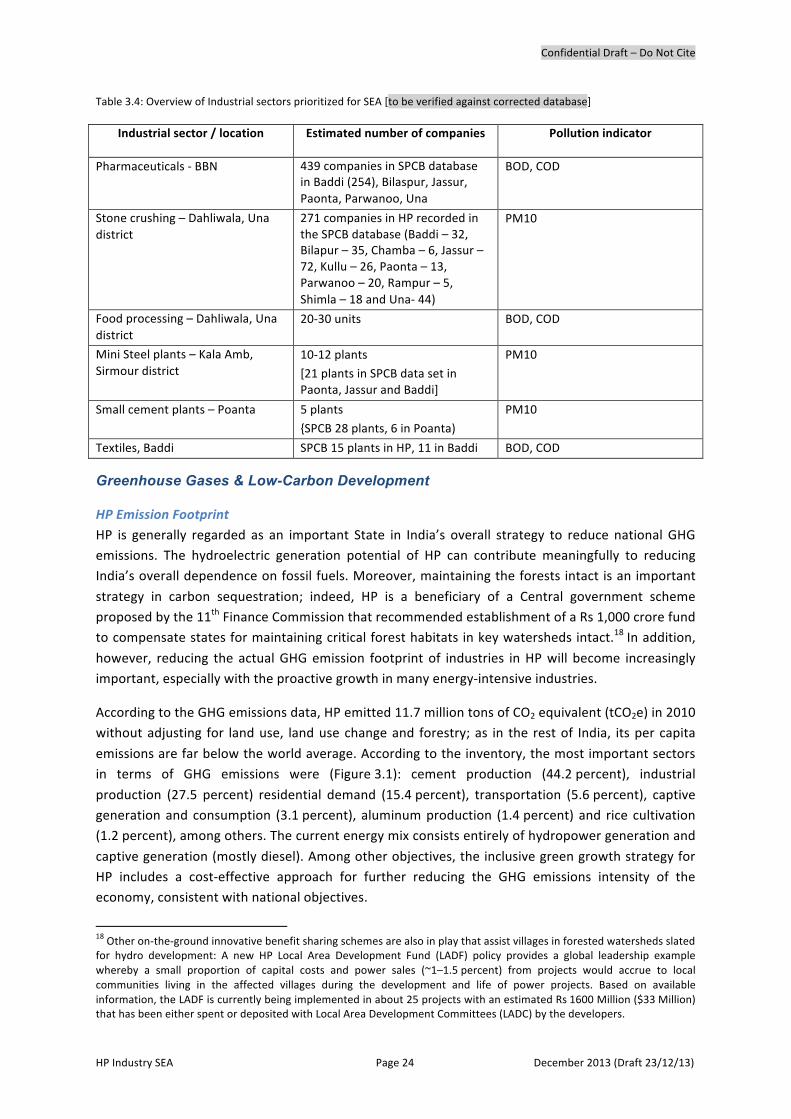
Confidential Draft – Do Not Cite
HP Industry SEA Page 24 December 2013 (Draft 23/12/13)
Table 3.4: Overview of Industrial sectors prioritized for SEA [to be verified against corrected database]
Industrial sector / location Estimated number of companies Pollution indicator
Pharmaceuticals -‐ BBN 439 companies in SPCB database in Baddi (254), Bilaspur, Jassur, Paonta, Parwanoo, Una
BOD, COD
Stone crushing – Dahliwala, Una district
271 companies in HP recorded in the SPCB database (Baddi – 32, Bilapur – 35, Chamba – 6, Jassur – 72, Kullu – 26, Paonta – 13, Parwanoo – 20, Rampur – 5, Shimla – 18 and Una-‐ 44)
PM10
Food processing – Dahliwala, Una district
20-‐30 units BOD, COD
Mini Steel plants – Kala Amb, Sirmour district
10-‐12 plants
[21 plants in SPCB data set in Paonta, Jassur and Baddi]
PM10
Small cement plants – Poanta 5 plants
{SPCB 28 plants, 6 in Poanta)
PM10
Textiles, Baddi SPCB 15 plants in HP, 11 in Baddi BOD, COD
Greenhouse Gases & Low-Carbon Development
HP Emission Footprint HP is generally regarded as an important State in India’s overall strategy to reduce national GHG emissions. The hydroelectric generation potential of HP can contribute meaningfully to reducing India’s overall dependence on fossil fuels. Moreover, maintaining the forests intact is an important
strategy in carbon sequestration; indeed, HP is a beneficiary of a Central government scheme proposed by the 11th Finance Commission that recommended establishment of a Rs 1,000 crore fund to compensate states for maintaining critical forest habitats in key watersheds intact.18 In addition,
however, reducing the actual GHG emission footprint of industries in HP will become increasingly important, especially with the proactive growth in many energy-‐intensive industries.
According to the GHG emissions data, HP emitted 11.7 million tons of CO2 equivalent (tCO2e) in 2010 without adjusting for land use, land use change and forestry; as in the rest of India, its per capita
emissions are far below the world average. According to the inventory, the most important sectors in terms of GHG emissions were (Figure 3.1): cement production (44.2 percent), industrial
production (27.5 percent) residential demand (15.4 percent), transportation (5.6 percent), captive generation and consumption (3.1 percent), aluminum production (1.4 percent) and rice cultivation (1.2 percent), among others. The current energy mix consists entirely of hydropower generation and
captive generation (mostly diesel). Among other objectives, the inclusive green growth strategy for HP includes a cost-‐effective approach for further reducing the GHG emissions intensity of the economy, consistent with national objectives.
18 Other on-‐the-‐ground innovative benefit sharing schemes are also in play that assist villages in forested watersheds slated for hydro development: A new HP Local Area Development Fund (LADF) policy provides a global leadership example whereby a small proportion of capital costs and power sales (~1–1.5 percent) from projects would accrue to local communities living in the affected villages during the development and life of power projects. Based on available information, the LADF is currently being implemented in about 25 projects with an estimated Rs 1600 Million ($33 Million) that has been either spent or deposited with Local Area Development Committees (LADC) by the developers.

Confidential Draft – Do Not Cite
HP Industry SEA Page 25 December 2013 (Draft 23/12/13)
Figure 3.1: Sectoral Contributions to GHG Emissions in Himachal Pradesh (2007 baseline)
International Experience
The OECD recently completed a global analysis of the efficiency with which energy is used in the manufacturing industry. It reveals how the adoption of advanced technologies already in commercial use could improve the performance of energy-‐intensive industries, especially in fast growing
economies such as Himachal Pradesh. It also shows how manufacturing industry as a whole could be made more efficient through systematic improvements to motor systems, including adjustable speed drives; and steam systems, including combined heat and power (CHP); and by recycling
materials. The findings demonstrate that potential technical energy savings of 25 to 37 exajoules per year are available globally based on proven technologies and best practices. This is equivalent to 600 to 900 million tonnes of oil equivalent per year. These substantial savings potentials can also
bring financial savings. Improved energy efficiency contributes positively to energy security and environmental protection and helps to achieve more sustainable economic development. The industrial CO2 emissions reduction potential amounts to 1.9 to 3.2 gigatonnes per year, about 7% to
12% of current global CO2 emissions.
The energy intensities of emerging and transition economies show a mixed picture. Where production has expanded rapidly in the absence of existing infrastructure, industry may be using new plant with the latest technology. For example, the world’s most efficient aluminum smelters are
in Africa and some of the most efficient cement kilns are in India. However, in some industries and regions where production levels have stalled or where technology has become locked into traditional methods, manufacturers have failed to upgrade to most efficient technology. For
example, older equipment remains dominant in parts of the Russian Federation and in Ukraine. Similarly, the widespread use of coal in China has reduced its overall energy efficiency, as coal is often a less efficient energy source than other fuels because of factors such as ash content and the
need for gasification. In China and India, there have been constraints to the adoption of new large scale processes because small-‐scale operations with relatively low efficiency continue to flourish, driven by transport constraints and local resource characteristics (e.g. poor coal and ore quality). The

Confidential Draft – Do Not Cite
HP Industry SEA Page 26 December 2013 (Draft 23/12/13)
use of low-‐grade coal with poor preparation is a major source of inefficiency in industrial processes in these countries. But with this situation as a starting point, they also harbor significant potential for
improvement through adopting globally available technologies that are already in use in other countries; industrial processes and products are more or less the same across the world. The general conclusion is that with proven technology manufacturing can improve its energy efficiency by 18% to
26%, while reducing the sector’s CO2 emissions by 19% to 32%.
To harness these efficiencies, the OECD recommends that in all countries, government and industry partnerships, incentives, and awareness programs should be pursued. New plants and the retrofit and refurbishment of existing industrial facilities should be encouraged. Small-‐scale manufacturing
plants using outdated processes, low quality fuel and feedstock, and weaknesses in transport infrastructure contribute to industrial inefficiency.
Motor and steam systems offer a large opportunity for energy savings, a potential that has remained largely unrealized worldwide. While the energy efficiency of individual components, such as motors
(85% – 96%) and boilers (80% – 85%) can be quite high, when viewed as an entire system, their overall efficiency is quite low. Motor systems lose on average approximately 55% of their input energy before reaching the process or end-‐use work. For steam systems, the losses are only slightly
better, with 45% of the input energy lost before the steam reaches point of use (USDOE, 2004)19. Some of these losses are inherent in the energy conversion process; for example, a compressor typically loses 80% of its input energy to low grade waste heat as the incoming air is converted from
atmospheric pressure to the desired system pressure. Other losses are due to system inefficiencies that can be avoided through the application of commercially available technology combined with good engineering practice. These improvements in energy efficiency of existing motor and steam
systems are cost-‐effective, with costs typically recovered in two years or less. As noted in the case studies in this SEA, a number of firms in HP have also started to implement such approaches in their
operations to improve their efficiency.
On a global basis, it is estimated that the energy efficiency of motor systems can be improved by 20% – 25% using commercially available technologies and steam systems can be improved by at least 10% (more if steam lines are initially uninsulated), as documented by program experiences in
the United States, United Kingdom and China.
At present, most markets and policy makers tend to focus on individual system components, such as motors or pumps, with an improvement potential of 2% – 5%, instead of optimizing systems. Equipment manufacturers have steadily improved the performance of individual system
components, e.g. motors, boilers, pumps and compressors, but these components only provide a service to the users’ production process when operating as part of a system. Even when new technologies emerge at the component level, such as a 94% efficient boiler currently under
development in the United States, their significant energy efficiency advantages can be negated by a poorly configured system. Terms such as “supply side efficiency” that seek to limit the definition of system energy efficiency to the compressor room, boiler room, or pump house are misleading in the
context of system optimization. There is little benefit in producing compressed air, steam, or pumped fluids efficiently only to oversupply plant requirements by a significant margin or to waste
19 United States Department of Energy. 2004. Energy Use, Loss, and Opportunities Analysis: Manufacturing and Mining, prepared by Energetics and E3M, Washington, DC. See also: http://www.eere.energy.gov/.

Confidential Draft – Do Not Cite
HP Industry SEA Page 27 December 2013 (Draft 23/12/13)
the energized medium through leaks or restrictions in the distribution system. System energy efficiency requires attention to the whole production scheme; otherwise the result is often failure to
realize a significant proportion of the energy savings potential. Improved energy system efficiency can also contribute to an industrial facility’s profitability at the same time as improving the reliability and control. Increased production through better use of equipment assets is frequently an
associated benefit. Maintenance costs also decline because better matching of equipment to demand results in less cycling of equipment operation, thus reducing wear. Optimizing the efficiency of steam systems may result in excess steam capacity that can be used for heating applications.
Payback periods for system optimization projects are typically short – from a few months to three years – and involve existing commercially available products and accepted engineering practices. Applying such system changes would have significant additional energy efficiency benefits in
Himachal Pradesh, but their adoption would be more rapid in a fast growing setting as they are more suitable for new plant construction that can optimize all processes.
Building Codes A final target for lowering GHG emissions and energy demand is in new commercial and industrial
buildings. Probably the most significant potential improvement in energy efficiency is that related to commercial buildings. Because of Himachal Pradesh’s rapid industrialization and expansion of its service sector, the energy efficiency improvements of buildings alone can contribute substantially to
the lowering of energy intensity in the region. Studies conducted elsewhere in Asia (du Pont, 2005) show that use of appropriate building codes for industry and commercial establishments can significantly reduce energy requirements, and thus associated GHG emissions. Analyses of the
potential energy efficiency showed an average annual energy use in the study sample of the order of 340 kWh per square meter, with the best buildings using 72% less energy than this average, and the
worst buildings using about 4 times as much as the average. Adoption of improved building codes improved energy intensity by as much as 30% over the long-‐term.20
20 The du Pont (2005) estimates were also based on earlier demand-‐side management and inventory work conducted by the International Institute for Energy Conservation (IIEC).
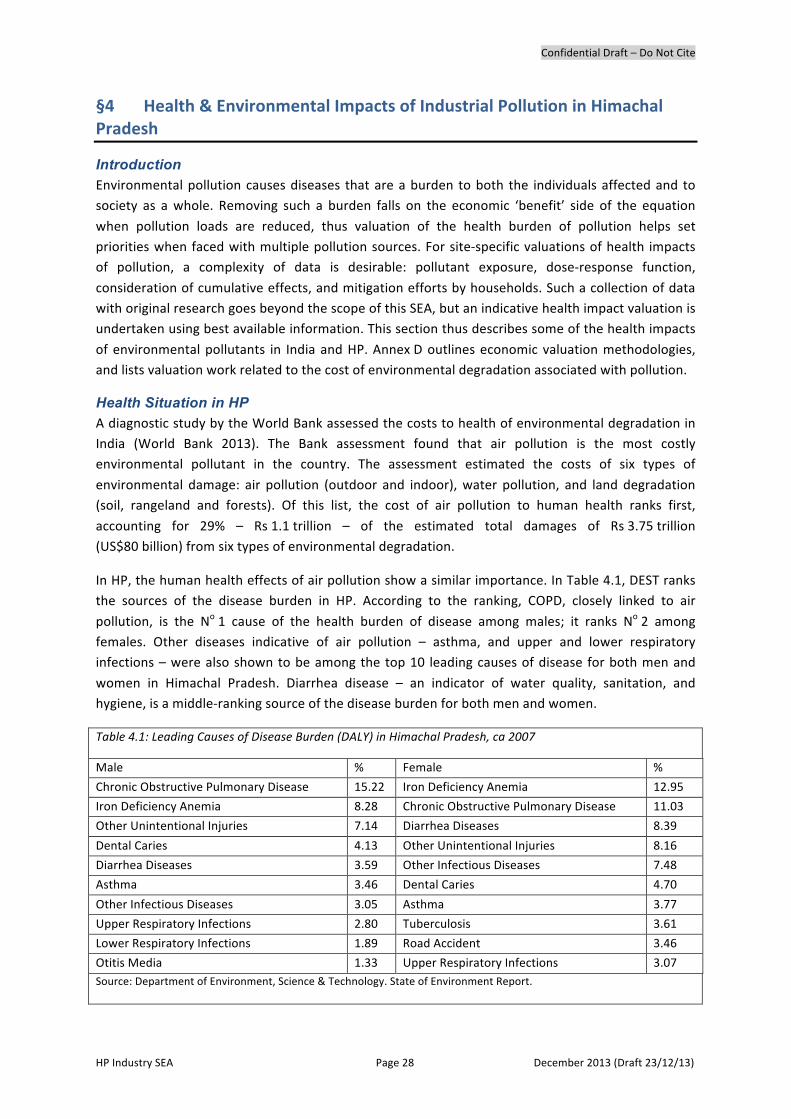
Confidential Draft – Do Not Cite
HP Industry SEA Page 28 December 2013 (Draft 23/12/13)
§4 Health & Environmental Impacts of Industrial Pollution in Himachal Pradesh
Introduction Environmental pollution causes diseases that are a burden to both the individuals affected and to society as a whole. Removing such a burden falls on the economic ‘benefit’ side of the equation
when pollution loads are reduced, thus valuation of the health burden of pollution helps set priorities when faced with multiple pollution sources. For site-‐specific valuations of health impacts of pollution, a complexity of data is desirable: pollutant exposure, dose-‐response function,
consideration of cumulative effects, and mitigation efforts by households. Such a collection of data with original research goes beyond the scope of this SEA, but an indicative health impact valuation is undertaken using best available information. This section thus describes some of the health impacts
of environmental pollutants in India and HP. Annex D outlines economic valuation methodologies, and lists valuation work related to the cost of environmental degradation associated with pollution.
Health Situation in HP A diagnostic study by the World Bank assessed the costs to health of environmental degradation in India (World Bank 2013). The Bank assessment found that air pollution is the most costly environmental pollutant in the country. The assessment estimated the costs of six types of
environmental damage: air pollution (outdoor and indoor), water pollution, and land degradation (soil, rangeland and forests). Of this list, the cost of air pollution to human health ranks first,
accounting for 29% – Rs 1.1 trillion – of the estimated total damages of Rs 3.75 trillion (US$80 billion) from six types of environmental degradation.
In HP, the human health effects of air pollution show a similar importance. In Table 4.1, DEST ranks the sources of the disease burden in HP. According to the ranking, COPD, closely linked to air
pollution, is the No 1 cause of the health burden of disease among males; it ranks No 2 among females. Other diseases indicative of air pollution – asthma, and upper and lower respiratory infections – were also shown to be among the top 10 leading causes of disease for both men and
women in Himachal Pradesh. Diarrhea disease – an indicator of water quality, sanitation, and hygiene, is a middle-‐ranking source of the disease burden for both men and women.
Table 4.1: Leading Causes of Disease Burden (DALY) in Himachal Pradesh, ca 2007
Male % Female %
Chronic Obstructive Pulmonary Disease 15.22 Iron Deficiency Anemia 12.95
Iron Deficiency Anemia 8.28 Chronic Obstructive Pulmonary Disease 11.03
Other Unintentional Injuries 7.14 Diarrhea Diseases 8.39
Dental Caries 4.13 Other Unintentional Injuries 8.16
Diarrhea Diseases 3.59 Other Infectious Diseases 7.48
Asthma 3.46 Dental Caries 4.70
Other Infectious Diseases 3.05 Asthma 3.77
Upper Respiratory Infections 2.80 Tuberculosis 3.61
Lower Respiratory Infections 1.89 Road Accident 3.46
Otitis Media 1.33 Upper Respiratory Infections 3.07 Source: Department of Environment, Science & Technology. State of Environment Report.
Confidential Draft – Do Not Cite
HP Industry SEA Page 29 December 2013 (Draft 23/12/13)
Valuation of Health & Environmental Impacts The economic cost of pollution can be valued using various methods. For example, the World Health Organization estimates country-‐specific DALYs (Disability Adjusted Life Years) which are years lost to death and illness because of diseases such as diarrhea, lower and upper respiratory infections, and
pulmonary obstruction, among others. Given the value of a lost year (per capita income), the DALYs permit a valuation of the human health effects attributable to environmental pollutants.
Other methods of economic valuation use survey work to determine the amount that people would be willing to pay to avoid exposure to pollution through, for example, the installation of pollution
abatement facilities. For example, Dasgupta (2004) found that the health cost of contaminated water to urban dwellers in Delhi was Rs 1094 per household in 1999; while the World Bank (2005) estimated that the cost of chronic bronchitis in Delhi was Rs 1.5 million per case.
In the absence of site-‐specific data and original research, economic valuation of environmental
goods and services often relies on “benefit transfer” methods. In these valuations, estimated values from research in regions/localities similar to the region/locality of interest, are “transferred”. The estimated values are typically adjusted for local conditions: population and household
characteristics, the number of reported cases of different health effects (cases of COPD, restricted activity, etc.), and other factors that may be important to valuation. Using benefit-‐transfer, the recent Bank assessment of the health cost of air and water pollution for India as a whole can be used
to provide an indication of the health cost of environmental degradation in Himachal Pradesh.
The Bank study calculated India-‐specific DALYs. DALYs are based on exposure to the pollutant and the concentration-‐ or dose-‐response. For air pollution, data from the CPCB on PM10 concentrations in Indian urban centers, and dose-‐response coefficients from the literature, allowed estimation of
the expected DALYs per health effect. Health effects include mortality and various forms of morbidity due to elevated PM10 concentrations. To assess DALYs for illness related to water pollution in India, the Bank study relied on national health and vital statistics, as well as international
experience and WHO estimates. Health effects include mortality and morbidity from diarrhea and typhoid in adults and children under five.
The DALYs permit an economic valuation because a DALY represents a lost year of productive time. Typically per capita income, adjusted to capture income differences among populations (urban
versus rural, employed versus unemployed) is applied to calculate the opportunity cost to society of the illness. The Bank study estimates assume an average wage rate of Rs 150 per day, which includes
an adjustment to capture the economic value to society of both income earning and non-‐income earning individuals.
Health Cost of Outdoor Air Pollution in HP Using parameters estimated in the World Bank (2013) India study, the health cost of outdoor air
pollution in HP was estimated for this report. As in the India study, the estimation focuses on the urban population, as it is the most exposed to above normal concentrations of PM10. For lack of HP-‐specific data on the incidence of different health effects from air pollution, the estimation assumes
that the percentage of DALYs from mortality and morbidity caused by air pollution in the Indian urban population is the same as that experienced in the urban population of Himachal Pradesh.
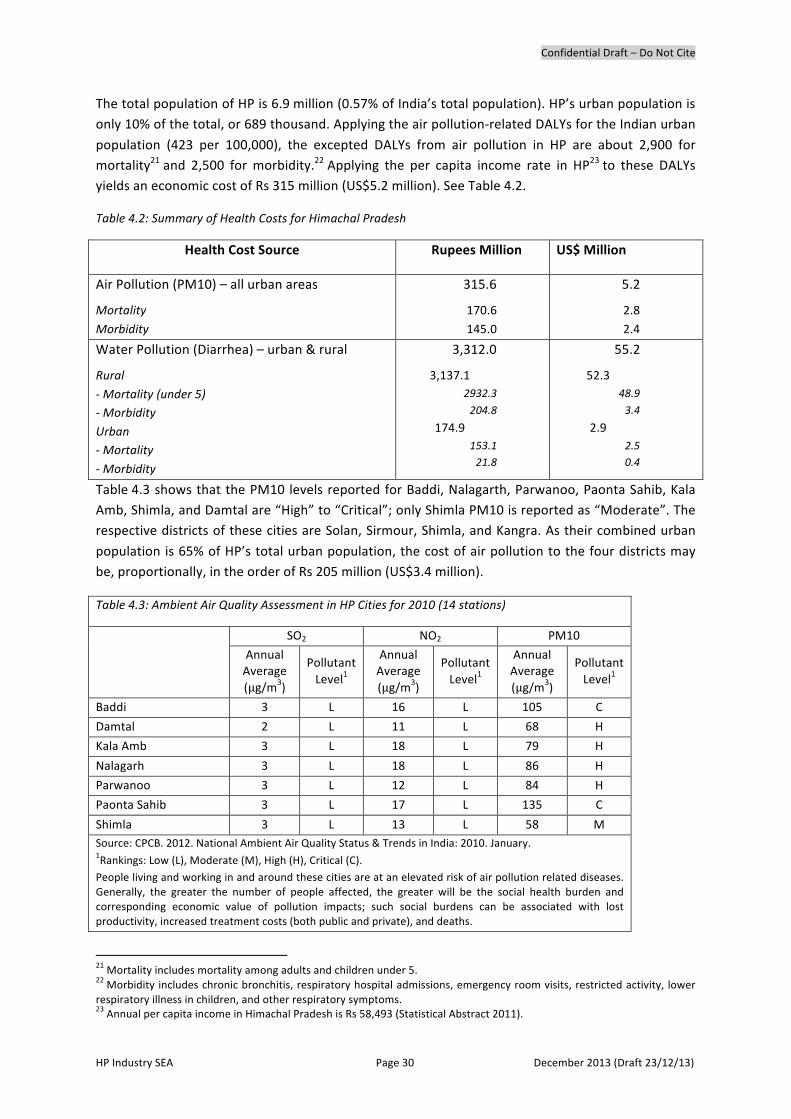
Confidential Draft – Do Not Cite
HP Industry SEA Page 30 December 2013 (Draft 23/12/13)
The total population of HP is 6.9 million (0.57% of India’s total population). HP’s urban population is only 10% of the total, or 689 thousand. Applying the air pollution-‐related DALYs for the Indian urban
population (423 per 100,000), the excepted DALYs from air pollution in HP are about 2,900 for mortality21 and 2,500 for morbidity.22 Applying the per capita income rate in HP23 to these DALYs yields an economic cost of Rs 315 million (US$5.2 million). See Table 4.2.
Table 4.2: Summary of Health Costs for Himachal Pradesh
Health Cost Source Rupees Million US$ Million
Air Pollution (PM10) – all urban areas
Mortality
Morbidity
315.6
170.6
145.0
5.2
2.8
2.4
Water Pollution (Diarrhea) – urban & rural
Rural
-‐ Mortality (under 5) -‐ Morbidity
Urban -‐ Mortality
-‐ Morbidity
3,312.0
3,137.1 2932.3 204.8
174.9 153.1 21.8
55.2
52.3 48.9 3.4
2.9 2.5 0.4
Table 4.3 shows that the PM10 levels reported for Baddi, Nalagarth, Parwanoo, Paonta Sahib, Kala Amb, Shimla, and Damtal are “High” to “Critical”; only Shimla PM10 is reported as “Moderate”. The respective districts of these cities are Solan, Sirmour, Shimla, and Kangra. As their combined urban
population is 65% of HP’s total urban population, the cost of air pollution to the four districts may be, proportionally, in the order of Rs 205 million (US$3.4 million).
Table 4.3: Ambient Air Quality Assessment in HP Cities for 2010 (14 stations)
SO2 NO2 PM10
Annual Average (μg/m3)
Pollutant Level1
Annual Average (μg/m3)
Pollutant Level1
Annual Average (μg/m3)
Pollutant Level1
Baddi 3 L 16 L 105 C
Damtal 2 L 11 L 68 H
Kala Amb 3 L 18 L 79 H
Nalagarh 3 L 18 L 86 H
Parwanoo 3 L 12 L 84 H
Paonta Sahib 3 L 17 L 135 C
Shimla 3 L 13 L 58 M Source: CPCB. 2012. National Ambient Air Quality Status & Trends in India: 2010. January. 1Rankings: Low (L), Moderate (M), High (H), Critical (C). People living and working in and around these cities are at an elevated risk of air pollution related diseases. Generally, the greater the number of people affected, the greater will be the social health burden and corresponding economic value of pollution impacts; such social burdens can be associated with lost productivity, increased treatment costs (both public and private), and deaths.
21 Mortality includes mortality among adults and children under 5. 22 Morbidity includes chronic bronchitis, respiratory hospital admissions, emergency room visits, restricted activity, lower respiratory illness in children, and other respiratory symptoms. 23 Annual per capita income in Himachal Pradesh is Rs 58,493 (Statistical Abstract 2011).
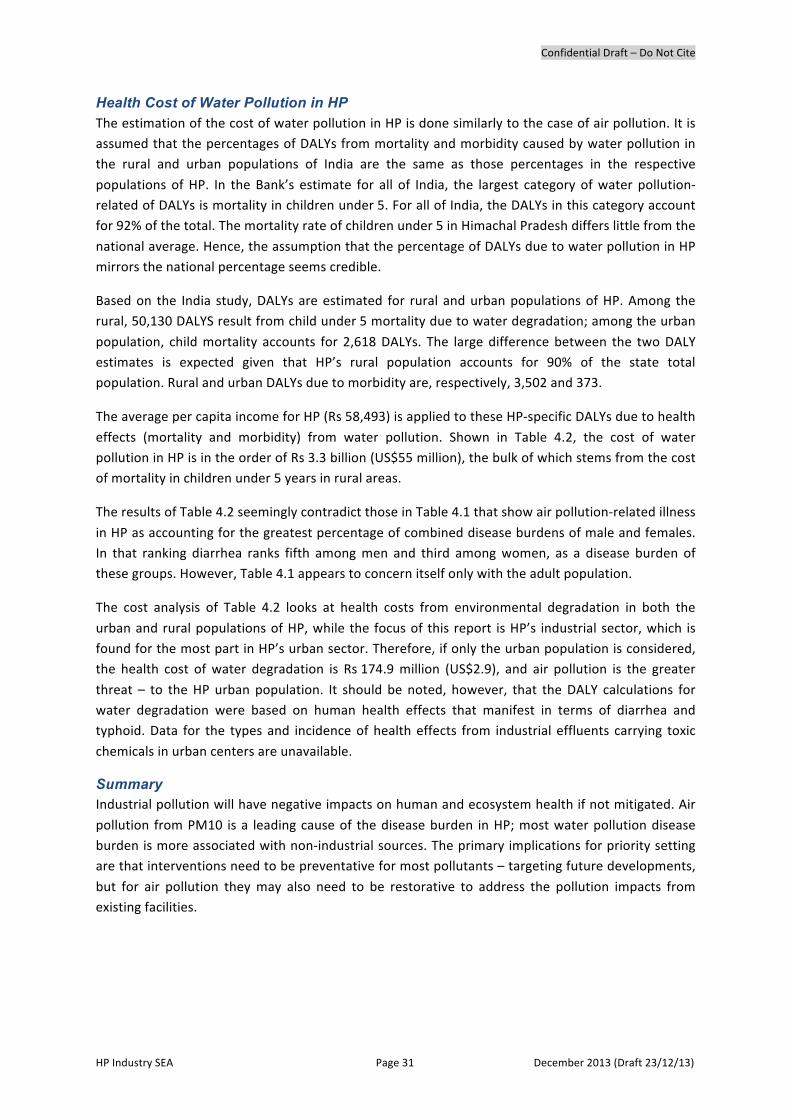
Confidential Draft – Do Not Cite
HP Industry SEA Page 31 December 2013 (Draft 23/12/13)
Health Cost of Water Pollution in HP The estimation of the cost of water pollution in HP is done similarly to the case of air pollution. It is assumed that the percentages of DALYs from mortality and morbidity caused by water pollution in the rural and urban populations of India are the same as those percentages in the respective
populations of HP. In the Bank’s estimate for all of India, the largest category of water pollution-‐related of DALYs is mortality in children under 5. For all of India, the DALYs in this category account for 92% of the total. The mortality rate of children under 5 in Himachal Pradesh differs little from the
national average. Hence, the assumption that the percentage of DALYs due to water pollution in HP mirrors the national percentage seems credible.
Based on the India study, DALYs are estimated for rural and urban populations of HP. Among the rural, 50,130 DALYS result from child under 5 mortality due to water degradation; among the urban
population, child mortality accounts for 2,618 DALYs. The large difference between the two DALY estimates is expected given that HP’s rural population accounts for 90% of the state total population. Rural and urban DALYs due to morbidity are, respectively, 3,502 and 373.
The average per capita income for HP (Rs 58,493) is applied to these HP-‐specific DALYs due to health
effects (mortality and morbidity) from water pollution. Shown in Table 4.2, the cost of water pollution in HP is in the order of Rs 3.3 billion (US$55 million), the bulk of which stems from the cost of mortality in children under 5 years in rural areas.
The results of Table 4.2 seemingly contradict those in Table 4.1 that show air pollution-‐related illness
in HP as accounting for the greatest percentage of combined disease burdens of male and females. In that ranking diarrhea ranks fifth among men and third among women, as a disease burden of these groups. However, Table 4.1 appears to concern itself only with the adult population.
The cost analysis of Table 4.2 looks at health costs from environmental degradation in both the
urban and rural populations of HP, while the focus of this report is HP’s industrial sector, which is found for the most part in HP’s urban sector. Therefore, if only the urban population is considered, the health cost of water degradation is Rs 174.9 million (US$2.9), and air pollution is the greater
threat – to the HP urban population. It should be noted, however, that the DALY calculations for water degradation were based on human health effects that manifest in terms of diarrhea and typhoid. Data for the types and incidence of health effects from industrial effluents carrying toxic
chemicals in urban centers are unavailable.
Summary Industrial pollution will have negative impacts on human and ecosystem health if not mitigated. Air
pollution from PM10 is a leading cause of the disease burden in HP; most water pollution disease burden is more associated with non-‐industrial sources. The primary implications for priority setting are that interventions need to be preventative for most pollutants – targeting future developments,
but for air pollution they may also need to be restorative to address the pollution impacts from existing facilities.
Confidential Draft – Do Not Cite
HP Industry SEA Page 32 December 2013 (Draft 23/12/13)
§5 Economic Instruments for Environmental Management in Himachal Pradesh
Introduction to Framework This Chapter treats the overall framework for applying economic instruments, and also outlines some of the experience that India and HP already have.
Economic policy instruments for pollution control can be placed along a continuum reflecting the
polluter’s ability to decide how much to pollute (Table 5.1).24 At one end, the polluter cannot participate in the decision. These are strict CAC instruments: government sets the level of permissible pollution, and then controls for compliance. Moving down the continuum, influenced by
market-‐based incentives, the polluter participates more in the decision as to how much to pollute and how to tackle abatement. Reaching the other end of the continuum, the polluter choses his own
level of pollution, and the community decides if it is an acceptable level. At both these extremes, there are incentives for the polluter to maintain permissible levels of pollution: at the CAC extreme, non-‐compliance risks sanctions imposed by the government. At the MBI extreme, pollution beyond
what the community will tolerate results in citizen advocacy and litigation, with probable compensation to pollution victims, and closure or loss of business.
Table 5.1: Economic policy incentives currently used in India and Himachal Pradesh for industrial pollution control
Instrument Type Target Regulation and Sanctions
• MINAS (industry specific) supported by sanctions such as closure or loss of power or water services
• EIA legislation • Consent mechanism – Consent to Establish, Consent to Operate
Charges, Taxes, Fees and subsidies
• Charge (cess) – for water consumption (industrial and large domestic) • Tax rebate on water cess for investment in effluent treatment • Solid waste user charges in some states • Charge – on produced and imported coal • Subsidy – CETP
Market Creation • Tradeable Renewable Energy Certificates • Tradeable Energy Saving Certificates • Clean Development Mechanism: Payment for Ecosystem Services (PES)
Final Demand Intervention • Eco-‐labeling to inform consumers about environmentally friendly products Liability Legislation • Pubic interest legislation
In the middle of these two extremes are economic policy instruments with varying degrees of government involvement and polluter decision-‐making power. Here one finds the frequently used taxes and subsidies, and less frequently used property right mechanisms such as market creation
schemes that allow polluters to trade amongst themselves to collectively achieve a set pollution-‐loading objective. There are also final demand instruments that start to bring the citizen’s or consumer’s power to bear on the activities of polluting industries: polluting starts to become bad for
business.
24 Annex E provides additional background information to the framework for discussing economic policy incentives.
Confidential Draft – Do Not Cite
HP Industry SEA Page 33 December 2013 (Draft 23/12/13)
Regulations and Sanctions Minimum National Standards (MINAS). CPCB provides industry-‐specific MINAS for effluent and emissions. Water effluent parameters include BOD, COD, suspended solids, and pH, among others depending on the industry concerned. MINAS for air emissions include limits for PM, SPM, VOC,
among others. Prescribed actions/equipment for meeting the MINAS are part of the conditions of the Consent Mechanism. All industry units must be able to provide, on demand, all information on their levels of pollution loading, and the operation and maintenance of their pollution treatment
equipment.
Consent Mechanism. Consent of the SPCB is required by all development projects, industrial units, tourism projects, hydroelectric projects, mining unit`s, and sewage treatment facilities. Consent to Establish (CTE) is granted, subject to certain conditions, after the project is evaluated for its pollution
potential. Typically, installation of pollution control systems is part of the conditions.
If the conditions of the CTE are met, a Consent to Operate (CTO) is initially granted for a period of one year, renewable thereafter if pollution systems are operated and maintained to comply with prescribed emission/effluent standards. The SPCB is to monitor the systems regularly. In the event of
non-‐compliance, the SPCB can issue directions to suspend production and disconnect the power and water supplies.
In 2010/11 the HP PCB conducted 10,336 inspections, a handful of which lost their CTE or CTO.
Environmental Impact Assessment (EIA). Environmental clearance from central or state impact assessment authorities is mandatory for all significant projects (mostly industrial) anywhere in India.
Central and state governments share the responsibility for the clearance and EIA process, according to the type of project, its potential impacts, and state capacity to undertake the process.25
HP has established the requisite State Level Environmental Impact Assessment Authority (SEACA), and the Expert Group and Committees, to assess (Category B) projects for Environmental Clearance.
Once clearance has been obtained, it is up to the SPCB to monitor the fulfillment of the conditions prescribed by the EIA and contained in the CTEs and CTOs.
Under the EIA Notification, the SPCB must also conduct the Public Hearings as part of the public consultation mechanism prescribed by the GOI. The HP PCB noted in its 2010/11 Annual Review that
with respect to hydroelectric projects, it was finding it difficult, given its resources, meeting the mandatory monitoring provisions of the Environmental Clearance process.
Charges, Taxes, and Fees The water cess is a charge on the quantity of water consumed by different categories of industries and local water authorities. For industrial users, the tariff ranges from 5 to 30 paise per kiloliter depending upon the intended use and quantity. The tariff is higher above certain levels of overall
consumption, and when the wastewater contains pollutants that are not easily biodegraded and/or toxic.
25 Schedule of EIA Notification, 2006, issued by the MOEF, GOI.
Confidential Draft – Do Not Cite
HP Industry SEA Page 34 December 2013 (Draft 23/12/13)
A rebate for effluent treatment is available to any person, industry, or local water authority that installs a sewage or effluent treatment plant, up to 25 percent of the cess payable. Laboratory
analysis is required as proof of treated effluent.
Solid waste charges for urban Solid Waste Management (SWM) are being encouraged in Indian cities. Mahabaleshwar introduced a pollution tax to generate revenue for urban management. Maharashtra has introduced a tax for 5 years on old vehicles, in a similar effort to raise revenue to
pay for the implementation of various pollution control measures.
A nationwide coal cess of Rs 50 (US$1) per metric ton of coal is charged on both produced and imported coal. Coal cess receipts finance a “clean coal fund” to be used, for example, to defray the costs of augmenting transmission networks to enable power distribution from clean energy sources
such as solar plants and wind farms.
A subsidy for Common Effluent Treatment Plants (CETP) was initiated by the GOI in 1991 to enable clusters of compatible small-‐scale industries to upgrade or install CETPs. It was revised in March 2012 to reduce the proponent’s outlay to 25% of the capital costs. The central government provides
a subsidy of 50% of capital costs, and the state subsidizes the remaining 25%.
Market Creation During the last few years, India has established a number of innovative market creation schemes.
The Renewable Energy Certificates (RECs) program promotes clean energy, and the Perform, Achieve and Trade (PAT) program aims to reduce energy demand in energy intensive industries (aluminum, fertilizer, and textiles, among others).
The Clean Development Mechanism is essentially a Payment for Ecosystem Services (PES) system
transferring the value of the global benefit of emission reduction to those responsible for the reduction. One-‐third of the Certified Emission Reduction (CER) credits earned through CDM projects in India are for energy efficiency. Another third is for renewable energy projects, including biomass
utilization. Industrial processes and fuel switching account for most of the remainder.
Final Demand Interventions Ecomark was launched in 1991 for easy identification of environmentally friendly products that meet
specified environmental criteria and Indian standards. It is a voluntary scheme wherein eligibility for labeling is determined by criteria that examine the product’s cradle-‐to-‐grave processes. (Although energy efficiency labeling is mandatory for air-‐conditioners and refrigerators.) Eligibility criteria for
Ecomark products are determined by concerned sectors, while the Bureau of Indian Statistics handles assessment and certification.
Public Interest Litigation Throughout India Public Interest Litigation (PIL) is becoming a frequent response to environmental degradation, to enforce compliance and compensation from the responsible industries. HP is no exception. The SPCB reported in its Annual Review that because of increasing PIL and the associated
increasing workload, the SPCB was contemplating increasing its legal staff.
There is a backlog of PIL cases across the country, which prompted the establishment of a National Green Tribunal (NGT) to settle cases relating to environmental protection, conservation of forests and other natural resources, and the enforcement of any legal right relating to environmental goods
Confidential Draft – Do Not Cite
HP Industry SEA Page 35 December 2013 (Draft 23/12/13)
and services. The Tribunal is dedicated to environmental matters only, so it is expected to handle expeditiously the cases brought to it (within 6 months), to rule on compensation for damages to
persons and property by perpetrators, and to reduce the amount of litigation waiting to access the higher courts.
Different Objectives When MBIs were initially touted some decades ago as an effective means of reducing pollution, the primary argument was that they were a more cost-‐effective mechanism for achieving a given abatement result than were CAC options. This result was essentially a theoretical argument, based
on asymmetric information: companies and polluters knew their own operations best, so were in the best situation to determine what the cost-‐efficient mechanism should be. This outcome has only been partially supported, mainly because of imperfect institutional structures. Essentially, few
“ideal” experiments have been conducted within the complexity of national legislation and regulation, and competing interests among environmental, economic, and social concerns. At best, therefore, even with 1000s of examples from which to choose globally, we are reduced to observing
a number of “stylized facts” about the effectiveness of the various mechanisms. Most notably, a key stylized fact is that no single instrument is capable of effectively addressing all three objectives frequently cited by policy-‐makers: (i) pollution abatement; (ii) revenue generation; and, (iii) cost
effectiveness.
The first two – abatement and revenue generation – are sometime at complete cross-‐purposes: a simple pollution charge meant to dissuade pollution loading, if effective, will eventually generate zero revenue even though initially it may generate significant funds. The last objective – cost
effectiveness – is complicated as much by definition as by measurement: cost-‐effectiveness from a private firm’s perspective (choosing an optimal process technology to achieve a given environmental standard) can be quite different from cost-‐effectiveness from a social perspective. The State would
normally consider: (i) the value of externalities (such as human or ecosystem health impacts); (ii) cumulative impacts from different polluters and pollutants; (iii) distributional impacts of pollution on different segments of society; and (iv) the availability of policy options that would be anathema
to some in the private sector (such as shutting down or discouraging entire industry groups). Such issues generally stimulate discussions on (and experiments with) different mechanisms, and hybrids emerge that may be as much an accident of history as an act of deliberate policy planning. From this,
economists often identify a category of “perverse incentives”: these are well-‐intentioned incentives that nonetheless have unintended negative environmental consequences once implemented within
real world situations. Identifying and dismantling such perverse incentives is frequently the first step in any set of policy reforms.
Pollution Abatement experience To consider India’s experience with pollution abatement, one can look at compliance experience
with regulated MINAS. Generally, for the industrial sector as a whole, enforcement of the conditions of the Consent Mechanism is the responsibility of the SPCB. Additionally, a program for surprise inspections (Environment Surveillance Scheme) focuses on the negative list industries. Assessments
of the effectiveness of CAC instruments have concluded that the provision of penalties for polluters needs strengthening (Kumar and Managri 2009). Also, studies routinely suggest that small-‐scale industries cannot afford pollution equipment: research found that the cost of an ETP to a SSI costs
about as much as the capital cost of the main plant (Murty et al. 1999).

Confidential Draft – Do Not Cite
HP Industry SEA Page 36 December 2013 (Draft 23/12/13)
There are guidelines for the frequency of inspections by the SPCBs, depending on the size of the industry and its pollution potential, but adherence to the guidelines is mixed. An assessment by
OECD (2006) found that although the number of site inspections is high, most SMEs are rarely or never inspected. Also, the shortage of SPCB staff often results in inspections that are too rapid to be effective.
• A CTO is issued with emission and effluent limits, and self-‐monitoring and reporting
schedules. In practice only large and medium-‐sized facilities obtain the required permits, while most small-‐scale industries operate without consents. But the MSMEs are responsible
for about 70% of total nationwide pollution.
• A 2005 review of 78 of the 88 CETPs constructed under the subsidy scheme found the
performance of CETPs to be very unsatisfactory, largely because of poor operation and maintenance, and recommended improved monitoring of CETPs and compliance enforcement by SPCBs.
• Indian experience shows that most of the action for reducing pollution is the result of PIL
cases filed by various interest groups.
• Institutional structures for EIA are strengthening in India. But problems remain particularly
with monitoring and compliance enforcement. Cumulative impacts from micro, small and medium enterprises (MSMEs) can be significant but are often ignored.
Revenue Generation experience
Fees from the Consent Mechanism and the Water Cess are both important for financing the operations of the SPCB. The Consent fees are by far the greater source of revenue. The purpose of the water cess on water consumption as described in the Water Cess Act, 1977, is to dissuade
wasteful use. Most studies show that it is not high enough to encourage efficient use, but it nonetheless is an important source of revenue for the HP PCB. Indeed, some authors (Murty and Kumar, 2011 [check source]) have recommended that it be increased substantially to generate
revenue and act as a more effective incentive to discourage wasteful practices.
Some states (Andhra Pradesh, Maharashtra and West Bengal) use bank guarantees to ensure compliance with pollution standards by new industries, or industries seeking renewal of their Consent to Operate. Typically, the amount of the guarantee is 10% of the particular industry’s cost
of compliance, and is related to an action plan for meeting compliance for the particular industry. In the case of non-‐compliance, part or all of the guarantee is forfeited. This instrument is considered an effective deterrence, but it is also a significant source of revenue for the Pollution Control Board in
the States where it is used. However, the use of bank guarantees does not work well in the case of MSMEs: most cannot afford to post a bank guarantee. Also, to date, bank guarantees are not used in HP.
Assessments of the HP fiscal situation frequently conclude that there are under-‐utilized mechanisms
for revenue generation throughout the available envelope of taxes, charges and levies. On the one hand, this may reflect HP’s desire to attract investment and stimulate savings. On the other hand, there are likely to be mechanisms available that would contribute to overall revenues without
distorting or discouraging investment. For example, many jurisdictions have found that carbon taxes
Confidential Draft – Do Not Cite
HP Industry SEA Page 37 December 2013 (Draft 23/12/13)
on fuels can be an effective revenue generating mechanism: they have a modest incentive effect, but generate revenues that can be redirected to other incentives or commitments associated with
environmental management goals (such as GHG emission reduction or carbon sequestration). A budget-‐neutral carbon tax may be worth considering at some future date as a form of revenue generation in HP.
Cost-‐effectiveness experience
A number of lessons have been drawn from experience with various approaches in HP. Many of the historical approaches have in fact imposed greater costs on either the regulator or industry without necessarily achieving any pollution abatement benefits. As the industrial sector grows in HP, so will
the resource requirements of the SPCB. Industrial compliance with pollution law is typically first sought through a consultative approach. This saves time and costs because recourse to the courts is avoided. But, the greater the number of industries, the greater will be the number of non-‐
compliance cases and PIL action, and consequently, the greater the demand for legal and mediation intervention from the SPCB.
The imposition of non-‐compliance penalties is only possible through court action, but even if a case is successful, monetary fines are too low to be an effective deterrence. Also, the lack of standardized
procedures for inspection often undermines the government’s court case against violators. The courts are overburdened, so enforcement by court action is slow, while its cost to the SPCB is high. As a result, SPCBs resort to other methods such as cutting the power or water supply to the
offending facility, issuing closure orders, or revoking the Consent. The latter is the least effective because it does not guarantee that operation will cease. Closure is the most effective.
Regulated compliance with MINAS does not provide the necessary incentives to polluters to adopt
least cost methods of pollution control. Tax-‐rebates on end-‐of-‐pipe treatment technologies have not promoted upstream efficiency of resource use in industrial processes.
Tax concessions for adoption for pollution control equipment are usually specified for identified abatement technologies and activities, rather than for providing dynamic incentives for
technological innovation and diffusion (Murty and Kumar, 2011).
Summary To summarize, HP does have some experience with market-‐based incentives, but institutional capacity can still hinder their effectiveness. Command and Control (CAC) and Market-‐Based
Instruments (MBIs) both incentivize industry to control pollution: either or both can make policy sense in a given institutional context.
A mix of CACs and MBIs can address different goals: cost-‐effectiveness, pollution reduction, and
revenue generation. Historical developments can generate a sub-‐optimal mix of approaches, implying that the first step involves reforming or changing “perverse incentives” that have unintended negative environmental impacts.
India and Himachal Pradesh already have experience with a number of CAC and MBIs; future
initiatives in the State can potentially build effectively on this experience if properly targeted.

Confidential Draft – Do Not Cite
HP Industry SEA Page 38 December 2013 (Draft 23/12/13)
Part II DIAGNOSTICS
§6 MSME Scheme – Mid-‐Study Recommendation Report
§7 Background to the Case Studies
§8 Case Study 1 – Pharmaceuticals
§9 Case Study 2 – Stone Crushing
§10 Case Study 3 – Food Processing
§11 Cost Effectiveness
[photo]
Confidential Draft – Do Not Cite
HP Industry SEA Page 39 December 2013 (Draft 23/12/13)
§6 MSME Scheme – Mid-‐Study Recommendation Report
Background to Request This Chapter presents the mid-‐study recommendation report of the SEA regarding regulation of MSME sectors in HP.
Building on past experience, and cognizant that economic instruments can contribute to improved
compliance, stakeholders in HP requested that early work in the SEA process was targeted to conducting a rapid assessment for developing economic incentive options relating to MSME pollution loads. As noted previously, these are among the most difficult to regulate effectively
because of high compliance monitoring requirements, geographic dispersion, and the sheer number of firms involved (often at household enterprise level). Also, the request was made that the approach did not further burden industry with high costs; given the recent removal of the incentive
package for industry in HP, the Government of Himachal Pradesh (GoHP) does not want to introduce new dis-‐incentives to industry. The trigger for the DPL is therefore focused on introducing a positive incentive for the adoption of clean technology, enhanced pollution control practices, and systems
that are in compliance with regulations.
Introduction Building on a review of existing economic instruments applied to Industry in ten countries in Asia
and South and Central America, five economic instrument approaches have been considered for potential application in Himachal Pradesh26. At a practical level, these economic instruments focus on incentivizing SMEs to participate in the Common Effluent Treatment Plant (CETP) currently under
construction in the district of Baddi, Himachal Pradesh.
In addition to reviewing the experience of these ten countries, lessons also draw from India’s experience. Murthy (2011), for example, in a comprehensive discussion of SMEs and the use of various economic incentives, advocates the need for a multi-‐prong approach: no single instrument is
likely to be effective. Some existing mechanisms in India already take such a multi-‐prong approach (Box 6.1). Experiences elsewhere also demonstrates that the complexity of the SME issues merits a hybrid approach that combines a basket of incentives and eventual disincentives to gain compliance
with pollution control objectives.27
The recommended model thus includes elements of all five different economic instruments reviewed here: (i) environmental fee tied to operating permits (on pollution discharge with exemptions); (ii) capital grant provisions for environmental technology; (iii) soft loan scheme for 26 The countries covered in the review of existing economic instruments are: Bangladesh, Brazil, China, Indonesia, Malaysia, Mexico, the Philippines, South Korea, Thailand and Vietnam. The review does not provide an exhaustive list of all instruments: all of these countries have had some decades of experience in testing various approaches and the lessons drawn from this are reflected in the recommendations contained here. Background research was also undertaken respecting Chilean experience with property right systems; these are not, however, covered in this review because implementation of such approaches in HP is not advised. 27 A review of environmental management of SMEs in Argentina, Chile, Columbia and Mexico supports the application of a ‘consolidated’ instrument (UN, 2006). The study recommends: (i) integrated policies – at least in the areas of productive development, productivity and competitiveness – with environmental policy, in order to avoid contradictions that create problems for firms; (ii) the development of economic instruments and new means of obtaining financing; (iii) a mix of instruments including direct regulation, economic measures and voluntary instruments, as no single method can be relied upon; (iv) partnerships between large businesses and SMEs, as well as among SMEs as a means of fostering sustainability and gaining footholds in emerging markets; and, (v) a focus on training and information to advance technology and management.

Confidential Draft – Do Not Cite
HP Industry SEA Page 40 December 2013 (Draft 23/12/13)
SME support; (iv) accountability instruments; and, (v) economic incentives associated with supply-‐chain management. In this mid-‐study recommendation report, each of these approaches is
summarized in terms of a general description, examples from the study set of countries, their advantages/disadvantages and their application in the HP context. The final hybrid of these is described as the “Himachal Pradesh SME Green Incentive Scheme.”28
The proposed hybrid – the SME Green Incentive Scheme – is described in the context of the Baddi
CETP. As this is the first CETP in HP that includes a significant investment in addressing river quality concerns, it could be a model for similar green investments elsewhere in the State and, indeed, in India.
The proposed SME Green Incentive Scheme also reflects some realities or “stylized facts” directly
experienced by other countries. First, SMEs are the most difficult industries to regulate or incentivize effectively anywhere in the world, although they are also among the most important for economic growth both in terms of their own production for end markets and for their production of inputs into
a domestic or global supply chain of larger partners. Second, successful incentives generally included some form of moral suasion, social pressure, or access to financial markets. Finally, successful compliance always required some eventual “stick”, either in terms of fines or closure (even if grace
periods were provided).
Box 6.1. Existing Initiatives supporting MSMEs in India
The Small Industries Development Bank of India (SIDBI), set up in 1990, is the principle financial institution for the promotion and development of the Micro, Small and Medium Sized Enterprise (MSME) sector. It promotes investment in clean production and energy efficient technologies. In respect to CETPs, Gujarat Environ Protection & Infrastructure Ltd. has been assisted to set up Treatment Storage and Disposal Facilities (TSDF) in Surat to help MSME textile dyeing and printing units in proper waste disposal. The majority of the 300 MSME member units have been able to become compliant with pollution control norms. In Bangalore Eco Green Solution Systems (P) Ltd. has been assisted to set up a TSDF facility for toxic waste generated from the electroplating, powder coating, and metal finishing industries, which has helped more than 300 MSMEs in the reuse and recycling of treated effluent, and in the reduction in waste treatment costs per unit.
Under the MSME Financing and Development Project (MSMEFDP) being implemented by SIDBI, Credit Facility (CF) has been provided to over 2,050 MSMEs across major cluster centers in India. This cluster development initiative is aimed at soft infrastructure development, and is adopting a long-‐term intervention strategy. Starting with value chain mapping of a cluster, an action plan is devised in consultation with stakeholders. Instilling Energy Efficiency (EE) in these adopted clusters has emerged as a cross cutting issue.
SMER Rating Agency of India Ltd (SMERA), under MSMEFDP, is the country's first rating agency focused primarily on Micro, Small and Medium Enterprises (MSME). SMERA's primary objective is to facilitate flows of credit from the banking sector to MSMEs. Better ratings from SMERA have benefitted MSMEs through lower collateral requirements, reduced interest loans, simplified lending norms and faster access to credit. SMERA has introduced a “Green Rating” model. This initiative is aimed to encourage MSMEs engaged in industrial activity to adopt better technologies and processes to prevent un-‐mitigated environmental damage. It will act as a risk mitigation tool for MSMEs to assess continuity risks associated with rapidly changing regulation on environment governance & compliance.
28 Note that this is a working title.
Confidential Draft – Do Not Cite
HP Industry SEA Page 41 December 2013 (Draft 23/12/13)
Option 1 – Basic Environmental Fee
Description The notion of an environmental fee, pollution charge, or effluent tax is a long-‐standing basis for the polluter pay principle. It essentially places a monetary burden on firms linked to their presumed or actual amount of pollution. They are thus found in many jurisdictions in various guises: these range
from simple fees attached to operating licenses, to complex pricing formulas dependent on pollution standards and effluent levels. Equally important, however, in structuring these fees is the relief (in terms of payment level or exemption period) which is available to firms if they comply, or before
compliance becomes mandatory. Application of any such fees to SMEs is often either politically problematic (because of distributional impacts) or financially problematic (to the extent that the burdens of such charges are unaffordable and simply put the firms out of business or otherwise fail
to incentivize them). A unilateral application of fees or taxes on SMEs thus typically fails.
But such charges and fees are included here because they do have a number of important roles to play. First, exemption of such fees is a powerful economic incentive instrument: an environmental fee can be attached to all operating permits with incentives attached to refund or waive the fee for
responsible SMEs. Second, the exemption periods and waivers can be targeted to reflect political, financial, and environmental requirements in any given area; adjustment periods of 5 years or longer are not unusual. Third, the administrative structure of the instrument provides a mechanism for
attaching other incentives or inducements, including performance subsidies that may exceed the amount of the basic fee. Fourth, it creates a monitoring structure through its attachment to operating permits (or licenses) where the monitoring protocols themselves can be more flexible
once compliance levels have been achieved (and thus less costly to participants and regulators).
International application As noted above, fees and charges are commonly used as incentives or for revenue generation in some form but the following provide some examples.
Ø Brazil’s Federal Water Law January 1997 introduced quality and quantity related water charges into
the regulatory framework. Water charges are intended to provide funding to projects related to pollution control. Brazil adopts a decentralised & participative water management approach with the
river basin committee as the cornerstone of the sector's institutional arrangements. In Paraiba do Sul industrial users pay a charge for water withdrawal, consumption (i.e. proportion of withdrawn water
not returned to water bodies), and effluent discharge (which depends on the percentage and efficiency of the effluent discharge). Analysis based on a survey of 488 plants located within the
Paraiba do Sul River Basin indicates that a significant proportion of the industrial plants approve of the water charge mechanism and that increasing water costs are inducing them to undertake conservation measures with limited impact on firms’ competitiveness.
Ø China passed a new Directive in June 2013, which will further compel firms to improve their pollution control equipment and strengthen enforcement and collection fees and penalties that companies pay
based on their emissions. In China, if institutions have paid the pollutant discharge fee but have not met the discharge standards for three years, the pollution discharge rate increases by five percent
each year thereafter. Conversely, institutions that have met the discharge standards, or markedly decreased the quantity and concentration of the discharged pollutants, may apply to the local
environmental protection department to terminate or reduce the discharge fee. The discharge fee is paid into a special fund for environmental protection used for the control of pollution sources in key
discharge institutions and integrated control of environmental pollution. If institutions cannot afford

Confidential Draft – Do Not Cite
HP Industry SEA Page 42 December 2013 (Draft 23/12/13)
pollution control, a certain amount may be subsidized through application to the environmental protection and financial departments by their competent authorities.
Ø Indonesia initially experimented with fees and charges applied to SMEs but still lacks the legal and
regulatory framework to apply such charges. It has thus relied more extensively on other mechanisms, with fines and shutdown being the final “stick” for non-‐compliant smaller scale polluters.
Ø Philippines 1977 legislation relating to the Laguna Lake area is regarded by many as international best practice of an Environmental User Fee System that is based on discharge levels and applied commonly
to all polluters. To date, only individual households (and household scale SMEs) are effectively exempt (in fact 100% subsidized); as a result of on-‐going evaluations the mechanism is being
increasingly connected to other incentives such as training and financing of pollution control. Compliance achievement after 20 years of implementation was >80% with visible improvements in environmental quality in a previously highly degraded area.
Ø Thailand is currently (2013) reintroducing a pollution charge system across all industries after some decades of ad hoc application of different instruments, going now for a more standardized instrument
that could permit greater flexibility. While final legislation is not yet passed, it is largely based on the Pollution Management Fee (PMF) structure that is universally applied and attached to licenses,
although with more relaxed provisions available for SMEs. The PMF is designed to be reimbursed if companies decide to install or upgrade waste management facilities; some proportion is always
retained by the regulator for larger firms but scope exists for a full waiver. The fee is structured to permit waivers for any action that mitigates environmental impact (installing equipment, changing inputs, changing processes).
Ø Vietnam relies on fees for effluent discharges and fines for discharges over permitted levels. SMEs are incapable of paying the discharge fees and regulators rarely apply available sanctions to SMEs.
Dispersal, size, and legal status make monitoring difficult, hence SME regulation and control is largely ineffective.
Advantages: provides an incentive structure that can be designed to be revenue neutral to the
Government. This would require the fee to be applied to large-‐scale operations as well as SMEs, with exemptions and special considerations being given only to the SMEs. This is an important consideration in HP, where the Government has not been able to finance existing incentives offered,
for example, on the installation of new pollution control devices.
Disadvantages: Transaction costs are typically high with SMEs because of fixed costs associated with compliance monitoring. These can be substantially reduced through making them independent of discharge levels.
Potential application to SMEs in Baddi CETP
Within the context of SMEs in HP, the structure of such an instrument would include:
Ø an annual environmental fee associated with an operating license for the business of the SME;
Ø eligibility for operating subsidies through CETP tariff relief equivalent to the lesser of: (a) the actual tariff; (b) the capital charge of the tariff if the tariff is based on full cost recovery29.
Ø a temporary holiday period of not more than (x: suggest five) years during which time the firm can
comply to standards either through equipment installation, process changes, or location within an industrial estate that has access to a CETP to which it is tied;
29 This provision is recommended because the capital portion of the tariff has, in India, often been covered implicitly by State and National Governments through cost-‐sharing of the ETP capital costs.

Confidential Draft – Do Not Cite
HP Industry SEA Page 43 December 2013 (Draft 23/12/13)
Ø permanent exemption of the fee as long as compliance continues;
Ø payment of the fee for a maximum of (y: suggest ten) years. After (z: suggest five) years, the firm will be obliged to adopt a supervised management plan for the remainder of the (y-‐z) year period to reduce pollution impacts or it will be closed.
It is important to note that the above structure is intended to be appropriate for SMEs both inside or outside a CETP (e.g., Baddi) although only those having access to the CETP would benefit from the
CETP subsidy.
Option 2 – Capital Grant Provision
Description Subsidized access to capital enables SMEs to respond to environmental objectives. For small-‐scale
firms, the capital cost of pollution abatement equipment – or clean production equipment – is prohibitive. Research in India has found it to be as high as the capital cost of the plant. In some cases where SMEs have made an investment in pollution treatment equipment, they subsequently find
that they cannot pay the operating costs. They operate the equipment only in anticipation of an inspection.
The incentives could include provision of land in an industrial estate giving access to common effluent treatment, a capital subsidy through excise tax exemption, or accelerated capital cost
depreciation when calculating taxable income within the tax system. Capital equipment generally eligible for incentives includes new or retrofit requirements, either for end of pipe treatment or for process changes.
The nature of the incentive is that it is typically a non-‐repayable grant or direct cash incentive for
pollution equipment. This contrasts to loans, which are typically more flexible and are repayable.
International application Selected examples of capital grants as pollution control incentives and financial relief follow. It should be noted that most of these are provided at a national level and are not necessarily targeted
to SMEs, but their universality provides further efficiencies as they can be applied using existing administrative structures such as the tax system.
Ø Bangladesh is currently proposing removal of import duties and taxes on selected green equipment. This is isolated to the textile industry and SMEs are eligible within the same context as other firms.
Ø China has a specific centrally financed fund for supporting the development of SMEs in industry clusters with local characteristics through financial aid, subsidies for loan interest and capital
investment. The Fund can be used to: promote technological innovation; promote energy-‐saving and emission reductions; strengthen cooperation between SMEs and backbone enterprises; promote the
industrial upgrading of SMEs; support the brand-‐building of SMEs; and, improve the service environment for SMEs. China also has a scheme for Micro and Small Sized Enterprises (MSE), which
among other things facilitates the development of clusters for MSEs. Stevens et al. (2013) argue that government legislation and financial support are necessary to improve SME environmental
performance in China. As a result the Government has issued a number of financial subsidies to support SMEs to reduce their operating costs, invest in greener production systems, and boost green innovation.
Confidential Draft – Do Not Cite
HP Industry SEA Page 44 December 2013 (Draft 23/12/13)
Ø Malaysia provides a partial reduction in taxable income for a specified period for investment in environment friendly processes. This is targeted to SMEs, and also intends to promote relocation to industrial estates.
Ø Thailand in its early stages of environmental management employed an unusual form of capital grant: a capital subsidy and fine. Under the Thai Factory Act, an Environmental Fund was established that
permitted the fund to finance 100% of pollution control equipment for non-‐compliant industries, but the capital was subsequently recovered through a repayment scheme that also recovered an
additional 30% fine. This scheme did have the desired effect of cleaning up pollution problems while providing a form of financing (albeit at high cost) to industry incapable of meeting regulatory obligations.
Ø Vietnam provides industrial land price subsidies to SMEs that relocate to designated industrial zones. The policy has created land price distortions and has been abused by residential developers and large-‐scale enterprises.
Advantages: direct positive impact on cash flow. Linked directly to pollution control. Waiver of import duties is a potentially low cost option for government in terms of direct outlays, if reduced
import receipts are recovered through other employment or profit taxes.
Disadvantages: An import duty waiver could create innovation bias due to lower cost imports that reduce incentive to produce home grown clean technologies. Incentive is often inadequate to cause changes in polluting behavior if it is just a tax deferral or if capital charge is low compared to overall
firm cost structure. May not adequately capture process changes as candidates for pollution discharge control.
Potential application to SMEs in Baddi CETP Capital grants through the taxation system are generally problematic at a State level, but their
inclusion within State policy could be possible if they targeted firms with access to a CETP and covered part or all of the costs of pre-‐treatment. For example, the Baddi CETP caters to different industries and some of these may still require some pre-‐treatment before the discharges meet the
inlet specifications of the CETP.
The structure of the instrument could address operations both inside and outside of a CETP installation and could thus take the form of:
Ø a capital grant of yy% of incremental installed equipment cost will be provided to SMEs not having
access to a CETP, for equipment required to meet State standards. For any year in which environmental standards are not met, usual applicable sanctions will be applied plus an amount equal to (zz%: suggest 10%) of the amount of the subsidy.
Ø a capital grant of xx% of the incremental installed equipment cost will be provided to SMEs having
access to a CETP, for equipment required to meet pre-‐treatment standards of the CETP. [Note: no non-‐compliance clause is necessary here, as a non-‐compliant operator would not be able to use the CETP and a condition of any annual license would remain that its waste is treated by the CETP.]
Option 3 – Soft Loan Scheme
Description Availability of financing any type of capital cost is a problem for many SMEs, and lack of access to finance is typically one of the most common issues identified in SME industrial surveys. The small scale of such firms, often coupled with a short operating history, lack of physical assets, and aversion
Confidential Draft – Do Not Cite
HP Industry SEA Page 45 December 2013 (Draft 23/12/13)
to bureaucratic lending processes create barriers to investment. Such barriers extend also to environmental investments, which are often perceived not to generate any inherent economic
return beyond reducing the risk of regulatory fines or closure.
Financing schemes and soft loan provisions are thus a common feature of a new brand of economic instrument that intends to induce compliance with environmental standards. These are in some ways no different than the capital grants mentioned previously, but they work through financial
markets instead of through taxation or grant schemes. Moreover, they have greater flexibility because there is still a possibility for them to be forgiven (in which case it becomes a grant scheme). Also, the loans can be structured such that they can be used for more than just pollution equipment.
International application
Selected examples of loan and financing schemes follow. A notable aspect of all of these is that they permit targeting to SMEs within selected industries or sub-‐industries.
Ø Bangladesh currently proposes to strengthen “green credit lines” for textile firms to invest in cleaner
production and pollution abatement equipment. It is available to all industry including SMEs, and covers water and energy efficient manufacturing equipment.
Ø Brazil’s study of 325 medium and large firms found that market incentives are influential
determinants of environmental performance. Cost savings on inputs and subsidised credit are found to be equally important. The study recommends flexible pollution control instruments that capture a
firm's differentials in characteristics & compliance as well as dissemination of information on environmental control and cost saving opportunities (Serôa da Motta 2006).
Ø Indonesia’s Ministry of Environment has environmental soft loan programs for micro, small and
medium enterprises to invest in environmental pollution control and improve production efficiency. The target group of these programs are companies that have potential to pollute and are financially
credit-‐worthy though not bankable. In recent surveys, half of all companies taking advantage of environmental loan facilities were SMEs.
Ø Malaysia has formalized much of its support to SMEs through the SME Corp or previously “SMIDEC” (Small and Medium Industries Development Corporation). Among many types of support, it provides
soft loans, investment advice, and special incentives for relocation to designated areas including 100% national income tax exemptions for five years. Various grant and loan schemes are available
(usually as matching funds to a maximum of 50% of costs) for equipment costs, production and processing improvements, product testing, or certification (e.g., ISO 13485, ISO 14000, ISO 22000).
Notably, the incentives go far beyond just environmental management but extend to all parts of the business and once registered as operating firms they generally become eligible for broad-‐based programs.
Ø South Korea provides capital subsidies (through grants and soft loans) and related technical assistance to enable SMEs to provide certifiably clean products to larger industries in key export sectors.
Ø Thailand relies extensively on SMEs; in early industrial restructuring efforts it allocated some $1 billion through the National Industry Restructuring Plan (NIRP), which targeted SMEs and provided
information on control technologies (through a Cleaner Technology Unit) and preferential loans. By 2000, after evaluating 185 clean technology options some 25 were identified for partial financing by
government through grants and loans. Firms targeted in a two-‐year period realized fuel savings of 80%, energy savings of 60%, and chemical savings of 80%.

Confidential Draft – Do Not Cite
HP Industry SEA Page 46 December 2013 (Draft 23/12/13)
Advantages: Long term revenue neutrality, strong uptake by SMEs especially if financing can be spread to non-‐environmental capital. Can convert loan to grant as additional incentive.
Disadvantages: cannot be done in isolation of disincentive (i.e., eventual fine or shutdown for non-‐
compliance); requires a financial partner. Financial security requirements need to be lightened or eliminated entirely at times before SME is willing to borrow.
Potential application to SMEs in Baddi CETP The structure of the soft loan scheme can be part of a grant scheme or, more commonly, a stand-‐
alone scheme that can incorporate a grant element. At the Baddi CETP, the amount would generally include an environmental management loan to cover connection fees for SMEs and pre-‐treatment equipment, and an additional loan that expands scope to other costs. The provisions are thus similar
to those of the grant scheme described previously, with the exception that it might include also an additional credit available for up to zzz% (suggest 100% initially) of the cost of the environmental loan. This additional credit could be used in parts of the business (for capital or operations) not
directly linked to environmental management.
Option 4 – Accountability Instrument
Description An accountability instrument motivates the SME to maintain the green momentum. Often, after the
initiation of some kind of pollution control measure – the purchase of abatement equipment, for example – SMEs return to previous polluting practices. An accountability instrument provides the means for continuous social surveillance. Pollution control measures have been most effective in
cases where public stakeholders (communities) are empowered to some degree, through the provision of information or the right to inspect.
The instrument typically involves both a rating and a disclosure process with an eventual compliance requirement: ultimately a firm will be shut down if it does not comply with the standards in place. In
some cases, especially where the firm is selling into international markets, the accountability can be tied into international certification systems such as ISO 14000 and its various sub-‐categories.
International application Selected examples of accountability instruments follow.
Ø China’s Green Watch program has coincided with higher rates of compliance among participating
plants. The program targets industrial firms and rates performance in categories. Participation in ISO 14001 has been found to be correlated with multinational status, exporting to industrial countries and size.
Ø Indonesia is acknowledged internationally for its public disclosure programs initiated in 1995. PROPER (Rating Program for Business Performance in Environmental Management) has generally proven a
successful program. The number of PROPER participants has increased every year from 95 companies in 2003 to 521 in 2007, with consistent increases since that time extending also to SMEs, which
otherwise elude effective management in the country. Other parallel linked programmes for clean rivers (PROKASIH) and clean air (PRODASIH) have similarly benefited from public disclosure and social
pressure to achieve voluntary compliance. It should be noted, however, that none of these programs can claim 100% success, and that the threat of administrative sanctions still weighs on firms to achieve compliance.
Confidential Draft – Do Not Cite
HP Industry SEA Page 47 December 2013 (Draft 23/12/13)
Ø Mexico has an internationally recognized successful program targeting small brick kilns that made available a subsidy for voluntary adoption of clean fuel (propane). This was available to highly
dispersed SMEs, and was regarded as a success due to community pressures, trade associations, and regulators. It should be noted that a parallel voluntary non-‐subsidized initiative (Clean Industry
Certification) targeted to larger firms met with mixed success because it continued to depend mostly on inspections and fines as a final motivating factor.
Ø South Korea maintains a system of operating permits issued to all industries (including SMEs) for
wastewater discharge. Inspection and enforcement was previously inadequate, but has improved subsequent empowerment of “civic environmental monitoring teams”, which participate in environmental inspections of industry.
Ø Thailand has from the early stages of its environmental management encouraged all exporting firms to pursue ISO 14000 certification and has for a long time been a leading participant in ASEAN and
APEC in obtaining such certificates. The program was complemented by a reduction in the number of inspections of certified companies, automatic renewals of permits, and (in some cases) reduction of operating permit fees by 50%.
Advantages: Reduced transaction costs. In the case of HP, would build on existing successful reliance in India on such mechanisms.
Disadvantages: Some of the mechanisms addressing international certification may not apply to
SMEs targeting only domestic markets or buyers.
Potential application to SMEs in Baddi CETP A rating and disclosure system is currently being developed for HP under the Inclusive Green Growth DPL. Initially this is likely to be targeted at the large industries. Once in place there is the opportunity
to link high ratings with charge exemptions, while revenue from charges applicable to less highly rated companies could be used to support SMEs in terms of pre-‐treatment costs or CETP charges. In addition to incentivizing companies to be environmentally responsible, the setting up of the rating
and disclosure system is expected to enable HP to be more ‘data ready’ for the potential application of other economic incentives.
Option 5 – Supply Chain Management (SCM) Instrument
Description The supply chain for a product or family of products (pharmaceuticals, textiles) is the set of firms linked to each other by the flow of intermediate goods and services necessary for the production of that particular product or family of products.
“Greening” the supply chain is a form of management that seeks to develop collaboration and
partnerships among the stakeholders in the supply chain, and to foster cleaner production practices by the members of the supply chain. The goal is to improve industrial production efficiency and profitability by promoting the optimal use of natural resources, while reducing the environmental
impacts of industrial activity. The stakeholders in the supply chain are of course the implicated private sector firms, but also may include the government, the financial sector, and international players/donors who facilitate and encourage supply chain collaboration.
Green SCM incentivizes firms within the chain – many of whom are SMEs – to adopt cleaner
production practices because their customers – the downstream members of the chain – establish criteria that their input products must meet. For example, Sony only buys from its “Green Partners”:
Confidential Draft – Do Not Cite
HP Industry SEA Page 48 December 2013 (Draft 23/12/13)
those input producers who have adopted certain cleaner production practices. Large textile producers are also placing input production criteria on their suppliers – most of which are also SMEs.
International application
Supply chain greening is a recent phenomenon as larger international firms are becoming more responsible to their shareholders’, employees’ and consumers’ demands for sound environmental practices. Government participation is not necessarily required, but it can provide further
encouragement or facilitation as shown below.
Ø Bangladesh has proposed the development of harmonized clean production guidelines: these target mainly SME suppliers within the textile industry supply chain.
Ø Malaysia through SME Corp includes a comprehensive commitment to integration of SMEs into the
global supply chain. This includes all levels of certification, quality control, audit and compliance to regional or global standards.
Ø South Korea encourages large firms to develop Supply Chain Environmental Management (SCEM) where suppliers to the larger firms adopt clean production practices.
Advantages: Reduced regulatory responsibility. Research shows that cleaner production interventions for all sizes of industry can reduce resource and pollution compliance costs.
Disadvantages: Not necessarily a strong incentive for firms selling only into India that cater to final demand by consumers in India.
Potential application to SMEs in Baddi CETP
The pharmaceutical industry, as well as other export industries, provides a useful target for SCM. Government could provide facilitation for smaller firms through creating networks to larger firms in the supply chain (as was done in Bangladesh textile industry). Preferentially, such incentives and
facilitation would only be available to firms using the services at a CETP (as these are more readily monitored by Government) and this would provide one potential addition to any incentive package for SMEs. Such a package also indirectly addresses a practice of “dirty outsourcing” to SMEs, which
some large firms employ to sidestep their environmental compliance obligations.
Consolidated Instrument: HP SME Green Incentive Scheme
Description Based on the previous elaboration, the Himachal Pradesh SME Green Incentive Scheme consists of
five incentives in two distinct elements. These include:
Part I. License Fee/Subsidy. This takes the form of a basic fee, with a subsidy attached to it as a waiver or rebate as described in Option 1 of this chapter. Within the Baddi CETP, this is characterized by: (i) an annual environmental fee associated with the operating license; (ii) eligibility
for operating subsidies through CETP tariff relief; and, (iii) partial fee exemption if operations continue with delivery of waste to CETP. Outside of the Baddi CETP, state-‐wide provisions could be applied with holiday periods as described in Option 1.
Part II. Complementary Compliance Incentives. This takes the form of four additional incentives for
which SMEs are eligible if and only if they have a valid operating license and are compliant under Part I.

Confidential Draft – Do Not Cite
HP Industry SEA Page 49 December 2013 (Draft 23/12/13)
IIa. Capital Grant Scheme. Provides a capital grant for eligible treatment or pre-‐treatment capital costs. (see Option 2)
IIb. Soft Loan Scheme. Provides financing support in the form of soft loans for eligible treatment or
pre-‐treatment capital costs, as well as additional financing for other SME capital and operations up to defined limits. (see Option 3)
IIc. Rating & Disclosure. Provides technical assistance in meeting rating and disclosure standards. It
will also make SME eligible to receive information on clean technologies. Upon attainment of these standards, the SME will be eligible for full fee exemption and reduced reporting and inspection requirements by State authorities.
IId. Supply Chain Management (SCM). Provides facilitation and technical assistance to SMEs in meeting SCM needs of larger firms.
Priorities and Implementation Options
There remains considerable discretion over the definition and full scope of this scheme.
Priorities. In principle, the minimum package would consist of Part I and either Part II(a) Capital Grants or Part II(b) Soft Loans. This provides a long term incentive to maintain operating compliance
(through Part I) and financial assistance to overcome what are traditionally the greatest financial hurdles encountered by SMEs (through Part II(a) or II(b)). Accountability and SCM incentives in Parts II(c) and II(d) may require some longer phase-‐in period, but commitment to such schemes on
the part of Government is a logical entry point to begin to establish institutional capacity and network capacity among all stakeholders.30
Fee Phase-‐in. It is recommended that any fee structure be set at zero for a phase-‐in period that provides immediate relief but nonetheless provides a long-‐term incentive for compliance. The
nature and time of the phase-‐in period is discretionary, and for illustrative purposes it can be set to five years. For higher priority industries or for large producers the phase-‐in period may be reduced.
Scope. There is a distinct advantage to making the structure of this incentive scheme universal to all industries independent of sector or scale, and it is readily adaptable to further nuancing within such
structure. For example, exemptions of fees and accessibility to capital grants may be available only to SMEs within high priority sectors (e.g., pharmaceutical). Large firms may be eligible for only partial fee exemptions and, moreover, soft loans in such instances may be unavailable or available
only for partial financing). As a start, for example, the scheme could be targeted to SMEs in the Pharmaceutical sector with access to a CETP.
Complementary SCM Incentives for Large Firms. SCM is a powerful mechanism but in India’s context still would benefit from state facilitation. Large firms selling into domestic markets, or firms
with little ability to monitor compliance within SMEs, may have few incentives to engage in quality control SCM. The current incentives (which create “dirty outsourcing”) are largely a consequence of this. To support SMEs, Government may also consider some token complementary financial
assistance (e.g., in preparing a management plan for SCM) targeted to large domestic firms.
30 Government of HP might, for example, consider obtaining matching funds from the Ministry of MSME Development Bank (SIDBI) to reduce information and transaction costs to SMEs. Also, note that experience in Malaysia demonstrates that a strong SME institutional support structure (e.g., SME Corp) that delivers a package of incentives is a strong incentive to become compliant with regulatory norms.

Confidential Draft – Do Not Cite
HP Industry SEA Page 50 December 2013 (Draft 23/12/13)
Next Steps The HP SME Green Incentive Scheme is a concept that can contribute positively to the Industrial
Green Growth strategy. Acceptance of such a concept may require on-‐going consultations with industry on the priorities, scope and phasing of some of its elements, as noted above. Upon agreement, necessary budgetary commitments can be made by Government. It should be noted
that any adopted structure has design elements that can work towards some level of cost-‐sharing and cost neutrality. Also, the initial scope and scale of the package can be adjusted to work within budgetary constraints.
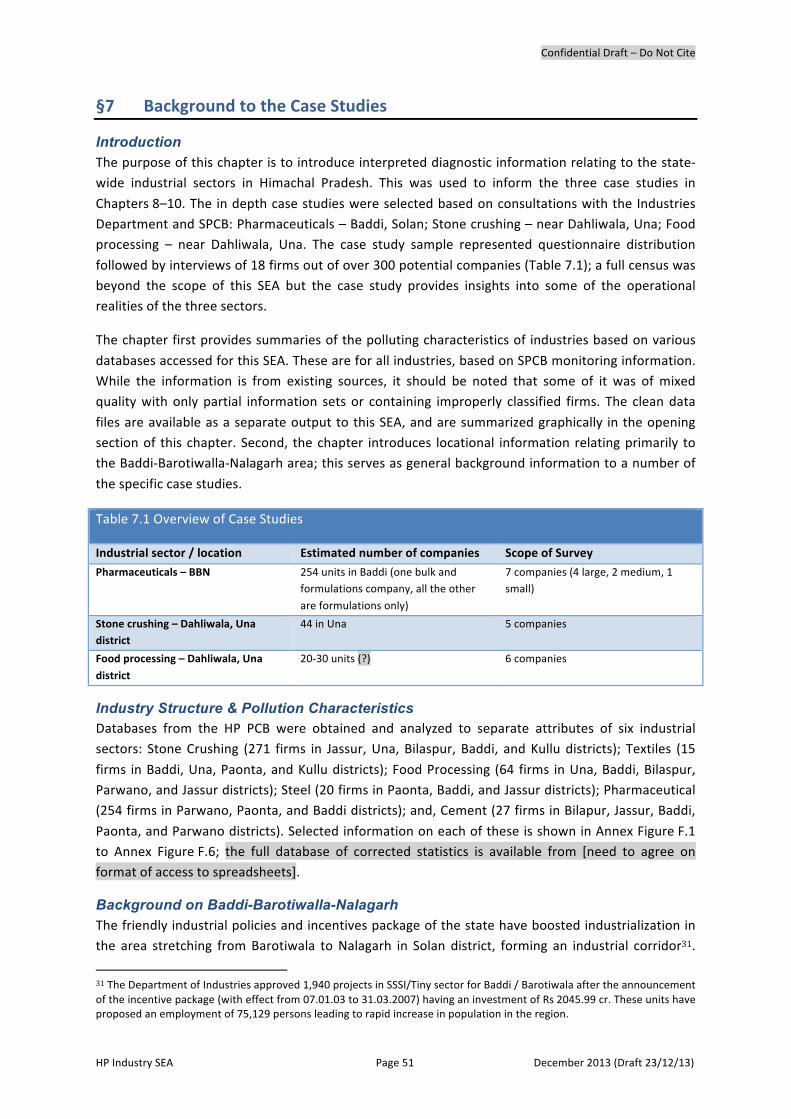
Confidential Draft – Do Not Cite
HP Industry SEA Page 51 December 2013 (Draft 23/12/13)
§7 Background to the Case Studies
Introduction The purpose of this chapter is to introduce interpreted diagnostic information relating to the state-‐wide industrial sectors in Himachal Pradesh. This was used to inform the three case studies in
Chapters 8–10. The in depth case studies were selected based on consultations with the Industries Department and SPCB: Pharmaceuticals – Baddi, Solan; Stone crushing – near Dahliwala, Una; Food processing – near Dahliwala, Una. The case study sample represented questionnaire distribution
followed by interviews of 18 firms out of over 300 potential companies (Table 7.1); a full census was beyond the scope of this SEA but the case study provides insights into some of the operational realities of the three sectors.
The chapter first provides summaries of the polluting characteristics of industries based on various
databases accessed for this SEA. These are for all industries, based on SPCB monitoring information. While the information is from existing sources, it should be noted that some of it was of mixed quality with only partial information sets or containing improperly classified firms. The clean data
files are available as a separate output to this SEA, and are summarized graphically in the opening section of this chapter. Second, the chapter introduces locational information relating primarily to the Baddi-‐Barotiwalla-‐Nalagarh area; this serves as general background information to a number of
the specific case studies.
Table 7.1 Overview of Case Studies
Industrial sector / location Estimated number of companies Scope of Survey
Pharmaceuticals – BBN 254 units in Baddi (one bulk and formulations company, all the other are formulations only)
7 companies (4 large, 2 medium, 1 small)
Stone crushing – Dahliwala, Una district
44 in Una 5 companies
Food processing – Dahliwala, Una district
20-‐30 units (?) 6 companies
Industry Structure & Pollution Characteristics Databases from the HP PCB were obtained and analyzed to separate attributes of six industrial sectors: Stone Crushing (271 firms in Jassur, Una, Bilaspur, Baddi, and Kullu districts); Textiles (15
firms in Baddi, Una, Paonta, and Kullu districts); Food Processing (64 firms in Una, Baddi, Bilaspur, Parwano, and Jassur districts); Steel (20 firms in Paonta, Baddi, and Jassur districts); Pharmaceutical (254 firms in Parwano, Paonta, and Baddi districts); and, Cement (27 firms in Bilapur, Jassur, Baddi,
Paonta, and Parwano districts). Selected information on each of these is shown in Annex Figure F.1 to Annex Figure F.6; the full database of corrected statistics is available from [need to agree on format of access to spreadsheets].
Background on Baddi-Barotiwalla-Nalagarh The friendly industrial policies and incentives package of the state have boosted industrialization in the area stretching from Barotiwala to Nalagarh in Solan district, forming an industrial corridor31.
31 The Department of Industries approved 1,940 projects in SSSI/Tiny sector for Baddi / Barotiwala after the announcement of the incentive package (with effect from 07.01.03 to 31.03.2007) having an investment of Rs 2045.99 cr. These units have proposed an employment of 75,129 persons leading to rapid increase in population in the region.
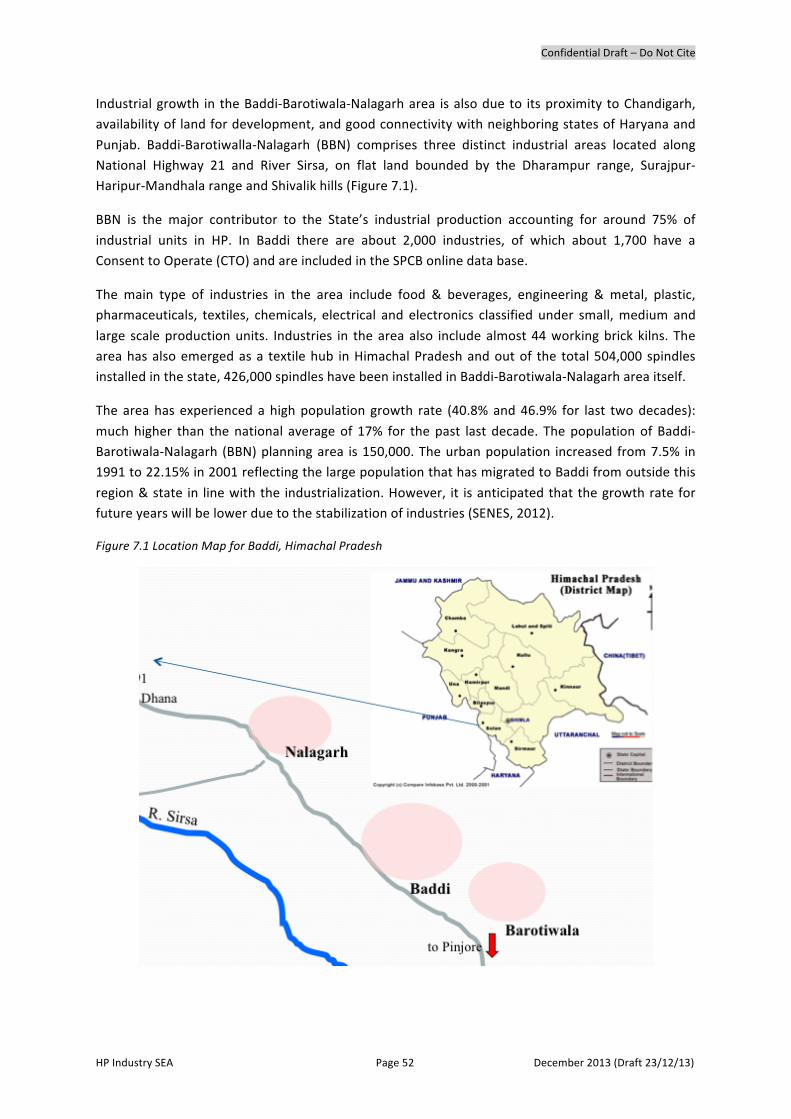
Confidential Draft – Do Not Cite
HP Industry SEA Page 52 December 2013 (Draft 23/12/13)
Industrial growth in the Baddi-‐Barotiwala-‐Nalagarh area is also due to its proximity to Chandigarh, availability of land for development, and good connectivity with neighboring states of Haryana and
Punjab. Baddi-‐Barotiwalla-‐Nalagarh (BBN) comprises three distinct industrial areas located along National Highway 21 and River Sirsa, on flat land bounded by the Dharampur range, Surajpur-‐Haripur-‐Mandhala range and Shivalik hills (Figure 7.1).
BBN is the major contributor to the State’s industrial production accounting for around 75% of
industrial units in HP. In Baddi there are about 2,000 industries, of which about 1,700 have a Consent to Operate (CTO) and are included in the SPCB online data base.
The main type of industries in the area include food & beverages, engineering & metal, plastic, pharmaceuticals, textiles, chemicals, electrical and electronics classified under small, medium and
large scale production units. Industries in the area also include almost 44 working brick kilns. The area has also emerged as a textile hub in Himachal Pradesh and out of the total 504,000 spindles installed in the state, 426,000 spindles have been installed in Baddi-‐Barotiwala-‐Nalagarh area itself.
The area has experienced a high population growth rate (40.8% and 46.9% for last two decades):
much higher than the national average of 17% for the past last decade. The population of Baddi-‐Barotiwala-‐Nalagarh (BBN) planning area is 150,000. The urban population increased from 7.5% in 1991 to 22.15% in 2001 reflecting the large population that has migrated to Baddi from outside this
region & state in line with the industrialization. However, it is anticipated that the growth rate for future years will be lower due to the stabilization of industries (SENES, 2012).
Figure 7.1 Location Map for Baddi, Himachal Pradesh

Confidential Draft – Do Not Cite
HP Industry SEA Page 53 December 2013 (Draft 23/12/13)
The Comprehensive Environmental Pollution Index (CEPI) for Baddi is 69.07, ranked 47 out of 88 industrial clusters (Central Pollution Control Board, 200932), indicating a severe level of pollution
(bordering on critical). The area has grown erratically with many industries coming up in a short time span with their associated human settlements and colonies. It has not been possible to manage this growth with the existing civic management services, leading to environmental degradation of quality
of life in the area.
Sirsa is the main river in Nalagarh. It flows from the hills above Kalka North West along the base of the Shivaliks eventually joining the Sutlej at Avankot in Ropar district. The region is drained by tributaries of Sirsa River such as Ratla, Ballad, Surajpur choe and Nanakpur emanating from the
Kasauli range. Other tributaries of Sirsa, such as Kundlu ki Khad, Chikni Khad, Khokraka choe, Kali nadi, Pola Nala, are ephemeral streams which remain dry for most of the year and are prone to flash floods during monsoons.
In the Baddi-‐Barotiwala region, the chota kalta Nala, Pula Nallah, Sandholi Nallah etc are the minor
tributaries bringing water to the River Sirsa. These natural drains usually accommodate runoff during the monsoon season. However, following the industrial development in the region these nallahs carry industrial effluents as well as runoff and during the lean period they are used just as natural
industrial drain carrying wastewater from the adjacent industrial clusters. There have been public complaints regarding river pollution (UPL, 2010).
There is a Common Effluent Treatment Plant (CETP) under construction for the Baddi-‐Barotiwalla (BB) area, and a Detailed Project Report (DPR) for a CETP for Nalagarh for which funding is being
sought33. For hazardous waste, the Shivalik Solid Waste Management Limited located in Nalagath caters for the entire State.
Municipal Solid Waste (MSW) management is considered to be a key issue in Baddi as there are
currently no facilities for non-‐hazardous waste, although there is a DPR for the BBN area, which is awaiting Ministry of Environment and Forests (MOEF) clearance34. The Municipal Corporation in Nalagarh is also in the process of constructing a solid waste management site. Water quality and
quantity is also increasingly becoming an issue. With increasing water scarcity industries try to reuse treated effluent so as to reduce their raw water requirements. While availability of labor is not a problem, there are no low-‐income housing areas in BBN. About 75 areas of private land have been
identified to address this gap.35
Baddi Barotiwala Nalagarh Development Authority (BBNDA) is a Special Area Development Authority created by the state government of Himachal Pradesh for comprehensive and regulated development of the Baddi-‐Barotiwala-‐Nalagarh area (BBNA), which is identified as one of the
32 Central Pollution Control Board, 2009. Comprehensive Assessment of Industrial Clusters. Ministry of Environment and Forests. The CEPI is explained with national information in Annex F. 33 UPL Environmental Engineers Ltd. 2013. Treatability Study for Nalagarh and Lodhimajra Industrial Areas. Prepared for the Department of Industries Single Window Clearance Agency – Industrial Area Development Agency – Baddi, District Solan H.P. 34 SENES Consultants India Pvt. Ltd, 2012. Detailed Project Report. Municipal Solid Waste Management Plan for Baddi, Barotiwala & Nalagarh Area, Himachal Pradesh. Submitted to: Baddi Barotiwala Nalagarh Development Authority (BBNDA). 35 There are a number of squatter camps apparently used by (migrant) workers on the outskirts of Baddi and the border with Harayana State (observed on field trip).
Confidential Draft – Do Not Cite
HP Industry SEA Page 54 December 2013 (Draft 23/12/13)
important growth centers of Himachal Pradesh having two major urban centers i.e. Baddi-‐Barotiwala and Nalagarh.
Industries in BBN have come together to form the Baddi Barotiwala Nalagarh Industrial Association
(BBNIA), which is a powerful, proactive and environmentally sensitive industrial association36. The association is playing a key role in creating and maintaining communications between government, industries and society at large, and disseminating information to its constituent members. Members
of the BBNIA include pharmaceutical industries (largest in number), textiles, food, electroplating and other miscellaneous industries. In 2006, BBNIA took the lead in establishing the State’s Transfer Storage and Disposal Facility (TSDF) in Nalagarh through a Special Purpose Vehicle, which includes
equity contributions from about 1,000 industries in BBN. More recently they have led in establishing the Baddi Infrastructure company, responsible for the design, construction and operation of the CETP. BBNIA has three main ongoing projects: (i) the CETP (total cost of Rs 650 million); (ii) 14.5 km
of road construction – Rs 150 million; and, (iii) a Skill Development Centre – Rs 100 million.
PCB views on incentives The Baddi PCB felt that incentives should not be given to industries for their private assets or
equipment, as there is no way to determine whether these are actually purchased and used. Instead the focus of incentives should be to create public industry infrastructure such as the CETP. BBNIA’s CETP covers industries in Baddi & Barotiwala industries, but other areas in HP such as Nalagarh,
Parwanoo, Paonta Sahib / Kala Amb and Una also need CETPs. Incentives could be provided to establish these CETPs.
Other areas that could be promoted through (financial) incentives in Baddi are: (i) recharging of groundwater through watershed approaches and greening initiatives; and, (ii) industrial waste
management.
Common Effluent Treatment Plants (CETP)
Baddi CETP A CETP in Baddi is being financed through a Central Government grant (Rs 580 million); a State Government grant (Rs 70 million); PCB grant (Rs 30 million), industry contributions (Rs 100 million),
with the balance expected to be sourced through financial institutions as loans.
Construction of the CETP started in February 2013. It has a design capacity of 25 MLD, which could be expanded to 40 MLD in the future with additional investment. A High Court order has made it mandatory for all the industries in the Baddi-‐Barotiwala (BB) area to connect to the CETP37. The SPCB
has also indicated that CTO will only be renewed if an industry is a CETP member. As it is being mandated, the Baddi PCB is of the view that there is no need for any incentive schemes for industries to release their effluent to the CETP. However, the strict mandate may not be
36 BBNDA is facilitating an ongoing greening initiative. About 100 areas of Government land have been identified, and NOC have been obtained. The next step is to develop agreements with various industries. In addition, 10-‐12 km of roadside tree plantations have been planned. Line Departments, e.g. Electricity Board, IPH and HIMUDA are being encouraged to green their respective areas and the Municipal Council is being encouraged to revive its 15 parks. It is planned to rename a circle Paryavaran Chowk (Environment Circle), which the PCB will then maintain. 37 Recall that some 1,700 have a Consent to Operate. Given its location (in Baddi), the CETP will not connect any industries from Nalagarh.

Confidential Draft – Do Not Cite
HP Industry SEA Page 55 December 2013 (Draft 23/12/13)
enforceable, or may result in the closure or loss of some firms, especially those of smaller scale. For these, schemes such as those identified in Chapter 6 may be warranted.
A special purpose company of BBNIA, Baddi Infrastructure, is responsible for the investment and has
contracted UPL Consultants to complete the project by August 2014. Baddi Infrastructure is actively encouraging industries to become CETP members. Membership involves a contribution towards the CETP’s fixed and operating costs, based on an agreed formula included in the Detailed Project
Report (DPR) and compatible with a model for a CETP in operation in Ankleshwar, Gujarat. To date 183 industries have become CETP members providing around Rs 45 million in funding (about 50% of the total anticipated industry contribution). The existing members account for about 18 MLD of the
plant’s capacity. Most of the remaining industries to sign up are small, with a corresponding small effluent load. Once the CETP is operational, operating charges will be collected from companies or operating units based on the effluent load being treated.
With a land area of nearly 35 km2 the Baddi & Barotiwala industrial belt accommodates a diverse
group of wet processing plants like textiles, food, beverages, paper, detergents, pharmaceuticals, pesticides, chrome plating and pickling. As such the effluent likely to be discharged into the common effluent treatment plant will be heterogeneous in character. Most of the units are already equipped
with their own waste treatment devices, but the complexity of the effluent makes it extremely difficult to meet the statutory standards despite best efforts (UPL, 2010). The DPR presents the results of a sector specific effluent load investigation. While food waste is easily biodegradable, the
pharmaceutical effluent is extremely harsh in the breakdown of non biodegradable recalcitrant, as is the handing of the residual refractory chemicals once the biodegradable portion is eliminated out for the detergent industries. The paper sector has the challenge of suspended solids. Textile effluent
poses a major problem of color removal as well as its total dissolved solid management which raises the TDS level exorbitantly of the resultant treated stream unless some suitable technique is called
for in the very beginning of its proper management.
In addition, there are some miscellaneous wastes such as chrome plating and the pickling wastes, which do not possess biological matter, but are contaminated with toxic heavy metals, acidity and high inorganic salts placing them in the red listed category alongside pesticides. Fortunately, the
volume of such effluent is small. There are also a few oil industries in the locality. Its effluent parameter is also found in the extreme range despite the fact its share in the overall effluent management is remarkably low.
The CETP is the first in India to adopt a segregated treatment approach. The separate treatment of
effluents is being pursued to reduce running cost and to reclaim the water; it can serve as a model for other CETPs across the country. Separate treatment is planned for (i) textile, food and paper – 16 MLD; (ii) Soaps & surfactants – 2 MLD; (iii) Pharmaceuticals – 2 MLD; (iv) Dyeing concentrates
(Textiles) – 2 MLD; and, (v) Electroplating and miscellaneous industries – 0.7 MLD. Of the total 25 MLD effluent that the CETP will be treating, 13 MLD will be from textiles (7 industries), 2 MLD each will be from paper, pharmaceuticals and soap & surfactants, 2 MLD will be from miscellaneous
industries, 0.9 MLD will be from food and about 3 MLD will be the sewage from industrial sources.
A pilot plant is being commissioned in late 2013 to inform the final design of the commercial-‐sized plant, which is expected to be commissioned by August 2014. The industries are scattered over a large area and transportation of the effluent is a concern. Fabrication of the pipeline has started

Confidential Draft – Do Not Cite
HP Industry SEA Page 56 December 2013 (Draft 23/12/13)
and the pipeline network and route have been identified. Completing the pipeline, however, is recognized as a major challenge. About 70 km Glass-‐lined Reinforced Plastic (GRP) pipeline will need
to be laid over a 23 km stretch. For isolated industries, for which the cost of installing a pipeline connection is considered to be too high, a tanker system will be used to collect effluent.
The CETP will help to address the industrial pollutants released into the 4 / 5 natural drains or nallahs leading to the Sirsa River. However, even with the CETP in place the natural drains / nallahs
leading to the River Sirsa will continue to carry untreated sewage as there is no sewerage treatment plant in BB. There is an initiative to expand the CETP into a combined plant to treat sewage as well. The estimated cost of this is Rs 700 million (About Rs 400 million for the pipeline and Rs 300 million
for the plant expansion).
Raw and treated water is a scarce commodity and reuse of CETP’s treated water is also being considered. According to the DPR the recovery and reuse of the respective streams are:
• Pharmaceuticals effluent will yield the nano permeate of less than 10 COD and TDS<1500
mg/L. This could be reused in any industry except the food and pharmaceutical sector. 2,200 KLD is expected to be recovered.
• Textile dye effluent will yield around 2,000 KLD of high saline water with TDS 40,000 -‐ 50,000
mg/L. This could be reused in the textile cotton dyeing process.
• The major part of water will be reclaimed through textile, food, paper and sewerage
contributing to 20 MLD under full capacity utilization.
Table 7.2: Overall Load Profile of Baddi CETP
Parameter Sector
Total load Textile Food Paper Detergent Pharma Electro
plating Misc
Volumetric Loading KLD 12,989 2,432 2050 1,961 2,903 42 193 22,570
Average COD Load (kg/d) 14,300 8,232 1086 18,606 8,271 203 902 51,600
Average BOD Load (kg/d) 4,661 4,411 429 4,706 3,466 2 21.4 17,696
Average TDS Load (kg/d) 43,229 4,039 2388 5,343 7,001 360 189 62,549
Non-‐biodegradable load (kg/d)
2,648 -‐ 13.5 6,841 -‐ 200 849
Average COD, mg/L 1,101 3,384 530 9,488 2,849 4,788 4,675
Average BOD, mg/L 359 1,813 209 2,400 1,194 46 111
Average TDS, mg/L 3,328 1,661 1165 2,724 2,412 9,747 980
Average COD/BOD 3.1 1.9 2.5 4.0 2.4 -‐ 42.1
Source: DPR

Confidential Draft – Do Not Cite
HP Industry SEA Page 57 December 2013 (Draft 23/12/13)
Table 7.3: Sewage load by sector
Sources Sewage Load, KLD
Textile, food & paper 945.25
Pharmaceuticals 363.45
Soap & detergents 192.5
Total of above units 1,051.2
Provisional 1,051.2
Future aspects 2,000
TOTAL SEWAGE LOAD 4,102.4
Source: DPR
Table 7.4: Draft Treatment Costs by Sector
Sector Basic Treatment Cost /KL
Conveyance Maintenance (20%)
Depreciation
Depreciation Profit (15%) Total / KL
Textile, food, paper & sewage
Rs 6 Rs 2 Rs 1 Rs 1.5 Rs 1.5 Rs 12
Soap & detergent
Rs 10 Rs 2 Rs 2 Rs 2 Rs 2 Rs 18
Pharma Rs 16 Rs 2 Rs 4 Rs 4 Rs 3 Rs 29
Textile Dye Effluent
Rs 14 Rs 2 Rs 4 Rs 4 Rs 3 Rs 27
Misc Rs 50 Rs 50
Source: DPR
Proposed CETP Nalagarh and Lodhimajra Industrial Areas Nalagarh and Lodhimajra are rapidly growing industrial zones in Solan district. A survey was
undertaken to understand the quantity and quality of effluent generated by the industries located in the area to help design the proposed CETP. Pharmaceutical and Textile industries were found to be the major contributors in terms of their effluent quality.
In Lodhimajra there are 11 major industries (including pharmaceutical, textile and electrical
industries) producing 360 m3/d of effluent flow. In additional there are around 100 small-‐scale industries, which are assumed to be producing another 200 m3/d of effluent.
Nalagarh hosts around 73 major industries contributing 4,500 m3/d (including textiles, pharmaceuticals, food processing, auto, electrical and electronics, cement, breweries, steel rolling
mill, power, chemicals). Another 100 industries are assumed to be producing 300 m3/d of effluent. The nine textiles units generate 61% of total effluent. While there are more Pharmaceutical units (21), they generate a relatively small amount of effluent – 6% of the total effluent.
Effluent samples were collected from 42 different industries located in Nalagarh and Lodhimajra.
Survey data show that the quantity of sewage flow is about 500 m3/d mixed with industrial effluent
and another 500 m3/d sewage form small scale industry. Based on a sample of 10 major industries in Lodhimajra area, COD is in the range of 50-‐5,000mg/l and BOD range is 10-‐4,000mg/l.
Based on a sample of 36 major industries in Nalagarh area, COD is in the range of 10-‐10,000 mg/l and BOD range is 10-‐2,800 mg/l.

Confidential Draft – Do Not Cite
HP Industry SEA Page 58 December 2013 (Draft 23/12/13)
Studies show that COD can be reduced to 144 mg/l and BOD to 6.0 mg/l after 24hours of biological treatment followed by tertiary treatment of Nalagarh and Lodhimajra’s composite effluent. Solid
waste within the effluent was found to be bio-‐degradable in nature so separate Primary treatment for the TSS removal is not considered to be necessary. Total flow for the proposed CETP is 6,360 m3/d.38
Transfer Storage and Disposal Facility (TSDF) There is one TSDF in HP located in Nalagarh that caters for the entire state and has been in operation since late 2008. The TSDF was established on land provided by the Industry Department
following Supreme Court Guidelines that every state should establish a TSDF. The TSDF is a joint venture between the BBNIA and UPL Environmental Engineers Limited. Around 1,060 industries are equity holders in the company, and around 1,020 industries are TSDF members.
The total capacity of the TSDF is 1 million metric tons, with approximately 20 cells of 50,000 metric
ton capacity. When the TSDF was designed, slag from the ferrochrome industry was considered to be hazardous waste and was expected to be treated at the TSDF. Subsequently, slag was reclassified as non-‐hazardous by the MOEF and CPCB and as a result the quantity of hazardous waste reaching
the TSDF was drastically reduced. The break-‐even point for the TSDF is 2,200 metric tons of waste per month but currently the TSDF only receives 1,300 metric tons. To remain financially viable, the company has started additional activities such as cleaning used drums, collecting lead acid batteries,
collecting used waste oil, crushing used fluorescent lamps, facilitating e-‐waste transfers to recyclers and pre-‐processing high calorific waste to cement plants. In the future, the company is planning to engage in laboratory services and in EIA consulting services.
About 60% of the hazardous waste treated at the plant is from textile units, followed by food
processing and soaps & surfactants. The pharmaceutical sector accounts for less than 10% of the hazardous waste reaching the TSDF. All hazardous waste is thought to reach the TSDF. However, Shivalik Solid Waste Management Limited, which operates the TSDF, has repeatedly requested a
process audit to be mandated of all industries generating hazardous waste so that the quantities generated can be tallied with the quantities reaching the landfill. Incentivizing the conduct of process audit appears a possibility.
Municipal Solid Waste Management Plan for BBN Currently there is no waste processing or treatment facility for the Baddi-‐Barotiwala area. Waste is disposed of in the valley, low-‐lying areas and along the riverbanks, triggering regular public
protests39.
Key sources of waste are residential, commercial, institutional, markets, public utilities and industrial units in Baddi MC Area and Barotiwala industrial clusters. Waste is generally comprised of organic bio-‐degradable waste such as food waste from households, hotels, restaurants, park and garden
waste, dry recyclable waste such as paper, plastic, cardboards from commercial and industrial units,
38 UPL Environmental Engineers Ltd. 2013. Treatability Study for Nalagarh and Lodhimajra Industrial Areas. Prepared for the Department of Industries Single Window Clearance Agency – Industrial Area Development Agency – Baddi, District Solan H.P. 39 Use of Plastics has been banned in the Baddi MC area under strict instructions from the state government for a “plastic free” state.
Confidential Draft – Do Not Cite
HP Industry SEA Page 59 December 2013 (Draft 23/12/13)
inert waste material such as glass, ceramic, and metal waste. Road sweeping and drain cleaning generate dust and silt which are inert materials with some biodegradable component.
To address the solid waste management (SWM) problems, BBNDA intends to facilitate an integrated
solid waste management service (waste segregation, collection, transportation, processing and disposal) in Kainduwal village, Baddi. The total capital cost of the proposed project is Rs 970.89 lakhs, with operating costs estimated at Rs 89.67 lakhs a year. The future development cost is
Rs 412.63 lakhs, which is for the construction of a new landfill cell after 7.5 years in 2019-‐20. The total revenue from the MSW project is expected to be Rs 82.17 lakhs per annum (from the sale of compost and recycling).
It is intended that the project will be implemented through a Public Private Partnership (PPP) under
a DBOT (Design Build Operate Transfer) mechanism. Private sector involvement in municipal solid waste management is growing rapidly in the country and the Ministry of Urban Development (MoUD), Government of India recognizes PPPs as an important element in improving service delivery
in Municipal Solid Waste Management (MSWM), in addition to attracting the external investment.
Quantification of waste generated by source was carried out by SENES covering residential, commercial, institutional, street sweeping and drain cleaning, markets, function halls, cinema halls, etc. The waste generation rates are based on field surveys, waste sampling and discussion with the
different waste generators and the officials in Baddi MC, Nalagarh MC and BBNDA. Domestic household waste forms the major component of total MSW generated in BBNDA, estimated at 8.7MT. There are about 3,100 commercial establishments operating in Baddi MC, Nalagarh MC,
majority of them are general shops, petty shops, electrical and electronics, whole sale & retail stores etc. The major waste generating sources are bakeries, juice shops, pan shops, cold drink shops,
vegetable stalls, coconut vendors, etc. Based on the survey it was concluded that commercial establishments in Baddi and Nalagarh MC generate 2.5 MT of solid waste every day with a unit generation rate of 0.805 kg/d.40
40 Source: SENES Consultants India Pvt. Ltd, 2012. Detailed Project Report. Municipal Solid Waste Management Plan for Baddi, Barotiwala & Nalagarh Area, Himachal Pradesh. Submitted to: Baddi Barotiwala Nalagarh Development Authority (BBNDA).

Confidential Draft – Do Not Cite
HP Industry SEA Page 60 December 2013 (Draft 23/12/13)
Box 7.1: Baddi Barotiwala Nalagarh – PPP for a CETP for Pharmaceuticals and Allied Industries Cluster [to be updated]
The Baddi Barotiwala Nalagarh Development Authority (BBNDA) was created in 2006. It is located in Baddi. Its functions include the preparation and execution of a master plan for the entire area, the promotion of Public Private Partnership (PPP) in infrastructure development and delivery. The BBNDA State Level Executive Committee includes representation from the HP SPCB. The BBNDA master plan indicates that industries with polluting effluents, situated in industrial zones, are to provide purification plants as “may be prescribed by the Competent Authority or the HPPCB.”
There is also a BBN Industry Association (BBNIA) to “promote, develop and encourage commerce trade and industry in this area”. In 2010 the BBNIA proposed the installation of a CEPT in the BBN Pharmaceutical Cluster, under the Industrial Infrastructure Upgradation Scheme (IIUS). The cost of CEPT project, which also includes two smaller projects for road upgrade and skill development, is to be shared between the industries (20%), and the Central and State governments (80%). The installation contract for the 23 MLD CEPT was awarded in September 2011, and the work was expected to take 18 months. Hence, if it received timely Environmental Clearance from the MOEF, it may be up and running now.
The Common Effluent Treatment plant (CETP) at Baddi. The CETP is scheduled for completion in June 2014 and will serve 700 industries in Baddi. Connection to the CETP will be mandatory, but there is some reluctance as it will require companies to pre-‐treat their effluent and pay a user charge. An economic instrument could be focused on supporting the Pharmaceutical Industry (formulation units) to connect to the CETP. This could be used as an example for the future analysis of the other types of industries that will be connected to the CETP. Incentives could include funding of pre-‐treatment equipment (capital cost), Operation and Maintenance costs, or reductions in charges for compliance. There has already been significant investment in the CETP, and therefore incentive mechanisms to ensure that the system functions effectively could be considered a priority. There is an effective Industrial Association in Baddi, who should be consulted in the design of the economic instrument.
Confidential Draft – Do Not Cite
HP Industry SEA Page 61 December 2013 (Draft 23/12/13)
§8 Case Study 1 – Pharmaceuticals
Introduction The pharmaceutical sector is a rapidly growing industry in India, and is identified as a “Thrust Industry” in HP. The Indian pharmaceutical industry has been growing at a compounded annual
growth rate of more than 15 per cent over the last five years and has significant growth opportunities. According to industry estimates, the Indian pharmaceutical sector is expected to grow five-‐fold to reach Rs 5 lakh crore (US$91.45 billion) by 2020. India commands a significant share of
global exports in this industry, and the production of so-‐called “Active Pharmaceutical Ingredients (APIs)” will continue to grow in response to ongoing incentives. 41 From an environmental management perspective, the chemical composition of such APIs makes their impacts uncertain, and
often dependent upon the receiving medium and other chemical and biological characteristics of those media. Recent issues in China, for example, prompted regulators in 2010 to increase standards and oversight of pharmaceutical discharges; the management response has also been to focus on
isolating the industries in industrial estates using common treatment facilities. Such an approach is also appropriate for HP, although its implementation will also require the design of financially sustainable treatment facilities that are capable of addressing the specific scales and compositions
of pollutants. The adoption of user charges within the context of regulated spatially sensitive industrial estates is a policy model that is appropriate to such a situation (e.g., see Box 3.1).
According to the HP Drug Manufacturers Association42, there are approximately 700 Pharmaceutical units in HP: 375 in BBN, 150 in Poanta Sahib, Nahan & Kala Amb; 100 in Parwanoo and Solan; and,
100 in Kangra – Una & Tahliwala. All companies are engaged in formulations only, with the exception of one company engaged in bulk drugs and formulations. According to the SPCB there are 254 online pharmaceuticals units in Baddi – 188 Small, 39 Medium and 27 Large. The reason for the discrepancy
in the data sources may be partly due to different classification; the PCB database is currently being streamlined in order to improve its accuracy {is this them or “us”? If “us” we should remove).
The pharmaceutical companies do not use much water, and hence do not generate significant wastewater. They use solvents, which are recovered and reused and therefore not released as
effluents. Overall, the pharmaceutical sector contributes 2 kilo liters per day (KLPD) out of the 25 KLPD that the CETP in Baddi is being designed to treat. As such, they are not major contributors to the effluent problem in the BBN area both in terms of quality and quantity.
The HP Drug Pharmaceutical Association estimates that 80% of pharmaceutical units meet pollution
norms. Large and medium units will not take the risk of having their power cut off by the SPCB for non-‐compliance, and they have in-‐built testing and laboratory facilities. However, among the small industries, only those who can afford to strive to achieve the pollution standards. The CETP will
therefore provide a needed service for the small industries, but it will also cost them something to connect to the CETP, and incentives could promote uptake where such costs are considered to be a
burden.
41 Global regulation is also becoming of increased significance. In India, access to European markets after July 2013 will require valid certifications of facilities in compliance with global regulatory requirements. In early 2013, India designated the Central Drugs Standard Control Organisation (CDSCO) to be the competent authority to certify exports of Active Pharmaceutical Ingredients (APIs) to European Union. 42 This Association is responsible for the whole of HP and covers pharmaceutical units in the BBN area, Solan, Kangra and Simaur. HP DMA is attached to the India DMA.
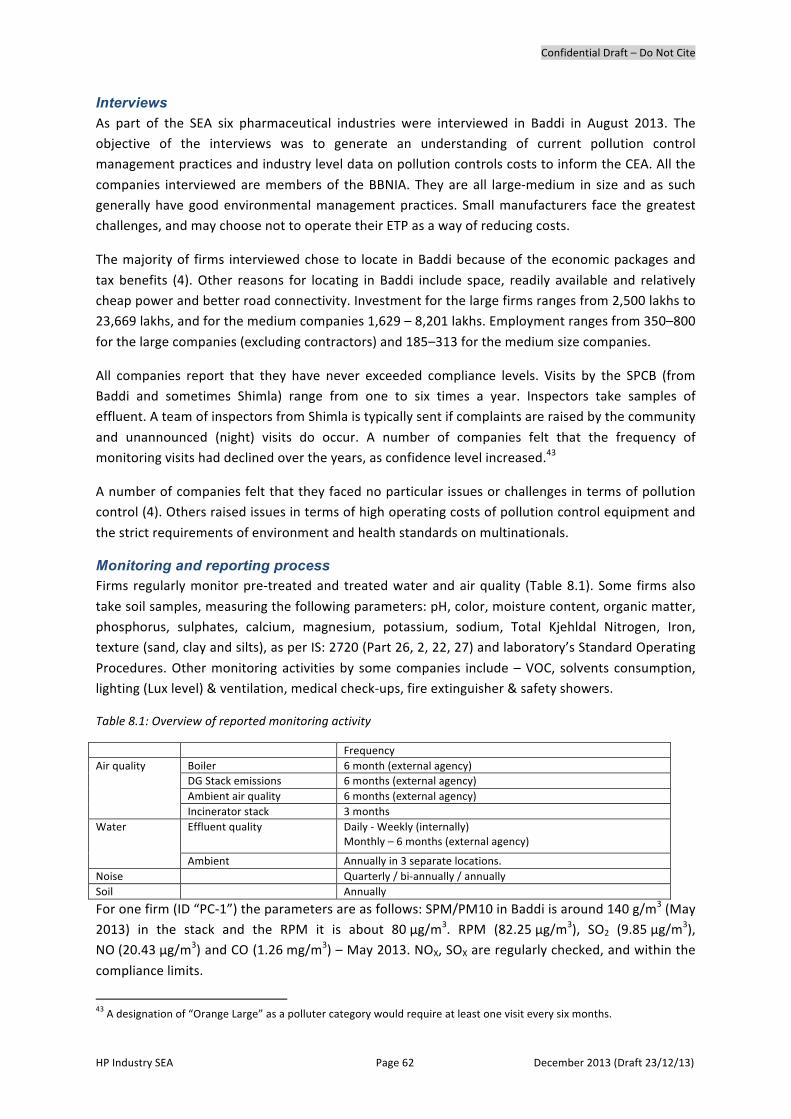
Confidential Draft – Do Not Cite
HP Industry SEA Page 62 December 2013 (Draft 23/12/13)
Interviews As part of the SEA six pharmaceutical industries were interviewed in Baddi in August 2013. The objective of the interviews was to generate an understanding of current pollution control management practices and industry level data on pollution controls costs to inform the CEA. All the
companies interviewed are members of the BBNIA. They are all large-‐medium in size and as such generally have good environmental management practices. Small manufacturers face the greatest challenges, and may choose not to operate their ETP as a way of reducing costs.
The majority of firms interviewed chose to locate in Baddi because of the economic packages and
tax benefits (4). Other reasons for locating in Baddi include space, readily available and relatively cheap power and better road connectivity. Investment for the large firms ranges from 2,500 lakhs to 23,669 lakhs, and for the medium companies 1,629 – 8,201 lakhs. Employment ranges from 350–800
for the large companies (excluding contractors) and 185–313 for the medium size companies.
All companies report that they have never exceeded compliance levels. Visits by the SPCB (from Baddi and sometimes Shimla) range from one to six times a year. Inspectors take samples of effluent. A team of inspectors from Shimla is typically sent if complaints are raised by the community
and unannounced (night) visits do occur. A number of companies felt that the frequency of monitoring visits had declined over the years, as confidence level increased.43
A number of companies felt that they faced no particular issues or challenges in terms of pollution control (4). Others raised issues in terms of high operating costs of pollution control equipment and
the strict requirements of environment and health standards on multinationals.
Monitoring and reporting process Firms regularly monitor pre-‐treated and treated water and air quality (Table 8.1). Some firms also
take soil samples, measuring the following parameters: pH, color, moisture content, organic matter, phosphorus, sulphates, calcium, magnesium, potassium, sodium, Total Kjehldal Nitrogen, Iron, texture (sand, clay and silts), as per IS: 2720 (Part 26, 2, 22, 27) and laboratory’s Standard Operating
Procedures. Other monitoring activities by some companies include – VOC, solvents consumption, lighting (Lux level) & ventilation, medical check-‐ups, fire extinguisher & safety showers.
Table 8.1: Overview of reported monitoring activity
Frequency Air quality Boiler 6 month (external agency)
DG Stack emissions 6 months (external agency) Ambient air quality 6 months (external agency) Incinerator stack 3 months
Water Effluent quality Daily -‐ Weekly (internally) Monthly – 6 months (external agency)
Ambient Annually in 3 separate locations. Noise Quarterly / bi-‐annually / annually Soil Annually
For one firm (ID “PC-‐1”) the parameters are as follows: SPM/PM10 in Baddi is around 140 g/m3 (May 2013) in the stack and the RPM it is about 80 μg/m3. RPM (82.25 μg/m3), SO2 (9.85 μg/m
3), NO (20.43 μg/m3) and CO (1.26 mg/m3) – May 2013. NOX, SOX are regularly checked, and within the
compliance limits.
43 A designation of “Orange Large” as a polluter category would require at least one visit every six months.

Confidential Draft – Do Not Cite
HP Industry SEA Page 63 December 2013 (Draft 23/12/13)
Annex F presents BOD & COD monitoring data provided by the companies and data recorded in SPCB online database. The SPCB data suggest a number of compliance breaches.
All companies have ETPs and scrubbers to control air pollution as summarized in. Process waste goes
to the Shivalik TSDP at Rs 23 per kg. The waste is highly organic and has a high calorific value and is sent to cement plants after pre-‐processing.
Not all companies reported the capital and operating costs of pollution control equipment. From the available information a large company spends up to Rs 20 million on pollution control equipment,
ETP capital costs range from Rs 450,000 – Rs 2,500,000, and a scrubber can cost Rs 1,200,000. Operating costs range from Rs 480,000 – Rs 1,800,000 per year. While company specific information on labor costs was not available, most companies claim to pay more than the minimum wage of
Rs 4,500 per month. Administrative costs relating to pollution control are not kept by the companies.
A number of companies are already members of the CETP in Baddi (4) and are happy with the proposed arrangement. Once the CETP is established, companies plan to continue with their primary
pre-‐treatment of effluent (pH setting and equalization) but stop secondary treatment (distillation process) as that will be done by the CETP.
Concerns related to the CETP include: (i) the tripartite agreement appears biased in favor of UPL; (ii) the monitoring process and penalties for non-‐compliance have not been specified; (iii) the CETP
will deprive companies of recycled water (treated effluent is currently used to serve the raw water needs of the industry); (iv) the cost, governance and risk associated with being wholly dependent on the CETP; and, (iv) transportation of the effluent through the pipeline, as it is still not clear how the
scattered industries will be connected and laying the pipeline will be a challenge.
Views on economic instruments Three companies are currently benefiting from a Government subsidy (a 10 year excise duty
exemption). One company reported that although this exemption is valid up to 2016 it is a very small amount and of little advantage. In addition two companies previously enjoyed benefits (e.g. central subsidy of Rs 30 million and 5-‐year income tax holiday and excise holiday, and 100% income tax
exemption).
Most companies (4) would partake in a soft or subsidized loan scheme for implementing pollution controls if offered. Others felt that such schemes were unnecessary as they already had pollution
equipment in place or the company was committed to meeting the costs for implementing pollution control itself.
Companies were broadly supportive of incentives schemes for other equipment or operational costs (not necessarily pollution control), especially given the fact that pollution control equipment is
already in place. Soft loans or subsidies for harnessing of solar energy were cited as an area of interest.
Voluntary certification Two companies have both ISO 14001 and OHSAS 18001 certification, and one company has
ISO 14001 in place. Some companies are considering these certifications while others feel that their

Confidential Draft – Do Not Cite
HP Industry SEA Page 64 December 2013 (Draft 23/12/13)
own management systems, existing US Food and Drug Administration approval, or drug certification is enough to manage most environmental issues.
Investments in energy efficiency Energy efficiency is a focus for a number of companies (5), often driven by economics (reducing operating costs), and in some cases feeding into corporate initiative on CO2 reduction. A number of
companies claim to be regularly monitoring and improving efficiency. While specific accounts of expenditure on energy efficiency investments and savings were not available, one company estimates an investment of about Rs 8 million per year. Existing initiatives include: (i) the
introduction of variable drive motors to reduce energy use and save money; (ii) a move to Compact Fluorescent Lamps (CFLs); (iii) sensor-‐based lighting; (iv) boiler auto-‐system for condensate recovery; (v) heat exchangers; (vi) efforts not to run the plant during peak hours; (vii) turning off lights during
breaks; and, (viii) purchase of energy efficient equipment.
All companies have taken out a variety of insurance covers. These include: (i) Public Liability Insurance to address any compensation to the community if there is an accident – this is a mandatory requirement of the SPCB; (ii) Asset insurance; and, (iii) Buildings insurance.

Confidential Draft – Do Not Cite
HP Industry SEA Page 65 December 2013 (Draft 23/12/13)
§9 Case Study 2 – Stone Crushing
Una District
Una is a small foothill district located at the South Western border of HP. It is bounded in the North by Kangra District, in North-‐East by Hamirpur District, in South-‐East by Bilaspur District and by Punjab in West and South. The population is 521,057 (2011 census, provisional).
Industrial areas in Una district include Mahetpur (South-‐Central), Tahliwal and Bathri (South–
Central), Gagret (North-‐West) and Amb (North-‐Central). The River Soan (pronounced as “Swan”) flows through the district from the North-‐west and provides industries with their water requirements, as well as acting as a repository for industrial waste water (both treated and un-‐
treated). The district is significantly less industrialized than the Baddi-‐Barotiwala-‐Nalagarh area. The local PCB office is in the town of Una, the capital of Una district.
Environmental management priorities according to the HP PCB are:
Ø There are clusters of small industries in Una district that require a common effluent treatment plant
(CETP), as it is not financially viable for these industries to individually treat their effluent. CETPs, smaller in size to the one under construction in Baddi-‐Barotiwala, should be explored in Bathri
(covering about 9 units), Tahliwal (covering about 12 units), Mehatpur (covering 12 units) and Dhamndri (covering 6 units).
Ø Intervention is required to improve the environmental performance of brick kilns, through the
Figure 9.1: District Map of Una
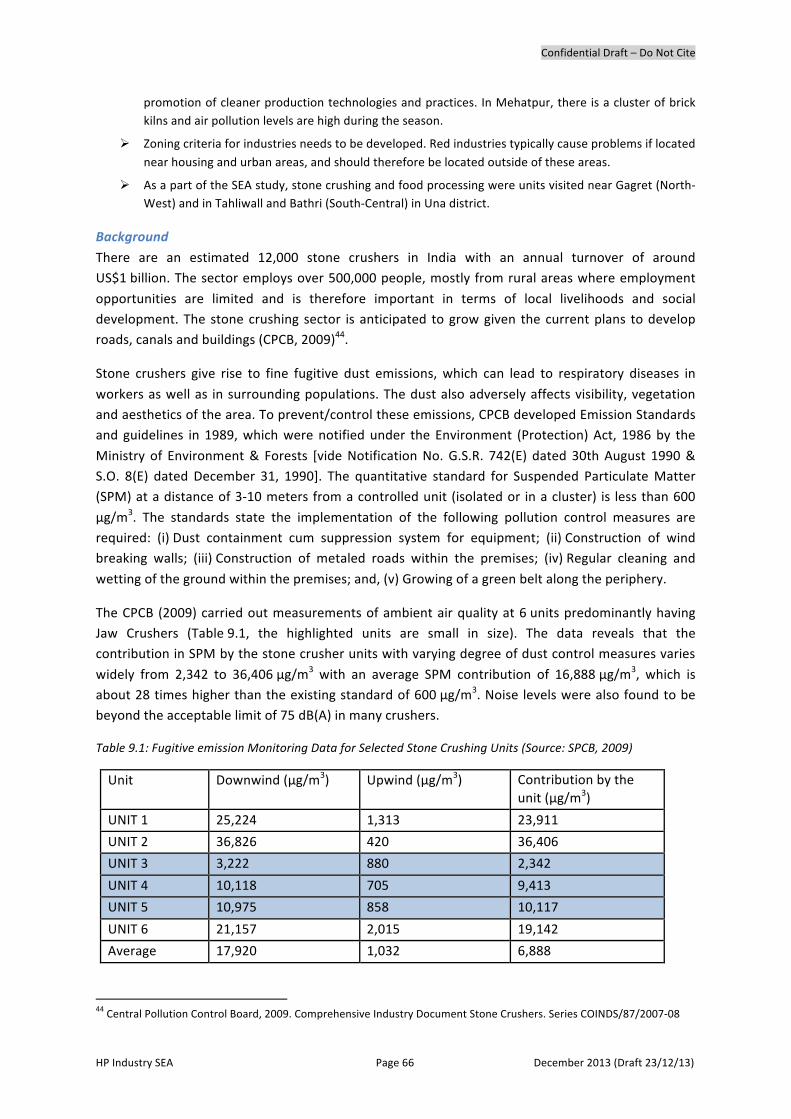
Confidential Draft – Do Not Cite
HP Industry SEA Page 66 December 2013 (Draft 23/12/13)
promotion of cleaner production technologies and practices. In Mehatpur, there is a cluster of brick kilns and air pollution levels are high during the season.
Ø Zoning criteria for industries needs to be developed. Red industries typically cause problems if located near housing and urban areas, and should therefore be located outside of these areas.
Ø As a part of the SEA study, stone crushing and food processing were units visited near Gagret (North-‐West) and in Tahliwall and Bathri (South-‐Central) in Una district.
Background
There are an estimated 12,000 stone crushers in India with an annual turnover of around US$1 billion. The sector employs over 500,000 people, mostly from rural areas where employment
opportunities are limited and is therefore important in terms of local livelihoods and social development. The stone crushing sector is anticipated to grow given the current plans to develop roads, canals and buildings (CPCB, 2009)44.
Stone crushers give rise to fine fugitive dust emissions, which can lead to respiratory diseases in
workers as well as in surrounding populations. The dust also adversely affects visibility, vegetation and aesthetics of the area. To prevent/control these emissions, CPCB developed Emission Standards and guidelines in 1989, which were notified under the Environment (Protection) Act, 1986 by the
Ministry of Environment & Forests [vide Notification No. G.S.R. 742(E) dated 30th August 1990 & S.O. 8(E) dated December 31, 1990]. The quantitative standard for Suspended Particulate Matter (SPM) at a distance of 3-‐10 meters from a controlled unit (isolated or in a cluster) is less than 600
μg/m3. The standards state the implementation of the following pollution control measures are required: (i) Dust containment cum suppression system for equipment; (ii) Construction of wind breaking walls; (iii) Construction of metaled roads within the premises; (iv) Regular cleaning and
wetting of the ground within the premises; and, (v) Growing of a green belt along the periphery.
The CPCB (2009) carried out measurements of ambient air quality at 6 units predominantly having Jaw Crushers (Table 9.1, the highlighted units are small in size). The data reveals that the contribution in SPM by the stone crusher units with varying degree of dust control measures varies
widely from 2,342 to 36,406 μg/m3 with an average SPM contribution of 16,888 μg/m3, which is about 28 times higher than the existing standard of 600 μg/m3. Noise levels were also found to be beyond the acceptable limit of 75 dB(A) in many crushers.
Table 9.1: Fugitive emission Monitoring Data for Selected Stone Crushing Units (Source: SPCB, 2009)
Unit Downwind (μg/m3) Upwind (μg/m3) Contribution by the unit (μg/m3)
UNIT 1 25,224 1,313 23,911
UNIT 2 36,826 420 36,406
UNIT 3 3,222 880 2,342
UNIT 4 10,118 705 9,413
UNIT 5 10,975 858 10,117
UNIT 6 21,157 2,015 19,142
Average 17,920 1,032 6,888
44 Central Pollution Control Board, 2009. Comprehensive Industry Document Stone Crushers. Series COINDS/87/2007-‐08
Confidential Draft – Do Not Cite
HP Industry SEA Page 67 December 2013 (Draft 23/12/13)
Field Studies were also carried out in the Raisina Crusher Zone, Sohna, Gurgaon District of Haryana State. The Cluster has 36 Stone Crushers, each occupying an area of 1 acre. Most crushers have
roller type tertiary crushers so as to produce more fine dust (<4 mm), which is saleable in the National Capital Region. All the crushers have partial enclosures and dust suppression arrangements such as nozzles and sprinklers. However, it was observed that few crusher units operate the water
sprays, due to concerns over water consumption and the formation of a dust layer on the crushed stone gravels which affects its quality. The SPM was found to be 55,926 μg/m3 with respirable content of 8,215 μg/m3. This high concentration calls for stricter measures to be enforced on stone
crushers in such zones. If wet suppression systems are not acceptable, dry type control systems as adopted widely in crushers in developed countries and practically feasible should be enforced (CPCB, 2009).]
Stone Crushing in HP
There are 271 stone crushing units / companies in HP recorded in the SPCB database, with the largest number occurring in Jassur district (Baddi – 32, Bilapur – 35, Chamba – 6, Jassur – 72, Kullu – 26, Paonta – 13, Parwanoo – 20, Rampur – 5, Shimla – 18 and Una-‐ 44). In Una, there are about 22
stone crushing units
There is a common feeling amongst the general public that mining activity in riverbeds creates environmental pollution and damage. In HP a number of petitions have been filed concerning the impact of indiscriminate mining in the riverbeds on the ecology and environment (including change
the course of rivers) and the safety of bridges (Survey Document of District of Una, 2011)45.
Closure of stone crushing sites is common in the neighboring Haryana State due to concerns over illegal activity. For example, in 2012 the Haryana Government suspended the granting of licences to
stone-‐crushers in the districts of Faridabad, Gurgaon and Mewat, due to complaints of illegal mining and transportation of minerals. Crushers in Panchkula, Hisar and Yamunanagar were also closed due to a court case.
The almost total ban on sand and gravel mining in neighboring Punjab State has boosted the
industry in Himachal Pradesh. The price of crushed stone for crushers located near the border increased from Rs 11 or Rs 12 per cubic foot to Rs 17 or Rs 18 per cubic foot, compared to around Rs 14 per cubic foot for stone crushers located further away (Tribune News Service, November
2012). The high prices have reportedly encouraged illegal practices, including the use of JCBs, to meet demand, and (in 2012) a ban was imposed on sand mining from the River Soan (Swan) in Una District.
Mining Policy
In 2011, the HP Mining Department earned almost 30% of its revenue through the mining of minor minerals. In 2004 The High Court of Himachal Pradesh directed the State Government to formulate Policy and Guidelines for the regulation and control of mining operation in rivers, streams and
khallas.
Key principles of the policy are: the river / natural resources must be utilized for the benefit of the present and future generation; it is the responsibility of all sectors to maintain the river resources of
45 Feasibility Report District Una H.P, 2011. Survey documents of District Una

Confidential Draft – Do Not Cite
HP Industry SEA Page 68 December 2013 (Draft 23/12/13)
the State and to ensure that it is prudently managed and developed; and, awareness is essential to ensure the protection of natural river resources and their proper utilization and conservation.
The objectives of the policy are to ensure: scientific and systematic mining; conservation of minerals;
protection of environment and ecology; proper replenishment of river beds; proper protection of river banks; protection of soil erosion; protection of bridges and other structures of public utility; and, checks on illegal mining.
The policy guidelines provided for the preparation of District level river/stream bed mining action
plans. These action plans were to be based on a survey, by the Geological Wing, Department of Industries, Himachal Pradesh, of the existing river/stream bed mining in each district, an assessment of the direct and indirect benefits of mining and an identification of the potential threats. The action
plans divide the State’s rivers/streams (or sections of rivers/stream) into two categories: (i) those selected for the extraction of minor minerals; (ii) those where extraction of minor minerals is prohibited. Based on the action plan, mining leases/ contracts are granted in accordance to the
Himachal Pradesh Minor Mineral (Concession) Revised Rules, 1971 and observing the Policy Guidelines. A field survey report of the riverbeds in Una district was based on existing survey information and new surveys undertaken in November 2010. The Survey Document (2011) details
the morphological features and mineral potential of river catchments in the district.
As per state regulations (Act, 1992), all crushing units require a mining (minor minerals) licence for riverbed mining and/ or hill-‐slope mining. Mining operations are governed by the Department of Mines and Geology, who grant the licenses [check that this is not Geological Wing, Department of
Industries]; they are not under the jurisdiction of the PCB, who give CTE and CTO by issuing a no-‐objection certificate, once the license is granted.
In 2006 the Ministry of Environment and Forests made it mandatory for stone crushers operating in
an area of over 5 hectares to obtain Environmental Impact Assessment (EIA) clearance before they were granted permission to operate. This requirement has only recently been fully implemented.
Background to Stone crushing in Una In Una District sand, stone and bajri/grit are available. In the past local residents used to take gravel
from riverbeds to meet their requirements. Now, in accordance with the Himachal Pradesh Minor Mineral Concession (Revised) Rules 1971, mineral concessions are granted through a lease or through auction. In 2011, 51 mining leases had been granted, on Government (20%) and Private land
(80%).
In an auction of minor mineral quarries in the District of Hamirpur in 2009, for 13 stream beds for the extraction of sand, stone and bajri, bid prices ranged from Rs 47,000-‐3,005,000 per year. Bids were significantly higher than previous bids (up to 8 times). The contracts are typically for 3 years.
The increase demand for minor minerals (sandstone and barji) can be gauged by the increase in
royalty receipt from minerals from 1.13 lakhs (1990-‐1991) to 221.45 lakhs (2010-‐2011). The royalty received from sandstone and barji, and white quartite boulders is presented in Table 9.2.
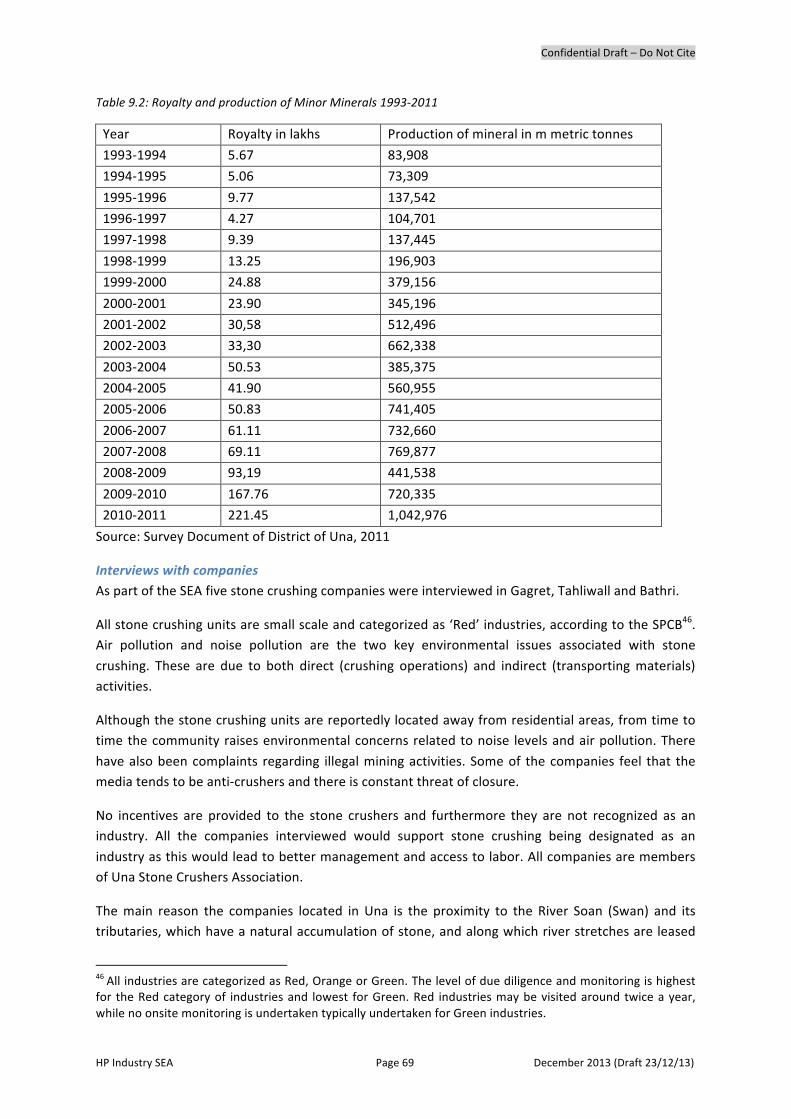
Confidential Draft – Do Not Cite
HP Industry SEA Page 69 December 2013 (Draft 23/12/13)
Table 9.2: Royalty and production of Minor Minerals 1993-‐2011
Year Royalty in lakhs Production of mineral in m metric tonnes
1993-‐1994 5.67 83,908
1994-‐1995 5.06 73,309
1995-‐1996 9.77 137,542
1996-‐1997 4.27 104,701
1997-‐1998 9.39 137,445
1998-‐1999 13.25 196,903
1999-‐2000 24.88 379,156
2000-‐2001 23.90 345,196
2001-‐2002 30,58 512,496
2002-‐2003 33,30 662,338
2003-‐2004 50.53 385,375
2004-‐2005 41.90 560,955
2005-‐2006 50.83 741,405
2006-‐2007 61.11 732,660
2007-‐2008 69.11 769,877
2008-‐2009 93,19 441,538
2009-‐2010 167.76 720,335
2010-‐2011 221.45 1,042,976
Source: Survey Document of District of Una, 2011
Interviews with companies As part of the SEA five stone crushing companies were interviewed in Gagret, Tahliwall and Bathri.
All stone crushing units are small scale and categorized as ‘Red’ industries, according to the SPCB46. Air pollution and noise pollution are the two key environmental issues associated with stone
crushing. These are due to both direct (crushing operations) and indirect (transporting materials) activities.
Although the stone crushing units are reportedly located away from residential areas, from time to time the community raises environmental concerns related to noise levels and air pollution. There
have also been complaints regarding illegal mining activities. Some of the companies feel that the media tends to be anti-‐crushers and there is constant threat of closure.
No incentives are provided to the stone crushers and furthermore they are not recognized as an industry. All the companies interviewed would support stone crushing being designated as an
industry as this would lead to better management and access to labor. All companies are members of Una Stone Crushers Association.
The main reason the companies located in Una is the proximity to the River Soan (Swan) and its tributaries, which have a natural accumulation of stone, and along which river stretches are leased
46 All industries are categorized as Red, Orange or Green. The level of due diligence and monitoring is highest for the Red category of industries and lowest for Green. Red industries may be visited around twice a year, while no onsite monitoring is undertaken typically undertaken for Green industries.

Confidential Draft – Do Not Cite
HP Industry SEA Page 70 December 2013 (Draft 23/12/13)
for stone mining by the Mining Department. Some companies also have a hill mining license. Only stone is withdrawn from the hill, whereas both stone and sand is mined from the riverbed. Himachal
Pradesh was also cited as having transparent and well set out processes for mining and stone crushing, which is attractive to industries.
Companies are producing sand, 10 mm stone, 20 mm stone and 40 mm stone. Licenses may cover 4-‐5 ha of riverbed and 1 ha in the hills. Production ranges from 70-‐120 tons / day. Production at the
upper end of this range requires 40-‐50 truck transports. Turnover ranges from Rs 90-‐120 million per annum. The companies employ 8-‐20 staff per unit on a permanent basis. Temporary / transport staff are also needed.
Prior to commencing mining operations, an Environmental Management Plan for mining (not
crushing) is required, which is approved by the Indian Bureau of Mines or, for minor minerals, by the State’s Department of Geology.
Environmental management The SPCB requires that the companies have certain pollution control equipment in place before
issuing Consent to Operate (CTO). The CTO includes conditions such as frequency of monitoring and the parameters to be monitored, which need to be strictly adhered to. All companies have water sprinklers and covering /enclosures around the crushers to contain dust. Water is being recycled for
use on the plantations and for irrigation.
Economics of stone crushing Companies have spent between Rs 75,000 and Rs 1,500,000 on capital equipment such as sprinkler systems and water tanks. The administrative costs related to pollution control are not available.
Permanent workers are reportedly paid above the minimum wage of Rs 4,500 per month.
SPCB (2009 – Section 2.5) provides overview of economics of a stone crusher. Based on information provided by stone crushers nationally, Tables 9.3–9.7 present typical details on capital investment
and annual operating costs of a small size stone crusher’s unit with a production capacity of 20 tons per hour.
Monitoring Most of the companies do not monitor air quality or noise levels, so this is left to the SPCB. Some
monitoring was undertaken by some companies as part of the EIA, and one company has contacted a supplier to monitor air and noise. All companies claim that they have never exceeded compliance levels. The SPCB is said to visit between 2-‐6 times a year, sometime unannounced (one company
stated that visits can be 1-‐2 a month during the season)47.
Not all companies have completed an EIA. For one company it will be mandatory at the time of consent renewal. For another company, within 10 km of the state border, an EIA was done (Eco Laboratories, Chandigarh) and approved by the MOEF in April 2013 and cost the company about Rs 1
million. In line with the requirements of the CTO, an Environmental statement is submitted annually and includes operational information. The companies raised no issues in terms of pollution control
47 Note: This does not match up with the data provided in SPCB database on date of last inspection. According to the database 10 companies in Una have not be visited since 2011. If SPCB is monitoring air pollution where is this data recorded? It is not provided in database and SEA Team was advised that it is not available.

Confidential Draft – Do Not Cite
HP Industry SEA Page 71 December 2013 (Draft 23/12/13)
(challenges, constraints). Note that clearances have to be obtained from 13 Departments prior to establishing the unit: this includes Revenue, Mining and Tourism.
Table 9.3: Investment in Plant and Machinery
S.No ITEM Cost (lakh Rs)
Sub-‐Total (lakh Rs)
% Share
A Crushers & Screen
Jaw crusher (20*12)
Jaw crusher (16*9)
Vibratory screen
Handling Material Equipment:
Belt Conveyors (tyre)
Motors
Structural
Miscellaneous electrical, starters
Miscellaneous Structural, chutes etc
Lab & office equipment
2.50
2.00
1.20
0.25
0.30
1.50
1.00
2.00
1.25
12.00 34.25%
B Transportation vehicles (Minimum)
2 Tractors
2 Dumpers
4.00
9.00
13.00 37.15%
C DG set 62 KVA (Captive Power Generation) 3.00 3.00 8.6%
D Civil work
Ramp, stone well etc
Office sheds
3.00
3.00
6.00 17.6%
Total Capital Investment (A+B+C+D) 34.00 34.00 100%
E Cost of dust control System (enclosures, tank, pump, pipes, nozzles etc)
1.00 1.00 2.9 %
Table 9.4: Electricity Consumption Costs
Belt conveyor 15 hp
Crushers 45 hp
Screen 10 hp
Miscellaneous, Lightings 5 hp
Total 75 hp (56 kWh)
Operating Cost @ Rs 4.50 = Rs 252/-‐ per hr
Cost/Ton = 2.8 kWh/ton or Rs 12/ton
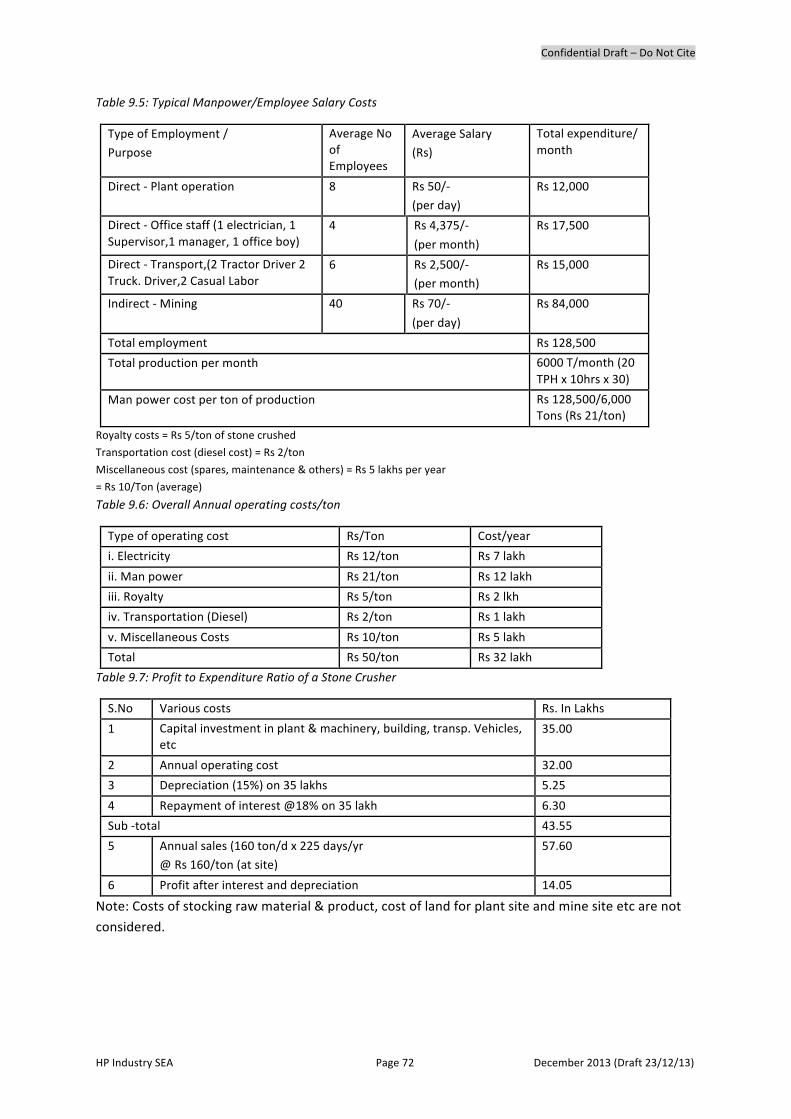
Confidential Draft – Do Not Cite
HP Industry SEA Page 72 December 2013 (Draft 23/12/13)
Table 9.5: Typical Manpower/Employee Salary Costs
Type of Employment /
Purpose
Average No of Employees
Average Salary
(Rs)
Total expenditure/ month
Direct -‐ Plant operation 8 Rs 50/-‐
(per day)
Rs 12,000
Direct -‐ Office staff (1 electrician, 1 Supervisor,1 manager, 1 office boy)
4 Rs 4,375/-‐
(per month)
Rs 17,500
Direct -‐ Transport,(2 Tractor Driver 2 Truck. Driver,2 Casual Labor
6 Rs 2,500/-‐
(per month)
Rs 15,000
Indirect -‐ Mining 40 Rs 70/-‐
(per day)
Rs 84,000
Total employment Rs 128,500
Total production per month 6000 T/month (20 TPH x 10hrs x 30)
Man power cost per ton of production Rs 128,500/6,000 Tons (Rs 21/ton)
Royalty costs = Rs 5/ton of stone crushed
Transportation cost (diesel cost) = Rs 2/ton
Miscellaneous cost (spares, maintenance & others) = Rs 5 lakhs per year
= Rs 10/Ton (average)
Table 9.6: Overall Annual operating costs/ton
Type of operating cost Rs/Ton Cost/year
i. Electricity Rs 12/ton Rs 7 lakh
ii. Man power Rs 21/ton Rs 12 lakh
iii. Royalty Rs 5/ton Rs 2 lkh
iv. Transportation (Diesel) Rs 2/ton Rs 1 lakh
v. Miscellaneous Costs Rs 10/ton Rs 5 lakh
Total Rs 50/ton Rs 32 lakh
Table 9.7: Profit to Expenditure Ratio of a Stone Crusher
S.No Various costs Rs. In Lakhs
1 Capital investment in plant & machinery, building, transp. Vehicles, etc
35.00
2 Annual operating cost 32.00
3 Depreciation (15%) on 35 lakhs 5.25
4 Repayment of interest @18% on 35 lakh 6.30
Sub -‐total 43.55
5 Annual sales (160 ton/d x 225 days/yr
@ Rs 160/ton (at site)
57.60
6 Profit after interest and depreciation 14.05
Note: Costs of stocking raw material & product, cost of land for plant site and mine site etc are not
considered.

Confidential Draft – Do Not Cite
HP Industry SEA Page 73 December 2013 (Draft 23/12/13)
Views on economic instruments The companies do not currently benefit from any government incentive schemes. However, the
majority would be interested in a soft/subsidized loan scheme for implementing pollution controls, or for other equipment or operational costs if offered.
None of the companies has sought any voluntary certification such as ISO14000, ISO9000. Some felt that this had no business value and was not relevant as stone crushers are not treated as an
industry.
A few companies have invested in energy efficiency initiatives in the past 10 years. These include the: (i) installation of energy-‐efficient motors; and, (ii) introduction of power factor control using capacitors to reduce electricity consumption (the estimated cost of capacitor equipment is
Rs 140,000).
For most companies calculation of the quantity mined/ crushed (and hence royalty paid) is linked to the electricity consumption. Crushing one ton of stone requires 7 units of power and washing requires 4 units of power (using energy-‐efficient operations). There is a royalty of Rs 5 per ton of
stone crushed.
The companies hold the following types of insurance: accident/labor insurance (one company pays Rs 40-‐50,000 per year); asset insurance; motor vehicle insurance (one company/unit pays Rs 325,000 to cover for plant & machinery, vehicles). Public liability insurance is not required as it is not
classified as an industry.
Confidential Draft – Do Not Cite
HP Industry SEA Page 74 December 2013 (Draft 23/12/13)
§10 Case Study 3 – Food Processing
Background
Agricultural development in HP has numerous challenges, with access to markets due to poor road infrastructure among the most frequently cited. State policy, however, expects that the sector will eventually expand and provide greater opportunities for value-‐added processing for both domestic
and export markets. In contrast to other manufacturing industries, agro-‐industries have relatively straightforward environmental impacts, usually associated with high water demands or high BOD loads into common water bodies. Breweries, slaughterhouses, canneries, food processing, and juice
packaging installations are all examples of industrial establishments that can take on significant scales and have high BOD loads. These types of enterprises are also amenable to common effluent treatment plants, handling both industrial and domestic waste. Their location, management, and
regulatory treatment thus have additional challenges. Moreover, due to the proactive policies of HP, such industries will be a more common part of the landscape in decades to come than they are today. (The GoHP is currently developing a vision document and strategy for the food processing
industry.) From a policy perspective, uplifting the agriculture sector has additional social benefits because it creates value-‐added in areas that can benefit more directly those in rural areas. Again, adoption of spatial planning models coupled with common waste treatment plants supported by an
equitably distributed user charge is a common model for addressing such circumstances. Because the sector remains in nascent stages, HP can apply such principles to all new industries in a way that anticipates its future economic importance.48
Findings
At present, only 6 food processing units are functioning in Una district, all of which were interviewed for SEA. Companies located in Una due to the good working environment in HP and family connections with the area. However, the main reason most companies moved to Una was the
availability of tax concessions. These concessions include tax holidays, VAT exemptions, and excise benefits. Following the end to the GOI special incentive package in 2011, a number of food processing units in Tahliwal, particularly the small industries, became unprofitable and closed
down49,50.
The food processing companies in Una are diverse in terms of size (2 small, 2 large and 2 medium), and in terms of their products. Products being produced across the companies include -‐ juices, jams,
pickles, sauces, noodles and biscuits. For some products, such as juices, production is seasonal peaking during summer. Some companies undertake work for larger firms such as Unilever, Walmart, cash-‐and-‐carry, Reliance, Vishal, V-‐Mart, ITC and Dabur. One company is supplying
Cadbury, Wrigley and Nestle products such as starch (multiple uses), liquid glucose (biscuit), dextrose monohydrate, and malt (baby powders).
48 Opportunity to incorporate state-‐of-‐the-‐art pollution abatement technologies in food processing exists in the recently announced “Food Parks” planned for Una, Solan and Kangra districts. 49 In Tahliwal area entrepreneurs reportedly ventured into the sector because of the concessions / incentives and did not have the experience to sustain their businesses beyond the concession / incentive period. 50 Interviewees demonstrated a mixed understanding of the phaseout of various subsidies; there was a progressive withdrawal of subsidies, e.g. sales tax in 2009 and income tax in 2013.

Confidential Draft – Do Not Cite
HP Industry SEA Page 75 December 2013 (Draft 23/12/13)
The companies belong to a range of Industrial Associations including: the All India Food Processor Association; Tahliwal Industrial Association; BBNIA; the local BBT Industrial Association; and the
Bathri Industry Association.
Availability of power, labor and infrastructure are problems in the area for the industries. In terms of the environment, wastewater generation and treatment is the key issue for the food processing sector. All the units have an ETP, and are treating their effluents. The units also have boilers that run
on diesel. In the small-‐scale units, [baby] boilers operate on wood. Stack emissions are measured, monitored and managed in the large and medium-‐scale units. Also, the large-‐ and medium-‐scale units tend to generate biogas from their food waste, which is used to supplement fuel in their
boilers (see Annex F). Water is sourced through a 130 ft bore well. The quality of water is hard and therefore needs to be treated before use. Though water is available at 20-‐30 ft, potable water is available only at a greater depth.
The installed capital costs of the ETPs ranges from Rs 40 million to Rs 175,000. Operating costs of the
ETP ranges from Rs 1,000 – Rs 30,000 per month. No specific labor costs are available, but companies pay at least the minimum wage of Rs 4,500 per month. Pollution control related administrative costs are not separately maintained by any of the companies.
The level of pollution monitoring undertaken by the companies is correlated with their size, with
large companies having on line monitoring systems and / or in house laboratories where tests are undertaken daily, and the small companies relying on the PCB and not undertaking independent measurements. Pollutants monitored vary across companies but include: BOD, COD, TSS, pH, flue
content, PM10, NOx and SOx, water color, odor and noise. Both pre-‐treated and treated water quality are typically measured. Social Audit Monitoring (SEDEX) audits, required by multinationals,
are undertaken by one of the large companies.
The majority of companies have never exceeded compliance levels. However, one company was non-‐compliant in 2010, related to a problem with gas recovery, and the plant was closed for 10 days. Another company is currently (mid-‐2013) non-‐compliant due to an out of service ETP, which is in the
process of being replaced.
According to the companies they are visited by the SPCB between 2-‐6 times a year, sometimes unannounced. The SPCB monitors effluent quality. For the larger plants, stack emissions and ambient air quality may be monitored, perhaps using the company’s own equipment. If a sample
fails, another sample is taken in 45 days.
Pollution control challenges faced by some of the companies include: (i) Total Dissolved Solids (TDS) because the requirement for TDS is 100 mg/l, however the region has hard water and raw (groundwater) water in the area is above 200 mg/l, and reducing this is practically difficult; (ii) solid
waste management, as no sewage system is in place; and, (iii) plastic disposal, with plastic currently being burnt in the boilers.
The large companies felt that within their geographical area there was no need for a CETP as they were the only industry or a state-‐of-‐the-‐art ETP was already in place. The medium and small
companies were all in favor of a CETP, which would enable effluent to be treated in a holistic manner, and reduce costs (for a small company an ETP can be a third of the total investment). In
Confidential Draft – Do Not Cite
HP Industry SEA Page 76 December 2013 (Draft 23/12/13)
May 2013 a proposal for a CETP similar to Baddi-‐Barotiwala’s was submitted to the Industry Minister.
Views on economic instruments
Most of the companies are currently benefitting from Government schemes such as area-‐based excise duty exemption (valid for 10 years and applicable to 2018 in one case), VAT exemption and a 0.5% sales tax subsidy. One company has applied for tax concessions and transport subsidy. All of
the companies would partake of a soft or subsidized loan scheme for implementing pollution controls, or to cover the purchase of other types of equipment or operational costs, if offered. It was suggested that facilities could be upgraded if the Government made concessionary funds available.
Voluntary certifications in place include: ISO 22000 obtained by 2 companies (a general derivative of
the ISO 9000 system particular to the food safety industry); and, ISO 14001 (1). A few companies are considering seeking ISO 900, ISO 14001 and OHSAS 18001 certification51. Others hold the view that these certifications are unnecessary given the strict food safety standards.
Many companies are focused on energy efficiency. Investments in the past 10 years to improve
energy efficiency include: (i) conducting energy audits to identify energy saving practices; (ii) monitoring of energy consumption/efficiency (electric, water, fuel consumption); (iii) investments to reduce steam and heat loss; (iv) use of CFL bulbs to minimize electricity consumption;
(v) motivating staff to move to an energy conservation culture, such as switching-‐off lights during lunch hours; (vi) setting energy consumption targets based on efficient energy use; and, (vii) installation of capacitors to improve power factor control.
One company spent about Rs 500-‐600,000 on energy efficiency measures. The problem of energy
supply is in the distribution. The electricity supply fails about 15-‐20 times a day.
Most of the companies maintain personal accident insurance, boiler insurance, medical insurance, workmen compensation, as well as insurances for fire, earthquake, assets, and stock-‐in-‐transit. One
(small) company has no insurance coverage. One company’s insurance premium is Rs 1.80 million per year. [PLI not applicable as it is below the levels required].
Recommendations to support industries in Una, provided by the companies are:
• Development of infrastructure in Tahliwal Industrial Area, which is lacking.
• Workshops, seminars, and updates of the latest information (e.g. on carbon trading)
• Promotion of pine needles, e.g. through a subsidy for bundling plants and transport, as a
source of fuel for industrial boilers. Pine needles have a good calorific value and their collection and use as a fuel would have the added benefit of reducing the risk of forest fires.
• Development of centralized waste disposal facilities – for effluent and solid waste
51 Note: ISO 45001 is an international standard being developed intended to replace the British Occupational and Health Standard OHSAS 18001.

Confidential Draft – Do Not Cite
HP Industry SEA Page 77 December 2013 (Draft 23/12/13)
§11 Cost Effectiveness
Role of Cost Effectiveness Analysis Cost-‐effectiveness analysis (CEA) is a technique used to try to achieve the least-‐cost means of achieving a certain target. The target is set independently and is regarded as exogenous – or
external to – the actual optimization decision. In environmental management or pollution abatement decisions, CEA can be used by a firm, for example, to determine which of a number of options is cheapest to achieve a given level of regulatory standard. But CEA also embodies a larger
domain of analysis including social cost-‐effectiveness analysis (CEA from a social perspective), constrained cost-‐benefit analysis (which seeks partially to optimize also the target pollution level), and comparative cost analyses across different pollutants. We here look at how each of these might
be incorporated into the HP SEA through considering how methodological issues can constrain the types of analyses that are possible.
CEA at the Firm Level CEA for a firm is normally represented as a pollution abatement function. “Pollution abatement” is seen as the output, and the marginal cost of abatement is associated with incremental changes in pollution abatement. Zero abatement has zero cost, and 100% abatement will generally have the
highest total cost; the marginal abatement cost is the slope of the total cost function that can be presented in terms of cost per % of pollution reduction. For a single pollutant generated by a single firm facing a regulated maximum pollution level, the firm will select the technology that generates
the least cost to achieve that level. Abating less is not an option; abating more imposes unnecessary costs. CEA in this case requires information about the firm’s level of output, the processes generating pollutants, and the technologies (and their costs) available for reducing pollution. Such
costs are generally industry specific and depend on things like location and vintage of the industry: retrofitting existing operations is generally more expensive than incorporating best available technology into new operations.
If there is more than one firm in the industry, and each firm produces different marketable goods
but the same pollutant, then each firm would (to extend the above scenario) still optimize its own pollution levels to meet the regulated standards. This is the classical situation of command and control. The cost of abatement is the sum of the costs from the two firms.
CEA at the Social Level At a social level, however, different factors come into play. First, if a planner is interested in minimizing the overall cost burden to firms, then she should be indifferent as to who undertakes the
abatement. If two firms are in different industries (or are of different vintage or scale) then it may make sense to let one firm pollute more (if that firm has very high costs of abatement) and count on the low abatement cost firm to do most of the abatement: market based mechanisms can
potentially achieve such an outcome. A level pollution tax, for example, would cause the high abatement cost firm to keep polluting (as it is cheaper to pay the tax) and the low abatement cost firm to reduce pollution loads significantly (as it is cheaper to put in place the technology than pay
the tax). Similarly, a “market creation” solution essentially tells polluters they are allowed to pollute collectively to a certain level: the individual firms will then negotiate an optimal level of pollution reduction. In targeting single pollutants among firms with different cost structures, market
Confidential Draft – Do Not Cite
HP Industry SEA Page 78 December 2013 (Draft 23/12/13)
mechanisms can be effective: the use of taxes or permits in controlling GHG emissions falls into this category and has seen some significant success globally.
It is noted that if all firms have similar cost structures, then the use of taxes or markets may not
achieve a different outcome than a strict regulatory stance: in that case the only difference is in transactions and regulatory costs. The industry level CEA at that stage must then also consider the different levels of monitoring costs, collection compliance, or other costs borne by the firms or the
regulators. The costs of the compliance system can differ significantly among regulators and regulatory instruments; some control mechanisms are relatively inexpensive compared to complex tax and charge schemes.
Another social concern is setting the pollution target in the first place. From a regulatory
perspective, ambient conditions (in water or air) present the desired quality of a receiving medium or environment. People need breathable air; people need drinkable water; industries and farms need water free of some but not all contaminants. But if the receiving medium takes loads (often
expressed as discharge rates) from different polluters, then the regulator must work out how to apportion abatement across a wide range of users. Also, she is aware that – because some level of pollution is either tolerable or can be assimilated by the environment – the “target” itself can be
moved up or down depending on tolerance or assimilative capacity.52 Setting of this target generally depends on the potential benefits associated with pollution abatement: if there are many benefits from having a clean environment, then it may be warranted to set targets higher and impose higher
costs on the users. But the setting of the target level technically depends concurrently on knowledge of the cost functions and knowledge of all of the benefits. In this scenario, the planner needs to know all of the industrial costs associated with abatement, and also the benefits associated with
different levels of pollution targets. For this reason, we have paid attention elsewhere in this study (Chapter 4) to questions of human and ecosystem health: benefits of improved health can be cast in
monetary terms. In this context, CEA needs minimally to be able to reflect different compliance costs at different emission or effluent targets; ideally, however, it also (from the social perspective) reflects favorably some of the environmental benefits associated with improved social productivity
or reduced health care costs. In simple terms, benefit adjustments reduce costs in the social CEA.
The complexity does not stop there from a planner’s perspective. To this stage, we have assumed that there could be multiple firms in multiple industries, but we have concentrated on a single pollutant. If there are different types of pollution, from different firms, and those pollutants have 52 In addition, the existence of assimilative capacity in the environment, or some minimum level of tolerance among those affected, can lead to serious inequities in any type of regulation (CAC or MBI). It is not uncommon for it to take some critical mass of polluters to comply to a standard before some effect is noticed. This implies that the marginal benefit of the first reductions in pollution is small or even zero: if this were the only criterion, it implies that the social costs of compliance far exceed the benefits. It is only when the cumulative abatement reaches a certain level that benefits start to become realized: the “lumpiness” of marginal abatement cost and marginal benefit curves complicates the arithmetic considerably, and may in fact make pollution control in some situations unnecessary where there are just a few polluters. In his studies of the Ganga basin, for example, Markandya (2011) moreover shows that individual preferences can also introduce non-‐linearities into the overall optimization process; the very timing of a project in relation to other activities in the basin can affect its economic desirability, even with no changes in its technical specifications or costs. The nature of the benefits showed that the first adopters of pollution reduction faced a rather flat benefit function (because it had little impact on overall water quality that was of interest to users and non-‐users) and that, similarly, the last adopters of pollution reduction contributed little to the marginal benefits of users and non-‐users (because water quality was by then more than adequate for all derived benefits). Those adopters that are in the “middle” – through making noticeable gains in water quality that approach or cross selected preference thresholds – generally have the greatest impact on benefits. The net benefit of a single sub-‐project is thus dependent on the timing and scale of other available projects in the basin.
Confidential Draft – Do Not Cite
HP Industry SEA Page 79 December 2013 (Draft 23/12/13)
different impacts on a receiving medium, then some method of standardizing across pollutants is necessary if one were to conduct a CEA from a social perspective. But this is where we run into the
methodological limits of CEA. Although we can compare the cost-‐effectiveness of BOD reductions from domestic and industrial loads, it is not possible to compare (say) air pollution with water pollution, or industrial BOD loads with sediment or chemical loads. Some pollutants, such as those
associated with APIs in the pharmaceutical industry, have no universally agreed method of comparison to other pollutants as their impact may be determined by the starting chemical characteristics of the receiving medium. Standardizing across pollutants is, therefore, not generally a
helpful exercise using numerical methods. What is possible, however, is the use of simple index-‐based approaches to reflect the different impacts. Such approaches can be as simple as rankings that designate detrimental impacts of pollution as “low, moderate, high or critical”: the CPBC and
the SPCBs already use such rankings in determining whether ambient air quality is acceptable in urban settings. In addition, more complex indices can be constructed, but these are usually built around final impact or ambient conditions. Annex F, for example, shows how the Comprehensive
Environmental Pollution Index (CEPI) can be used for Himachal Pradesh through combining impact scores for air, water and land. In all cases, it is clear, however, that the approaches are relatively information rich: if there is a lack of reliable underlying information, the indices themselves are
equally unreliable.
CEA of HP Industries Whether one is conducting analyses of private or social costs of pollution abatement, and whether
one is considering standard control methods or MBIs, all analyses rely at their core on basic information on the industry, its cost structures, and its abatement opportunities. Abatement possibilities and their costs are relatively well understood, and are available through international
case studies or through broad studies. The World Bank Industrial Pollution Projection System (IPPS) is an example of a database that has been used to estimate typical compliance costs for industries and industrial sub-‐groups. Similar databases also provide typical pollution coefficients by industry or
sub-‐industry for major criteria pollutants.
As a second step, it is also clear, however, that some measure of the benefits can inform whether it makes sense to impose pollution abatement at all on some industries. As described previously, one of the criteria for selecting priority industries is the actual cost of compliance: if the cost of
compliance is disproportionately large compared to the benefits, then one should potentially reconsider the target level of pollution abatement for that industry.
Finally, in evaluating the use of different economic instruments, the additional relevant information
in any CEA is the administrative cost of compliance borne both by industry and by the regulator. In some instances, such information can be based on current regulatory costs, while in others it may also require use of a qualitative index, which reflects order-‐of-‐magnitude relative costs among
different instruments.
At the practical implementation stage, such analyses cannot be done for every pollutant in every industry for every type of regulatory instrument. Further below, some of the specific information constraints in Himachal are treated in greater detail. Addressing these constraints effectively
(through institutional interventions) will also be a priority for capacity building within HP.

Confidential Draft – Do Not Cite
HP Industry SEA Page 80 December 2013 (Draft 23/12/13)
Context of Public Finances Cost effectiveness analysis also depends on the state of public finances, for a number of reasons. First, as described elsewhere and above, any type of intervention (with the exception of purely voluntary actions) to control pollution usually entails some government expense. The expense can
be relatively passive if it is purely administrative, or it can be relatively active if it involves grant provision or subsidies. Frequently, it also entails monitoring and enforcement compliance. Costs associated with any of these are part of the “cost” metric in cost effectiveness. Second, the ability of
the state to uphold standards or technology requirements is often a function of government capacity, which includes both the availability of financial and trained human resources. In the absence of such resources, the effectiveness of any intervention may be very low: this is the
“effectiveness” role of the state in the overall effectiveness formulation. In both of these instances, it is clear that public finances play a role in CEA. Ideally, for a pure theoretical CEA one would want to know the incremental cost to the public of a specific regulatory scheme in terms of its direct
outlays, less its direct receipts, plus its indirect administrative burdens. This level of information is usually, however, elusive. Moreover, if budgets are highly constrained then it is often best to seek (minimally) budgetary neutral interventions that have no net cost to the state. The hybrid Green
incentive Scheme detailed in Chapter 6 is of this nature: its design permits a modest environmental charge component applied to all polluters to be used to finance a subsidy scheme targeted to a particularly intractable set of polluters (SMEs).
SPCB Revenues and Expenditure
The SPCB has two general sources of funds: own resources and external assistance. The sources of its “own” resources include the cess reimbursement from the GOI; consent fees (to establish and to operate) collected from industries; interest on investments; and minor revenue sources such as
consultancy, sample testing fees, appellate fees, and receipts from fines, forfeitures, forms, etc.
External financing sources include funds from the GOI, and funds from the state and the CPCB for specific projects such as GEMS, National Air Quality Monitoring (NAAQM), Monitoring of Indian National Aquatic Resources (MINARS), and clean technology. Grants might also be provided by the
State.
Information on the sources of revenue for the HP PCB was obtained from its Annual Report 2011-‐12. This document provides aggregated data on receipts and expenditures shown in Table 11.1:
Table 11.1: HP PCB Receipts and Expenditure Summary (Source: HP PCB Annual Report 2011-‐12)
Year 2010-‐2011 Rs lakhs Rs lakhs
Receipts PCB 1,663.34
Receipts (Projects) 112.4
Total Resources 1,775.74
Expenditure Board 624.29
Expenditure Projects 109.15
Total Expenditure 733.44
Surplus 1,042.30
Information on PCB activities provides data on cess and consent fees collection. Cess remittance to
the Consolidated Fund of India, and cess reimbursement from the central government (about 15
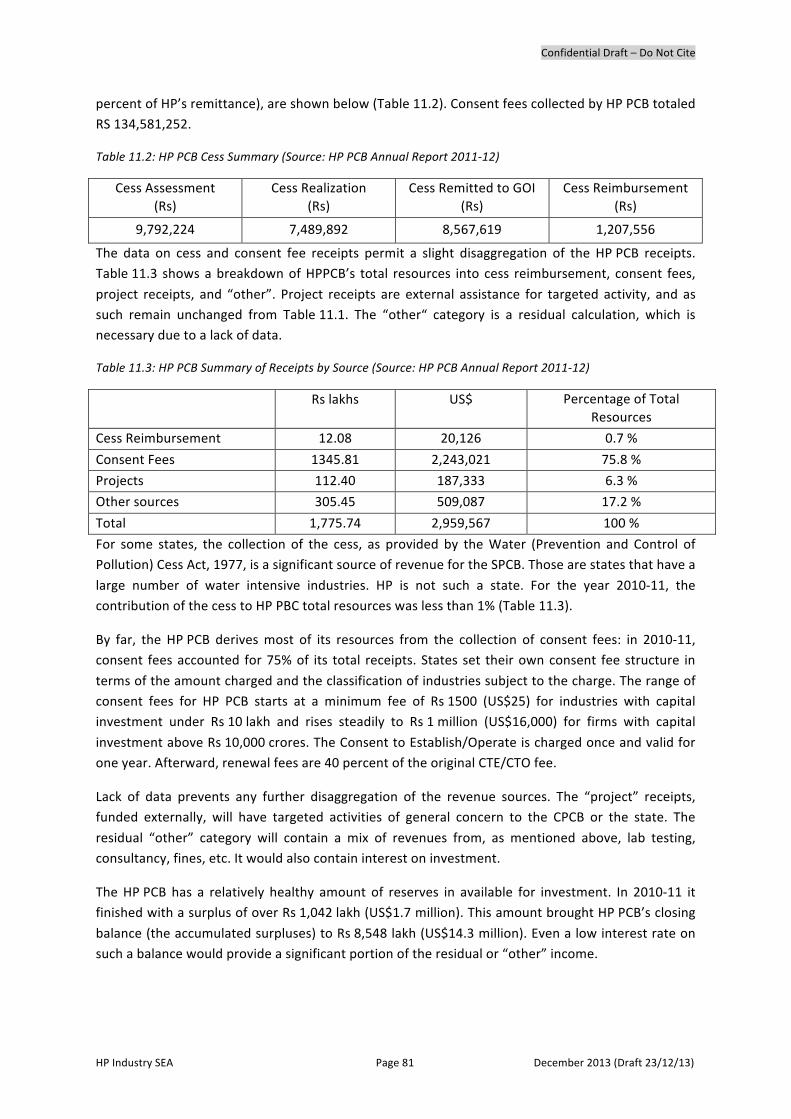
Confidential Draft – Do Not Cite
HP Industry SEA Page 81 December 2013 (Draft 23/12/13)
percent of HP’s remittance), are shown below (Table 11.2). Consent fees collected by HP PCB totaled RS 134,581,252.
Table 11.2: HP PCB Cess Summary (Source: HP PCB Annual Report 2011-‐12)
Cess Assessment (Rs)
Cess Realization (Rs)
Cess Remitted to GOI (Rs)
Cess Reimbursement (Rs)
9,792,224 7,489,892 8,567,619 1,207,556
The data on cess and consent fee receipts permit a slight disaggregation of the HP PCB receipts. Table 11.3 shows a breakdown of HPPCB’s total resources into cess reimbursement, consent fees,
project receipts, and “other”. Project receipts are external assistance for targeted activity, and as such remain unchanged from Table 11.1. The “other“ category is a residual calculation, which is necessary due to a lack of data.
Table 11.3: HP PCB Summary of Receipts by Source (Source: HP PCB Annual Report 2011-‐12)
Rs lakhs US$ Percentage of Total Resources
Cess Reimbursement 12.08 20,126 0.7 %
Consent Fees 1345.81 2,243,021 75.8 %
Projects 112.40 187,333 6.3 %
Other sources 305.45 509,087 17.2 %
Total 1,775.74 2,959,567 100 %
For some states, the collection of the cess, as provided by the Water (Prevention and Control of Pollution) Cess Act, 1977, is a significant source of revenue for the SPCB. Those are states that have a
large number of water intensive industries. HP is not such a state. For the year 2010-‐11, the contribution of the cess to HP PBC total resources was less than 1% (Table 11.3).
By far, the HP PCB derives most of its resources from the collection of consent fees: in 2010-‐11, consent fees accounted for 75% of its total receipts. States set their own consent fee structure in
terms of the amount charged and the classification of industries subject to the charge. The range of consent fees for HP PCB starts at a minimum fee of Rs 1500 (US$25) for industries with capital investment under Rs 10 lakh and rises steadily to Rs 1 million (US$16,000) for firms with capital
investment above Rs 10,000 crores. The Consent to Establish/Operate is charged once and valid for one year. Afterward, renewal fees are 40 percent of the original CTE/CTO fee.
Lack of data prevents any further disaggregation of the revenue sources. The “project” receipts, funded externally, will have targeted activities of general concern to the CPCB or the state. The
residual “other” category will contain a mix of revenues from, as mentioned above, lab testing, consultancy, fines, etc. It would also contain interest on investment.
The HP PCB has a relatively healthy amount of reserves in available for investment. In 2010-‐11 it finished with a surplus of over Rs 1,042 lakh (US$1.7 million). This amount brought HP PCB’s closing
balance (the accumulated surpluses) to Rs 8,548 lakh (US$14.3 million). Even a low interest rate on such a balance would provide a significant portion of the residual or “other” income.
Confidential Draft – Do Not Cite
HP Industry SEA Page 82 December 2013 (Draft 23/12/13)
Information Constraints in HP Industries The diagnostic exercise of data collection, interviews, case studies, and MSME economic instrument design provided substantial insights into the state of information available for conducting CEAs of the sort described in this chapter. In brief, the state of the current information is highly constrained
and is inadequate for undertaking detailed comprehensive analyses. At best, information exists to provide indicative examples of cost-‐effectiveness to communicate the concepts inherent in such tools. The tool we favor in this context reverts back to simple cost-‐curve analysis that might be
undertaken at the firm, industry, or economy-‐wide level. Such templates are provided in Annex G, and indicative results are provided further below. At this juncture, however, we enumerate some of the more significant constraints as follows:
Ø Industry classification. India’s classification system for industries is in itself not commensurable with
Standard Industrial Classifications used in standard international inventories. 53 This means that international pollution coefficients are unreliable if used in India, and places a greater onus on
analysts to use reliable pollution coefficients for the specific industries in India. This is what motivated the collection, assessment and correction of SPCB pollution data contained in Annex F.
Ø Pollution coefficient information in Himachal Pradesh. The collection of pollution loads from various
polluters is being done with some care and regularity for criteria pollutants. These loads, however, need to be more accurately attributed to a firm’s scale of operations (preferably in terms of output).
At present, the only scale indicator is a simple index (small, medium, large) usually based on investment rather than output; employment and water usage are also potential proxies, but they are
poor substitutes for firm revenues or output. In brief, this information is usually collected in other jurisdictions through industrial surveys that get a better handle on a firm’s production function and
technology. The HP SEA survey of 18 firms (out of more than 300) through the case studies is informative to a degree but a broader effort is warranted for any proper optimization and design effort.
Ø Data quality. Even though information is being collected by the state, it is not necessarily reliable for analytical work of the sort required by CEA until it has been assessed for quality and corrected where
necessary. Incorrect classification of firms, incomplete records, and questionable entries do not lend confidence to any results based on such information bases. It is acknowledged that the current
information collection may be adequate and “fit for purpose” if the purpose is monitoring individual firms and reporting the statistics of general activities; it is not, however adequate for optimization assessments involving cost minimization.
Ø Government costs. Government budgeting information is inadequate to attribute costs to specific activities associated with pollution control.
Ø Confidentiality of information. The information being requested from firms needs to be done in a
context where the confidentiality of that information can be guaranteed. This is best accomplished within a formal statistical survey rather than interviews.
A major implication of the above for future use of CEA in economic instrument design is that some considerable institutional strengthening and capacity building is warranted. This is best done
through a three-‐pronged approach consisting of: (i) creation of statistical infrastructure relating to pollution loads, industry production activities, and industry operating practices; (ii) capacity building of human resources to implement and interpret the information gathered through this
infrastructure; (iii) provision of financial resources either through standard budgetary allocations or
53 The World Bank Industrial Pollution Projection System (IPPS) database, for example, contains such pollution loading from different industrial technologies (pollution intensity coefficients).
Confidential Draft – Do Not Cite
HP Industry SEA Page 83 December 2013 (Draft 23/12/13)
through instruments that are themselves designed to raise revenues to that purpose (examples of this included the Environmental Fee described in Chapter 6 but another approach is to use the Cess
to a greater degree as it is in other states).
Approach, Assumptions & Results As noted above, the approach undertaken for a CEA is largely constrained by various data and
structural limitations. The HP SEA thus provides an indicative assessment of firms and industries on best available information. The relevant assumptions and results follow. Annex G provides additional information relating to the simplified cost effectiveness templates used in support of these analyses.
[block of results to be completed and included here in form of summary table.]
Summary There are a number of key outcomes of this diagnostic of cost-‐effectiveness issues.
First, we need to place a number of the costs within the context of overall benefits associated with the interventions. As described in Chapter 4, annual health benefits of eliminating pollution in HP
are of the order of Rs 490 million (US$8 million); this is relatively low by Indian standards because of the low level of urbanization in the State, and the relatively low population overall. The cost of any series of aggressive pollution reduction interventions may quickly outstrip these benefits to the
point that the state is regulating beyond the optimal amount. It is incumbent on regulators therefore to focus on low-‐cost, high effectiveness interventions. Many of these are already obvious – and were easily identified by stakeholders during consultations – without necessarily reverting to detailed
studies. These include reliance on voluntarily methods, on strengthening disclosure methods, and on using facilities (such as CETPs) that are capable of accommodating a diversity of waste streams to obtain greater efficiencies. They also rely on targeting in high priority zones such as those identified
in this HP SEA.
Second, if economic instruments are to become a mainstream “next policy” initiative within the state, investment in additional information infrastructure is warranted to guide future planning. Industrial surveys, human capacity building, and provision of adequate financial resources are all
part and parcel of such a commitment.
[other]

Confidential Draft – Do Not Cite
HP Industry SEA Page 84 December 2013 (Draft 23/12/13)
PART III WAY FORWARD
§12 Summary of Recommendations

Confidential Draft – Do Not Cite
HP Industry SEA Page 85 December 2013 (Draft 23/12/13)
§12 Summary of Recommendations This chapter summarizes the main recommendations arising from this SEA. At the outset, it should be noted that a key purpose of this volume is to serve as an ongoing reference for future planning of
economic instruments for environmental management in the industry sector. As such, it is a technical resource that can be built upon through internal capacity building within key stakeholders in Himachal Pradesh. The recommendations in this chapter, therefore, should be taken as a menu of
options for future consideration as capacity continues to build. Near-‐term priorities are identified both in terms of capacity-‐building, as well as in practical matters to provide pilot activities that will
help institutions and decision-‐makers become more familiar with economic instruments such as those relating to the DPL 2 trigger. In addition, the recommendations here reinforce or augment initiatives already taken in the State: notably this includes the pilot schemes and associated
institutional changes contemplated in the PES Notification of 2 November 2013 (FFE-‐B-‐C (15)-‐3/2005-‐11).
In principle, the core recommendations included are: (i) develop general statistical infrastructure for planning of economic instruments (industry surveys & human resource training); (ii) integrate
industry information into planning associated with PES Notification; (iii) incentivize zero-‐ and low-‐footprint industries; (iv) implement staged MSME incentive system; (v) design and implement comprehensive long-‐term incentive system for all industries. Each of these is discussed in more
detail below, and summarized in matrix form in the Executive Summary Table ES.1.
Statistical Infrastructure The HP SEA noted the mixed quality of information available to plan optimally an appropriate set of
economic incentives; some considerable institutional strengthening and capacity building is warranted. This is best done through a three-‐pronged approach consisting of: (i) creation of statistical infrastructure relating to pollution loads, industry production activities, and industry
operating practices; (ii) capacity building of human resources to implement and interpret the information gathered through this infrastructure; (iii) provision of financial resources either through standard budgetary allocations or through instruments that are themselves designed to raise
revenues to that purpose.
Specific initiatives include industry surveys, training in incentives, increased South-‐South dialogue on issues related to industrial pollution (with short-‐term focus on potential visits to countries polled for the SMSE systems), and improved environmental accounting through initiatives such as the Wealth
Accounting and Valuation of Ecosystem Services (WAVES) program.
PES Notification & Industry Currently, a PES initiative is being developed as a part of the DPL. A cross-‐department team of
technical experts from the Forest Department has worked to produce an assessment of water regulation and soil retention services of forests for hydropower generation. Also, the GoHP piloted a Payment for Environmental Services (PES) scheme in Palampur and provided for PES in the current
Catchment Area Treatment Plan Implementation Guidelines, which includes a provision for PES. A GoHP policy on PES was notified in November 2013. Among its objectives, the notification calls for a sustained flow of ecosystem services, and enabling experimentation and pilots that inform and
refine ecosystem service approaches; incentives are linked to the sustained flow of ecosystem services. Immediate priority elements of the PES program include quantification of ecosystem
Confidential Draft – Do Not Cite
HP Industry SEA Page 86 December 2013 (Draft 23/12/13)
service flows; (ii) stakeholder identification; (iii) stakeholder engagement; (iv) determination of institutional arrangements; (v) determination of types and levels of payments; and,
(vi) incorporating the ecosystem approach into decision-‐making. Other priorities deal with regulatory frameworks, financial arrangements, monitoring, capacity building with other departments, and safeguards to ensure that negative impacts are not just shifted from one region to
another in the wake of enforcement. Notably, the final element of the PES Notification calls for “concerned departments” to “frame operational guidelines from time to time”. For the Department of Industry, this latter element would be a first step that needs to be taken. It should be noted
that, technically, any firm that is an “ecosystem service generator” could potentially benefit from PES and such schemes thus complement any programs of pollution reduction.
Low Footprint Industries Himachal Pradesh has a tradition of aggressively promoting its Thrust industries through a mix of favorable incentives. These incentives were largely designed to promote those sectors with high economic potential, while also discouraging implicitly those with negative social or environmental
externalities. In reviewing these incentives, HP may also consider further extensions to zero pollution or “net positive impact” industries, which – because of their nature or because of their operations – receive additional incentives for sound environmental management. Biotech and
nanotech are examples of positive impact industries by nature. Commercial buildings reflecting positive impact (through recycling or treating the waste or water of others, for example), is an example of activities with positive operational impacts.
The findings further support the proposal by the Department of Industry and the Industry
Association in Baddi, which would like to develop or have access to a database of green technologies. An efficient mechanism would be to develop a technology bank at the national level, responsible for disseminating information on new technologies. The proposed Green Cell within the
Department of Industry, under DPL 1, has not been established and remains an appropriate way forward. [tbv: check against DPL]
MSME Incentive System The MSME scheme is described in detail in Chapter 6. It is comprised of the following elements:
Ø environmental fee tied to operating permits (on pollution discharge with exemptions);
Ø capital grant provisions for environmental technology;
Ø soft loan scheme for MSME support;
Ø accountability instruments; and,
Ø economic incentives associated with supply-‐chain management.
Comprehensive Long-term System This SEA has reviewed a wide range of systems. Any of these may in some circumstance be
appropriate for a specific target or reason. At this stage, however, the following interventions are regarded as efficient methods that can be applied more universally.
Ø Scaled elements of the MSME Scheme. There is a distinct advantage to making the structure of this
incentive scheme universal to all industries independent of sector or scale, and it is readily adaptable to further nuancing within such structure. For example, large firms may be eligible for only partial fee
exemptions and, moreover, soft loans in such instances may be unavailable or available only for
Confidential Draft – Do Not Cite
HP Industry SEA Page 87 December 2013 (Draft 23/12/13)
partial financing. Increasing the scope of the program also provides a firmer basis for budget neutrality as fees on large industries could be designed to create a net inflow for relevant subsidies to
smaller firms. Note also that the fee may be supplemented by increases in the cess; the cess currently in HP is among the lowest in the country.
Ø Complementary elements to the MSME Scheme. SCM is a powerful mechanism but in India’s context
still would benefit from state facilitation. Large firms selling into domestic markets, or firms with little ability to monitor compliance within SMEs, may have few incentives to engage in quality control SCM.
The current incentives (which create “dirty outsourcing”) are largely a consequence of this. To support SMEs, Government may also consider some token complementary financial assistance (e.g., in preparing a management plan for SCM) targeted to large domestic firms.
Ø Spatial planning through zoning. Himachal Pradesh already has substantial experience with spatial zoning through the designation of industrial supports. While in strict terms this is a pure CAC
approach, this trend should continue, as it places a physical and regulatory ring-‐fence around pollutants in a way that makes them easier (and cheaper) to monitor while also providing
opportunities for using common waste management, recycling and re-‐use, and waste treatment facilities. Aggressive use of spatial planning also provides opportunities to reduce the significance of
accidental or permitted releases of pollutants; industrial parks can be located in areas that are less disruptive on environmental services and physically separated from human settlements. Also, they
provide a basis – at the design stage – of introducing principles of Green Design that reduce at the outset the energy, water, and material demands of the activities within the space.
Other A number of other options were identified during the course of the HP SEA. Those with particular long-‐term promise include the following:
Ø Rating and Disclosure System. This system is currently being developed for HP under the Inclusive
Green Growth DPL. Initially this is likely to be targeted at the large industries. Once in place there is the opportunity to link high ratings with charge exemptions, while revenue from charges applicable to
less highly rated companies could be used to support SMEs in terms of pre-‐treatment costs or CETP charges. In addition to incentivizing companies to be environmentally responsible, the establishment
of the rating and disclosure system is expected to enable HP to be more ‘data ready’ for the potential application of other economic incentives.
Ø GHG Charges or Subsidies. The use of carbon and GHG taxation or charges is currently not a
significant option for states such as HP. It may, however, remain as an option over the longer term depending also on national policies and initiatives in other states. Providing support for monitoring
and information collection relating to GHGs is, however, potentially beneficial to HP and to large firms; access to carbon markets for creation of emission reduction (ER) credits either through energy
efficiency initiatives, decreased emissions of complex compounds, or reduction of GHGs through composting of organic wastes all provide opening are all valid methodologies for effectively gaining access to subsidies through carbon credit markets.
Phasing & Financial Implications Table ES.1 (in Executive Summary) summarizes the above in terms of their focus on phasing and priority. Near-‐ or short-‐term activities would commence within a 2 year time horizon (with some such as the DPL 2 trigger having almost immediate effect). Medium-‐term activities would commence
implementation within 5 years; long-‐term activities are those that are considered over a time horizon that goes beyond 5 years. At this stage, budgetary estimates are provisional and are treated as order of magnitude estimates.

Confidential Draft – Do Not Cite
HP Industry SEA Page 88 December 2013 (Draft 23/12/13)
[note: all of the above to be summarized in matrix form for Executive Summary. Consider repeating matrix here.]
Confidential Draft – Do Not Cite
HP Industry SEA Page 89 December 2013 (Draft 23/12/13)
ANNEXES
Annex A References
Annex B Key Meetings & Participants
Annex C Supplementary Data – Industries & Criteria Pollutants
Annex D Supplementary Valuation Sources & Information
Annex E Economic Instruments Framework
Annex F Supplementary Data – Miscellaneous & Case Studies
Annex G Cost Effectiveness Templates
Annex H Maps
[insert photo]
Confidential Draft – Do Not Cite
HP Industry SEA Page 90 December 2013 (Draft 23/12/13)
Annex A References Central Pollution Control Board. 2003. Charter on Corporate Responsibility for Environmental Protection:
Action Points for 17 Categories of Industries. Government of India. March.
Central Pollution Control Board. 2009. Comprehensive Environmental Assessment of Industrial Clusters. Ecological Impact Assessment Series. Ministry of Environment and Forests. December.
Central Pollution Control Board. 2011. Annual Report: 2010-‐11. Ministry of Environment and Forests (MOEF).
Das S, Chopra K. 2012. Towards ‘green growth’: Measuring the trade-‐off between conservation of protected
areas and hydel power generation in an ecologically fragile hill state of Northern India. Discussion Paper. Beijer Institute of Ecological Economics Discussion Paper Series No. 234.
Dasgupta P. 2004. Valuing health damages from water pollution in urban Delhi, India: a health production
function approach. Environment and Development Economics 9:83-‐106. Cambridge University Press. UK.
Government of Himachal Pradesh. 2007. State of Environment Report. Department of Environment, Science and Technology.
Government of Himachal Pradesh. 2012. Industries Department Annual Administration Report. 2011/12.
Government of Himachal Pradesh. 2013. Economic Survey of Himachal Pradesh. 2012-‐13. Economic and Statistics Department.
Himachal Pradesh State Pollution Control Board. 2011. Annual Report 2010-‐11.
India Brand Equity Foundation. 2013. Himachal Pradesh: The Abode of Gods. March. www.ibef.org.
Institute for Health Metrics and Evaluation. 2010. Global Burden of Disease 2010. Presentation to Dialogue Workshop. Centre for Science and Environment and Indian Council of Medical Research. Presentation at Gulmohar Hall. India Habitat Centre, New Delhi. February 13.
Kumer S, Managi S. 2009. Economics of Sustainable Development: The Case of India. Springer. New York.
Ministry of Environment and Forests. Annual Report 2011-‐12. Government of India.
Ministry of Micro, Small and Medium Enterprises – Development Institute. 2012. Annual Report 2011-‐12. Solan.
Ministry of Micro, Small and Medium Enterprises – Development Institute. 2009. Micro, Small and Medium Enterprises in India: An Overview. Development Commissioner (MSME). Government of India.
Ministry of Micro, Small and Medium Enterprises – Development Institute. 2009. Quick Results Fourth All India Census of Micro, Small and Medium Enterprises: 2006-‐2007. Development Commissioner (MSME). Government of India.
Mukhopadhyay K, Chakraorty D. 2012. Water pollution in India: an Input-‐Output Analysis. Draft. Paper submitted for the 20th IIOA conference in Bratislava, June 25-‐29.
Murty MN, James AJ, Misra S. 1999. Economics of Water Pollution: The Indian Experience. Oxford University Press. USA.
Murty MN, Kumar S. 2011. Water Pollution in India: An Economic Appraisal. India Infrastructure Report 2011. http://www.idfc.com/pdf/report/2011/Chp-‐19-‐Water-‐Pollution-‐in-‐India-‐An-‐Economic-‐Appraisal.pdf
OECD. 2008. Environmental Outlook to 2030. http://www.oecd.org/environment/indicators-‐modelling-‐outlooks/40200582.pdf
Pandy R. 2010. Estimating Sectoral and Geographical Industrial Pollution Inventories in India: Implications for Using Effluent Charge Versus Regulation. The Journal of Development Studies: 41:1, 33-‐61.
World Bank. 1995. The Industrial Pollution Projection System (IPPS). Policy Research Working Paper WPS 1431. Policy Research Department. Environment, Infrastructure, and Agriculture Division. March.
Confidential Draft – Do Not Cite
HP Industry SEA Page 91 December 2013 (Draft 23/12/13)
World Bank. 2001. Environmental Health in India. Priorities in Andhra Pradesh. Environment and Social Development Unit. South Asia Region. October.
World Bank. 2005. For a Breath of Fresh Air: Ten Years of Progress and Challenges in Urban Air Quality Management in India 1993-‐2002. Environment and Social Development Unit. South East Asia.
World Bank. 2007. Himachal Pradesh: Accelerating Development and Sustaining Success in a Hill State. Poverty Reduction and Economic Management Unit. South Asia Region.
World Bank. 2009. Himachal Pradesh Institutional Assessment Environmental Sector Part A: Issues – Priorities and their Management; and Part B: Organizational Assessment. May.
World Bank. 2011. Energy Intensive Sectors of the Indian Economy: Path to Low Carbon Growth. Sustainable Development Department. South Asia Region.
World Bank. 2012. DPL to Promote Inclusive Green Growth and Sustainable Development in Himachal Pradesh. August 6.
The following documents were considered and accessed in describing the lessons from other countries relating to MSMEs.
General Bernstein JD. 1997. “Chapter 6 – Economic Instruments”, in Helmer H, Hespanhol I (eds). Water Pollution
Control – A Guide to the Use of Water Quality Management Principles. WHO/UNEP.
Blackman A. 2009. Alternative Pollution Control Policies in Developing Countries: Informal, Informational and Voluntary. Resources for the Future Discussion paper
Bluffstone RA. 2000. Environmental Taxes in Developing and Transition Economies. Department of Economics, University of Redlands (also see: Journal of Public Finance and Management).
Murty MN, Kumar S. 2011. Water Pollution in India: An Economic Appraisal. India Infrastructure Report 2011. http://www.idfc.com/pdf/report/2011/Chp-‐19-‐Water-‐Pollution-‐in-‐India-‐An-‐Economic-‐Appraisal.pdf
Serôa da Motta R, Huber RM, Ruitenbeek HJ. 1999. Market based instruments for environmental policymaking
in Latin America and the Caribbean: lessons from eleven countries. Environmental Development Economics 4: 177-‐201.
United Nations, 2006. SMEs in the Environmental Goods and Services Market: Identifying areas of opportunity, policies and instruments. Case studies: Argentina, Chile, Columbia and Mexico.
Venkatesh J, Lavavya Kumarie R. 2012. Enhancing SMEs Access to Green Finance. International Journal of Marketing, Financial Services and Management Research.
World Bank/IFC. 2012. Doing Business 2013: Smarter Regulations for Small and Medium-‐Size Enterprises. Doing Business Series 10. (Current as at June 2012: updates http://www.doingbusiness.org)
Bangladesh World Bank. 2013. The Bangladesh Responsible Sourcing Initiative: A New Model for Green Growth? DRAFT.
South Asia Environment and Water Resources Unit of the World Bank.
Brazil Feres J, Reynaud A, Tomas A, Serôa da Motta R. 2008. Competitiveness and Effectiveness Concerns in Water
Charge Implementation: a Case Study of the Paraiba do Sul River Basin Brazil. Water Policy.
Serôa da Motta R. 2006. Analyzing the Environmental Performance of the Brazilian Industrial Sector. Ecological Economics.
China Cleaner Production Promotion Law. 2002. Approved by the Standing Committee of the National People’s
Congress (NPC) of the People’s Republic of China.
Confidential Draft – Do Not Cite
HP Industry SEA Page 92 December 2013 (Draft 23/12/13)
Ministry of Environmental Protection The People’s Republic of China. 1999. Decree of the State Environmental Protection Administration No 7. Measures on Administrative Penalty for Environmental Protection.
Stevens R, Moustapha M, Evelyn P, Stevenson R. 2013. Analysis of the Emerging China Green Era and its
Influence on Small and Medium-‐Sized Enterprises Development: Review and Perspectives. Journal of Sustainable Development.
Indonesia USAID. 2008. Environmental Compliance and Enforcement in Indonesia Rapid Assessment.
Malaysia Small and Medium Industries Development Corporation (SMIDEC). 2007. Policies, Incentives, Programmes and
Financial Assistance for SMEs. Ministry of International Trade and Industry. Government of Malaysia. January.
SMIDEC/SME Corp. 2009-‐2012. Policies, Incentives, Programmes and Financial Assistance for SMEs. Malaysia.
Mexico Blackman A, Lahiri B, Pizer W, Rivera Planter M, Muñoz Piña C. 2007. Voluntary Environmental Regulation in
Developing Countries: Mexico’s Clean Industry Program. Discussion Paper DP 07-‐36. Resources for the Future. Washington DC. July.
Blackman A. 2007. Can Voluntary Environmental Regulation Work in Developing Countries?: Lessons from Case Studies. Discussion Paper DP 07-‐10. Resources for the Future. Washington, DC. October.
Philippines Board of Investments. 2012. Primer on Doing Business in the Philippines. BOI, Manila.
Catelo MA, Sajise AJ, Darvin BA, Ramirez PA. 2006. Impact Evaluation of the Environmental User Fee System: A Stakeholder Perspective. EEPSEA, Singapore. (Also EEPSEA Policy Brief 2006-‐PB10).
Luken RA. 1999. Industrial Policy and the Environment in the Philippines, UNIDO.
South Korea Lee S-‐Y. 2008. Drivers for the participation of small and medium-‐sized suppliers in green supply chain
initiatives. Supply Chain Management: An International Journal. 13:3 185-‐198.
Water Environmental Partnership in Asia (WEPA). Republic of Korea. Various Entries.
Thailand Araya Nuntapotidech. 2012. Asia Regional Dialogue on Green Economy Approaches: Thailand Case. (Deputy
Director General) Pollution Control Department, Bangkok.
Jonsson F. 2007. Product Related Environmental Work in Small and Medium Sized Enterprises in Thailand,
Developing and Manufacturing Electrical and Electronic Products. Masters Thesis. Linköping University.
Prasert Tapaneeyangkul. nd. SME Industrial Review. Hazardous Substance Control Bureau, Ministry of Industry, Bangkok.
Staudte M, Karcher M. 2001. Economic Instruments for Air Pollution Management: Options for Thailand. Fichtner/GTZ.
Thoedsak Chomtohsuwan. 2011. Effect of Pollution Tax Policies on Change of Household Demand, Economic
Structure and Environmental Load: A Case Study of Thai Economy. Faculty of Economics, Saitama University, Japan.
“Thailand Finance Ministry Readies Pollution Tax”. 3 July 2013. Wordpress.

Confidential Draft – Do Not Cite
HP Industry SEA Page 93 December 2013 (Draft 23/12/13)
Vietnam Mahanty S, Dang TD, Hai PG. 2012. Crafting sustainability: managing water pollution in Viet Nam’s craft
villages. Discussion Paper 20. Development Policy Centre. Australian National University.

Confidential Draft – Do Not Cite
HP Industry SEA Page 94 December 2013 (Draft 23/12/13)
Annex B Key Meetings & Participants
Industries Department
Mr. P.C. Dhiman, Secretary (In-‐Charge), Department of Industries
Mr. Mohan Chauhan, Director, Department of Industries
Dr. Rajinder Chauhan, Sr. Industrial Advisor, Department of Industries
Department of Environment, Science and Technology (DEST) Dr. S. S. Negi, Director, Environment
Mr. Suresh Attri.
Mr. Sanjay Verma.
Department of Economics & Statistics Mr. Pradeep Chauhan, Director
Health Department
Mr. Ali R. Rizvi, Principal Secretary, Health & Family Welfare.
State Pollution Control Board Mr. Sandeep Sood, Member-‐Secretary, Pollution Control Board.
Team of engineers from the HP Pollution Control Board
Mr Chetan Joshi (Baddi)
The BBN Industrial Association Mr Rajender Guleria – Chair
25 representatives of the BBNIA

Confidential Draft – Do Not Cite
HP Industry SEA Page 95 December 2013 (Draft 23/12/13)
Annex C Supplementary Data – Industries & Criteria Pollutants Table C.1: Characteristics of Industrial “hotspots” in Himachal Pradesh
Environmental Reporting Main Industries (examples) Solan District Parwanoo
Air: Critically High PM10 Water quality: poor – industrial pollution in river Sukhana
Fruit processing – agro industries (cattle feed and pesticides) – chemicals – rubber – light engineering Large ESI hospital Many SSI due to proximity and connectivity to Chandigarh and Panchkula
Baddi Air: Critically High PM10 Water quality: mixed – pollution in river Sirsa
Pharmaceuticals (~ 800 companies) – textiles (tread mills) – aluminum, brass and steel product manufacturing – IT Haphazard development – lack of infrastructure; poor interstate connectivity
Barotiwala Water quality: mixed – pollution in river Sirsa
Multi-‐Industry – Pharmaceuticals – textiles (thread mills)
Nalagarh Air: High PM10 Water: mixed – pollution in river Sirsa
Pharmaceuticals – textiles (thread mills, leather) – food (confectionary, beverages, grocery items) – breweries – steel – mining – caustic soda
Solan City Water quality: poor Pharmaceuticals – breweries – bimetals – manufacturing (lead acid batteries, bimetals, HDPE pipe) – chemicals (gum rosin and terpenes) – machinery (motors)
Sirmour District Kala Amb
Air: High PM10 Water quality: poor
Engineering/automotive – paper – chemicals (raw materials for food, beverages, pharma) – metals (welding electrodes) – textiles (thread mills) – air conditioners
Paonto Sahib Air: Critically High PM10 Water quality: poor
Pharmaceuticals – cement – textiles – chemicals (hair, health, beauty) – textiles (thread mills) – machinery – food (fruit processing, mushrooms) – batteries
Kangra District Damtal Air: Moderate to High PM10 Mining – cement – aluminum products

Confidential Draft – Do Not Cite
HP Industry SEA Page 96 December 2013 (Draft 23/12/13)
Table C.2: Current occurrence and scale of industrial activities by District in Himachal Pradesh
Solan Sirmour Kangra Una Shimla Bilaspur Kullu Mandi Polluting Industry (as per CPCB)
1 Aluminium Smelting 2 Pharmaceutical Manufacturing *** ** *
3 Chlor Alkali/Caustic Soda **
4 Cement *** * ** *
5 Copper Smelting
6 Dyes and Dye Intermediate * *
7 Fermentation (Distillery) **
8 Fertilizer **
9 Integrated Iron and Steel *** ** *
10 Leather Processing incl Tanneries **
11 Oil Refinery
12 Pesticides formulation/manufacture ** **
13 Pulp and paper *** ** * *
14 Petrochemical
15 Sugar ** *
16 Thermal power plants 17 Zinc smelting Based on Director of Industries. 2003. Group-‐wise details of units in large and medium scale sector, March. Various reports with information on industrial development in HP. Miscellaneous web data sources including industry websites.
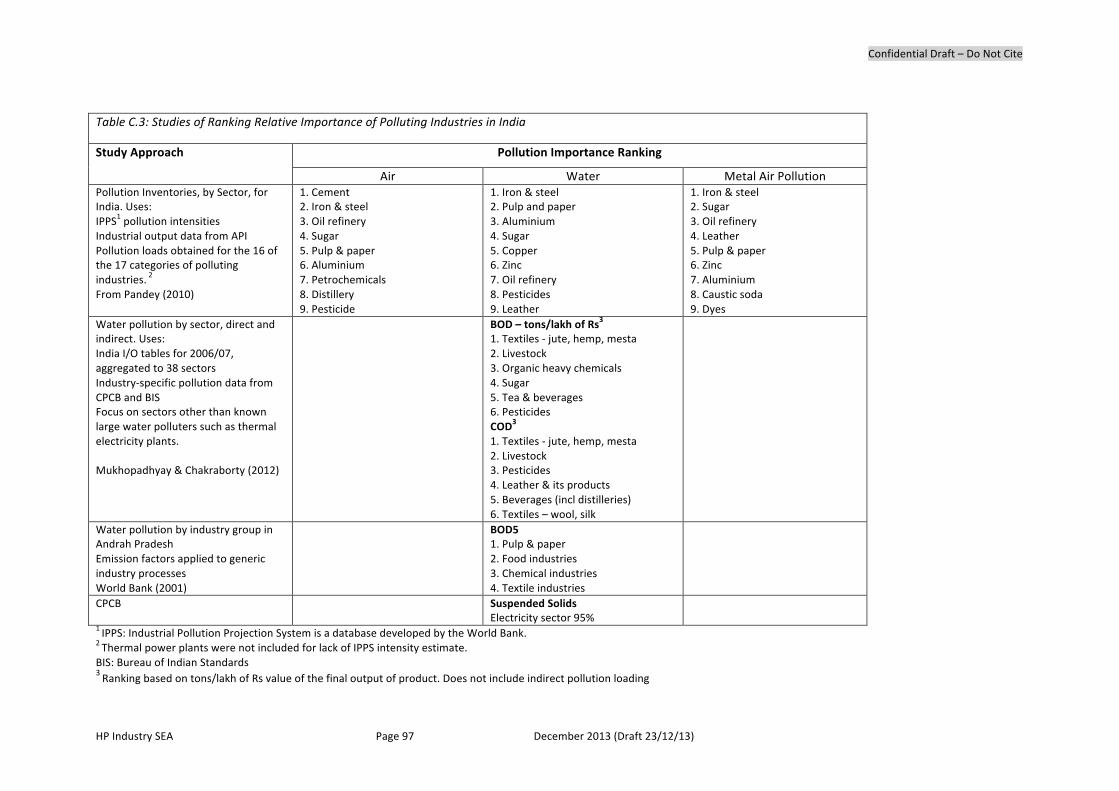
Confidential Draft – Do Not Cite
HP Industry SEA Page 97 December 2013 (Draft 23/12/13)
Table C.3: Studies of Ranking Relative Importance of Polluting Industries in India
Study Approach Pollution Importance Ranking
Air Water Metal Air Pollution Pollution Inventories, by Sector, for India. Uses: IPPS1 pollution intensities Industrial output data from API Pollution loads obtained for the 16 of the 17 categories of polluting industries. 2 From Pandey (2010)
1. Cement 2. Iron & steel 3. Oil refinery 4. Sugar 5. Pulp & paper 6. Aluminium 7. Petrochemicals 8. Distillery 9. Pesticide
1. Iron & steel 2. Pulp and paper 3. Aluminium 4. Sugar 5. Copper 6. Zinc 7. Oil refinery 8. Pesticides 9. Leather
1. Iron & steel 2. Sugar 3. Oil refinery 4. Leather 5. Pulp & paper 6. Zinc 7. Aluminium 8. Caustic soda 9. Dyes
Water pollution by sector, direct and indirect. Uses: India I/O tables for 2006/07, aggregated to 38 sectors Industry-‐specific pollution data from CPCB and BIS Focus on sectors other than known large water polluters such as thermal electricity plants. Mukhopadhyay & Chakraborty (2012)
BOD – tons/lakh of Rs3 1. Textiles -‐ jute, hemp, mesta 2. Livestock 3. Organic heavy chemicals 4. Sugar 5. Tea & beverages 6. Pesticides COD3 1. Textiles -‐ jute, hemp, mesta 2. Livestock 3. Pesticides 4. Leather & its products 5. Beverages (incl distilleries) 6. Textiles – wool, silk
Water pollution by industry group in Andrah Pradesh Emission factors applied to generic industry processes World Bank (2001)
BOD5 1. Pulp & paper 2. Food industries 3. Chemical industries 4. Textile industries
CPCB Suspended Solids Electricity sector 95%
1 IPPS: Industrial Pollution Projection System is a database developed by the World Bank. 2 Thermal power plants were not included for lack of IPPS intensity estimate. BIS: Bureau of Indian Standards 3 Ranking based on tons/lakh of Rs value of the final output of product. Does not include indirect pollution loading

Confidential Draft – Do Not Cite
HP Industry SEA Page 98 December 2013 (Draft 23/12/13)
Table C.4: Selected Himachal Pradesh Industry Incentives
New
Unit
Existing Unit w
ith
Large Expa
nsion
Catego
ry A
Catego
ry B
Catego
ry C
Village Indu
stry
Expo
rt Orien
ted
Special Category
Thrust In
dustry
List
Includ
es
Negative List
Subsidies 50% reimbursement of feasibility study ✔ SSI: 90% reimbursement of feasibility study ✔ ✔ SSI: 100% subsidy for installation cost of P&E ✔ ✔ Exemption from excise duty for 7 years (SSI) ✔ ✔ Interest subsidy at 5% (SSIs & some on Thrust List) ✔ ✔ ✔ Power Concession
+
Reduced rate for 5 years ✔ ✔ ✔ ✔ ✔ ✔1 Priority of connection ✔ ✔ Exemption from power load cuts ✔ ✔ Exemption from power duty for 10 years ✔ ✔ Tax Concessions Exemption from CST/GST for 10 years ✔ ✔ ✔ ✔ 100% GST exemption for 8 years ✔ ✔ 100% GST exemption for 5 years ✔ ✔ Deferment of 75% of GST for 8 years ✔ ✔ Deferment of 75% of GST for 5 years ✔ ✔ 1% GST on raw material, processing & packaging (excludes timber, shale, limestone)
✔ ✔
1% CST on goods manufactured (excludes breweries, distilleries, non-‐fruit-‐based wineries, bottling plants)
✔ ✔
Grants Pollution control equipment – 20% of installation cost ✔ ✔ ✔ ✔ Equipment for establishing testing centres; R&D costs of patent ✔ ✔ 1. Load must exceed 100kW CST: Central Sales Tax; GST: General Sales Tax

Confidential Draft – Do Not Cite
HP Industry SEA Page 99 December 2013 (Draft 23/12/13)
Table C.5: Himachal Pradesh – Thrust Industries54
1. Enterprises based directly on horticulture produce including hops and tea. 2. Mineral water bottling. 3. Automobile manufacturing Enterprises including assembly Enterprises that have a minimum of
5 ancillary Enterprises substantially dependent on it. 4. Cold storage Enterprises /chain. 5. Fruit/vegetable/herbs/ honey/spices based wineries. 6. Production of ciders/ale/ liqueurs. 7. Sericulture/Handlooms/Khadi industry related manufacturing industrial activities. 8. Electronic Enterprises including computer software and information technology except
assembling Enterprises where value addition is less than 15%. 9. Floriculture 10. Medicinal herbs and aromatic herbs etc. processing. 11. Horticulture, Maize based industries, herbal-‐based industries and Agro Based Industries
excluding those included in the negative list. 12. Food Processing Industry excluding those included in the negative list. 13. Sugar and its by-‐products. 14. Silk and silk products. 15. Wool and wool products 16. Woven fabrics (Excisable garments) 17. Sports goods and articles and equipment for general physical exercise and equipment for
adventure sports/activities, tourism. 18. Paper & paper products excluding those in negative list (as per excise classification) 19. Pharma products. 20. Information & Communication Technology Industry, Computer hardware, Call Centres, I.T.
Software and services. 21. Eco-‐tourism-‐ Hotels, resorts in locations other than those located in the Municipal limits/NAC
/Nagar Panchayats/Special Area Development Authority limits, as the case may be of Shimla, Dalhousie, Macleodganj and Manali
22. Spa, entertainment/amusement parks ropeways etc. 23. Industrial gases (based on atmospheric fraction). 24. Handicrafts 25. Non-‐timber forest product based industries. 26. Precision Industries 27. Enterprises to manufacture industrial products by any biotechnology process and Processing
Laboratories or R&D activity related to processing, scale-‐up, other innovations and products in the field of Biotechnology, as approved by State Level Single Window Clearance and Monitoring Authority on the recommendation of the Department of Environment, Science and Technology of the State Government.
54 Note: Products listed from Serial No 9 to No 24 are as reflected in GOI Ministry of Industry and Commerce O.M. dated 7/01/03 and as defined by Government of India from time to time.

Confidential Draft – Do Not Cite
HP Industry SEA Page 100 December 2013 (Draft 23/12/13)
Table C.6: Himachal Pradesh – Negative Industries55
1. Tobacco and tobacco products including cigarettes and pan masala 2. Thermal Power Plant (coal/oil based) 3. Coal washeries/dry coal processing 4. Inorganic Chemicals excluding medicinal grade oxygen (2804.11), medicinal grade hydrogen
peroxide (2847.11), compressed air (2851.30) 5. Organic Chemicals excluding Provitamins/vitamins, Hormones (29.36), Glycosides (29.39),
Sugars (29.40)(reproduction by synthesis not allowed as also down stream industries) 6. Tanning and dyeing extracts, tannins and their derivatives, dyes, colours, paints and varnishes,
putty, fillers and other mastics, inks 7. Marble and mineral substances not classified elsewhere. 8. Flour Mill/Rice Mill (including Roller flour mills) 9. Foundries using coal. 10. Minerals fuels, mineral oils and products of their distillation; Bituminous substances, mineral
waxes. 11. Synthetic rubber products 12. Cement Clinker and Asbestos raw including fibre. 13. Explosive (including industrial explosives, detonators & fuses, fireworks, matches, propellant
powders etc.) 14. Mineral or chemical fertilizers 15. Insecticides, fungicides, herbicides & pesticides (basic manufacture and formulation) 16. Fibre glass & articles thereof 17. Manufacture of wood pulp, mechanical or chemical (including dissolving pulp) 18. Branded aerated water/soft dinks (non-‐fruit based ) 19. Paper Writing or printing paper, Paper or paperboard, Maplitho paper, Newsprint, in rolls or
sheets, Craft paper, Sanitary towels, Cigarette paper, Grease-‐proof paper, toilet or facial tissue, Paper & paper board, laminated internally with bitumen, tar or asphalt, Carbon or similar copying paper, products consisting of sheets of paper or paperboard, impregnated, coated or covered with plastics, Paper and paperboard, coated impregnated or covered with wax etc.
20. Plastics and articles thereof. 21. Production of firewood and charcoal. 22. Mini Steel plants induction/ Arc/Submerged furnaces, and/ or rolling mills.
55 Note: Products listed from Serial No 1 to No 20 are as reflected in Government of India, Ministry of Industry and Commerce O.M. dated 7/01/04 and as defined by Government of India from time to time.
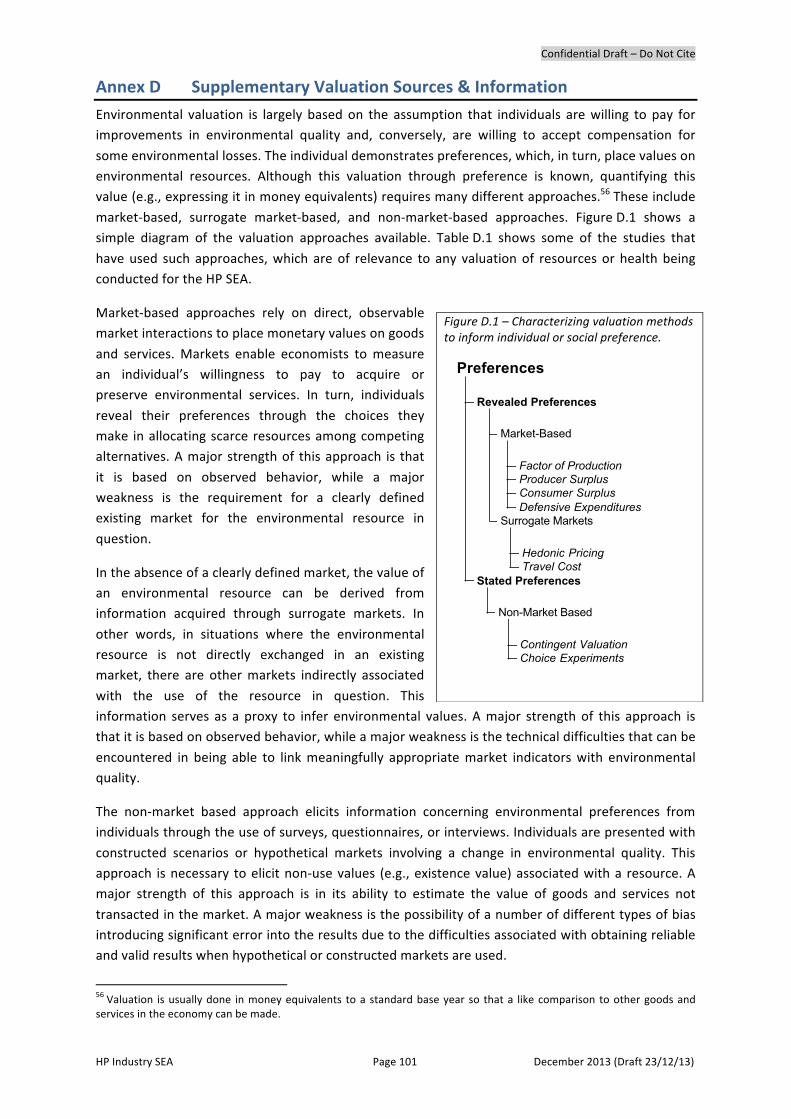
Confidential Draft – Do Not Cite
HP Industry SEA Page 101 December 2013 (Draft 23/12/13)
Annex D Supplementary Valuation Sources & Information Environmental valuation is largely based on the assumption that individuals are willing to pay for improvements in environmental quality and, conversely, are willing to accept compensation for
some environmental losses. The individual demonstrates preferences, which, in turn, place values on environmental resources. Although this valuation through preference is known, quantifying this value (e.g., expressing it in money equivalents) requires many different approaches.56 These include
market-‐based, surrogate market-‐based, and non-‐market-‐based approaches. Figure D.1 shows a simple diagram of the valuation approaches available. Table D.1 shows some of the studies that
have used such approaches, which are of relevance to any valuation of resources or health being conducted for the HP SEA.
Market-‐based approaches rely on direct, observable market interactions to place monetary values on goods
and services. Markets enable economists to measure an individual’s willingness to pay to acquire or preserve environmental services. In turn, individuals
reveal their preferences through the choices they make in allocating scarce resources among competing alternatives. A major strength of this approach is that
it is based on observed behavior, while a major weakness is the requirement for a clearly defined existing market for the environmental resource in
question.
In the absence of a clearly defined market, the value of an environmental resource can be derived from information acquired through surrogate markets. In
other words, in situations where the environmental resource is not directly exchanged in an existing market, there are other markets indirectly associated
with the use of the resource in question. This information serves as a proxy to infer environmental values. A major strength of this approach is that it is based on observed behavior, while a major weakness is the technical difficulties that can be
encountered in being able to link meaningfully appropriate market indicators with environmental quality.
The non-‐market based approach elicits information concerning environmental preferences from individuals through the use of surveys, questionnaires, or interviews. Individuals are presented with
constructed scenarios or hypothetical markets involving a change in environmental quality. This approach is necessary to elicit non-‐use values (e.g., existence value) associated with a resource. A major strength of this approach is in its ability to estimate the value of goods and services not
transacted in the market. A major weakness is the possibility of a number of different types of bias introducing significant error into the results due to the difficulties associated with obtaining reliable and valid results when hypothetical or constructed markets are used.
56 Valuation is usually done in money equivalents to a standard base year so that a like comparison to other goods and services in the economy can be made.
Figure D.1 – Characterizing valuation methods to inform individual or social preference.
Factor of ProductionProducer SurplusConsumer SurplusDefensive Expenditures
Market-Based
Hedonic PricingTravel Cost
Surrogate Markets
Revealed Preferences
Contingent ValuationChoice Experiments
Non-Market Based
Stated Preferences
Preferences
Confidential Draft – Do Not Cite
HP Industry SEA Page 102 December 2013 (Draft 23/12/13)
One of the approaches available is the “benefit transfer” methodology, which in effect involves transferring values from a site where detailed existing studies had been conducted (the “study site”)
to a new site with similar attributes but where no primary valuation research has been conducted.57 This new site or target site is typically called the “policy site”, reflecting the idea that a new policy or plan is being considered for application to this new site. The procedure is of interest to analysts and
policy-‐makers because the process is less costly and faster than conducting primary research. Typically valuation is done as a two-‐stage process: (i) the values are transferred based on specific targets (such as areas of ecosystems, numbers of species, or the number of dependent people); (ii)
the values are then further adjusted for various parameters relating to resource quality, income, timing or other characteristics that are considered to be significant in the determination of value. The first step – that of transferring the unadjusted values – still requires similarity in project sites,
environmental services, and local populations. Adjustments undertaken in the second step may be able to accommodate some site differences. It is generally acknowledged that the most reliable benefit transfers occur when the entire demand function can be shifted from the study site to the
policy site (ENVALUE, Smith et al. 2006).
The policy interest in benefit transfer work has turned what was originally a simple ad hoc procedure with low levels of confidence, into a more sophisticated science that now respects standard statistical tests for significance and has higher levels of confidence. A recent stock-‐taking of the
science was undertaken in a special issue of Ecological Economics, edited by Wilson and Hoehn (December 2006) in which 32 international experts and practitioners addressed some of the opportunities and remaining limitations to the benefit transfer techniques. The findings of this
exercise can be summarized as follows:
• Site similarity is normally a prerequisite. This similarity requires comparability of the
ecosystem commodity, market context and formulated welfare measure (Loomis and Rosenberger 2006). In practical terms this means paying attention to the welfare weights and distribution of benefits among individuals. Consistency checks are difficult to verify,
however, because the original published studies often do not contain that detail due to space or publication restrictions.
• Meta-‐analysis of multiple studies can produce a valid basis for transferred values, but
consistency requirements still hold (Bergstrom and Taylor 2006). Estimates will be improved through making adjustments for core demographic and related variables.
• Study values transferred between geographically removed sites (across continents) can be
reliable if components of the demand function at both sites are known. (Ready and Navrud 2006; Morrison and Bergland 2006)
• Values may need to be adjusted for geographic proximity of the respondents to the policy
site. There exists a distinct value “drop-‐off” for both use values and non-‐use values as respondents are further away from a site; individuals’ valuations are more stable for non-‐
use values, but both values decline because of non-‐responses or lexical preferences. (Bateman et al. 2006) Using mean value transfers under such circumstances will generally generate higher values than those that are spatially sensitive.
57 The term “benefit transfer” was first used by Desvousges, Naughton and Parsons (1992) to describe the transfer of monetary valuations determined by research applicable to the site studied, to a different site.
Confidential Draft – Do Not Cite
HP Industry SEA Page 103 December 2013 (Draft 23/12/13)
• Landscape mapping in geo-‐referenced GIS systems at the study site and policy site permit
significant improvements in valuation through linking the valuations to sub-‐areas, habitats, and ecosystem services. (Troy and Wilson 2006)
• Analysis of institutional use of valuation suggests that there are inherent built-‐in regulatory
constraints to implementing original valuation work. This creates a strategic bias towards benefit transfer methods. The lack of original studies in areas of new strategy formulation or
new policy formulation significantly hinders the use of benefit transfer methods to such agencies. (Iovanna and Griffiths 2006)
The final observation, of course, is that benefit transfer techniques remain a complement to good primary research. If there are no study sites available using primary methods, then the BT-‐based
policy studies cannot be undertaken.

Confidential Draft – Do Not Cite
HP Industry SEA Page 104 December 2013 (Draft 23/12/13)
Table D.1: Valuation Literature of Potential Relevance to Himachal Pradesh

Confidential Draft – Do Not Cite
HP Industry SEA Page 105 December 2013 (Draft 23/12/13)
Annex E Economic Instruments Framework This Annex provides a general framework for investigating the use of economic policy instruments and incentives. Policy instruments are defined and a classification of different approaches is
provided.58
Continuum of Economic Instruments There are a number of general economic principles that form the background philosophy for an
economically and environmentally sustainable strategy for natural resource management. The two most often enunciated include the polluter-‐pays and precautionary principles. The polluter-‐pays (or user-‐pays) principle assigns rights that allow internalization of costs that would not normally be
incurred by the polluter or user (externalities). The precautionary principle provides a mechanism for dealing with the uncertainty of impacts (Perrings 1991; O’Riordan and Cameron 1995).
A number of mechanisms have been developed and used to promote these principles. At one extreme they include fines or sanctions that are linked to traditional command-‐and-‐control (CAC)
regulations. At the other extreme they include laissez-‐faire approaches that require consumer advocacy or private litigation to act as incentives for improving environmental management. In
between are the more familiar tax-‐and-‐subsidy approaches as well as the less familiar mechanisms relying on traded property rights. All of these approaches attempt to internalize environmental costs of natural resource use.
There is no single standardized definition of an incentive-‐based or “market”-‐based instrument (MBI),
but the commonly held understanding and the definition employed here is that an MBI must, foremost, attempt to align private costs with social costs to reduce externalities (Panayotou 1995). Within this definition, the particular strength of an MBI then depends on the degree of flexibility that
a polluter or resource user has in achieving a given environmental target. A very “weak” MBI essentially dictates through regulation the type of technologies that firms must use, or the targets they must meet. This is the inflexible Command and Control (CAC) approach – which also entails an
economic incentive to the extent that failure to comply can result in monetary sanctions. A very “strong” MBI allows market signals rather than explicit directives determine the best way to meet a given standard or goal.
Flexibility is operationalized by equating it to the level of decentralization that occurs in transferring
social (or state) decisions to the private (individual) level. A strong MBI decentralizes decision-‐making to a degree that the polluter or resource user has a maximum amount of flexibility to select the production or consumption option that minimizes the social cost of achieving a particular level
of environmental quality; profit-‐ or utility-‐maximizing behavior in this case also generates a “lowest social cost” outcome for the achievement of a given policy objective.
The framework presented here focuses on the cost-‐effectiveness of reducing externalities in defining an MBI. This interpretation provides scope both for internalizing the costs or benefits of any
externality while allowing the freedom of choice that will permit users to select an appropriate technology for optimizing environmental quality.
Table E.1 illustrates the broad spectrum of instruments that might be available, all of which implicitly or explicitly have some incentive effect. They fall across a continuum ranging from very strict
58 The framework draws on Huber, Ruitenbeek, da Motta. (1998).

Confidential Draft – Do Not Cite
HP Industry SEA Page 106 December 2013 (Draft 23/12/13)
command approaches to decentralized approaches that rely more on market or legal mechanisms. Even traditional CAC regulations, with heavy fines, create a presumed incentive effect because the
resource user would be compelled to comply with the regulations to avoid the sanctions.
Table E.1: Classification of Economic Instruments Based on Flexibility in Individual Decision-‐making
Minimum Flexibility Moderate Flexibility Maximum Flexibility
Control Oriented Market Oriented Litigation Oriented Government Involvement Decreasing –––––––––––> Private Initiative Increasing ––––––––––––––>
Regulations and Sanctions
Charges, Taxes, and Fees
Market Creation Final Demand Intervention
Liability Legislation
General Examples
Standards Government restricts nature and amount of pollution or resource use for individual polluters or resource users. Compliance is monitored and sanctions imposed (fines, closure, jail terms) for noncompliance.
Effluent or User Charges: Government charges fees to individual polluters or resource users based on amount of pollution or resource use and nature of receiving medium. Fee is high enough to create incentive to reduce impacts. Subsidies: Government provides subsidized inputs to encourage their adoption.
Tradable Permits: Government establishes a system of tradable permits for pollution or resource use, auctions or distributes permits, and monitors compliance. Polluters or resource users trade permits at unregulated market prices.
Performance Rating: Government supports labeling/performance rating program that requires disclosure of environmental information on the final end-‐use product. Performance based on adoption of ISO 14000 voluntary guidelines: zero pollution discharge, mitigation plans submitted; pollution prevention technology adopted, reuse policies and waste recycling.
Strict Liability Legislation: The polluter or resource user is required by law to pay any damages to those affected. Damaged parties collect settlements through litigation and the court system.
Specific Examples Pollution standards. Licensing of economic activities. Land use restrictions. Zoning and setback requirements. Water use quotas. Construction impact regulations for roads, pipelines, ports, or communications grids. Fines for spills from port or land-‐based storage facilities. Bans applied to materials deemed unacceptable for solid waste collection services.
Noncompliance pollution charges. Source-‐based effluent charges to reduce downstream water treatment requirements. Royalties and financial compensation for natural resources exploitation. Performance bonds to ensure construction standards. Subsidies to construct CETPs. Tipping fees on solid wastes. User charges for water.
PES to forest owners to ensure water protection ecosystem services. Designation of property rights to farmers to improve irrigation water and drainage management. Deposit-‐refund systems for solid and hazardous wastes. Tradable permits for water abstraction rights, and water and air pollution emissions.
Consumer product labeling (eco-‐labels) relating to production practices, energy efficiency, etc. Supply chain intervention where intermediate buyers insist on installation of ETPs for upstream product production processes. Education regarding recycling and reuse. Disclosure legislation requiring manufacturers to publish solid, liquid, and toxic waste generation. Blacklist of polluters.
Damages compensation to plaintive. Liability placed on guilty firm’s managers and environmental authorities. Long-‐term performance bonds posted for potential or uncertain hazards from infrastructure construction. “Zero net impact” requirements for infrastructure projects.
Goals of Incentive-Based Instruments In principle, there is a wide range of methods available for attempting to regulate or manage environmental quality. Each of these intends to address a variety of goals. One goal associated with decentralized decision-‐making relates to cost-‐effectiveness. The asymmetry of information, for
example, often implies that individual agents, private firms, or community associations are more likely than governments to identify the most cost-‐effective means for achieving a given environmental goal, such as less water withdrawal, less water pollution, or more forest coverage.
This forms the basis for the common theoretical result that – if one focuses entirely on private costs

Confidential Draft – Do Not Cite
HP Industry SEA Page 107 December 2013 (Draft 23/12/13)
– strong forms of MBIs are more cost effective than their weaker counterparts or than CAC approaches (Tietenberg 1992).
Another fundamental goal of most environmental regulatory systems is to decrease externalities.
Externalities exist where the agent making the production or consumption decision does not bear all of the costs or benefits of this decision. Externalities abound in environmental issues. Disposal of industrial effluent into a waterway may be a low-‐cost solution to waste disposal for the polluter, but
firms and individuals downstream may suffer consequences through higher costs from lost fishery production, higher water treatment costs, lower amenity values (for recreation), or loss of critical drinking water supplies. Most economic incentive structures attempt to transfer some of this cost
back to the individual responsible for the decision. A similar situation could exist with environmentally beneficial decisions: a firm that cleans polluted intake water and then discharges clean water after using it in its internal process would, in fact, be creating a positive externality, and
in such cases it could be argued that it is optimal to provide subsidies to such a firm in direct proportion to the value of this external benefit.
A third goal that many policymakers have when designing an appropriate economic incentive system is revenue generation. There are, however, practical tradeoffs to consider between revenue
generation and incentive effects. For example, it would be possible to levy a very high charge that effectively discourages all polluting activity. Abatement levels would be very high in such a case, but no revenue would be generated. Similarly, very low charges would generate little revenue and
generate little abatement because there is no incentive for firms to reduce pollution. Typically, revenue is maximized at some intermediate level of abatement. A policy decision must be made relating to how much additional revenue (beyond the maximum) a government is willing to give up
to generate higher levels of abatement. The answer to this policy question should be related to the marginal benefits of pollution abatement, but in fact it typically is more a function of government
budgetary realities that regard such taxes as a convenient means for underwriting environmental management efforts.
Types of Incentive-Based Instruments Regulations, Fines, and Penalties. Centralized control-‐oriented approaches relying extensively on
regulatory guidelines, permits, or licenses have traditionally been the preferred mechanisms for controlling environmental impacts in urban areas. Although it is technically simple to impose
regulations with specific fines for noncompliance, the problems associated with implementing them and achieving compliance are for many developing countries insurmountable.
First, “regulatory drag” can occur when the regulatory approval system, because it is overburdened, unnecessarily holds up critically important investments, and in so doing acts as a drag on economic
development prospects. Second, the capacity to implement regulations is often limited because of inadequate human resources, or inadequate supportive infrastructure such as environmental information or monitoring networks. Third, local financing constraints arise because authority for
environmental regulations is often delegated to lower (local) levels of government without adequate sources of financing for implementing and monitoring the regulations. Fourth, conflicting standards often prevail where individual ministries or departments have been responsible for setting
environmental regulations within their own departments; lack of coordination often leads to conflicting or overlapping regulations. This is often most pronounced for water-‐related issues because of the numerous stakeholders involved in water use. Finally, conflict of interest within

Confidential Draft – Do Not Cite
HP Industry SEA Page 108 December 2013 (Draft 23/12/13)
government programs exists where government agencies are themselves the implementing or investing authority; self-‐regulation becomes problematic under such circumstances and seldom are
there built-‐in incentives to ensure compliance. This is especially a problem with common infrastructure facilities that typically are a government mandate.
User Charges and Taxes (or Subsidies). Some of the greatest opportunities for improved environmental management include those arising from appropriate market-‐oriented instruments.
The application of these mechanisms typically has a number of goals. First, incentive effects which provide economic reasons for polluters or resource users to lower their impacts are reflected in user charges for typical infrastructure services such as sanitation and water provision. Incentives can also
be used to affect intermodal choices: environmental taxes on fuels can discourage private automobile use, and concomitantly reduce demand for complementary public goods such as roads. Second, market-‐oriented approaches can be used as a recurrent revenue base; this is especially
important where local institutions are expected to be financially autonomous, or are required to fund selected regulatory functions. An important variant of the user charge is a “presumptive tax.” The basis of the tax is an effluent charge that is sensitive to a presumed level of pollution. A firm is
compelled to pay the tax, and no specific monitoring is conducted. If the firm wishes to reduce its tax burden, it must conduct monitoring at its own expense (but still subject to regulatory audit) to demonstrate that its actual pollution loads are less than the presumed loads. Subsidies can also be
used as an economic incentive for environmental management. Subsidies on environmentally appropriate behavior are analytically identical to taxes on inappropriate behavior. Such subsidies have been especially common in developing countries for the importation of pollution control
technologies or for credit subsidies where the credit is used for environmental investments.
Market Creation (Permits and Deposit-‐Refund). At a more complex level, market-‐oriented approaches can include some form of market creation. The most complex system involves tradable
permits where user/polluter rights are assigned, according to a desirable total level of use or pollution, and compliance is achieved by trade. One potential advantage of such systems is that they may reduce bureaucracy and government participation in the process. Such decentralization of
decision-‐making is particularly important in high growth economies where regulatory drag might otherwise be a problem. Another potentially important type of market creation involves reform of property rights to confer some form of property right (either individual or collective) in areas of
environmental sensitivity. The right holder then has the incentive to manage resource use sustainably, and the legal right to seek compensation from agents that benefit from the resource. Deposit-‐refund systems are also based on a market created to buy back sources of solid wastes.
These have been used extensively to promote recycling. Such schemes are also appropriate for difficult problems such as toxic and hazardous waste management.
Market Creation (Payment for Ecosystem Services PES). The PES approach to environmental protection entails the creation of arrangements where individuals or communities are paid to
undertake actions that increase the levels of ecosystem services desired by those who stand to benefit from those services. The Clean Development Mechanism (CDM) is perhaps the most well known such arrangement that facilitates the payment by the global community for carbon emission
reductions, to those providing the emission-‐reduction ecosystem service. PES policies are a growing trend because they offer a direct and possibly poverty-‐alleviating method for achieving environmental objectives. However, transaction costs of implementation, monitoring and

Confidential Draft – Do Not Cite
HP Industry SEA Page 109 December 2013 (Draft 23/12/13)
enforcement can be high if there are a large number of agents, such as when there are many individual landowners whose collective action threatens certain ecosystem services.
Final Demand Intervention (Eco-‐labeling, Disclosure Requirements, or Environmental Awareness).
Eco-‐labeling to promote environmentally sound production and packaging is a relatively passive form of intervention; it decentralizes decision-‐making to the final consumer. A more aggressive form involves promulgating disclosure requirements: firms are required to publish precisely what they
pollute. There are no sanctions attached to such disclosure but consumers are then given the choice of how to deal with the products of particular firms. Another example of education and awareness building, targeted to industries, is the UNIDO waste minimization program that assists in identifying
appropriate technologies for specific plant and industry types. The programs typically improve energy and material efficiency for plants, while at the same time reducing waste generation. All such interventions can effectively reduce urban infrastructure requirements, improve environmental
quality, and have important spin-‐offs in other social sectors. Their major disadvantage is that they typically require some form of subsidy.
Final Demand Intervention (Supply-‐chain Management). Related to eco-‐labeling, firms are increasingly sensitive about the environmental and social context in which their suppliers operate. In
such cases, firms downstream in the supply chain intervene in the upstream production processes of their intermediate products by insisting that certain environmental protection activities are undertaken in during production. These types of interventions have resulted in upstream firms
installing pollution control equipment to satisfy their buyers’ sourcing criteria.
Liability Legislation. Litigation-‐oriented approaches to environmental management require only that legislation be in place that confers relatively straightforward rights and obligations to resource users.
These approaches form a legal umbrella for court cases, which then consider the nature and extent of environmental damages on a case-‐by-‐case basis. Most of these approaches are relatively new, and have seen very limited application in developing countries (quite often because legal systems
are themselves weak in such countries). Even in industrial countries they are hampered by the analytical difficulties of establishing cause and effect, or of ascribing blame or negligence.
One significant objection to using litigation-‐oriented mechanisms is neither environmental nor economic: it is social. Because such systems assume that all have equal access to the courts, the
mechanisms often discriminate against the poor and others with limited access to legal recourse.
Lessons and Implications In each of the above cases there is usually both an incentive element as well as a control element.
Simply stated, there is no getting around the classic “carrot and stick.” Experience with these types of mechanisms around the world has shown that they have different advantages and disadvantages, and that depending on the goals of the government, some mechanisms are better than others. The
following general conclusions can be drawn from this experience:
• Systems based solely on control-‐oriented approaches impose high private costs and often are not enforceable given existing institutional capacity.
• Litigation-‐oriented approaches require the development of a strong legal system to which all
members of society have equal access.

Confidential Draft – Do Not Cite
HP Industry SEA Page 110 December 2013 (Draft 23/12/13)
• Market-‐oriented instruments allow polluters and resource users to find their own best mix
of controls or responses, and therefore result in lower private costs than other approaches.
• Local authorities and strong institutional support play an important role in the success of
market-‐oriented mechanisms.
• Hybrid systems relying partially on control-‐oriented approaches and partially on market-‐oriented instruments are frequently a practical compromise, especially where monitoring
capacity both by industry and the state is weak.
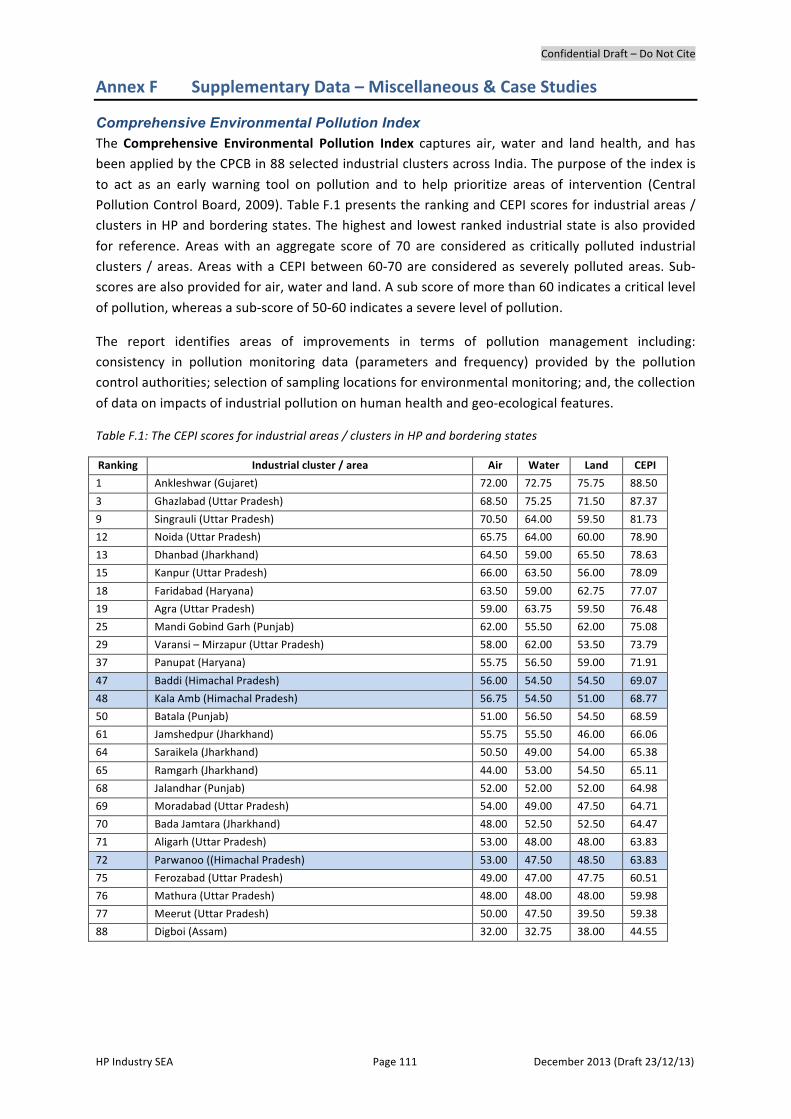
Confidential Draft – Do Not Cite
HP Industry SEA Page 111 December 2013 (Draft 23/12/13)
Annex F Supplementary Data – Miscellaneous & Case Studies
Comprehensive Environmental Pollution Index The Comprehensive Environmental Pollution Index captures air, water and land health, and has been applied by the CPCB in 88 selected industrial clusters across India. The purpose of the index is
to act as an early warning tool on pollution and to help prioritize areas of intervention (Central Pollution Control Board, 2009). Table F.1 presents the ranking and CEPI scores for industrial areas / clusters in HP and bordering states. The highest and lowest ranked industrial state is also provided
for reference. Areas with an aggregate score of 70 are considered as critically polluted industrial clusters / areas. Areas with a CEPI between 60-‐70 are considered as severely polluted areas. Sub-‐scores are also provided for air, water and land. A sub score of more than 60 indicates a critical level
of pollution, whereas a sub-‐score of 50-‐60 indicates a severe level of pollution.
The report identifies areas of improvements in terms of pollution management including: consistency in pollution monitoring data (parameters and frequency) provided by the pollution control authorities; selection of sampling locations for environmental monitoring; and, the collection
of data on impacts of industrial pollution on human health and geo-‐ecological features.
Table F.1: The CEPI scores for industrial areas / clusters in HP and bordering states
Ranking Industrial cluster / area Air Water Land CEPI
1 Ankleshwar (Gujaret) 72.00 72.75 75.75 88.50
3 Ghazlabad (Uttar Pradesh) 68.50 75.25 71.50 87.37
9 Singrauli (Uttar Pradesh) 70.50 64.00 59.50 81.73
12 Noida (Uttar Pradesh) 65.75 64.00 60.00 78.90
13 Dhanbad (Jharkhand) 64.50 59.00 65.50 78.63
15 Kanpur (Uttar Pradesh) 66.00 63.50 56.00 78.09
18 Faridabad (Haryana) 63.50 59.00 62.75 77.07
19 Agra (Uttar Pradesh) 59.00 63.75 59.50 76.48
25 Mandi Gobind Garh (Punjab) 62.00 55.50 62.00 75.08
29 Varansi – Mirzapur (Uttar Pradesh) 58.00 62.00 53.50 73.79
37 Panupat (Haryana) 55.75 56.50 59.00 71.91
47 Baddi (Himachal Pradesh) 56.00 54.50 54.50 69.07
48 Kala Amb (Himachal Pradesh) 56.75 54.50 51.00 68.77
50 Batala (Punjab) 51.00 56.50 54.50 68.59
61 Jamshedpur (Jharkhand) 55.75 55.50 46.00 66.06
64 Saraikela (Jharkhand) 50.50 49.00 54.00 65.38
65 Ramgarh (Jharkhand) 44.00 53.00 54.50 65.11
68 Jalandhar (Punjab) 52.00 52.00 52.00 64.98
69 Moradabad (Uttar Pradesh) 54.00 49.00 47.50 64.71
70 Bada Jamtara (Jharkhand) 48.00 52.50 52.50 64.47
71 Aligarh (Uttar Pradesh) 53.00 48.00 48.00 63.83
72 Parwanoo ((Himachal Pradesh) 53.00 47.50 48.50 63.83
75 Ferozabad (Uttar Pradesh) 49.00 47.00 47.75 60.51
76 Mathura (Uttar Pradesh) 48.00 48.00 48.00 59.98
77 Meerut (Uttar Pradesh) 50.00 47.50 39.50 59.38
88 Digboi (Assam) 32.00 32.75 38.00 44.55
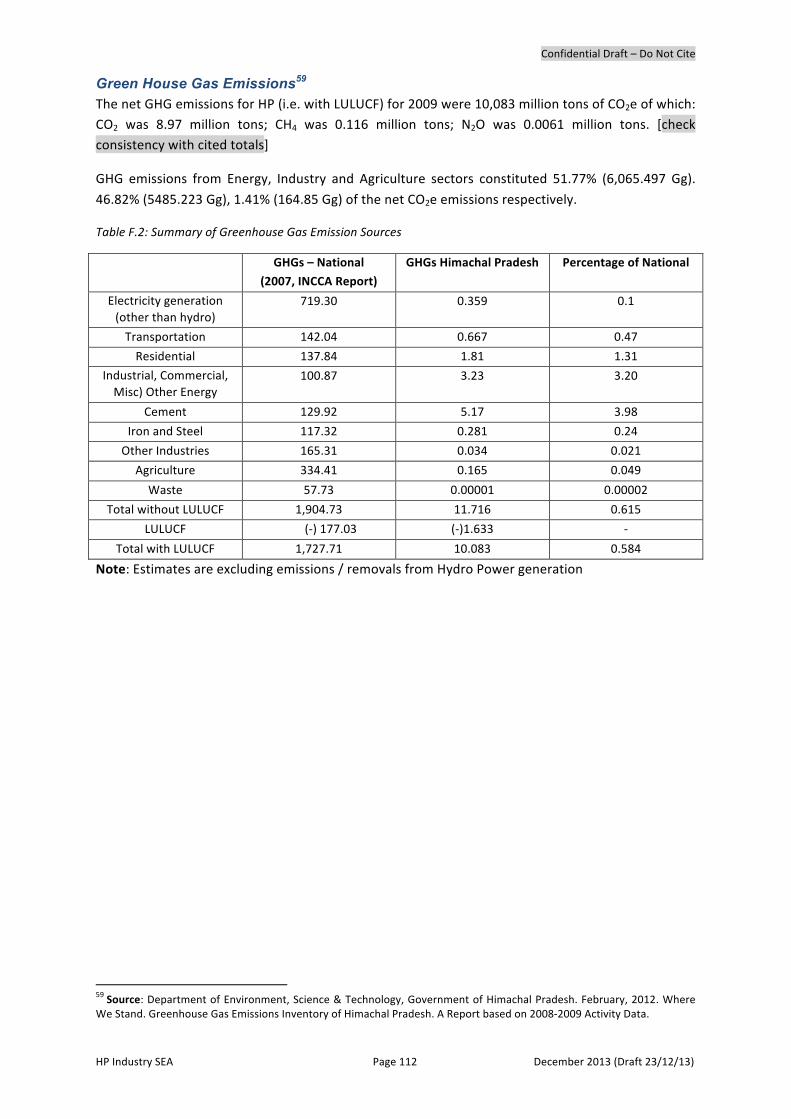
Confidential Draft – Do Not Cite
HP Industry SEA Page 112 December 2013 (Draft 23/12/13)
Green House Gas Emissions59 The net GHG emissions for HP (i.e. with LULUCF) for 2009 were 10,083 million tons of CO2e of which: CO2 was 8.97 million tons; CH4 was 0.116 million tons; N2O was 0.0061 million tons. [check consistency with cited totals]
GHG emissions from Energy, Industry and Agriculture sectors constituted 51.77% (6,065.497 Gg).
46.82% (5485.223 Gg), 1.41% (164.85 Gg) of the net CO2e emissions respectively.
Table F.2: Summary of Greenhouse Gas Emission Sources
GHGs – National
(2007, INCCA Report)
GHGs Himachal Pradesh Percentage of National
Electricity generation (other than hydro)
719.30 0.359 0.1
Transportation 142.04 0.667 0.47
Residential 137.84 1.81 1.31
Industrial, Commercial, Misc) Other Energy
100.87 3.23 3.20
Cement 129.92 5.17 3.98
Iron and Steel 117.32 0.281 0.24
Other Industries 165.31 0.034 0.021
Agriculture 334.41 0.165 0.049
Waste 57.73 0.00001 0.00002
Total without LULUCF 1,904.73 11.716 0.615
LULUCF (-‐) 177.03 (-‐)1.633 -‐
Total with LULUCF 1,727.71 10.083 0.584
Note: Estimates are excluding emissions / removals from Hydro Power generation
59 Source: Department of Environment, Science & Technology, Government of Himachal Pradesh. February, 2012. Where We Stand. Greenhouse Gas Emissions Inventory of Himachal Pradesh. A Report based on 2008-‐2009 Activity Data.
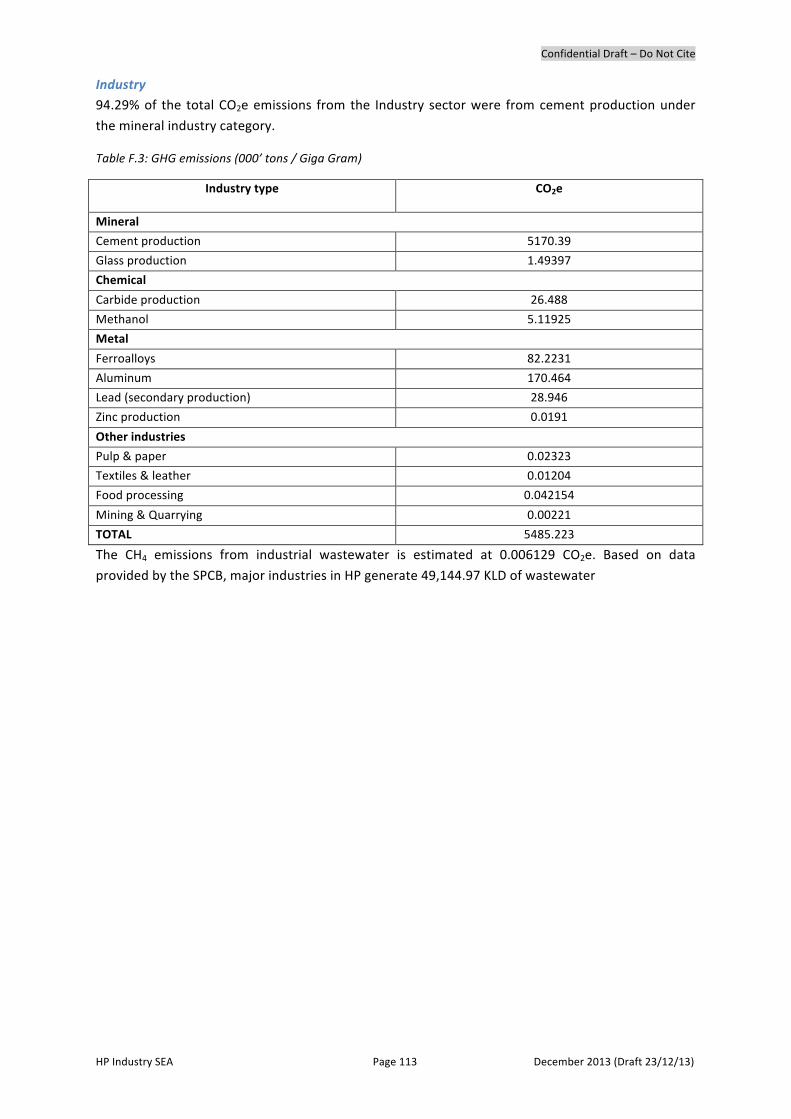
Confidential Draft – Do Not Cite
HP Industry SEA Page 113 December 2013 (Draft 23/12/13)
Industry 94.29% of the total CO2e emissions from the Industry sector were from cement production under
the mineral industry category.
Table F.3: GHG emissions (000’ tons / Giga Gram)
Industry type CO2e
Mineral
Cement production 5170.39
Glass production 1.49397
Chemical
Carbide production 26.488
Methanol 5.11925
Metal
Ferroalloys 82.2231
Aluminum 170.464
Lead (secondary production) 28.946
Zinc production 0.0191
Other industries
Pulp & paper 0.02323
Textiles & leather 0.01204
Food processing 0.042154
Mining & Quarrying 0.00221
TOTAL 5485.223
The CH4 emissions from industrial wastewater is estimated at 0.006129 CO2e. Based on data
provided by the SPCB, major industries in HP generate 49,144.97 KLD of wastewater
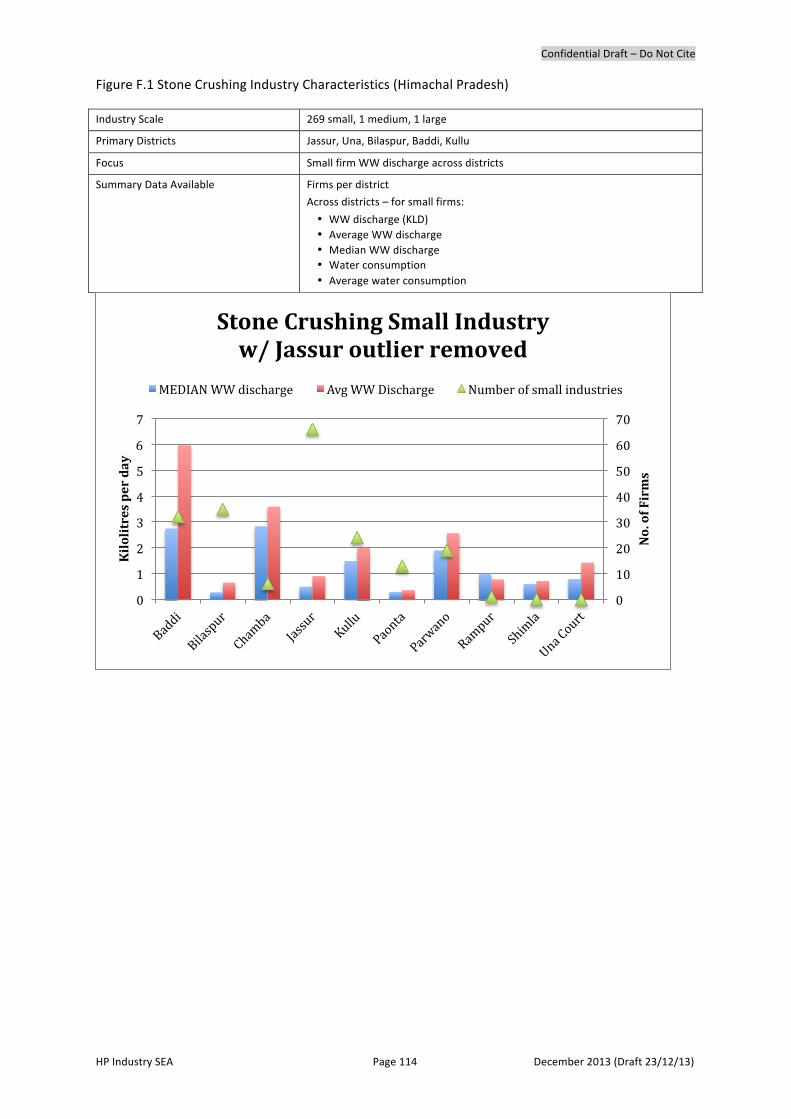
Confidential Draft – Do Not Cite
HP Industry SEA Page 114 December 2013 (Draft 23/12/13)
Figure F.1 Stone Crushing Industry Characteristics (Himachal Pradesh)
Industry Scale 269 small, 1 medium, 1 large
Primary Districts Jassur, Una, Bilaspur, Baddi, Kullu
Focus Small firm WW discharge across districts
Summary Data Available
Firms per district
Across districts – for small firms:
• WW discharge (KLD) • Average WW discharge • Median WW discharge • Water consumption • Average water consumption
0
10
20
30
40
50
60
70
0
1
2
3
4
5
6
7
No. of Firms
Kilolitres per day
Stone Crushing Small Industry w/ Jassur outlier removed
MEDIAN WW discharge Avg WW Discharge Number of small industries
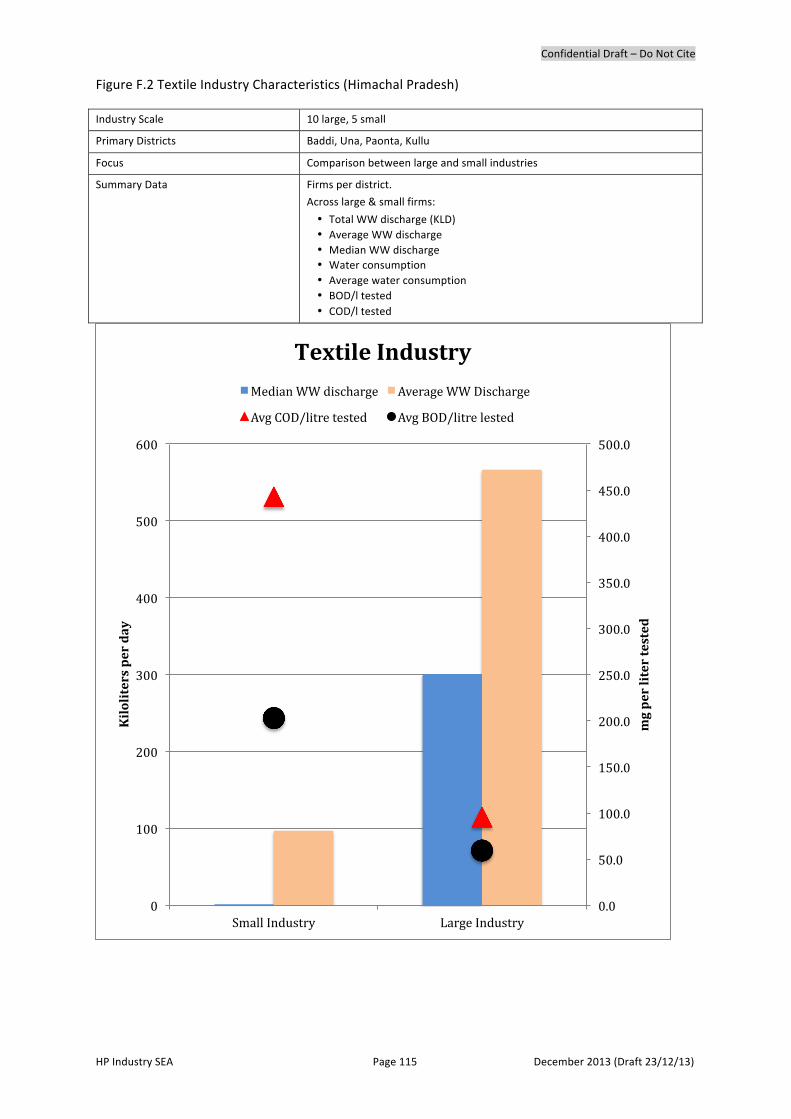
Confidential Draft – Do Not Cite
HP Industry SEA Page 115 December 2013 (Draft 23/12/13)
Figure F.2 Textile Industry Characteristics (Himachal Pradesh)
Industry Scale 10 large, 5 small
Primary Districts Baddi, Una, Paonta, Kullu
Focus Comparison between large and small industries
Summary Data Firms per district.
Across large & small firms:
• Total WW discharge (KLD) • Average WW discharge • Median WW discharge • Water consumption • Average water consumption • BOD/l tested • COD/l tested
0.0
50.0
100.0
150.0
200.0
250.0
300.0
350.0
400.0
450.0
500.0
0
100
200
300
400
500
600
Small Industry Large Industry
mg per liter tested
Kiloliters per day
Textile Industry
Median WW discharge Average WW Discharge
Avg COD/litre tested Avg BOD/litre lested

Confidential Draft – Do Not Cite
HP Industry SEA Page 116 December 2013 (Draft 23/12/13)
Figure F.3 Food Processing Industry Characteristics (Himachal Pradesh)
Industry Scale 60 small, 1 medium, 3 large
Primary Districts Una, Baddi, Bilaspur, Parwano, Jassur
Focus Small industries
Summary Data Industries (small, medium, large) per district
Across districts – for small firms:
• WW discharge (KLD) • Average WW discharge • Median WW discharge • Water consumption • Average water consumption • BOD/l tested • COD/l tested
0
2
4
6
8
10
12
14
16
0
20
40
60
80
100
120
140
160
180
Number of SMALL Food Processing Industries & WW
Total Discharge/Day
WW discharge KL/D
Number of small industries
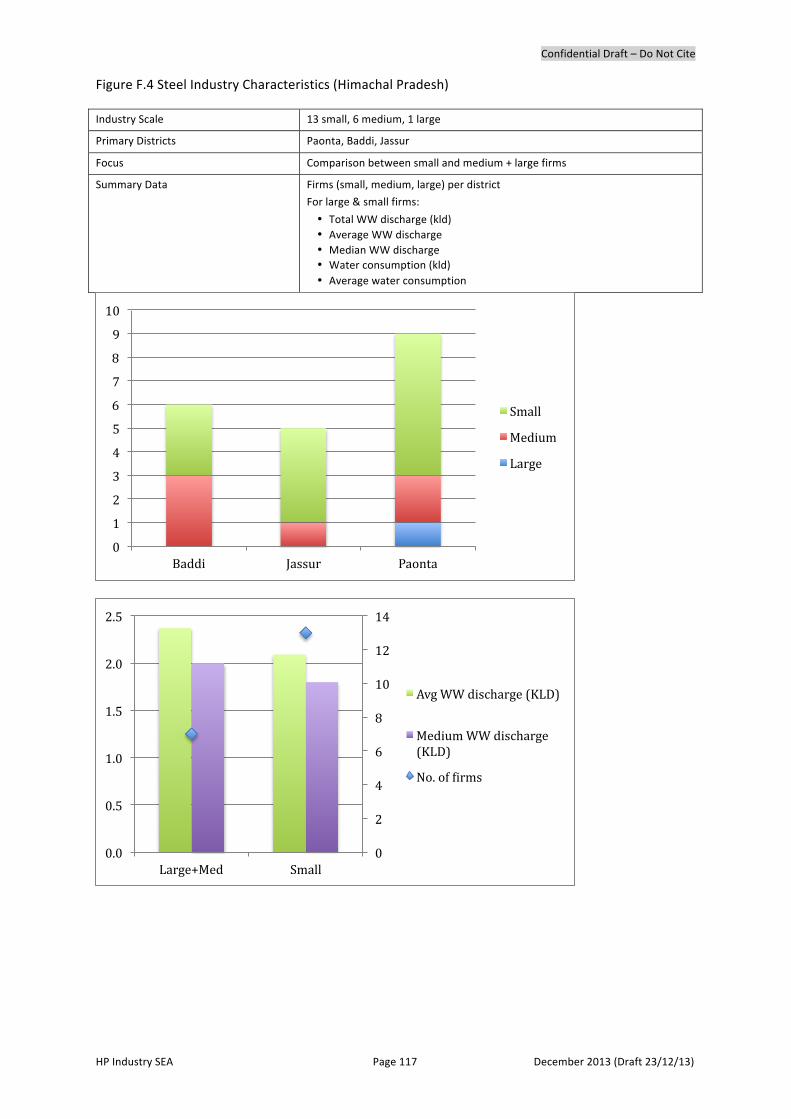
Confidential Draft – Do Not Cite
HP Industry SEA Page 117 December 2013 (Draft 23/12/13)
Figure F.4 Steel Industry Characteristics (Himachal Pradesh)
Industry Scale 13 small, 6 medium, 1 large
Primary Districts Paonta, Baddi, Jassur
Focus Comparison between small and medium + large firms
Summary Data Firms (small, medium, large) per district
For large & small firms:
• Total WW discharge (kld) • Average WW discharge • Median WW discharge • Water consumption (kld) • Average water consumption
0
1
2
3
4
5
6
7
8
9
10
Baddi Jassur Paonta
Small
Medium
Large
0
2
4
6
8
10
12
14
0.0
0.5
1.0
1.5
2.0
2.5
Large+Med Small
Avg WW discharge (KLD)
Medium WW discharge (KLD)
No. of Sirms

Confidential Draft – Do Not Cite
HP Industry SEA Page 118 December 2013 (Draft 23/12/13)
Figure F.5 Pharmaceutical Industry Characteristics (Himachal Pradesh)
Industry Scale 189 small, 28 medium, 37 large
Primary Districts For small: Parwano, Paonta, Baddi For large & medium: Baddi, Paonta, Parwano
Focus Comparison across districts of WW discharge Comparison across scales of WW discharge
Summary Data Firms (small, medium, large) per district For large & small firms: • Total WW discharge (KLD) • Average WW discharge • Median WW discharge • Water consumption • Average water consumption
0
5
10
15
20
25
Small Medium Large
Median WW Discharge across Districts according to Firm Size
Baddi Paonta Parwano Una

Confidential Draft – Do Not Cite
HP Industry SEA Page 119 December 2013 (Draft 23/12/13)
Figure F.6 Cement Industry Characteristics (Himachal Pradesh)
Industry Scale 13 large, 10 small, 4 medium
Primary Districts Bilapur, Parwano, Baddi for large; Paonta, Jassur for small; medium Baddi, Paonta, Parwano
0 1 2 3 4 5 6 7 8
Baddi Bilapur Jassur Paonta Parwanoo Una
Cement Industy
Large Medium Small
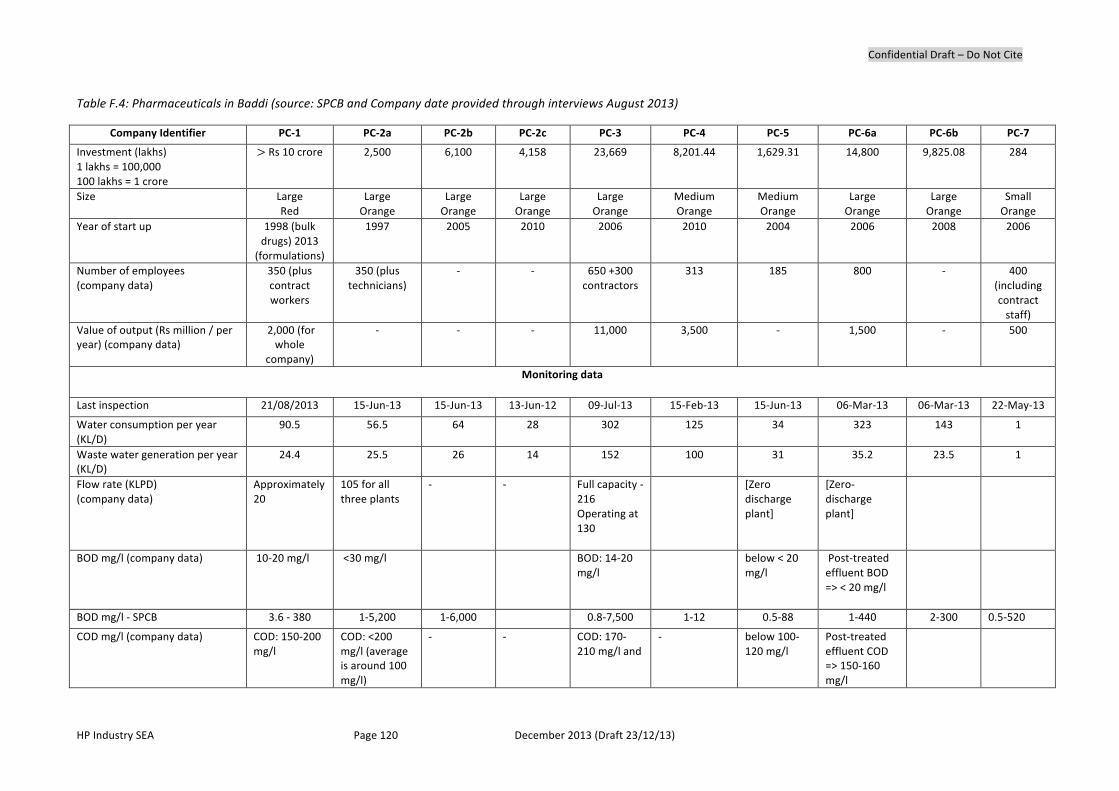
Confidential Draft – Do Not Cite
HP Industry SEA Page 120 December 2013 (Draft 23/12/13)
Table F.4: Pharmaceuticals in Baddi (source: SPCB and Company date provided through interviews August 2013)
Company Identifier PC-‐1 PC-‐2a PC-‐2b PC-‐2c PC-‐3 PC-‐4 PC-‐5 PC-‐6a PC-‐6b PC-‐7
Investment (lakhs) 1 lakhs = 100,000 100 lakhs = 1 crore
> Rs 10 crore
2,500 6,100 4,158 23,669 8,201.44 1,629.31 14,800 9,825.08 284
Size Large Red
Large Orange
Large Orange
Large Orange
Large Orange
Medium Orange
Medium Orange
Large Orange
Large Orange
Small Orange
Year of start up 1998 (bulk drugs) 2013
(formulations)
1997 2005 2010 2006 2010 2004 2006 2008 2006
Number of employees (company data)
350 (plus contract workers
350 (plus technicians)
-‐ -‐ 650 +300 contractors
313 185 800 -‐ 400 (including contract staff)
Value of output (Rs million / per year) (company data)
2,000 (for whole
company)
-‐ -‐ -‐ 11,000 3,500 -‐ 1,500 -‐ 500
Monitoring data
Last inspection 21/08/2013 15-‐Jun-‐13 15-‐Jun-‐13 13-‐Jun-‐12 09-‐Jul-‐13 15-‐Feb-‐13 15-‐Jun-‐13 06-‐Mar-‐13 06-‐Mar-‐13 22-‐May-‐13
Water consumption per year (KL/D)
90.5 56.5 64 28 302 125 34 323 143 1
Waste water generation per year (KL/D)
24.4 25.5 26 14 152 100 31 35.2 23.5 1
Flow rate (KLPD) (company data)
Approximately 20
105 for all three plants
-‐ -‐ Full capacity -‐ 216 Operating at 130
[Zero discharge plant]
[Zero-‐discharge plant]
BOD mg/l (company data) 10-‐20 mg/l <30 mg/l
BOD: 14-‐20 mg/l
below < 20 mg/l
Post-‐treated effluent BOD => < 20 mg/l
BOD mg/l -‐ SPCB 3.6 -‐ 380 1-‐5,200 1-‐6,000 0.8-‐7,500 1-‐12 0.5-‐88 1-‐440 2-‐300 0.5-‐520
COD mg/l (company data) COD: 150-‐200 mg/l
COD: <200 mg/l (average is around 100 mg/l)
-‐ -‐ COD: 170-‐210 mg/l and
-‐ below 100-‐120 mg/l
Post-‐treated effluent COD => 150-‐160 mg/l
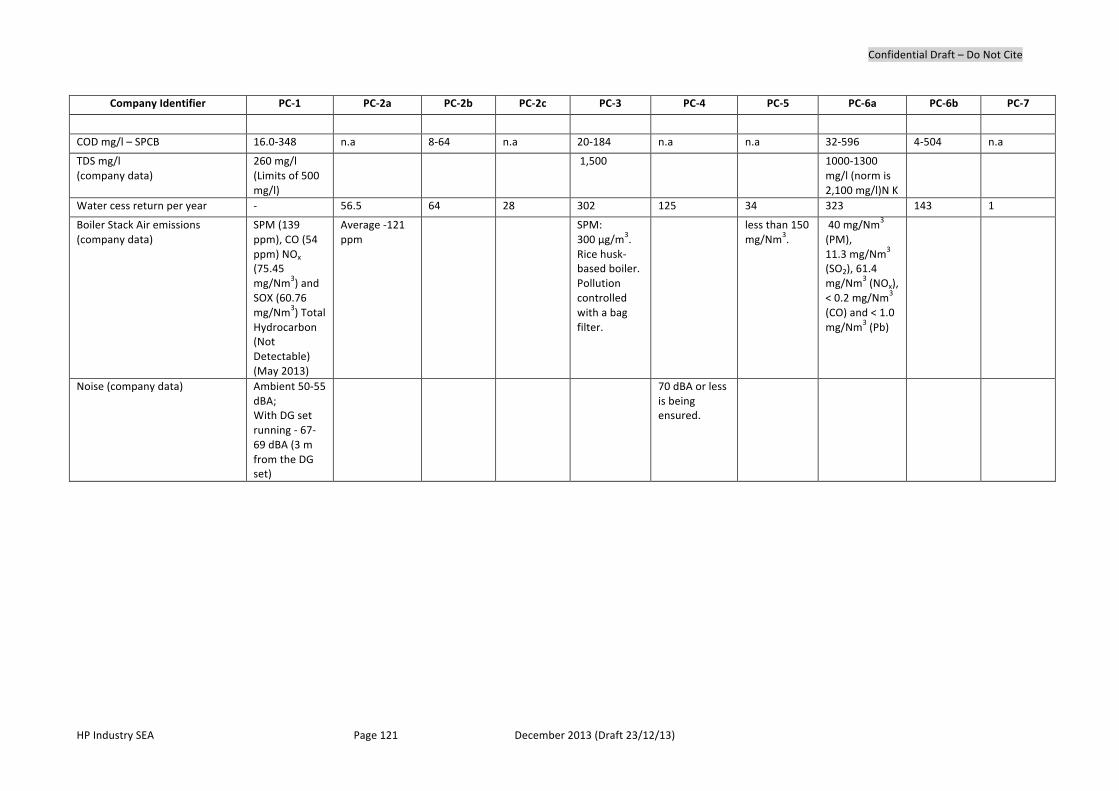
Confidential Draft – Do Not Cite
HP Industry SEA Page 121 December 2013 (Draft 23/12/13)
Company Identifier PC-‐1 PC-‐2a PC-‐2b PC-‐2c PC-‐3 PC-‐4 PC-‐5 PC-‐6a PC-‐6b PC-‐7
COD mg/l – SPCB 16.0-‐348 n.a 8-‐64 n.a 20-‐184 n.a n.a 32-‐596 4-‐504 n.a
TDS mg/l (company data)
260 mg/l (Limits of 500 mg/l)
1,500 1000-‐1300 mg/l (norm is 2,100 mg/l)N K
Water cess return per year -‐ 56.5 64 28 302 125 34 323 143 1
Boiler Stack Air emissions (company data)
SPM (139 ppm), CO (54 ppm) NOx (75.45 mg/Nm3) and SOX (60.76 mg/Nm3) Total Hydrocarbon (Not Detectable) (May 2013)
Average -‐121 ppm
SPM: 300 μg/m3. Rice husk-‐based boiler. Pollution controlled with a bag filter.
less than 150 mg/Nm3.
40 mg/Nm3 (PM), 11.3 mg/Nm3 (SO2), 61.4 mg/Nm3 (NOx), < 0.2 mg/Nm3 (CO) and < 1.0 mg/Nm3 (Pb)
Noise (company data) Ambient 50-‐55 dBA; With DG set running -‐ 67-‐69 dBA (3 m from the DG set)
70 dBA or less is being ensured.

Confidential Draft – Do Not Cite
HP Industry SEA Page 122 December 2013 (Draft 23/12/13)
Table F.5: Pharmaceuticals in Baddi – Pollution Control Equipment & Costs – based on Company Data
Company Identifier PC-‐1 PC-‐2 PC-‐3 PC-‐4 PC-‐5 PC-‐6 PC-‐7
ETP ETP with Multiple Effective Evaporator. Effluent is distilled under vacuum. Distillate is treated biologically through Activated Sludge process, which is followed by filtration and oxidation. Residue is incinerated.
Oil-‐water separator, equalization, secondary treatment (biological). Treated water used in gardening. ETP sludge sent to TSDF. As there are multiple plants, there are 2 ETPs with separate processes.
ETP combined with STP. Includes primary treatment (flocculation, tube settler, aeration), secondary treatment (settlement of bacteria pond) and tertiary (Sand filter and Carbon filter)
ETP & RO: Equalization tank, anaerobic and filter (sand & carbon) and aeration. This is fed to a combined storage tank. After that, ultra-‐filtration and Reverse Osmosis is done. The treated water is reused in the cooling tower. Capacity 100KLPD, 30 KLPD utilized.
(i) Primary (Flocculator, Flash Mixer and Primary Clarifier); (ii) Secondary (Aeration & Clarifier); (iii) Tertiary (Activated Carbon and Sand Filter).
Zero discharge plant. ETP capacity is being increased from 35 to 85 KLPD.
ETP-‐with-‐STP including (i) Primary (Aeration – pH adjusted), (ii) Secondary (Bioreactor & secondary clarifier) and (iii) Tertiary (Treated Tank and Sand filters).
Zero discharge unit
Primary, Secondary and Tertiary treatment in place. There is also a fish tank post-‐treatment to ensure effluent quality. Raw water is treated using Reverse Osmosis & Demineralization in order to bring the water quality to a standard that can be used in the manufacture of pharmaceuticals]
Discharge Mode (source: SPCB)
Zero discharge Irrigation Irrigation Recycling Irrigation Irrigation Zero discharge
Air Pollution Control Equipment
Wet scrubbers for the boiler and DG set.
Scrubbers in the boilers. There are 4 boilers ( 1.5, 2, 0.85t x 2) 2 running, 2 standby serving 4 boilers. Runs on High Speed Diesel (HSD)
Pre-‐heater for boiler & multi-‐cyclone and bag filter. Stack chimney height -‐ 30m.
Boilers have scrubbers & dust collectors, Chimney height 30m – 2 boilers running on HSD
Wet scrubbers for both boilers and DG set. One in operation and other on stand-‐by. Chimney stack is 20m
Boiler and DG Set use standard water scrubbing systems. The fuel used is HSD
Boilers and DG Sets have all control systems in place as required by the PCB.
[Solid] Waste management
No treatment or landfill capacity. Being sent to the TSDF. This includes ash from the incinerator, and used carbon and oil.
ETP Sludge is about 3.3 tons per annum and costs Rs 1,500 per ton to dispose.
Hazardous waste (i) ETP sludge of about 100-‐150 kg per month (ii) 2/3 tons per year of off-‐specs products. Scrap is disposed as municipal waste
20-‐25 tons per year of solid waste (ETP sludge) sent to the Shivalik Solid Waste Management Limited. No off-‐specs products are generated
Hazardous Waste and Biomedical waste are sent to Nalagarh (Shivalik) and Shimla (Alliance Envirocare) respectively
Date or year installed APC in 1998 ETP: 1997 and 2004 2006 2010 2004 -‐ 2006
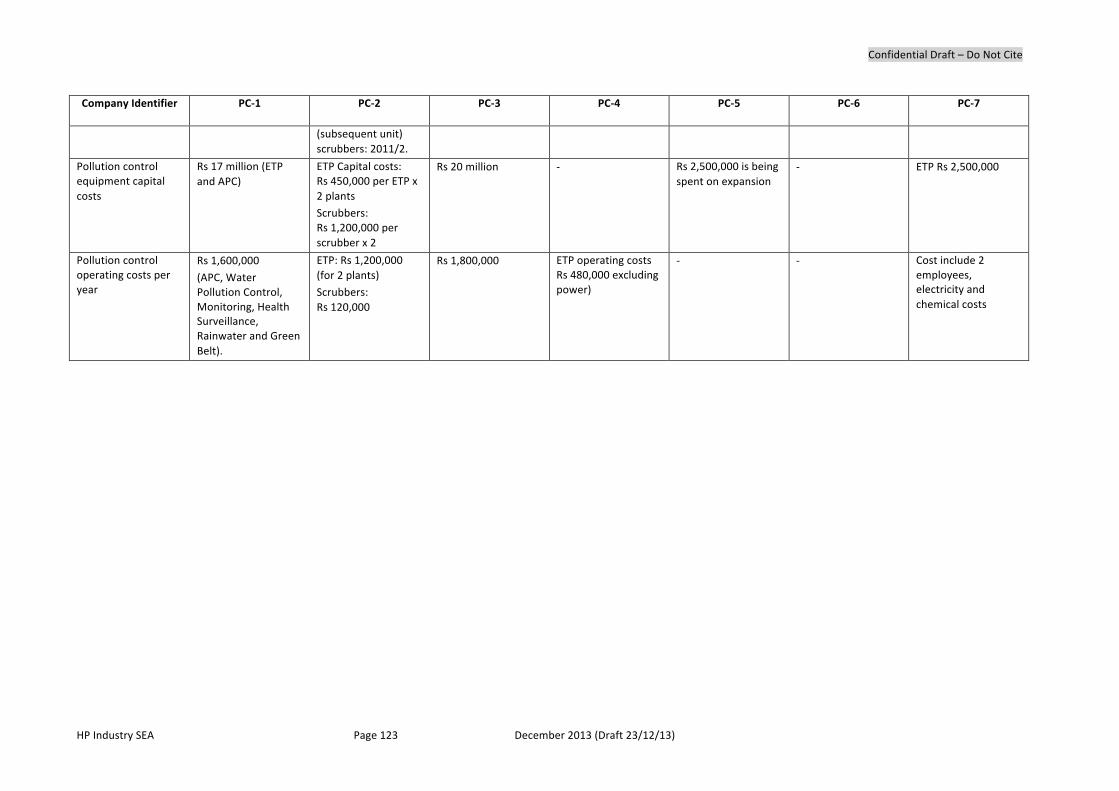
Confidential Draft – Do Not Cite
HP Industry SEA Page 123 December 2013 (Draft 23/12/13)
Company Identifier PC-‐1 PC-‐2 PC-‐3 PC-‐4 PC-‐5 PC-‐6 PC-‐7
(subsequent unit) scrubbers: 2011/2.
Pollution control equipment capital costs
Rs 17 million (ETP and APC)
ETP Capital costs: Rs 450,000 per ETP x 2 plants Scrubbers: Rs 1,200,000 per scrubber x 2
Rs 20 million -‐ Rs 2,500,000 is being spent on expansion
-‐ ETP Rs 2,500,000
Pollution control operating costs per year
Rs 1,600,000 (APC, Water Pollution Control, Monitoring, Health Surveillance, Rainwater and Green Belt).
ETP: Rs 1,200,000 (for 2 plants) Scrubbers: Rs 120,000
Rs 1,800,000 ETP operating costs Rs 480,000 excluding power)
-‐ -‐ Cost include 2 employees, electricity and chemical costs

Confidential Draft – Do Not Cite
HP Industry SEA Page 124 December 2013 (Draft 23/12/13)
Table F.6: Pollutants Load of Major Pharmaceutical Units (based on projects DPRs)
Industry Identifier Flow (Q) KLD
COD (C1) Mg/L
BOD (C2) Mg/L
COD/BOD Kg COD / day (Q*C1)
Kg BOD / day (Q*C2)
TDS Kg TDS / day
PI-‐1 175 646 (2,117)
230 854
2.8 113 (370)
40 (149)
880 (1,450)
154 (254)
PI-‐2 175 2,800 (2,128)
500 746
5.6 490 (372)
88 (131)
1,055 (1,400)
185 (245)
PI-‐3 82 1560 (2,106)
560 460
2.8 128 (173)
46 (33)
3,355 (1,325)
275 (109)
PI-‐4 200 520 (450)
125 105
4.2 104 (90)
25 (21)
850 (450)
170 (90)
PI-‐5 50 720 300 2.4 36 15 880 44
PI-‐6 112 500 190 2.6 56 21 780 87
PI-‐7 230 440 110 4.0 101 25 400 92
PI-‐8 100 1,900 600 3.2 190 60 1,270 127
PI-‐9 / PC-‐4 155 1400 (1,165)
600 (674)
2.3 217 (180)
93 (104)
1,980 (10,444)
307 (162)
PI-‐10 / PC-‐6a 115 240 (450)
130 1.8 28 (52)
15 350 (950)
40 (109)
PI-‐11 / PC-‐6b 105 360 (500)
190 1.9 38 (53)
20 455 (850)
48 (89)
PI-‐12 / PC-‐5 43 324 (370)
280 2.3 14 (16)
12 500 (1,100)
22 (47)
PI-‐13 128 1000 (1671)
200 443
5.0 128 (214)
26 (57)
2,910 (1,800)
372 (230)
PI-‐14 63 340 75 4.5 21 5 1,115 70
PI-‐15 35 22,000 (3,500)
10,000 2,000
2.2 770 (122)
350 (70)
19,635 (200)
687 (7)
PI-‐16 150 30,000 (20,000)
15,000 (120)
2.0 4,500 (3,000)
2,250 (18)
3,670 (22,000)
550 (3,300)
PI-‐17 47 480 (2,000)
62 (450)
7.7 23 (94)
3 (21)
535 25
PI-‐18 40 1,300 (1,000)
500 (800)
2.6 52 (400)
20 (32)
830 33
PI-‐19 87 1,460 (2,000)
200 (720)
7.3 127 (174)
17 (63)
1280 (1,700)
111 (148)
PI-‐20 / PC-‐1 125 3,024 (25,000)
940 (4,000)
3.2 378 118 15,800 (5,000)
1,975
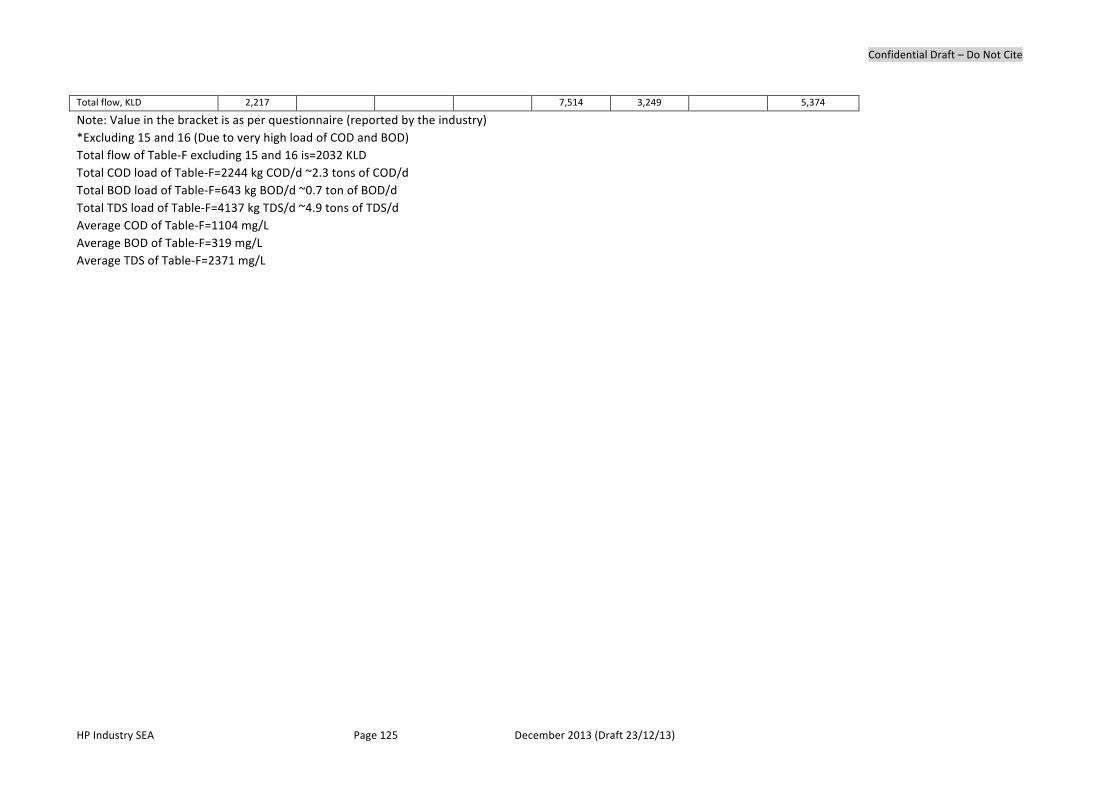
Confidential Draft – Do Not Cite
HP Industry SEA Page 125 December 2013 (Draft 23/12/13)
Total flow, KLD 2,217 7,514 3,249 5,374
Note: Value in the bracket is as per questionnaire (reported by the industry) *Excluding 15 and 16 (Due to very high load of COD and BOD) Total flow of Table-‐F excluding 15 and 16 is=2032 KLD Total COD load of Table-‐F=2244 kg COD/d ~2.3 tons of COD/d Total BOD load of Table-‐F=643 kg BOD/d ~0.7 ton of BOD/d Total TDS load of Table-‐F=4137 kg TDS/d ~4.9 tons of TDS/d Average COD of Table-‐F=1104 mg/L Average BOD of Table-‐F=319 mg/L Average TDS of Table-‐F=2371 mg/L
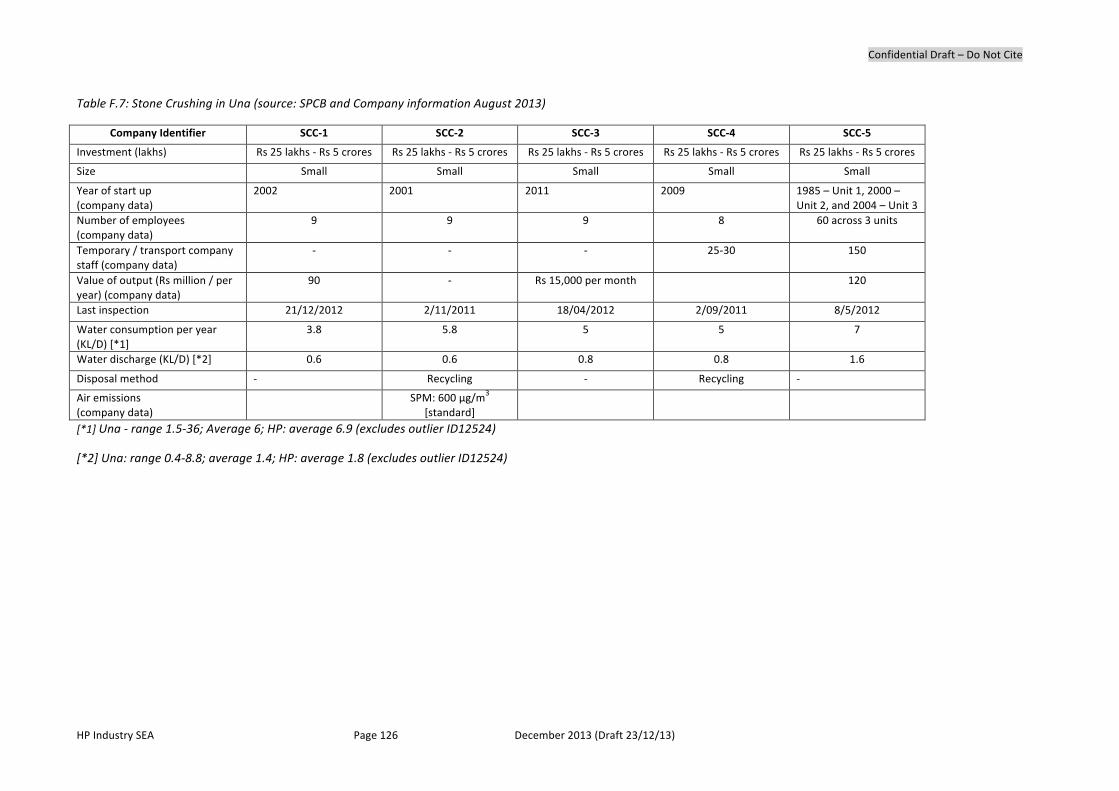
Confidential Draft – Do Not Cite
HP Industry SEA Page 126 December 2013 (Draft 23/12/13)
Table F.7: Stone Crushing in Una (source: SPCB and Company information August 2013)
Company Identifier SCC-‐1 SCC-‐2 SCC-‐3 SCC-‐4 SCC-‐5
Investment (lakhs) Rs 25 lakhs -‐ Rs 5 crores Rs 25 lakhs -‐ Rs 5 crores Rs 25 lakhs -‐ Rs 5 crores Rs 25 lakhs -‐ Rs 5 crores Rs 25 lakhs -‐ Rs 5 crores
Size Small Small Small Small Small
Year of start up (company data)
2002 2001 2011 2009 1985 – Unit 1, 2000 – Unit 2, and 2004 – Unit 3
Number of employees (company data)
9 9 9 8 60 across 3 units
Temporary / transport company staff (company data)
-‐ -‐ -‐ 25-‐30 150
Value of output (Rs million / per year) (company data)
90 -‐ Rs 15,000 per month 120
Last inspection 21/12/2012 2/11/2011 18/04/2012 2/09/2011 8/5/2012
Water consumption per year (KL/D) [*1]
3.8 5.8 5 5 7
Water discharge (KL/D) [*2] 0.6 0.6 0.8 0.8 1.6
Disposal method -‐ Recycling -‐ Recycling -‐
Air emissions (company data)
SPM: 600 μg/m3 [standard]
[*1] Una -‐ range 1.5-‐36; Average 6; HP: average 6.9 (excludes outlier ID12524)
[*2] Una: range 0.4-‐8.8; average 1.4; HP: average 1.8 (excludes outlier ID12524)
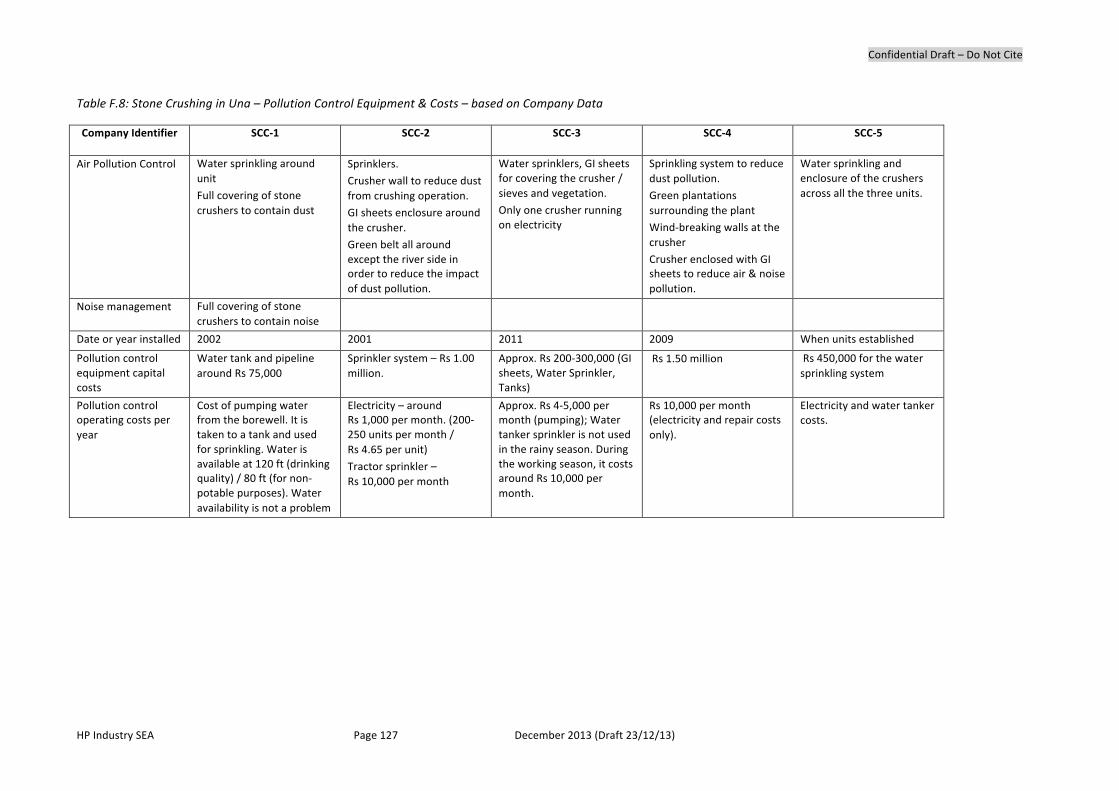
Confidential Draft – Do Not Cite
HP Industry SEA Page 127 December 2013 (Draft 23/12/13)
Table F.8: Stone Crushing in Una – Pollution Control Equipment & Costs – based on Company Data
Company Identifier SCC-‐1 SCC-‐2 SCC-‐3 SCC-‐4 SCC-‐5
Air Pollution Control Water sprinkling around unit Full covering of stone crushers to contain dust
Sprinklers. Crusher wall to reduce dust from crushing operation. GI sheets enclosure around the crusher. Green belt all around except the river side in order to reduce the impact of dust pollution.
Water sprinklers, GI sheets for covering the crusher / sieves and vegetation. Only one crusher running on electricity
Sprinkling system to reduce dust pollution. Green plantations surrounding the plant Wind-‐breaking walls at the crusher Crusher enclosed with GI sheets to reduce air & noise pollution.
Water sprinkling and enclosure of the crushers across all the three units.
Noise management Full covering of stone crushers to contain noise
Date or year installed 2002 2001 2011 2009 When units established
Pollution control equipment capital costs
Water tank and pipeline around Rs 75,000
Sprinkler system – Rs 1.00 million.
Approx. Rs 200-‐300,000 (GI sheets, Water Sprinkler, Tanks)
Rs 1.50 million Rs 450,000 for the water sprinkling system
Pollution control operating costs per year
Cost of pumping water from the borewell. It is taken to a tank and used for sprinkling. Water is available at 120 ft (drinking quality) / 80 ft (for non-‐potable purposes). Water availability is not a problem
Electricity – around Rs 1,000 per month. (200-‐250 units per month / Rs 4.65 per unit) Tractor sprinkler – Rs 10,000 per month
Approx. Rs 4-‐5,000 per month (pumping); Water tanker sprinkler is not used in the rainy season. During the working season, it costs around Rs 10,000 per month.
Rs 10,000 per month (electricity and repair costs only).
Electricity and water tanker costs.

Confidential Draft – Do Not Cite
HP Industry SEA Page 128 December 2013 (Draft 23/12/13)
Table F.9: Food Processing in Una (interviews August 2013) [check if Jupiter still missing from dataset; probably OK … Jupiter is FP–2]
Company Identifier FPC-‐1 FPC-‐2 FPC-‐3 FPC-‐4 FPC-‐5 FPC-‐6
Investment (lakhs) Rs 25 lakhs -‐ Rs 5 crores
Less than Rs 25 lakhs Over Rs 10 crores Over Rs 10 crores Rs 600million (company data)
Rs 25 lakhs – Rs 5 crores
Size / SPCB ratings Small / Green 1 Micro Large /Green Large / Green 2 Large / Orange Small / Green
Year of start up (company data)
1994 2005 2012 2005 2007 2010
Number of employees (company data)
230
(no contractors)
12
(28 in the season)
404
(plus 250 contractors)
800
(plus 400 contractors)
200
(plus 50 contractors)
30
Value of output (Rs million / per year) (company data)
160 12 2,700 180 1,000
Last inspection 05/05/2010 04/10/2013 18/09/2013 06/09/2013 06/09/2013
Water consumption per year (KLD)
0.5 800 210 1,500 8
Waste water generation per year (KLD)
0.4 420 190 1.200 6.5
Flow rate (KLPD) (company data)
300,000 liters day Zero discharge plant 110 KL Estimated at 1,000 liters / day
BOD mg/l (company &/or SPCB) Norm: 30 mg
25-‐28 mg/l (company) 6.0 (SPCB: 21/09/2013)
22.0 (SPCB: 20/09/2013)
15.0 (SPCB:12/09/2013)
360 (company) 960 (SPCB:12/09/2013)
COD mg/l (company &/or SPCB data ) Norm: 250 mg/l)]
180-‐200 (company) 72.0 (SPCB: 07/10/2013)
108.0 (SPCB: 20/09/2013)
64.0 (SPCB:12/09/2013)
656 (company) 1,424 (SPCB:12/09/2013)
Ph 7.62 (SPCB: 07/10/2013)
8.24 (SPCB: 20/09/2013)
7.81 (SPCB:12/09/2013)
7.57 (SPCB:12/09/2013)
Suspended solids mg/l 30 (21/09/2013) 82.0 (SPCB: 20/09/2013)
21.0 (SPCB:12/09/2013)
157.0 (SPCB:12/09/2013)
Air emissions RSPM 648.18 g/m3
Notes: 1/ Large under GoI’s Food Safety Regulations & Small under the Factories Act. 2 / Large-‐medium by Department of Industry]
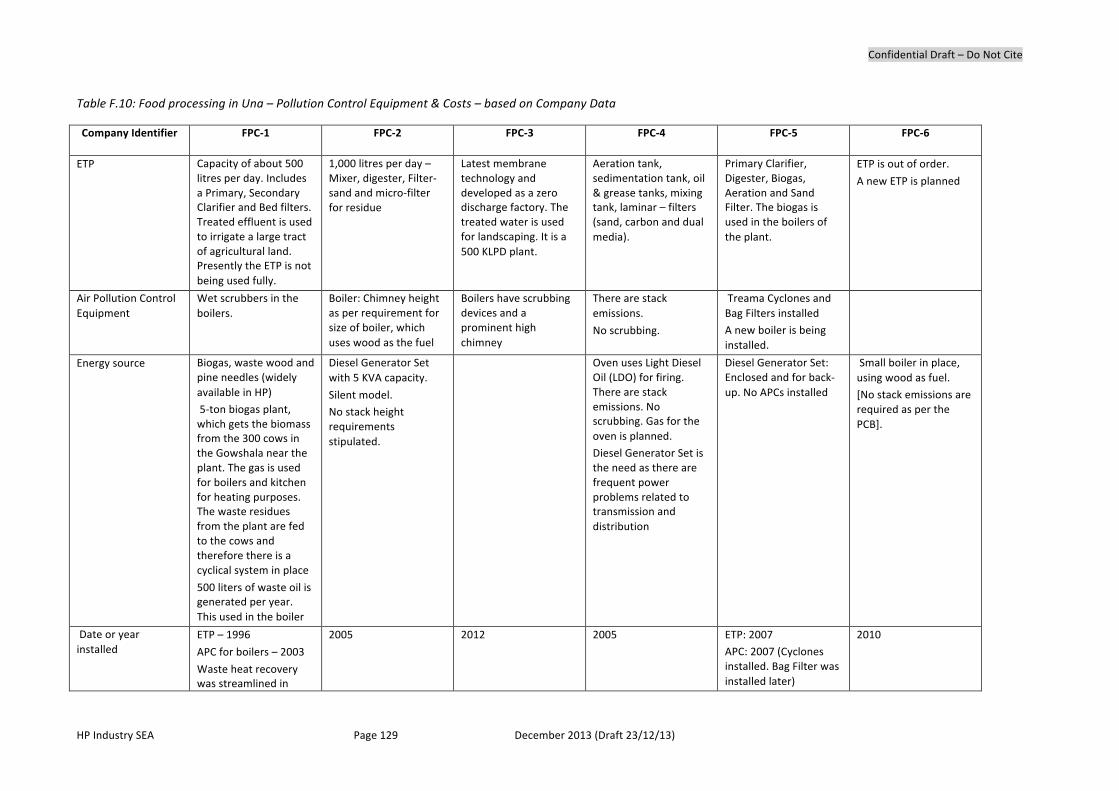
Confidential Draft – Do Not Cite
HP Industry SEA Page 129 December 2013 (Draft 23/12/13)
Table F.10: Food processing in Una – Pollution Control Equipment & Costs – based on Company Data
Company Identifier FPC-‐1 FPC-‐2 FPC-‐3 FPC-‐4 FPC-‐5 FPC-‐6
ETP Capacity of about 500 litres per day. Includes a Primary, Secondary Clarifier and Bed filters. Treated effluent is used to irrigate a large tract of agricultural land. Presently the ETP is not being used fully.
1,000 litres per day – Mixer, digester, Filter-‐sand and micro-‐filter for residue
Latest membrane technology and developed as a zero discharge factory. The treated water is used for landscaping. It is a 500 KLPD plant.
Aeration tank, sedimentation tank, oil & grease tanks, mixing tank, laminar – filters (sand, carbon and dual media).
Primary Clarifier, Digester, Biogas, Aeration and Sand Filter. The biogas is used in the boilers of the plant.
ETP is out of order.
A new ETP is planned
Air Pollution Control Equipment
Wet scrubbers in the boilers.
Boiler: Chimney height as per requirement for size of boiler, which uses wood as the fuel
Boilers have scrubbing devices and a prominent high chimney
There are stack emissions.
No scrubbing.
Treama Cyclones and Bag Filters installed A new boiler is being installed.
Energy source Biogas, waste wood and pine needles (widely available in HP) 5-‐ton biogas plant, which gets the biomass from the 300 cows in the Gowshala near the plant. The gas is used for boilers and kitchen for heating purposes. The waste residues from the plant are fed to the cows and therefore there is a cyclical system in place
500 liters of waste oil is generated per year. This used in the boiler
Diesel Generator Set with 5 KVA capacity.
Silent model. No stack height requirements stipulated.
Oven uses Light Diesel Oil (LDO) for firing. There are stack emissions. No scrubbing. Gas for the oven is planned. Diesel Generator Set is the need as there are frequent power problems related to transmission and distribution
Diesel Generator Set: Enclosed and for back-‐up. No APCs installed
Small boiler in place, using wood as fuel. [No stack emissions are required as per the PCB].
Date or year installed
ETP – 1996
APC for boilers – 2003
Waste heat recovery was streamlined in
2005 2012 2005 ETP: 2007 APC: 2007 (Cyclones installed. Bag Filter was installed later)
2010
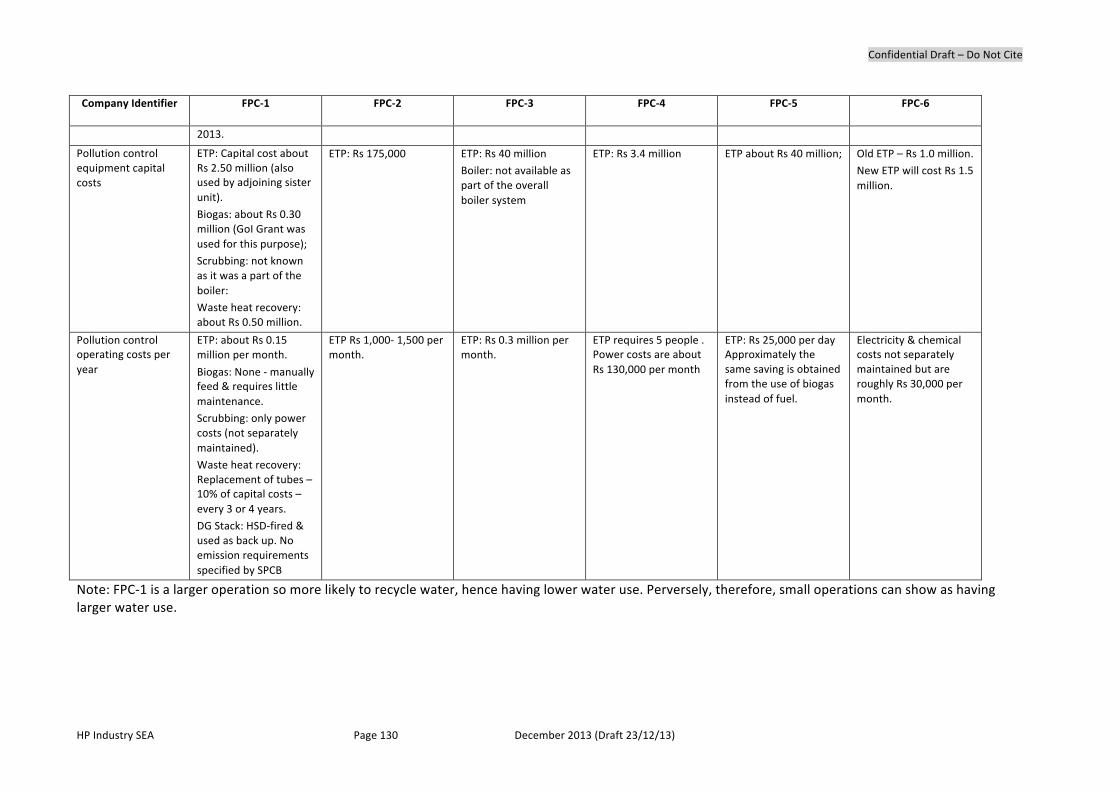
Confidential Draft – Do Not Cite
HP Industry SEA Page 130 December 2013 (Draft 23/12/13)
Company Identifier FPC-‐1 FPC-‐2 FPC-‐3 FPC-‐4 FPC-‐5 FPC-‐6
2013.
Pollution control equipment capital costs
ETP: Capital cost about Rs 2.50 million (also used by adjoining sister unit). Biogas: about Rs 0.30 million (GoI Grant was used for this purpose); Scrubbing: not known as it was a part of the boiler: Waste heat recovery: about Rs 0.50 million.
ETP: Rs 175,000
ETP: Rs 40 million Boiler: not available as part of the overall boiler system
ETP: Rs 3.4 million ETP about Rs 40 million;
Old ETP – Rs 1.0 million. New ETP will cost Rs 1.5 million.
Pollution control operating costs per year
ETP: about Rs 0.15 million per month.
Biogas: None -‐ manually feed & requires little maintenance. Scrubbing: only power costs (not separately maintained). Waste heat recovery: Replacement of tubes – 10% of capital costs – every 3 or 4 years. DG Stack: HSD-‐fired & used as back up. No emission requirements specified by SPCB
ETP Rs 1,000-‐ 1,500 per month.
ETP: Rs 0.3 million per month.
ETP requires 5 people . Power costs are about Rs 130,000 per month
ETP: Rs 25,000 per day Approximately the same saving is obtained from the use of biogas instead of fuel.
Electricity & chemical costs not separately maintained but are roughly Rs 30,000 per month.
Note: FPC-‐1 is a larger operation so more likely to recycle water, hence having lower water use. Perversely, therefore, small operations can show as having larger water use.
Confidential Draft – Do Not Cite
HP Industry SEA Page 131 December 2013 (Draft 23/12/13)
Annex G Cost Effectiveness Templates
[to be imported {potentially including ftp link?} – 4 pages including 1 description, 1 template for single firm (detailed), 1 template for industry (partial pro-‐forma), 1 template for all sources in economy (full pro-‐forma)]
Description

Confidential Draft – Do Not Cite
HP Industry SEA Page 132 December 2013 (Draft 23/12/13)
Template 1 – Firm
Confidential Draft – Do Not Cite
HP Industry SEA Page 133 December 2013 (Draft 23/12/13)
Template 2 – Industry/Sector

Confidential Draft – Do Not Cite
HP Industry SEA Page 134 December 2013 (Draft 23/12/13)
Template 3 – Economy
Confidential Draft – Do Not Cite
HP Industry SEA Page 135 December 2013 (Draft 23/12/13)
Annex H Maps (placeholder) [to be selected and inserted if needed]
Index:
Map H.1: Himachal Pradesh Highways, Roads, and Urban Centers
Map H.2: Himachal Pradesh Administrative Districts
Map H.3: Sirmour District, Himachal Pradesh, India
Map H.4: Shimla District, Himachal Pradesh, India
Map H.5: Solan District, Himachal Pradesh, India
Map H.6: Una District, Himachal Pradesh, India
Map H.7: Kangra District, Himachal Pradesh, India

Confidential Draft – Do Not Cite
HP Industry SEA Page 136 December 2013 (Draft 23/12/13)
Map H.1: Himachal Pradesh Highways, Roads, and Urban Centers

Confidential Draft – Do Not Cite
HP Industry SEA Page 137 December 2013 (Draft 23/12/13)
Map H.2: Himachal Pradesh Administrative Districts

Confidential Draft – Do Not Cite
HP Industry SEA Page 138 December 2013 (Draft 23/12/13)
Map H.3: Sirmour District, Himachal Pradesh, India

Confidential Draft – Do Not Cite
HP Industry SEA Page 139 December 2013 (Draft 23/12/13)
Map H.4: Shimla District, Himachal Pradesh, India

Confidential Draft – Do Not Cite
HP Industry SEA Page 140 December 2013 (Draft 23/12/13)
Map H.5: Solan District, Himachal Pradesh, India

Confidential Draft – Do Not Cite
HP Industry SEA Page 141 December 2013 (Draft 23/12/13)
Map H.6: Una District, Himachal Pradesh, India

Confidential Draft – Do Not Cite
HP Industry SEA Page 142 December 2013 (Draft 23/12/13)
Map H.7: Kangra District, Himachal Pradesh, India
Confidential Draft – Do Not Cite
HP Industry SEA Page 143 December 2013 (Draft 23/12/13)
Internal Confidential Notes (remove before publication)
Company Survey Codes
Pharmaceutical Company Identifier PC-‐1 Morephen PC-‐2a Unichem I PC-‐2b Unichem II PC-‐2c Unichem III PC-‐3 Abbott PC-‐4 USV II PC-‐5 Cadilla PC-‐6a Panacea I PC-‐6b Panacea II PC-‐7 MDC
Pharmaceutical Industry Identifier PI-‐1 Nicholas-‐1 PI-‐2 Nicholas -‐2 PI-‐3 Wockhardt PI-‐4 Alkem PI-‐5 FDC PI-‐6 Paras pharma PI-‐7 Ranbaxy PI-‐8 Hetero labs PI-‐9 USV [PC-‐4] PI-‐10 Panacea Biotech 1 [PC-‐6a] PI-‐11 Panacea Biotech 2 [PC-‐6b] PI-‐12 Cadilla [PC-‐5] PI-‐13 Ayuret PI-‐14 Alembic PI-‐15 Torque
Confidential Draft – Do Not Cite
HP Industry SEA Page 144 December 2013 (Draft 23/12/13)
PI-‐16 Surya 85 PI-‐17 Indoco PI-‐18 Ozone PI-‐19 Cipla pharma PI-‐20 Morephen Lab ltd [PC-‐1]
Stone Crushing Company Identifier SCC-‐1 Shiva (ID 10404) SCC-‐2 Saraswati (ID 10401) [check – selected as “Sarawati Crushers Village Worker”] SCC-‐3 Rudra (ID 19587) [check – selected as “Shree Rudra Stone Crushing and Screening”] SCC-‐4 Bharat (ID 14141) SCC-‐5 Himachal Chemicals & Silicates Group (ID 17784) [check – selected as “Himachal Crushing Company”]
Food Processing Company Identifier FPC-‐1 Shivambhu International FPC-‐2 Jupiter Multi Food Processing FPC-‐3 Nestle FPC-‐4 Mrs Bector Food Specialities Ltd FPC-‐5 Sukhjeet Agro FPC-‐6 Nature Agro Foods