Embed Size (px)
Citation preview
1
Strategic Workforce Optimization: Ensuring Workforce Readiness
with OptForceTM
Jay April1, Marco Better1, Fred Glover1, James P. Kelly1, Gary Kochenberger2 1OptTek Systems, Inc., 2241 17th Street, Boulder, CO 80302
2 University of Colorado, Denver, CO 80217 Abstract Strategic workforce planning (SWP) has been identified as a top business challenge and a high priority in order to produce organizations that are capable of performing more effectively. Industry leaders recognize that success depends on attracting, retaining and developing talent, and having the right talent in the right place at the right time – to achieve the condition often characterized as workforce readiness. High readiness levels require anticipating and responding to changing workforce needs and market demands, and allocating resources effectively. We have approached the SWP challenge by applying state-of-the-art technology from decision sciences and advanced analytics to the field of talent management. Our resulting software, called OptForce, enables organizations to optimize workforce readiness and composition while accounting for critical workforce constraints. OptForce offers a broad range of predictive analytics capabilities including sophisticated workforce demand planning, fine-grained employee retention models, and agent-based simulation forecasting. Cloud hosted, the system additionally provides a prescriptive analytics capability through its simulation optimization engine. Keywords: workforce planning, workforce readiness, talent management, strategic decision-making, forecasting, simulation optimization, software-as-a-service. 1. Introduction CEOs consistently identify “attracting, retaining and developing talent” as a priority, as well as a top business challenge for the future (see Talent Watch (2011) and Mercer Global Business Challenges Survey (2008)). They recognize that an organization is only as good as its talent, and success depends on having the right people in the right place at the right time and for the right cost – a concept referred to as readiness. Achieving a high level of readiness requires the ability to anticipate and rapidly respond to changing workforce needs, and to allocate resources as effectively as possible in meeting those needs.
Workforce planning has been defined as the business process that enables the identification and analysis of what an organization will need in terms of the future size, type, and quality of workforce to achieve its objectives. As such, its goals are more strategic and long-term than those of workforce optimization and labor scheduling, where the end result is an optimal, short-term schedule of its existing resources. Whereas many organizations have been doing workforce scheduling for a long time, in most organizations workforce planning is still in its infancy, if done at all. The tools and analytics used to support strategic HR decisions are not nearly as
2
advanced as they are in other disciplines. For example, there’s no equivalent of a cash flow model or operations plan. Yet the complexity of the workforce planning task is enormous! The pace of change within economies, industries and organizations continues to accelerate; labor markets continue to become more competitive and more global; the workforce continues to become more diverse in terms of its demographics, expectations and goals. Advanced workforce planning and talent management tools are needed to enable HR to:
Forecast human capital requirements (numbers, skill sets, locations, timing) given a range
of possible business scenarios, and respond in real-time to changes in the assumptions behind those scenarios;
Identify the recruitment channels that will be most effective in meeting those requirements;
Forecast the impact of various HR programs/practices on attraction and retention, and identify how that varies based on demographics, job level, and performance;
Model the impact of turnover and employee movement within the organization; Understand trade-offs between readiness and HR costs; Achieve objectives with respect to workforce representation; Quantify the financial impact of HR decisions.
If HR is to have a credible place at the strategic planning table, then human capital recommendations and decisions must be made based on data and analytics instead of relying solely on anecdotes and assumptions. The system we describe in this paper, called OptForce, is designed to meet these challenges. Based on our experience with optimization and simulation, and our partnering with the US Navy on a project designed to manage career progression in the military, we set out to develop a model that would enable organizations to optimize readiness (right people, right place, right time, and right costs) and representation (diversity of the workforce) within defined constraints such as HR budget dollars, total compensation dollars and scarce skills. The National Science Foundation recognized the potential application of optimization to human capital decisions and awarded OptTek Systems a grant to support development of a prototype. The result is OptForceTM.
This new system for strategic workforce planning goes beyond systems developed in the past. Whereas traditional approaches limit their scope to projecting future workforce requirements based on static assumptions, OptForce provides decision making tools that support the development and implementation of strategies, programs and policies to meet those requirements. For example, OptForce can be used to determine optimal investment levels in specific practices (policies, programs, initiatives, organizational culture) used to attract and retain valued employees while recognizing budget constraints and considering the demographics of your population. Additional applications include:
Identifying the most effective recruiting channels for the organization; Modeling the cost-effectiveness and risk of using contingent versus regular staff;
3
Supporting the budgeting process by defining and communicating trade-offs between readiness and costs;
Modeling the likely impact of total compensation strategies; Identifying likely bench strength in key areas given workforce mobility; Modeling workforce requirements and transitions following M&As.
Ultimately, OptForce has been given the flexibility to be applied to any strategic human capital decision-making process. The remainder of this paper is organized as follows. Section 2 summarizes the key components of the OptForce System in preparation for more detailed discussions of subsequent sections. Section 3 describes the agent-based simulation model that is a core mechanism for representing employee flows over time, while Sections 4 and 5 respectively describe the simulation of workforce planning scenarios attended by what-if analysis, and the associated optimization of HR practices. Finally, Section 6 highlights two real-world applications of OptForce that underscore its success in meeting complex workforce planning challenges for a major organization and the US Army, and conclusions are presented in Section 7.
2. Key Components of the OptForce System In order to use OptForce, an organization must begin the process of developing strategic workforce forecasts (in terms of numbers, skills, demographics, locations, timing) linked to business plans and financial and operational forecasts. OptForce then models the movement of people into, within, and out of the organization, factoring in (1) employee attributes such as skill and performance data, information on the current and potential practices; (2) policies that impact attraction, retention and movement; and (3) economic or environmental factors that impact the business and/or workforce. The outcome of the process is a set of gaps between actual workforce and forecasted workforce requirements. A decision-making optimization-based model is then developed that enables a user to evaluate the effectiveness of various strategies in closing those gaps. The main components of OptForce are as follows.
2.1. Workforce Forecasting Model The forecasting step employs an innovative model that predicts future workforce
requirements based on business planning assumptions. (The efficacy of this model compared to alternative approaches is highlighted in Section 6, which reports on applications.) Business plans are then translated into workforce requirements, a key input to the OptForce system.
2.2. Workforce Planning Model Our OptForce workforce planning model utilizes an agent-based simulation design. Within
this framework, individual employees are simulated as “computerized agents” that interact
4
with their environment and periodically make decisions about their career in the organization. These decisions are based on their perceptions of the degree to which the organization is currently meeting its objectives and needs, and the likelihood that the organization will continue to meet its needs in the future.
In OptForce, these perceptions are defined by the organization’s practices (e.g., policies,
programs, initiatives, work environment) and current and future job opportunities. The system considers the probabilistic impact of these factors given specific employee attributes. In every period, each employee will make a decision (according to a probability) of whether s/he will stay in the organization for another period, and the organization will make decisions (again, probabilistically) about the assignment of employees to particular jobs, the promotion and movement of employees, and the recruitment of new hires to fill available positions. The organization will also make decisions about which practices to start, enhance, reduce and discontinue.
2.3 Optimizing the Model OptForce’s embedded optimization software – OptQuest® – contains state-of-the-art
algorithms for optimizing complex systems, such as workforce planning. OptQuest is a general optimization engine, flexible enough to accommodate single or multiple optimization objectives, as well as various organizational structures, policy/program portfolios, and environmental influences.
2.4 A Simple User Interface OptForce provides a simple, step-by-step user interface that structures the planning process,
resulting in a tool for upper level decision makers. In many cases, OptForce will be delivered through a web interface deployed through a software-as-a-service (SAS) sales model.
The technology embedded in OptForce derives from many years of experience in developing and implementing simulation optimization, network optimization, logistics and forecasting models. Fundamental analytics and search technologies underlying the system are described in April et al. (2006), Better et al. (2007, 2008, 2010), and Glover et al. (1992, 1997, 2000).
3. Building the Agent-Based Simulation Model At the core of OptForce is an agent-based simulation model that represents the flow of employees over time. The basic steps in building this model are:
1. Define workforce forecasts 2. Define key attributes most relevant to categorizing employees (e.g., gender, ethnicity,
age, job level, performance rating, etc.) 3. Identify current and proposed HR policies, programs and initiatives designed to influence
employee attraction, retention and movement within the organization 4. Determine the impact of each policy, program and initiative on employees with different
attributes
5
5. Define current and potential recruitment channels and practices 6. Define assumptions with respect to promotion and movement within the organization
Users are provided with tools and templates for data collection, external data (where publicly available) to support model assumptions (e.g., correlation between a specific practice and the corresponding retention rates based on demographics), recruiting channel effectiveness in recruiting employees with specific attributes, guidance in determining relevant inputs to the model, and seasoned judgment in the formulation of components of the model which are more subjective, either by nature or due to the lack of historical data when the model is first developed.
3.1. Define Workforce Requirements
Defining future workforce requirements serves as the foundation for effective workforce-planning – a forecast of talent requirements given likely business scenarios. It involves translating business plans into a specific workforce profile or staffing plan – number of positions, types of skills, timing, location, etc. – and identifying those factors that could change the required profile so that contingency plans can be developed.
For this purpose, OptForce enables users to create various “Demand Metrics” for demand
planning purposes. These metrics may be tied directly to financial projections such as sales, revenue and gross margin. Alternately, the metrics may be tied to operational projections, such as number of beds in a hospital ward, number of machines in a job shop, expected throughput goals, expected cycle time for patients and so forth.
The user can take advantage of the system to create a metric that reflects the need for one
or more roles in the organization, and then tie the metric to growth in those roles. These metrics provide the basis for defining specific job requirements (e.g., knowledge/skills/abilities, education and experience, certifications.) The requirements in turn form the basis for job descriptions or job postings.
The workforce requirements model drives a critical aspect of the planning process, in
which readiness is measured as the extent to which the defined job requirements are met. Therefore, the model drives job assignments, promotions, internal movement and hiring decisions during the simulation of each scenario.
3.2. Define the key attributes most relevant to categorizing employees The second step is to identify the key employee attributes to include in the model.
Attributes describe the characteristics of an employee, such as age, gender, ethnicity, work experience, education, performance or talent review rating, etc. Attribute values are used to classify employees for the purpose of assessing the impact of different HR decisions on different groups of employees. For instance, it may be desired to track employees by two attributes: Gender and Age. Then, within Gender there are two values: Male and Female; and within Age there are four values: Veterans, Baby Boomers, Generation X and
6
Generation Y. As an example, if the organization were to implement a policy that allows for flex-time, the model might predict a highly positive impact on the retention rate of Female, Generation Y employees, whereas it might predict little or no effect on the retention of Male, Baby Boomers.
Ultimately, the set of attributes chosen to describe the employee population should be
selected according to the following criterion: Does the impact of any of the current or potential practices vary significantly by this attribute? If the answer is “yes”, then the attribute should be included in the model.
3.3 Identify current and potential HR practices The next step is to develop a comprehensive inventory of practices currently in place that
impact attraction, movement and retention, as well as any proposed modifications to current practices, and any practices being considered for future implementation. To aid in the process, OptForce provides an interface that organizes practices into different user-defined Attraction and Retention Drivers. These drivers represent key factors that affect employee decisions to join an organization or to leave the organization. The drivers that have been reported in the literature to hold the most sway over employee attraction and retention have been included in our model by default. (see Watson Wyatt Webcast (2008) and Customizing the Employment Offer (2002)). These are (a) Compensation, (b) Benefits, (c) Career Development Opportunities, (d) Work-Life Balance, (e) Manager Quality, (f) Company Reputation and Performance, and (g) Company Culture and Work Environment. These Drivers can be modified to reflect any categorization scheme used by the organization.
3.4 Determine the impact of each practice on employees with different attributes The impact of each practice on an employee’s behavior is determined based on relevant
employee attributes. In the absence of solid historical data and/or external benchmark data, we assume the organization has, at minimum, anecdotal data and informed judgment as to the expected impact of different practices on employees with specific attributes. Like the development of the workforce profile, this is an area where anorganization may find it useful to start simple and build sophistication over time.
3.5 Define current and potential recruitment channels In addition to considering the impact of various HR practices on current employees,
OptForce considers the effectiveness of alternate recruiting channels in bringing employees into the organization. For each current and potential future recruiting channel, the following parameters are defined:
• A probability distribution of the population in that channel, as defined by key
employee attributes • A cost-per-hire figure for that channel by job level • An effectiveness factor for that channel by job level
7
• A maximum number of new hires that can be obtained from that channel, by job level
OptForce is populated with available published data on common channels (e.g., universities, job sites, etc.), but parameters related to effectiveness and cost will vary by organization, so the model will be enhanced by historical, company-specific data. The probability distribution of the population in a channel represents the likelihood that a new hire will have certain desired attributes. For example, according to the National Center for Education Statistics (see http://nces.ed.gov/ ) of the Department of Education, the probability distribution of the population of graduating seniors in all public colleges and universities in the US, by ethnicity and gender, is:
• White males: 29% • Minority males: 13% • Asian American males: 3% • White females: 36% • Minority females: 16% • Asian American females: 3%
These data could be entered into a recruitment channel labeled “General Colleges and Universities”, so that during a simulation, when a new hire is drawn from this population the likelihood of hiring a minority female, for example, would be about 16%.
The cost-per-hire figure for the channel is the average amount it costs the organization to
hire a new employee utilizing that particular channel. It includes all costs and expenses related to hiring, including setup costs (i.e. travel costs to a university, setting up a booth at a job fair, etc.), advertising costs, recruiting costs (i.e. recruiters’ time, managers’ time in interviews, etc.), agency fees, employee referral fees, relocation expenses, signing bonuses, etc. If the organization does not calculate cost-per-hire for each channel, but has a good estimate of average cost-per-hire by job level (e.g., hourly, professional, middle management) each channel’s cost-per-hire figure will be derived by multiplying the cost-per-hire times the effectiveness factor, described below.
The effectiveness factor relates to the efficiency of the channel in yielding qualified
candidates for a given job family or level. It is multi-dimensional, and can consider such factors as % of jobs filled by this channel, offers as a % of interviews, first-year retention rates, offer acceptance rate) Effectiveness can be measured in many ways, but it is important that the calculation be consistent across all channels.
Finally, the organization estimates the maximum number of new hires it expects to get
from each channel, for each job family and/or level, during each period. Ideally, this information will be forecast based on historical recruitment data, adjusted to reflect expected future state, but it may be based simply on the best judgment of in-house recruiting experts.
8
The data in the recruitment channels will be used to simulate new hires coming into the organization, according to alternative recruitment budget allocations across channels and the probability distributions of the population associated with each channel.
3.6 Define assumptions with respect to promotion and movement within the organization The last step in setting up the model relates to the mobility of employees within the
organization, in terms of promotions, job changes, location changes, etc. One of the attributes associated with each employee is their level within the organization, which may be defined either generically for the entire organization or expressed as career paths within a job family. Using historic data on mobility, we develop a probability table as shown in Table 1. This table predicts the likelihood that employees with particular combinations of attributes will move within the organization during the measurement timeframe.
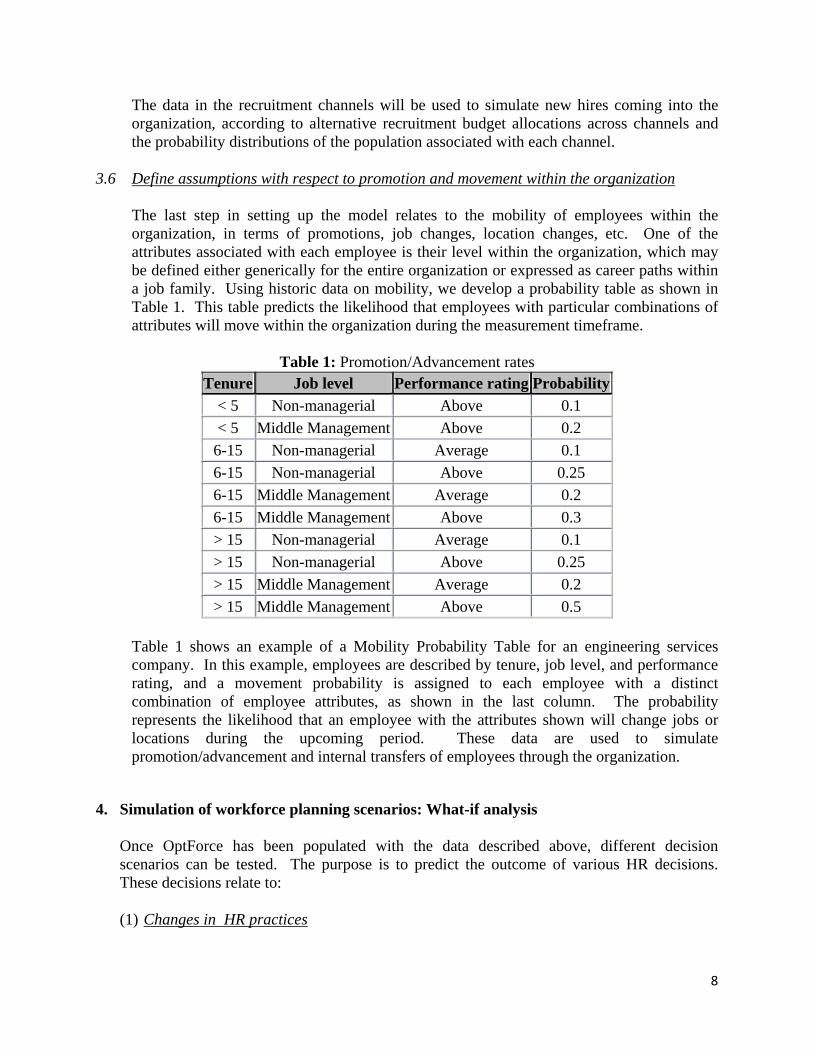
Table 1: Promotion/Advancement rates
Tenure Job level Performance rating Probability < 5 Non-managerial Above 0.1 < 5 Middle Management Above 0.2
6-15 Non-managerial Average 0.1 6-15 Non-managerial Above 0.25 6-15 Middle Management Average 0.2 6-15 Middle Management Above 0.3 > 15 Non-managerial Average 0.1 > 15 Non-managerial Above 0.25 > 15 Middle Management Average 0.2 > 15 Middle Management Above 0.5
Table 1 shows an example of a Mobility Probability Table for an engineering services company. In this example, employees are described by tenure, job level, and performance rating, and a movement probability is assigned to each employee with a distinct combination of employee attributes, as shown in the last column. The probability represents the likelihood that an employee with the attributes shown will change jobs or locations during the upcoming period. These data are used to simulate promotion/advancement and internal transfers of employees through the organization.
4. Simulation of workforce planning scenarios: What-if analysis
Once OptForce has been populated with the data described above, different decision scenarios can be tested. The purpose is to predict the outcome of various HR decisions. These decisions relate to: (1) Changes in HR practices
9
Assuming a limited HR budget, the organization must prioritize the practices it will implement, maintain, change or discontinue, and the level of funding for each. A key application of the model is to determine the budget allocation that results in the highest possible level of readiness while meeting defined representation goals. It should be noted that the model considers the existence of various practices and level of funding. It does not attempt to quantify the execution quality.
(2) Allocation of recruitment budget
The model considers how budget dollars are allocated across recruitment channels in simulating movement into the organization. Another key application of the model is to determine the budget allocation that will most likely enable the organization achieve readiness and representation/diversity goals
(3) Economic/business outlook and other environmental parameters Factors such as economic forecasts, the unemployment rate, financial strength of the organization, demand and supply gaps for certain skills, etc. affect employee decisions about staying in a job or seeking other employment opportunities. How this factor is defined will likely be unique to each organization, depending on the factors that are most relevant to their organization and the degree to which these factors can be based on quantitative metrics or are more subjective.
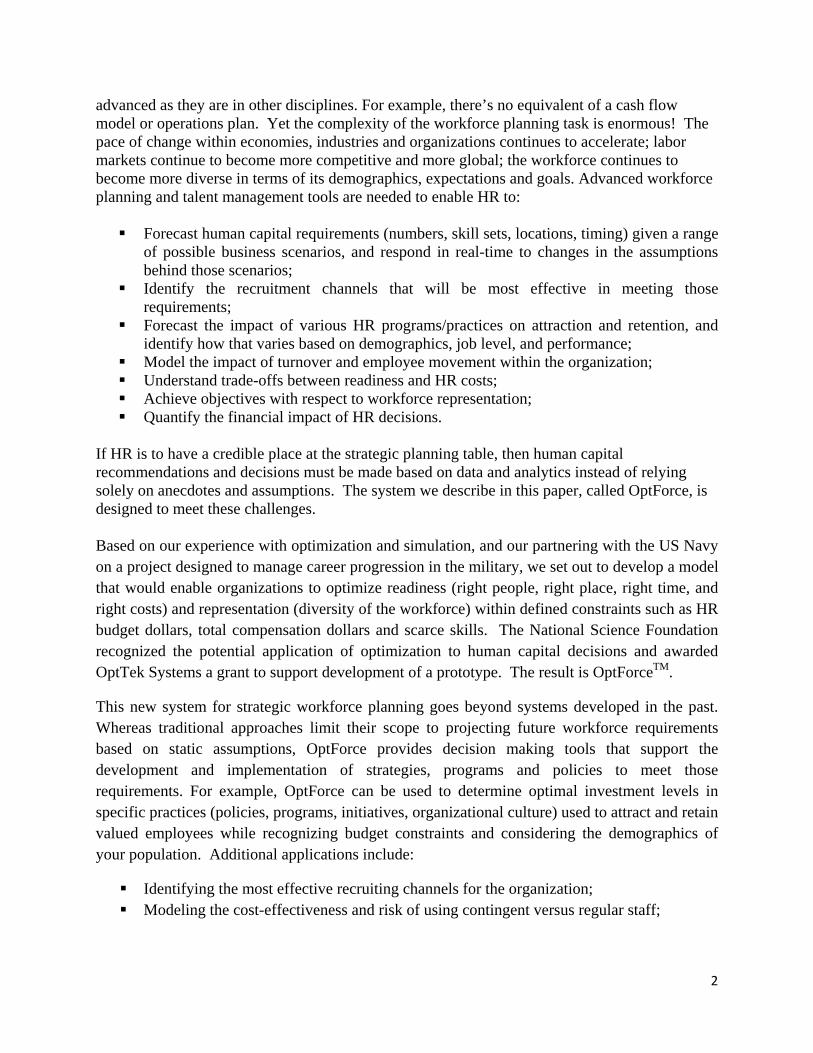
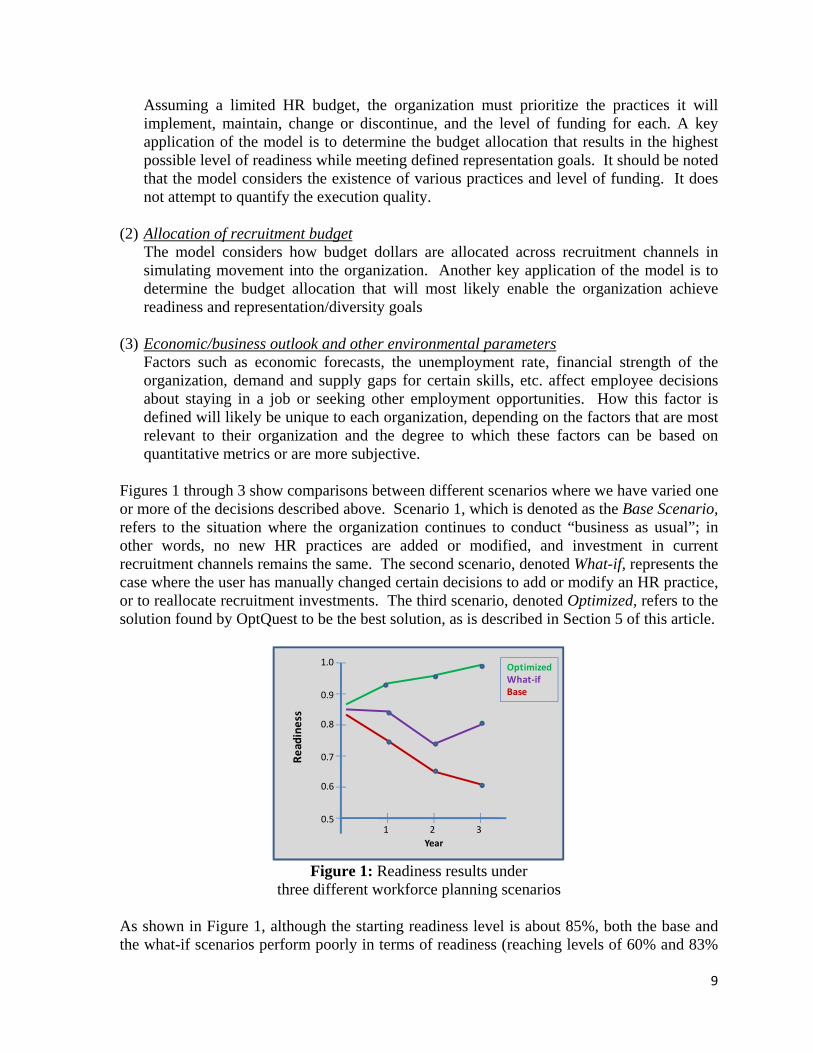
Figures 1 through 3 show comparisons between different scenarios where we have varied one or more of the decisions described above. Scenario 1, which is denoted as the Base Scenario, refers to the situation where the organization continues to conduct “business as usual”; in other words, no new HR practices are added or modified, and investment in current recruitment channels remains the same. The second scenario, denoted What-if, represents the case where the user has manually changed certain decisions to add or modify an HR practice, or to reallocate recruitment investments. The third scenario, denoted Optimized, refers to the solution found by OptQuest to be the best solution, as is described in Section 5 of this article.
Figure 1: Readiness results under
three different workforce planning scenarios As shown in Figure 1, although the starting readiness level is about 85%, both the base and the what-if scenarios perform poorly in terms of readiness (reaching levels of 60% and 83%
OptimizedWhat‐ifBase
0.5
0.6
0.7
0.8
0.9
1.0
1 2 3Year
Readiness
10
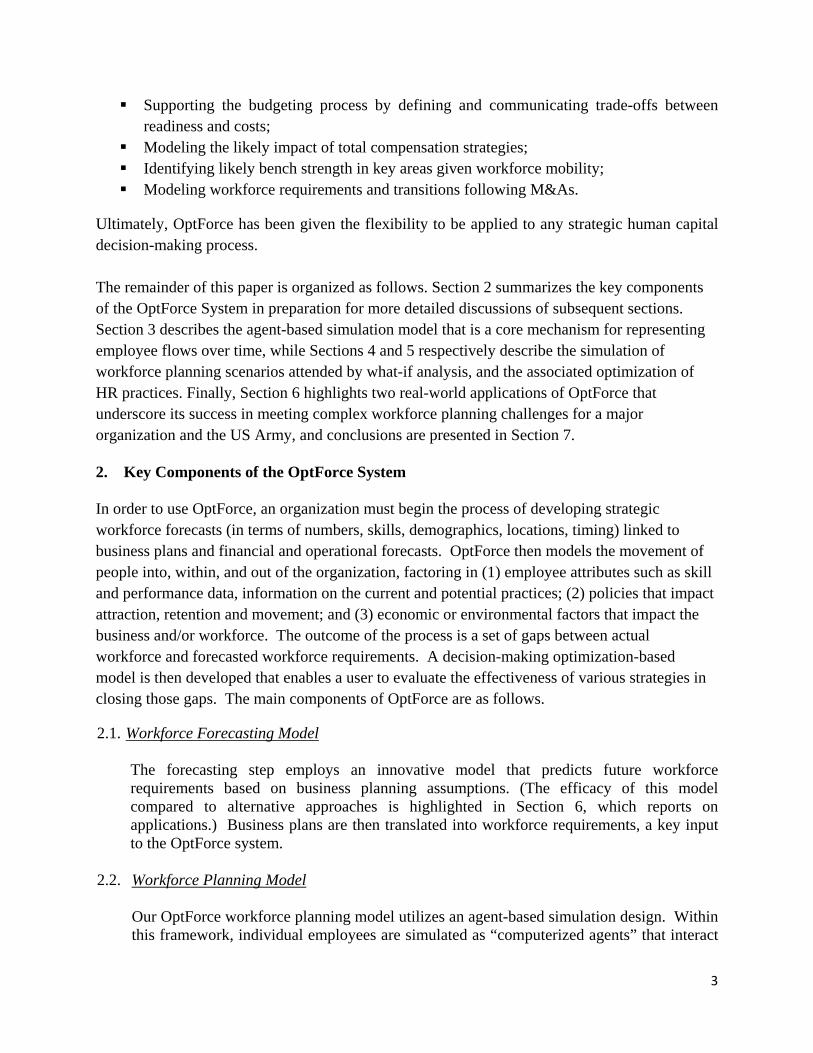
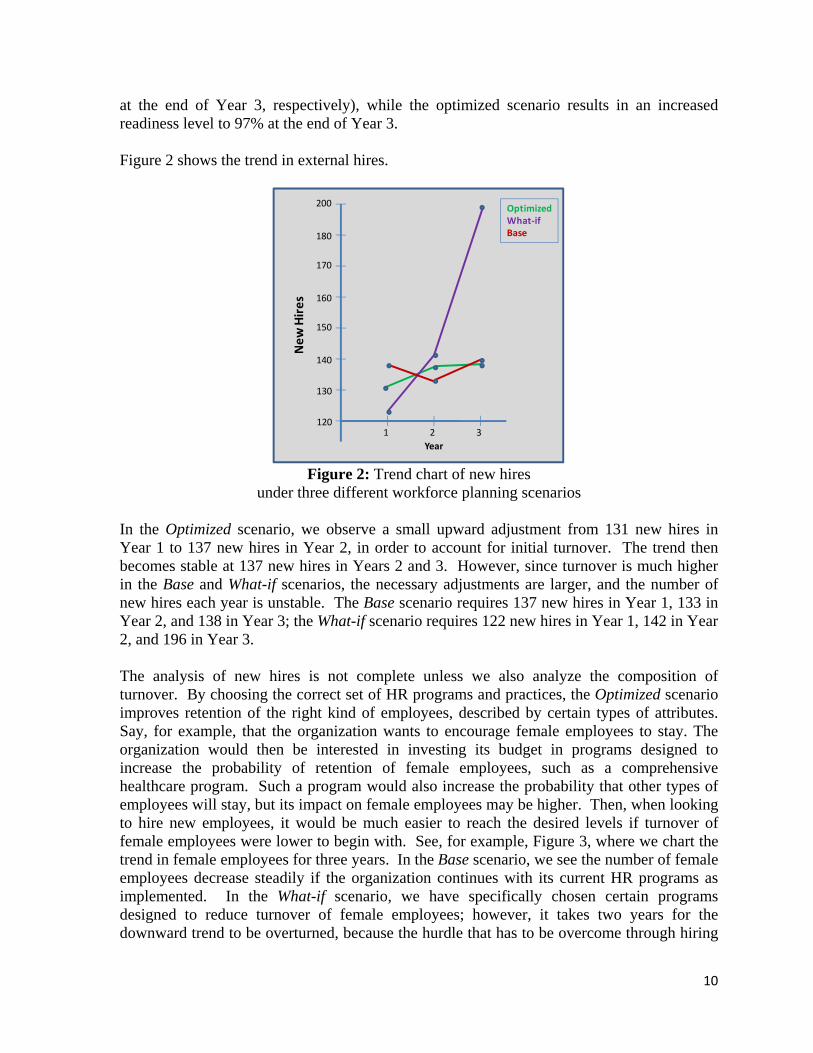
at the end of Year 3, respectively), while the optimized scenario results in an increased readiness level to 97% at the end of Year 3. Figure 2 shows the trend in external hires.
Figure 2: Trend chart of new hires
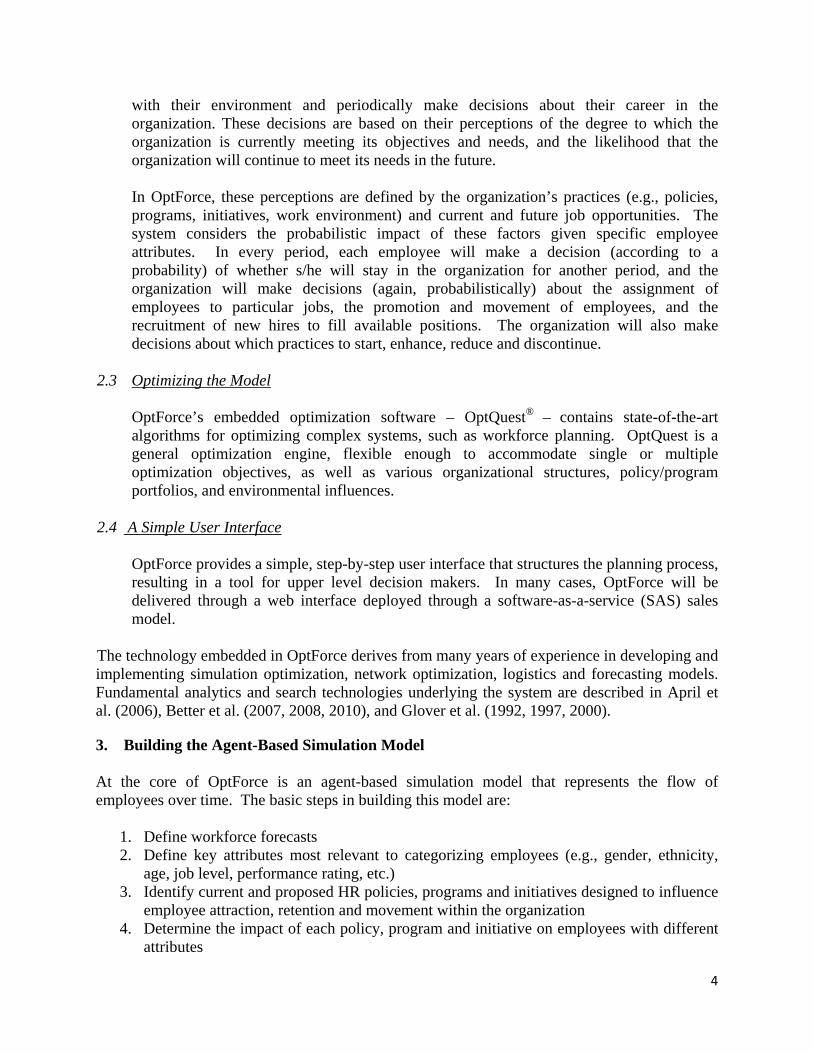
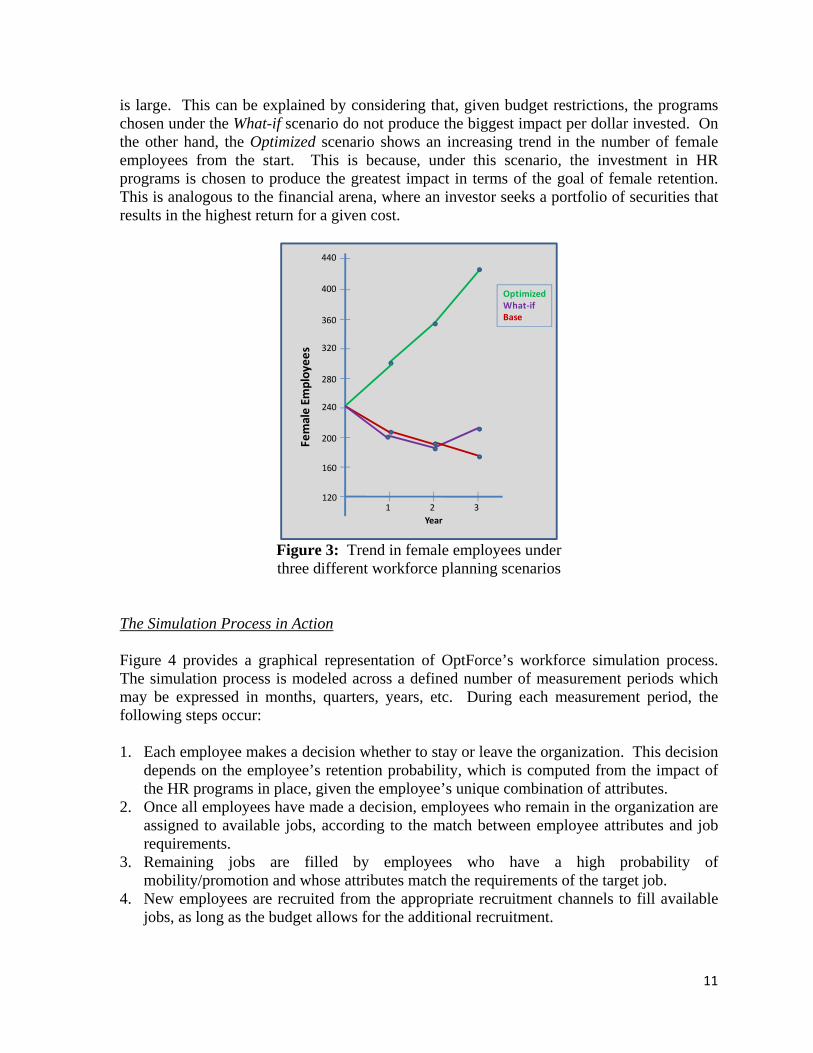
under three different workforce planning scenarios In the Optimized scenario, we observe a small upward adjustment from 131 new hires in Year 1 to 137 new hires in Year 2, in order to account for initial turnover. The trend then becomes stable at 137 new hires in Years 2 and 3. However, since turnover is much higher in the Base and What-if scenarios, the necessary adjustments are larger, and the number of new hires each year is unstable. The Base scenario requires 137 new hires in Year 1, 133 in Year 2, and 138 in Year 3; the What-if scenario requires 122 new hires in Year 1, 142 in Year 2, and 196 in Year 3. The analysis of new hires is not complete unless we also analyze the composition of turnover. By choosing the correct set of HR programs and practices, the Optimized scenario improves retention of the right kind of employees, described by certain types of attributes. Say, for example, that the organization wants to encourage female employees to stay. The organization would then be interested in investing its budget in programs designed to increase the probability of retention of female employees, such as a comprehensive healthcare program. Such a program would also increase the probability that other types of employees will stay, but its impact on female employees may be higher. Then, when looking to hire new employees, it would be much easier to reach the desired levels if turnover of female employees were lower to begin with. See, for example, Figure 3, where we chart the trend in female employees for three years. In the Base scenario, we see the number of female employees decrease steadily if the organization continues with its current HR programs as implemented. In the What-if scenario, we have specifically chosen certain programs designed to reduce turnover of female employees; however, it takes two years for the downward trend to be overturned, because the hurdle that has to be overcome through hiring
OptimizedWhat‐ifBase
140
150
160
170
180
200
1 2 3Year
New
Hire
s
130
120
11
is large. This can be explained by considering that, given budget restrictions, the programs chosen under the What-if scenario do not produce the biggest impact per dollar invested. On the other hand, the Optimized scenario shows an increasing trend in the number of female employees from the start. This is because, under this scenario, the investment in HR programs is chosen to produce the greatest impact in terms of the goal of female retention. This is analogous to the financial arena, where an investor seeks a portfolio of securities that results in the highest return for a given cost.
Figure 3: Trend in female employees under three different workforce planning scenarios
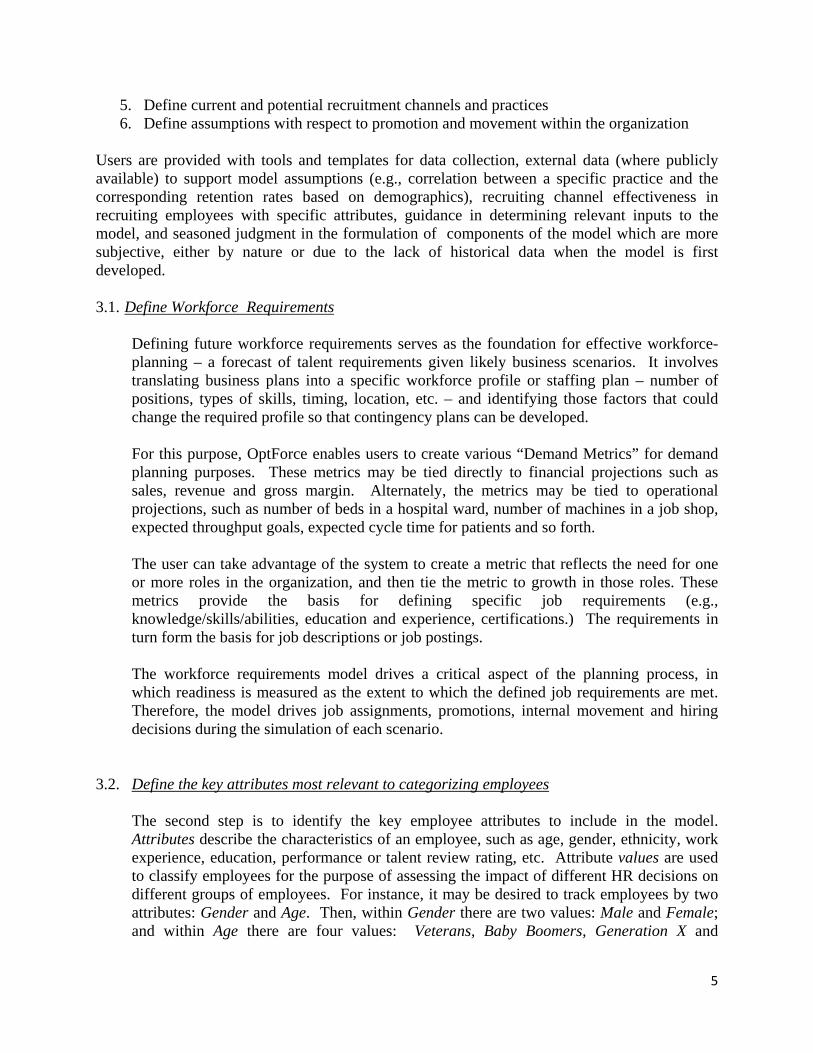
The Simulation Process in Action Figure 4 provides a graphical representation of OptForce’s workforce simulation process. The simulation process is modeled across a defined number of measurement periods which may be expressed in months, quarters, years, etc. During each measurement period, the following steps occur:
1. Each employee makes a decision whether to stay or leave the organization. This decision
depends on the employee’s retention probability, which is computed from the impact of the HR programs in place, given the employee’s unique combination of attributes.
2. Once all employees have made a decision, employees who remain in the organization are assigned to available jobs, according to the match between employee attributes and job requirements.
3. Remaining jobs are filled by employees who have a high probability of mobility/promotion and whose attributes match the requirements of the target job.
4. New employees are recruited from the appropriate recruitment channels to fill available jobs, as long as the budget allows for the additional recruitment.
OptimizedWhat‐ifBase
200
240
280
320
360
400
1 2 3Year
Female Em
ployee
s
160
120
440
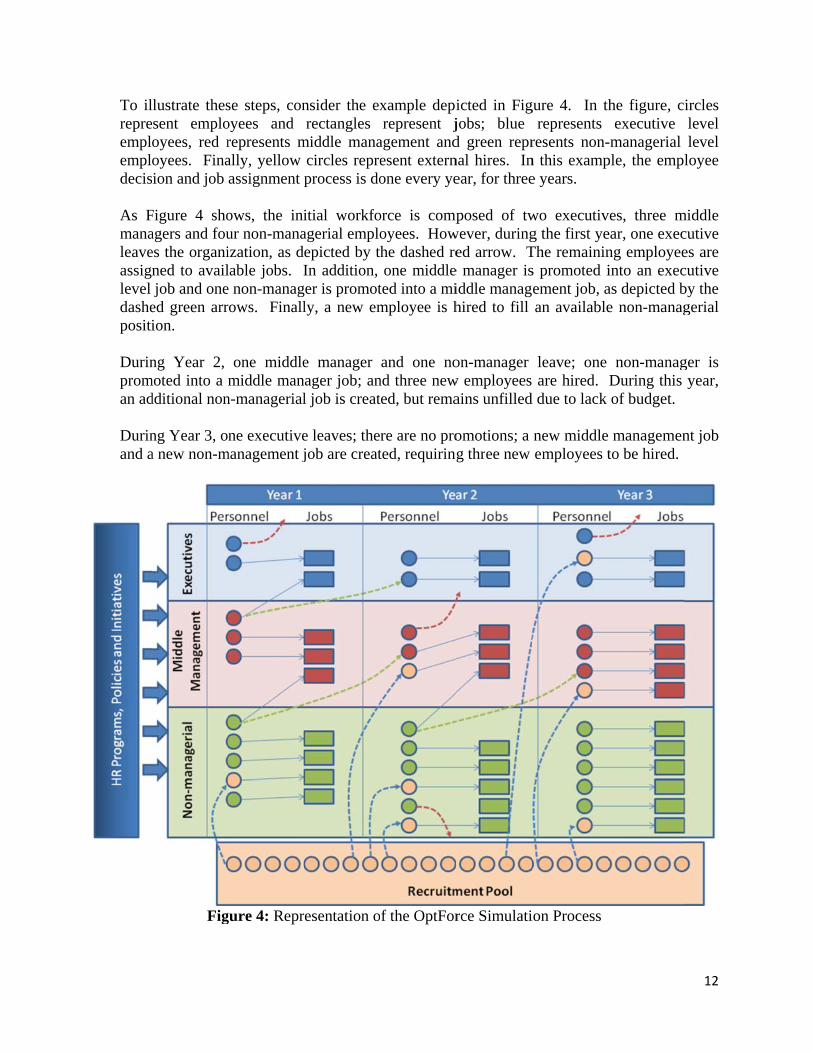
To ilrepreemplempldecis As Fmanaleaveassignlevel dashepositi Durinproman ad Durinand a
llustrate thessent emplooyees, red royees. Finaion and job
Figure 4 shoagers and foues the organined to availjob and one
ed green arrion.
ng Year 2, moted into a mdditional non
ng Year 3, oa new non-m
Fig
se steps, conoyees and represents mally, yellow assignment p
ows, the iniur non-manaization, as dlable jobs. Ie non-managrows. Finall
one middlemiddle man
n-managerial
ne executivemanagement j
gure 4: Repr
nsider the exrectangles
middle manacircles repreprocess is do
itial workfoagerial emploepicted by thIn addition,
ger is promotly, a new em
e manager nager job; anl job is creat
e leaves; thejob are creat
resentation o
xample depirepresent j
agement andesent externone every ye
orce is compoyees. Howhe dashed reone middle
ted into a mimployee is h
and one nond three newted, but rema
re are no proted, requiring
f the OptFor
icted in Figjobs; blue d green reprnal hires. Inear, for three
posed of twwever, duringed arrow. T
e manager isiddle managhired to fill
on-manager w employees ains unfilled
omotions; a g three new
rce Simulati
gure 4. In threpresents
resents non-n this exampe years.
wo executivg the first yeThe remainins promoted iement job, aan available
leave; one are hired.
d due to lack
new middleemployees t
ion Process
he figure, cexecutive
-managerial ple, the emp
ves, three mear, one execng employeeinto an execas depicted be non-manag
non-managDuring this of budget.
managemento be hired.
12
ircles level level loyee
middle cutive es are cutive by the gerial
ger is year,
nt job
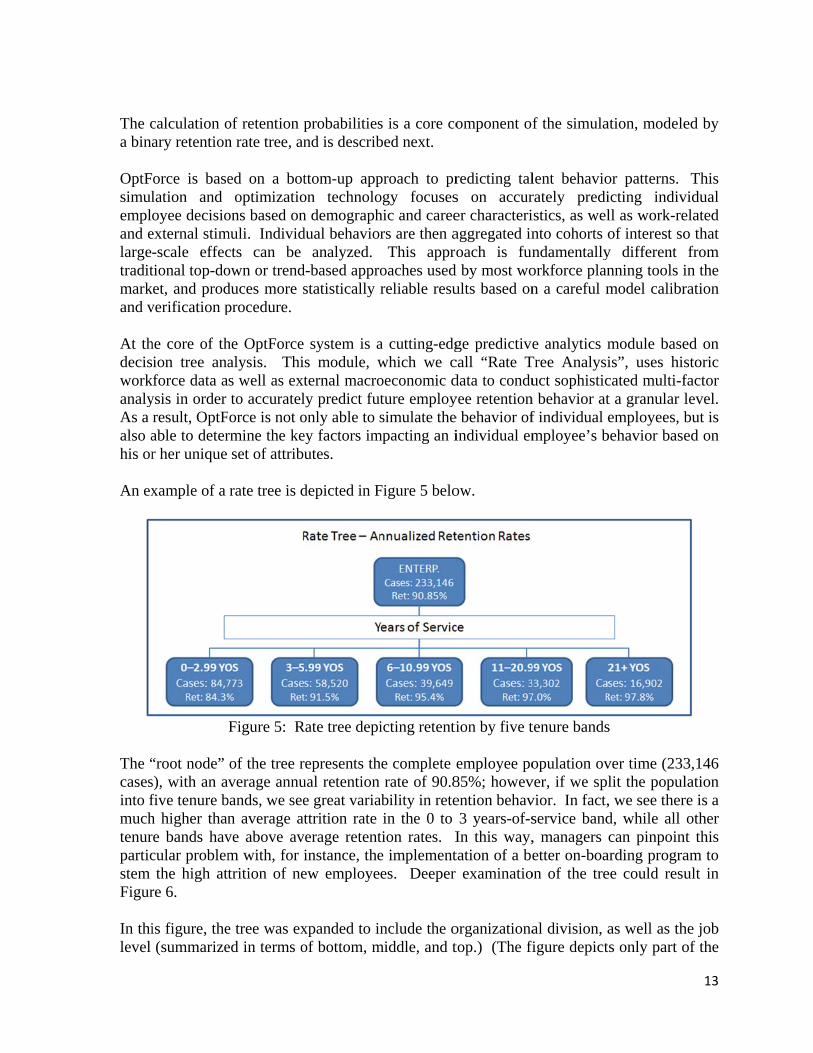
The ca bina OptFsimulempland elargetraditmarkand v At thdecisworkanalyAs a also ahis or An ex
The “casesinto fmuchtenurparticstem Figur In thilevel
calculation oary retention
orce is baselation and oyee decisio
external stim-scale effectional top-do
ket, and prodverification p
he core of thion tree ana
kforce data aysis in order result, OptFable to deterr her unique
xample of a
“root node” s), with an afive tenure bh higher thanre bands havcular problemthe high att
re 6.
is figure, the(summarize
of retention pn rate tree, an
ed on a botoptimizatio
ons based onmuli. Individcts can be own or trendduces more sprocedure.
he OptForce alysis. This well as extto accuratelorce is not o
rmine the keset of attribu
rate tree is d
Figure 5: R
of the tree rverage annu
bands, we seen average atve above avm with, for itrition of ne
e tree was exed in terms o
probabilitiesnd is describ
ttom-up appon technolon demographdual behavior
analyzed. d-based approstatistically
system is as module, wternal macroly predict futonly able to sey factors imutes.
depicted in F
Rate tree depi
represents thual retention e great variattrition rate
verage retentinstance, theew employe
xpanded to inof bottom, m
s is a core cobed next.
proach to progy focuseshic and careers are then aThis appro
oaches usedreliable resu
a cutting-edgwhich we coeconomic dture employsimulate the
mpacting an i
Figure 5 belo
icting retenti
he complete erate of 90.8
ability in retein the 0 to
tion rates. Ie implementes. Deeper
nclude the omiddle, and t
omponent o
redicting tals on accurer characteriaggregated inoach is fun
d by most woults based on
ge predictivecall “Rate Tdata to conduyee retentione behavior ofindividual em
ow.
ion by five t
employee po85%; howevention behav3 years-of-s
In this way,tation of a be
examinatio
organizationatop.) (The fi
f the simula
lent behaviorately prediistics, as welnto cohorts ondamentallyorkforce plann a careful m
e analytics mTree Analysiuct sophistic
n behavior atf individual employee’s b
tenure bands
opulation ovver, if we splvior. In fact,service band, managers etter on-boa
on of the tre
al division, afigure depict
ation, modele
or patterns. icting indivll as work-reof interest so
y different nning tools imodel calibr
module baseis”, uses hiscated multi-ft a granular lemployees, b
behavior base
s
ver time (233lit the popul, we see therd, while all can pinpoin
arding prograee could resu
as well as ths only part o
13
ed by
This vidual elated o that from
in the ration
ed on storic factor level. but is ed on
3,146 lation re is a other
nt this am to ult in
he job of the
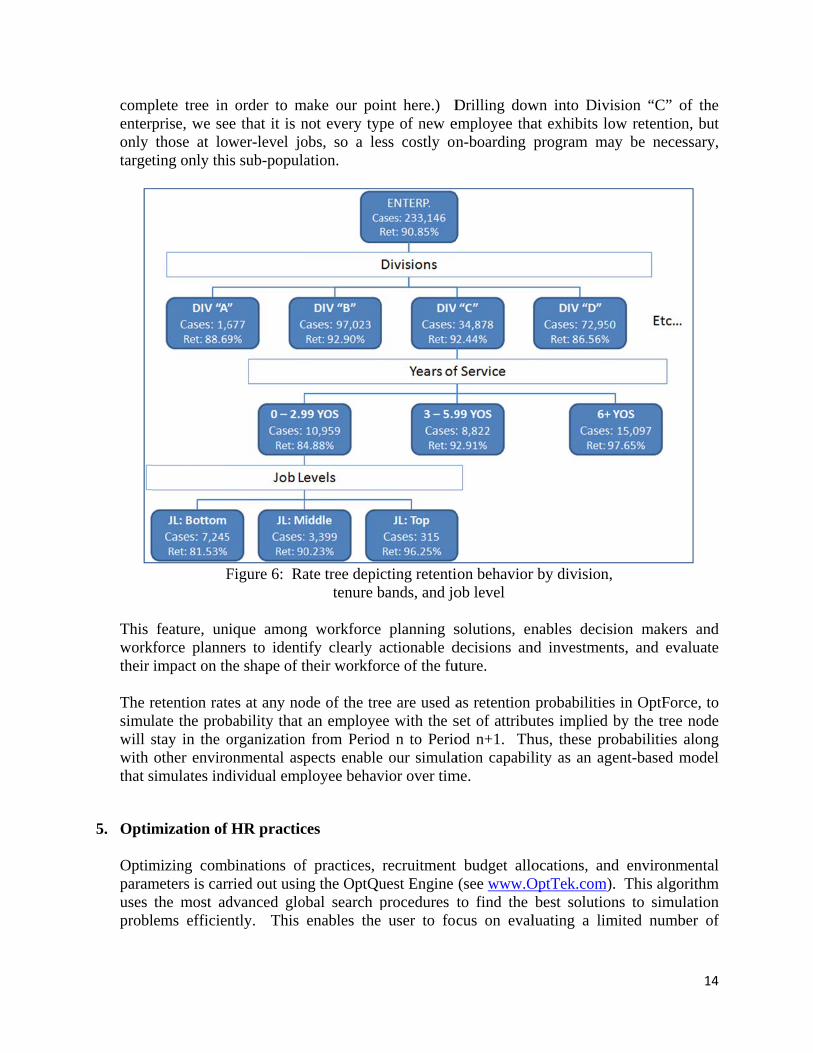
compenterponly target
This worktheir The rsimulwill swith that s
5. Optim
Optimparamuses probl
plete tree in prise, we sethose at lo
ting only thi
F
feature, unkforce plann
impact on th
retention ratlate the probstay in the oother enviro
simulates ind
mization of
mizing combmeters is carrthe most ad
lems efficien
order to mee that it is nwer-level jois sub-popula
Figure 6: Ra
nique amongers to identhe shape of t
es at any nobability that organizationonmental aspdividual emp
f HR practic
binations ofried out usindvanced glontly. This
make our poinot every typobs, so a leation.
ate tree depitenure b
g workforceify clearly atheir workfo
ode of the trean employe
n from Periopects enableployee behav
ces
f practices, ng the OptQuobal search p
enables the
int here.) Dpe of new e
ess costly on
cting retentibands, and jo
e planning sactionable drce of the fu
ee are used aee with the sod n to Perioe our simulavior over tim
recruitment uest Engine procedures t
e user to foc
Drilling dowemployee than-boarding
ion behaviorob level
solutions, endecisions anuture.
as retention set of attribuod n+1. Thation capabilme.
t budget allo(see www.Oto find the cus on eval
wn into Divat exhibits loprogram ma
r by division
nables decisnd investmen
probabilitieutes implied hus, these prlity as an ag
ocations, anOptTek.com)
best solutioluating a lim
vision “C” oow retentionay be neces
n,
sion makersnts, and eva
es in OptForcby the tree
robabilities agent-based m
nd environm). This algorons to simulmited numb
14
of the n, but ssary,
s and aluate
ce, to node
along model
mental rithm lation
ber of
15
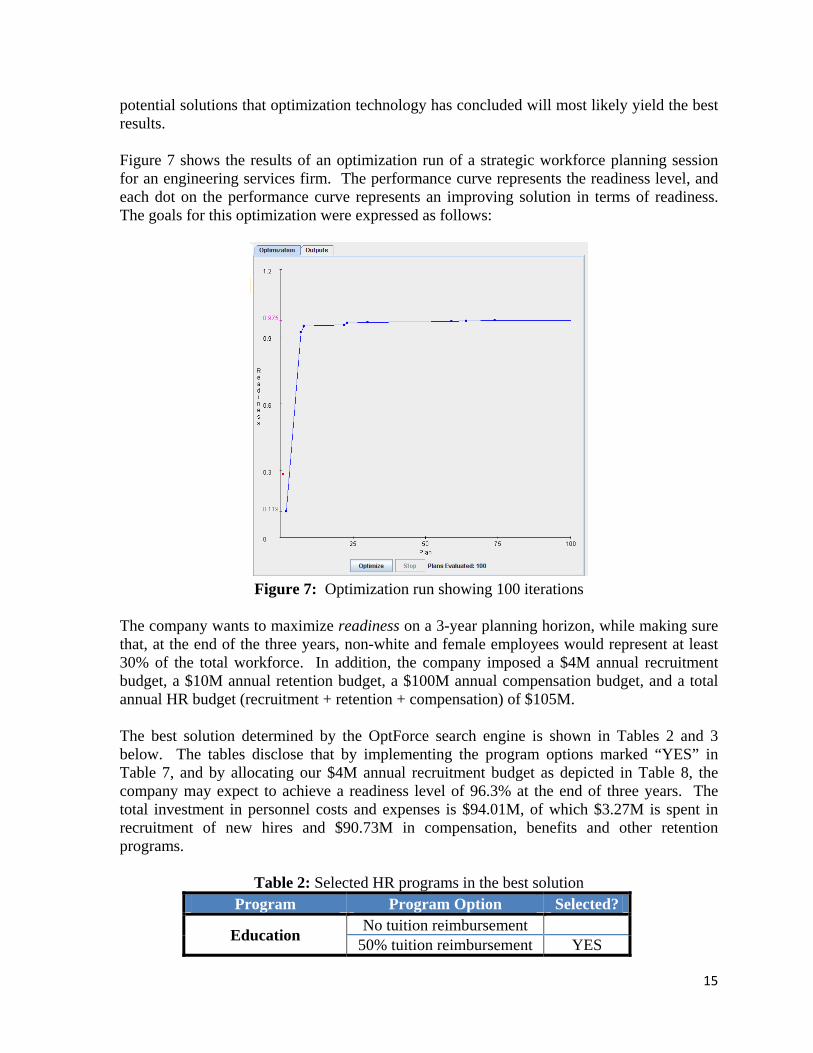
potential solutions that optimization technology has concluded will most likely yield the best results. Figure 7 shows the results of an optimization run of a strategic workforce planning session for an engineering services firm. The performance curve represents the readiness level, and each dot on the performance curve represents an improving solution in terms of readiness. The goals for this optimization were expressed as follows:
Figure 7: Optimization run showing 100 iterations
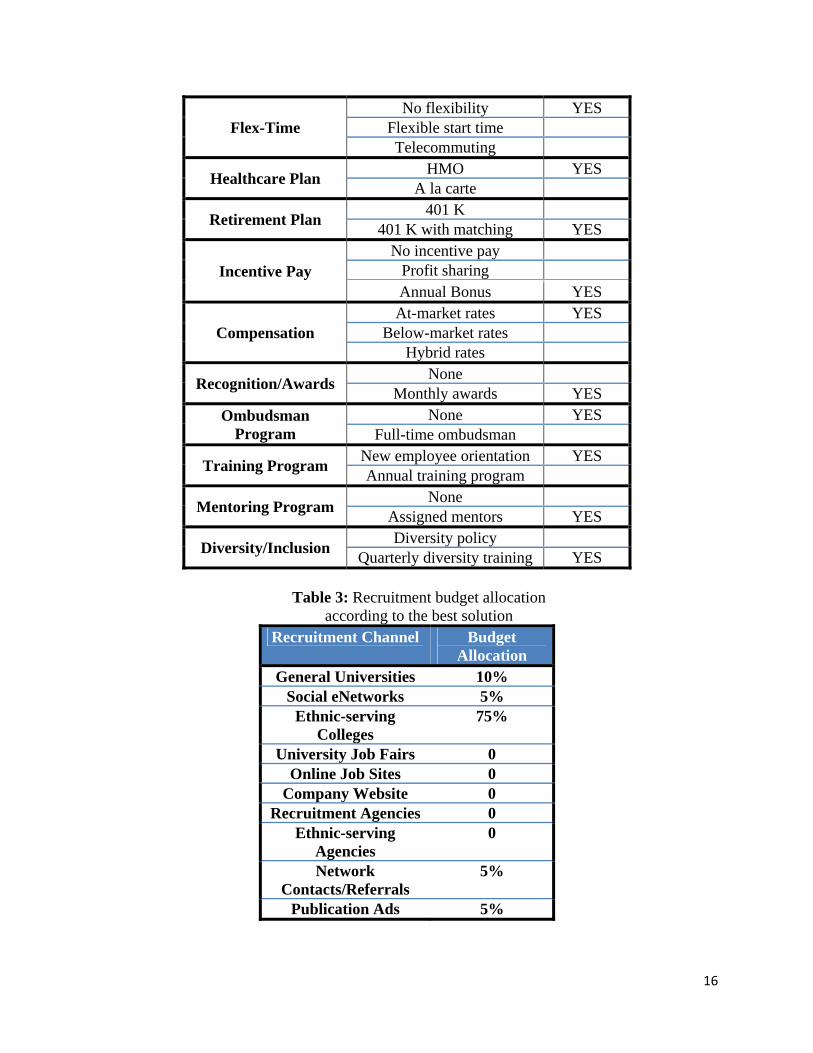
The company wants to maximize readiness on a 3-year planning horizon, while making sure that, at the end of the three years, non-white and female employees would represent at least 30% of the total workforce. In addition, the company imposed a $4M annual recruitment budget, a $10M annual retention budget, a $100M annual compensation budget, and a total annual HR budget (recruitment + retention + compensation) of $105M. The best solution determined by the OptForce search engine is shown in Tables 2 and 3 below. The tables disclose that by implementing the program options marked “YES” in Table 7, and by allocating our $4M annual recruitment budget as depicted in Table 8, the company may expect to achieve a readiness level of 96.3% at the end of three years. The total investment in personnel costs and expenses is $94.01M, of which $3.27M is spent in recruitment of new hires and $90.73M in compensation, benefits and other retention programs.
Table 2: Selected HR programs in the best solution
Program Program Option Selected?
Education No tuition reimbursement 50% tuition reimbursement YES
16
Flex-Time No flexibility YES
Flexible start time Telecommuting
Healthcare Plan HMO YES A la carte
Retirement Plan 401 K 401 K with matching YES
Incentive Pay No incentive pay
Profit sharing Annual Bonus YES
Compensation At-market rates YES
Below-market rates Hybrid rates
Recognition/Awards None Monthly awards YES
Ombudsman Program
None YES Full-time ombudsman
Training Program New employee orientation YES Annual training program
Mentoring Program None Assigned mentors YES
Diversity/Inclusion Diversity policy Quarterly diversity training YES
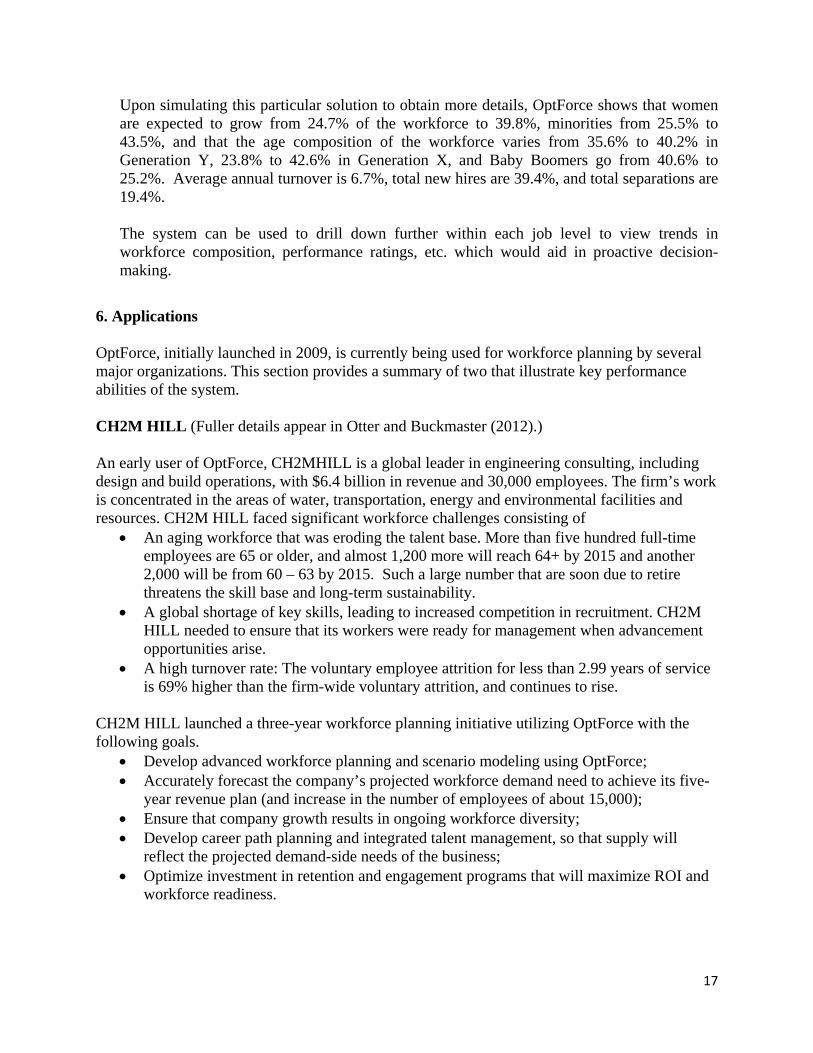
Table 3: Recruitment budget allocation
according to the best solution Recruitment Channel Budget
Allocation General Universities 10%
Social eNetworks 5% Ethnic-serving
Colleges 75%
University Job Fairs 0 Online Job Sites 0
Company Website 0 Recruitment Agencies 0
Ethnic-serving Agencies
0
Network Contacts/Referrals
5%
Publication Ads 5%
17
Upon simulating this particular solution to obtain more details, OptForce shows that women are expected to grow from 24.7% of the workforce to 39.8%, minorities from 25.5% to 43.5%, and that the age composition of the workforce varies from 35.6% to 40.2% in Generation Y, 23.8% to 42.6% in Generation X, and Baby Boomers go from 40.6% to 25.2%. Average annual turnover is 6.7%, total new hires are 39.4%, and total separations are 19.4%. The system can be used to drill down further within each job level to view trends in workforce composition, performance ratings, etc. which would aid in proactive decision-making.
6. Applications OptForce, initially launched in 2009, is currently being used for workforce planning by several major organizations. This section provides a summary of two that illustrate key performance abilities of the system. CH2M HILL (Fuller details appear in Otter and Buckmaster (2012).) An early user of OptForce, CH2MHILL is a global leader in engineering consulting, including design and build operations, with $6.4 billion in revenue and 30,000 employees. The firm’s work is concentrated in the areas of water, transportation, energy and environmental facilities and resources. CH2M HILL faced significant workforce challenges consisting of
• An aging workforce that was eroding the talent base. More than five hundred full-time employees are 65 or older, and almost 1,200 more will reach 64+ by 2015 and another 2,000 will be from 60 – 63 by 2015. Such a large number that are soon due to retire threatens the skill base and long-term sustainability.
• A global shortage of key skills, leading to increased competition in recruitment. CH2M HILL needed to ensure that its workers were ready for management when advancement opportunities arise.
• A high turnover rate: The voluntary employee attrition for less than 2.99 years of service is 69% higher than the firm-wide voluntary attrition, and continues to rise.
CH2M HILL launched a three-year workforce planning initiative utilizing OptForce with the following goals.
• Develop advanced workforce planning and scenario modeling using OptForce; • Accurately forecast the company’s projected workforce demand need to achieve its five-
year revenue plan (and increase in the number of employees of about 15,000); • Ensure that company growth results in ongoing workforce diversity; • Develop career path planning and integrated talent management, so that supply will
reflect the projected demand-side needs of the business; • Optimize investment in retention and engagement programs that will maximize ROI and
workforce readiness.
18
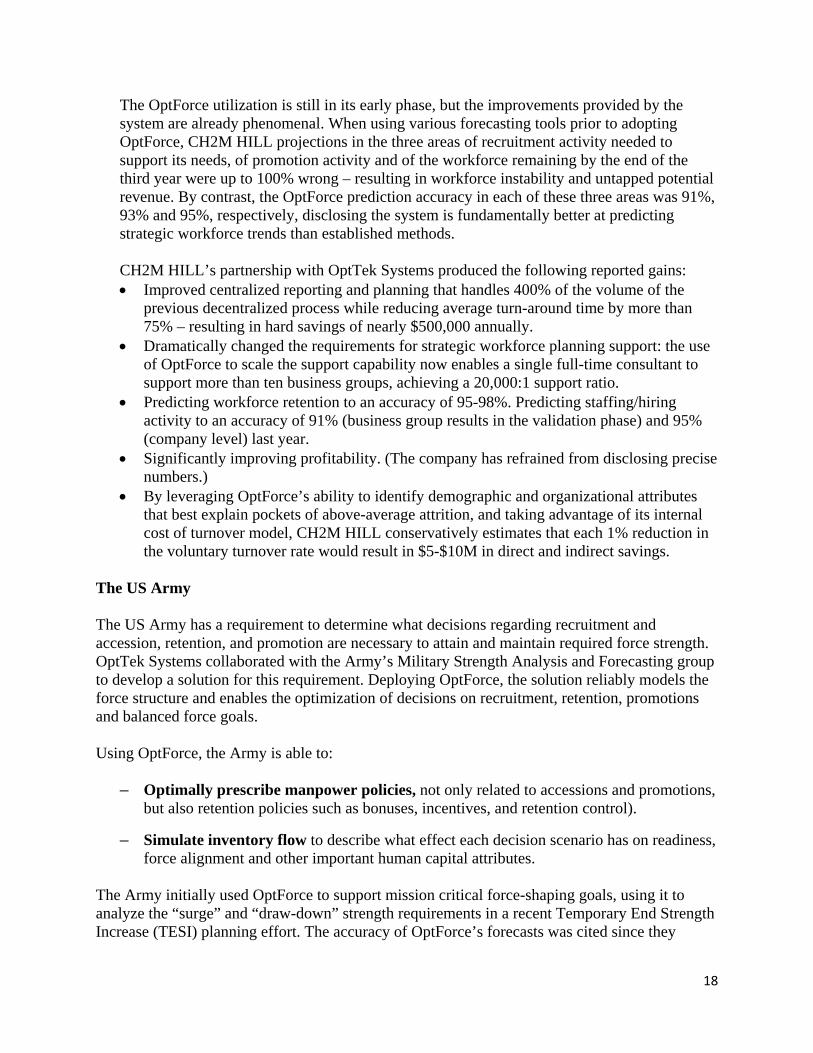
The OptForce utilization is still in its early phase, but the improvements provided by the system are already phenomenal. When using various forecasting tools prior to adopting OptForce, CH2M HILL projections in the three areas of recruitment activity needed to support its needs, of promotion activity and of the workforce remaining by the end of the third year were up to 100% wrong – resulting in workforce instability and untapped potential revenue. By contrast, the OptForce prediction accuracy in each of these three areas was 91%, 93% and 95%, respectively, disclosing the system is fundamentally better at predicting strategic workforce trends than established methods. CH2M HILL’s partnership with OptTek Systems produced the following reported gains: • Improved centralized reporting and planning that handles 400% of the volume of the
previous decentralized process while reducing average turn-around time by more than 75% – resulting in hard savings of nearly $500,000 annually.
• Dramatically changed the requirements for strategic workforce planning support: the use of OptForce to scale the support capability now enables a single full-time consultant to support more than ten business groups, achieving a 20,000:1 support ratio.
• Predicting workforce retention to an accuracy of 95-98%. Predicting staffing/hiring activity to an accuracy of 91% (business group results in the validation phase) and 95% (company level) last year.
• Significantly improving profitability. (The company has refrained from disclosing precise numbers.)
• By leveraging OptForce’s ability to identify demographic and organizational attributes that best explain pockets of above-average attrition, and taking advantage of its internal cost of turnover model, CH2M HILL conservatively estimates that each 1% reduction in the voluntary turnover rate would result in $5-$10M in direct and indirect savings.
The US Army
The US Army has a requirement to determine what decisions regarding recruitment and accession, retention, and promotion are necessary to attain and maintain required force strength. OptTek Systems collaborated with the Army’s Military Strength Analysis and Forecasting group to develop a solution for this requirement. Deploying OptForce, the solution reliably models the force structure and enables the optimization of decisions on recruitment, retention, promotions and balanced force goals.
Using OptForce, the Army is able to:
– Optimally prescribe manpower policies, not only related to accessions and promotions, but also retention policies such as bonuses, incentives, and retention control).
– Simulate inventory flow to describe what effect each decision scenario has on readiness, force alignment and other important human capital attributes.
The Army initially used OptForce to support mission critical force-shaping goals, using it to analyze the “surge” and “draw-down” strength requirements in a recent Temporary End Strength Increase (TESI) planning effort. The accuracy of OptForce’s forecasts was cited since they
19
estimated every 10,000 soldiers exceeding their target would result in one billion dollars over budget. The Army is working to identify funds to expand its use to other requirements including the National Guard and Reserve as well as share the software with other organizations including the Human Resources Command. 7. Summary and Conclusions:
OptForce represents a major leap in technology for strategic workforce planning. Its predictive capabilities for performing demand planning, retention forecasting, and agent-based simulation enables organizations to forecast human capital requirements such as headcount, skill sets, locations and timing over a range of business scenarios. The optimizing engine at the heart of these innovations provides a prescriptive capability designed to select the best set of investments in order to achieve workforce composition goals, such as maximizing readiness and achieving diversity targets under stated budget limitations. Continuing and new applications are on the horizon, both for the major players described in the preceding section and for others, including GE Energy, a 90,000 employee business in the GE family. OptTek also has begun developing pilot implementations at several public organizations including Southern Company, a $17B in revenue power generation company. OptTek is similarly developing pilots for several private firms including Newmont Mining, a 34,000 employee gold producing company, the Catholic Health Initiatives, a 68,000 employee health care provider and the US Navy’s OPNAV/N14, a line division that provides analysis, oversight and strategic planning. References: April, J., M. Better, F. Glover, J. Kelly and M. Laguna. 2006. Enhancing Business Process
Management with Simulation-Optimization. Proceedings of the 2006 Winter Simulations Conference, L.F. Perrone, F.P. Wieland, J.Liu, B.G. Lawson, D.M. Nicol, and R.M. Fujimoto, eds.
Better, M., F. Glover, M. Laguna. 2007. Advances in Analytics: Integrating Dynamic Data
Mining with Simulation Optimization. IBM Journal of Research and Development, Vol. 51, No. 3/4, pp. 477-487.
Better, M., F. Glover, G. Kochenberger, H. Wang. 2008. Simulation Optimization: Applications in Risk Management. International Journal of Information Technology & Decision Making, Vol. 7, No. 4, pp. 571-587.
Better. M., F. Glover and M. Samorani. 2010. Classification by Vertical and Cutting Multi-
Hyperplane Decision Tree Induction. Decision Support Systems 48, pp. 430-436.
20
Glover, F., D. Klingman, N. Phillips. 1992. Network Models in Optimization and their
Applications in Practice. Wiley Interscience, John Wiley and Sons, Boston, 284 p.
Glover, F., M. Laguna. 1997. Tabu Search. Kluwer Academic Publishers. 382 pp.
Glover, F., M. Laguna, R. Marti. 2000. Fundamentals of Scatter Search and Path Relinking. Control and Cybernetics, volume 29, number 3, pp. 653-684.
CLC Solutions. 2002. Customizing the Employment Offer. CLC Solutions Corporate Leadership Council, Washington, D.C.
Mercer. 2006. Global Business Challenges Survey. Retrieved June 6, 2008,
www.worldatwork.org. National Center for Employment Statistics, Department of Labor, www.nces.gov. Otter, T., Buckmaster, M. 2012. Global Engineering Firm Uses Strategic Workforce Planning to
Build a Sustainable and Better Workforce. Gartner, Inc., Case Study 08.06.2012. Talent Watch. 2011. Uncovering the Realities for the Next Economy. Bersin & Associates. Watson Wyatt. 2008. Advanced Workforce Planning: Securing the Future. Human Capital
Institute. Webcast: November 20, 2008.