Embed Size (px)
Citation preview
STRATEGIC
UPDATEDelivering
sustainable value
Neal Froneman
Chief Executive Officer
28 July 2016
Disclaimer
The information in this presentation may include forward-looking statements, which are based on current expectations and
projections about future events. These statements may include, without limitation, any statements preceded by, followed by or
including words such as “target,” “expect,” “may,” “anticipate,” “estimate,” “will,” and other words and terms of similar
meaning or the negative thereof. These forward-looking statements, as well as those included in any other material discussed
at the meeting, are subject to risks, uncertainties and assumptions, including, among other things, the development of
Sibanye’s business, general economic conditions and actions of regulators. In light of these risks, uncertainties and
assumptions, the events in the forward-looking statements may not occur. No representation or warranty is made that any
forward-looking statement will come to pass and no reliance should be placed on any forward-looking statement. No one
undertakes to publicly update or revise any such forward-looking statement.
2
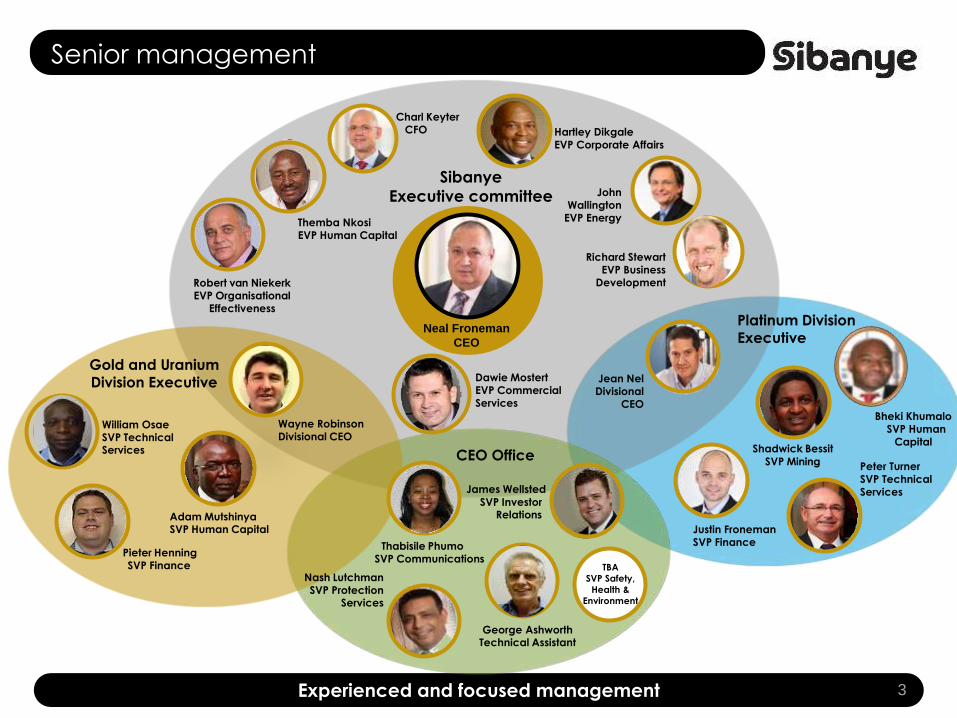
Senior management
3Experienced and focused management
Sibanye
Executive committee
Charl KeyterCFO
Dawie MostertEVP Commercial Services
Robert van NiekerkEVP Organisational
Effectiveness
Richard StewartEVP Business
Development
Hartley DikgaleEVP Corporate Affairs
Jean NelDivisional
CEO
Themba NkosiEVP Human Capital
John Wallington
EVP Energy
Wayne RobinsonDivisional CEO
Neal Froneman
CEO
Platinum Division Executive
Justin FronemanSVP Finance
Shadwick Bessit
SVP Mining Peter TurnerSVP Technical Services
Gold and Uranium
Division Executive
Pieter HenningSVP Finance
Adam MutshinyaSVP Human Capital
William OsaeSVP Technical Services
George AshworthTechnical Assistant
Thabisile PhumoSVP Communications
CEO Office
TBA
SVP Safety,
Health &
Environment
James Wellsted
SVP Investor Relations
Nash LutchmanSVP Protection
Services
Bheki KhumaloSVP Human
Capital
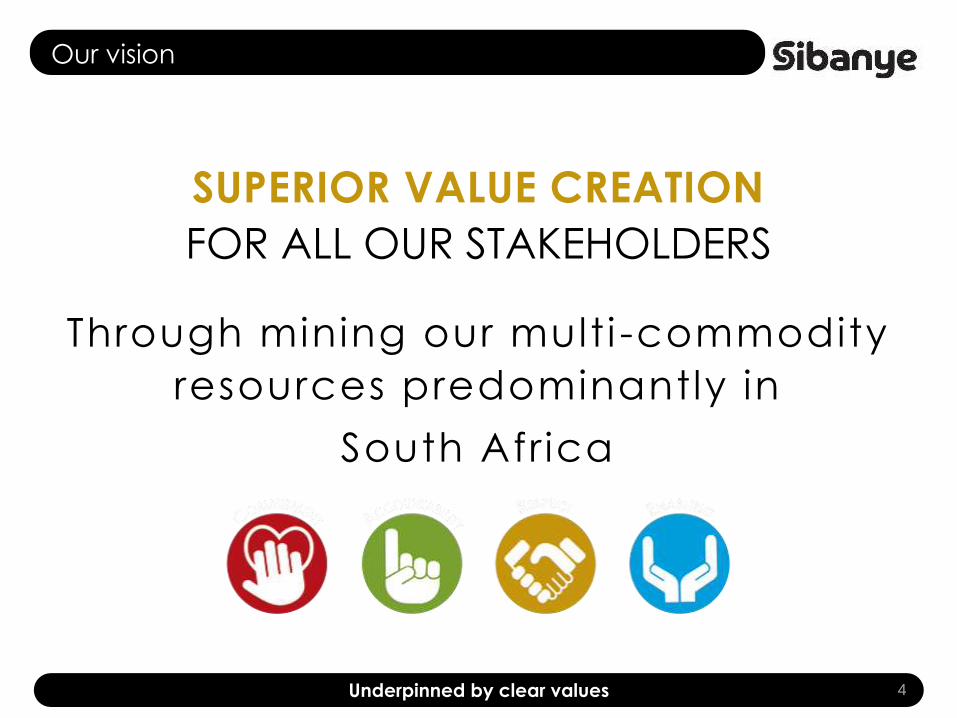
Our vision
SUPERIOR VALUE CREATION
FOR ALL OUR STAKEHOLDERS
Through mining our mult i -commodity
resources predominantly in
South Afr ica
4Underpinned by clear values
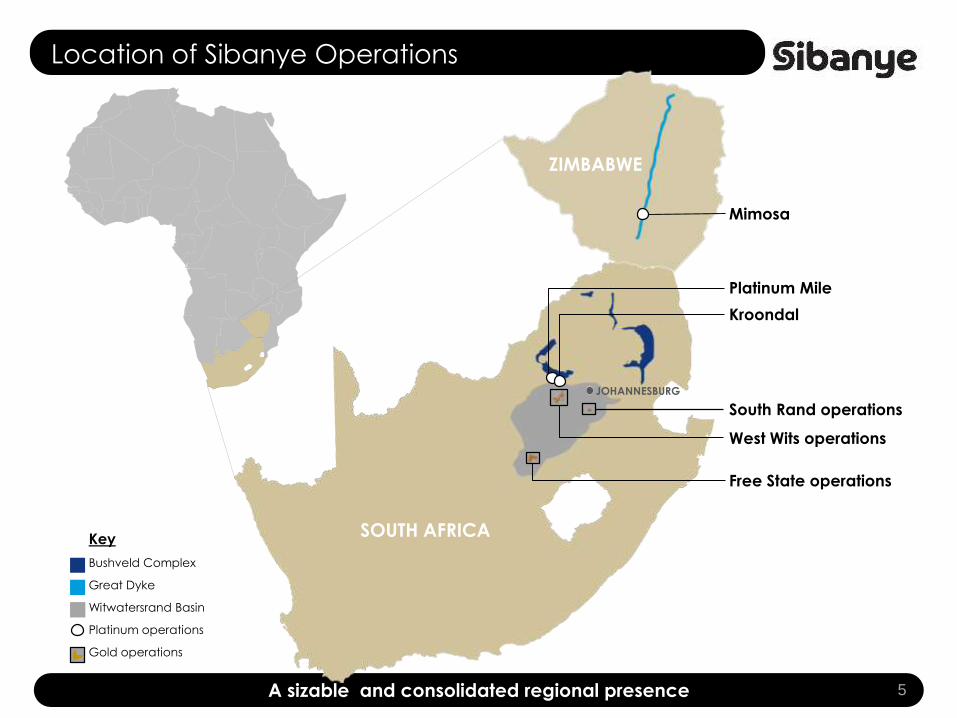
Location of Sibanye Operations
5A sizable and consolidated regional presence
Mimosa
Platinum Mile
Kroondal
SOUTH AFRICA
ZIMBABWE
JOHANNESBURG
Free State operations
West Wits operations
South Rand operations
Key
Bushveld Complex
Great Dyke
Witwatersrand Basin
Platinum operations
Gold operations
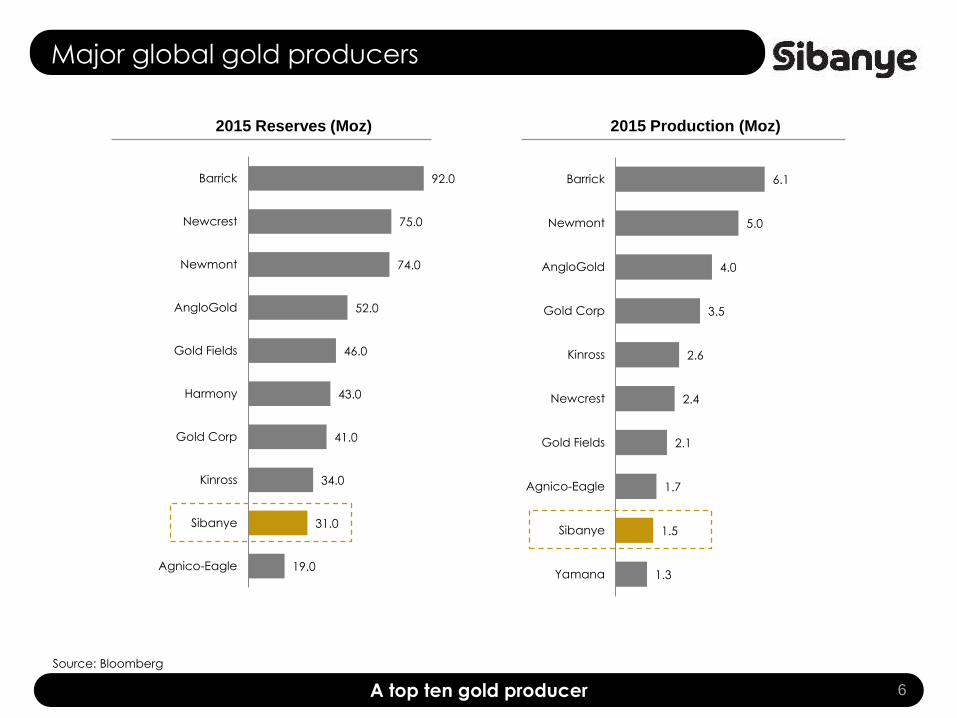
Major global gold producers
6A top ten gold producer
Source: Bloomberg
2015 Reserves (Moz) 2015 Production (Moz)
19.0
31.0
34.0
41.0
43.0
46.0
52.0
74.0
75.0
92.0
Agnico-Eagle
Sibanye
Kinross
Gold Corp
Harmony
Gold Fields
AngloGold
Newmont
Newcrest
Barrick
1.3
1.5
1.7
2.1
2.4
2.6
3.5
4.0
5.0
6.1
Yamana
Sibanye
Agnico-Eagle
Gold Fields
Newcrest
Kinross
Gold Corp
AngloGold
Newmont
Barrick
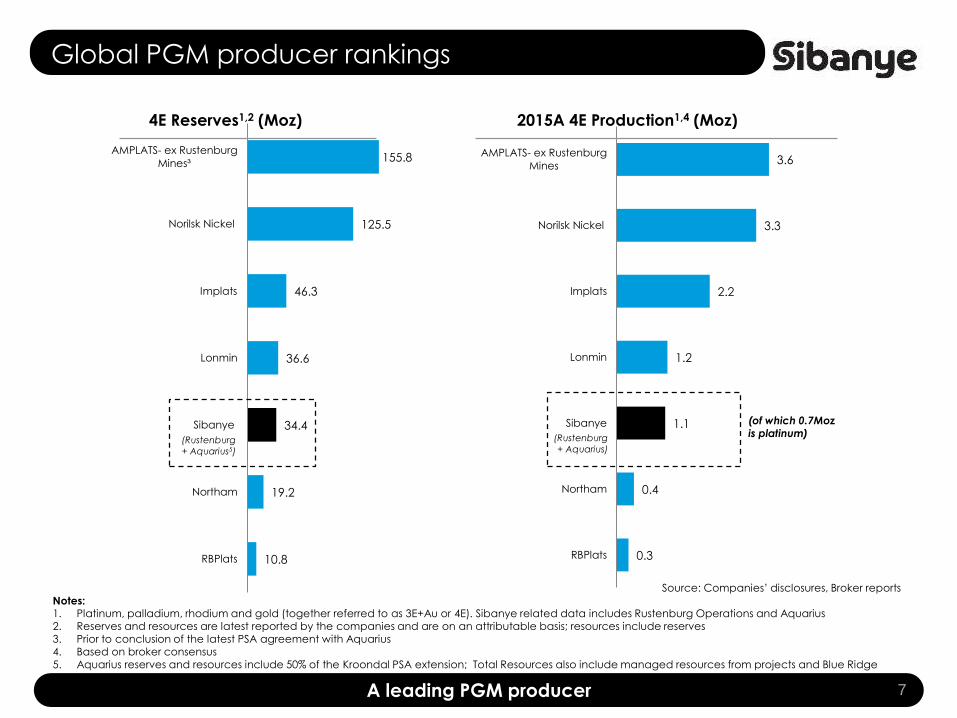
Global PGM producer rankings
7A leading PGM producer
0.3
0.4
1.1
1.2
2.2
3.3
3.6
RBPlats
Northam
Sibanye
Lonmin
Implats
Norilsk Nickel
AMPLATS- ex Rustenburg
Mines
10.8
19.2
34.4
36.6
46.3
125.5
155.8
RBPlats
Northam
Sibanye
Lonmin
Implats
Norilsk Nickel
AMPLATS- ex Rustenburg
Mines³
Implats
4E Reserves1,2 (Moz) 2015A 4E Production1,4 (Moz)
(of which 0.7Mozis platinum)
(Rustenburg
+ Aquarius5)
(Rustenburg
+ Aquarius)
Source: Companies’ disclosures, Broker reports
Notes:1. Platinum, palladium, rhodium and gold (together referred to as 3E+Au or 4E). Sibanye related data includes Rustenburg Operations and Aquarius2. Reserves and resources are latest reported by the companies and are on an attributable basis; resources include reserves3. Prior to conclusion of the latest PSA agreement with Aquarius4. Based on broker consensus5. Aquarius reserves and resources include 50% of the Kroondal PSA extension; Total Resources also include managed resources from projects and Blue Ridge
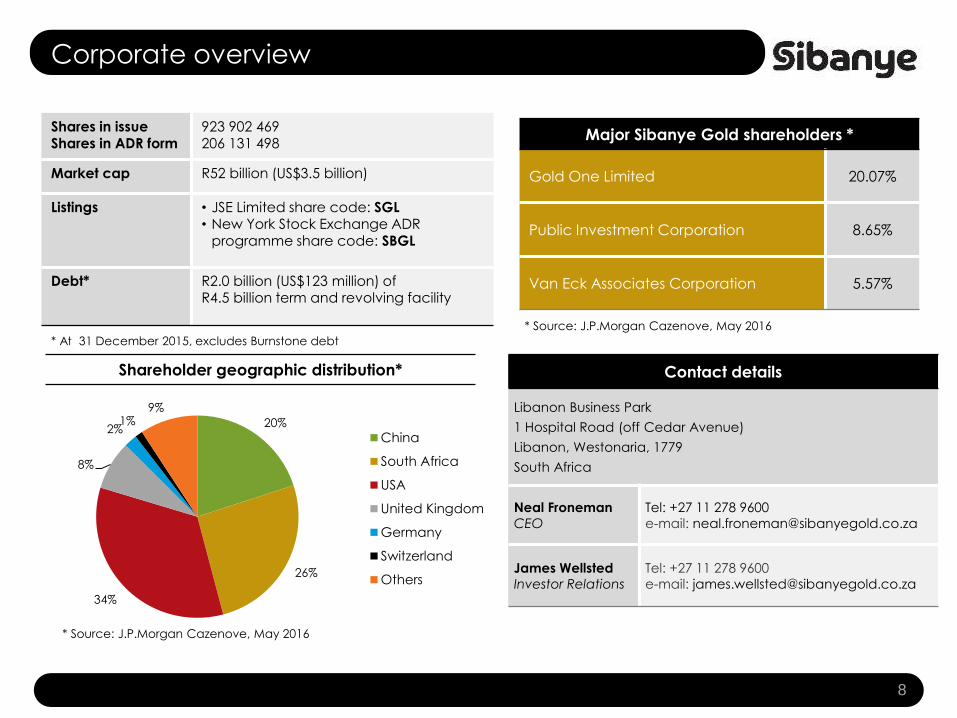
Corporate overview
8
Shares in issueShares in ADR form
923 902 469206 131 498
Market cap R52 billion (US$3.5 billion)
Listings • JSE Limited share code: SGL • New York Stock Exchange ADR
programme share code: SBGL
Debt* R2.0 billion (US$123 million) of R4.5 billion term and revolving facility
Major Sibanye Gold shareholders *
Gold One Limited 20.07%
Public Investment Corporation 8.65%
Van Eck Associates Corporation 5.57%
Contact details
Libanon Business Park
1 Hospital Road (off Cedar Avenue)
Libanon, Westonaria, 1779
South Africa
Neal Froneman
CEO
Tel: +27 11 278 9600
e-mail: [email protected]
James Wellsted
Investor Relations
Tel: +27 11 278 9600
e-mail: [email protected]
* Source: J.P.Morgan Cazenove, May 2016
* At 31 December 2015, excludes Burnstone debt
20%
26%
34%
8%
2%1%
9%
China
South Africa
USA
United Kingdom
Germany
Switzerland
Others
* Source: J.P.Morgan Cazenove, May 2016
Shareholder geographic distribution*
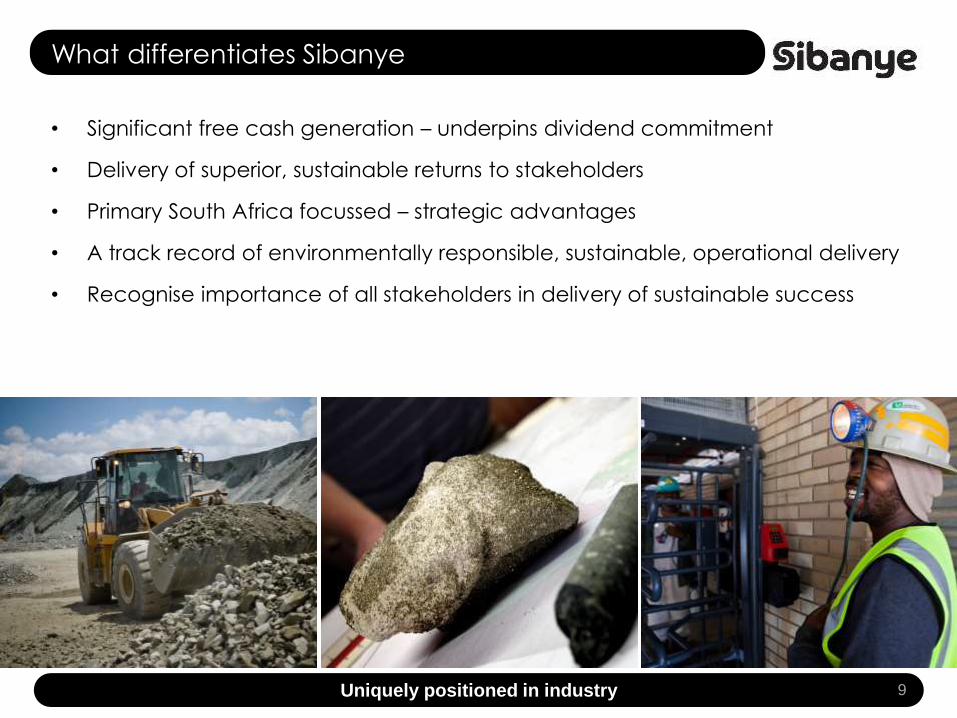
What differentiates Sibanye
• Significant free cash generation – underpins dividend commitment
• Delivery of superior, sustainable returns to stakeholders
• Primary South Africa focussed – strategic advantages
• A track record of environmentally responsible, sustainable, operational delivery
• Recognise importance of all stakeholders in delivery of sustainable success
9Uniquely positioned in industry
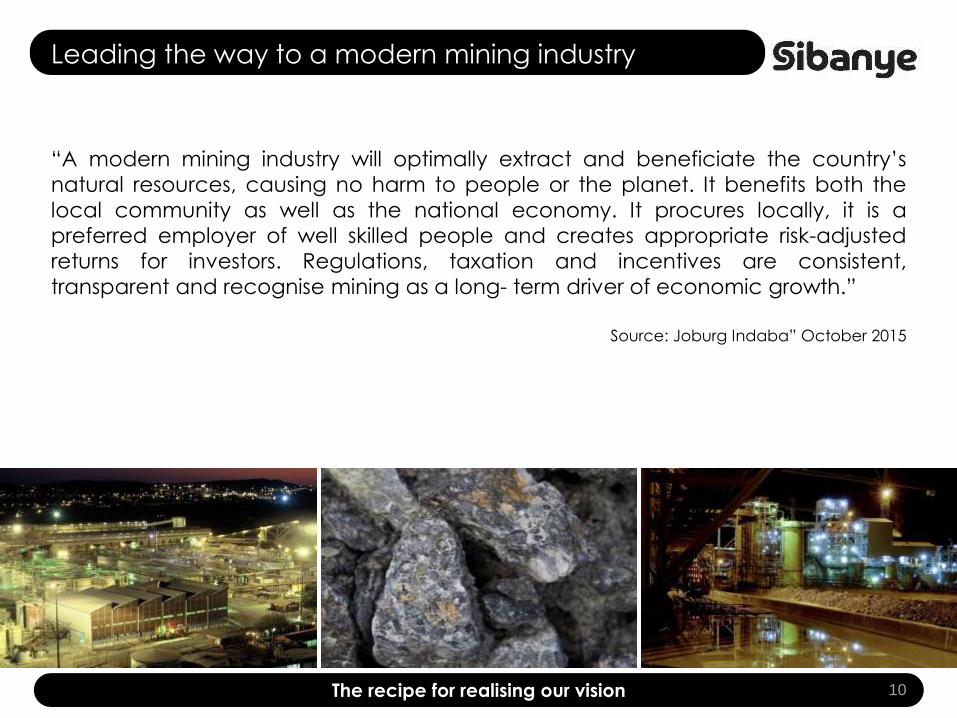
Leading the way to a modern mining industry
“A modern mining industry will optimally extract and beneficiate the country’s
natural resources, causing no harm to people or the planet. It benefits both the
local community as well as the national economy. It procures locally, it is a
preferred employer of well skilled people and creates appropriate risk-adjusted
returns for investors. Regulations, taxation and incentives are consistent,
transparent and recognise mining as a long- term driver of economic growth.”
Source: Joburg Indaba” October 2015
10The recipe for realising our vision
A track record
of delivery
What we inherited on unbundling
• A strong safety culture with a good safety record
• Large, high-grade resources but relatively small reserves
• Well-maintained assets
• A declining production profile
• Unacceptably high costs
• Sub-optimal operational effectiveness:
– inefficient organisational structures
– a service function too large for sustainable operational requirements
• Opportunity to extend the operating life and enhance cash flow by:
– reducing costs
– increasing operational efficiency and productivity
12The 'Good, the Bad and the Ugly'
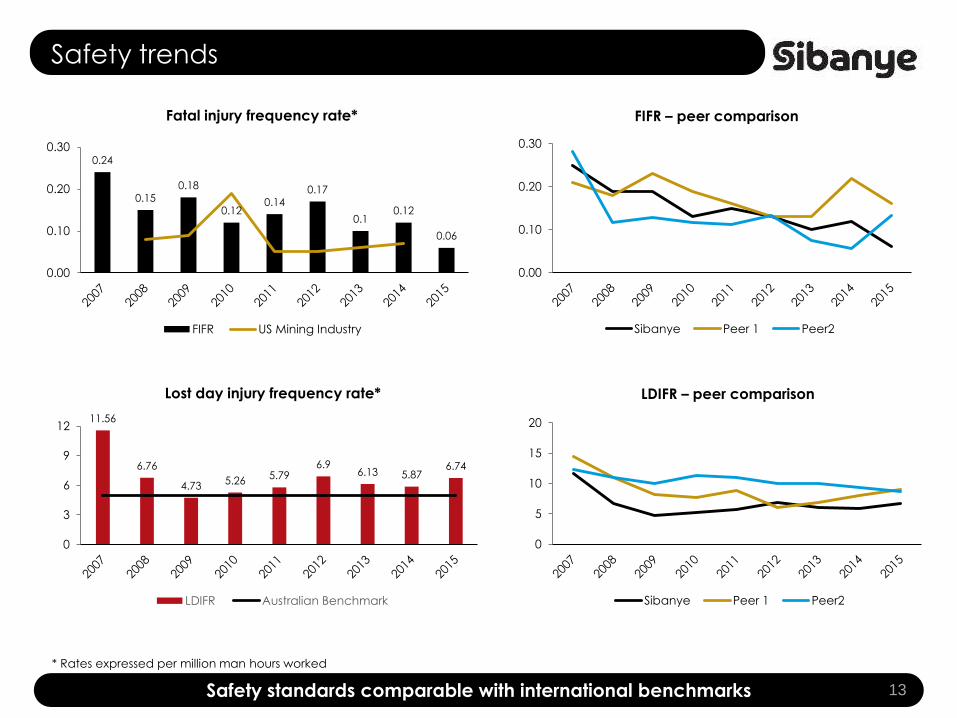
Safety trends
13Safety standards comparable with international benchmarks
0.24
0.150.18
0.120.14
0.17
0.10.12
0.06
0.00
0.10
0.20
0.30
Fatal injury frequency rate*
FIFR US Mining Industry
0.00
0.10
0.20
0.30
FIFR – peer comparison
Sibanye Peer 1 Peer2
11.56
6.76
4.735.26
5.796.9
6.13 5.876.74
0
3
6
9
12
Lost day injury frequency rate*
LDIFR Australian Benchmark
* Rates expressed per million man hours worked
0
5
10
15
20
LDIFR – peer comparison
Sibanye Peer 1 Peer2
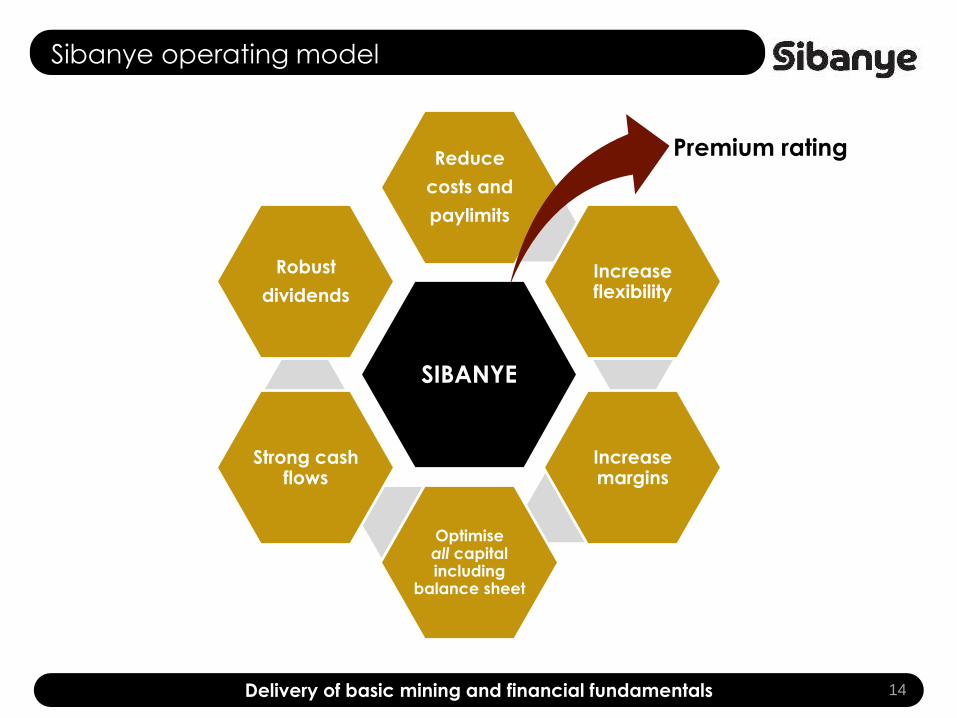
Sibanye operating model
14Delivery of basic mining and financial fundamentals
SIBANYE
Reduce
costs and
paylimits
Increase flexibility
Increase margins
Optimise all capital including
balance sheet
Strong cash flows
Robust
dividends
Premium rating
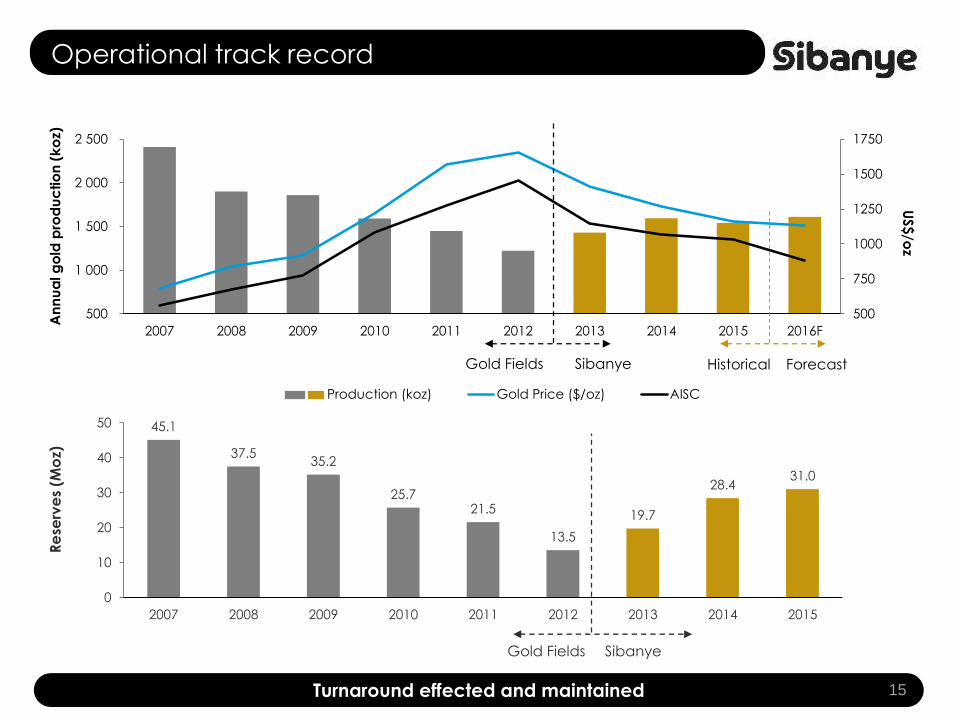
45.1
37.535.2
25.721.5
13.5
19.7
28.431.0
0
10
20
30
40
50
2007 2008 2009 2010 2011 2012 2013 2014 2015
Gold Fields Sibanye
Re
serv
es
(Mo
z)Operational track record
15Turnaround effected and maintained
500
750
1000
1250
1500
1750
500
1 000
1 500
2 000
2 500
2007 2008 2009 2010 2011 2012 2013 2014 2015 2016F
Production (koz) Gold Price ($/oz) AISC
An
nu
al g
old
pro
du
ctio
n (
ko
z)U
S$/o
z
Historical ForecastGold Fields Sibanye
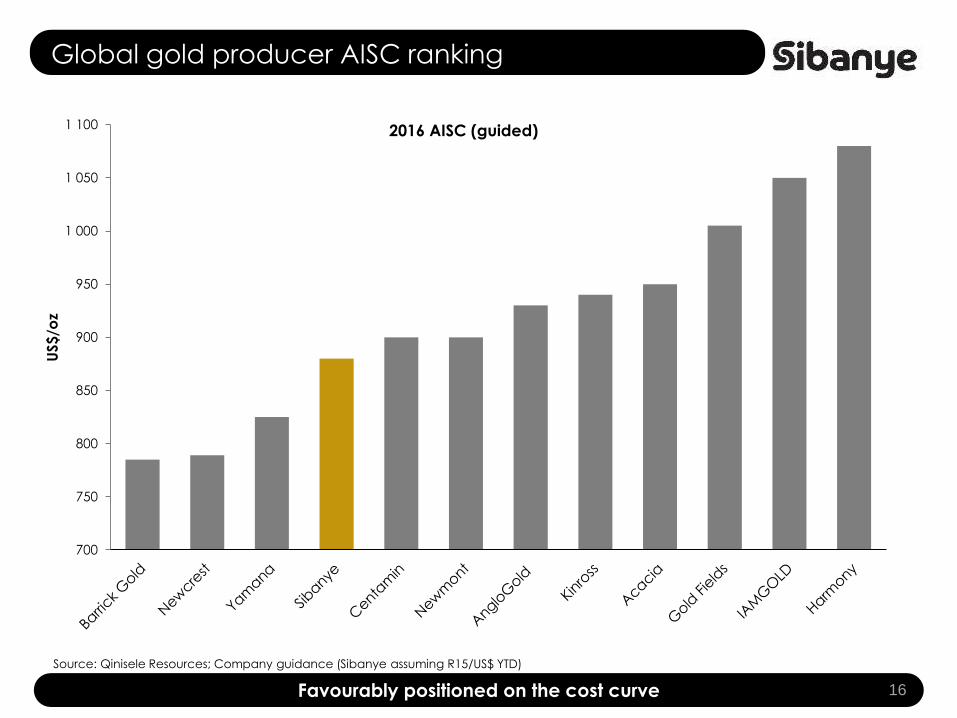
Global gold producer AISC ranking
16Favourably positioned on the cost curve
700
750
800
850
900
950
1 000
1 050
1 100
US$
/oz
2016 AISC (guided)
Source: Qinisele Resources; Company guidance (Sibanye assuming R15/US$ YTD)
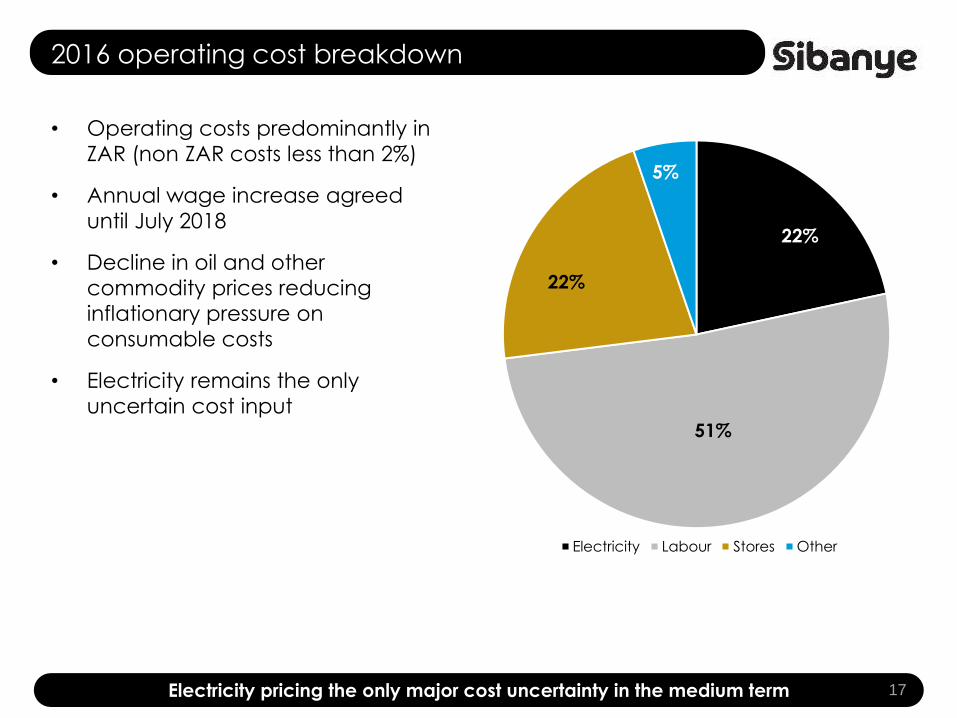
2016 operating cost breakdown
• Operating costs predominantly in
ZAR (non ZAR costs less than 2%)
• Annual wage increase agreed
until July 2018
• Decline in oil and other
commodity prices reducing
inflationary pressure on
consumable costs
• Electricity remains the only
uncertain cost input
17Electricity pricing the only major cost uncertainty in the medium term
22%
51%
22%
5%
Electricity Labour Stores Other
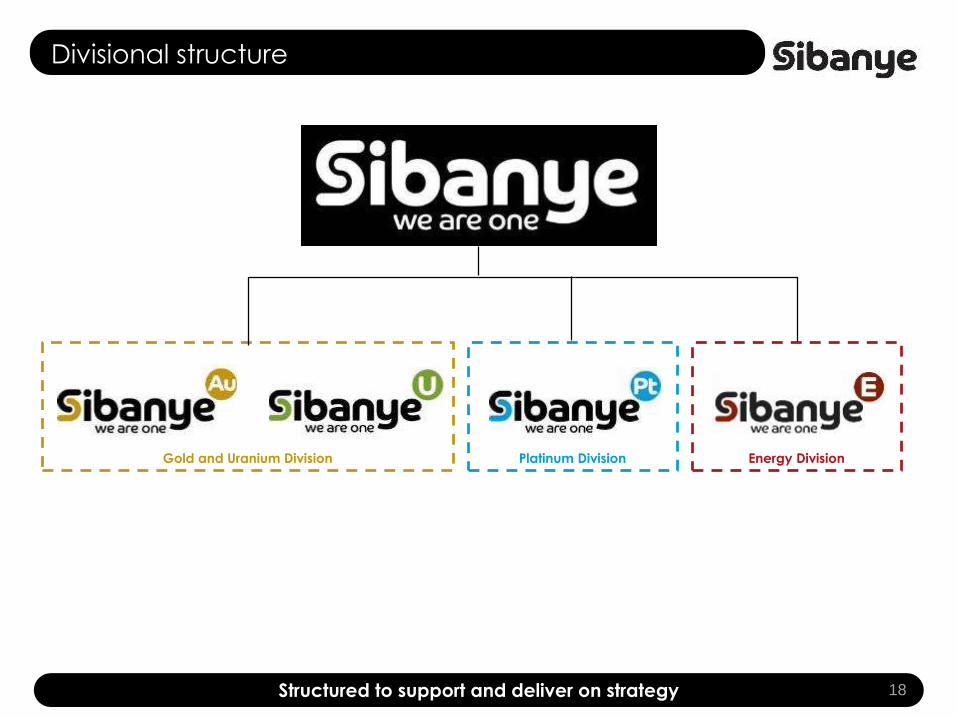
Divisional structure
18Structured to support and deliver on strategy
Gold and Uranium Division Platinum Division Energy Division
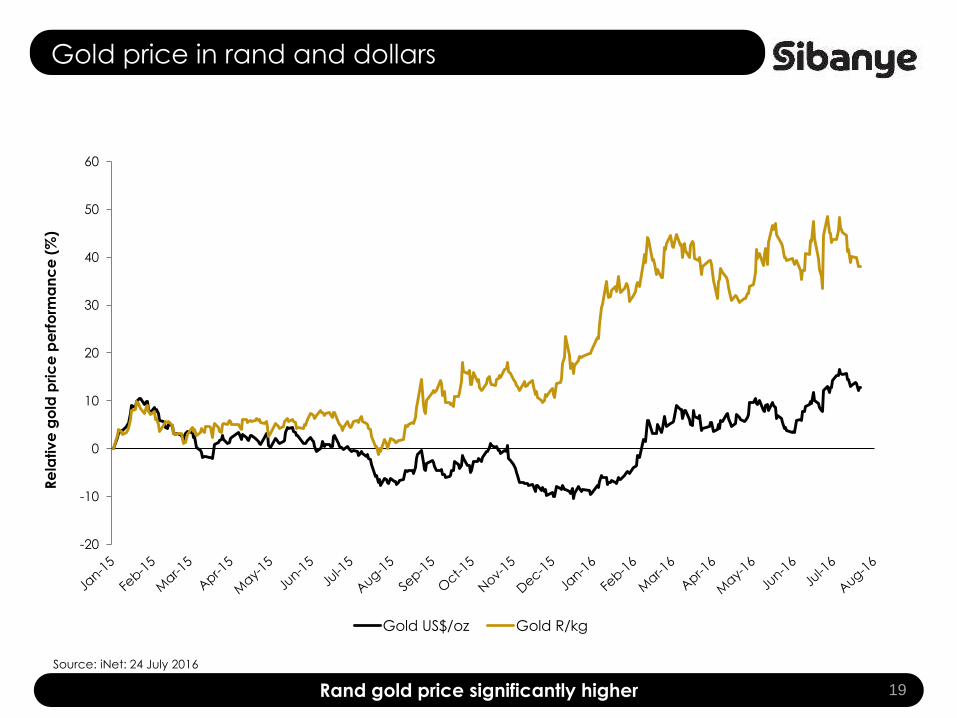
Gold price in rand and dollars
19Rand gold price significantly higher
Source: iNet: 24 July 2016
-20
-10
0
10
20
30
40
50
60
Re
lativ
e g
old
pric
e p
erf
orm
an
ce
(%
)
Gold US$/oz Gold R/kg
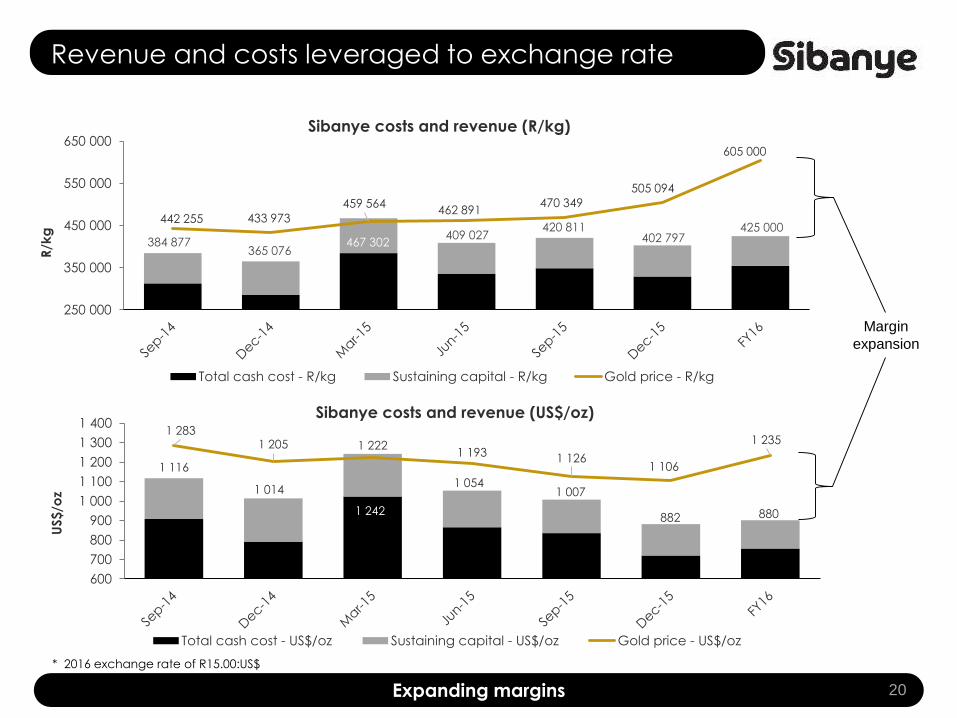
1 2831 205 1 222
1 193 1 1261 106
1 235
600
700
800
900
1 000
1 100
1 200
1 300
1 400
US$/o
z
Sibanye costs and revenue (US$/oz)
Total cash cost - US$/oz Sustaining capital - US$/oz Gold price - US$/oz
1 116
1 014
1 242
1 0541 007
882 880
Revenue and costs leveraged to exchange rate
20Expanding margins
* 2016 exchange rate of R15.00:US$
442 255 433 973
459 564462 891
470 349
505 094
605 000
250 000
350 000
450 000
550 000
650 000
R/k
g
Sibanye costs and revenue (R/kg)
Total cash cost - R/kg Sustaining capital - R/kg Gold price - R/kg
384 877365 076
467 302409 027
420 811402 797
425 000
Margin
expansion
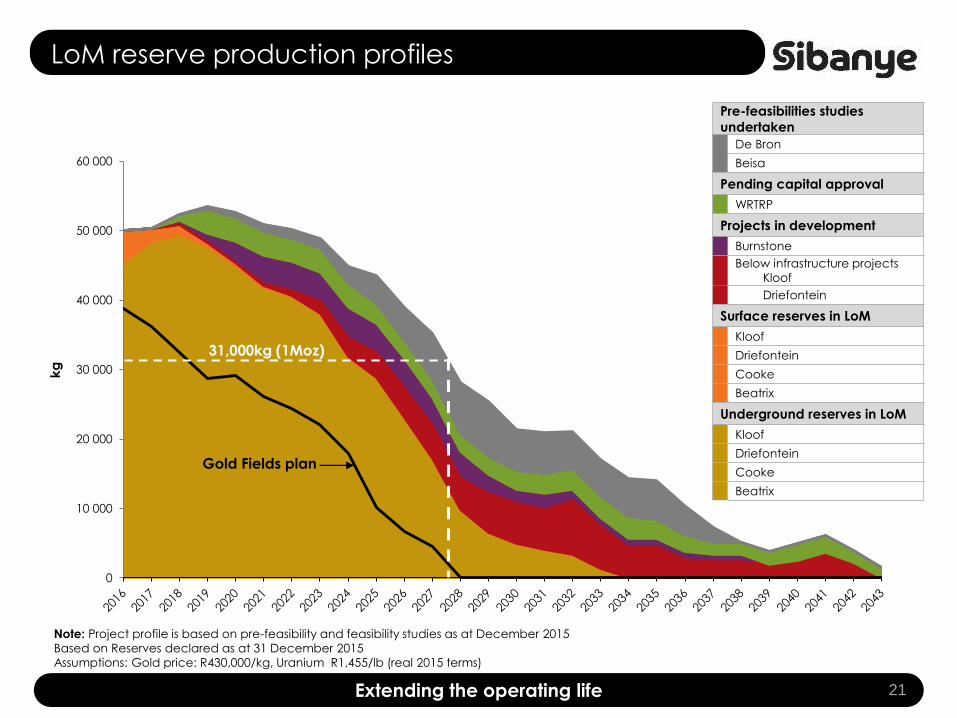
LoM reserve production profiles
21Extending the operating life
0
10 000
20 000
30 000
40 000
50 000
60 000
kg
Pre-feasibilities studies
undertaken
De Bron
Beisa
Pending capital approval
WRTRP
Projects in development
Burnstone
Below infrastructure projects
Kloof
Driefontein
Surface reserves in LoM
Kloof
Driefontein
Cooke
Beatrix
Underground reserves in LoM
Kloof
Driefontein
Cooke
Beatrix
Note: Project profile is based on pre-feasibility and feasibility studies as at December 2015
Based on Reserves declared as at 31 December 2015
Assumptions: Gold price: R430,000/kg, Uranium R1,455/lb (real 2015 terms)
Gold Fields plan
31,000kg (1Moz)
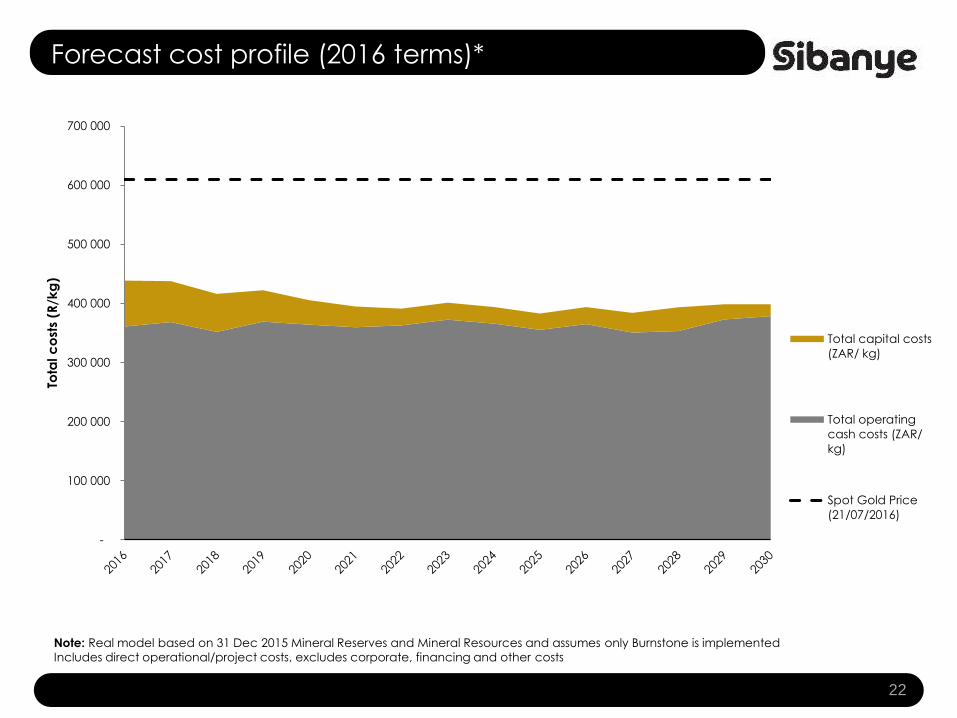
Forecast cost profile (2016 terms)*
22
-
100 000
200 000
300 000
400 000
500 000
600 000
700 000
Tota
l c
ost
s (R
/kg
)
Total capital costs
(ZAR/ kg)
Total operating
cash costs (ZAR/
kg)
Spot Gold Price
(21/07/2016)
Note: Real model based on 31 Dec 2015 Mineral Reserves and Mineral Resources and assumes only Burnstone is implemented
Includes direct operational/project costs, excludes corporate, financing and other costs
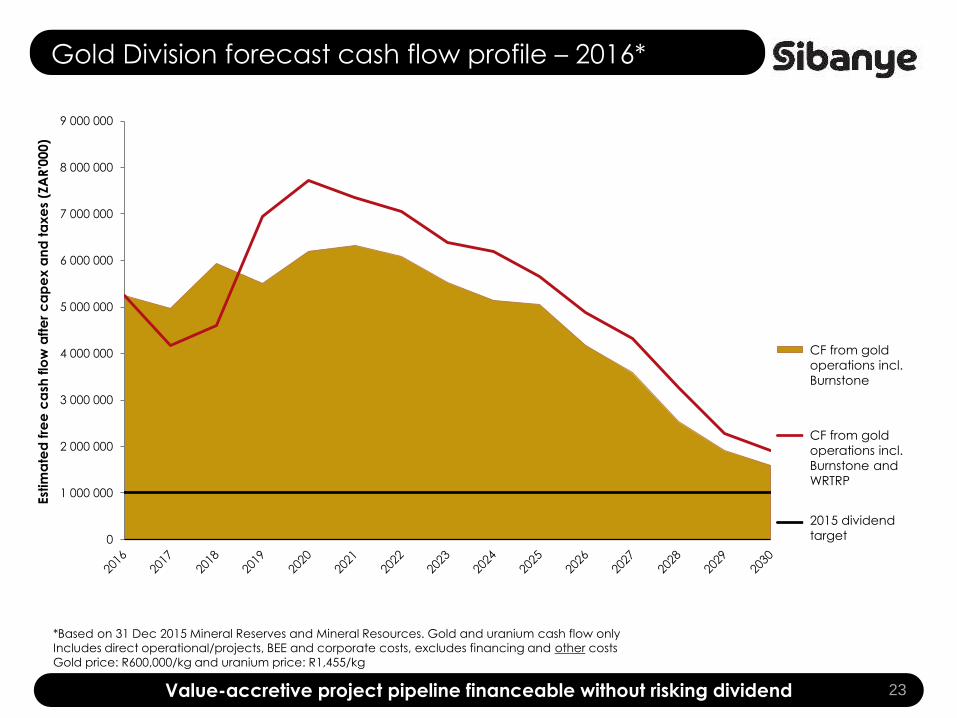
Gold Division forecast cash flow profile – 2016*
23Value-accretive project pipeline financeable without risking dividend
0
1 000 000
2 000 000
3 000 000
4 000 000
5 000 000
6 000 000
7 000 000
8 000 000
9 000 000
Est
ima
ted
fre
e c
ash
flo
w a
fte
r c
ap
ex a
nd
ta
xe
s (Z
AR
'000)
Operations including
Burnstone
Operations including
Burnstone and WRTRP
2015 Gross Dividend
*Based on 31 Dec 2015 Mineral Reserves and Mineral Resources. Gold and uranium cash flow only
Includes direct operational/projects, BEE and corporate costs, excludes financing and other costs
Gold price: R600,000/kg and uranium price: R1,455/kg
CF from gold
operations incl.
Burnstone
CF from gold
operations incl.
Burnstone and
WRTRP
2015 dividend
target
Delivering
value to all
stakeholders
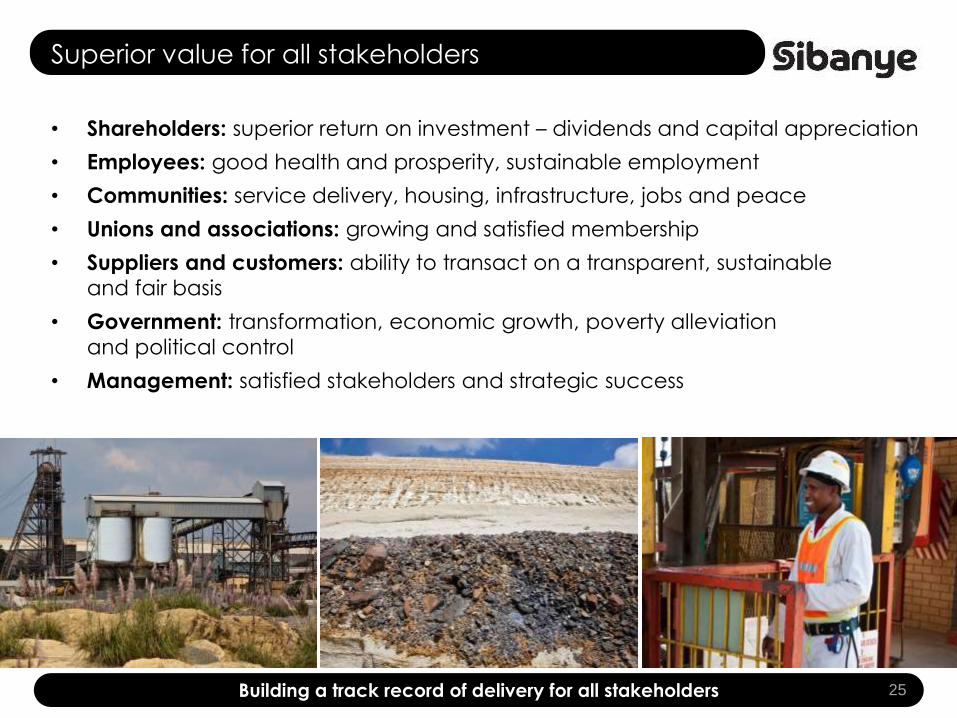
Superior value for all stakeholders
• Shareholders: superior return on investment – dividends and capital appreciation
• Employees: good health and prosperity, sustainable employment
• Communities: service delivery, housing, infrastructure, jobs and peace
• Unions and associations: growing and satisfied membership
• Suppliers and customers: ability to transact on a transparent, sustainable and fair basis
• Government: transformation, economic growth, poverty alleviation and political control
• Management: satisfied stakeholders and strategic success
25Building a track record of delivery for all stakeholders
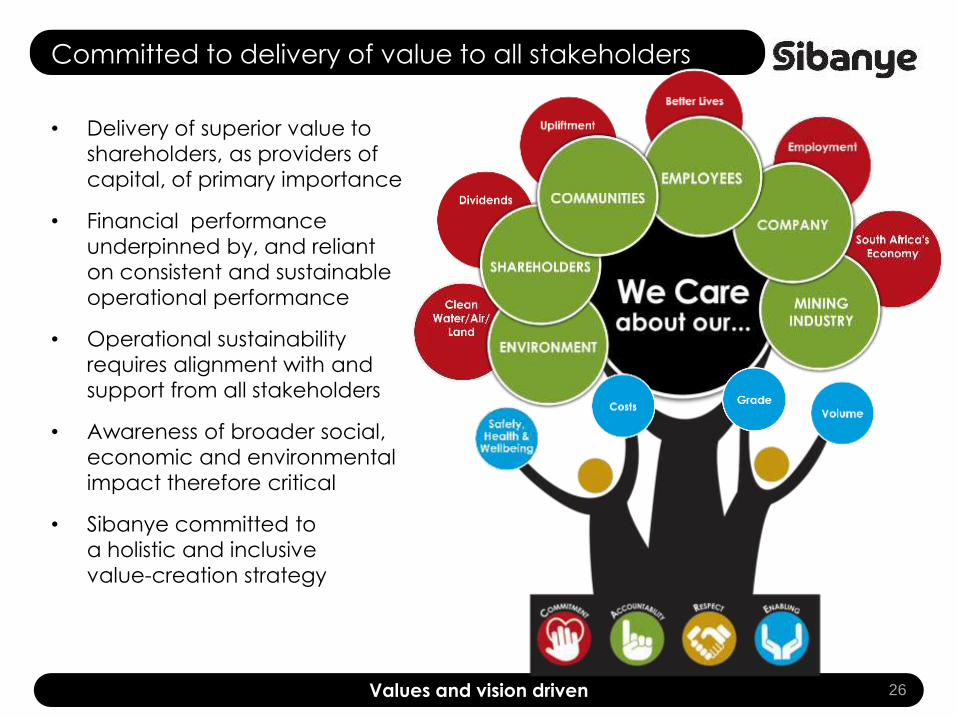
Committed to delivery of value to all stakeholders
• Delivery of superior value to
shareholders, as providers of
capital, of primary importance
• Financial performance
underpinned by, and reliant
on consistent and sustainable
operational performance
• Operational sustainability
requires alignment with and
support from all stakeholders
• Awareness of broader social,
economic and environmental
impact therefore critical
• Sibanye committed to
a holistic and inclusive
value-creation strategy
26Values and vision driven
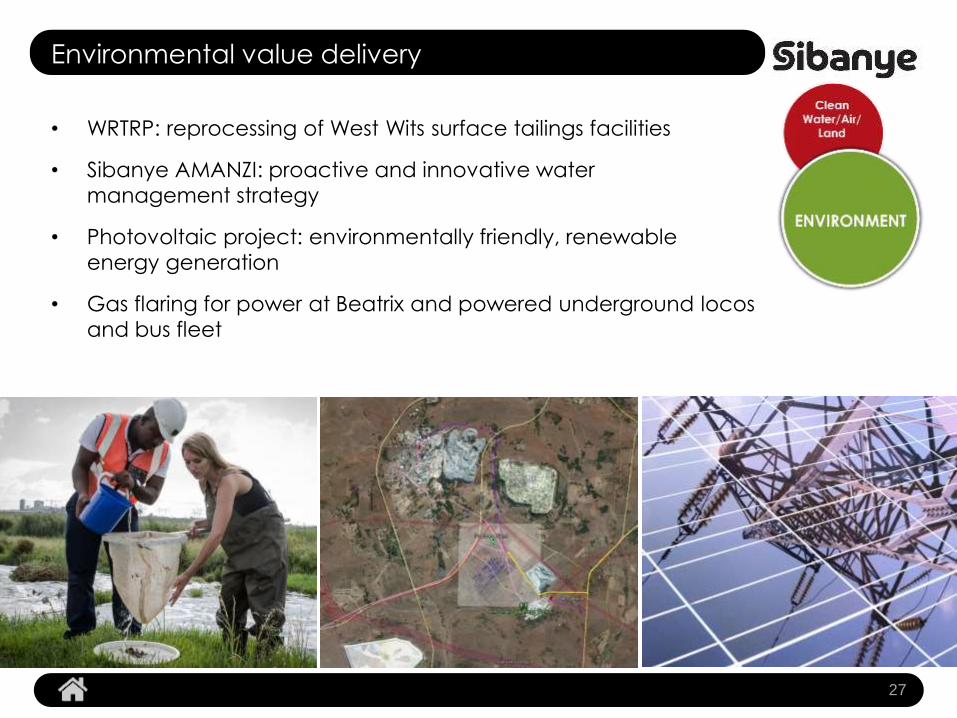
Environmental value delivery
• WRTRP: reprocessing of West Wits surface tailings facilities
• Sibanye AMANZI: proactive and innovative water
management strategy
• Photovoltaic project: environmentally friendly, renewable
energy generation
• Gas flaring for power at Beatrix and powered underground locos
and bus fleet
27
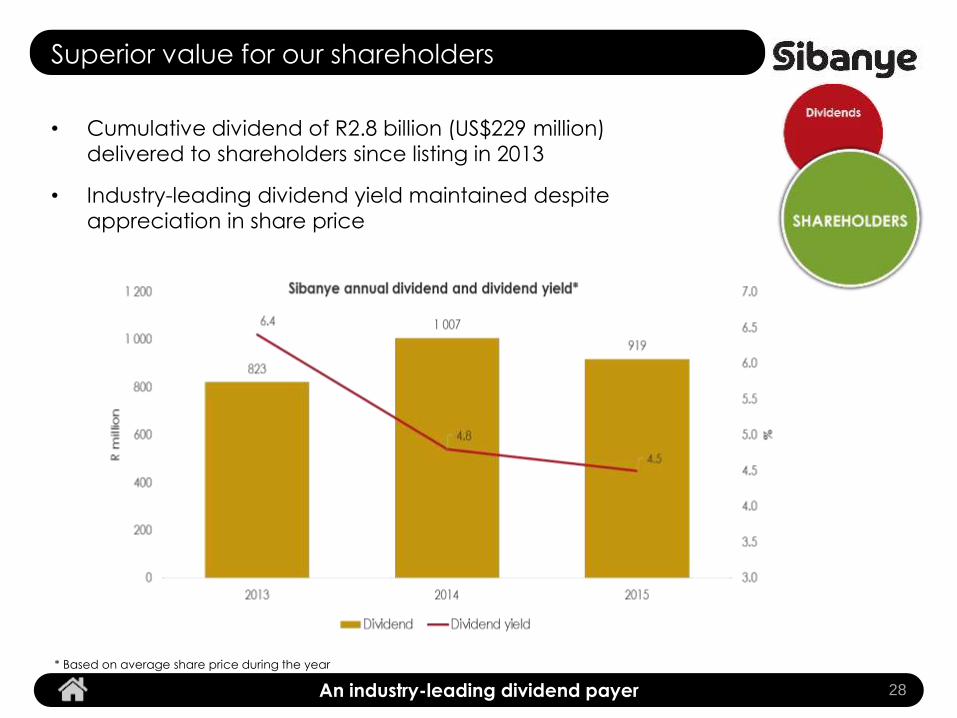
Superior value for our shareholders
• Cumulative dividend of R2.8 billion (US$229 million)
delivered to shareholders since listing in 2013
• Industry-leading dividend yield maintained despite
appreciation in share price
28An industry-leading dividend payer
* Based on average share price during the year
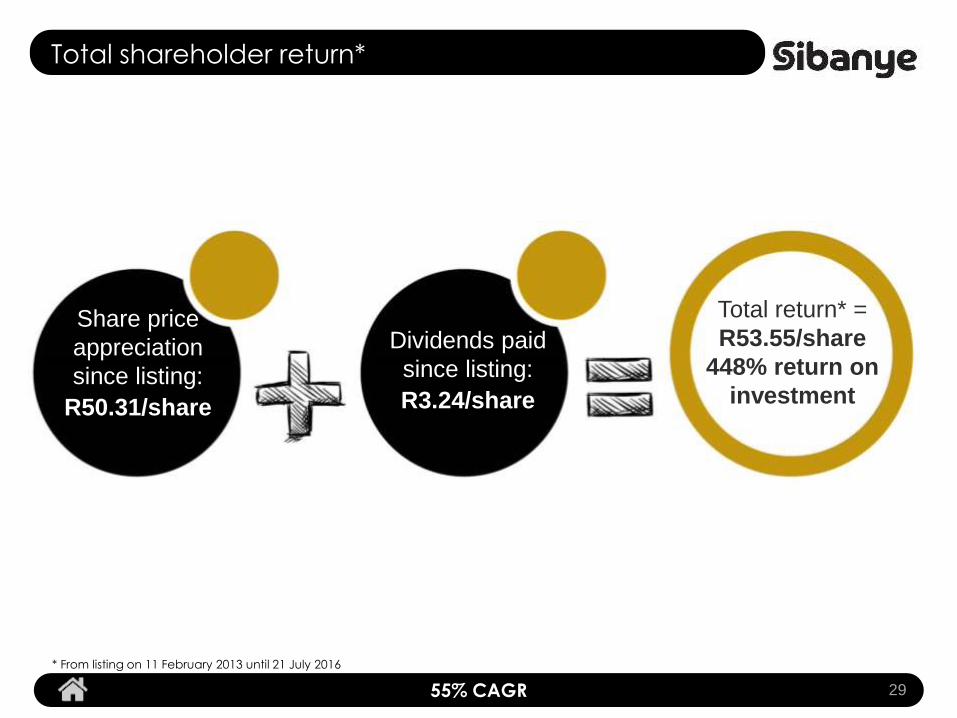
Total shareholder return*
2955% CAGR
* From listing on 11 February 2013 until 21 July 2016
Share price
appreciation
since listing:
R50.31/share
Dividends paid
since listing:
R3.24/share
Total return* =
R53.55/share
448% return on
investment
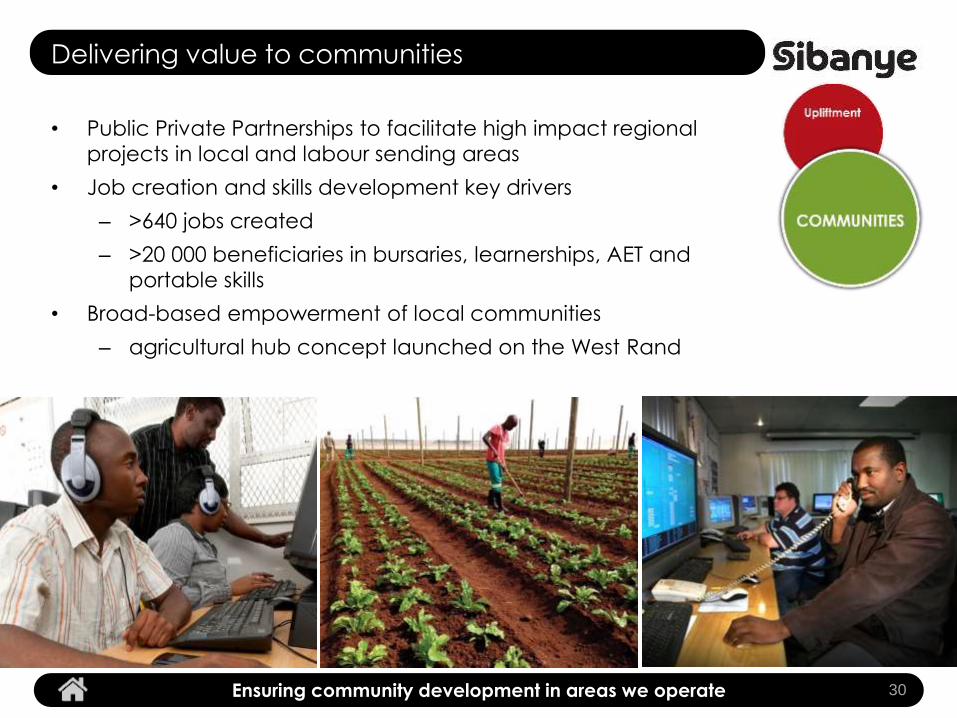
Delivering value to communities
• Public Private Partnerships to facilitate high impact regional
projects in local and labour sending areas
• Job creation and skills development key drivers
– >640 jobs created
– >20 000 beneficiaries in bursaries, learnerships, AET and
portable skills
• Broad-based empowerment of local communities
– agricultural hub concept launched on the West Rand
30Ensuring community development in areas we operate
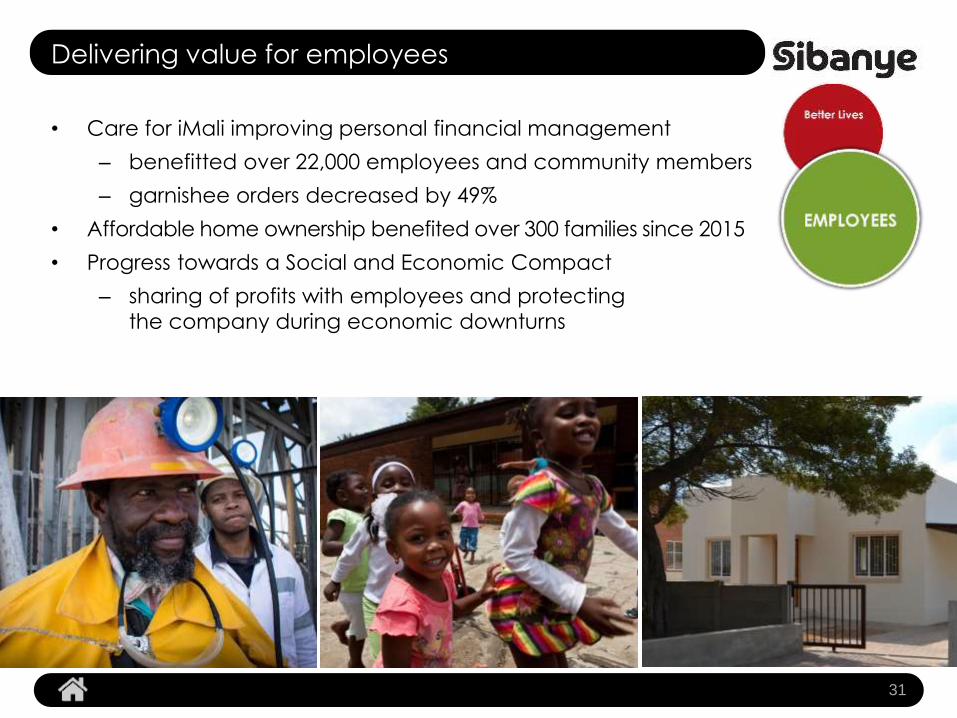
Delivering value for employees
• Care for iMali improving personal financial management
– benefitted over 22,000 employees and community members
– garnishee orders decreased by 49%
• Affordable home ownership benefited over 300 families since 2015
• Progress towards a Social and Economic Compact
– sharing of profits with employees and protecting
the company during economic downturns
31
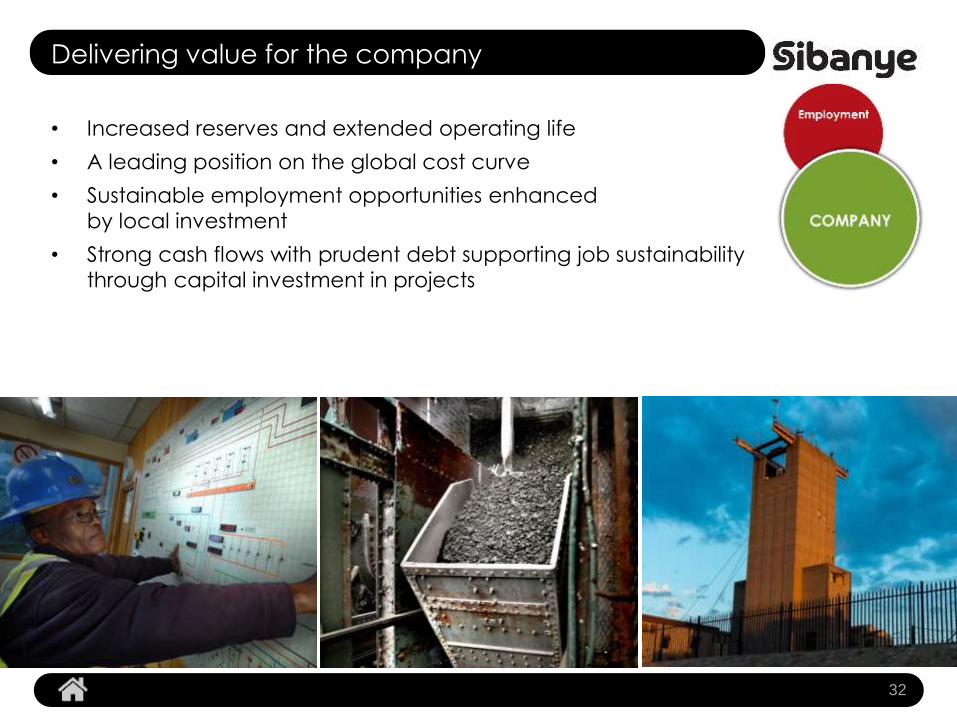
Delivering value for the company
• Increased reserves and extended operating life
• A leading position on the global cost curve
• Sustainable employment opportunities enhanced
by local investment
• Strong cash flows with prudent debt supporting job sustainability
through capital investment in projects
32
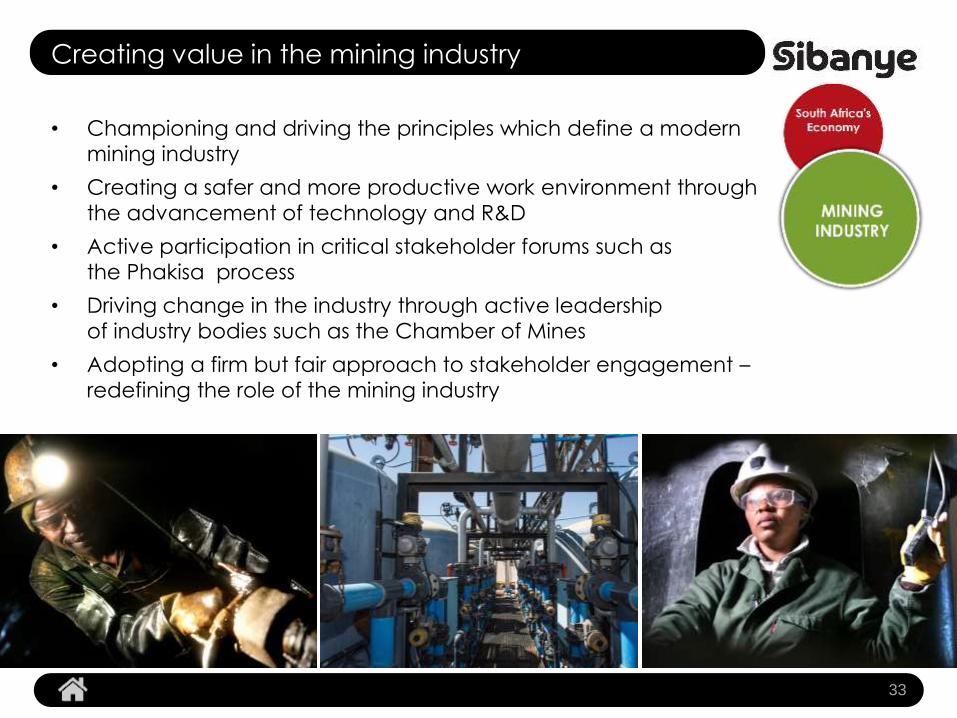
Creating value in the mining industry
• Championing and driving the principles which define a modern
mining industry
• Creating a safer and more productive work environment through
the advancement of technology and R&D
• Active participation in critical stakeholder forums such as
the Phakisa process
• Driving change in the industry through active leadership
of industry bodies such as the Chamber of Mines
• Adopting a firm but fair approach to stakeholder engagement –
redefining the role of the mining industry
33

Value creation
strategy
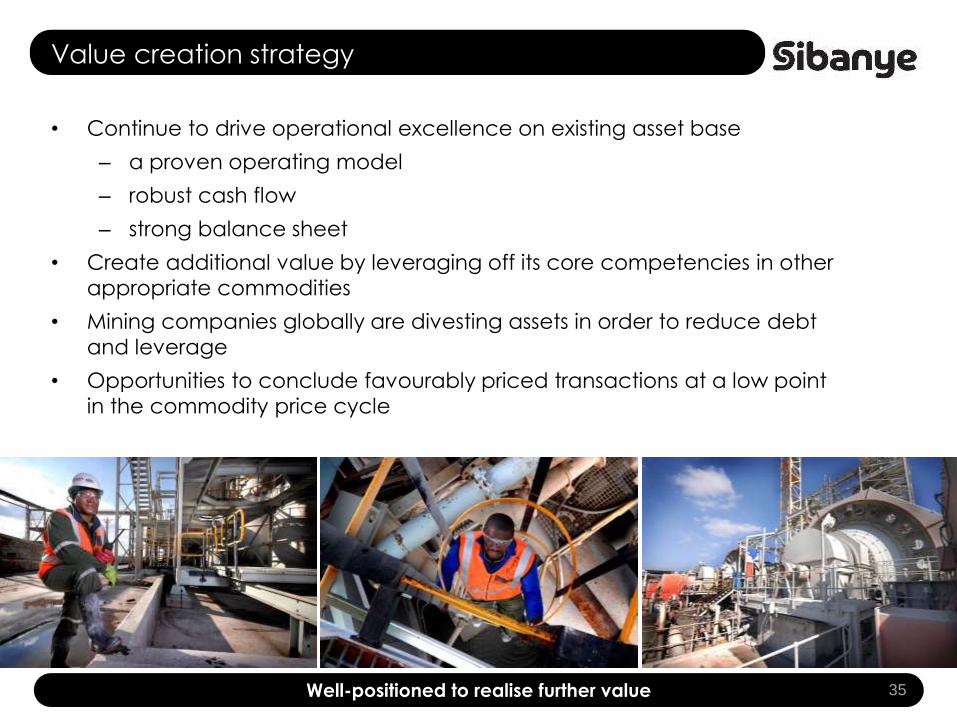
Value creation strategy
• Continue to drive operational excellence on existing asset base
– a proven operating model
– robust cash flow
– strong balance sheet
• Create additional value by leveraging off its core competencies in other
appropriate commodities
• Mining companies globally are divesting assets in order to reduce debt
and leverage
• Opportunities to conclude favourably priced transactions at a low point
in the commodity price cycle
35Well-positioned to realise further value
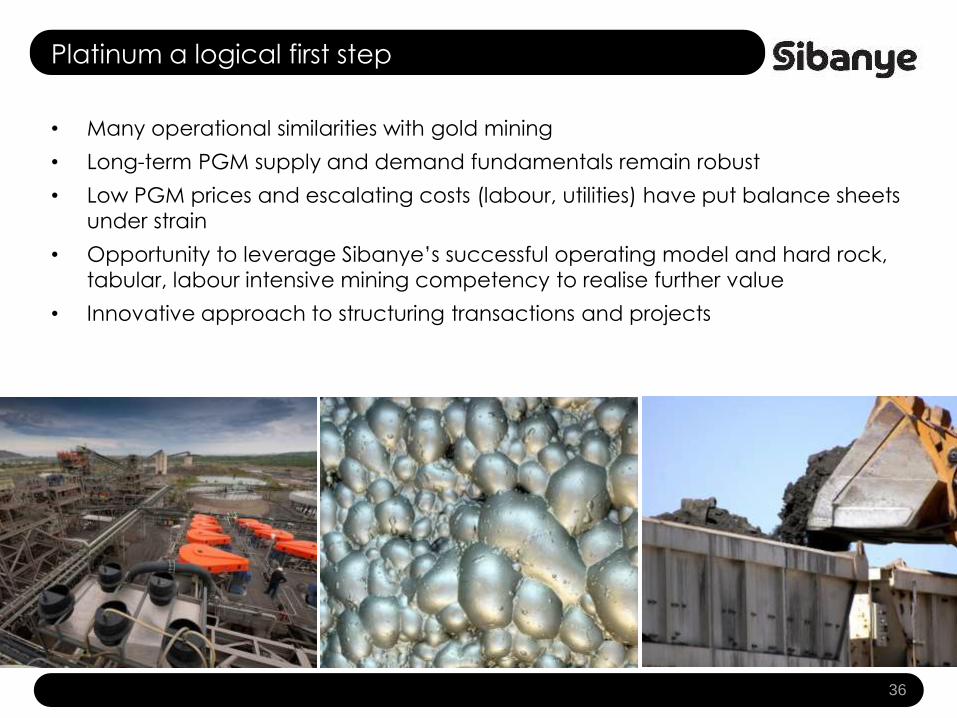
Platinum a logical first step
• Many operational similarities with gold mining
• Long-term PGM supply and demand fundamentals remain robust
• Low PGM prices and escalating costs (labour, utilities) have put balance sheets
under strain
• Opportunity to leverage Sibanye’s successful operating model and hard rock,
tabular, labour intensive mining competency to realise further value
• Innovative approach to structuring transactions and projects
36
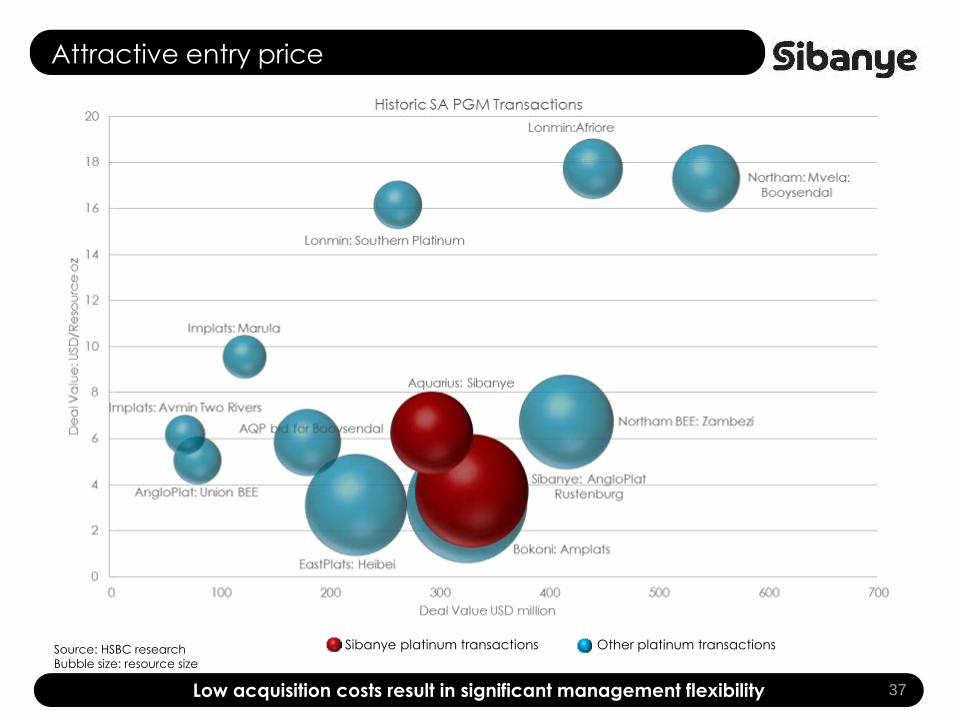
Attractive entry price
37Low acquisition costs result in significant management flexibility
Source: HSBC research
Bubble size: resource size
Sibanye platinum transactions Other platinum transactions
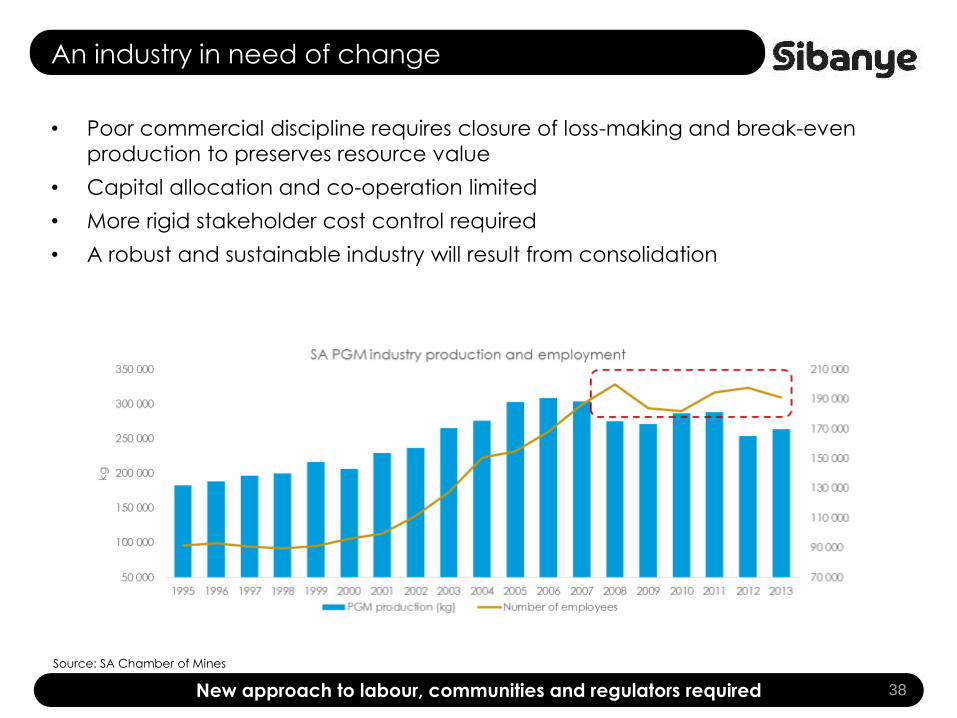
An industry in need of change
• Poor commercial discipline requires closure of loss-making and break-even
production to preserves resource value
• Capital allocation and co-operation limited
• More rigid stakeholder cost control required
• A robust and sustainable industry will result from consolidation
38New approach to labour, communities and regulators required
Source: SA Chamber of Mines
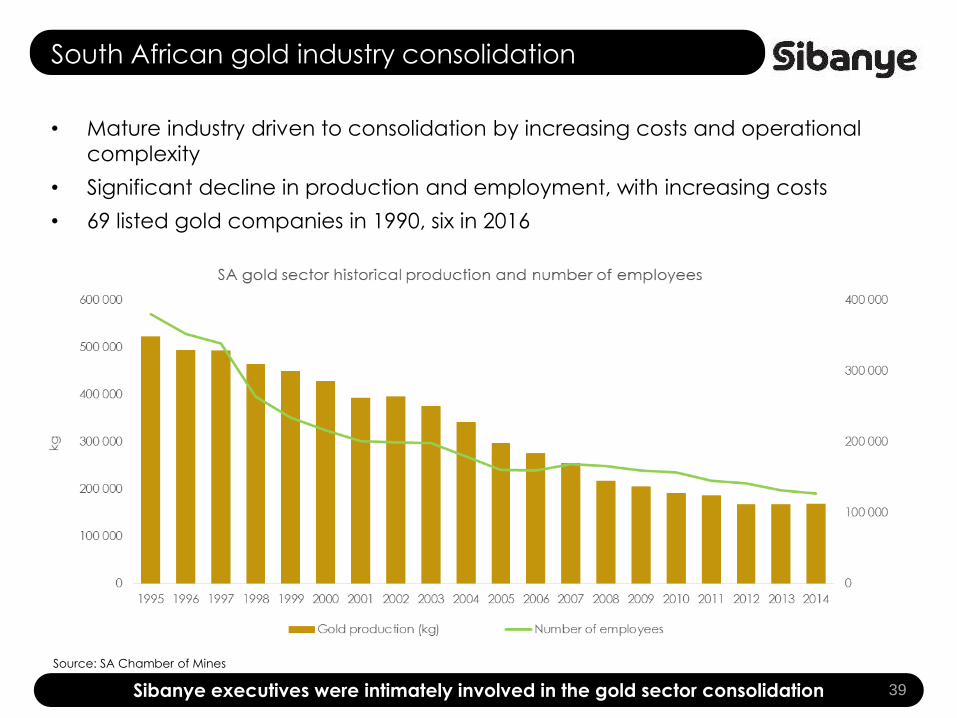
South African gold industry consolidation
• Mature industry driven to consolidation by increasing costs and operational
complexity
• Significant decline in production and employment, with increasing costs
• 69 listed gold companies in 1990, six in 2016
39Sibanye executives were intimately involved in the gold sector consolidation
Source: SA Chamber of Mines
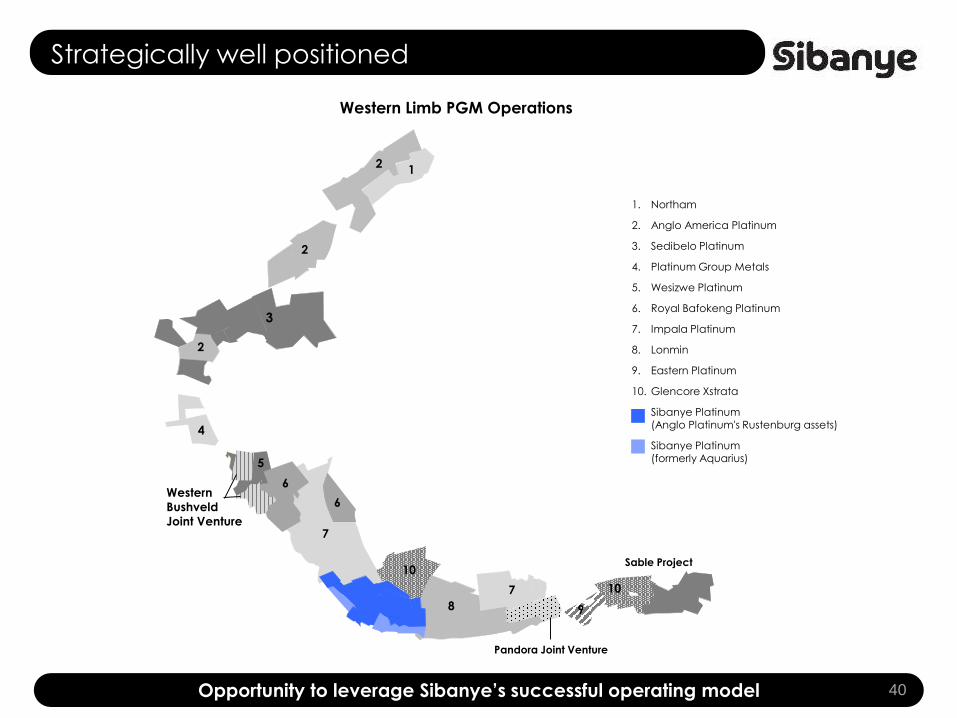
Strategically well positioned
40Opportunity to leverage Sibanye’s successful operating model
1. Northam
2. Anglo America Platinum
3. Sedibelo Platinum
4. Platinum Group Metals
5. Wesizwe Platinum
6. Royal Bafokeng Platinum
7. Impala Platinum
8. Lonmin
9. Eastern Platinum
10. Glencore Xstrata
Sibanye Platinum (Anglo Platinum's Rustenburg assets)
Sibanye Platinum (formerly Aquarius)
12
2
2
3
4
Sable Project
Western
Bushveld
Joint Venture
Pandora Joint Venture
7
7
6
6
5
10
8
10
9
Western Limb PGM Operations
Consolidation benefits
• Planning and ore body extraction optimised by breaking down farm
boundaries
• Improved capacity utilisation and rationalisation of infrastructure
• Remove duplicated/unnecessary overhead structures and costs
• Rationalise replicated support services
• Optimise capital allocation
• Flexibility to close loss making production
• Enhance financial capacity
– access to capital markets improved
– cost of capital reduced
41Consolidation is logical and necessary
0
2 000 000
4 000 000
6 000 000
8 000 000
10 000 000
Est
ima
ted
fre
e c
ash
flo
w a
fte
r c
ap
ex a
nd
ta
xe
s (Z
AR
'000)
Operations including
Burnstone
Operations including
Burnstone and WRTRP
2015 Gross Dividend
Operations including
Burnstone and WRTRP
and PGMs
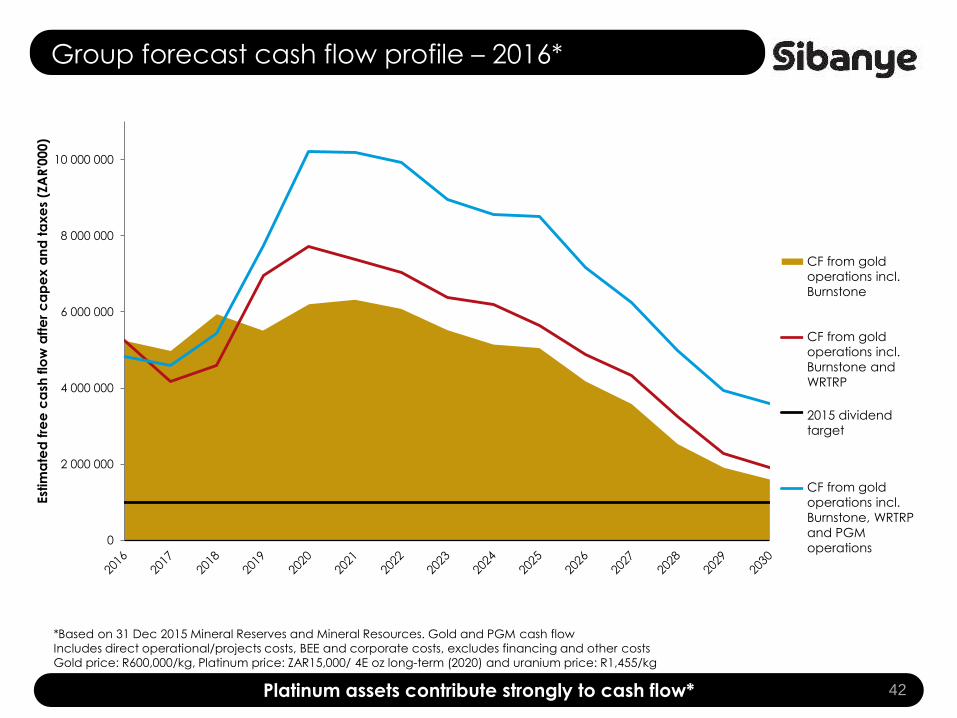
Group forecast cash flow profile – 2016*
42Platinum assets contribute strongly to cash flow*
*Based on 31 Dec 2015 Mineral Reserves and Mineral Resources. Gold and PGM cash flow
Includes direct operational/projects costs, BEE and corporate costs, excludes financing and other costs
Gold price: R600,000/kg, Platinum price: ZAR15,000/ 4E oz long-term (2020) and uranium price: R1,455/kg
CF from gold
operations incl.
Burnstone
CF from gold
operations incl.
Burnstone and
WRTRP
2015 dividend
target
CF from gold
operations incl.
Burnstone, WRTRP
and PGM
operations
Relative
valuation
43
-100.0
-50.0
0.0
50.0
100.0
150.0
200.0
250.0
300.0
350.0
400.0
2013 2014 2015 2016
%
Sibanye AngloGold Gold Fields Harmony FTSE/JSE ALSI Gold (US$/oz) Gold (R/kg)
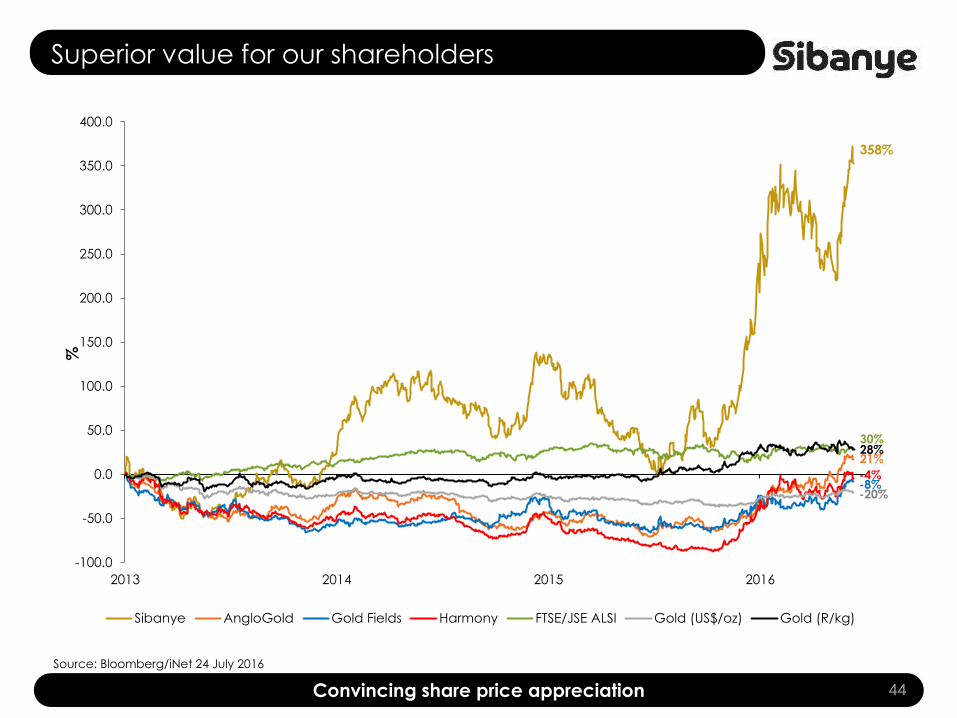
Superior value for our shareholders
44Convincing share price appreciation
Source: Bloomberg/iNet 24 July 2016
358%
30%
-8%
21%
-20%
-4%
28%
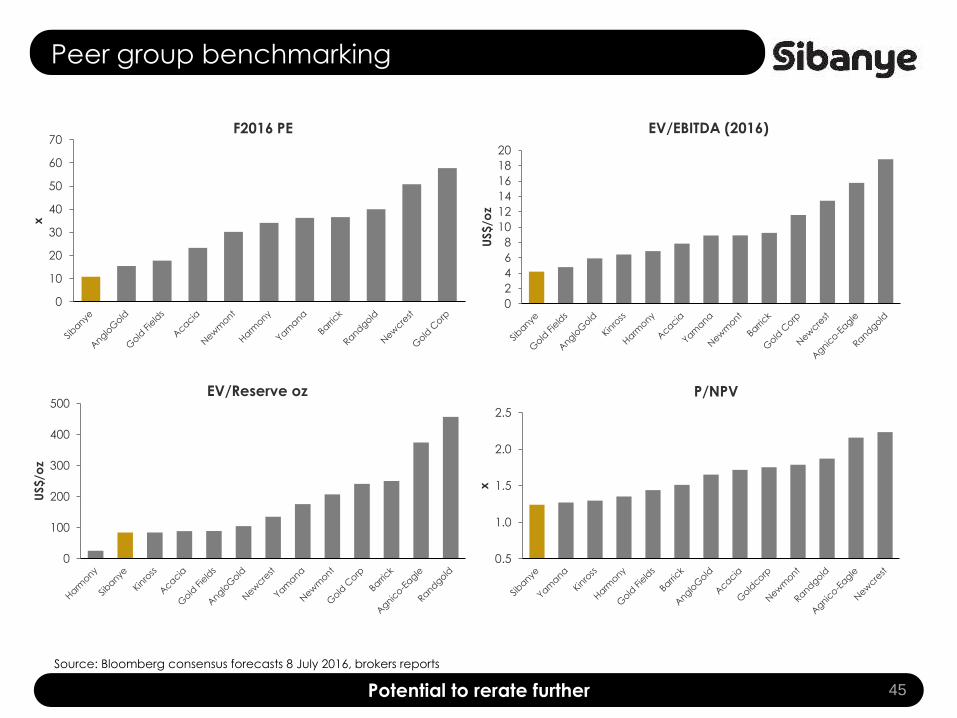
Peer group benchmarking
45Potential to rerate further
Source: Bloomberg consensus forecasts 8 July 2016, brokers reports
0
10
20
30
40
50
60
70
x
F2016 PE
0
2
4
6
8
10
12
14
16
18
20
US$
/oz
EV/EBITDA (2016)
0
100
200
300
400
500
US$/o
z
EV/Reserve oz
0.5
1.0
1.5
2.0
2.5
x
P/NPV
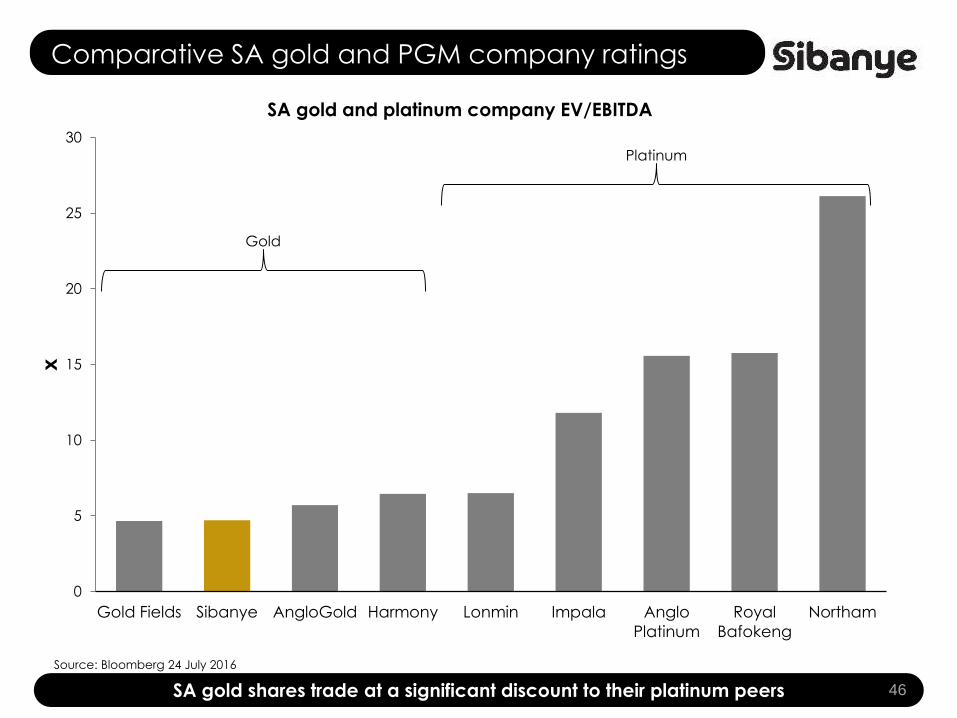
Comparative SA gold and PGM company ratings
46SA gold shares trade at a significant discount to their platinum peers
Source: Bloomberg 24 July 2016
0
5
10
15
20
25
30
Gold Fields Sibanye AngloGold Harmony Lonmin Impala Anglo
Platinum
Royal
Bafokeng
Northam
x
SA gold and platinum company EV/EBITDA
Gold
Platinum
Strategic
outlook and
conclusion
47
Strategic principles
• Dividend underpins investment case and will not be compromised
• Investment discipline regarding M&A and capital allocation to ensure
industry leading dividend sustainability
• Industry leading dividend underpins long-term returns to investors and will drive
rerating
• Sustainability only possible if value is created for all stakeholders
• Focus on sustainable value over longer term rather than reacting to short-term
exogenous issues
48A clear and focused strategy
Sibanye's key strategic thrusts 2016
• Enabling consistent, safe operational delivery
• Continuous business improvement
• Integration of platinum acquisitions
• Retain balance sheet strength and flexibility
• Respectful relationships with stakeholders and stakeholder communications
• Value-accretive growth to increase and sustain shareholder returns
• Focus on environmentally beneficial business practices
• Strategic and leadership role in repositioning the South African mining industry
49
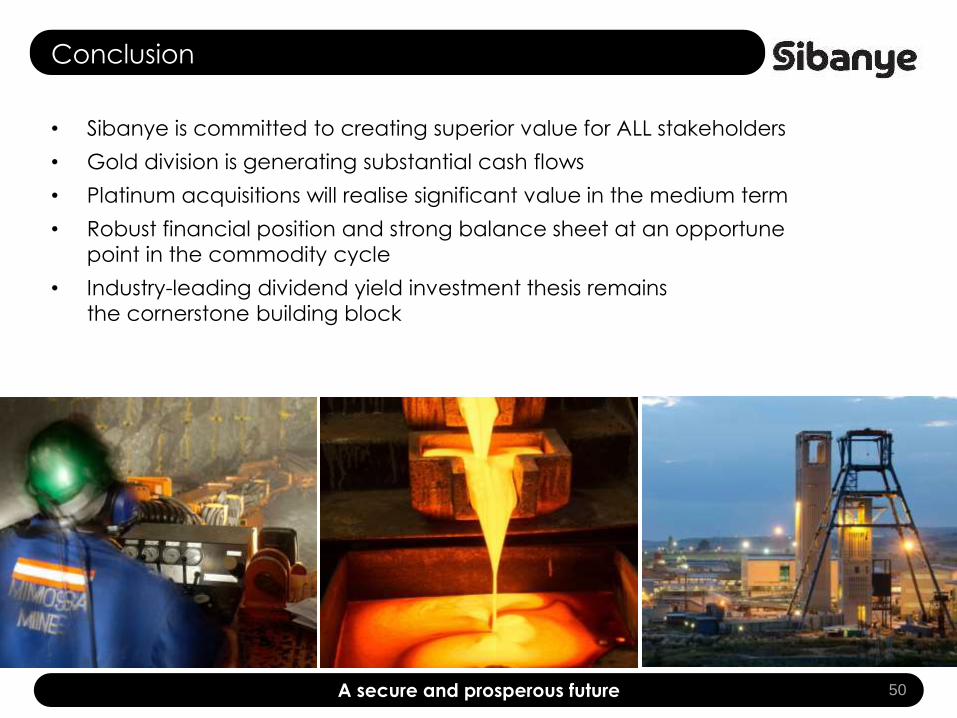
Conclusion
• Sibanye is committed to creating superior value for ALL stakeholders
• Gold division is generating substantial cash flows
• Platinum acquisitions will realise significant value in the medium term
• Robust financial position and strong balance sheet at an opportune
point in the commodity cycle
• Industry-leading dividend yield investment thesis remains
the cornerstone building block
50A secure and prosperous future
Questions