Embed Size (px)
Citation preview
sustainability
Article
Strategic Transport Management Models—The CaseStudy of an Oil Industry
Srdan Dimic 1, Dragan Pamucar 2, Srdan Ljubojevic 2,* and Boban Ðorovic 2
1 Strategic Planning Department, Ministry of Defence, Belgrade 11000, Serbia; [email protected] Department of Logistics, University of Defence, Belgrade 11000, Serbia; [email protected] (D.P.);
[email protected] (B.Ð.)* Correspondence: [email protected]; Tel.: +381-11-360-3817
Academic Editor: Giuseppe IoppoloReceived: 17 July 2016; Accepted: 14 September 2016; Published: 21 September 2016
Abstract: The awareness of the need to preserve the environment and establish sustainabledevelopment evolved as the result of the development of the world economy and society. Transportplays a very important role in this process. It is recognized as one of the main factors in sustainabledevelopment strategy. Strategic transport management model is presented in this paper. It representsa comprehensive and complete strategic management process, beginning from the strategic analysis,then strategy formulation and its implementation to strategic control. What makes this modelspecific is the development of its phases using contemporary strategic management methods andMCDM (Multicriteria Decision Making) techniques. In this way, subjectivity is avoided and thedecision-making process is impartial. To formulate sustainable transport strategy, the authors use aSWOT analysis (Strengths, Weaknesses, Opportunities, and Threats) and the fuzzy Delphi methodas the basis to evaluate impact factors. Fuzzy SWOT analysis is applied to formulate strategicoptions and the selection of optimal option is realized through DEMATEL (Decision-Making Trial andEvaluation Laboratory)-based ANP (Analytic Network Process). The strategic transport managementmodel is applied to Serbian Oil Industry (NIS) as a company engaged in the production and transportof oil and oil derivatives. The results presented in this paper have shown that this model can besuccessfully implemented in profit organizations. It also can be used to formulate strategies on thebasis of scientific principles and create conditions for successful sustainable strategies implementation.
Keywords: strategic management; transport; SWOT; DEMATEL; ANP
1. Introduction
One of the basic concepts of the economics of natural resources and the living environment issustainability and sustainable development. Despite different interpretations that can be found in theliterature, this concept today has a central role in long-term perspectives on the survival and progressof mankind. In that sense, sustainable development occurs not only as a core requirement, but as theultimate goal of effective non-profit or for-profit organizations [1].
Overall economic and social development have a significant role in contributing to risingawareness of the importance of environmental protection and the establishment of sustainabledevelopment policies. Transport is recognized as an important factor of sustainable developmentstrategy, due to the strong correlation between transport and economic and social developmentand particularly because of its significant impact on the environment. Besides the positive andsignificant impact of transport on social and economic development, there is its negative impact on theenvironment. The essence of the sustainable transport strategy is the control of negative effects/impactsof transport, i.e., traffic accidents, congestion, pollution of land, air, and water, noise produced bytransport vehicles, and power consumption. All of these negative effects must be considered together,
Sustainability 2016, 8, 954; doi:10.3390/su8090954 www.mdpi.com/journal/sustainability
Sustainability 2016, 8, 954 2 of 27
because there is a high degree of interdependence among them, and they result in direct or indirectimpacts on human health, the environment, and the quality of everyday life.
Studies that consider transport strategies are mainly related to sustainable transport strategiesat the state, region, city, or company level. For example, in [2] the authors analyzed the usageof electric vehicles to implement sustainable strategy for road transport in Australia, and in [3]the strategic planning guidelines are given for a sustainable transport system in the United States.Long-term sustainable transport strategy in Havana, Cuba is formulated in [4], and in [5] the analysisof public transport of passengers in Bucharest, Romania is provided. In 2013, to design a strategy fora semi-governmental start-up company allied with the railway transport industry Sarfaraz et al. [6]applied the Strategy-Formulation Analytical Framework (proposed by David [7]). There are alsostudies that deal with traffic safety strategies [8–11], road maintenance strategies [12–14], or networkmanagement strategies [15], etc. However, there are only a few cases of transport strategy selectionwith the aim to distribute the final product of a specific company. Since this type of strategyis a part of the overall company strategy, it needs to be competitive, socially responsible, andsustainable, in accordance with the company’s overall goals. According to Abbasi and Nilsson [16],due to tremendous uncertainty, designing future sustainability-related logistic activities and transportbetween them is hindered. This is because it is very hard to plan at the strategic level due to rapidlychanging external and internal factors in the environment [17].
As a methodological framework for strategy formulation, SWOT analysis is often used. Besides allthe advantages and wide practical implementation, SWOT analysis has disadvantages also. They areprimarily related to quantification and prioritization of factors and alternatives. More about theproblems in the implementation of SWOT analysis can be found in [3]. The disadvantages of SWOTare reasons for combining SWOT with other methods and techniques. One of the first hybrid modelsof SWOT analysis was the A’WOT model [18], combining SWOT analysis with the AHP method,with the aim of analytical priority determination among SWOT analysis factors. Later, this hybridmodel was modified and widely exploited. Examples of SWOT–AHP model implementation can befound in [19–24], and examples of combining SWOT with fuzzy AHP in [25–27]. For a combination ofSWOT with other methods and techniques we refer to [28–32], etc.
One of the popular ways to formulate the strategy is to combine SWOT analysis with ANP.Realizing that interdependence of the factors that are used in SWOT analysis can impact the selectionof a final strategy, Yuksel and Dagdeviren proposed the hybrid SWOT–ANP model for strategyformulation [33]. ANP was adopted by Al-Rafaie et al. [34] to determine strategic factors’ relativeimportance as the basis of prioritizing previously formulated strategic options. In a similar way,Živkovic et al. [35] also proposed strategic option selection, implementing the AHP method todetermine the factor weights of dependency or independency. Examples of such models can befound in [33–38]. Also, in a similar way the combination of ANP and SWOT was used even in a fuzzyenvironment [39–42].
Although the ANP method was previously proposed for improving SWOT analysis,the SWOT–ANP combination was not sufficient because it does not solve the real problems ofquantification of relations between SWOT factors. Specifically, when making maps of a relationnetwork, in applying the ANP method, the mutual dependency of two factors is treated as the reciprocalvalue (the dependence of factor A on factor B is equal to the reciprocal value of the dependence offactor B on factor A) and that does not always correspond to reality. Also, the same problem ariseswhen normalizing the unweighted supermatrix in ANP, where to each cluster the same relativeimportance is assigned.
The hybrid SWOT–DANP model proposed in this paper eliminates most of the disadvantagesof standard SWOT and hybrid SWOT–ANP models. DEMATEL is an often used method for factors(criteria) segmentation and the identification of cause and effect relationships [43–45]. Also, DEMATELhas been widely used in fuzzy environments [46–50]. A DEMATEL-based ANP approach was used toexamine influential weights among the criteria in the ANP model [51–54].
Sustainability 2016, 8, 954 3 of 27
The presented SWOT–DANP model enables qualitative factor analysis, priority determinationamong factors and alternatives, and the selection of adequate alternatives even in the case of a largenumber of factors. Conditionally, the SWOT–DANP model can be divided into two phases.
Identification of influential factors and formulation of strategic options is conducted in the firstphase. In the second phase selection of optimal strategic option takes place. Because of the highlevel of uncertainty that is present in the first phase, for influential factors identification, the fuzzyDelphi technique is used. Experts involved in the identification process evaluate factors’ influenceson a fuzzy scale. The average opinion of group of experts is a fuzzy value obtained by individualopinions aggregation. By applying fuzzy SWOT analysis based on the fuzzy values of the factors’influences, connections between factors are determined and strategic transport options are formulated.The highest level of uncertainty is present during the identification of factors and quantification oftheir influences. This is the reason for fuzzy approach application in the first phase of the model.
In the second phase of the model, DEMATEL and ANP methods are combined with fuzzy SWOTanalysis with the aim of eliminating subjectivity during the process of mapping, quantifying theirrelative influence, and prioritizing strategic transport options. In this stage, crisp DEMATEL and ANPmethods are used for strategic options evaluation because of the lower level of uncertainty in thesecond phase.
Quantification of reciprocal influence of cluster/factors in this model is performed by forming thetotal-influence matrix T and establishing a threshold value α, or constructing an effect relationshipdiagram (ERD), according to the DEMATEL method. Fuzzy SWOT analysis is used for factorsevaluation and options formation based on the established relations between factors and the ANPmethod is used for the quantification of clusters’/factors’ relative importance and the selection of anoptimal option.
The model of strategic transport management presented in this paper, in a difference fromcurrently applied models, integrates all phases of strategic management process in transport companies.The model is applied to a company engaged in the transport of hazardous goods and it is also applicablein other companies that aim to establish a sustainable development strategy.
2. Strategic Transport Management Model
Most approaches to modelling the strategic management process follow the logic of strategicplanning as the most important phase of the management process. This is understandable becausethe results of the planning phase are decisions about the objectives, policies, strategies, and set ofindividual plans that are implemented in real business. In this regard a formalized planning processhas served as a framework to develop a model of strategic transport management.
Considering the company’s engagement in transport and the need to establish a sustainabletransport strategy, this model should provide an adequate framework for solving a variety of problemssuch as variable and limited resources (human, material, information, weather, etc.) and taking presentand future characteristics of external and internal environment into account.
Modern strategic management methods and techniques are used in the elaboration of the model.This makes it a comprehensive and complete process that begins with strategic analysis, then strategyformulation and implementation, and ends with strategic control. The strategic transportationmanagement model includes the following phases:
(1) Strategic analysis(2) Strategic options formulation(3) Optimal strategic option selection(4) Selected strategy implementation(5) Strategic control
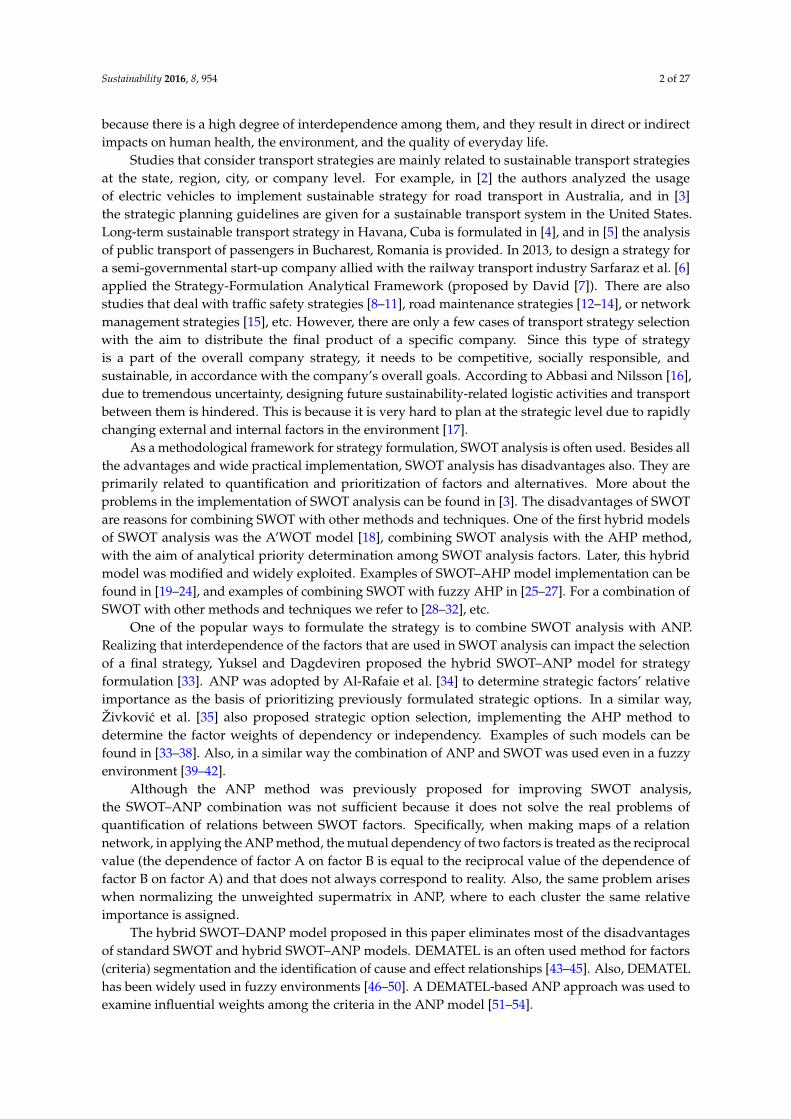
Each of these phases implies the implementation of sequence of permeated activities that can begrouped into several basic activities—presented in Figure 1.
Sustainability 2016, 8, 954 4 of 27Sustainability 2016, 8, 954 4 of 27
Figure 1. Strategic transport management model.
2.1. Strategic Analysis
The process of strategic transport management starts with strategic analysis, which consists of external and internal analysis of the company’s environment with special attention given to the operations of the transport sector. In this phase it is possible to use several methods such as SWOT analysis. The results of the first phase of this model are factors that are grouped into elements of the SWOT matrix (strengths, weaknesses, opportunities, and threats).
2.2. Strategic Option Formulation
When formulating strategic options, it should be noted that the chosen strategy must meet several basic requirements:
It is in accordance with business policy It entails an acceptable level of risk It is consistent with the external environment It is acceptable in terms of available resources It has an acceptable time frame according to the urgency of its implementation, period of
strategy adoption, and the beginning of its execution It is feasible and has measurable results, etc.
Figure 1. Strategic transport management model.
2.1. Strategic Analysis
The process of strategic transport management starts with strategic analysis, which consistsof external and internal analysis of the company’s environment with special attention given to theoperations of the transport sector. In this phase it is possible to use several methods such as SWOTanalysis. The results of the first phase of this model are factors that are grouped into elements of theSWOT matrix (strengths, weaknesses, opportunities, and threats).
2.2. Strategic Option Formulation
When formulating strategic options, it should be noted that the chosen strategy must meet severalbasic requirements:
• It is in accordance with business policy• It entails an acceptable level of risk• It is consistent with the external environment• It is acceptable in terms of available resources
Sustainability 2016, 8, 954 5 of 27
• It has an acceptable time frame according to the urgency of its implementation, period of strategyadoption, and the beginning of its execution
• It is feasible and has measurable results, etc.
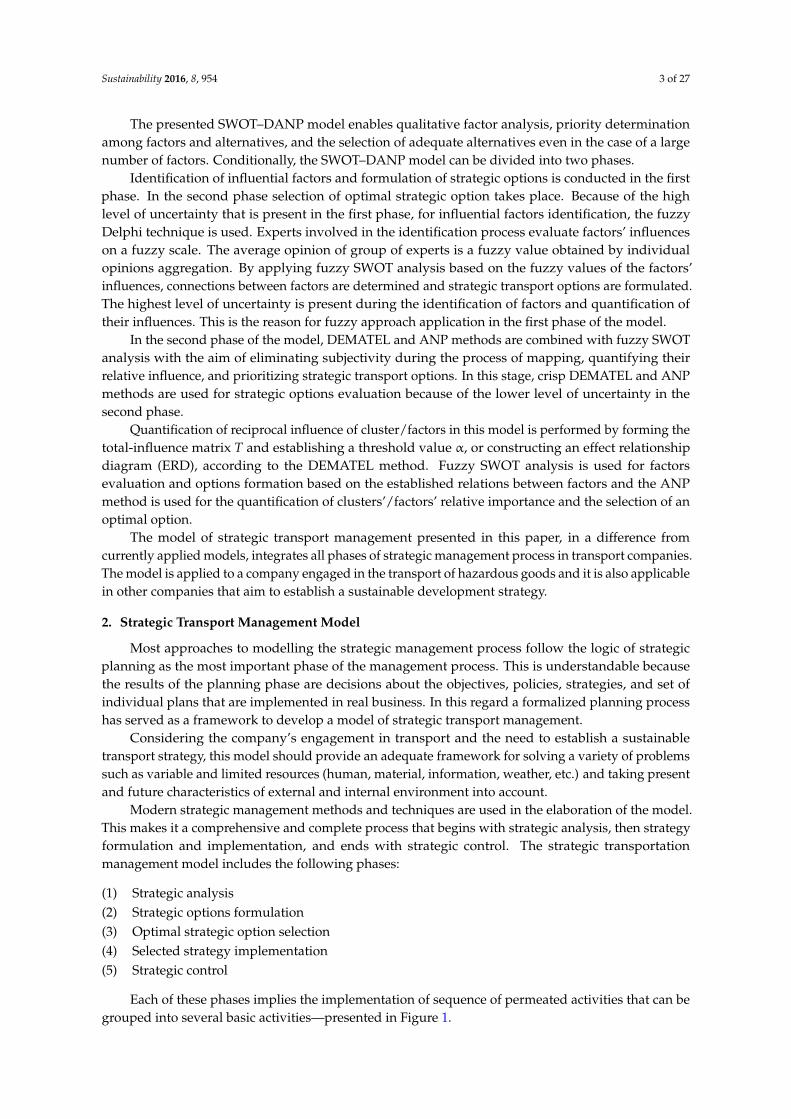
Sustainable development strategy should also meet these requirements. Many methods andtechniques are used in strategic management theory and practice to provide insight into theoperating requirements of companies and define adequate strategies. In this paper SWOT analysisis implemented because it is systematic, transparent, and simple to use. The process of establishingsustainable transport strategy is primary based on SWOT analysis ideas with additional modifications,as shown in Figure 2.
Sustainability 2016, 8, 954 5 of 27
Sustainable development strategy should also meet these requirements. Many methods and techniques are used in strategic management theory and practice to provide insight into the operating requirements of companies and define adequate strategies. In this paper SWOT analysis is implemented because it is systematic, transparent, and simple to use. The process of establishing sustainable transport strategy is primary based on SWOT analysis ideas with additional modifications, as shown in Figure 2.
Figure 2. Strategic options formulation process based on SWOT analysis ideas [55].
After conducting a situation analysis of a company’s internal and external environment, impact factors that influence the transport sector are determined and classified into two groups: internal and external factors. Internal factors are the identified strengths and weaknesses of the company and external factors are opportunities and threats of the company’s external environment.
After determining impact factors, they are valued by applying a modification of the fuzzy Delphi method through the next steps:
Step 1. Expert selection. Step 2. Sorting experts into groups according to their level of education, job position, previous
experience, and similar research, etc. To each expert a specific weighting coefficient is assigned, ∈0, 1 , where the sum of weighting coefficients of all experts equals 1: ∑ = 1 , where N represents the number of experts taking part in the research.
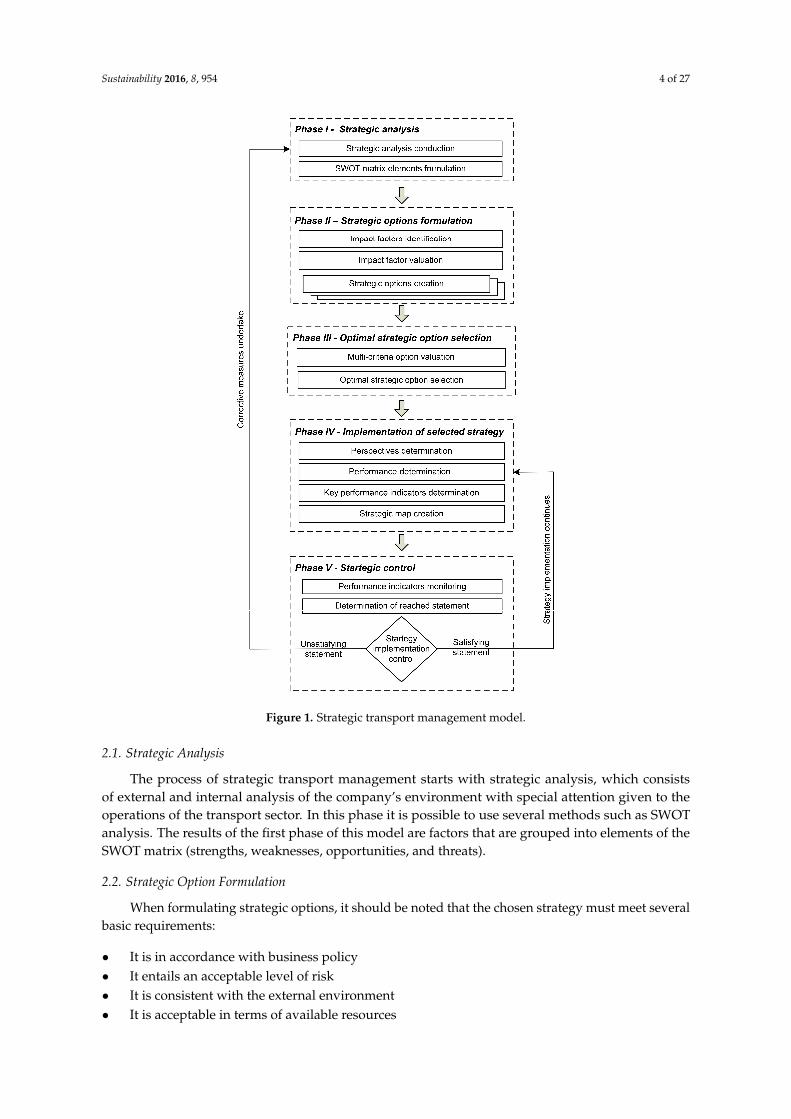
Step 3. Assessment of identified factors’ influence is provided by experts who assess the factor intensity through linguistic descriptors (very low—VL, low—L, medium—M, high—H, very high—VH). Assessed factors’ intensity values are later fuzzified through fuzzy scale transformation (Figure 3).
Experiences Experts engagement
- Mission - Vision
- Objectives
- Mission - Vision
- Objectives
- Mission - Vision
- Objectives
Phase IVStrategic option formulation
Impact assessment based on research
Expert’ impact assessment
Situation analysis Environment analysis
Phase I Factors identification
(internal, external)
Phase IIImpact factors evaluation
Phase IIIMapping of factor connectedness
Figure 2. Strategic options formulation process based on SWOT analysis ideas [55].
After conducting a situation analysis of a company’s internal and external environment, impactfactors that influence the transport sector are determined and classified into two groups: internaland external factors. Internal factors are the identified strengths and weaknesses of the company andexternal factors are opportunities and threats of the company’s external environment.
After determining impact factors, they are valued by applying a modification of the fuzzy Delphimethod through the next steps:
Step 1. Expert selection.Step 2. Sorting experts into groups according to their level of education, job position, previous
experience, and similar research, etc. To each expert a specific weighting coefficient is assigned,wi ∈ [0, 1], where the sum of weighting coefficients of all experts equals 1: ∑N
i=1 wi = 1, where Nrepresents the number of experts taking part in the research.
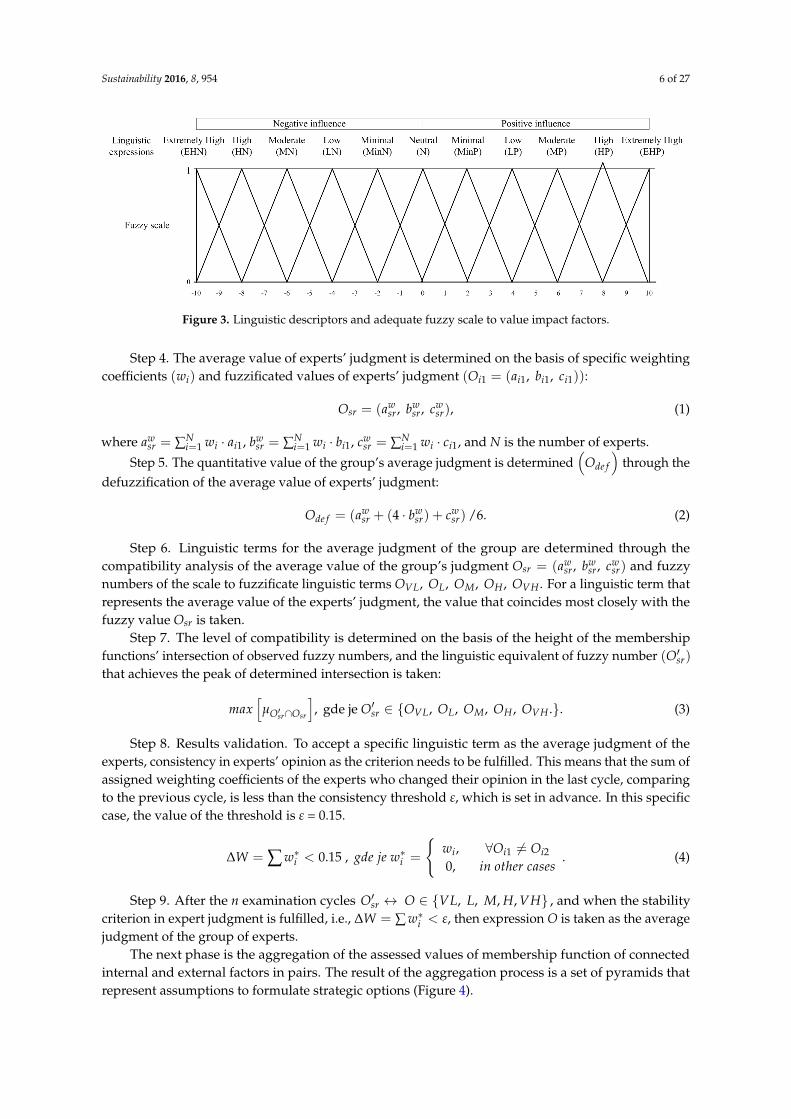
Step 3. Assessment of identified factors’ influence is provided by experts who assess thefactor intensity through linguistic descriptors (very low—VL, low—L, medium—M, high—H, veryhigh—VH). Assessed factors’ intensity values are later fuzzified through fuzzy scale transformation(Figure 3).
Sustainability 2016, 8, 954 6 of 27Sustainability 2016, 8, 954 6 of 27
Figure 3. Linguistic descriptors and adequate fuzzy scale to value impact factors.
Step 4. The average value of experts’ judgment is determined on the basis of specific weighting coefficients and fuzzificated values of experts’ judgment = , , : = , , , (1)
where = ∑ ∙ , = ∑ ∙ , = ∑ ∙ , and N is the number of experts. Step 5. The quantitative value of the group’s average judgment is determined through
the defuzzification of the average value of experts’ judgment: = + 4 ∙ + /6. (2)
Step 6. Linguistic terms for the average judgment of the group are determined through the compatibility analysis of the average value of the group’s judgment = , , and fuzzy numbers of the scale to fuzzificate linguistic terms , , , , . For a linguistic term that represents the average value of the experts’ judgment, the value that coincides most closely with the fuzzy value is taken.
Step 7. The level of compatibility is determined on the basis of the height of the membership functions’ intersection of observed fuzzy numbers, and the linguistic equivalent of fuzzy number
that achieves the peak of determined intersection is taken:
∩ , gde je ∈ , , , , . . (3)
Step 8. Results validation. To accept a specific linguistic term as the average judgment of the experts, consistency in experts’ opinion as the criterion needs to be fulfilled. This means that the sum of assigned weighting coefficients of the experts who changed their opinion in the last cycle, comparing to the previous cycle, is less than the consistency threshold ε, which is set in advance. In this specific case, the value of the threshold is ε = 0.15. ∆ = ∑ ∗ < 0.15 , ∗ = ,0, ∀ ≠ℎ . (4)
Step 9. After the n examination cycles ↔ ∈ , , , , , and when the stability criterion in expert judgment is fulfilled, i.e., ∆ = ∑ ∗ < , then expression O is taken as the average judgment of the group of experts.
The next phase is the aggregation of the assessed values of membership function of connected internal and external factors in pairs. The result of the aggregation process is a set of pyramids that represent assumptions to formulate strategic options (Figure 4).
Figure 3. Linguistic descriptors and adequate fuzzy scale to value impact factors.
Step 4. The average value of experts’ judgment is determined on the basis of specific weightingcoefficients (wi) and fuzzificated values of experts’ judgment (Oi1 = (ai1, bi1, ci1)):
Osr = (awsr, bw
sr, cwsr), (1)
where awsr = ∑N
i=1 wi · ai1, bwsr = ∑N
i=1 wi · bi1, cwsr = ∑N
i=1 wi · ci1, and N is the number of experts.
Step 5. The quantitative value of the group’s average judgment is determined(
Ode f
)through the
defuzzification of the average value of experts’ judgment:
Ode f = (awsr + (4 · bw
sr) + cwsr) /6. (2)
Step 6. Linguistic terms for the average judgment of the group are determined through thecompatibility analysis of the average value of the group’s judgment Osr = (aw
sr, bwsr, cw
sr) and fuzzynumbers of the scale to fuzzificate linguistic terms OVL, OL, OM, OH , OVH . For a linguistic term thatrepresents the average value of the experts’ judgment, the value that coincides most closely with thefuzzy value Osr is taken.
Step 7. The level of compatibility is determined on the basis of the height of the membershipfunctions’ intersection of observed fuzzy numbers, and the linguistic equivalent of fuzzy number (O′sr)
that achieves the peak of determined intersection is taken:
max[µO′sr∩Osr
], gde je O′sr ∈ {OVL, OL, OM, OH , OVH .}. (3)
Step 8. Results validation. To accept a specific linguistic term as the average judgment of theexperts, consistency in experts’ opinion as the criterion needs to be fulfilled. This means that the sum ofassigned weighting coefficients of the experts who changed their opinion in the last cycle, comparingto the previous cycle, is less than the consistency threshold ε, which is set in advance. In this specificcase, the value of the threshold is ε = 0.15.
∆W = ∑ w∗i < 0.15 , gde je w∗i =
{wi,0,
∀Oi1 6= Oi2in other cases
. (4)
Step 9. After the n examination cycles O′sr ↔ O ∈ {VL, L, M, H, VH} , and when the stabilitycriterion in expert judgment is fulfilled, i.e., ∆W = ∑ w∗i < ε, then expression O is taken as the averagejudgment of the group of experts.
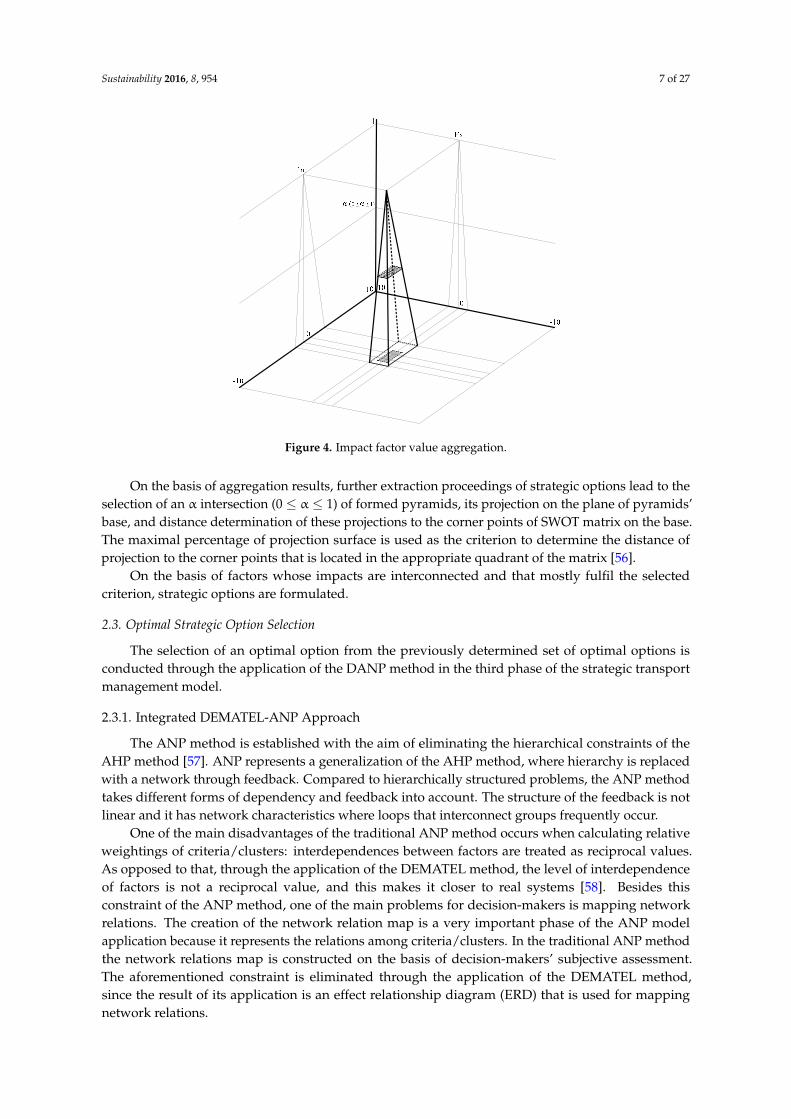
The next phase is the aggregation of the assessed values of membership function of connectedinternal and external factors in pairs. The result of the aggregation process is a set of pyramids thatrepresent assumptions to formulate strategic options (Figure 4).
Sustainability 2016, 8, 954 7 of 27Sustainability 2016, 8, 954 7 of 27
Figure 4. Impact factor value aggregation.
On the basis of aggregation results, further extraction proceedings of strategic options lead to the selection of an α intersection (0 ≤ α ≤ 1) of formed pyramids, its projection on the plane of pyramids’ base, and distance determination of these projections to the corner points of SWOT matrix on the base. The maximal percentage of projection surface is used as the criterion to determine the distance of projection to the corner points that is located in the appropriate quadrant of the matrix [56].
On the basis of factors whose impacts are interconnected and that mostly fulfil the selected criterion, strategic options are formulated.
2.3. Optimal Strategic Option Selection
The selection of an optimal option from the previously determined set of optimal options is conducted through the application of the DANP method in the third phase of the strategic transport management model.
2.3.1. Integrated DEMATEL-ANP Approach
The ANP method is established with the aim of eliminating the hierarchical constraints of the AHP method [57]. ANP represents a generalization of the AHP method, where hierarchy is replaced with a network through feedback. Compared to hierarchically structured problems, the ANP method takes different forms of dependency and feedback into account. The structure of the feedback is not linear and it has network characteristics where loops that interconnect groups frequently occur.
One of the main disadvantages of the traditional ANP method occurs when calculating relative weightings of criteria/clusters: interdependences between factors are treated as reciprocal values. As opposed to that, through the application of the DEMATEL method, the level of interdependence of factors is not a reciprocal value, and this makes it closer to real systems [58]. Besides this constraint of the ANP method, one of the main problems for decision-makers is mapping network relations. The creation of the network relation map is a very important phase of the ANP model application because it represents the relations among criteria/clusters. In the traditional ANP method the network relations map is constructed on the basis of decision-makers’ subjective assessment. The aforementioned constraint is eliminated through the application of the DEMATEL method, since the result of its application is an effect relationship diagram (ERD) that is used for mapping network relations.
Figure 4. Impact factor value aggregation.
On the basis of aggregation results, further extraction proceedings of strategic options lead to theselection of an α intersection (0 ≤ α ≤ 1) of formed pyramids, its projection on the plane of pyramids’base, and distance determination of these projections to the corner points of SWOT matrix on the base.The maximal percentage of projection surface is used as the criterion to determine the distance ofprojection to the corner points that is located in the appropriate quadrant of the matrix [56].
On the basis of factors whose impacts are interconnected and that mostly fulfil the selectedcriterion, strategic options are formulated.
2.3. Optimal Strategic Option Selection
The selection of an optimal option from the previously determined set of optimal options isconducted through the application of the DANP method in the third phase of the strategic transportmanagement model.
2.3.1. Integrated DEMATEL-ANP Approach
The ANP method is established with the aim of eliminating the hierarchical constraints of theAHP method [57]. ANP represents a generalization of the AHP method, where hierarchy is replacedwith a network through feedback. Compared to hierarchically structured problems, the ANP methodtakes different forms of dependency and feedback into account. The structure of the feedback is notlinear and it has network characteristics where loops that interconnect groups frequently occur.
One of the main disadvantages of the traditional ANP method occurs when calculating relativeweightings of criteria/clusters: interdependences between factors are treated as reciprocal values.As opposed to that, through the application of the DEMATEL method, the level of interdependenceof factors is not a reciprocal value, and this makes it closer to real systems [58]. Besides thisconstraint of the ANP method, one of the main problems for decision-makers is mapping networkrelations. The creation of the network relation map is a very important phase of the ANP modelapplication because it represents the relations among criteria/clusters. In the traditional ANP methodthe network relations map is constructed on the basis of decision-makers’ subjective assessment.The aforementioned constraint is eliminated through the application of the DEMATEL method,since the result of its application is an effect relationship diagram (ERD) that is used for mappingnetwork relations.
Sustainability 2016, 8, 954 8 of 27
In application of the traditional ANP method, a weighted supermatrix is calculated by normalizingthe unweighted supermatrix. Each column of the unweighted supermatrix is divided by the numberof clusters so that each column sums to unity. This means that each cluster weighs the same. However,this is not an appropriate assumption, since it is known that clusters could have different mutualinfluence on one another. Although it is easy to normalize with such a method, this neglects the factthat different groups should have different degrees of influence. Thus we need to find another wayof normalizing the unweighted supermatrix that does not rely on this assumption of equal weightamong clusters. Here, we turn to the total-influence matrix T in DEMATEL and threshold value α forhelp [39].
By combining DEMATEL-a with the ANP method, the aforementioned problems can be solved.In this way the final results are closer to real circumstances. Later in this paper, the DEMATELmethod is presented, and the authors concentrate on the process of hybrid DEMATEL–ANP (DANP)model implementation.
2.3.2. The DEMATEL Method
The mathematical formulation of DEMATEL method was established at Battelle Geneva Institutewith the aim of enabling interpretation of interactive group models where there are multipledecision-makers in the decision-making process, as well as determination of qualitative factor relationsthat connect different aspects of social problems [46]. The DEMATEL method enables an overview offactors’ position through their mutual influence. In this way, conditions for constructing structuralrelations among factors in the system are created. The mathematical concept of the DEMATELmethod is evaluated and adjusted for different academic areas, such as strategy analysis, competenceassessment, result analysis, selection, etc. Through its implementation in different academic areas, theDEMATEL method proved to be a very useful method in solving complex problems [46,59–62].
Assuming that there are m experts in the research and n observed factors, each expert shoulddetermine the level of influence of factor i on factor j. Comparative analysis of the pair of factor iand factor j by expert k is designated as xk
ij, where: i = 1, ..., n; j = 1, ..., n; k = 1, ..., m. The value of
each pair xkij is an integer, where: 0—no influence; 1—low influence; 2—middle influence; 3—high
influence; 4—very high influence. The judgment of expert k is presented as a non-negative matrixn × n rank, and each element of matrix k in Xk = [xk
ij]n × ndesignates a non-negative number xk
ij,
where 1 ≤ k ≤ m. In accordance with this, X1, X2, . . . , Xm matrices are judgment matrices of eachof m experts. Diagonal elements of the judgment matrix have a value of 0 since the same factors donot influence each other. On the basis of judgment matrix Xk = [xk
ij]n×nof all m experts, the matrix of
average judgments Zk = [zkij]n×n
is calculated to represent the average judgment value of all m expertsfor each element of the Z matrix in the following way:
Z =
z11 z12 · · · z1nz21 z21 · · · z2n
......
. . ....
zn1 zn2 . . . znn
, (5)
wherezij =
1m ∑ m
k=1xkij. (6)
Matrix Z represents the starting effects caused by a specific factor, as well as the starting effectsobtained from other factors. Normalized matrix of average judgment (D) is calculated using matrix Z:
D = Z/s, (7)
Sustainability 2016, 8, 954 9 of 27
wheres = max
(max1≤i≤n ∑ n
j=1aij; max1≤j≤n ∑ ni=1aij
). (8)
The sum of each i row of the Z matrix is the total direct effect that i factor delivers to other factorsand the sum of each j column of Z matrix is the total direct effect that j factor receives from otherfactors. Matrix D is calculated by dividing each element zij of matrix Z with Equation (8). Each elementdij of matrix D is assigned a value between 0 and 1.
In the next step, the total-relation matrix is calculated (T) of n × n rank according to Equation (9).The tij element denotes a direct influence of factor i on factor j, and the T matrix denotes total relationsamong each pair of factors:
T = D · (I − D)−1, (9)
where I represents n × n identity matrix.
T =[tij]
n×n , i, j = 1, 2, . . . , n. (10)
In total-relation matrix T, the sum of rows and the sum columns are denoted as vectors R and Cof the n × 1 rank:
R = [ri]n×1 =[∑ n
j=1tij
]n×1
(11)
C = [ci]′1×n =
[∑ n
i=1tij]′
1×n. (12)
The value of ri is the sum of row i of matrix T and represents the total direct and indirect effectsthat factor i delivers to other factors. The value of cj is the sum of column j of matrix T and it representsthe total direct and indirect effects that factor j receives from other factors. In cases where i = j,Equation (ri + ci) indicates the impact of the factors and Equation (ri − ci) indicates the intensity ofthe factors compared to others.
On the basis of obtained total influence matrix values, the threshold is determined (α) and anetwork relations map is constructed. The threshold is determined by applying Equation (13), whichgives the mean of the elements in matrix T. The aim of determining the threshold is to eliminate theinfluence of elements that have less influence on matrix T [58]:
α =∑n
i=1 ∑nj=1[tij]
N, (13)
where N indicates the number of elements of matrix T.On the basis of the determined threshold, a filtered matrix T is obtained. It is used for creating
network relations maps that represent a foundation for defining relations in the ANP method.
2.3.3. DANP Model
A hybrid DANP model, or an integration of DEMATEL and ANP method, is created in four steps,described in the following.
Step 1. The unweighted supermatrix determination. Before determining the unweightedsupermatrix, it is necessary to define a network model for the ANP method. The network model isdetermined on the basis of the total relation matrix and ERD. By forming network model conditionsfor unweighted supermatrix determination are created. Normalize each level with the total degreeof influence from the total relation matrix T for criteria by DEMATEL. To normalize the matrix it isnecessary to determine the sum of elements of the matrix by columns:
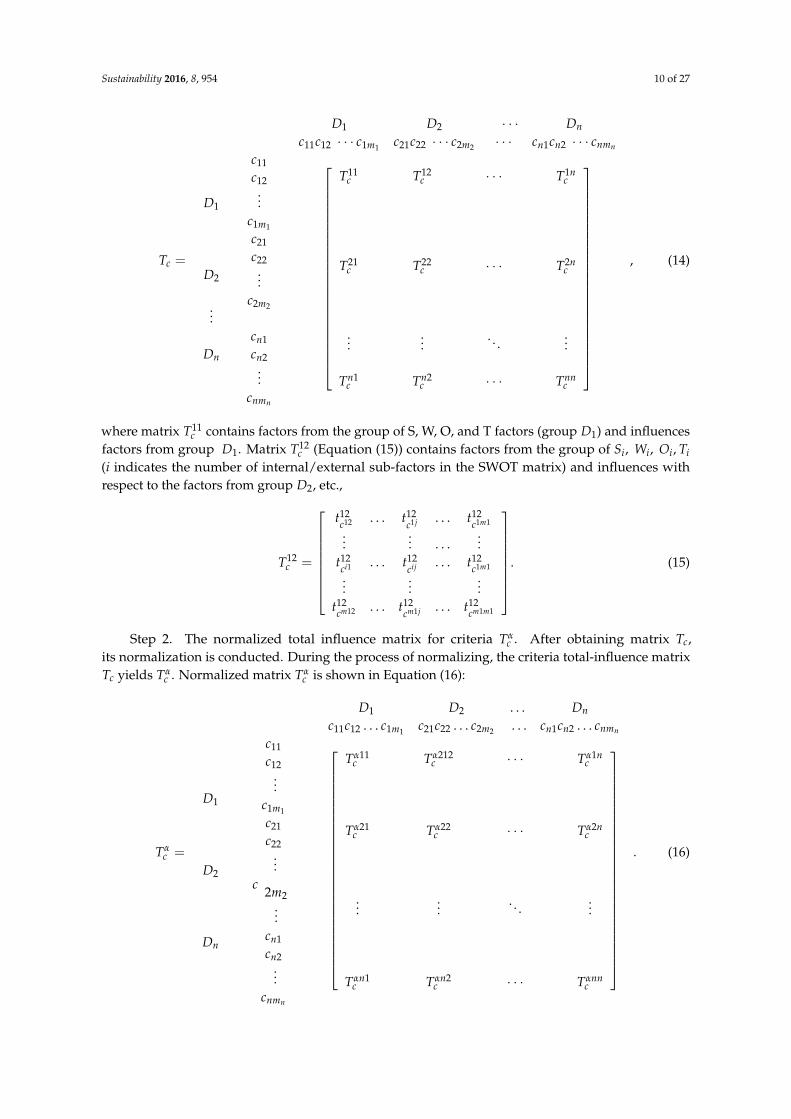
Sustainability 2016, 8, 954 10 of 27
Tc =
D1 D2 · · · Dn
c11c12 · · · c1m1 c21c22 · · · c2m2 · · · cn1cn2 · · · cnmn
D1
D2
...
Dn
c11
c12...
c1m1
c21
c22...
c2m2
cn1
cn2...
cnmn
T11c T12
c · · · T1nc
T21c T22
c · · · T2nc
......
. . ....
Tn1c Tn2
c · · · Tnnc
, (14)
where matrix T11c contains factors from the group of S, W, O, and T factors (group D1) and influences
factors from group D1. Matrix T12c (Equation (15)) contains factors from the group of Si, Wi, Oi, Ti
(i indicates the number of internal/external sub-factors in the SWOT matrix) and influences withrespect to the factors from group D2, etc.,
T12c =
t12c12 . . . t12
c1j . . . t12c1m1
...... . . .
...t12ci1 . . . t12
cij . . . t12c1m1
......
...t12cm12 . . . t12
cm1j . . . t12cm1m1
. (15)
Step 2. The normalized total influence matrix for criteria Tαc . After obtaining matrix Tc,
its normalization is conducted. During the process of normalizing, the criteria total-influence matrixTc yields Tα
c . Normalized matrix Tαc is shown in Equation (16):
Tαc =
D1 D2 . . . Dn
c11c12 . . . c1m1 c21c22 . . . c2m2 . . . cn1cn2 . . . cnmn
D1
D2
Dn
c11
c12...
c1m1
c21
c22...
c 2m2...
cn1
cn2...
cnmn
Tα11c Tα212
c · · · Tα1nc
Tα21c Tα22
c · · · Tα2nc
......
. . ....
Tαn1c Tαn2
c · · · Tαnnc
. (16)
Sustainability 2016, 8, 954 11 of 27
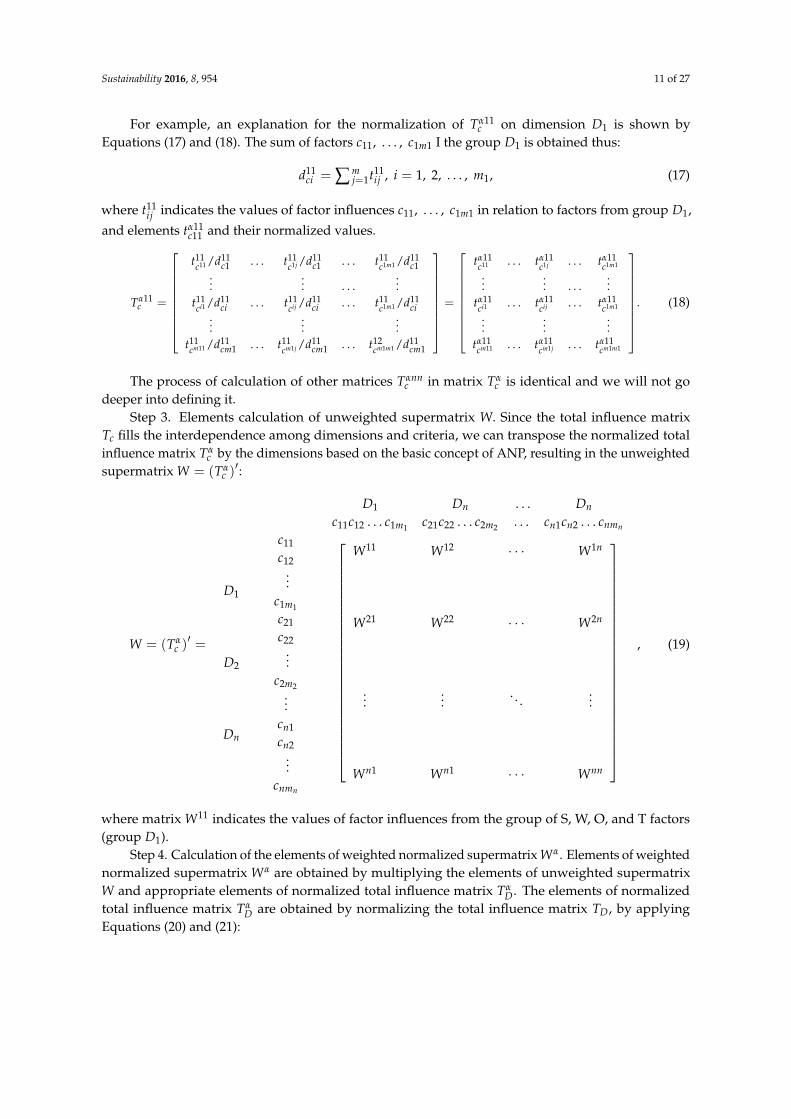
For example, an explanation for the normalization of Tα11c on dimension D1 is shown by
Equations (17) and (18). The sum of factors c11, . . . , c1m1 I the group D1 is obtained thus:
d11ci = ∑ m
j=1t11ij , i = 1, 2, . . . , m1, (17)
where t11ij indicates the values of factor influences c11, . . . , c1m1 in relation to factors from group D1,
and elements tα11c11 and their normalized values.
Tα11c =
t11c11 /d11
c1 . . . t11c1j /d11
c1 . . . t11c1m1 /d11
c1...
... . . ....
t11ci1 /d11
ci . . . t11cij /d11
ci . . . t11c1m1 /d11
ci...
......
t11cm11 /d11
cm1 . . . t11cm1j /d11
cm1 . . . t12cm1m1 /d11
cm1
=
tα11c11 . . . tα11
c1j . . . tα11c1m1
...... . . .
...tα11ci1 . . . tα11
cij . . . tα11c1m1
......
...tα11cm11 . . . tα11
cm1j . . . tα11cm1m1
. (18)
The process of calculation of other matrices Tαnnc in matrix Tα
c is identical and we will not godeeper into defining it.
Step 3. Elements calculation of unweighted supermatrix W. Since the total influence matrixTc fills the interdependence among dimensions and criteria, we can transpose the normalized totalinfluence matrix Tα
c by the dimensions based on the basic concept of ANP, resulting in the unweightedsupermatrix W = (Tα
c )′:
W = (Tαc )′ =
D1 Dn . . . Dn
c11c12 . . . c1m1 c21c22 . . . c2m2 . . . cn1cn2 . . . cnmn
D1
D2
Dn
c11
c12...
c1m1
c21
c22...
c2m2...
cn1
cn2...
cnmn
W11 W12 · · · W1n
W21 W22 · · · W2n
......
. . ....
Wn1 Wn1 · · · Wnn
, (19)
where matrix W11 indicates the values of factor influences from the group of S, W, O, and T factors(group D1).
Step 4. Calculation of the elements of weighted normalized supermatrix Wα. Elements of weightednormalized supermatrix Wα are obtained by multiplying the elements of unweighted supermatrixW and appropriate elements of normalized total influence matrix Tα
D. The elements of normalizedtotal influence matrix Tα
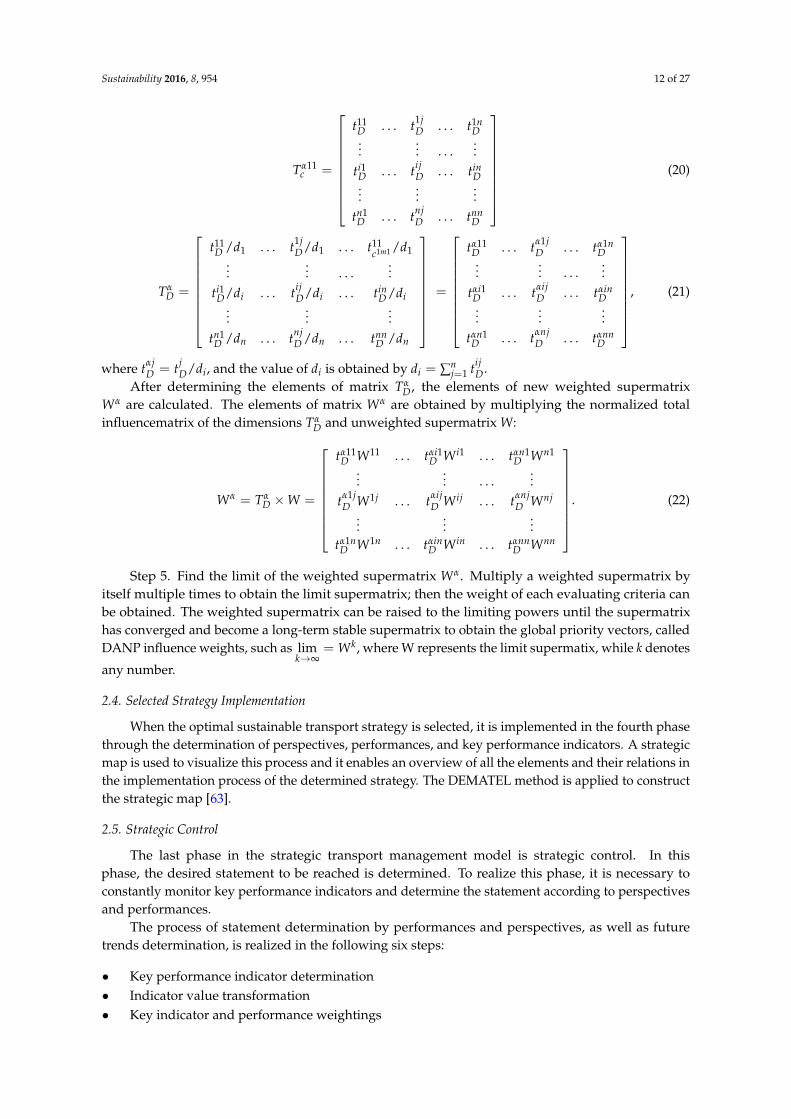
D are obtained by normalizing the total influence matrix TD, by applyingEquations (20) and (21):
Sustainability 2016, 8, 954 12 of 27
Tα11c =
t11D . . . t1j
D . . . t1nD
...... . . .
...ti1D . . . tij
D . . . tinD
......
...tn1D . . . tnj
D . . . tnnD
(20)
TαD =
t11D /d1 . . . t1j
D/d1 . . . t11c1m1 /d1
...... . . .
...ti1D/di . . . tij
D/di . . . tinD /di
......
...tn1D /dn . . . tnj
D /dn . . . tnnD /dn
=
tα11D . . . tα1j
D . . . tα1nD
...... . . .
...tαi1D . . . tαij
D . . . tαinD
......
...tαn1D . . . tαnj
D . . . tαnnD
, (21)
where tαjD = tj
D/di, and the value of di is obtained by di = ∑nj=1 tij
D.After determining the elements of matrix Tα
D, the elements of new weighted supermatrixWα are calculated. The elements of matrix Wα are obtained by multiplying the normalized totalinfluencematrix of the dimensions Tα
D and unweighted supermatrix W:
Wα = TαD ×W =
tα11D W11 . . . tαi1
D Wi1 . . . tαn1D Wn1
...... . . .
...tα1jD W1j . . . tαij
D Wij . . . tαnjD Wnj
......
...tα1nD W1n . . . tαin
D Win . . . tαnnD Wnn
. (22)
Step 5. Find the limit of the weighted supermatrix Wα. Multiply a weighted supermatrix byitself multiple times to obtain the limit supermatrix; then the weight of each evaluating criteria canbe obtained. The weighted supermatrix can be raised to the limiting powers until the supermatrixhas converged and become a long-term stable supermatrix to obtain the global priority vectors, calledDANP influence weights, such as lim
k→∞= Wk, where W represents the limit supermatix, while k denotes
any number.
2.4. Selected Strategy Implementation
When the optimal sustainable transport strategy is selected, it is implemented in the fourth phasethrough the determination of perspectives, performances, and key performance indicators. A strategicmap is used to visualize this process and it enables an overview of all the elements and their relations inthe implementation process of the determined strategy. The DEMATEL method is applied to constructthe strategic map [63].
2.5. Strategic Control
The last phase in the strategic transport management model is strategic control. In thisphase, the desired statement to be reached is determined. To realize this phase, it is necessary toconstantly monitor key performance indicators and determine the statement according to perspectivesand performances.
The process of statement determination by performances and perspectives, as well as futuretrends determination, is realized in the following six steps:
• Key performance indicator determination• Indicator value transformation• Key indicator and performance weightings
Sustainability 2016, 8, 954 13 of 27
• Key performance indicator weighted values calculation• Performances and perspectives statement determination• Future trend determination
At the end of this process, if the statement reached is satisfying then it continues into strategyimplementation. If not, appropriate corrective measures are taken for reaching the desired statement.
3. Results and Discussion
The presented strategic transport management model is applied for defining a sustainabletransport strategy for NIS. The NIS is one of the greatest energy systems in southeastern Europeengaged in oil and natural gas exploration, production, and processing, as well as the sale of a wideassortment of oil and gas derivatives and energy projects.
In accordance with current macroeconomic changes that strongly influence this industry,NIS has begun current process of development strategy revision. Taking the importance oftransport in sustainable development into account, long-term consideration of environmental changesoccurred, as well as sustainable development strategy projection. The main challenge in sustainabletransport strategy implementation is achieving a balance between environmental sustainabilityand competitiveness in the transport market. All of this includes investments in new technology,improvements in energy efficiency, an increase in renewable energy and recycling, and waste reduction.
The presented strategic transport management model enables long-term consideration ofenvironmental changes and development projection.
The fourth and fifth phase, implementation and strategic control, are not explained in detail inthis paper. The implementation of these phases requires monitoring of perspectives, performance,and indicators that are determined in the strategy implementation phase for a certain period of time.The aim of monitoring is to determine the reached level in the strategic control phase.
3.1. Strategic Transport Analysis in NIS
The first phase in applying the strategic transport model is strategic analysis. In order to revisethe current development strategy for NIS, the first, strategic analysis phase is performed.
The strategic goal reflected in documents from NIS remains the same—to become the mostefficient, fast-growing energy company in the Balkan region and to remain the leader in the domesticmarket. To become a regional leader, the expansion of NIS must proceed in two ways: exploration,and increased production and trade [64].
In accordance with the commitment of NIS to implement principles of energy efficiency and theuse of renewable energy, as well as the optimal use of available resources in the future, the sustainabledevelopment vision of NIS is focused on responsibility towards future generations.
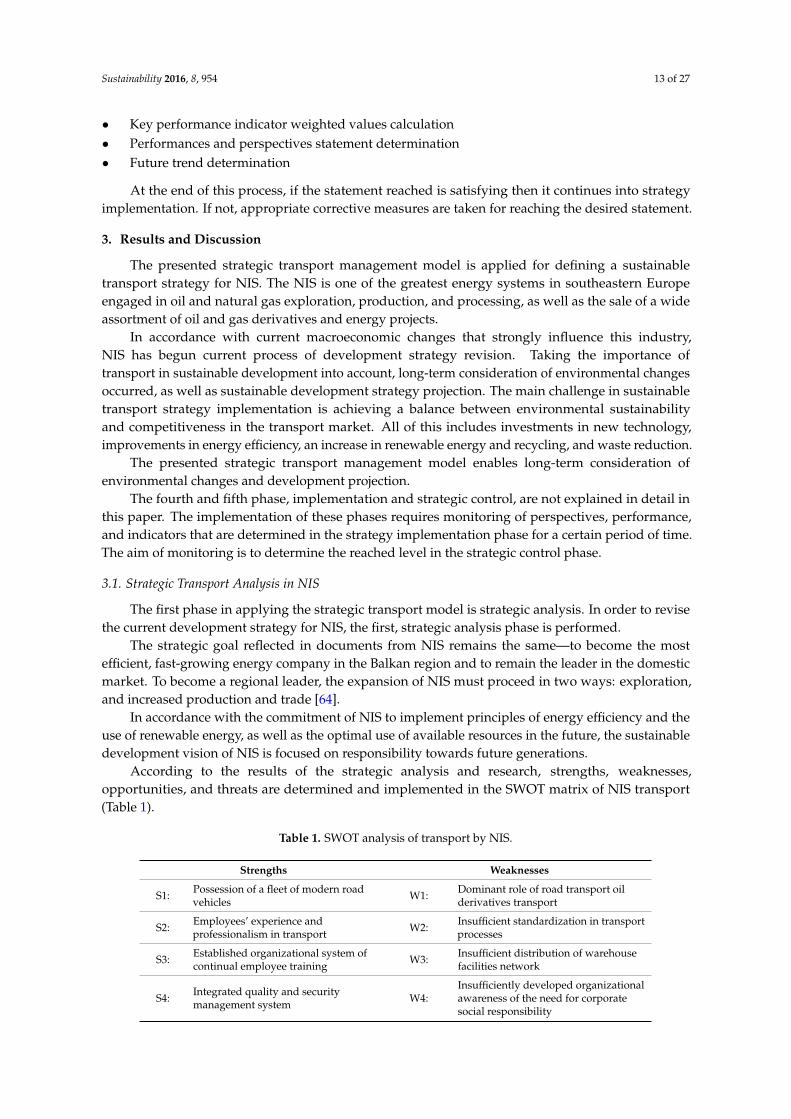
According to the results of the strategic analysis and research, strengths, weaknesses,opportunities, and threats are determined and implemented in the SWOT matrix of NIS transport(Table 1).
Table 1. SWOT analysis of transport by NIS.
Strengths Weaknesses
S1: Possession of a fleet of modern roadvehicles W1: Dominant role of road transport oil
derivatives transport
S2: Employees’ experience andprofessionalism in transport W2: Insufficient standardization in transport
processes
S3: Established organizational system ofcontinual employee training W3: Insufficient distribution of warehouse
facilities network
S4: Integrated quality and securitymanagement system W4:
Insufficiently developed organizationalawareness of the need for corporatesocial responsibility
Sustainability 2016, 8, 954 14 of 27
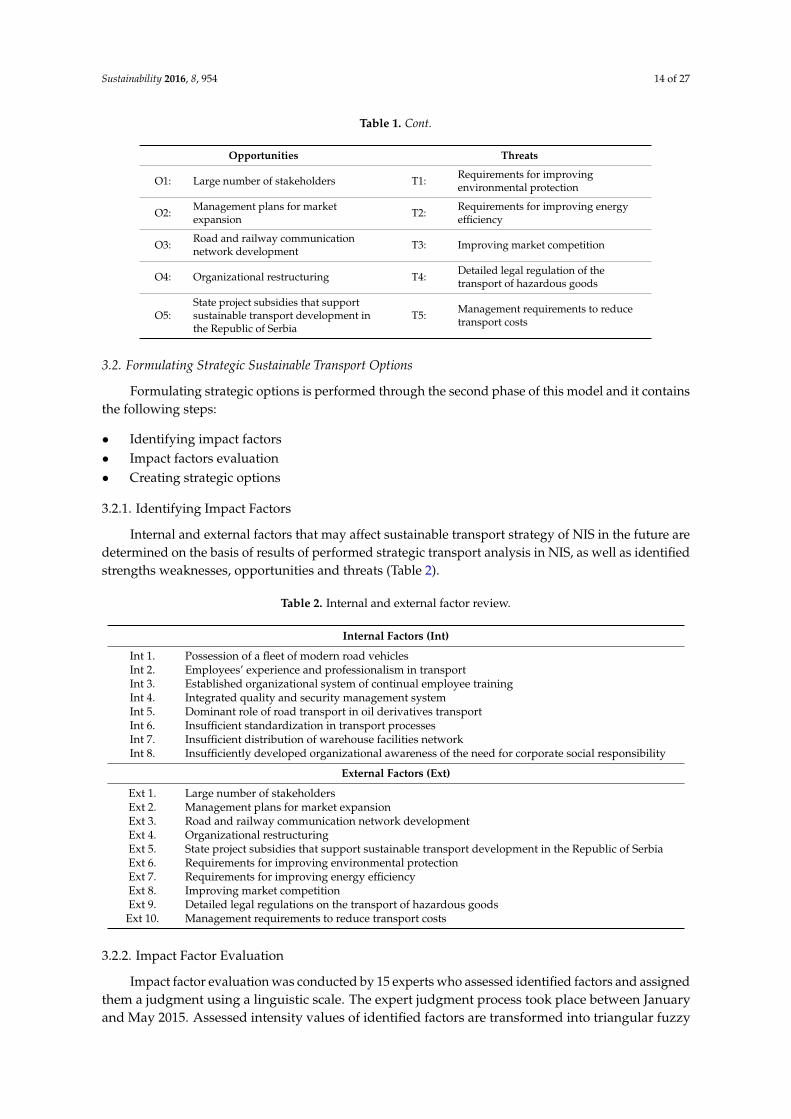
Table 1. Cont.
Opportunities Threats
O1: Large number of stakeholders T1: Requirements for improvingenvironmental protection
O2: Management plans for marketexpansion T2: Requirements for improving energy
efficiency
O3: Road and railway communicationnetwork development T3: Improving market competition
O4: Organizational restructuring T4: Detailed legal regulation of thetransport of hazardous goods
O5:State project subsidies that supportsustainable transport development inthe Republic of Serbia
T5: Management requirements to reducetransport costs
3.2. Formulating Strategic Sustainable Transport Options
Formulating strategic options is performed through the second phase of this model and it containsthe following steps:
• Identifying impact factors• Impact factors evaluation• Creating strategic options
3.2.1. Identifying Impact Factors
Internal and external factors that may affect sustainable transport strategy of NIS in the future aredetermined on the basis of results of performed strategic transport analysis in NIS, as well as identifiedstrengths weaknesses, opportunities and threats (Table 2).
Table 2. Internal and external factor review.
Internal Factors (Int)
Int 1. Possession of a fleet of modern road vehiclesInt 2. Employees’ experience and professionalism in transportInt 3. Established organizational system of continual employee trainingInt 4. Integrated quality and security management systemInt 5. Dominant role of road transport in oil derivatives transportInt 6. Insufficient standardization in transport processesInt 7. Insufficient distribution of warehouse facilities networkInt 8. Insufficiently developed organizational awareness of the need for corporate social responsibility
External Factors (Ext)
Ext 1. Large number of stakeholdersExt 2. Management plans for market expansionExt 3. Road and railway communication network developmentExt 4. Organizational restructuringExt 5. State project subsidies that support sustainable transport development in the Republic of SerbiaExt 6. Requirements for improving environmental protectionExt 7. Requirements for improving energy efficiencyExt 8. Improving market competitionExt 9. Detailed legal regulations on the transport of hazardous goodsExt 10. Management requirements to reduce transport costs
3.2.2. Impact Factor Evaluation
Impact factor evaluation was conducted by 15 experts who assessed identified factors and assignedthem a judgment using a linguistic scale. The expert judgment process took place between Januaryand May 2015. Assessed intensity values of identified factors are transformed into triangular fuzzy
Sustainability 2016, 8, 954 15 of 27
numbers through the application of a fuzzy transformation scale (Figure 3). Average expert judgmentOsr =
(al
sr, amsr, au
sr
), for each factor is obtained by the aggregation of individual judgment in the
form of average values of a given set of fuzzy numbers (judgments) for this factor, according tothe expression:
Osr =(
alsr, am
sr, ausr
)=
(1N ∑ N
i=1ali ,
1N ∑ N
i=1ami ,
1N ∑ N
i=1aui
). (23)
Given that Osr is not entirely congruent with any number of the fuzzy scale for fuzzification oflinguistic terms, like linguistic expert judgment interpretation, the fuzzy number O′sr that appears tobe the average value of expert judgment, or its corresponding linguistic term that is mostly congruentwith Osr, should be accepted. In this sense, for a linguistic term that represents expert judgment aboutthe influence of a specific factor, the term that will be accepted is the one whose fuzzy representationO′sr intersects Osr at the maximum height, i.e., has the highest value of the membership degree.
In accordance with the modified fuzzy Delphi method, presented in previous parts of this paper,the process was conducted through two cycles when the required stability in expert judgment isobtained (∆W = 0.12 < ε).
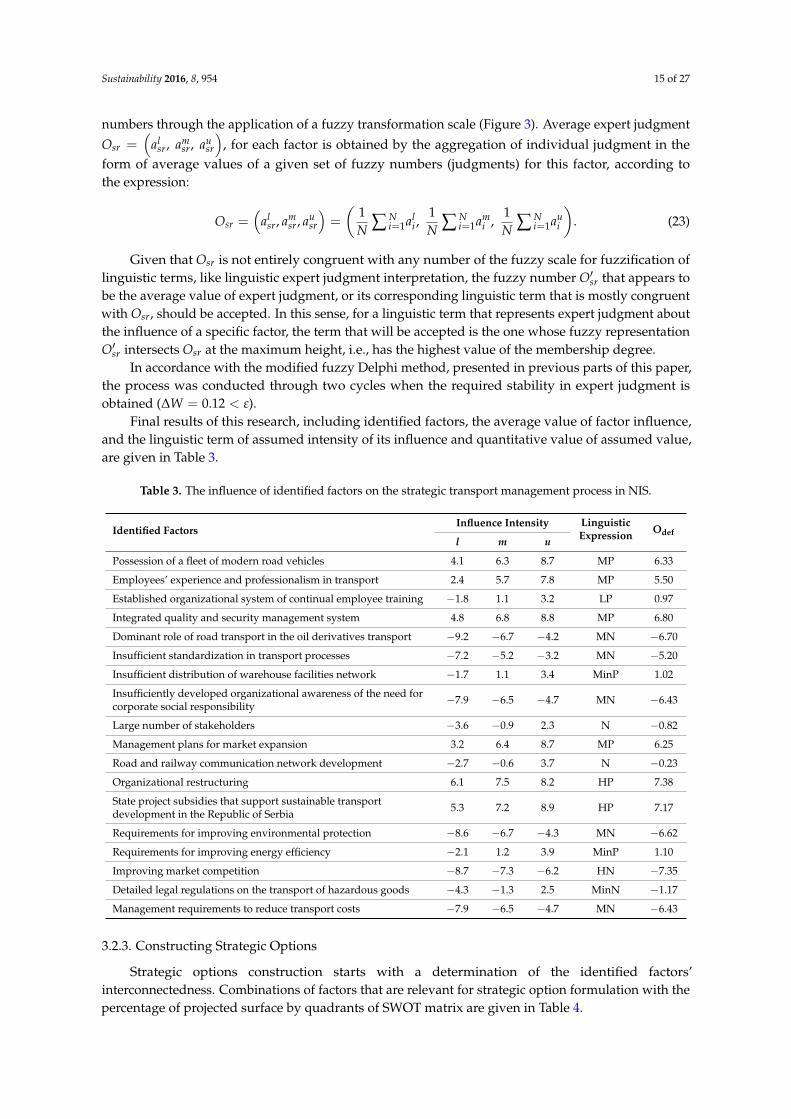
Final results of this research, including identified factors, the average value of factor influence,and the linguistic term of assumed intensity of its influence and quantitative value of assumed value,are given in Table 3.
Table 3. The influence of identified factors on the strategic transport management process in NIS.
Identified FactorsInfluence Intensity Linguistic
Expression Odefl m u
Possession of a fleet of modern road vehicles 4.1 6.3 8.7 MP 6.33
Employees’ experience and professionalism in transport 2.4 5.7 7.8 MP 5.50
Established organizational system of continual employee training −1.8 1.1 3.2 LP 0.97
Integrated quality and security management system 4.8 6.8 8.8 MP 6.80
Dominant role of road transport in the oil derivatives transport −9.2 −6.7 −4.2 MN −6.70
Insufficient standardization in transport processes −7.2 −5.2 −3.2 MN −5.20
Insufficient distribution of warehouse facilities network −1.7 1.1 3.4 MinP 1.02
Insufficiently developed organizational awareness of the need forcorporate social responsibility −7.9 −6.5 −4.7 MN −6.43
Large number of stakeholders −3.6 −0.9 2.3 N −0.82
Management plans for market expansion 3.2 6.4 8.7 MP 6.25
Road and railway communication network development −2.7 −0.6 3.7 N −0.23
Organizational restructuring 6.1 7.5 8.2 HP 7.38
State project subsidies that support sustainable transportdevelopment in the Republic of Serbia 5.3 7.2 8.9 HP 7.17
Requirements for improving environmental protection −8.6 −6.7 −4.3 MN −6.62
Requirements for improving energy efficiency −2.1 1.2 3.9 MinP 1.10
Improving market competition −8.7 −7.3 −6.2 HN −7.35
Detailed legal regulations on the transport of hazardous goods −4.3 −1.3 2.5 MinN −1.17
Management requirements to reduce transport costs −7.9 −6.5 −4.7 MN −6.43
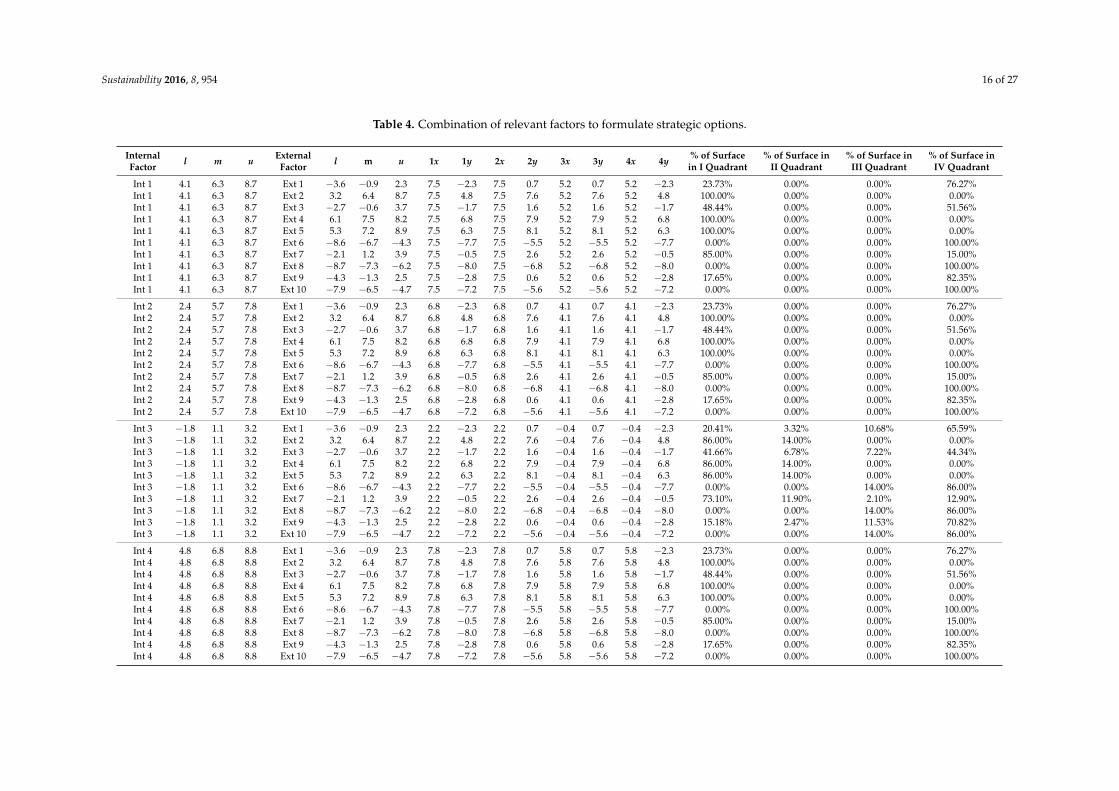
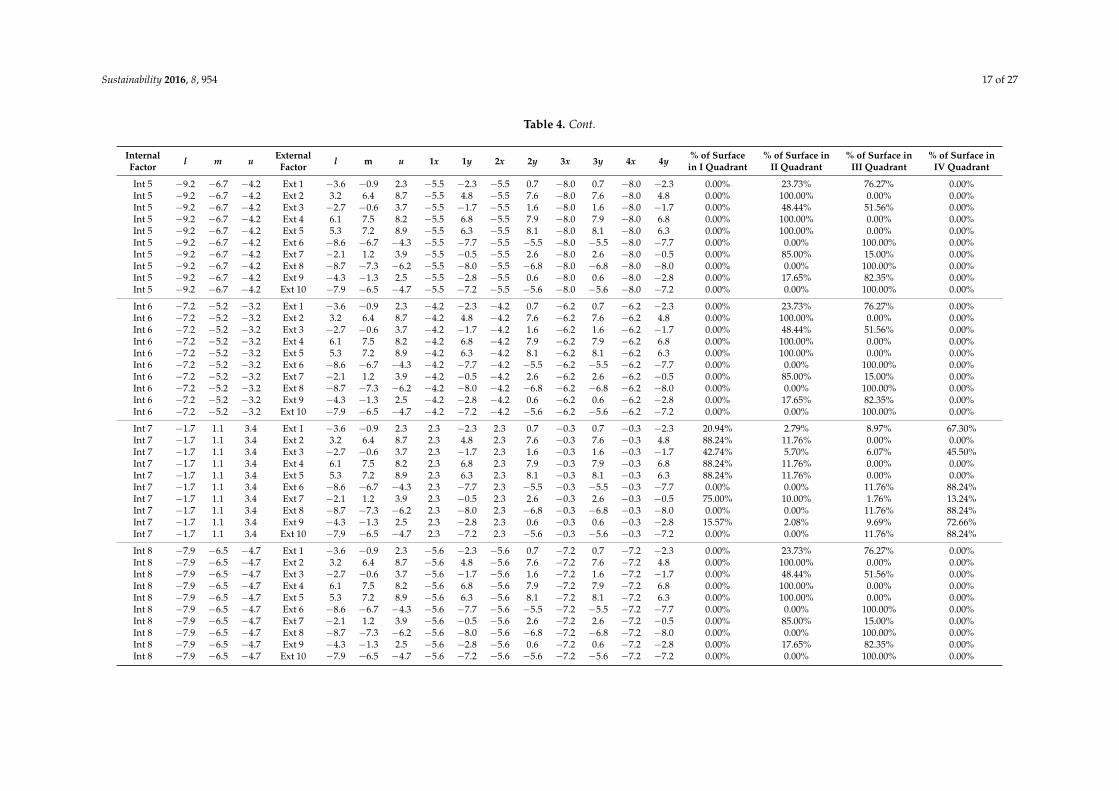
3.2.3. Constructing Strategic Options
Strategic options construction starts with a determination of the identified factors’interconnectedness. Combinations of factors that are relevant for strategic option formulation with thepercentage of projected surface by quadrants of SWOT matrix are given in Table 4.
Sustainability 2016, 8, 954 16 of 27
Table 4. Combination of relevant factors to formulate strategic options.
InternalFactor l m u External
Factor l m u 1x 1y 2x 2y 3x 3y 4x 4y % of Surfacein I Quadrant
% of Surface inII Quadrant
% of Surface inIII Quadrant
% of Surface inIV Quadrant
Int 1 4.1 6.3 8.7 Ext 1 −3.6 −0.9 2.3 7.5 −2.3 7.5 0.7 5.2 0.7 5.2 −2.3 23.73% 0.00% 0.00% 76.27%Int 1 4.1 6.3 8.7 Ext 2 3.2 6.4 8.7 7.5 4.8 7.5 7.6 5.2 7.6 5.2 4.8 100.00% 0.00% 0.00% 0.00%Int 1 4.1 6.3 8.7 Ext 3 −2.7 −0.6 3.7 7.5 −1.7 7.5 1.6 5.2 1.6 5.2 −1.7 48.44% 0.00% 0.00% 51.56%Int 1 4.1 6.3 8.7 Ext 4 6.1 7.5 8.2 7.5 6.8 7.5 7.9 5.2 7.9 5.2 6.8 100.00% 0.00% 0.00% 0.00%Int 1 4.1 6.3 8.7 Ext 5 5.3 7.2 8.9 7.5 6.3 7.5 8.1 5.2 8.1 5.2 6.3 100.00% 0.00% 0.00% 0.00%Int 1 4.1 6.3 8.7 Ext 6 −8.6 −6.7 −4.3 7.5 −7.7 7.5 −5.5 5.2 −5.5 5.2 −7.7 0.00% 0.00% 0.00% 100.00%Int 1 4.1 6.3 8.7 Ext 7 −2.1 1.2 3.9 7.5 −0.5 7.5 2.6 5.2 2.6 5.2 −0.5 85.00% 0.00% 0.00% 15.00%Int 1 4.1 6.3 8.7 Ext 8 −8.7 −7.3 −6.2 7.5 −8.0 7.5 −6.8 5.2 −6.8 5.2 −8.0 0.00% 0.00% 0.00% 100.00%Int 1 4.1 6.3 8.7 Ext 9 −4.3 −1.3 2.5 7.5 −2.8 7.5 0.6 5.2 0.6 5.2 −2.8 17.65% 0.00% 0.00% 82.35%Int 1 4.1 6.3 8.7 Ext 10 −7.9 −6.5 −4.7 7.5 −7.2 7.5 −5.6 5.2 −5.6 5.2 −7.2 0.00% 0.00% 0.00% 100.00%
Int 2 2.4 5.7 7.8 Ext 1 −3.6 −0.9 2.3 6.8 −2.3 6.8 0.7 4.1 0.7 4.1 −2.3 23.73% 0.00% 0.00% 76.27%Int 2 2.4 5.7 7.8 Ext 2 3.2 6.4 8.7 6.8 4.8 6.8 7.6 4.1 7.6 4.1 4.8 100.00% 0.00% 0.00% 0.00%Int 2 2.4 5.7 7.8 Ext 3 −2.7 −0.6 3.7 6.8 −1.7 6.8 1.6 4.1 1.6 4.1 −1.7 48.44% 0.00% 0.00% 51.56%Int 2 2.4 5.7 7.8 Ext 4 6.1 7.5 8.2 6.8 6.8 6.8 7.9 4.1 7.9 4.1 6.8 100.00% 0.00% 0.00% 0.00%Int 2 2.4 5.7 7.8 Ext 5 5.3 7.2 8.9 6.8 6.3 6.8 8.1 4.1 8.1 4.1 6.3 100.00% 0.00% 0.00% 0.00%Int 2 2.4 5.7 7.8 Ext 6 −8.6 −6.7 −4.3 6.8 −7.7 6.8 −5.5 4.1 −5.5 4.1 −7.7 0.00% 0.00% 0.00% 100.00%Int 2 2.4 5.7 7.8 Ext 7 −2.1 1.2 3.9 6.8 −0.5 6.8 2.6 4.1 2.6 4.1 −0.5 85.00% 0.00% 0.00% 15.00%Int 2 2.4 5.7 7.8 Ext 8 −8.7 −7.3 −6.2 6.8 −8.0 6.8 −6.8 4.1 −6.8 4.1 −8.0 0.00% 0.00% 0.00% 100.00%Int 2 2.4 5.7 7.8 Ext 9 −4.3 −1.3 2.5 6.8 −2.8 6.8 0.6 4.1 0.6 4.1 −2.8 17.65% 0.00% 0.00% 82.35%Int 2 2.4 5.7 7.8 Ext 10 −7.9 −6.5 −4.7 6.8 −7.2 6.8 −5.6 4.1 −5.6 4.1 −7.2 0.00% 0.00% 0.00% 100.00%
Int 3 −1.8 1.1 3.2 Ext 1 −3.6 −0.9 2.3 2.2 −2.3 2.2 0.7 −0.4 0.7 −0.4 −2.3 20.41% 3.32% 10.68% 65.59%Int 3 −1.8 1.1 3.2 Ext 2 3.2 6.4 8.7 2.2 4.8 2.2 7.6 −0.4 7.6 −0.4 4.8 86.00% 14.00% 0.00% 0.00%Int 3 −1.8 1.1 3.2 Ext 3 −2.7 −0.6 3.7 2.2 −1.7 2.2 1.6 −0.4 1.6 −0.4 −1.7 41.66% 6.78% 7.22% 44.34%Int 3 −1.8 1.1 3.2 Ext 4 6.1 7.5 8.2 2.2 6.8 2.2 7.9 −0.4 7.9 −0.4 6.8 86.00% 14.00% 0.00% 0.00%Int 3 −1.8 1.1 3.2 Ext 5 5.3 7.2 8.9 2.2 6.3 2.2 8.1 −0.4 8.1 −0.4 6.3 86.00% 14.00% 0.00% 0.00%Int 3 −1.8 1.1 3.2 Ext 6 −8.6 −6.7 −4.3 2.2 −7.7 2.2 −5.5 −0.4 −5.5 −0.4 −7.7 0.00% 0.00% 14.00% 86.00%Int 3 −1.8 1.1 3.2 Ext 7 −2.1 1.2 3.9 2.2 −0.5 2.2 2.6 −0.4 2.6 −0.4 −0.5 73.10% 11.90% 2.10% 12.90%Int 3 −1.8 1.1 3.2 Ext 8 −8.7 −7.3 −6.2 2.2 −8.0 2.2 −6.8 −0.4 −6.8 −0.4 −8.0 0.00% 0.00% 14.00% 86.00%Int 3 −1.8 1.1 3.2 Ext 9 −4.3 −1.3 2.5 2.2 −2.8 2.2 0.6 −0.4 0.6 −0.4 −2.8 15.18% 2.47% 11.53% 70.82%Int 3 −1.8 1.1 3.2 Ext 10 −7.9 −6.5 −4.7 2.2 −7.2 2.2 −5.6 −0.4 −5.6 −0.4 −7.2 0.00% 0.00% 14.00% 86.00%
Int 4 4.8 6.8 8.8 Ext 1 −3.6 −0.9 2.3 7.8 −2.3 7.8 0.7 5.8 0.7 5.8 −2.3 23.73% 0.00% 0.00% 76.27%Int 4 4.8 6.8 8.8 Ext 2 3.2 6.4 8.7 7.8 4.8 7.8 7.6 5.8 7.6 5.8 4.8 100.00% 0.00% 0.00% 0.00%Int 4 4.8 6.8 8.8 Ext 3 −2.7 −0.6 3.7 7.8 −1.7 7.8 1.6 5.8 1.6 5.8 −1.7 48.44% 0.00% 0.00% 51.56%Int 4 4.8 6.8 8.8 Ext 4 6.1 7.5 8.2 7.8 6.8 7.8 7.9 5.8 7.9 5.8 6.8 100.00% 0.00% 0.00% 0.00%Int 4 4.8 6.8 8.8 Ext 5 5.3 7.2 8.9 7.8 6.3 7.8 8.1 5.8 8.1 5.8 6.3 100.00% 0.00% 0.00% 0.00%Int 4 4.8 6.8 8.8 Ext 6 −8.6 −6.7 −4.3 7.8 −7.7 7.8 −5.5 5.8 −5.5 5.8 −7.7 0.00% 0.00% 0.00% 100.00%Int 4 4.8 6.8 8.8 Ext 7 −2.1 1.2 3.9 7.8 −0.5 7.8 2.6 5.8 2.6 5.8 −0.5 85.00% 0.00% 0.00% 15.00%Int 4 4.8 6.8 8.8 Ext 8 −8.7 −7.3 −6.2 7.8 −8.0 7.8 −6.8 5.8 −6.8 5.8 −8.0 0.00% 0.00% 0.00% 100.00%Int 4 4.8 6.8 8.8 Ext 9 −4.3 −1.3 2.5 7.8 −2.8 7.8 0.6 5.8 0.6 5.8 −2.8 17.65% 0.00% 0.00% 82.35%Int 4 4.8 6.8 8.8 Ext 10 −7.9 −6.5 −4.7 7.8 −7.2 7.8 −5.6 5.8 −5.6 5.8 −7.2 0.00% 0.00% 0.00% 100.00%
Sustainability 2016, 8, 954 17 of 27
Table 4. Cont.
InternalFactor l m u External
Factor l m u 1x 1y 2x 2y 3x 3y 4x 4y % of Surfacein I Quadrant
% of Surface inII Quadrant
% of Surface inIII Quadrant
% of Surface inIV Quadrant
Int 5 −9.2 −6.7 −4.2 Ext 1 −3.6 −0.9 2.3 −5.5 −2.3 −5.5 0.7 −8.0 0.7 −8.0 −2.3 0.00% 23.73% 76.27% 0.00%Int 5 −9.2 −6.7 −4.2 Ext 2 3.2 6.4 8.7 −5.5 4.8 −5.5 7.6 −8.0 7.6 −8.0 4.8 0.00% 100.00% 0.00% 0.00%Int 5 −9.2 −6.7 −4.2 Ext 3 −2.7 −0.6 3.7 −5.5 −1.7 −5.5 1.6 −8.0 1.6 −8.0 −1.7 0.00% 48.44% 51.56% 0.00%Int 5 −9.2 −6.7 −4.2 Ext 4 6.1 7.5 8.2 −5.5 6.8 −5.5 7.9 −8.0 7.9 −8.0 6.8 0.00% 100.00% 0.00% 0.00%Int 5 −9.2 −6.7 −4.2 Ext 5 5.3 7.2 8.9 −5.5 6.3 −5.5 8.1 −8.0 8.1 −8.0 6.3 0.00% 100.00% 0.00% 0.00%Int 5 −9.2 −6.7 −4.2 Ext 6 −8.6 −6.7 −4.3 −5.5 −7.7 −5.5 −5.5 −8.0 −5.5 −8.0 −7.7 0.00% 0.00% 100.00% 0.00%Int 5 −9.2 −6.7 −4.2 Ext 7 −2.1 1.2 3.9 −5.5 −0.5 −5.5 2.6 −8.0 2.6 −8.0 −0.5 0.00% 85.00% 15.00% 0.00%Int 5 −9.2 −6.7 −4.2 Ext 8 −8.7 −7.3 −6.2 −5.5 −8.0 −5.5 −6.8 −8.0 −6.8 −8.0 −8.0 0.00% 0.00% 100.00% 0.00%Int 5 −9.2 −6.7 −4.2 Ext 9 −4.3 −1.3 2.5 −5.5 −2.8 −5.5 0.6 −8.0 0.6 −8.0 −2.8 0.00% 17.65% 82.35% 0.00%Int 5 −9.2 −6.7 −4.2 Ext 10 −7.9 −6.5 −4.7 −5.5 −7.2 −5.5 −5.6 −8.0 −5.6 −8.0 −7.2 0.00% 0.00% 100.00% 0.00%
Int 6 −7.2 −5.2 −3.2 Ext 1 −3.6 −0.9 2.3 −4.2 −2.3 −4.2 0.7 −6.2 0.7 −6.2 −2.3 0.00% 23.73% 76.27% 0.00%Int 6 −7.2 −5.2 −3.2 Ext 2 3.2 6.4 8.7 −4.2 4.8 −4.2 7.6 −6.2 7.6 −6.2 4.8 0.00% 100.00% 0.00% 0.00%Int 6 −7.2 −5.2 −3.2 Ext 3 −2.7 −0.6 3.7 −4.2 −1.7 −4.2 1.6 −6.2 1.6 −6.2 −1.7 0.00% 48.44% 51.56% 0.00%Int 6 −7.2 −5.2 −3.2 Ext 4 6.1 7.5 8.2 −4.2 6.8 −4.2 7.9 −6.2 7.9 −6.2 6.8 0.00% 100.00% 0.00% 0.00%Int 6 −7.2 −5.2 −3.2 Ext 5 5.3 7.2 8.9 −4.2 6.3 −4.2 8.1 −6.2 8.1 −6.2 6.3 0.00% 100.00% 0.00% 0.00%Int 6 −7.2 −5.2 −3.2 Ext 6 −8.6 −6.7 −4.3 −4.2 −7.7 −4.2 −5.5 −6.2 −5.5 −6.2 −7.7 0.00% 0.00% 100.00% 0.00%Int 6 −7.2 −5.2 −3.2 Ext 7 −2.1 1.2 3.9 −4.2 −0.5 −4.2 2.6 −6.2 2.6 −6.2 −0.5 0.00% 85.00% 15.00% 0.00%Int 6 −7.2 −5.2 −3.2 Ext 8 −8.7 −7.3 −6.2 −4.2 −8.0 −4.2 −6.8 −6.2 −6.8 −6.2 −8.0 0.00% 0.00% 100.00% 0.00%Int 6 −7.2 −5.2 −3.2 Ext 9 −4.3 −1.3 2.5 −4.2 −2.8 −4.2 0.6 −6.2 0.6 −6.2 −2.8 0.00% 17.65% 82.35% 0.00%Int 6 −7.2 −5.2 −3.2 Ext 10 −7.9 −6.5 −4.7 −4.2 −7.2 −4.2 −5.6 −6.2 −5.6 −6.2 −7.2 0.00% 0.00% 100.00% 0.00%
Int 7 −1.7 1.1 3.4 Ext 1 −3.6 −0.9 2.3 2.3 −2.3 2.3 0.7 −0.3 0.7 −0.3 −2.3 20.94% 2.79% 8.97% 67.30%Int 7 −1.7 1.1 3.4 Ext 2 3.2 6.4 8.7 2.3 4.8 2.3 7.6 −0.3 7.6 −0.3 4.8 88.24% 11.76% 0.00% 0.00%Int 7 −1.7 1.1 3.4 Ext 3 −2.7 −0.6 3.7 2.3 −1.7 2.3 1.6 −0.3 1.6 −0.3 −1.7 42.74% 5.70% 6.07% 45.50%Int 7 −1.7 1.1 3.4 Ext 4 6.1 7.5 8.2 2.3 6.8 2.3 7.9 −0.3 7.9 −0.3 6.8 88.24% 11.76% 0.00% 0.00%Int 7 −1.7 1.1 3.4 Ext 5 5.3 7.2 8.9 2.3 6.3 2.3 8.1 −0.3 8.1 −0.3 6.3 88.24% 11.76% 0.00% 0.00%Int 7 −1.7 1.1 3.4 Ext 6 −8.6 −6.7 −4.3 2.3 −7.7 2.3 −5.5 −0.3 −5.5 −0.3 −7.7 0.00% 0.00% 11.76% 88.24%Int 7 −1.7 1.1 3.4 Ext 7 −2.1 1.2 3.9 2.3 −0.5 2.3 2.6 −0.3 2.6 −0.3 −0.5 75.00% 10.00% 1.76% 13.24%Int 7 −1.7 1.1 3.4 Ext 8 −8.7 −7.3 −6.2 2.3 −8.0 2.3 −6.8 −0.3 −6.8 −0.3 −8.0 0.00% 0.00% 11.76% 88.24%Int 7 −1.7 1.1 3.4 Ext 9 −4.3 −1.3 2.5 2.3 −2.8 2.3 0.6 −0.3 0.6 −0.3 −2.8 15.57% 2.08% 9.69% 72.66%Int 7 −1.7 1.1 3.4 Ext 10 −7.9 −6.5 −4.7 2.3 −7.2 2.3 −5.6 −0.3 −5.6 −0.3 −7.2 0.00% 0.00% 11.76% 88.24%
Int 8 −7.9 −6.5 −4.7 Ext 1 −3.6 −0.9 2.3 −5.6 −2.3 −5.6 0.7 −7.2 0.7 −7.2 −2.3 0.00% 23.73% 76.27% 0.00%Int 8 −7.9 −6.5 −4.7 Ext 2 3.2 6.4 8.7 −5.6 4.8 −5.6 7.6 −7.2 7.6 −7.2 4.8 0.00% 100.00% 0.00% 0.00%Int 8 −7.9 −6.5 −4.7 Ext 3 −2.7 −0.6 3.7 −5.6 −1.7 −5.6 1.6 −7.2 1.6 −7.2 −1.7 0.00% 48.44% 51.56% 0.00%Int 8 −7.9 −6.5 −4.7 Ext 4 6.1 7.5 8.2 −5.6 6.8 −5.6 7.9 −7.2 7.9 −7.2 6.8 0.00% 100.00% 0.00% 0.00%Int 8 −7.9 −6.5 −4.7 Ext 5 5.3 7.2 8.9 −5.6 6.3 −5.6 8.1 −7.2 8.1 −7.2 6.3 0.00% 100.00% 0.00% 0.00%Int 8 −7.9 −6.5 −4.7 Ext 6 −8.6 −6.7 −4.3 −5.6 −7.7 −5.6 −5.5 −7.2 −5.5 −7.2 −7.7 0.00% 0.00% 100.00% 0.00%Int 8 −7.9 −6.5 −4.7 Ext 7 −2.1 1.2 3.9 −5.6 −0.5 −5.6 2.6 −7.2 2.6 −7.2 −0.5 0.00% 85.00% 15.00% 0.00%Int 8 −7.9 −6.5 −4.7 Ext 8 −8.7 −7.3 −6.2 −5.6 −8.0 −5.6 −6.8 −7.2 −6.8 −7.2 −8.0 0.00% 0.00% 100.00% 0.00%Int 8 −7.9 −6.5 −4.7 Ext 9 −4.3 −1.3 2.5 −5.6 −2.8 −5.6 0.6 −7.2 0.6 −7.2 −2.8 0.00% 17.65% 82.35% 0.00%Int 8 −7.9 −6.5 −4.7 Ext 10 −7.9 −6.5 −4.7 −5.6 −7.2 −5.6 −5.6 −7.2 −5.6 −7.2 −7.2 0.00% 0.00% 100.00% 0.00%
Sustainability 2016, 8, 954 18 of 27
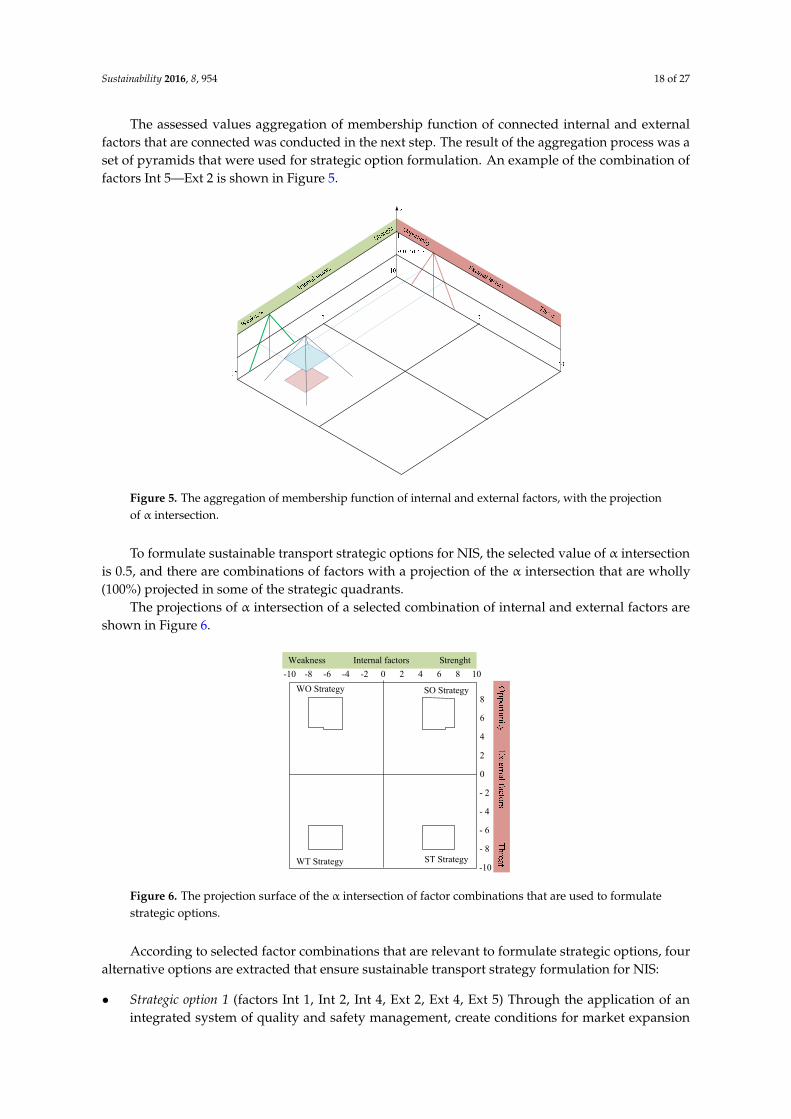
The assessed values aggregation of membership function of connected internal and externalfactors that are connected was conducted in the next step. The result of the aggregation process was aset of pyramids that were used for strategic option formulation. An example of the combination offactors Int 5—Ext 2 is shown in Figure 5.
Sustainability 2016, 8, x 18 of 27
The assessed values aggregation of membership function of connected internal and external factors that are connected was conducted in the next step. The result of the aggregation process was a set of pyramids that were used for strategic option formulation. An example of the combination of factors Int 5—Ext 2 is shown in Figure 5.
Figure 5. The aggregation of membership function of internal and external factors, with the projection of α intersection.
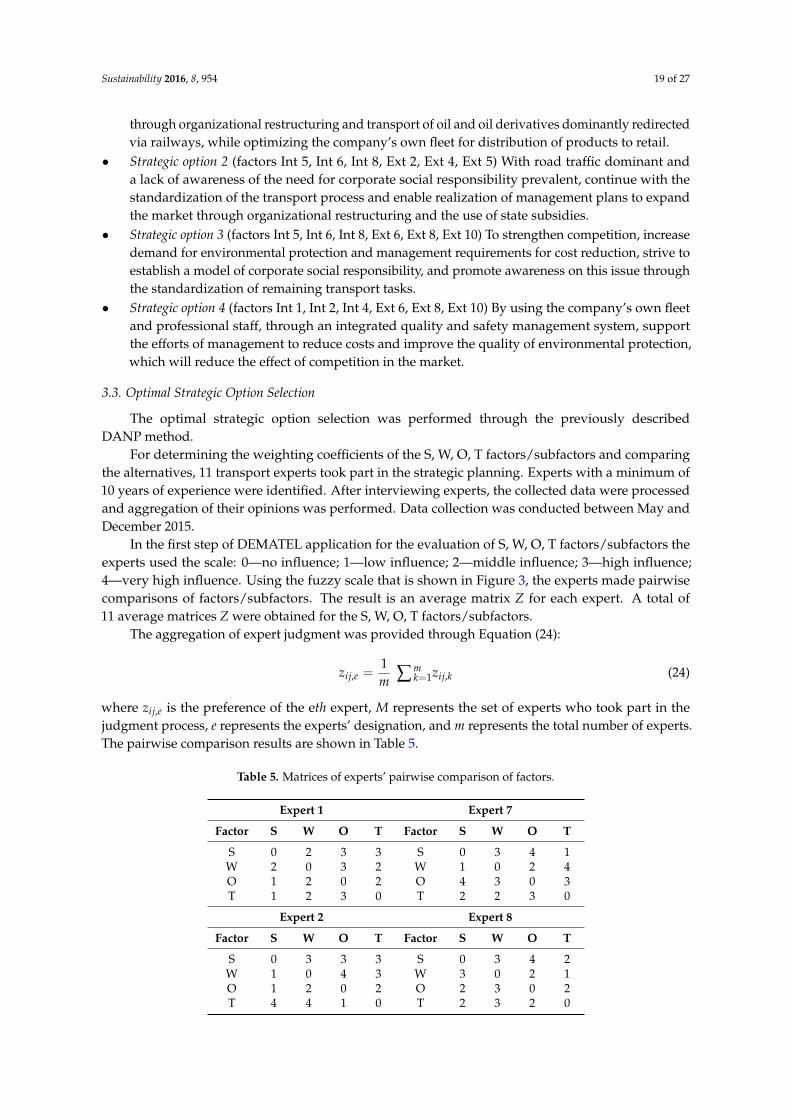
To formulate sustainable transport strategic options for NIS, the selected value of α intersection is 0.5, and there are combinations of factors with a projection of the α intersection that are wholly (100%) projected in some of the strategic quadrants.
The projections of α intersection of a selected combination of internal and external factors are shown in Figure 6.
Figure 6. The projection surface of the α intersection of factor combinations that are used to formulate strategic options.
0 2 4 6 8 10-8 -6 -4 -2-10
0
- 2
8
6
4
2
-10
- 4
- 6
- 8
Weakness Internal factors Strenght
WO Strategy SO Strategy
WT Strategy ST Strategy
Figure 5. The aggregation of membership function of internal and external factors, with the projectionof α intersection.
To formulate sustainable transport strategic options for NIS, the selected value of α intersectionis 0.5, and there are combinations of factors with a projection of the α intersection that are wholly(100%) projected in some of the strategic quadrants.
The projections of α intersection of a selected combination of internal and external factors areshown in Figure 6.
Sustainability 2016, 8, x 18 of 27
The assessed values aggregation of membership function of connected internal and external factors that are connected was conducted in the next step. The result of the aggregation process was a set of pyramids that were used for strategic option formulation. An example of the combination of factors Int 5—Ext 2 is shown in Figure 5.
Figure 5. The aggregation of membership function of internal and external factors, with the projection of α intersection.
To formulate sustainable transport strategic options for NIS, the selected value of α intersection is 0.5, and there are combinations of factors with a projection of the α intersection that are wholly (100%) projected in some of the strategic quadrants.
The projections of α intersection of a selected combination of internal and external factors are shown in Figure 6.
Figure 6. The projection surface of the α intersection of factor combinations that are used to formulate strategic options.
0 2 4 6 8 10-8 -6 -4 -2-10
0
- 2
8
6
4
2
-10
- 4
- 6
- 8
Weakness Internal factors Strenght
WO Strategy SO Strategy
WT Strategy ST Strategy
Figure 6. The projection surface of the α intersection of factor combinations that are used to formulatestrategic options.
According to selected factor combinations that are relevant to formulate strategic options, fouralternative options are extracted that ensure sustainable transport strategy formulation for NIS:
• Strategic option 1 (factors Int 1, Int 2, Int 4, Ext 2, Ext 4, Ext 5) Through the application of anintegrated system of quality and safety management, create conditions for market expansion
Sustainability 2016, 8, 954 19 of 27
through organizational restructuring and transport of oil and oil derivatives dominantly redirectedvia railways, while optimizing the company’s own fleet for distribution of products to retail.
• Strategic option 2 (factors Int 5, Int 6, Int 8, Ext 2, Ext 4, Ext 5) With road traffic dominant anda lack of awareness of the need for corporate social responsibility prevalent, continue with thestandardization of the transport process and enable realization of management plans to expandthe market through organizational restructuring and the use of state subsidies.
• Strategic option 3 (factors Int 5, Int 6, Int 8, Ext 6, Ext 8, Ext 10) To strengthen competition, increasedemand for environmental protection and management requirements for cost reduction, strive toestablish a model of corporate social responsibility, and promote awareness on this issue throughthe standardization of remaining transport tasks.
• Strategic option 4 (factors Int 1, Int 2, Int 4, Ext 6, Ext 8, Ext 10) By using the company’s own fleetand professional staff, through an integrated quality and safety management system, supportthe efforts of management to reduce costs and improve the quality of environmental protection,which will reduce the effect of competition in the market.
3.3. Optimal Strategic Option Selection
The optimal strategic option selection was performed through the previously describedDANP method.
For determining the weighting coefficients of the S, W, O, T factors/subfactors and comparingthe alternatives, 11 transport experts took part in the strategic planning. Experts with a minimum of10 years of experience were identified. After interviewing experts, the collected data were processedand aggregation of their opinions was performed. Data collection was conducted between May andDecember 2015.
In the first step of DEMATEL application for the evaluation of S, W, O, T factors/subfactors theexperts used the scale: 0—no influence; 1—low influence; 2—middle influence; 3—high influence;4—very high influence. Using the fuzzy scale that is shown in Figure 3, the experts made pairwisecomparisons of factors/subfactors. The result is an average matrix Z for each expert. A total of11 average matrices Z were obtained for the S, W, O, T factors/subfactors.
The aggregation of expert judgment was provided through Equation (24):
zij,e =1m ∑ m
k=1zij,k (24)
where zij,e is the preference of the eth expert, M represents the set of experts who took part in thejudgment process, e represents the experts’ designation, and m represents the total number of experts.The pairwise comparison results are shown in Table 5.
Table 5. Matrices of experts’ pairwise comparison of factors.
Expert 1 Expert 7
Factor S W O T Factor S W O T
S 0 2 3 3 S 0 3 4 1W 2 0 3 2 W 1 0 2 4O 1 2 0 2 O 4 3 0 3T 1 2 3 0 T 2 2 3 0
Expert 2 Expert 8
Factor S W O T Factor S W O T
S 0 3 3 3 S 0 3 4 2W 1 0 4 3 W 3 0 2 1O 1 2 0 2 O 2 3 0 2T 4 4 1 0 T 2 3 2 0

Sustainability 2016, 8, 954 20 of 27
Table 5. Cont.
Expert 3 Expert 9
Factor S W O T Factor S W O T
S 0 3 4 2 S 0 2 2 4W 2 0 2 2 W 4 0 2 2O 2 3 0 1 O 2 2 0 3T 3 3 4 0 T 3 3 1 0
Expert 4 Expert 10
Factor S W O T Factor S W O T
S 0 3 3 2 S 0 1 2 4W 1 0 4 2 W 3 0 3 4O 2 3 0 0 O 2 3 0 1T 3 3 3 0 T 3 4 1 0
Expert 5 Expert 11
Factor S W O T Factor S W O T
S 0 3 3 0 S 0 3 3 2W 1 0 2 4 W 3 0 2 2O 2 4 0 2 O 2 3 0 1T 3 2 2 0 T 3 3 4 0
Expert 6 Average matrix
Factor S W O T Factor C1 C2 C3 C4
S 0 3 4 1 S 0.00 2.64 3.18 2.18W 3 0 3 4 W 2.18 0.00 2.64 2.73O 2 2 0 2 O 2.00 2.73 0.00 1.73T 2 3 3 0 T 2.64 2.91 2.45 0.00
Aggregation of experts’ opinions was performed using Equation (24). As a result, the averagematrix Z (Table 5) was obtained. Aggregation of experts’ opinions for subfactors was done in thesame way.
Through the normalization of average matrix Z (Equations (5)–(8)), elements of initialdirect-relation matrices D were formed: matrix Dc for S, W, O, T factors, and matrix Dck for subfactors.Elements of the initial direct-relation matrix D for factors are shown in Table 6.
Table 6. The initial direct-relation matrix for S, W, O, T factors (Dc).
Factor C1 C2 C3 C4
S 0.00 0.33 0.40 0.27W 0.27 0.00 0.33 0.34O 0.25 0.34 0.00 0.22T 0.33 0.36 0.31 0.00
Element normalization of initial direct-relation matrix was conducted by dividing each element ofaverage matrix by Equation (8). By applying Equations (9) and (10), the elements of the total relationmatrix of S, W, O, T factors (Tc) were determined (see Table 7).
Table 7. Total relation matrix of S, W, O, T factors (Tc).
Clusters S W O T
S 1.12 3.52 3.59 1.71W 3.17 2.28 3.29 1.96O 1.51 3.57 1.13 2.18T 2.22 1.28 1.39 1.61
Sustainability 2016, 8, 954 21 of 27
By implementing Equations (11) and (12), the values in matrix T are summarized by rows (Ri) andcolumns (Ci). Summarized values of matrices Tc and Tck by rows and columns are shown in Table 8.
Table 8. The sums of delivered and received among cluster/criteria.
Cluster/Criteria Ri Ci R + C R − C
S 1.21 1.18 2.39 0.04
S1 3.73 3.61 7.34 0.12S2 3.12 3.02 6.14 0.09S3 3.33 3.22 6.55 0.11S4 3.45 3.17 6.62 0.28
W 0.78 0.89 1.67 −0.11
W1 3.47 2.89 6.36 0.58W2 2.92 3.45 6.37 −0.53W3 2.43 2.11 4.54 0.33W4 2.23 2.87 5.10 −0.65
O 0.76 0.79 1.54 −0.03
O1 2.79 2.66 5.45 0.13O2 1.88 2.59 4.48 −0.71O3 2.30 2.21 4.51 0.09O4 1.89 2.17 4.07 −0.28O5 2.81 2.17 4.98 0.64
T 1.11 1.00 2.12 0.11
T1 3.29 1.66 4.95 1.63T2 3.09 2.76 5.85 0.34T3 3.68 2.96 6.64 0.72T4 2.59 2.74 5.33 −0.16T5 3.17 2.54 5.71 0.63
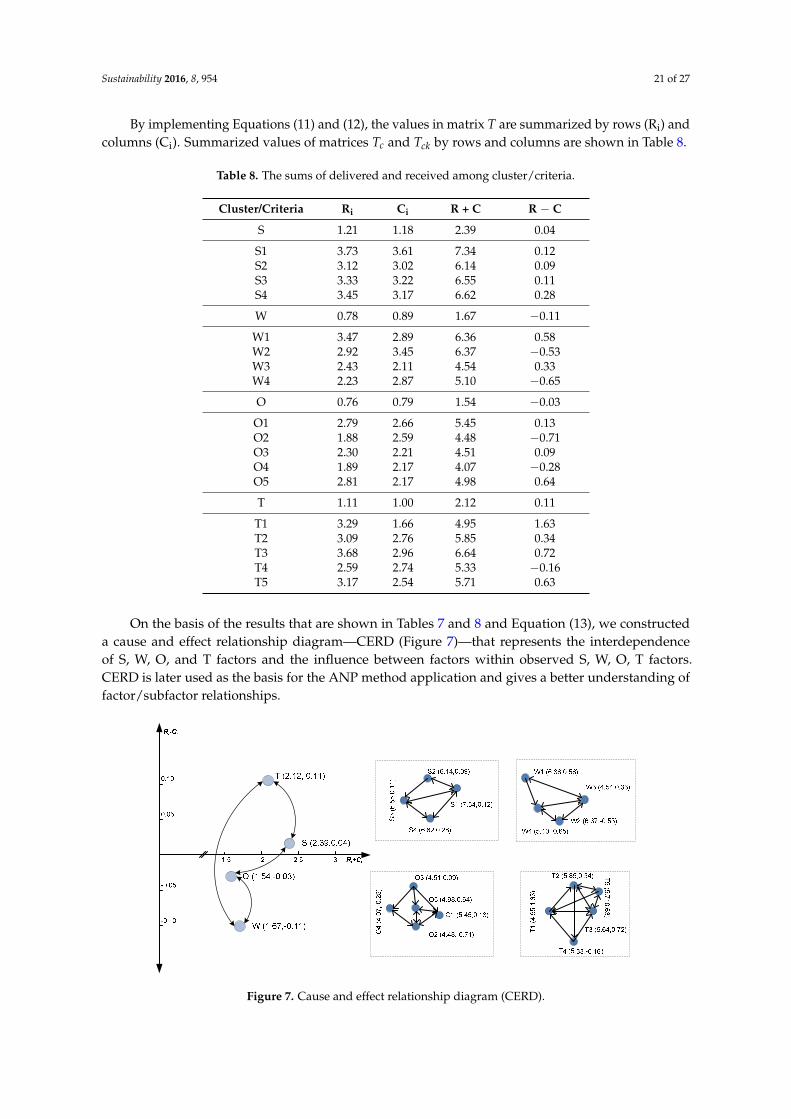
On the basis of the results that are shown in Tables 7 and 8 and Equation (13), we constructeda cause and effect relationship diagram—CERD (Figure 7)—that represents the interdependenceof S, W, O, and T factors and the influence between factors within observed S, W, O, T factors.CERD is later used as the basis for the ANP method application and gives a better understanding offactor/subfactor relationships.
Sustainability 2016, 8, x 21 of 27
By implementing Equations (11) and (12), the values in matrix T are summarized by rows (Ri) and columns (Ci). Summarized values of matrices and by rows and columns are shown in Table 8.
Table 8. The sums of delivered and received among cluster/criteria.
Cluster/Criteria Ri Ci R + C R − C S 1.21 1.18 2.39 0.04S1 3.73 3.61 7.34 0.12S2 3.12 3.02 6.14 0.09S3 3.33 3.22 6.55 0.11S4 3.45 3.17 6.62 0.28W 0.78 0.89 1.67 −0.11
W1 3.47 2.89 6.36 0.58W2 2.92 3.45 6.37 −0.53W3 2.43 2.11 4.54 0.33W4 2.23 2.87 5.10 −0.65O 0.76 0.79 1.54 −0.03
O1 2.79 2.66 5.45 0.13O2 1.88 2.59 4.48 −0.71O3 2.30 2.21 4.51 0.09O4 1.89 2.17 4.07 −0.28O5 2.81 2.17 4.98 0.64T 1.11 1.00 2.12 0.11
T1 3.29 1.66 4.95 1.63T2 3.09 2.76 5.85 0.34T3 3.68 2.96 6.64 0.72T4 2.59 2.74 5.33 −0.16T5 3.17 2.54 5.71 0.63
On the basis of the results that are shown in Tables 7 and 8 and Equation (13), we constructed a cause and effect relationship diagram—CERD (Figure 7)—that represents the interdependence of S, W, O, and T factors and the influence between factors within observed S, W, O, T factors. CERD is later used as the basis for the ANP method application and gives a better understanding of factor/subfactor relationships.
Figure 7. Cause and effect relationship diagram (CERD).
CERD is projected in the network relation map in Figure 8, which facilitates an understanding of the model of the ANP method.
Figure 7. Cause and effect relationship diagram (CERD).
Sustainability 2016, 8, 954 22 of 27
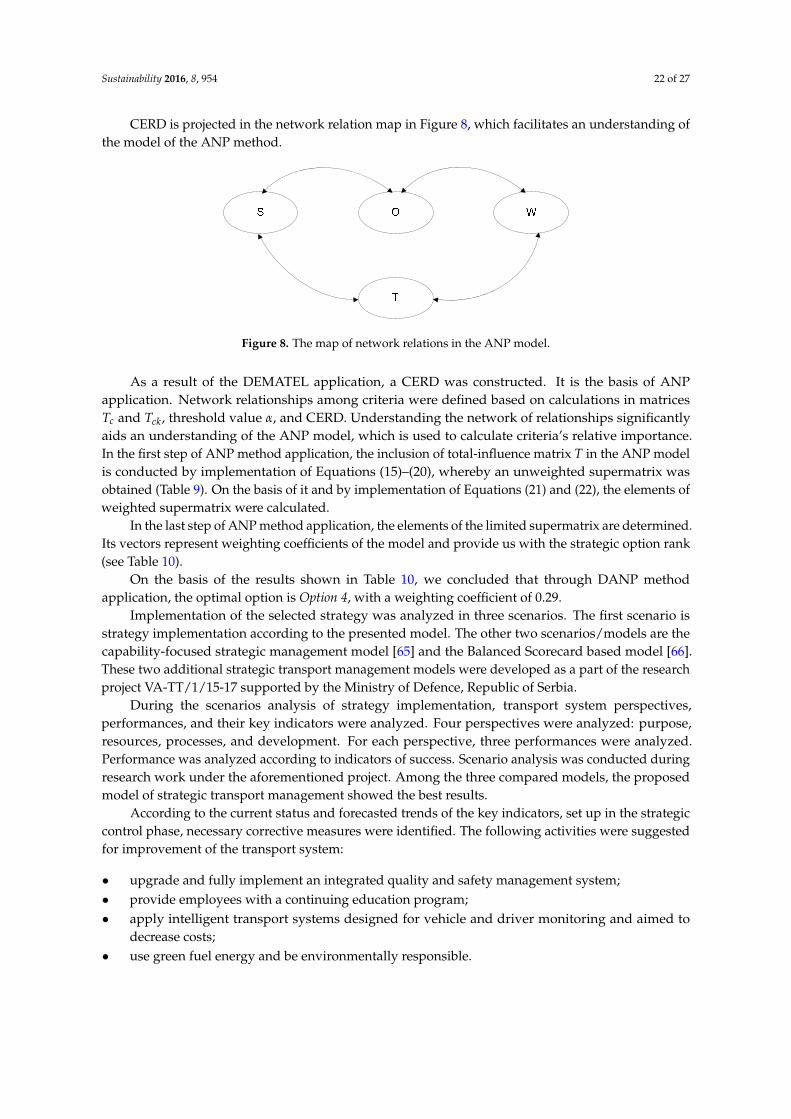
CERD is projected in the network relation map in Figure 8, which facilitates an understanding ofthe model of the ANP method.Sustainability 2016, 8, x 22 of 27
Figure 8. The map of network relations in the ANP model.
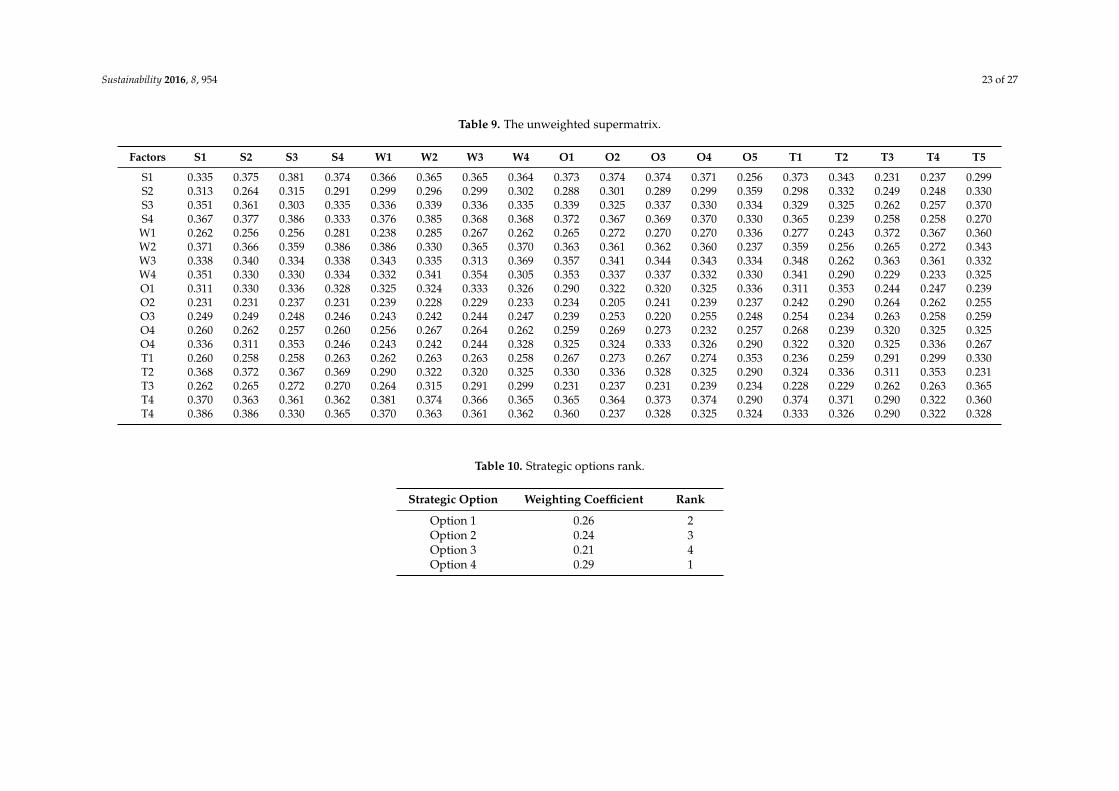
As a result of the DEMATEL application, a CERD was constructed. It is the basis of ANP application. Network relationships among criteria were defined based on calculations in matrices and , threshold value α, and CERD. Understanding the network of relationships significantly aids an understanding of the ANP model, which is used to calculate criteria’s relative importance. In the first step of ANP method application, the inclusion of total-influence matrix T in the ANP model is conducted by implementation of Equations (15)–(20), whereby an unweighted supermatrix was obtained (Table 9). On the basis of it and by implementation of Equations (21) and (22), the elements of weighted supermatrix were calculated.
In the last step of ANP method application, the elements of the limited supermatrix are determined. Its vectors represent weighting coefficients of the model and provide us with the strategic option rank (see Table 10).
On the basis of the results shown in Table 10, we concluded that through DANP method application, the optimal option is Option 4, with a weighting coefficient of 0.29.
Implementation of the selected strategy was analyzed in three scenarios. The first scenario is strategy implementation according to the presented model. The other two scenarios/models are the capability-focused strategic management model [65] and the Balanced Scorecard based model [66]. These two additional strategic transport management models were developed as a part of the research project VA-TT/1/15-17 supported by the Ministry of Defence, Republic of Serbia.
During the scenarios analysis of strategy implementation, transport system perspectives, performances, and their key indicators were analyzed. Four perspectives were analyzed: purpose, resources, processes, and development. For each perspective, three performances were analyzed. Performance was analyzed according to indicators of success. Scenario analysis was conducted during research work under the aforementioned project. Among the three compared models, the proposed model of strategic transport management showed the best results.
According to the current status and forecasted trends of the key indicators, set up in the strategic control phase, necessary corrective measures were identified. The following activities were suggested for improvement of the transport system:
upgrade and fully implement an integrated quality and safety management system; provide employees with a continuing education program; apply intelligent transport systems designed for vehicle and driver monitoring and aimed to
decrease costs; use green fuel energy and be environmentally responsible.
Figure 8. The map of network relations in the ANP model.
As a result of the DEMATEL application, a CERD was constructed. It is the basis of ANPapplication. Network relationships among criteria were defined based on calculations in matricesTc and Tck, threshold value α, and CERD. Understanding the network of relationships significantlyaids an understanding of the ANP model, which is used to calculate criteria’s relative importance.In the first step of ANP method application, the inclusion of total-influence matrix T in the ANP modelis conducted by implementation of Equations (15)–(20), whereby an unweighted supermatrix wasobtained (Table 9). On the basis of it and by implementation of Equations (21) and (22), the elements ofweighted supermatrix were calculated.
In the last step of ANP method application, the elements of the limited supermatrix are determined.Its vectors represent weighting coefficients of the model and provide us with the strategic option rank(see Table 10).
On the basis of the results shown in Table 10, we concluded that through DANP methodapplication, the optimal option is Option 4, with a weighting coefficient of 0.29.
Implementation of the selected strategy was analyzed in three scenarios. The first scenario isstrategy implementation according to the presented model. The other two scenarios/models are thecapability-focused strategic management model [65] and the Balanced Scorecard based model [66].These two additional strategic transport management models were developed as a part of the researchproject VA-TT/1/15-17 supported by the Ministry of Defence, Republic of Serbia.
During the scenarios analysis of strategy implementation, transport system perspectives,performances, and their key indicators were analyzed. Four perspectives were analyzed: purpose,resources, processes, and development. For each perspective, three performances were analyzed.Performance was analyzed according to indicators of success. Scenario analysis was conducted duringresearch work under the aforementioned project. Among the three compared models, the proposedmodel of strategic transport management showed the best results.
According to the current status and forecasted trends of the key indicators, set up in the strategiccontrol phase, necessary corrective measures were identified. The following activities were suggestedfor improvement of the transport system:
• upgrade and fully implement an integrated quality and safety management system;• provide employees with a continuing education program;• apply intelligent transport systems designed for vehicle and driver monitoring and aimed to
decrease costs;• use green fuel energy and be environmentally responsible.
Sustainability 2016, 8, 954 23 of 27
Table 9. The unweighted supermatrix.
Factors S1 S2 S3 S4 W1 W2 W3 W4 O1 O2 O3 O4 O5 T1 T2 T3 T4 T5
S1 0.335 0.375 0.381 0.374 0.366 0.365 0.365 0.364 0.373 0.374 0.374 0.371 0.256 0.373 0.343 0.231 0.237 0.299S2 0.313 0.264 0.315 0.291 0.299 0.296 0.299 0.302 0.288 0.301 0.289 0.299 0.359 0.298 0.332 0.249 0.248 0.330S3 0.351 0.361 0.303 0.335 0.336 0.339 0.336 0.335 0.339 0.325 0.337 0.330 0.334 0.329 0.325 0.262 0.257 0.370S4 0.367 0.377 0.386 0.333 0.376 0.385 0.368 0.368 0.372 0.367 0.369 0.370 0.330 0.365 0.239 0.258 0.258 0.270W1 0.262 0.256 0.256 0.281 0.238 0.285 0.267 0.262 0.265 0.272 0.270 0.270 0.336 0.277 0.243 0.372 0.367 0.360W2 0.371 0.366 0.359 0.386 0.386 0.330 0.365 0.370 0.363 0.361 0.362 0.360 0.237 0.359 0.256 0.265 0.272 0.343W3 0.338 0.340 0.334 0.338 0.343 0.335 0.313 0.369 0.357 0.341 0.344 0.343 0.334 0.348 0.262 0.363 0.361 0.332W4 0.351 0.330 0.330 0.334 0.332 0.341 0.354 0.305 0.353 0.337 0.337 0.332 0.330 0.341 0.290 0.229 0.233 0.325O1 0.311 0.330 0.336 0.328 0.325 0.324 0.333 0.326 0.290 0.322 0.320 0.325 0.336 0.311 0.353 0.244 0.247 0.239O2 0.231 0.231 0.237 0.231 0.239 0.228 0.229 0.233 0.234 0.205 0.241 0.239 0.237 0.242 0.290 0.264 0.262 0.255O3 0.249 0.249 0.248 0.246 0.243 0.242 0.244 0.247 0.239 0.253 0.220 0.255 0.248 0.254 0.234 0.263 0.258 0.259O4 0.260 0.262 0.257 0.260 0.256 0.267 0.264 0.262 0.259 0.269 0.273 0.232 0.257 0.268 0.239 0.320 0.325 0.325O4 0.336 0.311 0.353 0.246 0.243 0.242 0.244 0.328 0.325 0.324 0.333 0.326 0.290 0.322 0.320 0.325 0.336 0.267T1 0.260 0.258 0.258 0.263 0.262 0.263 0.263 0.258 0.267 0.273 0.267 0.274 0.353 0.236 0.259 0.291 0.299 0.330T2 0.368 0.372 0.367 0.369 0.290 0.322 0.320 0.325 0.330 0.336 0.328 0.325 0.290 0.324 0.336 0.311 0.353 0.231T3 0.262 0.265 0.272 0.270 0.264 0.315 0.291 0.299 0.231 0.237 0.231 0.239 0.234 0.228 0.229 0.262 0.263 0.365T4 0.370 0.363 0.361 0.362 0.381 0.374 0.366 0.365 0.365 0.364 0.373 0.374 0.290 0.374 0.371 0.290 0.322 0.360T4 0.386 0.386 0.330 0.365 0.370 0.363 0.361 0.362 0.360 0.237 0.328 0.325 0.324 0.333 0.326 0.290 0.322 0.328
Table 10. Strategic options rank.
Strategic Option Weighting Coefficient Rank
Option 1 0.26 2Option 2 0.24 3Option 3 0.21 4Option 4 0.29 1
Sustainability 2016, 8, 954 24 of 27
4. Conclusions
On the one hand, transport is one of the main factors of economic growth and quality of life; onthe other hand, it is one of the main causes of environmental pollution [23]. One of the priorities of therevised EU Sustainable Development Strategy is sustainable transport, with an overall objective ofensuring that transport systems meet the economic, social, and environmental needs of the communitywhile minimizing their undesirable impacts on the economy, society, and environment.
The presented model of strategic transport management provides factor determination that willmanifest their influence in the future, formulating possible strategic options and selecting the optimalone that enables sustainable transport strategy formulation. The model was applied to sustainabletransport strategy formulation in NIS, but it is also possible to apply it in other companies that aim toestablish sustainable transportation. The flexibility of this model provides an opportunity to determineindustry-specific factors that can also be successfully applied in other companies and organizations.
The strategic options formulation process that is presented in this paper is based on the ideasof SWOT analysis, with specific modifications. Impact factor evaluation is conducted throughfuzzy Delphi method implementation, and for strategic options formulation fuzzy SWOT analysis isimplemented. At the end of this process, using a hybrid DANP model application, we selected theoptimal strategic option. For sustainable transport, strategic options were formulated in applyingthis model, and Option 4 was selected because it includes threat mitigation from the environmentrelying on its own strength. By applying strategic management methods and techniques, we tried toavoid subjectivity in the formulation of strategies and make the whole process based on the scientificmethod. Given that experts are engaged in strategic option formulation and the selection of an optimaloption, they must be competent in their particular domain. Also, the model was applied in a casestudy for the oil industry. For other industries it is necessary to reconsider important strategic factorsand formulated strategic options.
There are few papers that observe the problem of sustainable transport strategy formulation incompanies, so this paper contributes to the expansion of a theoretical framework for understanding theproblems of strategic management and the establishment of sustainable development. In furtheranalysis of this problem, the focus will be on sustainable transport strategies implementationand strategic control. Significant problems that should be considered in future works are propertreatment of subjective estimates during strategic options prioritization, the problem of consistency inDEMATEL, and the question of the model’s sensitivity analysis , especially in case of any changes infactors’ influences.
The application of the presented model completely solves the strategy implementation problem,as the largest problem in strategic management. The model also allows for monitoring of thestrategic objectives of a specific company, a comprehensive assessment of its state, and quick and easyidentification of key issues in order to take the appropriate corrective measures. This approach ensuresthe successful implementation of sustainable transport strategies.
Acknowledgments: The work reported in this paper is a part of the investigation within the researchproject VA-TT/1/15-17 supported by the Ministry of Defence, Republic of Serbia. This support isgratefully acknowledged.
Author Contributions: Srdan Dimic formulated the strategic management model and determined the impactfactors; Srdan Ljubojevic conducted the impact factor evaluation; Boban Ðorovic formulated strategicoptions; Dragan Pamucar conducted the multi-criteria options evaluation; all authors read and approved thefinal manuscript.
Conflicts of Interest: The authors declare no conflict of interest.
References
1. Štrbac, N.; Vukovic, M.; Voza, D.; Sokic, M. Održivi razvoj i zaštita životne sredine. Reciklaža i Održivi Razvoj2012, 5, 18–29.
Sustainability 2016, 8, 954 25 of 27
2. Maniatopoulos, P.; Andrews, J.; Shabani, B. Towards a sustainable strategy for road transportation inAustralia: The potential contribution of hydrogen. Renew. Sustain. Energy Rev. 2015, 52, 24–34. [CrossRef]
3. Barrella, E.M. Strategic Planning for a Sustainable Transportation System: A SWOT-Based Framework forAssessment and Implementation Guidance for Transportation Agencies. Ph.D. Thesis, Georgia Institute ofTechnology, School of Civil and Environmental Engineering, Atlanta, GA, USA, 2012.
4. Warren, J.; Morris, E.; Enoch, M.; Magdaleno, I.P.; Arias, Z.P.; Guanche, J. Developing an equitable andsustainable mobility strategy for Havana. Cities 2015, 45, 133–141. [CrossRef]
5. Bugheanu, A. SWOT analysis of public transport system in Bucharest. Manag. Res. Pract. 2015, 7, 14–31.6. Sarfaraz, A.H.; Shariatmadari, M.; Hedayat, P.; Vadoudi, K. Strategy formulating for semi-governmental
companies, Case study: Railway transportation in QODS NIROO. Procedia Soc. Behav. Sci. 2013, 99, 1082–1092.[CrossRef]
7. David, F.R. Strategic Management—Concepts and Cases, 11th ed.; Pearson-Prentice Hall: New York, NY,USA, 2007.
8. Hughes, B.P.; Anund, A.; Falkmer, T. A comprehensive conceptual framework for road safety strategies.Accid. Anal. Prev. 2016, 90, 13–28. [CrossRef] [PubMed]
9. Bastos, J.T.; Shen, Y.; Hermans, E.; Brijs, T.; Wets, G.; Ferraz, A.C.P. Bootstrapping DEA scores for road safetystrategic analysis in Brasil. Int. J. Comput. Intell. Syst. 2015, 8, 29–38. [CrossRef]
10. Schepers, P. Cycling safety as part of a successful road safety strategy in India. J. Neurosci. Rural Pract. 2013,4, 248–249. [CrossRef] [PubMed]
11. Corben, B.F.; Logan, D.B.; Fanciulli, L.; Farley, R.; Cameron, I. Strengthening road safety strategy development‘towards zero’ 2008–2020—Western Australia’s experience scientific research on road safety managementswov workshop 16 and 17 November 2009. Saf. Sci. 2010, 48, 1085–1097. [CrossRef]
12. Mathew, B.S.; Isaac, K.P. Optimisation of maintenance strategy for rural road network using genetic algorithm.Int. J. Pavement Eng. 2014, 15, 352–360. [CrossRef]
13. Lethanh, N.; Adey, B. Investigation of the use of a Weibull model for the determination of optimal road linkintervention strategies. Struct. Infrastruct. Eng. 2014, 10, 684–696. [CrossRef]
14. Mubaraki, M. Maintenance strategies at project level for low volume urban roads. Int. J. Pavement Res. Technol.2012, 5, 225–233.
15. Charansonney, L.; Aguilera, V. Real-time dynamic information to road-users: New challenges for urbannetwork management strategies. In Proceedings of the International Conference on Numerical Analysis andApplied Mathematics 2014 (ICNAAM-2014), Rhodes, Greece, 22–28 September 2014.
16. Abbasi, M.; Nilsson, F. Developing environmentally sustainable logistics: Exploring themes and challengesfrom a logistics service providers’ perspective. Transp. Res. Part D 2016, 46, 273–283. [CrossRef]
17. Yazdani, M.; Lorijani, A.L.; Zarimohaleh, S.T.; Monavarian, A. Developing optimized strategy bycomprehensive framework of strategy; Case study in a construction inspection company. Procedia Soc.Behav. Sci. 2012, 58, 73–83. [CrossRef]
18. Kurttila, M.; Pesonen, M.; Kangas, J.; Kajanus, M. Utilizing the analytic hierarchy process (AHP) in SWOTanalysis—A hybrid method and its application to a forest-certification case. For. Policy Econ. 2000, 1, 41–52.[CrossRef]
19. Okello, C.; Pindozzi, S.; Faugno, S.; Boccia, L. Appraising bioenergy alternatives in uganda using strengths,weaknesses, opportunities and threats (SWOT)—Analytical hierarchy process (AHP) and a desirabilityfunctions approach. Energies 2014, 7, 1171–1192. [CrossRef]
20. Eslamipoor, R.; Sepehriar, A. Firm relocation as a potential solution for environment improvement using aSWOT-AHP hybrid method. Process Saf. Environ. Prot. 2014, 92, 269–276. [CrossRef]
21. Gerasimov, Y.; Senko, S.; Karjalainen, T. Nordic forest energy solutions in the Republic of Karelia. Forests2013, 4, 945–967. [CrossRef]
22. Stainback, G.A.; Masozera, M.; Mukuralinda, A.; Dwivedi, P. Smallholder agroforestry in Rwanda:A SWOT-AHP analysis. Small Scale For. 2012, 11, 285–300. [CrossRef]
23. Radicevic, V.; Subotic, M.; Milic, D. Promovisanje održivog urbanog transporta u funkciji održivog razvoja.FBIM Trans. J. Financ. Bus. Inf. Ind. Technol. Manag. 2014, 2, 279–289.
24. Guerrero-Liquet, G.C.; Sanchez-Lozano, J.M.; Garcia-Cascales, M.S.; Lamata, M.T.; Verdegay, J.L.Decision-making for risk management in sustainable renewable energy facilities: A case study in theDominican Republic. Sustainability 2016, 8, 455. [CrossRef]
Sustainability 2016, 8, 954 26 of 27
25. Cebeci, U. Fuzzy AHP-based decision support system for selecting ERP systems in textile industry by usingbalanced scorecard. Expert Syst. Appl. 2009, 36, 8900–8909. [CrossRef]
26. Fouladgar, M.M.; Yazdani-Chamzini, A.; Zavadskas, E.K. An integrated model for prioritizing strategies ofthe Iranian mining sector. Technol. Econ. Dev. Econ. 2011, 17, 459–483. [CrossRef]
27. Ren, J.; Gao, S.; Tan, S.; Dong, L. Hydrogen economy in China: Strengths–weaknesses–opportunities–threatsanalysis and strategies prioritization. Renew. Sustain. Energy Rev. 2015, 41, 1230–1243. [CrossRef]
28. Arabzad, M.S.; Ghorbani, M.; Razmi, J.; Shirouzehzad, H. Employing fuzzy topsis and swot for supplierselection and order allocation problem. Int. J. Adv. Manuf. Technol. 2015, 76, 803–818. [CrossRef]
29. Zare, K.; Mehri-Tekmeh, J.; Karimi, S. SWOT framework for analyzing the electricity supply chain usingan integrated AHP methodology combined with fuzzy-TOPSIS. Int. Strateg. Manag. Rev. 2015, 3, 66–80.[CrossRef]
30. Ebonzo, A.D.M.; Liu, X. The use of axiomatic fuzzy set theory in AHP and TOPSIS methodology to determinestrategies priorities by SWOT analysis. Qual. Quant. 2013, 47, 2671–2685. [CrossRef]
31. Shariatmadari, M.; Sarfaraz, A.H.; Hedayat, P.; Vadoudi, K. Using SWOT analysis and SEM to prioritizestrategies in Foreign exchange market in Iran. Procedia Soc. Behav. Sci. 2013, 99, 886–892. [CrossRef]
32. Amin, S.H.; Razmi, J.; Zhang, G. Supplier selection and order allocation based on fuzzy SWOT analysis andfuzzy linear programming. Expert Syst. Appl. 2011, 38, 334–342. [CrossRef]
33. Yuksel, I.; Dagdeviren, M. Using the analytic network process (ANP) in a SWOT analysis—A case study fora textile firm. Inf. Sci. 2007, 177, 3364–3382. [CrossRef]
34. Al-Rafaie, A.; Sy, E.; Rawabdeh, I.; Alaween, W. Integration of SWOT and ANP for effective strategicplanning in the cosmetic industry. Adv. Prod. Eng. Manag. 2016, 11, 49–58. [CrossRef]
35. Živkovic, Ž.; Nikolic, Ð.; Ðordevic, P.; Mihajlovic, I.; Savic, M. Analytical network process in the frameworkof SWOT analysis for strategic decision making (Case study: Technical faculty in bor, University of Belgrade,Serbia). Acta Polytech. Hung. 2015, 12, 199–216.
36. Di Lallo, G.; Maesano, M.; Masiero, M.; Mugnozza, G.S.; Marchetti, M. Analyzing strategies to enhancesmall and low intensity managed forests certification in europe using SWOT-ANP. Small Scale For. 2016, 15,393–411. [CrossRef]
37. Shojaei, M.; Hejazi, S.; Lak, E. Determining priorities of effective organizational strategies by ANP andSWOT models. Eur. J. Bus. Manag. 2014, 6, 115–128.
38. Moghimi, H.R.; Sobhanollahi, M.A.; Ghodratnama, A. Analytic network process based strategic planning forIran’s trade promotion organization. Int. J. Eng. 2014, 27, 1215–1222.
39. Ou Yang, Y.P.; Shieh, H.M.; Leu, J.D.; Tzeng, G.H. A novel hybrid MCDM model combined with DEMATELand ANP with applications. Int. J. Oper. Res. 2008, 5, 160–168.
40. Khamesh, A.A.; Fazayeli, M. A fuzzy analytical network process for SWOT analysis (Case study: Drugdistribution company). Tech. J. Eng. Appl. Sci. 2013, 3, 2317–2326.
41. Sevkli, M.; Oztekin, A.; Uysal, O.; Torlak, G.; Turkyilmaz, A.; Delen, D. Development of a fuzzy ANP basedSWOT analysis for the airline industry in Turkey. Expert Syst. Appl. 2012, 39, 14–24. [CrossRef]
42. Ren, J.; Tan, S.; Goodsite, M.E.; Sovacool, B.K.; Dong, L. Sustainability, shale gas, and energy transition inChina: Assessing barriers and prioritizing strategic measures. Energy 2015, 84, 551–562. [CrossRef]
43. Chang, K.H.; Chang, Y.C.; Lee, Y.T. Integrating TOPSIS and DEMATEL methods to rank the risk of failure ofFMEA. Int. J. Inf. Technol. Dec. Mak. 2014, 13, 1229–1257. [CrossRef]
44. Chang, D.S.; Chen, S.H.; Hsu, C.W.; Hu, A.H. Identifying strategic factors of the implantation CSR in theairline industry: The case of Asia-Pacific airlines. Sustainability 2015, 7, 7762–7783. [CrossRef]
45. Hwang, B.N.; Huang, C.Y.; Wu, C.H. A TOE approach to establish a green supply chain adoption decisionmodel in the semiconductor industry. Sustainability 2016, 8, 168. [CrossRef]
46. Wu, W.W.; Lee, Y.T. Developing global managers’ competencies using the fuzzy DEMATEL method.Expert Syst. Appl. 2007, 32, 499–507. [CrossRef]
47. Chang, B.; Chang, C.W.; Wu, C.H. Fuzzy DEMATEL method for developing supplier selection criteria.Expert Syst. Appl. 2007, 38, 1850–1858. [CrossRef]
48. Ren, J.; Sovacool, B.K. Quantifying, measuring, and strategizing energy security: Determining the mostmeaningful dimensions and metrics. Energy 2014, 76, 838–849. [CrossRef]
49. Deng, Q.; Liu, X.; Liao, H. Identifying critical factors in the eco-efficiency of remanufacturing based on thefuzzy DEMATEL method. Sustainability 2015, 7, 15527–15547. [CrossRef]
Sustainability 2016, 8, 954 27 of 27
50. Zhou, F.; Wang, X.; Lin, Y.; He, Y.; Zhou, L. Strategic part prioritization for quality improvement practice usinga hybrid MCDM framework: A case application in an auto factory. Sustainability 2016, 8, 559. [CrossRef]
51. Kuo, T.C.; Hsu, C.W.; Li, J.Y. Developing a green supplier selection model by using the DANP with VIKOR.Sustainability 2015, 7, 1661–1689. [CrossRef]
52. Hu, K.H.; Chen, F.H.; Tzeng, G.H. Evaluating the improvement of sustainability of sports industry policybased on MADM. Sustainability 2016, 8, 606. [CrossRef]
53. Huang, K.W.; Huang, J.H.; Tzeng, G.H. New Hybrid multiple attribute decision-making model for improvingcompetence sets: Enhancing a company’s core competitiveness. Sustainability 2016, 8, 175. [CrossRef]
54. Lu, I.Y.; Kuo, T.; Lin, T.S.; Tzeng, G.H.; Huang, S.L. Multicriteria decision analysisto develop effectivesustainable development strategies for enhancing competitive advantages: Case of the TFT-LCD industry inTaiwan. Sustainability 2016, 8, 646. [CrossRef]
55. Ljubojevic, S.; Dimic, S.; Lukovic, N. Analiticnost u definisanju strategijskih opcija na primeru razvojamultimodalnog transporta u Vojsci Srbije. Bоjнотехнички глaсник/Military Tech. Cour. 2014, 62, 74–95.
56. Ghazinoory, S.; Zadeh, E.A.; Memariani, A. Fuzzy SWOT analysis. J. Intell. Fuzzy Syst. 2007, 18, 99–108.57. Saaty, T.L. Decision Making with Dependence and Feedback: The Analytic Network Process; RWS Publications:
Pittsburgh, PA, USA, 1996.58. Yang, J.L.; Tzeng, G.H. An integrated MCDM technique combined with DEMATEL for a novel
cluster-weighted with ANP method. Expert Syst. Appl. 2011, 38, 1417–1424. [CrossRef]59. Chiu, Y.J.; Chen, H.C.; Tzeng, G.H.; Shyu, J.Z. Marketing strategy based on customer behaviour for the
LCD-TV. Int. J. Manag. Dec. Mak. 2006, 7, 143–165. [CrossRef]60. Lin, C.L.; Tzeng, G.H. A value-created system of science (technology) park by using DEMATEL.
Expert Syst. Appl. 2009, 36, 9683–9697. [CrossRef]61. Liou, J.J.H.; Tzeng, G.H.; Chang, H.C. Airline safety measurement using a hybrid model. J. Air Transp. Manag.
2007, 13, 243–249. [CrossRef]62. Tzeng, G.H.; Chiang, C.H.; Li, C.W. Evaluating intertwined effects in E-learning programs: A novel hybrid
MCDM model based on factor analysis and DEMATEL. Expert Syst. Appl. 2007, 32, 1028–1044. [CrossRef]63. Sumrit, D.; Anuntavoranich, P. Using DEMATEL method to analyze the casual realations on technological
innovation capability evaluation factors in Thai technology-based firms. Int. Trans. J. Eng. Manag. Appl.Sci. Technol. 2013, 4, 81–103.
64. NIS. Izveštaj o Održivom Razvoju, Naftna Industrija Srbije, 2015. Available online: http://www.nis.eu/wp-content/uploads/2015/07/NIS-Odrzivi-razvoj-2015-sr.pdf (accessed on 10 May 2016).
65. Rothaermel, F.T. Strategic Management: Concepts and Cases; McGraw-Hill Irwin: New York, NY, USA, 2012.66. Tapinos, E.; Dyson, R.G.; Meadows, M. Does the balanced scorecard make a difference to the strategy
development process? J. Oper. Res. Soc. 2011, 62, 888–899. [CrossRef]
© 2016 by the authors; licensee MDPI, Basel, Switzerland. This article is an open accessarticle distributed under the terms and conditions of the Creative Commons Attribution(CC-BY) license (http://creativecommons.org/licenses/by/4.0/).