Embed Size (px)
Citation preview
Strategic Transit Automation Research Plan
FTA Report No. 0116 Federal Transit Administration
PREPARED BY
Federal Transit Administration with the support of the
John A. Volpe National Transportation Systems Center
JANUARY 2018

COVER PHOTO Courtesy of istockphoto.com
DISCLAIMER This document is disseminated under the sponsorship of the U.S. Department of Transportation in the interest of information exchange. The United States Government assumes no liability for its contents or use thereof. The United States Government does not endorse products of manufacturers. Trade or manufacturers’ names appear herein solely because they are considered essential to the objective of this report.
FEDERAL TRANSIT ADMINISTRATION i
JANUARY 2018FTA Report No. 0116
PREPARED BY
Vincent Valdes, Gwo-Wei Torng, Steven Mortensen, and Danyell Diggs
Federal Transit AdministrationOffice of Research, Demonstration and InnovationU.S. Department of Transportation1200 New Jersey Avenue, SEWashington, DC 20590
Elizabeth Machek, E. Burkman, T. Crayton, J. Cregger, S. Fischer, S. Peirce, H. Richardson, and A. Thomas
John A. Volpe National Transportation Systems CenterU.S. Department of Transportation55 BroadwayCambridge, MA 02142 SPONSORED BY
Federal Transit AdministrationOffice of Research, Demonstration and Innovation U.S. Department of Transportation1200 New Jersey Avenue, SEWashington, DC 20590
AVAILABLE ONLINE
https://www.transit.dot.gov/about/research-innovation
Strategic Transit Automation Research Plan
FEDERAL TRANSIT ADMINISTRATION iv
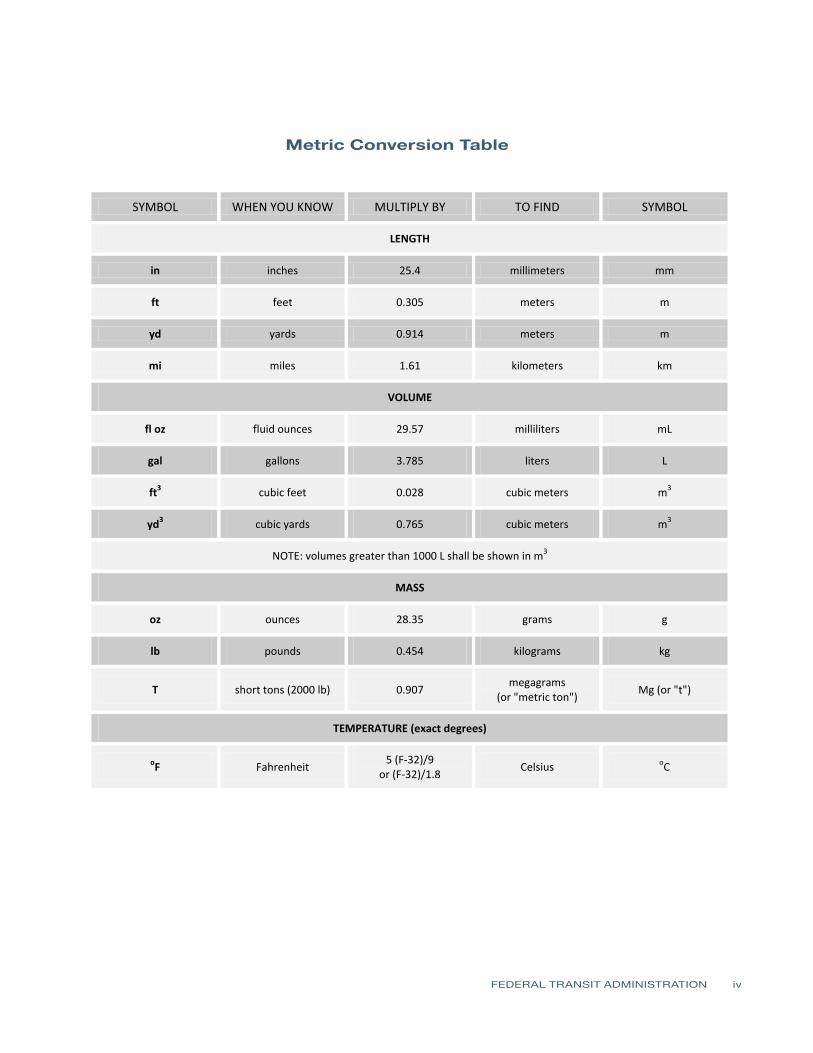
Metric Conversion Table
SYMBOL WHEN YOU KNOW MULTIPLY BY TO FIND SYMBOL
LENGTH
in inches 25.4 millimeters mm
ft feet 0.305 meters m
yd yards 0.914 meters m
mi miles 1.61 kilometers km
VOLUME
fl oz fluid ounces 29.57 milliliters mL
gal gallons 3.785 liters L
ft3 cubic feet 0.028 cubic meters m3
yd3 cubic yards 0.765 cubic meters m3
NOTE: volumes greater than 1000 L shall be shown in m3
MASS
oz ounces 28.35 grams g
lb pounds 0.454 kilograms kg
T short tons (2000 lb) 0.907 megagrams
(or "metric ton") Mg (or "t")
TEMPERATURE (exact degrees)
oF Fahrenheit 5 (F-32)/9
or (F-32)/1.8 Celsius oC
FEDERAL TRANSIT ADMINISTRATION ii
Metric Conversion TableMetric Conversion Table
FEDERAL TRANSIT ADMINISTRATION v
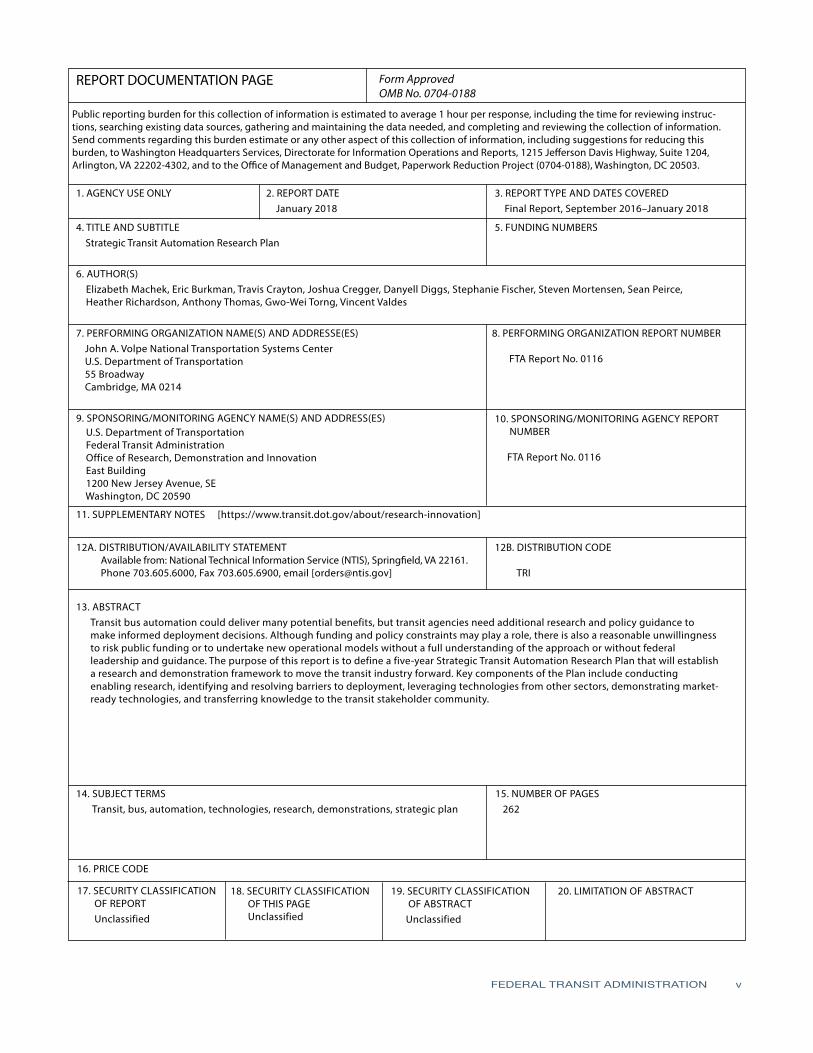
REPORT DOCUMENTATION PAGE Form ApprovedOMB No. 0704-0188
1. AGENCY USE ONLY 2. REPORT DATE January 2018
3. REPORT TYPE AND DATES COVERED Final Report, September 2016–January 2018
Public reporting burden for this collection of information is estimated to average 1 hour per response, including the time for reviewing instruc-tions, searching existing data sources, gathering and maintaining the data needed, and completing and reviewing the collection of information. Send comments regarding this burden estimate or any other aspect of this collection of information, including suggestions for reducing this burden, to Washington Headquarters Services, Directorate for Information Operations and Reports, 1215 Jefferson Davis Highway, Suite 1204, Arlington, VA 22202-4302, and to the Office of Management and Budget, Paperwork Reduction Project (0704-0188), Washington, DC 20503.
4. TITLE AND SUBTITLE Strategic Transit Automation Research Plan
5. FUNDING NUMBERS
6. AUTHOR(S) Elizabeth Machek, Eric Burkman, Travis Crayton, Joshua Cregger, Danyell Diggs, Stephanie Fischer, Steven Mortensen, Sean Peirce, Heather Richardson, Anthony Thomas, Gwo-Wei Torng, Vincent Valdes
7. PERFORMING ORGANIZATION NAME(S) AND ADDRESSE(ES)John A. Volpe National Transportation Systems CenterU.S. Department of Transportation55 BroadwayCambridge, MA 0214
8. PERFORMING ORGANIZATION REPORT NUMBER
FTA Report No. 0116
9. SPONSORING/MONITORING AGENCY NAME(S) AND ADDRESS(ES) U.S. Department of Transportation Federal Transit Administration Office of Research, Demonstration and Innovation East Building 1200 New Jersey Avenue, SE Washington, DC 20590
10. SPONSORING/MONITORING AGENCY REPORT NUMBER
FTA Report No. 0116
11. SUPPLEMENTARY NOTES [https://www.transit.dot.gov/about/research-innovation]
12A. DISTRIBUTION/AVAILABILITY STATEMENT Available from: National Technical Information Service (NTIS), Springfield, VA 22161. Phone 703.605.6000, Fax 703.605.6900, email [[email protected]]
12B. DISTRIBUTION CODE
TRI
13. ABSTRACTTransit bus automation could deliver many potential benefits, but transit agencies need additional research and policy guidance to make informed deployment decisions. Although funding and policy constraints may play a role, there is also a reasonable unwillingness to risk public funding or to undertake new operational models without a full understanding of the approach or without federal leadership and guidance. The purpose of this report is to define a five-year Strategic Transit Automation Research Plan that will establish a research and demonstration framework to move the transit industry forward. Key components of the Plan include conducting enabling research, identifying and resolving barriers to deployment, leveraging technologies from other sectors, demonstrating market-ready technologies, and transferring knowledge to the transit stakeholder community.
14. SUBJECT TERMSTransit, bus, automation, technologies, research, demonstrations, strategic plan
15. NUMBER OF PAGES 262
16. PRICE CODE
17. SECURITY CLASSIFICATION OF REPORT Unclassified
18. SECURITY CLASSIFICATION OF THIS PAGE Unclassified
19. SECURITY CLASSIFICATION OF ABSTRACT Unclassified
20. LIMITATION OF ABSTRACT
FEDERAL TRANSIT ADMINISTRATION vi
1 Executive Summary
3 Part I: Research Plan 3 Introduction 3 Scope 4 Approach 5 Relationship to Other USDOT Initiatives 7 Related FTA Research 7 Summary of Key Findings 9 Strategic Transit Automation Research Roadmap
19 Part II: Input and Analysis 19 Methodology 19 Inputs to Research Plan: Interim Products 30 Knowledge Transfer Activity Plan 30 Research Needs and Gaps 31 Conclusion
33 Appendix A: SAE Levels of Automation
35 Appendix B: Automation Risk/Barrier and Mitigation Assessment
52 Appendix C: Analysis of Non-Driving Operator Responsibilities
81 AppendixD:TransitAutomationBenefit-CostAnalysisReport
128 Appendix E: Stakeholders Consulted
131 Appendix F: Technology Literature Review and Analysis
TABLE OF CONTENTS
FEDERAL TRANSIT ADMINISTRATION vii
2 Figure ES-1: Strategic Transit Automation Research Roadmap 11 Figure 1-1: Strategic Transit Automation Research Roadmap 23 Figure 2-1: Summary of Technology Packages and Use Cases 34 Figure A-1: SAE Levels of Automation 97 Figure D-1: Conceptual diagram of two-mile route with automated shuttle service 101 Figure D-2: Estimated deployment costs for varying numbers of shuttles, unstaffed scenario 103 Figure D-3: University of Michigan Logistics, Transportation, and Parking Kipke Drive fleet, garage, and transit services facility 108 Figure D-4: Illustrative bus parking layouts with automated parking and re call application, University of Michigan Kipke Drive Facility: Current conditions and notational space-efficient configuration 109 Figure D-5: Illustrative bus parking layouts with automated parking and recall application, University of Michigan Kipke Drive facility: Current conditions and notational space-efficient configuration 110 Figure D-6: RIPTA maintenance and yard operations automation analysis – operators’ path on reporting 111 Figure D-7: RIPTA maintenance and yard operations automation analysis – service attendant motion 114 Figure D-8: Comparative operating costs among modes, report year 2014 150 Figure F-1: Comparison of object recognition in low and high spatial resolution 158 Figure F-2: CDD vs. CMOS data collection, transformation, and transmission diagram 160 Figure F-3: Measuring distance to object using sonar principle utilized by ultrasonic sensors 162 Figure F-4: Use of ultrasonic sensors for backing and parking maneuvers 163 Figure F-5: Example of linear array of ultrasonic sensors for side-object detection 163 Figure F-6: Ultrasonic sensor sensing distances and blind zone 164 Figure F-7: Diagram of angular relationships between ultrasonic sensors and target objects 164 Figure F-8: Ultrasonic sensor detecting echoes from irregular objects 169 Figure F-9: Conceptual brake application timing with coordinated V2V 172 Figure F-10: Basic units of providing cellular communication: Base station or cell and cell clusters 173 Figure F-11: Depiction of cells connected to cellular switch and public switched telephone network 179 Figure F-12: Basic GNSS capable of 15-meter location accuracy 182 Figure F-13: BNSS augmentation comparison 192 Figure F-14: Magnetic marker relative positioning
LIST OF FIGURES
FEDERAL TRANSIT ADMINISTRATION viii
200 Figure F-15: GPU-accelerated processing 201 Figure F-16: Neural network illustration 203 Figure F-17: NVIDIA desktop GPU specifications and release prices, 2008–present 206 Figure F-18: Multi-dimensional taxonomy of machine learning 220 Figure F-19: System architecture of series plug-in hybrid electric bus
5 Table 1-1: Anticipated Work Area Outcomes 48 Table B-1: Overview of Risks and Mitigation 87 Table D-1a: Costs and Benefits for ADAS Smooth Acceleration and Braking, per Vehicle Equipped: Diesel Transit Bus 87 Table D-1b: Costs and Benefits for ADAS Smooth Acceleration and Braking, per Vehicle Equipped: Hybrid Transit Bus (Average Energy Recapture) 89 Table D-2: Costs and Benefits for ADAS AEB and Pedestrian Detection, per Vehicle Equipped 94 Table D-3: Costs and Benefits for ADAS Narrow Lang/Shoulder Operation, per Vehicle Equipped 99 Table D-4: Capital and Operating Costs by Year per Vehicle 101 Table D-5: Shuttles Required to Provide Equivalent Service as a 15-Passenger Van 105 Table D-6: Benefits and Costs for Automated Yard Operations: Precision Movement, for Illustrative Facility and Vehicles 107 Table D-7: Benefits and Costs for Automated Yard Operations: Automated Parking and Recall, for Illustrative Facility and Vehicles 114 Table D-8: Operating Expenses for Demand Response Service 116 Table D-9: Comparison of Average Costs for Human Driven and Automated Paratransit Operation, 2015 Data 116 Table D-10: Illustrative Operating Costs per Paratransit Vehicle, 5-Year Vehicle Lifecycle 122 Table D-11: Benefits of Costs for Automated BRT by Year 142 Table F-1: CityMobil2 Demonstration Project Details 149 Table F-2: Comparison of Radar by Operational Frequency 151 Table F-3: Typical Strengths and Weaknesses of Automotive Sensors 165 Table F-4: Speed of Sound across Varying Dry Air Temperatures 195 Table F-5: PATH – Exemplar Cost Estimation Model
LIST OF TABLES
FEDERAL TRANSIT ADMINISTRATION ix
ACKNOWLEDGMENTS
The research team would like to thank the stakeholders who participated in workshops, interviews, and webinars to, among other items, provide information on risks and barriers, help develop technology packages and use cases, and inventory early demonstration projects. Their input was essential in developing a comprehensive research plan. Additionally, the team also thanks their USDOT colleagues for providing valuable insight and guidance throughout the development of the Plan.
FEDERAL TRANSIT ADMINISTRATION x
ABSTRACT
Transit bus automation could deliver many potential benefits, but transit agencies need additional research and policy guidance to make informed deployment decisions. Although funding and policy constraints may play a role, there is also a reasonable unwillingness to risk public funding or to undertake new operational models without a full understanding of the approach or without federal leadership and guidance.
The purpose of this report is to define a five-year Strategic Transit Automation Research Plan that will establish a research and demonstration framework to move the transit industry forward. Key components of the Plan include conducting enabling research, identifying and resolving barriers to deployment, leveraging technologies from other sectors, demonstrating market-ready technologies, and transferring knowledge to the transit stakeholder community.
EXECUTIVE SUMMARY
FEDERAL TRANSIT ADMINISTRATION 1
Automation capabilities have grown rapidly in recent years and have changed the dialogue around all aspects of the surface transportation system. Whereas automation is relatively mature in rail transit operations, this is not the case in bus transit. The domestic transit bus industry lags behind both light-duty vehicles and heavy-duty trucking, as well as international transit manufacturers and providers. Transit bus automation could deliver many potential benefits, but transit agencies need additional research and policy guidance to make informed deployment decisions. The U.S. transit industry often is conservative in adopting new technologies, services, and business models. Although funding and policy constraints may play a role, there is also a reasonable unwillingness to risk public funding or to undertake new operational models without a full understanding of the approach or without federal leadership and guidance.
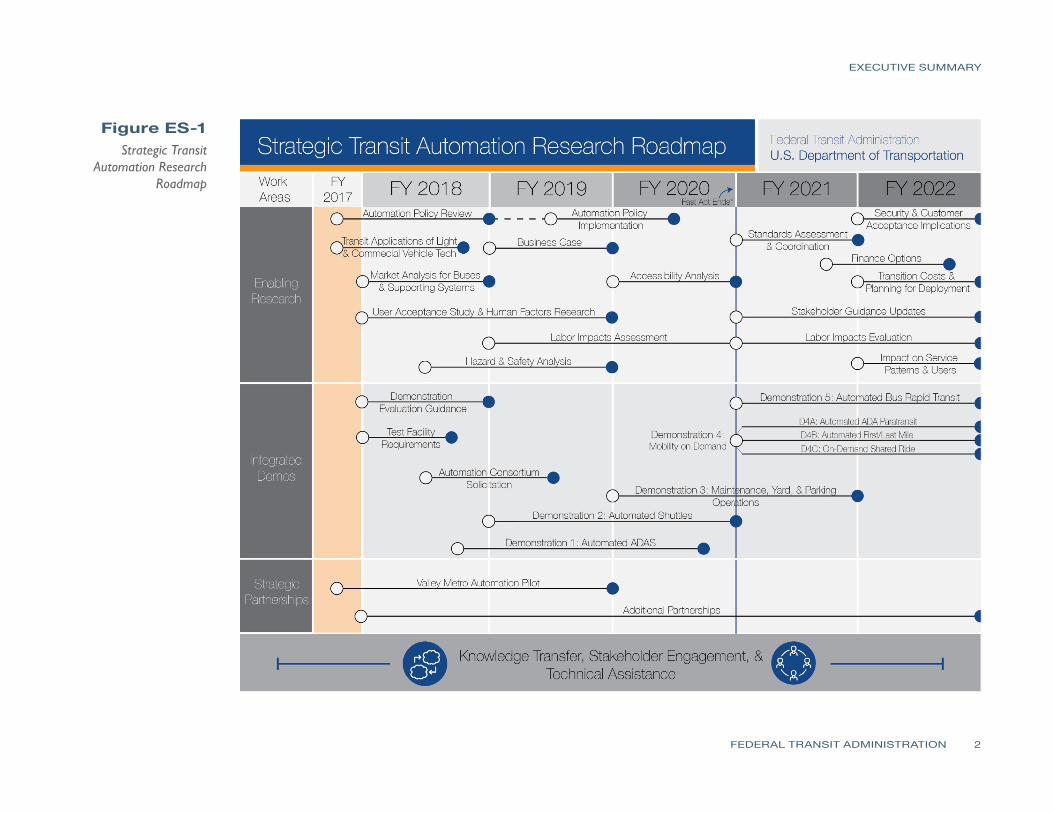
The Federal Transit Administration (FTA) has developed this Strategic Transit Automation Research Plan to begin addressing these issues. The plan establishes a research and demonstration framework that will move the transit industry forward (see Figure ES-1: Strategic Transit Automation Research Roadmap).
The research plan leverages the core strengths of academia and the public and private sectors and is organized around three complementary work areas: Enabling Research, Integrated Demonstrations, and Strategic Partnerships. Ongoing stakeholder engagement and knowledge transfer activities will ensure that the research meets stakeholder needs and that the industry can quickly build on results. Research and demonstration projects are designed to complement each other and collectively advance FTA and U.S. Department of Transportation (USDOT) goals in automation.
To understand the current state of the practice, as well as potential benefits, challenges, and risks and to gauge stakeholder interest, FTA sponsored a series of research studies, engaging with internal and external stakeholders throughout. These included literature review, in-person and remote interviews of subject matter experts and stakeholders, qualitative analysis, and benefit-cost analysis. Research needs were identified in the areas of safety and security, operations and economics, passenger experience, and policy research. The research plan addresses these needs.
EXECUTIVE SUMMARY
FEDERAL TRANSIT ADMINISTRATION 2
Figure ES-1Strategic Transit
Automation Research Roadmap
PART
1
FEDERAL TRANSIT ADMINISTRATION 3
Research Plan
IntroductionAutomation capabilities have grown rapidly in recent years and have changed the dialogue around all aspects of the surface transportation system. Whereas automation is relatively mature in rail transit operations, this is not the case in bus transit. The domestic transit bus industry lags behind both light-duty vehicles and heavy-duty trucking, as well as international transit manufacturers and providers. Transit bus automation could deliver many potential benefits, but transit agencies need additional research and policy guidance to make informed deployment decisions. The U.S. transit industry often is conservative in adopting new technologies, services, and business models. Although funding and policy constraints may play a role, there is also a reasonable unwillingness to risk public funding or to undertake new operational models without a full understanding of the approach or without federal leadership and guidance.
The Federal Transit Administration (FTA)’s Strategic Transit Automation Research Plan builds on extensive stakeholder consultation and use case analysis to define a five-year research agenda which will move the transit industry forward.
ScopeAdvancements in technology are rapidly transforming the transportation system and provide potential to improve transit systems. FTA’s Office of Research, Demonstration and Innovation is exploring the use of vehicle automation technologies in bus transit operations. The goal of this effort is to advance transit readiness for automation by:
• conducting enabling research to achieve safe and effective transit automation deployments
• identifying and resolving barriers to deployment of transit automation
• leveraging technologies from other sectors to move the transit automation industry forward
• demonstrating market-ready technologies in real-world settings
• transferring knowledge to the transit stakeholder community
The FTA transit automation research team (hereinafter referred to as the “research team”) consists of FTA staff and members of the John A. Volpe National Transportation Systems Center (Volpe Center). To support the
PART 1: RESEARCH PLAN
FEDERAL TRANSIT ADMINISTRATION 4
development and deployment of automated bus transit services, the research team has developed this five-year research plan. This plan outlines FTA’s research agenda to move the transit industry forward with regard to automation technologies. The plan is built upon extensive stakeholder consultation and use case analysis and is informed by a rigorous literature review.
The focus of the plan is on transit bus operations, but the research team also considered lessons learned from automation efforts in rail, commercial vehicles, and aviation. This study considers a broad range of automation—from Society of Automotive Engineers (SAE) Level 1-5—meaning that the scope includes collision-avoidance technologies for human-operated buses, full vehicle automation, and everything in-between. (See Appendix A for more information on SAE’s automation level definitions.) The scope does not include driver assistance systems without an automation aspect (e.g., driver warnings and alerts), but does include those with automated actuation (e.g., as in an automated emergency braking application). For the purposes of this plan, “bus” is defined broadly to consider a range of passenger capacities and both traditional and novel vehicle designs.
Five broad areas of use cases have been identified, including transit bus advanced driver assistance systems (ADAS), automated shuttles, automated maintenance and yard operations, automated mobility-on-demand service, and automated bus rapid transit (BRT). These areas represent a range of near-term and long-term concepts, as well as a range of automation levels. They also respond to interest expressed by stakeholders.
ApproachThe plan leverages the core strengths of academia and the public and private sectors and is organized around three complementary work areas: Enabling Research, Integrated Demonstrations, and Strategic Partnerships. Ongoing stakeholder engagement and knowledge transfer activities will ensure that the research meets stakeholder needs and that the industry can quickly build on results. The focus is on non-technical challenges. Although technical challenges also clearly remain, FTA believes that its limited resources are best spent in supporting development, demonstration, and evaluation, in support of deployment. Anticipated outcomes of the three work areas are outlined in Table 1-1.

PART 1: RESEARCH PLAN
FEDERAL TRANSIT ADMINISTRATION 5
Work Area Description Anticipated Outcomes
Enabling Research
Enabling research tackles questions that must be addressed for the transit industry to engage more broadly with automation technologies. There is a clear Federal role in that objective results are needed for oversight and stewardship or where a lack of information serves as a disincentive to private and public sector progress.
Enabling research will accelerate entry of manufacturers, suppliers, and transit providers into automation by building common understanding of foundational issues (human factors, Federal policy, costs and benefits, etc.).
Integrated Demonstrations
Integrated demonstrations will demonstrate automation technologies in real-world settings. These projects will create a testbed for study of technical issues, user acceptance, operational and maintenance costs, and institutional issues and will further assess needs for standards development to ensure interoperability.
Evaluation results and lessons learned will be widely disseminated to transit stakeholders. These projects will spur technology development and grow the industry. These demonstrations also will grow the confidence level for transit agencies considering deployment automated transit services.
Strategic Partnerships
Strategic partnerships will leverage research projects and investments led by other agencies. FTA funding and technical assistance will supplement partners’ deployment and evaluation activities, so research topics of interest to FTA may be cost-effectively added and research findings can be disseminated.
Strategic partnerships will improve quality and usefulness of research by other actors and disseminate findings to a broad community, expanding participation of providers and suppliers.
Table 1-1 Anticipated Work Area Outcomes
Relationship to Other USDOT InitiativesAutomated vehicle technologies could eventually impact every part of the surface transportation system and, as such, are of interest across USDOT. This plan has been developed with input from the USDOT agencies currently engaged in surface transportation automation research, including the Office of the Secretary, the Federal Highway Administration (FHWA), the National Highway Traffic Safety Administration (NHTSA), the Federal Motor Carrier Safety Administration (FMCSA), and the Intelligent Transportation System (ITS) Joint Program Office (JPO).
Automated Driving Systems 2.0: A Vision for SafetyIn September 2017, USDOT released Automated Driving Systems 2.0: A Vision for Safety,1 which replaces the 2016 Federal Automated Vehicles Policy.2 The new policy document focuses on Automated Driving Systems (ADS), which include
1 USDOT (2017), “Automated Driving Systems: A Vision of Safety,” U.S. Department of Transportation, September. https://www.nhtsa.gov/sites/nhtsa.dot.gov/files/documents/13069a-ads2.0_090617_v9a_tag.pdf.
2 USDOT (2016), “Federal Automated Vehicles Policy: Accelerating the Next Revolution in Roadway Safety,” U.S. Department of Transportation, September. https://www.safetyresearch.net/Library/Federal_Automated_Vehicles_Policy.pdf.
PART 1: RESEARCH PLAN
FEDERAL TRANSIT ADMINISTRATION 6
SAE automation levels 3–5, provides Voluntary Guidance for “entities involved with manufacturing, designing, supplying, testing, selling, operating, or deploying ADSs” in the United States. This definition includes ADSs used for transit applications.3
The Voluntary Guidance identifies 12 priority safety elements that are generally considered to be the most salient to consider and address when developing, testing, and deploying ADSs on public roadways:
1. System Safety
2. Operational Design Domain
3. Object and Event Detection and Response
4. Fallback (Minimal Risk Condition)
5. Validation Methods
6. Human Machine Interface
7. Vehicle Cybersecurity
8. Crashworthiness
9. Post-Crash ADS Behavior
10. Data Recording
11. Consumer Education and Training
12. Federal, State, and Local Laws
In general, the guidance suggests entities adopt and follow voluntary guidance, best practices, design principles, and standards in these areas. Further, for nearly all priority safety elements, entities are encouraged to document processes for assessment, testing, and validation. The document suggests that transit agencies and their partners should follow this guidance if they are working to develop and test a new ADS or operating a commercially-available ADS. Entities involved in testing and deployment may develop a Voluntary Safety Self-Assessment containing concise information on how the Voluntary Guidance or other processes are being used to address applicable safety elements identified in the Voluntary Guidance.
Whereas the current guidance focuses on the roles and responsibilities of NHTSA (e.g., motor vehicles and motor vehicle equipment), USDOT is beginning the process to include content more directly related to other modes, including FTA.
3 The document specifies that these entities include “equipment designers and suppliers; entities that outfit any vehicle with automated capabilities or equipment for testing, for commercial sale, and/or for use on public roadways; transit companies; automated fleet operators; ‘driverless’ taxi companies; and any other individual or entity that offers services utilizing ADS technology” (USDOT 2017, p. 2).
PART 1: RESEARCH PLAN
FEDERAL TRANSIT ADMINISTRATION 7
Related FTA ResearchFTA identified automation as a topic of interest more than a decade ago, leading to the development of the Vehicle Assist and Automation (VAA) project, which was active between 2009 and 2016 with testing in revenue service between 2013 and 2015.4 The system was installed on a 60-foot articulated bus and enabled automation for precision docking at bus stops and lateral control for operation on narrow lanes.
The Minnesota Valley Transit Authority (MVTA) received $4.2 million from FTA in 2008 to develop a lane guidance system for bus-on-shoulder operations along Cedar Avenue (Trunk Highway 77). Referred to as the Driver Assist System (DAS), the GPS-based technology suite provides lane position feedback to the driver via a head-up display, virtual mirror, vibrating seat, and actuated steering. MVTA hopes to enhance driver confidence in operating buses on shoulders, particularly during bad weather. Secondary goals include reduced travel times, increased reliability, safety, and customer satisfaction. In 2015, FTA awarded MVTA an additional $1.79 million to upgrade the system, which is being demonstrated in revenue service. An evaluation of the system will be completed summer 2018.
In addition to the VAA and DAS projects, TRI’s Mobility-on-Demand (MOD) program,5 safety research, accessibility research, and fare payment research are particularly relevant for transit automation because of the issues raised by automated operation, such as a need for new fare collection approaches. Additional research related to transit bus automation is covered in the literature review for this project.6 Findings from relevant projects inform this plan and will continue to inform the research and demonstration projects included in it.
Summary of Key FindingsDevelopment of the research plan is grounded in a series of preliminary research studies, which are detailed in Part II and the Appendices. Key findings from this work are summarized below.
4 PATH (2017), “Vehicle Assist and Automation Demonstration Report,” prepared by California Department of Transportation (Caltrans) Partners for Advanced Transportation Technology (PATH) for Federal Transit Administration, U.S. Department of Transportation, FTA Report No. 0113, August. https://www.transit.dot.gov/sites/fta.dot.gov/files/docs/research-innovation/65486/ftareportno0113-002.pdf.
5 FTA (2017), “Mobility on Demand (MOD) Sandbox Program,” Federal Transit Administration, U.S. Department of Transportation. https://www.transit.dot.gov/research-innovation/mobility-demand-mod-sandbox-program.html, accessed October 2017.
6 Volpe and TTI (2017), “Technology Literature Review and Analysis,” produced by the John A. Volpe National Transportation Systems Center and the Texas A&M Transportation Institute for Federal Transit Administration, U.S. Department of Transportation.
PART 1: RESEARCH PLAN
FEDERAL TRANSIT ADMINISTRATION 8
The transit industry is increasingly interested in the potential applications and benefits of automation:
• There is growing interest in partial to full automation of bus transit, with several demonstrations and test sites being planned or already underway.
• Expected benefits of automation include safety and operational improvements, along with cost savings. Automation could also enable new forms of transit service that provide increased mobility, flexibility, and convenience.
• Transit agencies’ expressed interest in automation applications depends to some extent on their service patterns and local context; for example, agencies that are highly space-constrained have more interest in automated remote parking.
• Although estimates of costs and capabilities are still evolving, an initial analysis confirmed there are several partial automation applications that have a clear business case for transit agency investment. That is, the technology investment costs for these applications would readily be recouped through future operational savings.
However, investment in automated transit application development and deployment has been relatively slow:
• Actual implementation in revenue service has been limited. Transit agencies tend to be risk-averse and generally have limited in-house resources for studying emerging technologies or exploring new service concepts.
• Key issues and uncertainties associated with automation, identified through stakeholder consultation and literature review, include:
– Product availability in the transit market is not as advanced as in the light-duty and commercial truck sectors, in part due to the small market size. Transit automation has also lagged in the U.S. relative to Europe and Asia, so availability could be further constrained by requirements (49 USC § 5323(j)(1), https://www.transit.dot.gov/buyamerica).
– Safety issues are critical for public transit providers, and automation systems introduce new types of risks, ranging from technology limitations, hardware failures, and cybersecurity breaches to more subtle human factors issues such as overreliance and skill decay.
– User acceptance of automated systems, although well-established in some rail settings, is largely unknown in a bus transit context. Fully-driverless operation raises a number of questions about customer assistance, fare collection, and other non-driving duties that require additional study.
– Labor issues were repeatedly cited by stakeholders as a potential concern. It is anticipated that transit labor would oppose automation initiatives that eliminate driving and maintenance staff positions, and Federal 13(c)
PART 1: RESEARCH PLAN
FEDERAL TRANSIT ADMINISTRATION 9
regulations7 impose limitations in this regard. Partial automation raises fewer labor issues—and indeed can reduce driver stress and fatigue —but may still involve concerns related to changes in job responsibilities and conditions.
– Funding issues for fiscally-constrained transit agencies may make it difficult to invest in automation technologies, even when they are ultimately cost-effective.
• There also are specific legal and policy issues, such as rules and regulations written with the assumption of a human driver, which could be barriers to adoption, particularly for fully-automated (driverless) transit.
Federal investment in transit automation can accelerate adoption:
• Near-term enabling research to analyze key issues that otherwise might impede deployment, such as Federal policy constraints and market conditions, is necessary.
• From there, safety, operations, human factors, customer acceptance, and other impacts can be assessed through integrated demonstration projects.
• FTA-provided evaluation support can maximize the learning value of the demonstrations, especially in situations in which the capabilities to be tested are new and do not necessarily have established methodologies.
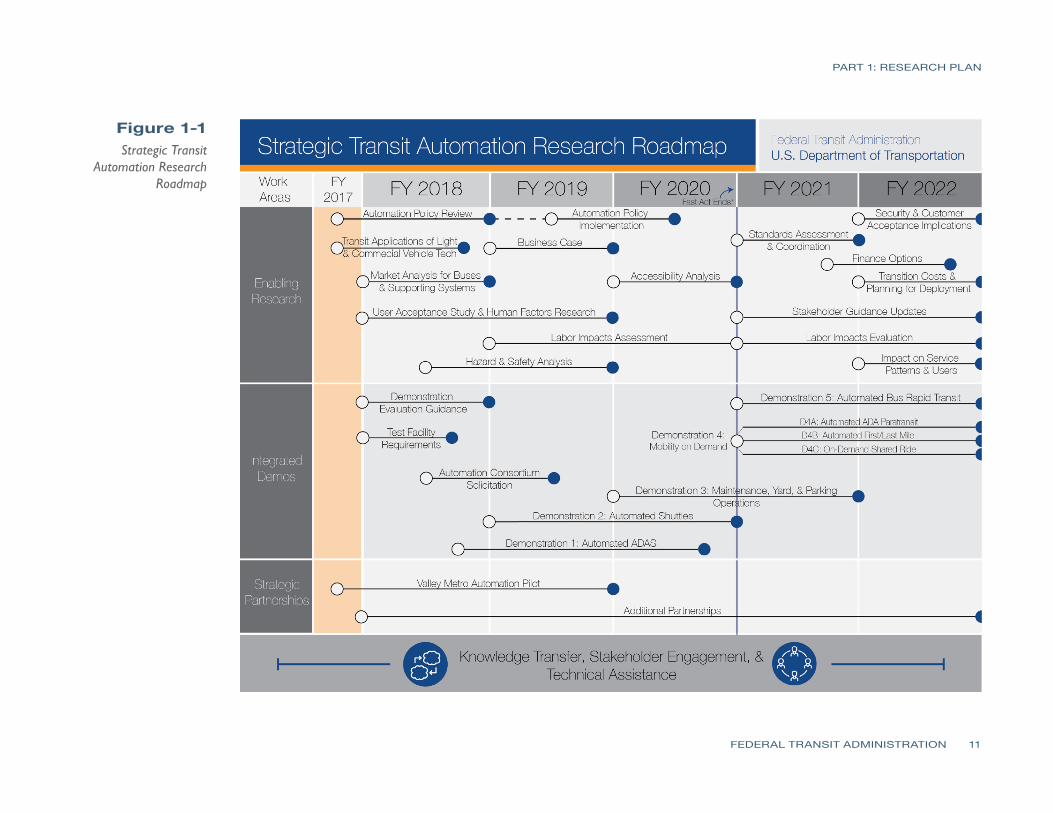
Strategic Transit Automation Research RoadmapThe five-year strategic transit automation research roadmap describes a set of research projects that complement each other and collectively advance FTA and USDOT goals in automation. As noted, the roadmap is organized around three complementary work areas: Enabling Research, Integrated Demonstrations, and Strategic Partnerships. A set of cross-cutting supporting activities, such as Knowledge Transfer, Stakeholder Engagement, and Technical Assistance, is also identified.
Integrated demonstrations are at the core of the plan. Whereas there are many and diverse research questions, they are fundamentally interrelated. A single demonstration can, with planning, address multiple topics. Details of the demonstrations will vary according to the partner(s) and project(s) selected, but are expected to include assessment of performance and impacts in the following areas:
• System performance, capabilities, and limitations
• Transit operations and maintenance
7 49 USC. §5333(b).
PART 1: RESEARCH PLAN
FEDERAL TRANSIT ADMINISTRATION 10
• Fuel and emissions
• Service quality
• Safety and security, including cybersecurity
• Passenger experience, comfort, and acceptance
• Accessibility
• Travel options and mode choice
• Fare collection
• Communication and equipment needs and costs
• Overall cost-effectiveness
FTA will also monitor research, demonstrations, and deployments internationally and identify opportunities to learn from international peers wherever possible.
Topics for the demonstrations are suggested based on findings from the literature review, stakeholder consultation, and market research. The first demonstration will focus on high-priority advanced driver assistance use cases. The second demonstration will focus on automated shuttles, either in circulator or first/last-mile service. Both of these use cases can be demonstrated with technologies and vehicles that are either market-ready or that can be adapted to the purpose relatively quickly. Subsequent demonstrations involve technologies that are currently in development and may change as the plan evolves. The third, fourth, and fifth demonstrations will focus on automated maintenance yard applications, automated mobility-on-demand, and automated bus rapid transit, respectively.
The demonstrations are bookended by two types of enabling research. The initial set of projects investigate basic questions with regard to technology availability, business case, policy, human factors, and safety, to sharpen the research focus of the demonstrations and help resolve policy and technical issues that affect their viability. As the demonstrations draw to a close, the second set of planned projects will use data and results from the demonstrations as inputs to more in-depth analysis of key topics, such as workforce and service planning.
Finally, strategic partnerships will allow FTA to leverage investments by others, in both the private and public sectors, and gain access to datasets and results which would otherwise be unavailable.
Figure 1-1 shows the five-year research roadmap.
PART 1: RESEARCH PLAN
Figure 1-1
FEDERAL TRANSIT ADMINISTRATION 11
Strategic Transit Automation Research
Roadmap
PART 1: RESEARCH PLAN
FEDERAL TRANSIT ADMINISTRATION 12
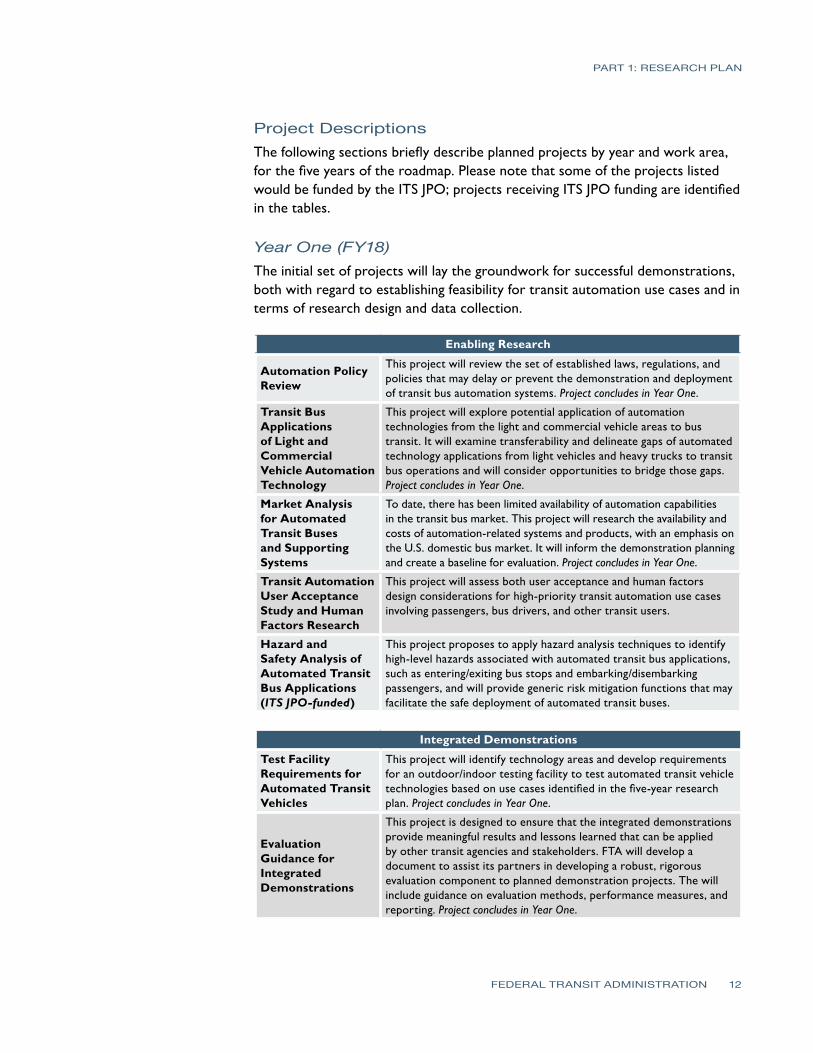
Project DescriptionsThe following sections briefly describe planned projects by year and work area, for the five years of the roadmap. Please note that some of the projects listed would be funded by the ITS JPO; projects receiving ITS JPO funding are identified in the tables.
Year One (FY18)The initial set of projects will lay the groundwork for successful demonstrations, both with regard to establishing feasibility for transit automation use cases and in terms of research design and data collection.
Enabling Research
Automation Policy Review
This project will review the set of established laws, regulations, and policies that may delay or prevent the demonstration and deployment of transit bus automation systems. Project concludes in Year One.
Transit Bus Applications of Light and Commercial Vehicle Automation Technology
This project will explore potential application of automation technologies from the light and commercial vehicle areas to bus transit. It will examine transferability and delineate gaps of automated technology applications from light vehicles and heavy trucks to transit bus operations and will consider opportunities to bridge those gaps. Project concludes in Year One.
Market Analysis for Automated Transit Buses and Supporting Systems
To date, there has been limited availability of automation capabilities in the transit bus market. This project will research the availability and costs of automation-related systems and products, with an emphasis on the U.S. domestic bus market. It will inform the demonstration planning and create a baseline for evaluation. Project concludes in Year One.
Transit Automation User Acceptance Study and Human Factors Research
This project will assess both user acceptance and human factors design considerations for high-priority transit automation use cases involving passengers, bus drivers, and other transit users.
Hazard and Safety Analysis of Automated Transit Bus Applications (ITS JPO-funded)
This project proposes to apply hazard analysis techniques to identify high-level hazards associated with automated transit bus applications, such as entering/exiting bus stops and embarking/disembarking passengers, and will provide generic risk mitigation functions that may facilitate the safe deployment of automated transit buses.
Integrated Demonstrations
Test Facility Requirements for Automated Transit Vehicles
This project will identify technology areas and develop requirements for an outdoor/indoor testing facility to test automated transit vehicle technologies based on use cases identified in the five-year research plan. Project concludes in Year One.
Evaluation Guidance for Integrated Demonstrations
This project is designed to ensure that the integrated demonstrations provide meaningful results and lessons learned that can be applied by other transit agencies and stakeholders. FTA will develop a document to assist its partners in developing a robust, rigorous evaluation component to planned demonstration projects. The will include guidance on evaluation methods, performance measures, and reporting. Project concludes in Year One.
PART 1: RESEARCH PLAN
FEDERAL TRANSIT ADMINISTRATION 13
Integrated Demonstrations
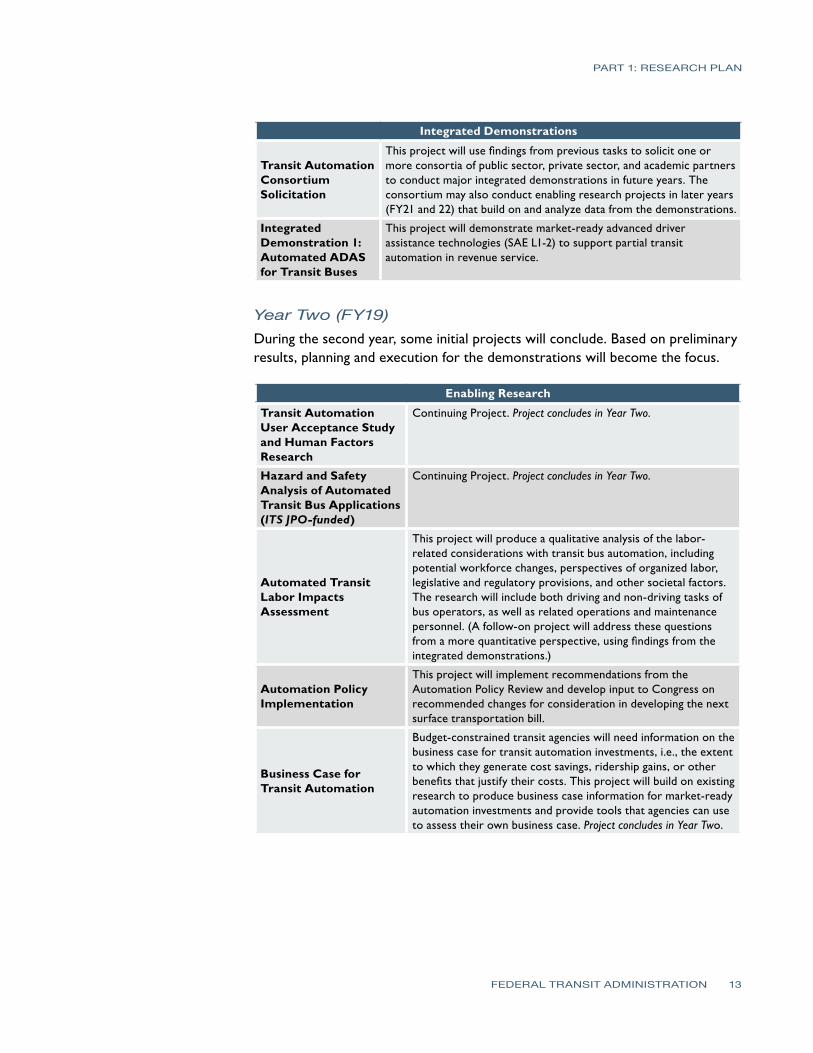
Transit Automation Consortium Solicitation
This project will use findings from previous tasks to solicit one or more consortia of public sector, private sector, and academic partners to conduct major integrated demonstrations in future years. The consortium may also conduct enabling research projects in later years (FY21 and 22) that build on and analyze data from the demonstrations.
Integrated Demonstration 1: Automated ADAS for Transit Buses
This project will demonstrate market-ready advanced driver assistance technologies (SAE L1-2) to support partial transit automation in revenue service.
Year Two (FY19)During the second year, some initial projects will conclude. Based on preliminary results, planning and execution for the demonstrations will become the focus.
Enabling Research
Transit Automation User Acceptance Study and Human Factors Research
Continuing Project. Project concludes in Year Two.
Hazard and Safety Analysis of Automated Transit Bus Applications (ITS JPO-funded)
Continuing Project. Project concludes in Year Two.
Automated Transit Labor Impacts Assessment
This project will produce a qualitative analysis of the labor-related considerations with transit bus automation, including potential workforce changes, perspectives of organized labor, legislative and regulatory provisions, and other societal factors. The research will include both driving and non-driving tasks of bus operators, as well as related operations and maintenance personnel. (A follow-on project will address these questions from a more quantitative perspective, using findings from the integrated demonstrations.)
Automation Policy Implementation
This project will implement recommendations from the Automation Policy Review and develop input to Congress on recommended changes for consideration in developing the next surface transportation bill.
Business Case for Transit Automation
Budget-constrained transit agencies will need information on the business case for transit automation investments, i.e., the extent to which they generate cost savings, ridership gains, or other benefits that justify their costs. This project will build on existing research to produce business case information for market-ready automation investments and provide tools that agencies can use to assess their own business case. Project concludes in Year Two.
PART 1: RESEARCH PLAN
FEDERAL TRANSIT ADMINISTRATION 14
Integrated Demonstrations
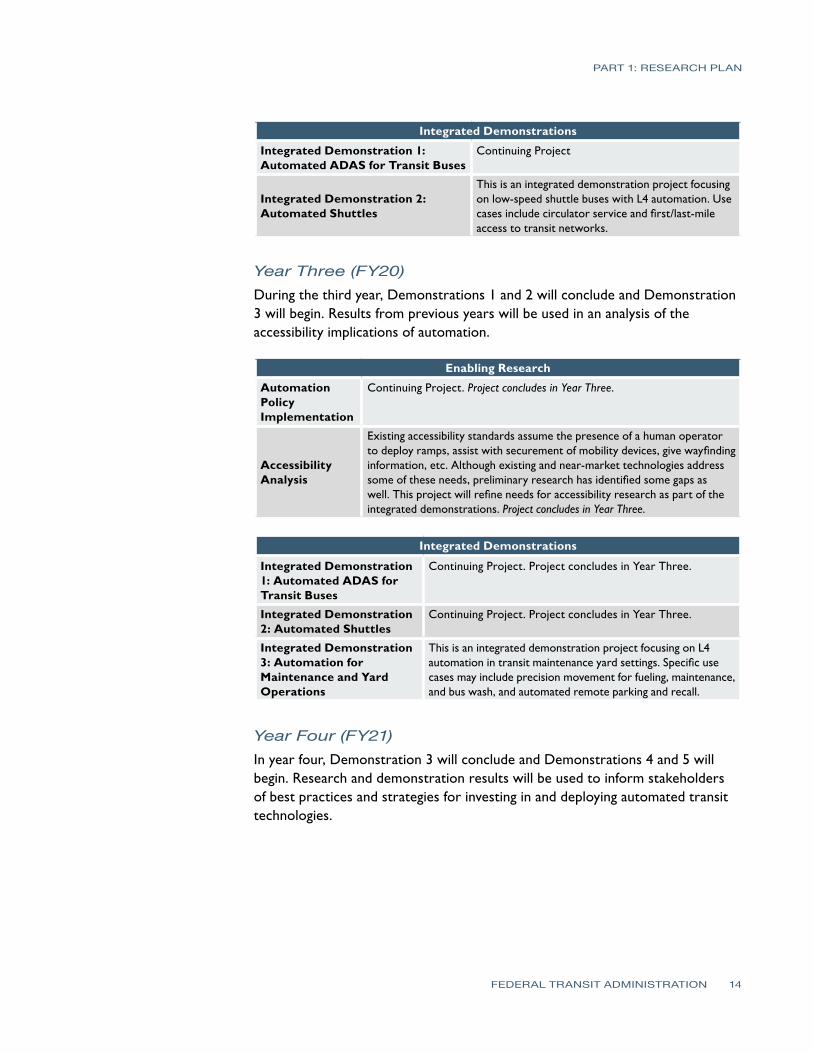
Integrated Demonstration 1: Automated ADAS for Transit Buses
Continuing Project
Integrated Demonstration 2: Automated Shuttles
This is an integrated demonstration project focusing on low-speed shuttle buses with L4 automation. Use cases include circulator service and first/last-mile access to transit networks.
Year Three (FY20)During the third year, Demonstrations 1 and 2 will conclude and Demonstration 3 will begin. Results from previous years will be used in an analysis of the accessibility implications of automation.
Enabling Research
Automation Policy Implementation
Continuing Project. Project concludes in Year Three.
Accessibility Analysis
Existing accessibility standards assume the presence of a human operator to deploy ramps, assist with securement of mobility devices, give wayfinding information, etc. Although existing and near-market technologies address some of these needs, preliminary research has identified some gaps as well. This project will refine needs for accessibility research as part of the integrated demonstrations. Project concludes in Year Three.
Integrated Demonstrations
Integrated Demonstration 1: Automated ADAS for Transit Buses
Continuing Project. Project concludes in Year Three.
Integrated Demonstration 2: Automated Shuttles
Continuing Project. Project concludes in Year Three.
Integrated Demonstration 3: Automation for Maintenance and Yard Operations
This is an integrated demonstration project focusing on L4 automation in transit maintenance yard settings. Specific use cases may include precision movement for fueling, maintenance, and bus wash, and automated remote parking and recall.
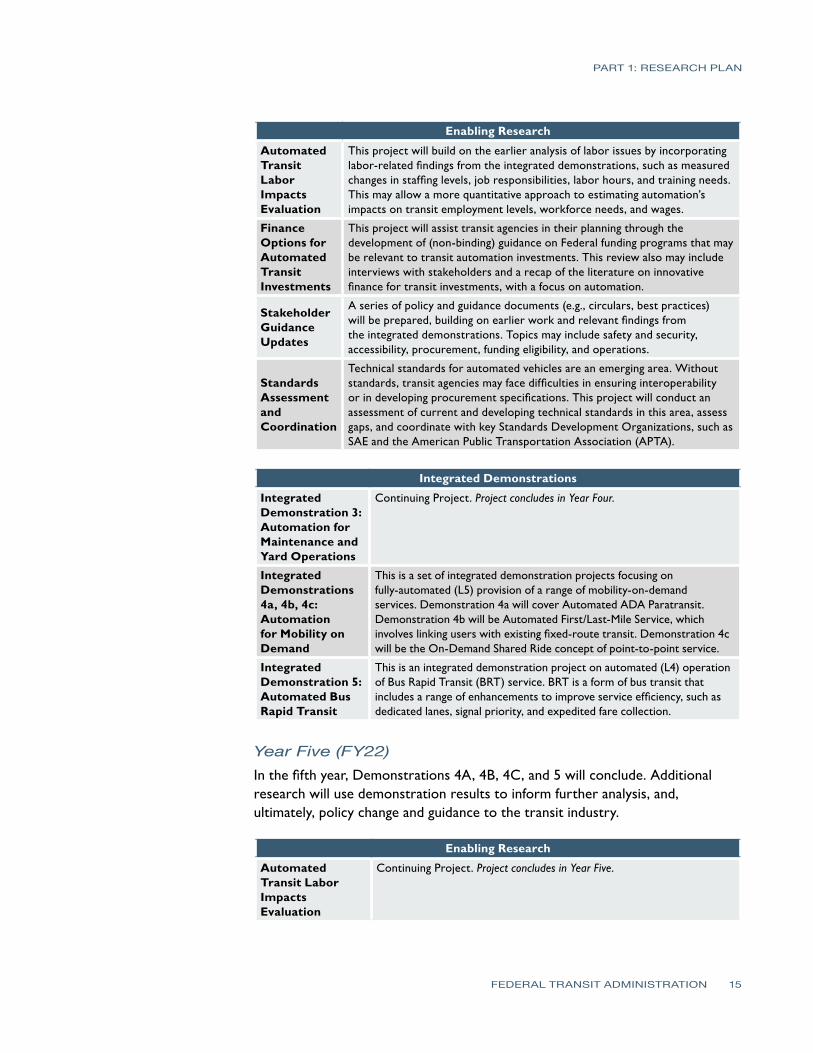
Year Four (FY21)In year four, Demonstration 3 will conclude and Demonstrations 4 and 5 will begin. Research and demonstration results will be used to inform stakeholders of best practices and strategies for investing in and deploying automated transit technologies.
PART 1: RESEARCH PLAN
FEDERAL TRANSIT ADMINISTRATION 15
Enabling Research
Automated Transit Labor Impacts Evaluation
This project will build on the earlier analysis of labor issues by incorporating labor-related findings from the integrated demonstrations, such as measured changes in staffing levels, job responsibilities, labor hours, and training needs. This may allow a more quantitative approach to estimating automation’s impacts on transit employment levels, workforce needs, and wages.
Finance Options for Automated Transit Investments
This project will assist transit agencies in their planning through the development of (non-binding) guidance on Federal funding programs that may be relevant to transit automation investments. This review also may include interviews with stakeholders and a recap of the literature on innovative finance for transit investments, with a focus on automation.
Stakeholder Guidance Updates
A series of policy and guidance documents (e.g., circulars, best practices) will be prepared, building on earlier work and relevant findings from the integrated demonstrations. Topics may include safety and security, accessibility, procurement, funding eligibility, and operations.
Standards Assessment and Coordination
Technical standards for automated vehicles are an emerging area. Without standards, transit agencies may face difficulties in ensuring interoperability or in developing procurement specifications. This project will conduct an assessment of current and developing technical standards in this area, assess gaps, and coordinate with key Standards Development Organizations, such as SAE and the American Public Transportation Association (APTA).
Integrated Demonstrations
Integrated Demonstration 3: Automation for Maintenance and Yard Operations
Continuing Project. Project concludes in Year Four.
Integrated Demonstrations 4a, 4b, 4c: Automation for Mobility on Demand
This is a set of integrated demonstration projects focusing on fully-automated (L5) provision of a range of mobility-on-demand services. Demonstration 4a will cover Automated ADA Paratransit. Demonstration 4b will be Automated First/Last-Mile Service, which involves linking users with existing fixed-route transit. Demonstration 4c will be the On-Demand Shared Ride concept of point-to-point service.
Integrated Demonstration 5: Automated Bus Rapid Transit
This is an integrated demonstration project on automated (L4) operation of Bus Rapid Transit (BRT) service. BRT is a form of bus transit that includes a range of enhancements to improve service efficiency, such as dedicated lanes, signal priority, and expedited fare collection.
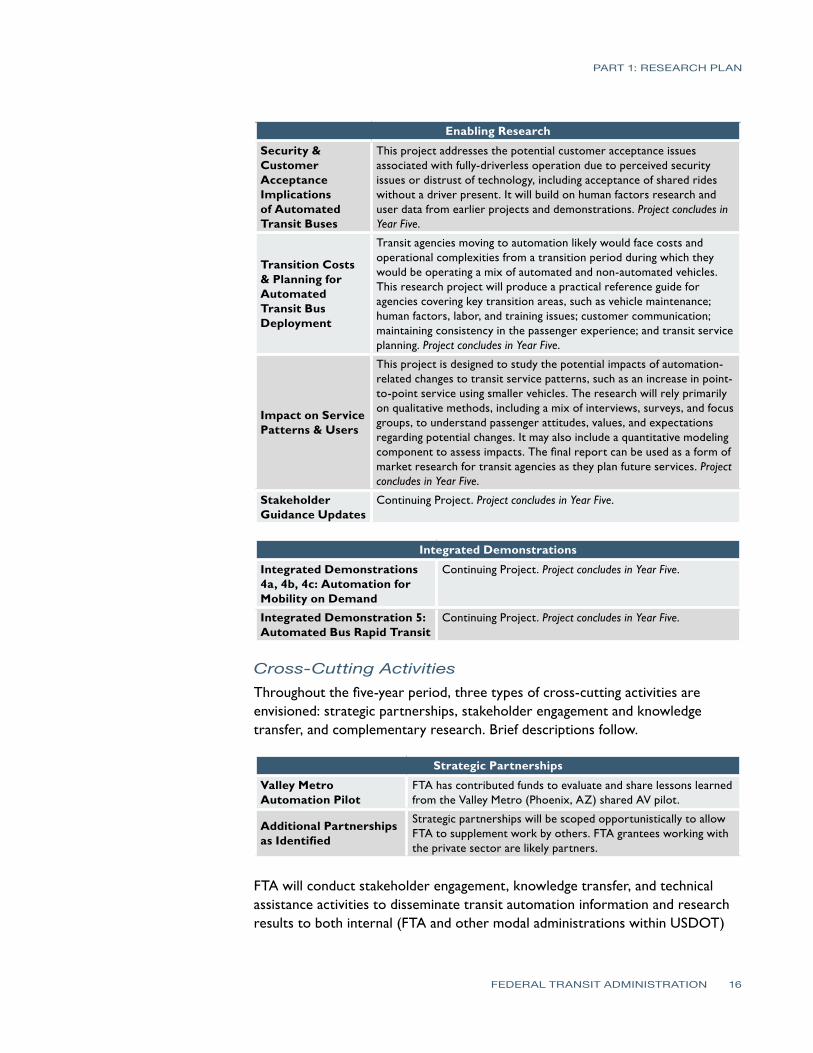
Year Five (FY22) In the fifth year, Demonstrations 4A, 4B, 4C, and 5 will conclude. Additional research will use demonstration results to inform further analysis, and, ultimately, policy change and guidance to the transit industry.
Enabling Research
Automated Transit Labor Impacts Evaluation
Continuing Project. Project concludes in Year Five.
PART 1: RESEARCH PLAN
FEDERAL TRANSIT ADMINISTRATION 16
Enabling Research
Security & Customer Acceptance Implications of Automated Transit Buses
This project addresses the potential customer acceptance issues associated with fully-driverless operation due to perceived security issues or distrust of technology, including acceptance of shared rides without a driver present. It will build on human factors research and user data from earlier projects and demonstrations. Project concludes in Year Five.
Transition Costs & Planning for Automated Transit Bus Deployment
Transit agencies moving to automation likely would face costs and operational complexities from a transition period during which they would be operating a mix of automated and non-automated vehicles. This research project will produce a practical reference guide for agencies covering key transition areas, such as vehicle maintenance; human factors, labor, and training issues; customer communication; maintaining consistency in the passenger experience; and transit service planning. Project concludes in Year Five.
Impact on Service Patterns & Users
This project is designed to study the potential impacts of automation-related changes to transit service patterns, such as an increase in point-to-point service using smaller vehicles. The research will rely primarily on qualitative methods, including a mix of interviews, surveys, and focus groups, to understand passenger attitudes, values, and expectations regarding potential changes. It may also include a quantitative modeling component to assess impacts. The final report can be used as a form of market research for transit agencies as they plan future services. Project concludes in Year Five.
Stakeholder Guidance Updates
Continuing Project. Project concludes in Year Five.
Integrated Demonstrations
Integrated Demonstrations 4a, 4b, 4c: Automation for Mobility on Demand
Continuing Project. Project concludes in Year Five.
Integrated Demonstration 5: Automated Bus Rapid Transit
Continuing Project. Project concludes in Year Five.
Cross-Cutting ActivitiesThroughout the five-year period, three types of cross-cutting activities are envisioned: strategic partnerships, stakeholder engagement and knowledge transfer, and complementary research. Brief descriptions follow.
Strategic Partnerships
Valley Metro Automation Pilot
FTA has contributed funds to evaluate and share lessons learned from the Valley Metro (Phoenix, AZ) shared AV pilot.
Additional Partnerships as Identified
Strategic partnerships will be scoped opportunistically to allow FTA to supplement work by others. FTA grantees working with the private sector are likely partners.
FTA will conduct stakeholder engagement, knowledge transfer, and technical assistance activities to disseminate transit automation information and research results to both internal (FTA and other modal administrations within USDOT)
PART 1: RESEARCH PLAN
FEDERAL TRANSIT ADMINISTRATION 17
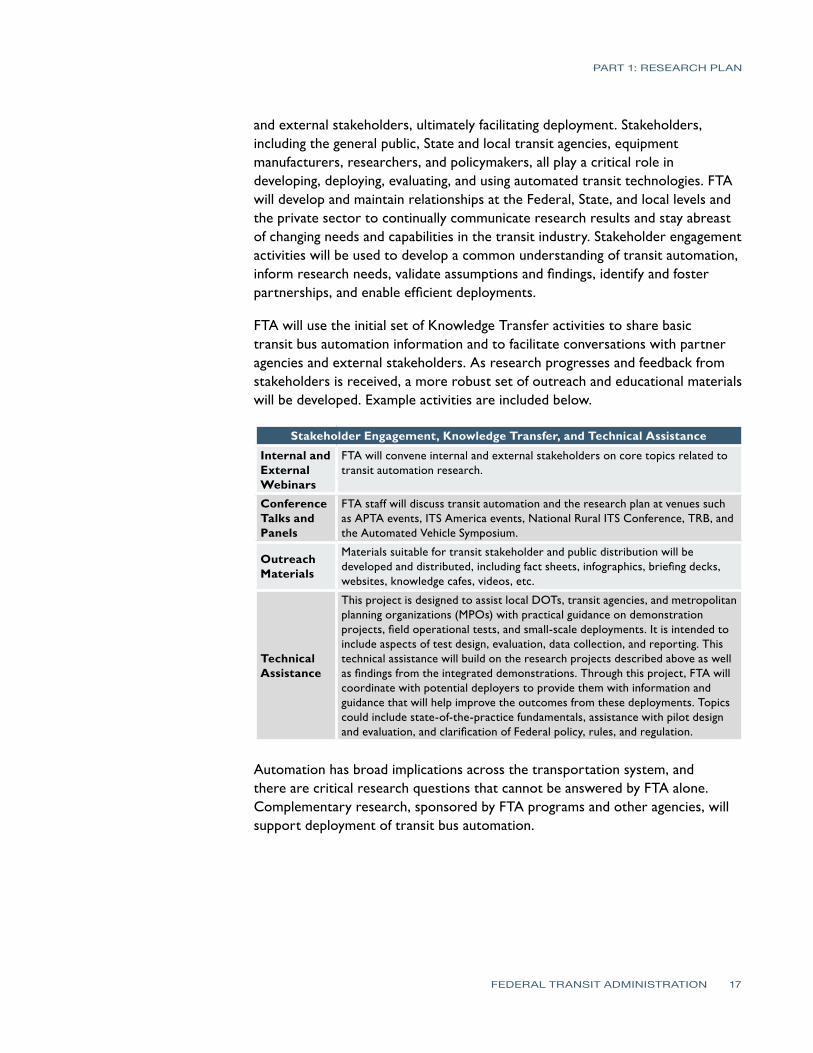
and external stakeholders, ultimately facilitating deployment. Stakeholders, including the general public, State and local transit agencies, equipment manufacturers, researchers, and policymakers, all play a critical role in developing, deploying, evaluating, and using automated transit technologies. FTA will develop and maintain relationships at the Federal, State, and local levels and the private sector to continually communicate research results and stay abreast of changing needs and capabilities in the transit industry. Stakeholder engagement activities will be used to develop a common understanding of transit automation, inform research needs, validate assumptions and findings, identify and foster partnerships, and enable efficient deployments.
FTA will use the initial set of Knowledge Transfer activities to share basic transit bus automation information and to facilitate conversations with partner agencies and external stakeholders. As research progresses and feedback from stakeholders is received, a more robust set of outreach and educational materials will be developed. Example activities are included below.
Stakeholder Engagement, Knowledge Transfer, and Technical Assistance
Internal and External Webinars
FTA will convene internal and external stakeholders on core topics related to transit automation research.
Conference Talks and Panels
FTA staff will discuss transit automation and the research plan at venues such as APTA events, ITS America events, National Rural ITS Conference, TRB, and the Automated Vehicle Symposium.
Outreach Materials
Materials suitable for transit stakeholder and public distribution will be developed and distributed, including fact sheets, infographics, briefing decks, websites, knowledge cafes, videos, etc.
Technical Assistance
This project is designed to assist local DOTs, transit agencies, and metropolitan planning organizations (MPOs) with practical guidance on demonstration projects, field operational tests, and small-scale deployments. It is intended to include aspects of test design, evaluation, data collection, and reporting. This technical assistance will build on the research projects described above as well as findings from the integrated demonstrations. Through this project, FTA will coordinate with potential deployers to provide them with information and guidance that will help improve the outcomes from these deployments. Topics could include state-of-the-practice fundamentals, assistance with pilot design and evaluation, and clarification of Federal policy, rules, and regulation.
Automation has broad implications across the transportation system, and there are critical research questions that cannot be answered by FTA alone. Complementary research, sponsored by FTA programs and other agencies, will support deployment of transit bus automation.
PART 1: RESEARCH PLAN
FEDERAL TRANSIT ADMINISTRATION 18
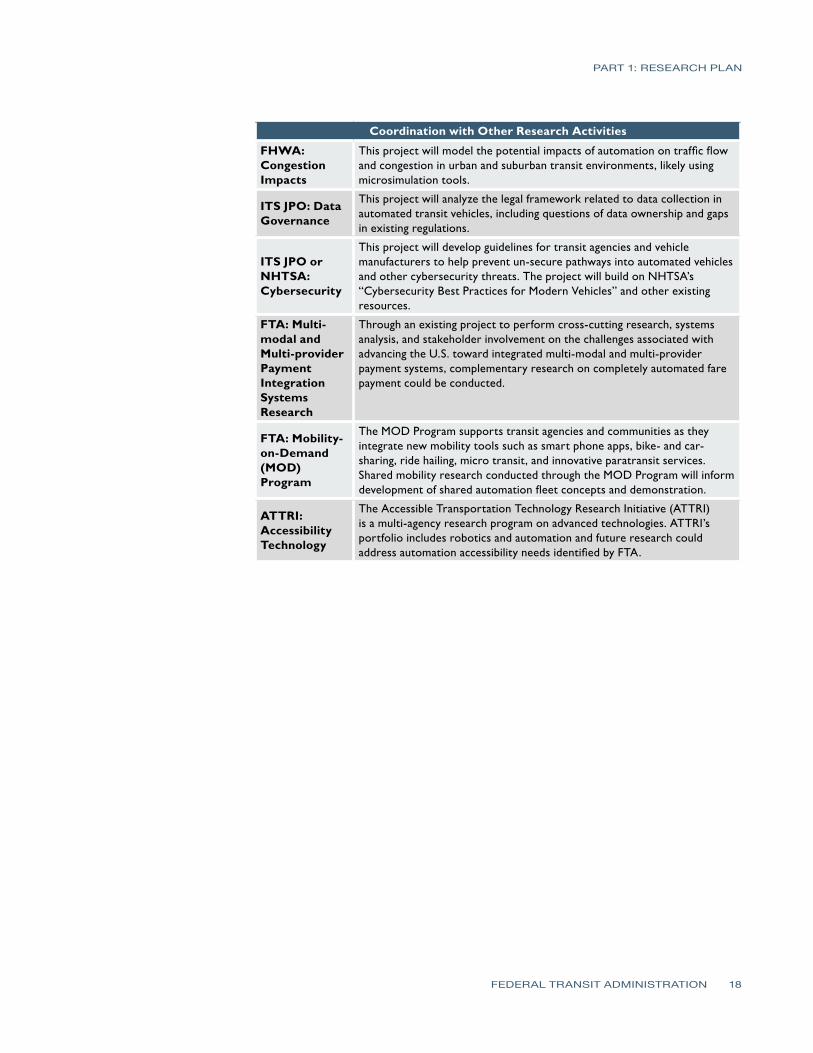
Coordination with Other Research Activities
FHWA: Congestion Impacts
This project will model the potential impacts of automation on traffic flow and congestion in urban and suburban transit environments, likely using microsimulation tools.
ITS JPO: Data Governance
This project will analyze the legal framework related to data collection in automated transit vehicles, including questions of data ownership and gaps in existing regulations.
ITS JPO or NHTSA: Cybersecurity
This project will develop guidelines for transit agencies and vehicle manufacturers to help prevent un-secure pathways into automated vehicles and other cybersecurity threats. The project will build on NHTSA’s “Cybersecurity Best Practices for Modern Vehicles” and other existing resources.
FTA: Multi-modal and Multi-provider Payment Integration Systems Research
Through an existing project to perform cross-cutting research, systems analysis, and stakeholder involvement on the challenges associated with advancing the U.S. toward integrated multi-modal and multi-provider payment systems, complementary research on completely automated fare payment could be conducted.
FTA: Mobility-on-Demand (MOD) Program
The MOD Program supports transit agencies and communities as they integrate new mobility tools such as smart phone apps, bike- and car-sharing, ride hailing, micro transit, and innovative paratransit services. Shared mobility research conducted through the MOD Program will inform development of shared automation fleet concepts and demonstration.
ATTRI: Accessibility Technology
The Accessible Transportation Technology Research Initiative (ATTRI) is a multi-agency research program on advanced technologies. ATTRI’s portfolio includes robotics and automation and future research could address automation accessibility needs identified by FTA.
PART
2
FEDERAL TRANSIT ADMINISTRATION 19
Input and Analysis
The Strategic Transit Automation Research Plan has been developed to accelerate the development, demonstration, and deployment of automation technologies in the transit industry by responding to research needs and gaps. Part II documents the process used to identify these needs and gaps and summarizes research conducted in the course of developing the plan.
MethodologyTo understand the current state of the practice and potential benefits, challenges, and risks and to gauge stakeholder interest, the research team conducted a series of research studies that engaged with internal and external stakeholders throughout. Techniques included literature review, in-person and remote interviews of subject matter experts and stakeholders, qualitative analysis, and benefit-cost analysis. Interviewees included FTA offices, transit agencies, industry representatives, academic institutions, and associations. In addition to the interviews, the research team hosted two stakeholder activities to solicit additional perspectives and feedback. Using the literature review and stakeholder consultation as a starting point, the research team identified and assessed risks and barriers to automation and identified potential mitigations to those risks and barriers. The literature review and stakeholder consultation also informed the development of technology packages and use cases, which were further refined based on input during the second stakeholder activity. The technology packages and use-case scenarios were used to structure the analysis in a benefit-cost analysis, which built out assumptions on the implementation of transit automation systems to discuss the appropriate automation technologies and calculate benefits and costs. Work products associated with these tasks are discussed in the following sections.
Inputs to Research Plan: Interim Products Summary of Literature Review (see Appendix F for full version)
Overall, the literature review revealed that transit bus automation research and development in the United States lags behind that which is taking place in Europe and Asia. There were relatively few relevant domestic projects identified in the review; all completed American automated bus demonstrations have been supported by funding from FTA, primarily through its VAA program.
PART 2: INPUT AND ANALYSIS
FEDERAL TRANSIT ADMINISTRATION 20
Several benefits of transit bus automation were identified in the literature review, which included review of various technologies used in vehicle automation. In general, transit automation is expected to address problems of road capacity, safety and connectivity to other modes of transportation. Articles focused on safety generally agreed that automation is a potential tool to mitigate crash risks for transit buses. The literature also included consideration of how automated taxis and similar services could reduce the costs of first/last-mile trips and change the nature or role of public transit in this area, essentially redefining public transportation from what it is today. Some reports also investigated the benefit automation could have on equity, concluding that automated services can help eliminate driver bias/discrimination in first/last-mile applications while expanding the reach of transit to areas that are currently underserved.
The literature also addressed barriers to implementation. One common barrier was the high cost of transit automation, especially as compared to applications for light-duty vehicles. Buses and other heavy-duty vehicles require a different approach to automation adaption than light-duty vehicles, which have received more research and development attention due to different vehicle dynamics and control systems. Technical challenges identified in the review include:
• Passenger comfort and ride quality
• System integration
• Telecommunication integration (e.g., unstable GPS signals)
• Inaccurate technology readings (e.g., false warnings)
• Safety concerns (e.g., vehicle malfunction)
• Environmental impacts (e.g., heat waves, drought)
Non-technical issues revealed by the demonstration projects include legal permissions to operate vehicles without drivers or without vehicle components (such as steering wheels), liability, procurement issues/delays, and issues of public perception and trust. Some of the literature asked whether, when, and how the general public will accept ride-sharing in automated vehicles. The general conclusion was that acceptance and trust are critical for integrating automated vehicles into shared transportation. Many passengers derive a sense of security from the presence of an operator; when surveyed, about 40% indicated a preference for higher fares with staff on board for all services. Nonetheless, the majority of individuals surveyed preferred automated service (as described in the survey) to non-automated services. This result indicates a general public acceptance of automated bus service, especially among younger people and male participants. Overall, the research recommends an incremental approach to automation that provides users with hands-on experience at every phase.
PART 2: INPUT AND ANALYSIS
FEDERAL TRANSIT ADMINISTRATION 21
The literature review also included documentation of transit automation deployment projects from the U.S. and abroad. The completed FTA VAA demonstrations in Oregon and California were included, as were non-VAA projects that are currently planned or underway. The international demonstration projects were from France, Germany, the Netherlands, United Kingdom, Japan, and Australia, as well as three from the CityMobil2 initiative in Europe (France, Switzerland and Greece). None of the demonstrations included automation of yard or maintenance facilities. The demonstrations used a variety of automation technologies, including magnetic markers, GPS, radar, LIDAR, cameras and electric drives, which were used for lane-keeping, precision docking, transit signal priority (TSP), automated taxis, and urban circulators. One demonstration identified several characteristics unique to bus operations as compared to light-duty vehicles, such as blind spot locations, component replacement and maintenance requirements, forces acting on seated and standing passengers, operator training and workload, proximity of pedestrians and waiting passengers, sensor placement, and vehicle lifespan.
Stakeholder Consultation (see Appendix E for full version) FTA has conducted significant stakeholder outreach through workshops, interviews, and webinars to ensure that FTA’s Strategic Transit Automation Research Plan aligns with stakeholder priorities and interests, as well as to get a better sense of the technology environment and identify potential risks and barriers and ways to address them. The stakeholders contacted hailed from private sector manufacturers and consultants, transit agencies, municipal organizations, state departments of transportation, academics, transit associations, non-profit organizations, and relevant federal agencies.
Stakeholder input was used in the development and refinement of the technology packages and use cases, which in turn informed the development of the research projects and demonstrations. Further, conversations with industry partners, transit agencies and FTA regional offices were used to identify technical and policy/regulatory barriers. The research projects and demonstrations aim to mitigate these barriers.
Risk-Barrier Assessment (see Appendix B for full version) In support of the development of this research plan, potential risks of and barriers to implementation of automation technologies in the transit industry were studied. For the purpose of the assessment, a “barrier” is an obstacle that could prevent or significantly challenge implementation of an automation technology. This could include policies, procedures, or actions that pose a barrier to implementation, whether intentional or unintentional. For example, if highly-automated vehicles do not meet safety certifications or accessibility standards, transit agencies may be unable to purchase those vehicles. A “risk” is
PART 2: INPUT AND ANALYSIS
FEDERAL TRANSIT ADMINISTRATION 22
defined as the potential for transit automation, once in place, to yield negative consequences or for anticipated benefits to go unrealized. A simple example is sensor malfunctions that could cause unsafe vehicle operations. Risks and barriers can be linked, for example, if safety concerns lead to new regulations that limit options for deployment, but they can also be distinct. A “mitigation” is a strategy or set of strategies that could be used to overcome the barrier or to reduce the magnitude or likelihood of the risk.
The content of the risk-barrier assessment represents a synthesis of findings from internal staff experience, a literature review, and numerous stakeholder interviews with representatives from FTA, transit agencies, industry, and academia.
• Safety and cost-related risks are critical. At a system level, the risks of negatively impacting passenger experience or equity are relatively less likely, since they are somewhat easier to anticipate and mitigate through appropriate design and implementation choices. For new technologies, however, safety and cost-related risks are often unknown, and have the potential to be quite serious. Automation technologies are still rapidly developing, and relevant safety standards do not yet exist, nor have component costs stabilized. Without operational experience to draw from, system and component costs will be difficult to project with any certainty.
• The major barriers are likely to be labor, risk-aversion, financial constraints, and market size. Whereas there are a number of potential barriers, these four were repeatedly raised by interviewees as the most likely to occur and the most difficult to overcome.
• Federal research and policy leadership is needed to create a solid basis for local decision-making on transit automation. By working closely with early adopters nationwide, FTA can analyze and synthesize their experiences to inform design specifications, system design, and deployments which enable user-friendly mobility.
Some of these risks and barriers are subject to influence by FTA through its funding of research and development, support for field operational tests, support for knowledge-sharing across the industry, and issuance of guidance and regulations where appropriate. Others, such as financial constraints, are largely determined by local conditions (e.g., ridership, political support, and population density) and national policy (e.g., legislation).
Transit Automation Use CasesUsing information gathered from the literature review and initial interviews, five technology packages and 14 use cases were generated. The technology packages, which group use cases with similar functionalities, were selected to represent
PART 2: INPUT AND ANALYSIS
FEDERAL TRANSIT ADMINISTRATION 23
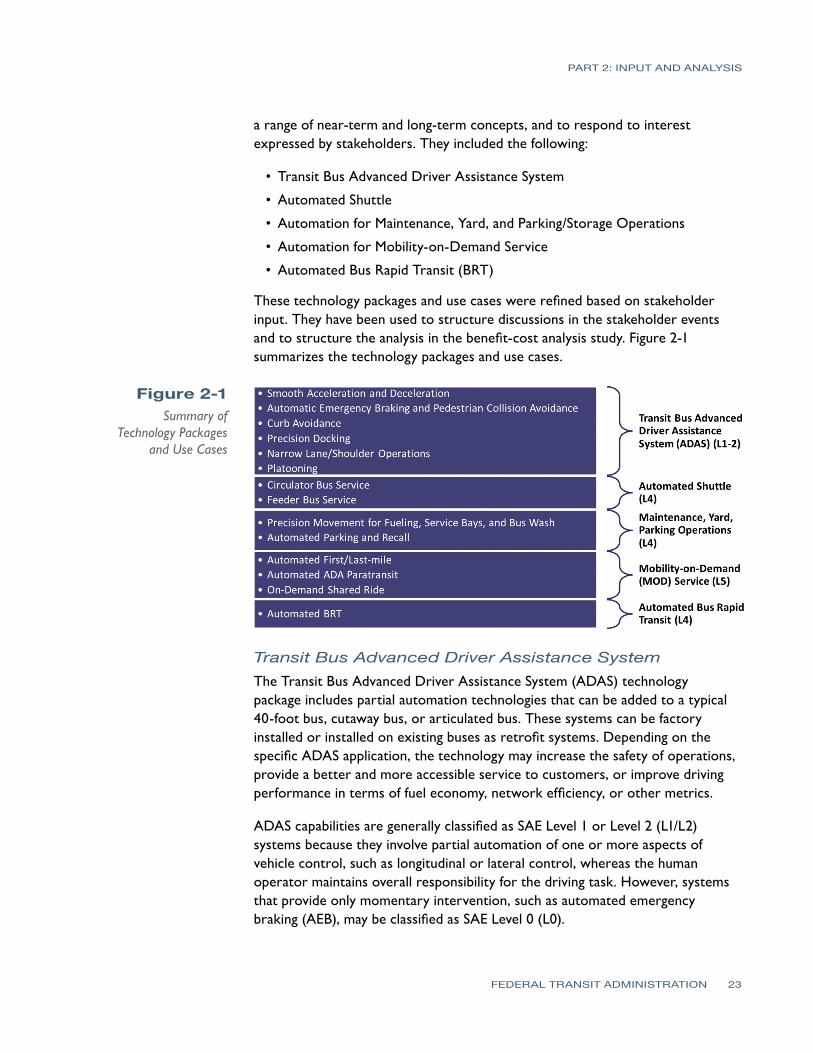
a range of near-term and long-term concepts, and to respond to interest expressed by stakeholders. They included the following:
• Transit Bus Advanced Driver Assistance System
• Automated Shuttle
• Automation for Maintenance, Yard, and Parking/Storage Operations
• Automation for Mobility-on-Demand Service
• Automated Bus Rapid Transit (BRT)
These technology packages and use cases were refined based on stakeholder input. They have been used to structure discussions in the stakeholder events and to structure the analysis in the benefit-cost analysis study. Figure 2-1 summarizes the technology packages and use cases.
Figure 2-1Summary of
Technology Packages and Use Cases
Transit Bus Advanced Driver Assistance SystemThe Transit Bus Advanced Driver Assistance System (ADAS) technology package includes partial automation technologies that can be added to a typical 40-foot bus, cutaway bus, or articulated bus. These systems can be factory installed or installed on existing buses as retrofit systems. Depending on the specific ADAS application, the technology may increase the safety of operations, provide a better and more accessible service to customers, or improve driving performance in terms of fuel economy, network efficiency, or other metrics.
ADAS capabilities are generally classified as SAE Level 1 or Level 2 (L1/L2) systems because they involve partial automation of one or more aspects of vehicle control, such as longitudinal or lateral control, whereas the human operator maintains overall responsibility for the driving task. However, systems that provide only momentary intervention, such as automated emergency braking (AEB), may be classified as SAE Level 0 (L0).
PART 2: INPUT AND ANALYSIS
FEDERAL TRANSIT ADMINISTRATION 24
ADAS on buses can use inputs from sensor systems (e.g., camera, radar, lidar) to provide information for actuators controlling throttle, braking, and steering systems. These components can enable a variety of applications, including:
• Smooth acceleration and deceleration to improve fuel economy
• Automated emergency braking (AEB) and pedestrian detection for collision avoidance
• Precision docking at bus stops
• Curb avoidance during bus stop approaches and turns
• Operations in narrow lanes or road shoulders (e.g., for Bus-on-Shoulder or BRT guideway)
• Bus platooning to enhance throughput in constrained corridors
These applications can be used in a variety of settings, including highways, expressways, busways, urban roads, and tunnels, depending on the specific application.
Automated ShuttleThe automated shuttle technology package uses a small, SAE Level 4 (L4) shuttle vehicle, such as the low-speed automated buses available from EasyMile, Local Motors, and Navya, or a modified FMVSS-compliant vehicle, such as the Chrysler Pacifica vans used by Waymo. As L4 vehicles, these shuttles do not require a human operator, although early demonstrations all have included an on-board human attendant to observe passengers, record data, answer questions, and serve as a safety operator if needed. Beyond initial prototype testing, these vehicles have been designed to run without an operator, which may enable additional transit services that would be cost prohibitive to provide if a human driver were required. Potential applications that have been considered for automated shuttles include:
• Circulator bus service – fixed-route or flexible service between two or more points
• Feeder bus service – connections to fixed-route transit stations
Due to their low speeds (generally less than 25 mph), these vehicles may be limited to operating in certain (limited speed) environments, such as parking lots, busways, campuses, downtown districts, and retirement communities.
Automation for Maintenance, Yard, and Parking/Storage OperationsThe Automation for Maintenance, Yard, and Parking/Storage Operations technology package includes L4 automation technologies that could be added to buses in a transit agency’s fleet, including a typical 40-foot bus, cutaway bus,
PART 2: INPUT AND ANALYSIS
FEDERAL TRANSIT ADMINISTRATION 25
or articulated bus. These systems are not currently available, either as factory-installed or as retrofitted systems, so assumptions about system cost and performance parameters as listed below represent the best available estimates at this time.
As defined in this technology package, the operational design domain (ODD) for the vehicles comprises the maintenance facility. Outside of the ODD, the vehicles will still require a human operator; within the ODD, they will be capable of operating without anyone in the vehicle.
This technology package is designed primarily to increase efficiency in transit agency facilities, but could also potentially have implications for safety of operations within the yard. As with the other technology packages, this package uses inputs from sensor systems (e.g., camera, radar, lidar) to provide information for actuators controlling throttle, braking, and steering systems. These components can enable a variety of applications, including:
• Precision docking and maneuvering for bus wash, service bay, refueling, and other yard or maintenance operations
• Fully-automated driving for parking and recall
These applications can be used only within the ODD and may require intensive mapping of the facilities or, in some cases, reconfiguration of the infrastructure at the facility. Precision docking and maneuvering includes fully-automated operation for some maintenance and service activities, such as pulling through a bus wash or into a service bay. Maintenance staff will still be needed for some daily operations and maintenance activities.
Automation for Mobility-on-Demand ServiceThe Automation for Mobility-on-Demand (MOD) Service technology package uses SAE Level 5 (L5) automation in a small- to medium-size vehicle (such as a minibus on a cutaway van chassis, although new designs may emerge) to provide on-demand service between any two addresses within a defined service area. Use cases identified for the MOD service include:
• Automated ADA paratransit
• Automated first/last-mile
• On-demand shared ride
This MOD concept is similar to the automated shuttle technology package; however, it is not restricted to predefined routes and waypoints, and users can request pick-ups and drop-offs rather than being restricted to scheduled service. In addition, rather than operating only in dense, high-demand areas, the MOD service can provide rides to users in neighborhoods and other less-dense locations, such as suburban and rural regions. The automated first/last-mile
PART 2: INPUT AND ANALYSIS
FEDERAL TRANSIT ADMINISTRATION 26
service concept would provide connections between a fixed-route transit stop (e.g., BRT or rail transit) and user specified locations, such as shopping centers, business parks, and residences. The on-demand shared ride concept would provide rides between user specified locations within a designated service area. The automated ADA paratransit concept would provide similar service as the on-demand shared ride concept, but it would also focus on providing rides to users with mobility limitations, and therefore, may need an on-board attendant, specialized equipment, or other design features.
Automated Bus Rapid Transit (BRT)The automated Bus Rapid Transit (BRT) technology package uses a full-size or articulated bus with L4 automation to provide BRT service without a driver on board the vehicle. According to FTA, BRT is a “high-quality bus-based transit system that delivers fast and efficient service that may include dedicated lanes, busways, traffic signal priority, off-board fare collection, elevated platforms and enhanced stations.”8 BRT systems use buses to provide cost-effective service at metro-level capacities by including features similar to a light or heavy rail system. BRT systems are faster and more reliable and typically have longer distances between stops compared to regular bus service.9 These features focus on eliminating causes of delay that typically slow regular bus services (e.g., being stuck in other road traffic and on-board payment for passengers). Over the past decade, BRT has become more common, and today such systems operate in large cities such as Los Angeles and Pittsburgh, as well as mid-size metropolitan areas such as Eugene, Oregon.10 Fully-automated BRT could be of interest to cities that are considering cost-effective alternatives to light rail transit or other high-capacity transit systems.
As L4 vehicles, these automated BRT buses would not require a human operator, although such a system has yet to be demonstrated. Some work has already been done to test automated features on BRT systems, including applications such as lane centering and precision docking at boarding platforms, although those applications have been tested with a driver on board and were considered L1 or L2 systems.11
8 FTA (2017), “Bus Rapid Transit,” Federal Transit Administration, U.S. Department of Transportation. https://www.transit.dot.gov/research-innovation/bus-rapid-transit, updated January 6, 2017.
9 ITDP (2017), “What is BRT?” Institute for Transportation & Development Policy. https://www.itdp.org/library/standards-and-guides/the-bus-rapid-transit-standard/what-is-brt/, accessed September 2017.
10 FTA (2017).11 FTA (2016), “Vehicle Assist and Automation (VAA) Demonstration Evaluation Report,” Report 0093, Federal Transit Administration, U.S. Department of Transportation, January. https://www.transit.dot.gov/sites/fta.dot.gov/files/docs/FTA_Report_No._0093.pdf; Daimler (2017), “Mercedes-Benz Future Bus: Safe, Ecological, Comfortable – Semi-Automated Driving with the CityPilot,” Daimler Media, http://media.daimler.com/marsMediaSite/ko/en/12776483, accessed September 2017.
PART 2: INPUT AND ANALYSIS
FEDERAL TRANSIT ADMINISTRATION 27
Bus Operator Actions Summary (see Appendix C for full version)
To better understand the technical challenges unique to automating bus transit, the non-driving tasks of bus operators were compiled. These then were analyzed to determine the general level of difficulty associated with fulfilling these non-driving tasks without a human operator or attendant. This assessment was an analytical tool and is not necessarily representative of all transit operations, which may vary between agencies. High-level findings from this exercise are summarized below.
Initial Findings• Pre-trip inspection requirements likely could be addressed through advanced
sensing, although current technology may not fully address these needs. Some activities during pre-trip inspection require visually inspecting the vehicle, physically touching vehicle components, listening and smelling for indicators of a mechanical problem, and other actions. Current technology does not directly address all of these actions.
• Vehicle movement is unlikely to be a significant barrier to transit automation. Thorough research currently exists, including demonstration projects, to address heavy-duty vehicle driving through sensing and actuation.
• Communication between potential passengers, on-vehicle passengers, and other road users is currently addressed through formal means (e.g., external destination signage, internal announcements and signage) and informal means (e.g., bus operator waving to communicate vehicle is full, body language to indicate a person standing on street intends to board vehicle). Transit automation implementations will need to consider new ways of communicating with people, especially in high-context environments in which body language or eye contact sometimes communicates a potential passenger’s intents.
• Current practices for fare payment and revenue collection may be addressed through a combination of automation and periodic fare payment verification (e.g., periodic on-vehicle fare checking by human staff). Automation may require revising current procedure or creating entirely new processes for fare collection.
• Automation technology currently cannot fully address bus operator responsibilities related to monitoring passengers, answering passenger questions, and otherwise interacting with passengers. Technologies exist for addressing components of these responsibilities, such as smartphone applications or kiosks to communicate system information, but more nuanced responsibilities such as answering specific questions, monitoring passengers for safety and security, and deescalating on-board altercations or other emergent situations are not currently addressed by automation.
PART 2: INPUT AND ANALYSIS
FEDERAL TRANSIT ADMINISTRATION 28
• Some specialized service models, such as flagged service or deviated route service, may be challenging for automated systems because system behavior varies depending on passenger needs. Without a way for passengers to communicate with the system and vehicle, automation will not be able to address these service models.
• Passengers with mobility devices currently rely on the bus operator to deploy a ramp or lift and secure the mobility device to the vehicle. Technology exists to automate these specific activities, but some passengers may require further assistance outside of ramp deployment and securement, such as carrying belongings onto the vehicle. These automated systems might not fully address the needs of all passengers.
• Transit buses must have awareness of network location to ensure there is always an exit from a roadway. Mapping technology exists or could be developed to address this application, but it must be applied properly for transit buses. For example, a vehicle may sense that there is sufficient clearance for turning onto another roadway. However, if there is a low bridge one mile down the roadway, the turn is actually not allowable because there is no way for the transit vehicle to exit the roadway. These are not always marked with signage, and will not always be recognized by on-vehicle sensing.
• Additional roadway information may be necessary for safe operation of transit buses, which might require additional data gathering mapping application development. For example, transit buses must know clearance of bridges, weight restrictions on roadways and bridges, and curb heights where the front of the vehicle hangs over a narrow roadway during turning maneuvers.
• Fueling, servicing, and cleaning the vehicle require highly-specialized, physical tasks that may be challenging to automate. Current technology allows for partial automation of these tasks, such as automatic measurement and dispensing of fluids, but technology to enable fully-automated fueling, servicing, and cleaning is not currently available. However, automated vehicles could improve efficiencies in these task areas by independently moving between parking locations and work stations.
• Automation technology for sensing a collision may currently exist, or may be adopted from light duty vehicles. Technology to assist agencies in responding to collisions, however, currently does not exist. Bus transit systems require specialized processes when collisions occur, including communication with affected parties (on- and off-vehicle), deployment of replacement service, helping affected passengers reach their destinations, assessing the transit vehicle operator for required drug or medical testing (which may or may not continue to be relevant), and inspection of the damaged transit vehicle.
PART 2: INPUT AND ANALYSIS
FEDERAL TRANSIT ADMINISTRATION 29
• Transit vehicles undergo a pre-trip inspection prior to revenue service, but mechanical failures also occur during revenue service. Bus operators often can hear or feel indicators of mechanical failure, and can investigate and alert a dispatcher. Sensing could likely address these responsibilities, but may not be able to investigate on-road mechanical failures, which can require exiting the vehicle and visually, aurally, or tactilely inspecting vehicle components.
• Blocked roadways, traffic light outages, construction, and other roadway issues affect all roadway users. Transit vehicles have unique height, weight, and width requirements for roadway use, and may be impacted differently from light duty vehicles. Automation technologies for light duty vehicles already address these special roadway circumstances, but may need to be modified to meet the needs of transit vehicles. In cases in which a roadway is impassable for a transit vehicle, agency staff must also be able to detour the vehicle and communicate service impacts to users.
• Transit agencies occasionally use buses to assist public safety agencies and other organizations during emergencies and events. For example, when an apartment building catches fire a transit agency may be called upon to provide temporary shelter while affected residents are processed by first responders. These unique use cases may not require any additional automation technology other than what would already be available on a functioning automated bus.
Benefit-CostAnalysis(see Appendix D for full version)
The analysis investigated the benefits and costs for selected transit bus automation use cases from the perspective of the transit agency’s internal business case. It was performed to provide decision-support to FTA and its stakeholders as they consider priorities for further research and potential tests or deployments. The research team did not attempt to quantify benefits that accrue to transit users, such as travel time improvements, or intangible benefits such as improved transit agency marketing or customer satisfaction. Thus, the benefit-cost figures should not be used to produce strict rankings of the use cases, but only to give initial indications of their cost-effectiveness and to highlight the factors that influence their return on investment, as an input to further research. The results of the benefit-cost analysis are summarized below.
Initial FindingsThe business case for automation applications is highly influenced by the specific characteristics of the transit service or facility, as no two are alike. For example, a particular use case that is highly cost-effective for a two-mile, low-speed circulator route may not be cost-effective for a longer route or in a different operational environment. Additional sensitivity testing can help identify the breakeven points for cost-effective investment for agencies with different service characteristics.
PART 2: INPUT AND ANALYSIS
FEDERAL TRANSIT ADMINISTRATION 30
With those caveats in mind, the results indicate that ADAS capabilities such as Smooth Acceleration and Deceleration, Automatic Emergency Braking and Pedestrian Collision Avoidance, and Narrow Lane/Shoulder Operations all have a favorable investment profile at current cost levels. The costs for onboard sensing and other equipment needed to enable these applications are more than offset by long-term savings in fuel, crash costs, and/or operating costs. Since there is overlap in the equipment required for each use case, transit agencies may find that implementing these capabilities as a package is more cost-effective than any single application. Calculations for the automated Maintenance, Yard, and Parking Operations use cases also showed the potential for a positive return on investment, based on the prospect of reducing labor requirements, though these results are contingent on the specifics of yard layout and agency policies.
For fully-driverless shuttle vehicles and Automated ADA Paratransit, as well as for Automated BRT, the results suggest the potential for large cost savings relative to conventional service with human operators, but only in scenarios without an onboard attendant. There is limited operational experience with these vehicles, and more research is needed on the safety, security, and accessibility implications of fully-unattended operation, as well as customer acceptance.
Other automated Mobility-on-Demand concepts are discussed in the report, but information on costs, availability, and overall service and business models is currently too speculative to support quantitative benefit and cost estimates. These areas are all candidates for additional research. Other research needs identified in the report include work on the operational implications of precision docking; the user benefits of ADAS applications, including improved travel time and reliability; and applications of partial automation for platooning.
Knowledge Transfer Activity PlanTo develop a robust suite of activities to transfer knowledge gained from FTA-sponsored transit automation research, relevant stakeholders, communication requirements, and priority activities were identified and documented in a Knowledge Transfer Activity Plan. The document will need to be updated as new research findings suggest additional areas of outreach.
Research Needs and GapsTo develop this Strategic Transit Automation Research Plan, significant work was done to identify the research needs and gaps regarding transit bus automation. The findings and lessons learned from the research will be shared with key stakeholders including industry, transit agencies, and research institutions. Identified research needs and gaps include:
PART 2: INPUT AND ANALYSIS
FEDERAL TRANSIT ADMINISTRATION 31
• Safety and Security – There is a potential for automated systems to introduce new safety and security vulnerabilities to transit operations. These could include limitations of the software and hardware, human factors issues affecting safety (or perceptions thereof), and cybersecurity vulnerabilities. Research will be required across multiple areas to demonstrate how reliably safe automated vehicle systems are.
• Operations and Economics – Transit bus automation may have economic and operational impacts that require additional research. For example, it may be expensive to procure or retrofit vehicles and facilities for automation, or to automate non-driving tasks such as accessibility assistance. At present, product availability is limited, and lifecycle costs and cost-effectiveness have generally not been quantified. Further, there may be effects on workforce needs and operational practices that will need to be understood before operationalizing automation in transit. Additionally, when introducing fully-automated systems or systems that enable new service models, there may be an impact on congestion and traffic-flow. More demonstration of these systems will be needed to model and understand these potential effects.
• Passenger Experience – Ensuring a positive passenger experience is critical to deploying automated transit operations. There will need to be significant research, demonstration, and evaluation of transit bus automation to verify reliability, ride quality, and customer service.
• Policy Research – The policy environment for automation is rapidly advancing, and it is necessary to understand the impacts of Federal, State, and local regulations and policies on demonstrating and deploying transit bus automation. Special consideration should be given to fare payment, labor issues, accessibility, liability and insurance, data collection and management, and procurement.
These research needs and gaps represent the highest priority areas for the enabling research and integrated demonstrations described in Part I. They will be used to guide the design and evaluation of demonstrations and to assess the relevance of potential Strategic Partnerships as those opportunities arise. By addressing these needs, FTA can address issues that may otherwise impede adoption and make most effective use of its resources.
ConclusionThe five-year research agenda outlined in FTA’s Strategic Transit Automation Research Plan will provide a framework for the transit industry to pursue transit bus automation in a safe, efficient, and economically-sound manner. Built on a foundation of stakeholder engagement, use case analysis, and an extensive literature review, the Plan defines activities in the areas of Enabling Research, Integrated Demonstrations, and Strategic Partnerships to explore non-technical factors. If not properly addressed, these could slow or stop the development
PART 2: INPUT AND ANALYSIS
FEDERAL TRANSIT ADMINISTRATION 32
and deployment of transit automation technologies. While acknowledging the continued existence of technical challenges, the rapid development of transit automation technology and the limitations of Federal resources informed FTA’s decision to focus on the societal, institutional, and regulatory issues impacting the development, demonstration, evaluation, and, ultimately, full deployment of transit bus automation. The Plan’s continued emphasis on stakeholder engagement, knowledge transfer, and technical assistance will ensure that complementary work being done by the public sector, the private sector, and academia is effectively communicated and leveraged. By providing leadership and guidance at the Federal level while incorporating the strengths of external stakeholders and partners, the Strategic Transit Automation Research Plan will help close the gap between the transit bus industry and earlier adopters of automation technologies while continuing to maintain a secure and equitable transportation system.

APPENDIX
FEDERAL TRANSIT ADMINISTRATION 33
A SAE Levels of AutomationIn general, SAE J3016™ levels and definitions include:
• Level 0 – No Automation – The full-time performance by the human driver of all aspects of the dynamic driving task, even when enhanced by warning or intervention systems.
• Level 1 – Driver Assistance – The driving mode-specific execution by a driver assistance system of either steering or acceleration/deceleration using information about the driving environment and with the expectation that the human driver performs all remaining aspects of the dynamic driving task.
• Level 2 – Partial Automation – The driving mode-specific execution by one or more driver assistance systems of both steering and acceleration/deceleration using information about the driving environment and with the expectation that the human driver performs all remaining aspects of the dynamic driving task.
• Level 3 – Conditional Automation – The driving mode-specific performance by an Automated Driving System of all aspects of the dynamic driving task with the expectation that the human driver will respond appropriately to a request to intervene.
• Level 4 – High Automation – The driving mode-specific performance by an Automated Driving System of all aspects of the dynamic driving task, even if a human driver does not respond appropriately to a request to intervene.
• Level 5 – Full Automation – The full-time performance by an Automated Driving System of all aspects of the dynamic driving task under all roadway and environmental conditions that can be managed by a human driver.
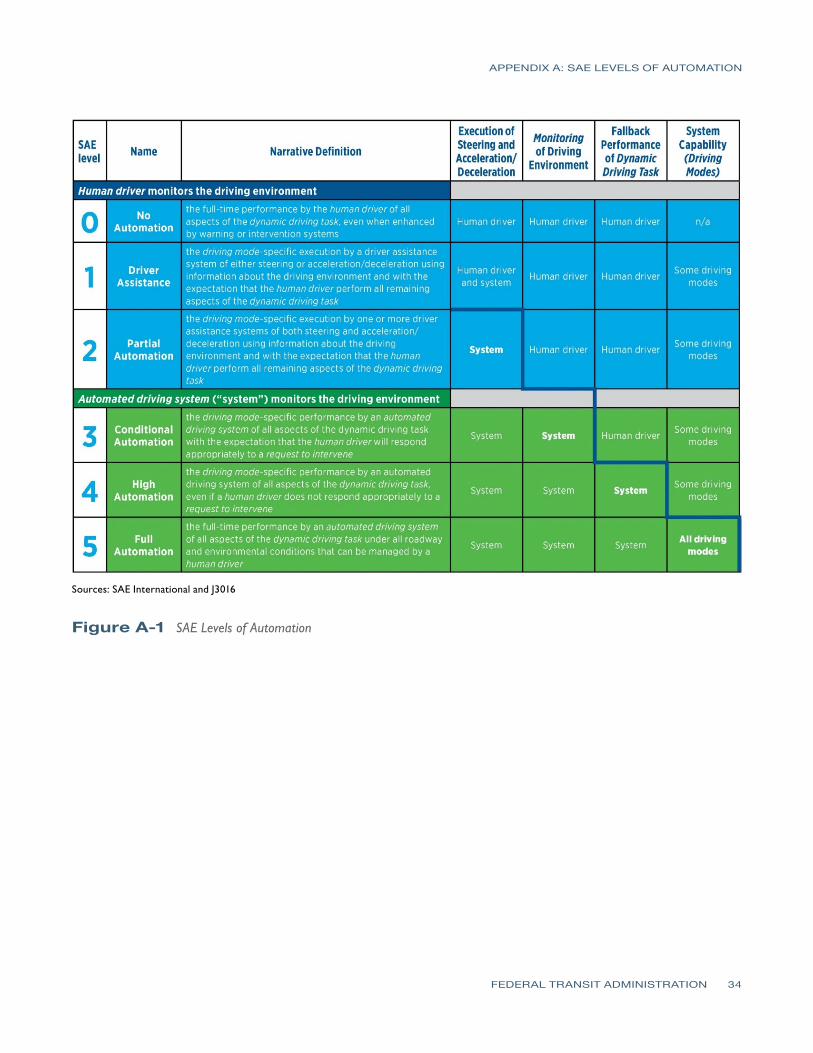
APPENDIX A: SAE LEVELS OF AUTOMATION
FEDERAL TRANSIT ADMINISTRATION 34
Sources: SAE International and J3016
Figure A-1 SAE Levels of Automation
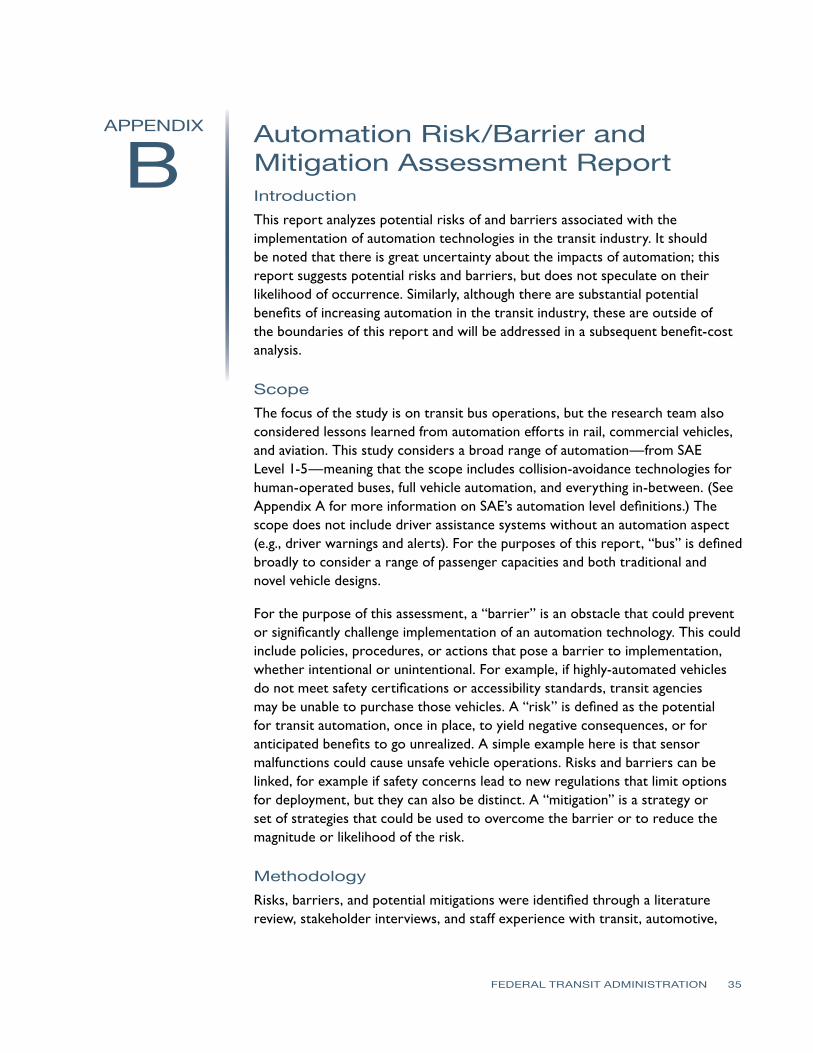
APPENDIX
FEDERAL TRANSIT ADMINISTRATION 35
B Automation Risk/Barrier and Mitigation Assessment ReportIntroductionThis report analyzes potential risks of and barriers associated with the implementation of automation technologies in the transit industry. It should be noted that there is great uncertainty about the impacts of automation; this report suggests potential risks and barriers, but does not speculate on their likelihood of occurrence. Similarly, although there are substantial potential benefits of increasing automation in the transit industry, these are outside of the boundaries of this report and will be addressed in a subsequent benefit-cost analysis.
ScopeThe focus of the study is on transit bus operations, but the research team also considered lessons learned from automation efforts in rail, commercial vehicles, and aviation. This study considers a broad range of automation—from SAE Level 1-5—meaning that the scope includes collision-avoidance technologies for human-operated buses, full vehicle automation, and everything in-between. (See Appendix A for more information on SAE’s automation level definitions.) The scope does not include driver assistance systems without an automation aspect (e.g., driver warnings and alerts). For the purposes of this report, “bus” is defined broadly to consider a range of passenger capacities and both traditional and novel vehicle designs.
For the purpose of this assessment, a “barrier” is an obstacle that could prevent or significantly challenge implementation of an automation technology. This could include policies, procedures, or actions that pose a barrier to implementation, whether intentional or unintentional. For example, if highly-automated vehicles do not meet safety certifications or accessibility standards, transit agencies may be unable to purchase those vehicles. A “risk” is defined as the potential for transit automation, once in place, to yield negative consequences, or for anticipated benefits to go unrealized. A simple example here is that sensor malfunctions could cause unsafe vehicle operations. Risks and barriers can be linked, for example if safety concerns lead to new regulations that limit options for deployment, but they can also be distinct. A “mitigation” is a strategy or set of strategies that could be used to overcome the barrier or to reduce the magnitude or likelihood of the risk.
MethodologyRisks, barriers, and potential mitigations were identified through a literature review, stakeholder interviews, and staff experience with transit, automotive,
APPENDIX B: AUTOMATION RISK/BARRIER AND MITIGATION ASSESSMENT REPORT
FEDERAL TRANSIT ADMINISTRATION 36
and automation sectors. The research team interviewed 29 stakeholders from within the Federal Transit Administration (FTA) and at transit agencies and local governments, academia, and manufacturers and suppliers. The full list of organizations interviewed is included below.
Report OrganizationThe sections below describe risks, barriers, and potential mitigation strategies. Conceptually, “barriers” must be overcome for “risks” to occur. However, this report first details risks, an understanding of which is necessary to explain the barriers that follow. Some risks and barriers are more likely to occur at particular points in a technology’s maturity and deployment; others are more general in nature. General categories of mitigations are described; Appendices B and C show the applicability of potential mitigation strategies to the identified risks and barriers. Finally, the conclusion identifies critical risks and barriers and discusses the ability of FTA to influence outcomes.
RisksFour major categories of risk were identified: Safety and Security, Operations and Cost-Effectiveness, Passenger Experience, and Equity. Whereas this section is focused on risks and does not discuss potential benefits in any detail, positive impacts from automation may be experienced in each of these categories as well. (The inclusion of a particular risk thus reflects the possibility of negative outcomes, not a prediction of such an outcome.)
Safety and SecuritySafety risks comprise the pathways by which automated transit systems may not achieve their expected safety benefits, or by which new types of negative safety outcomes could occur even as overall transit safety improves. Sources of risk include:
• Software and hardware failures or limitations – Like all technologies, the sensor-based systems that enable automated operation are fallible. In particular, they may have limited capabilities in poor weather and low light conditions, in construction zones, or on atypical road surfaces. Many automated safety systems also require the presence of high-quality lane markings, which may not be present along urban transit routes or may be temporarily obscured by snow or dust. Unless adequate fail-safes are put in place, system failures could lead to collisions with other vehicles or road users. Even in the absence of a collision due to sensor failure, a recurring need to revert to manual operating mode due to system limitations would diminish the potential safety benefits expected from automation. Repeated “false positives” from collision avoidance systems would also create operational challenges (e.g., delays and degradation of service quality due

APPENDIX B: AUTOMATION RISK/BARRIER AND MITIGATION ASSESSMENT REPORT
FEDERAL TRANSIT ADMINISTRATION 37
to unnecessary stopping) and may lead agencies to reduce their use of the technology or disable it altogether.
• Human factors – For bus operators (and for the private automobile operators with whom they interact on the roads), repeated use of automated functions can lead to over-reliance on the systems and overestimation of the automated capabilities. Operators also may be distracted by secondary tasks when the vehicle is not under their manual control. In both scenarios, operators may lack situational awareness and, thus, be unprepared to revert to manual mode when required, which could lead to crashes. Over the longer term, heavy reliance on automation could also cause driver skills to atrophy, making them less prepared for manual operation and raising the crash risk. Vulnerable road users’ initial experiences with automated transit could also cause them to misjudge or overestimate vehicle collision avoidance capabilities. This could lead to risk-taking behaviors, such as turning in front of a bus, which could result in a crash in cases in which the automated system is not capable of responding.
• Security and cybersecurity considerations – This refers to the potential for assaults and criminal activity to become more prevalent when there is no driver or other transit agency employee on the bus or through the introduction of automation technologies. Currently, the presence of a driver (who can, if necessary, communicate to police by radio) can act as a deterrent to criminal behavior. With the employee absent, onboard crime could increase. There is even the possibility of a vehicle hijacking or other scenarios that could be more prevalent in the absence of a human driver if adequate safeguards are not in place. Cybersecurity is another element of security concerns, as “hacked” transit vehicles could be used in an unsafe manner.
• Emergency response – Similarly, the lack of a human operator could impede emergency response and communications with responders. This could lead to greater consequences (e.g., injury severity) in the event of a crash or other incident.
• Quiet operations – Strictly speaking, although this is more related to vehicle and powertrain issues, there is the potential for automated vehicles to operate more quietly due to associated changes in vehicle size or propulsion. This raises the crash risk for visually-impaired pedestrians, who rely in part on traffic noise to judge the safety of crossings. This also could make it more difficult for them to board the transit vehicle safely, particularly if there is no human operator to provide assistance. To some extent, this safety risk also applies to non-visually impaired road users who also use traffic noise as a cue to safe operation.
APPENDIX B: AUTOMATION RISK/BARRIER AND MITIGATION ASSESSMENT REPORT
FEDERAL TRANSIT ADMINISTRATION 38
Operations, Maintenance, and Cost-EffectivenessThis category refers to the potential for automated transit to present unintended negative outcomes with regard to service provision and costs.
• Unplanned technology and transition costs – Transit automation may require additional capital, maintenance, or operating costs, such as for revamping maintenance facilities, enhancing telecommunications capabilities, or maintaining sophisticated onboard and roadside equipment. In particular, agencies could face higher costs during the transition period between manual and automated control, when both sets of vehicles, parts, and systems would need to be maintained. Full automation also could require significant investments in new fare collection systems or technologies, since a human operator may not be available to oversee fare payments. As a result of these costs, the savings from automation may be less than anticipated. Planned lifecycle costs of technology also may not decline as quickly as anticipated, particularly if agencies become “locked in” to a particular supplier of proprietary automation technology.
• Workforce costs – Automation may require a high-skill workforce and/or a significant change in occupational specialties due to the technology components, which in turn could create recruiting and retention costs for transit agencies. There also could be potential training needs or overall wage increases due to the higher skill levels needed for automated operation. The transition between manual and automated operations also may take longer than expected. These factors would reduce the labor cost savings that would otherwise be expected from a move toward automated operation.
• Obsolescence – Fast-paced changes in technology markets could make capital investments or spending plans obsolete, which is a particular challenge for public agencies with long lead times for procurements and typically cumbersome processes. An example that has been mentioned is the difficulty of managing rapid technology product cycles in the context of the much longer lifespan of a bus, which can be 12 years or more. In extreme cases, agencies could be stuck with non-functional or non-standard technology that would need to be replaced at significant expense. In other cases, the savings from automation may be less than anticipated due to upgrade or switchover costs.
• Costs of new service patterns – Transit automation could lead to changes in overall service patterns that are beneficial to passengers but costly for the agency—for example, with increased expectations for point-to-point or door-to-door service or a more diverse fleet of vehicles. This could reduce the productivity and cost-effectiveness of the transit service relative to conventional fixed-route service. It also could require capital investment for additional vehicles or entail higher maintenance costs due to the complexities of operating additional vehicle types. These changes, in
APPENDIX B: AUTOMATION RISK/BARRIER AND MITIGATION ASSESSMENT REPORT
FEDERAL TRANSIT ADMINISTRATION 39
turn, could necessitate changes to transit funding mechanisms that would themselves entail transition costs or collection costs.
• Congestion and emissions – Transit service changes that are designed to take advantage of automation capabilities potentially could have the effect of reducing vehicle productivity or fuel economy, and/or result in greater vehicle-miles of travel for transit vehicles. One example would be a large fleet of driverless shuttles for first/last-mile service that create congestion on local streets. On-demand service types may also increase vehicle-miles traveled in “zero passenger” or deadhead service. These service changes could impose higher societal costs in the form of congestion and emissions. Although these costs would largely not be borne by the transit agency directly, they would have the effect of reducing the overall benefits from automation.
• Increased competition from other modes and transit providers – Vehicle automation may enable new transportation services and business models that erode public transit agencies’ market share. For example, private sector firms may offer transit-like service using highly-automated vehicles, potentially as a direct competitor to conventional fixed-route rail and buses, with implications for ridership and revenue. Low-ridership routes that serve important societal needs often are cross-subsidized by higher-ridership routes. Market erosion on the latter due to private sector competition could impact agencies’ ability to serve the former.
Passenger ExperienceThere are risks that automated transit could degrade one or more elements of the transit passenger experience, or at a minimum fail to deliver expected benefits.
• Travel times and reliability – Users’ overall transit travel times may not decrease much, or at all, due to factors such as changed service patterns (e.g., more route deviations) or conservative vehicle control algorithms, and/or due to external factors such as increased traffic congestion. If that is the case, expected benefits in terms of travel time savings would not be realized. Similarly, travel time reliability could be affected. Overall service reliability also could be reduced—for example, if automated transit vehicles fail without warning mid-route and require a relief vehicle or human operator to be dispatched. All of these factors would impact ridership.
• Convenience and Access – Changes in service characteristics that accompany automation may reduce convenience for some riders. For example, automated vehicles that have been designed for controlled environments may not be capable of providing a route-deviation service that uses other streets in mixed traffic. Likewise, a “flag stop” service could prove challenging for an automated bus, since it would require some level of gesture recognition to interpret waiting passenger pickup requests, along with an ability to distinguish safe vs. unsafe stopping locations in between
APPENDIX B: AUTOMATION RISK/BARRIER AND MITIGATION ASSESSMENT REPORT
FEDERAL TRANSIT ADMINISTRATION 40
designated stops. Although these types of services generally are not as common as fixed routes, they often are highly valued by passengers, and the inability to continue such service could affect ridership and customer satisfaction. Even conventional fixed-route services could experience issues with service quality—for example, if highly-automated buses have imperfect capabilities for detecting the presence of passengers waiting to board at stops. Even a small number of missed pick-ups would create issues with customer satisfaction.
• Customer service – The lack of a human operator would reduce service quality for passengers who currently receive assistance from the operator—for example, for wheelchair securement, fare payment, service questions, or wayfinding. Although some of these functions can be automated to a degree, many passengers would view that as an incomplete substitute for personal assistance. Again, this would affect ridership and customer satisfaction.
• Ride quality, comfort, and privacy – Previous field trials found that some automated systems produce a “jerky” ride, e.g., with high lateral acceleration. Emergency auto-braking or forward collision avoidance also could produce strong deceleration that would be experienced very sharply by unrestrained bus passengers, particularly standees. Although ride quality may improve alongside technology, other impacts may be discovered as automation advances. Comfort also could be impacted by changes in vehicle design that accompany automation. Different vehicle types also could negatively impact passenger experiences with regard to personal space and privacy, which, in turn, could affect ridership and customer satisfaction.
EquityEquity concerns focus on the possibility that the benefits of transit automation would not be shared equally by all segments of society, or that automated transit would create or exacerbate disparities among users along the lines of income, race, sex, disability, geography, or related factors. As transit agencies are already required by Federal law and regulation to practice non-discrimination12 and to accommodate riders with disabilities,13 the partial or full automation of transit services would likely raise novel issues related to equity.
• Payment – Without a human operator to handle cash fare transactions, transit agencies may move toward all-electronic fare collection. This could present a hardship for low-income communities that include many unbanked households—i.e., those with no formal bank accounts or access to credit/debit cards. The affected populations could lose access to transit unless alternatives are developed, creating inequities in transit access.
12 See FTA Circular, Title VI, “Requirements and Guidelines for Federal Transit Administration Recipients,” FTA C 4702.1B, October 1, 2012.
13 See FTA Circular, “Americans with Disabilities Act (ADA): Guidance,” FTA C 4710.1, November 4, 2015.
APPENDIX B: AUTOMATION RISK/BARRIER AND MITIGATION ASSESSMENT REPORT
FEDERAL TRANSIT ADMINISTRATION 41
• Accessibility – Passengers with disabilities may find it more difficult to use automated vehicles due to the lack of assistance from a human operator. Depending on the type of disability, this could relate to challenges with finding the transit stop, boarding the vehicle, securing a wheelchair, or knowing where to exit. The same could be true for passengers who do not have a formal disability but require occasional assistance and may not be comfortable with the prospect of riding a driverless vehicle. Vehicle design changes that accompany automation could ameliorate these impacts but also could introduce additional accessibility issues. Reduced accessibility would create inequities in service provision and access.
• Service changes – Changes to transit service patterns that accompany automation could create disparities among groups—for example, if higher-income neighborhoods receive a disproportionate share of new service, if low-volume transit routes are eliminated, or if access to (and comfort with) mobile phone applications is required to request service. Again, such changes would create inequities in service provision and access.
BarriersGiven the dynamic nature of the automation industry and rapid advances in sensor systems and artificial intelligence, technical barriers that exist as of this writing may be rapidly overcome. Consequently, this report focuses on non-technical barriers such as legal, financial, and institutional obstacles to deployment of automation. However, there are known limitations of existing technologies, both on the market and in development. For example, current camera-based collision avoidance systems have a high rate of false positives.
The following categories of barriers were identified and are discussed:
• Product Availability
• Labor Relations and Human Resources
• Financial Constraints
• Risk-Aversion
• Accessibility
• Law, Regulation, Liability and Insurance
• Institutional Capacity and Planning
• Interagency Cooperation
• Public Opposition Due to Privacy, Equity, and Other Policy Concerns
Product AvailabilityA primary barrier to widespread deployment of automation is that transit vehicles with relevant automation features are primarily limited to small, low-speed shuttles,14 and more conventional automated vehicles will not become
APPENDIX B: AUTOMATION RISK/BARRIER AND MITIGATION ASSESSMENT REPORT
FEDERAL TRANSIT ADMINISTRATION 42
available in the marketplace soon. Based on research conducted to date, the importance of this potential barrier should not be understated. In particular, although vehicle automation capabilities are growing rapidly, most driver assistance systems have significant limitations, and industry observers estimate that full, Level 5 automation remains a decade away, if not longer. The transit bus industry may be slow to make the investments that would foster greater automation capabilities, especially if there is a perceived lack of a viable business case due to one or more issues listed in the Risks section above. Other contributing factors are identified below.
• Limited market size – In the US, the small size of the transit market and the reliance on politically-driven public funding create disincentives to investment in research and development (R&D). To date, the vast majority of automation R&D has focused on the light-duty and heavy truck markets. Adapting automation features from those markets to transit vehicles will require additional research and testing due to differences in vehicle dynamics (e.g., stopping distance) and operational environments.
• Complex operational requirements – The nature of transit service, with vehicles making frequent service stops, often in congested areas with high volumes of vulnerable road users (i.e., pedestrians, bicyclists, and other non-motorists) and varying road conditions, including extreme weather conditions, could present particular challenges for sensing systems and control algorithms. Harsh weather challenges the performance of the current generation of sensors, many of which are not usable in rain, in snow, or at night. Transit vehicles are expected to run in all of these conditions.
• Certification – Transit vehicles must meet applicable Federal and State safety standards. Safety standards and testing protocols for automated functions have not been developed yet in the light-duty vehicle market, much less for transit vehicles, so this remains an open question. Until safety test procedures are developed, transit agencies may be unable or unwilling to pursue automation, and bus manufacturers may not put automation into their research and product development processes. Certification for transit vehicles may take a conservative approach given the public’s high safety expectations for transit, which would further lengthen the process.
Labor Relations and Human Resources• Opposition from labor – Full automation would be expected to reduce
employment for transit operators and thus may face opposition from transit employees and labor unions, and potentially other stakeholders
14 Novel vehicle types such as the Easymile EZ10, a low-speed, 12-passenger automated shuttle, are the target of significant private sector investment and already are available on the market. However, these early vehicles are subject to speed and operational environment limitations and low passenger capacities, so are not yet suitable for broad adoption by the transit industry.
APPENDIX B: AUTOMATION RISK/BARRIER AND MITIGATION ASSESSMENT REPORT
FEDERAL TRANSIT ADMINISTRATION 43
and the general public. Even some partial automation capabilities may be opposed because they are viewed as a step in the direction of job losses or a “de-skilling” of the vehicle operator role. There are also specific legal protections for transit labor in Section 13(c) of the Federal Transit Act and potentially in State law and/or collective bargaining agreements that would create legal complexities for agencies seeking to achieve labor cost savings through automation. In the face of such challenges, some transit agencies may not view automation as a worthwhile pursuit.
• Training and workforce needs – The lack of a transit workforce with the appropriate skills to manage technologically-complex automated systems also could be a barrier. Transit agencies may not be nimble enough to recruit and retain these highly-skilled workers or may not have the resources to commit to ongoing professional development for such a workforce. Faced with such challenges, agencies may elect not to pursue automation.
Financial ConstraintsAs noted, it is possible that automation functions may not reach the traditional transit bus market. Even where products exist, however, transit agencies may lack the financial resources to purchase automated vehicles (or the required maintenance and support infrastructure) if they command a price premium. Agencies also may simply not view automation as a cost-effective use of funds due to the factors discussed in the Risks section above or simply due to limited return on the investment. Additional financial constraints include the following:
• Procurement – Stipulations in transit agencies’ grant funding agreements or procurement regulations could make it difficult to purchase automated vehicles. More generally, although not necessarily a hard barrier, the tendency for transit agencies’ procurement processes to favor tried-and-true vehicle designs and industrywide standards means that there may be a considerable lag between the availability of new automation functions and their incorporation into RFP specifications. Procurement processes with long time requirements may also make it difficult for agencies to act nimbly in rapidly changing technology markets.
• Buy America – Requirements for minimum U.S. content and assembly under the Buy America Act also could prevent such investments to the extent that automated vehicles do not meet those requirements.
Risk AversionThe transit industry in the U.S. is generally conservative in adopting new technologies, services, and business models. Although limited funding and policy constraints play a large part in this, there is also an unwillingness to take risks with public funding, especially those which have even the slightest risk of a
APPENDIX B: AUTOMATION RISK/BARRIER AND MITIGATION ASSESSMENT REPORT
FEDERAL TRANSIT ADMINISTRATION 44
negative safety impact or adverse impact on ridership. The politicized nature of transit, and transit funding, in some communities contributes here as well.
Pilots and deployments undertaken by a public agency are necessarily public, and are subject to public scrutiny, which may increase the perceived risk of deploying a new technology. Even with relatively conventional technology investments, such as new fare cards or turnstiles, technical glitches and system failures often become high-profile stories in the local news media, creating an environment that may not be conducive to deploying cutting-edge automation capabilities.
AccessibilityTransit automation cannot proceed if the vehicles are not compliant with the Americans with Disabilities Act (ADA) and other Federal and State accessibility laws and regulations that require equivalent service for persons with disabilities. Even where legally-compliant, transit agencies may choose not to pursue automation if the vehicles or new service concept would present accessibility challenges for their riders.
Law, Regulation, Liability, and InsuranceTransit agencies’ insurance policies or internal safety regulations, as well as state laws that have not been updated to account for highly-automated vehicles, could all present barriers to adoption. For example, some state laws require a human driver at all times. For agencies that do not self-insure, insurance policies could become unaffordable or unavailable when adopting automated vehicles if underwriters are not familiar with the impacts of automation, or if there are unresolved concerns about potential cybersecurity vulnerabilities, legal liability in the event of system failure, or similar issues. These issues are somewhat less salient for lower levels of automation (L1 to L2) in which the human operator remains in overall control of the vehicle, especially as these systems have become more familiar to insurers. Even here, however, there have been some concerns with liability and indemnification issues, as noted in recent automation pilot programs.
Institutional Capacity and Planning Transit agency staff may lack awareness of automation capabilities and associated benefits and costs, making it difficult to build an internal business case for investment or to overcome institutional inertia that favors the status quo. Agency management and public oversight bodies may also have near-term priorities that consume planning resources and staff time that might otherwise be used in planning for a transition to automation. Moreover, depending on the form that automation takes, it is possible that achieving significant benefits would require major changes to transit service models, route structures, and/or operational practices. This would require significant investment in long-
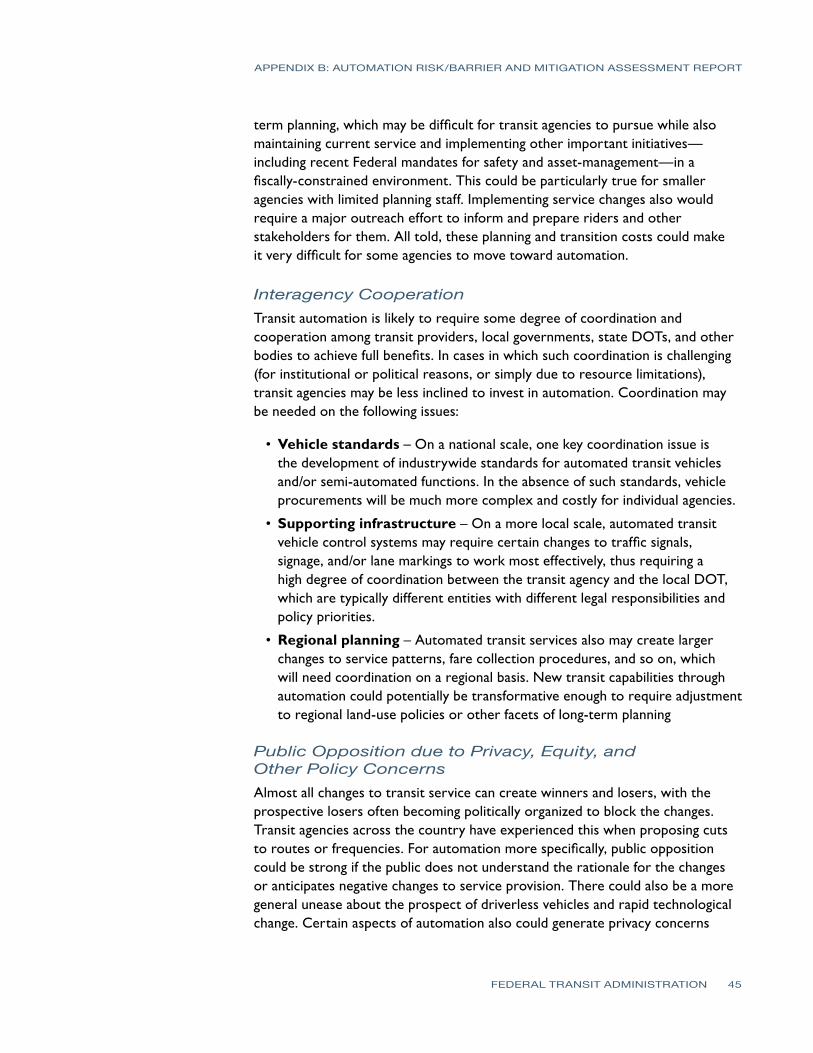
APPENDIX B: AUTOMATION RISK/BARRIER AND MITIGATION ASSESSMENT REPORT
FEDERAL TRANSIT ADMINISTRATION 45
term planning, which may be difficult for transit agencies to pursue while also maintaining current service and implementing other important initiatives—including recent Federal mandates for safety and asset-management—in a fiscally-constrained environment. This could be particularly true for smaller agencies with limited planning staff. Implementing service changes also would require a major outreach effort to inform and prepare riders and other stakeholders for them. All told, these planning and transition costs could make it very difficult for some agencies to move toward automation.
Interagency CooperationTransit automation is likely to require some degree of coordination and cooperation among transit providers, local governments, state DOTs, and other bodies to achieve full benefits. In cases in which such coordination is challenging (for institutional or political reasons, or simply due to resource limitations), transit agencies may be less inclined to invest in automation. Coordination may be needed on the following issues:
• Vehicle standards – On a national scale, one key coordination issue is the development of industrywide standards for automated transit vehicles and/or semi-automated functions. In the absence of such standards, vehicle procurements will be much more complex and costly for individual agencies.
• Supporting infrastructure – On a more local scale, automated transit vehicle control systems may require certain changes to traffic signals, signage, and/or lane markings to work most effectively, thus requiring a high degree of coordination between the transit agency and the local DOT, which are typically different entities with different legal responsibilities and policy priorities.
• Regional planning – Automated transit services also may create larger changes to service patterns, fare collection procedures, and so on, which will need coordination on a regional basis. New transit capabilities through automation could potentially be transformative enough to require adjustment to regional land-use policies or other facets of long-term planning
Public Opposition due to Privacy, Equity, and Other Policy ConcernsAlmost all changes to transit service can create winners and losers, with the prospective losers often becoming politically organized to block the changes. Transit agencies across the country have experienced this when proposing cuts to routes or frequencies. For automation more specifically, public opposition could be strong if the public does not understand the rationale for the changes or anticipates negative changes to service provision. There could also be a more general unease about the prospect of driverless vehicles and rapid technological change. Certain aspects of automation also could generate privacy concerns
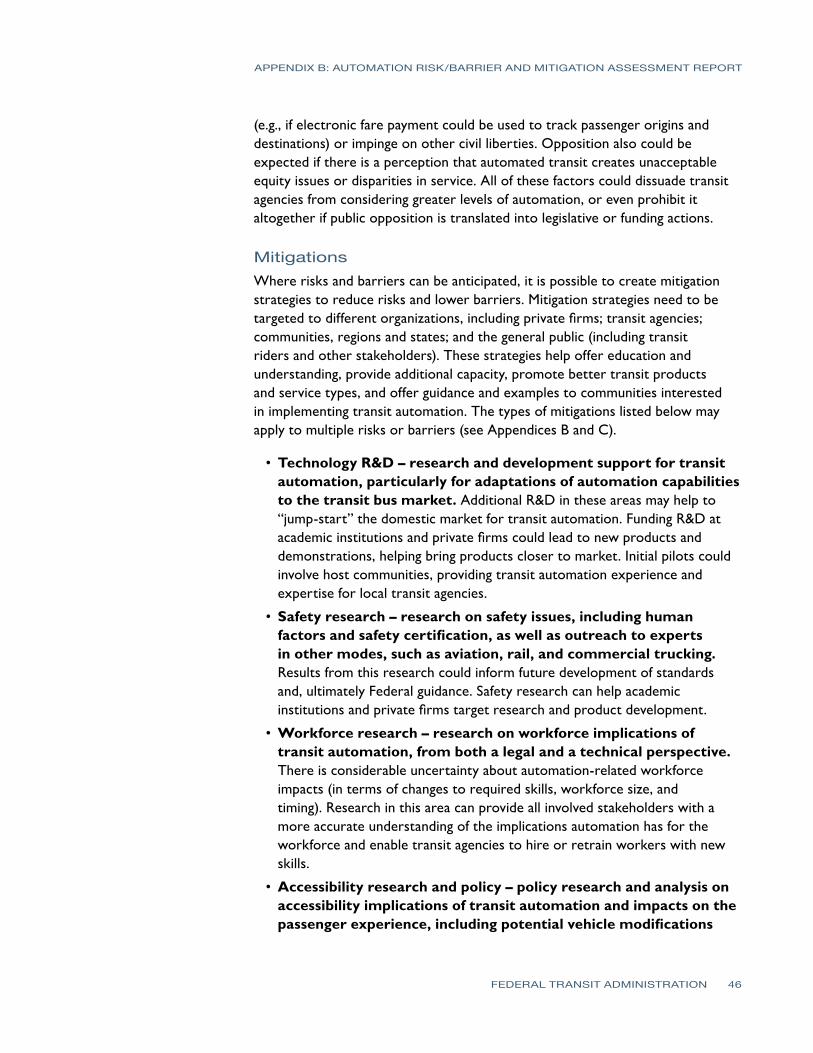
APPENDIX B: AUTOMATION RISK/BARRIER AND MITIGATION ASSESSMENT REPORT
FEDERAL TRANSIT ADMINISTRATION 46
(e.g., if electronic fare payment could be used to track passenger origins and destinations) or impinge on other civil liberties. Opposition also could be expected if there is a perception that automated transit creates unacceptable equity issues or disparities in service. All of these factors could dissuade transit agencies from considering greater levels of automation, or even prohibit it altogether if public opposition is translated into legislative or funding actions.
MitigationsWhere risks and barriers can be anticipated, it is possible to create mitigation strategies to reduce risks and lower barriers. Mitigation strategies need to be targeted to different organizations, including private firms; transit agencies; communities, regions and states; and the general public (including transit riders and other stakeholders). These strategies help offer education and understanding, provide additional capacity, promote better transit products and service types, and offer guidance and examples to communities interested in implementing transit automation. The types of mitigations listed below may apply to multiple risks or barriers (see Appendices B and C).
• Technology R&D – research and development support for transit automation, particularly for adaptations of automation capabilities to the transit bus market. Additional R&D in these areas may help to “jump-start” the domestic market for transit automation. Funding R&D at academic institutions and private firms could lead to new products and demonstrations, helping bring products closer to market. Initial pilots could involve host communities, providing transit automation experience and expertise for local transit agencies.
• Safety research – research on safety issues, including human factors and safety certification, as well as outreach to experts in other modes, such as aviation, rail, and commercial trucking. Results from this research could inform future development of standards and, ultimately Federal guidance. Safety research can help academic institutions and private firms target research and product development.
• Workforce research – research on workforce implications of transit automation, from both a legal and a technical perspective. There is considerable uncertainty about automation-related workforce impacts (in terms of changes to required skills, workforce size, and timing). Research in this area can provide all involved stakeholders with a more accurate understanding of the implications automation has for the workforce and enable transit agencies to hire or retrain workers with new skills.
• Accessibility research and policy – policy research and analysis on accessibility implications of transit automation and impacts on the passenger experience, including potential vehicle modifications
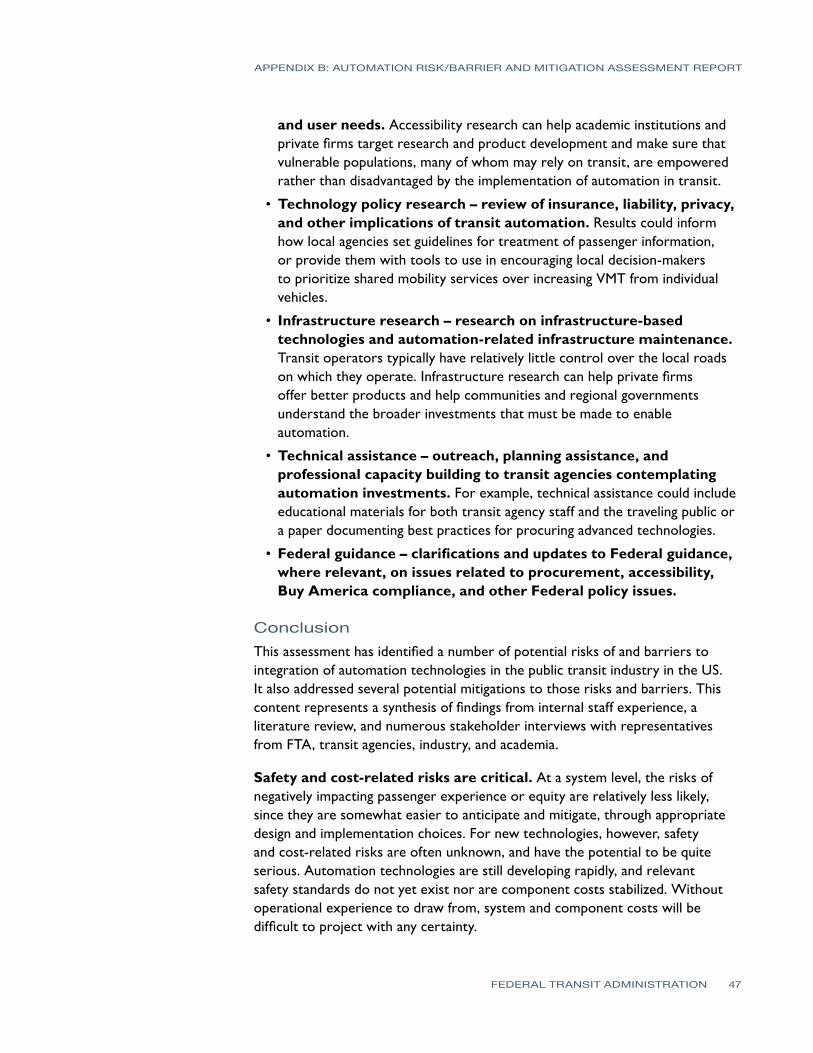
APPENDIX B: AUTOMATION RISK/BARRIER AND MITIGATION ASSESSMENT REPORT
FEDERAL TRANSIT ADMINISTRATION 47
and user needs. Accessibility research can help academic institutions and private firms target research and product development and make sure that vulnerable populations, many of whom may rely on transit, are empowered rather than disadvantaged by the implementation of automation in transit.
• Technology policy research – review of insurance, liability, privacy, and other implications of transit automation. Results could inform how local agencies set guidelines for treatment of passenger information, or provide them with tools to use in encouraging local decision-makers to prioritize shared mobility services over increasing VMT from individual vehicles.
• Infrastructure research – research on infrastructure-based technologies and automation-related infrastructure maintenance. Transit operators typically have relatively little control over the local roads on which they operate. Infrastructure research can help private firms offer better products and help communities and regional governments understand the broader investments that must be made to enable automation.
• Technical assistance – outreach, planning assistance, and professional capacity building to transit agencies contemplating automation investments. For example, technical assistance could include educational materials for both transit agency staff and the traveling public or a paper documenting best practices for procuring advanced technologies.
• Federal guidance – clarifications and updates to Federal guidance, where relevant, on issues related to procurement, accessibility, Buy America compliance, and other Federal policy issues.
ConclusionThis assessment has identified a number of potential risks of and barriers to integration of automation technologies in the public transit industry in the US. It also addressed several potential mitigations to those risks and barriers. This content represents a synthesis of findings from internal staff experience, a literature review, and numerous stakeholder interviews with representatives from FTA, transit agencies, industry, and academia.
Safety and cost-related risks are critical. At a system level, the risks of negatively impacting passenger experience or equity are relatively less likely, since they are somewhat easier to anticipate and mitigate, through appropriate design and implementation choices. For new technologies, however, safety and cost-related risks are often unknown, and have the potential to be quite serious. Automation technologies are still developing rapidly, and relevant safety standards do not yet exist nor are component costs stabilized. Without operational experience to draw from, system and component costs will be difficult to project with any certainty.

APPENDIX B: AUTOMATION RISK/BARRIER AND MITIGATION ASSESSMENT REPORT
FEDERAL TRANSIT ADMINISTRATION 48
The major barriers are likely to be labor, risk-aversion, financial constraints, and market size. Whereas there are a number of potential barriers, these four were repeatedly raised by interviewees as the most likely to occur and the most difficult to overcome.
Federal research and policy leadership is needed to create a solid basis for local decision-making on transit automation. By working closely with early adopters nationwide, FTA can analyze and synthesize their experiences to inform design specifications, system design, and deployments which enable user-friendly mobility.
Some of these risks and barriers are subject to influence by FTA through its funding of R&D, support for field operational tests, support for knowledge sharing across the industry, and issuance of guidance and regulations where appropriate. Others, such as financial constraints, are largely determined by local conditions (e.g., ridership, political support, and density) and national policy (e.g., legislation). In creating an automation research plan, it will be necessary to consider both the scope of the problem and the ability of research to address it.
Table B-1 Overview of Risks and Mitigations
Risks and Outcomes Mitigation Strategies
Category Risk Outcomes
Safety and Security
Software and hardware failures or limitations
• Diminishment of potential safety benefits• “False positives” create operational challenges
X X X X
Human factors
• Overreliance and overestimation of capabilities• Operator skills atrophy• Other road users misjudge or overestimate
capabilities and take greater risks
X X X X X X
Security and cybersecurity considerations
• Potential increase in assaults and criminal activity• Transit vehicles “hacked”
X X X X X
Emergency response
• Emergency response and communications with responders impeded
X X X X
Quiet operations
• Reducing vehicle conspicuity for vulnerable road users
X X X
Tech
nolo
gy R
&D
Safe
ty R
esea
rch
Wor
kfor
ce R
esea
rch
Acc
essi
bilit
y R
esea
rch
and
Polic
y
Tech
nolo
gy P
olic
y R
esea
rch
Infr
astr
uctu
re R
esea
rch
Tech
nica
l Ass
ista
nce
Fede
ral G
uida
nce
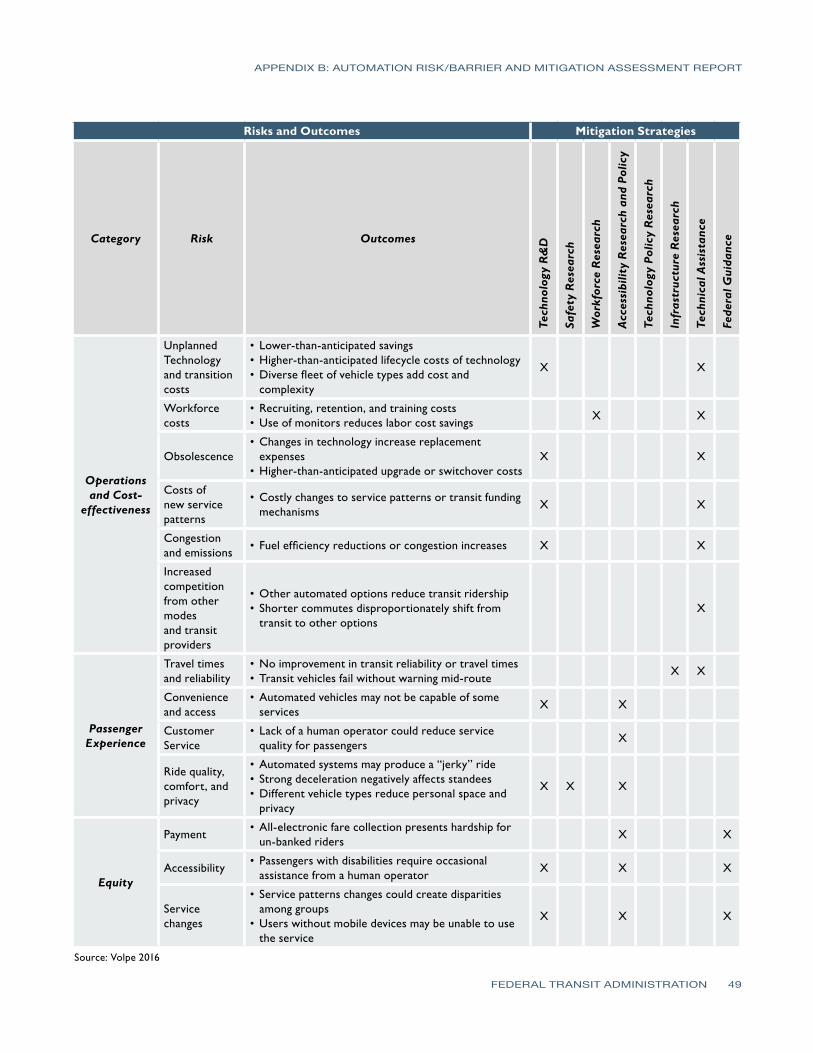
APPENDIX B: AUTOMATION RISK/BARRIER AND MITIGATION ASSESSMENT REPORT
FEDERAL TRANSIT ADMINISTRATION 49
Risks and Outcomes Mitigation Strategies
Category Risk Outcomes
Operations and Cost-
effectiveness
Unplanned Technology and transition costs
• Lower-than-anticipated savings• Higher-than-anticipated lifecycle costs of technology• Diverse fleet of vehicle types add cost and
complexity
X X
Workforce costs
• Recruiting, retention, and training costs• Use of monitors reduces labor cost savings
X X
Obsolescence• Changes in technology increase replacement
expenses• Higher-than-anticipated upgrade or switchover costs
X X
Costs of new service patterns
• Costly changes to service patterns or transit funding mechanisms
X X
Congestion and emissions
• Fuel efficiency reductions or congestion increases X X
Increased competition from other modes and transit providers
• Other automated options reduce transit ridership• Shorter commutes disproportionately shift from
transit to other optionsX
Passenger Experience
Travel times and reliability
• No improvement in transit reliability or travel times• Transit vehicles fail without warning mid-route
X X
Convenience and access
• Automated vehicles may not be capable of some services
X X
Customer Service
• Lack of a human operator could reduce service quality for passengers
X
Ride quality, comfort, and privacy
• Automated systems may produce a “jerky” ride• Strong deceleration negatively affects standees• Different vehicle types reduce personal space and
privacy
X X X
Equity
Payment• All-electronic fare collection presents hardship for
un-banked ridersX X
Accessibility• Passengers with disabilities require occasional
assistance from a human operatorX X X
Service changes
• Service patterns changes could create disparities among groups
• Users without mobile devices may be unable to use the service
X X X
Source: Volpe 2016
Tech
nolo
gy R
&D
Safe
ty R
esea
rch
Wor
kfor
ce R
esea
rch
Acc
essi
bilit
y R
esea
rch
and
Polic
y
Tech
nolo
gy P
olic
y R
esea
rch
Infr
astr
uctu
re R
esea
rch
Tech
nica
l Ass
ista
nce
Fede
ral G
uida
nce
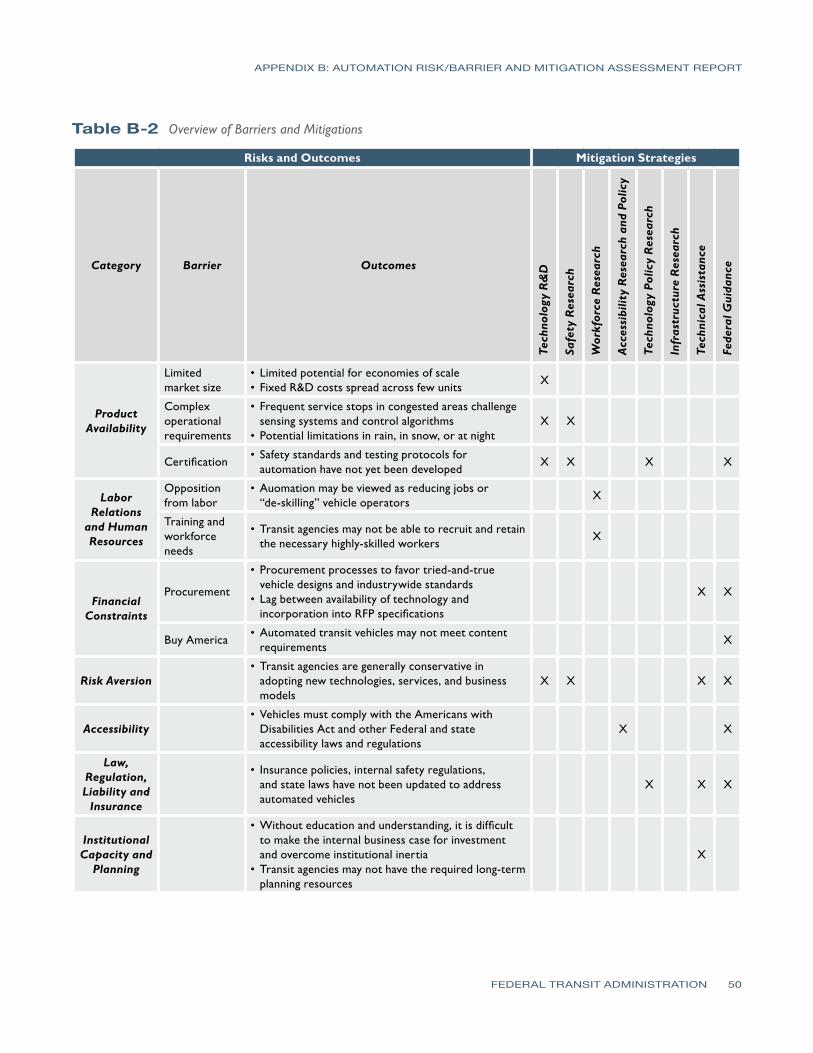
APPENDIX B: AUTOMATION RISK/BARRIER AND MITIGATION ASSESSMENT REPORT
FEDERAL TRANSIT ADMINISTRATION 50
Table B-2 Overview of Barriers and Mitigations
Risks and Outcomes Mitigation Strategies
Category Barrier Outcomes
Product Availability
Limited market size
• Limited potential for economies of scale • Fixed R&D costs spread across few units
X
Complex operational requirements
• Frequent service stops in congested areas challenge sensing systems and control algorithms
• Potential limitations in rain, in snow, or at nightX X
Certification• Safety standards and testing protocols for
automation have not yet been developedX X X X
Labor Relations
and Human Resources
Opposition from labor
• Auomation may be viewed as reducing jobs or “de-skilling” vehicle operators
X
Training and workforce needs
• Transit agencies may not be able to recruit and retain the necessary highly-skilled workers
X
Financial Constraints
Procurement
• Procurement processes to favor tried-and-true vehicle designs and industrywide standards
• Lag between availability of technology and incorporation into RFP specifications
X X
Buy America• Automated transit vehicles may not meet content
requirementsX
Risk Aversion• Transit agencies are generally conservative in
adopting new technologies, services, and business models
X X X X
Accessibility• Vehicles must comply with the Americans with
Disabilities Act and other Federal and state accessibility laws and regulations
X X
Law, Regulation, Liability and
Insurance
• Insurance policies, internal safety regulations, and state laws have not been updated to address automated vehicles
X X X
Institutional Capacity and
Planning
• Without education and understanding, it is difficult to make the internal business case for investment and overcome institutional inertia
• Transit agencies may not have the required long-term planning resources
X
Tech
nolo
gy R
&D
Safe
ty R
esea
rch
Wor
kfor
ce R
esea
rch
Acc
essi
bilit
y R
esea
rch
and
Polic
y
Tech
nolo
gy P
olic
y R
esea
rch
Infr
astr
uctu
re R
esea
rch
Tech
nica
l Ass
ista
nce
Fede
ral G
uida
nce
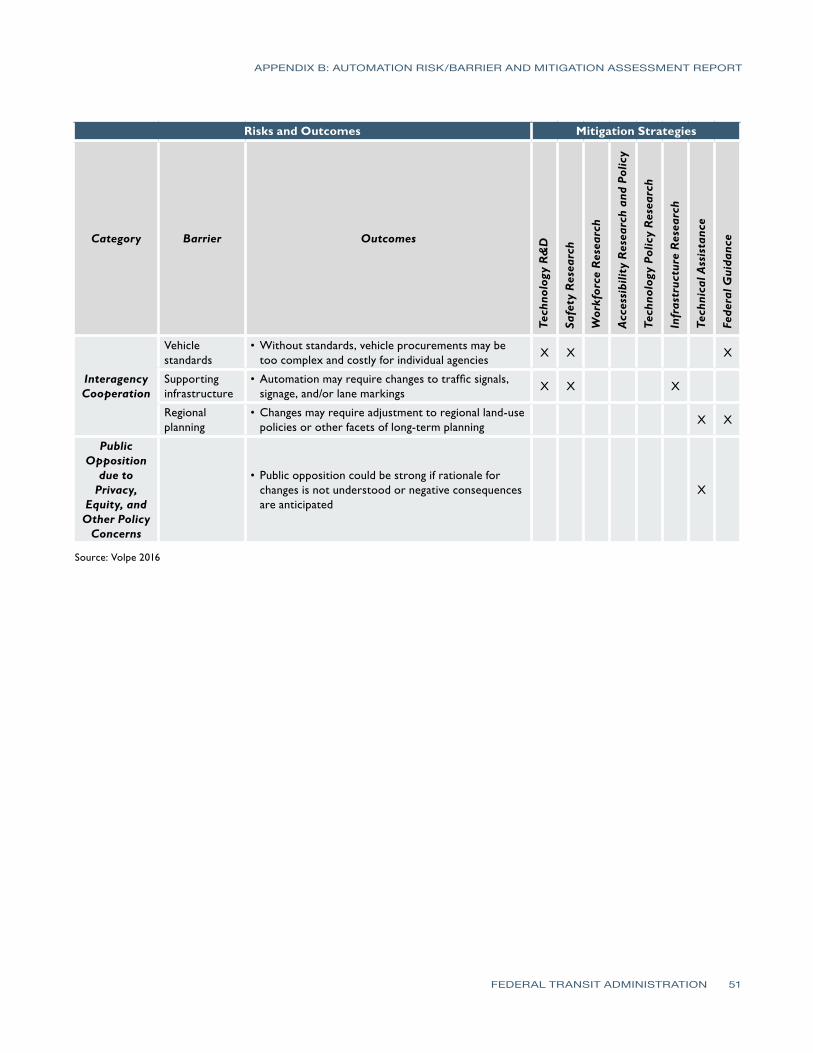
APPENDIX B: AUTOMATION RISK/BARRIER AND MITIGATION ASSESSMENT REPORT
FEDERAL TRANSIT ADMINISTRATION 51
Risks and Outcomes Mitigation Strategies
Category Barrier Outcomes
Interagency Cooperation
Vehicle standards
• Without standards, vehicle procurements may be too complex and costly for individual agencies
X X X
Supporting infrastructure
• Automation may require changes to traffic signals, signage, and/or lane markings
X X X
Regional planning
• Changes may require adjustment to regional land-use policies or other facets of long-term planning
X X
Public Opposition
due to Privacy,
Equity, and Other Policy
Concerns
• Public opposition could be strong if rationale for changes is not understood or negative consequences are anticipated
X
Source: Volpe 2016Te
chno
logy
R&
D
Safe
ty R
esea
rch
Wor
kfor
ce R
esea
rch
Acc
essi
bilit
y R
esea
rch
and
Polic
y
Tech
nolo
gy P
olic
y R
esea
rch
Infr
astr
uctu
re R
esea
rch
Tech
nica
l Ass
ista
nce
Fede
ral G
uida
nce
APPENDIX
FEDERAL TRANSIT ADMINISTRATION 52
C Analysis of Non-Driving Operator ResponsibilitiesSummaryTo identify opportunities for and challenges to automation, it is helpful to understand the individual steps taken in operating a transit bus. This appendix provides details of the individual, operational steps of transit bus operations from vehicle pull-out to vehicle pull-in. It is original research based on the research team’s expertise, with some peer review by a few transit stakeholders. This assessment was an analytical tool and is not necessarily representative of all transit operations, which may vary between agencies.
Appendix C covers non-driving responsibilities in the following areas:
• Preparing for revenue service
• During revenue service
• After concluding revenue service
• Special situations
Preparing for Revenue Service
Operator Reports to Yard LocationPrior to beginning service, the operator arrives at the report location. Report types and locations can vary, such as direct reports to a vehicle in the field or pull-out reports to dispatch offices, storage facilities, transit centers, etc.
Once the operator reports, the operator receives a work assignment (ex.: run #78041 – route 78, schedule block 4, weekday service) and a vehicle assignment (ex.: bus #6430), in addition to any other pertinent information for the day’s work, such as detours or special event information.
This example uses a pull-out report to a dispatch/yard facility.
Operator Arrives at Report LocationSome facilities have specialized yard staff to complete certain tasks.
1. Operator locates vehicle (not always easy or quick, especially in a large bus yard).
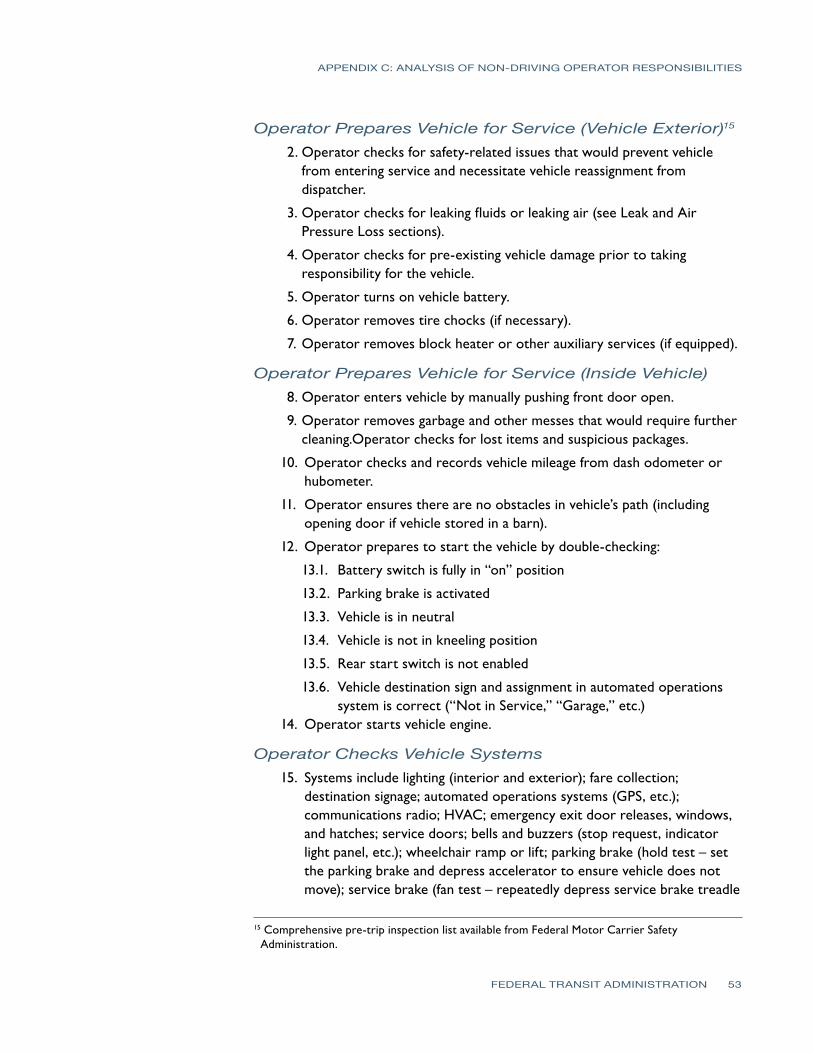
APPENDIX C: ANALYSIS OF NON-DRIVING OPERATOR RESPONSIBILITIES
FEDERAL TRANSIT ADMINISTRATION 53
Operator Prepares Vehicle for Service (Vehicle Exterior)15
2. Operator checks for safety-related issues that would prevent vehicle from entering service and necessitate vehicle reassignment from dispatcher.
3. Operator checks for leaking fluids or leaking air (see Leak and Air Pressure Loss sections).
4. Operator checks for pre-existing vehicle damage prior to taking responsibility for the vehicle.
5. Operator turns on vehicle battery.
6. Operator removes tire chocks (if necessary).
7. Operator removes block heater or other auxiliary services (if equipped).
Operator Prepares Vehicle for Service (Inside Vehicle)8. Operator enters vehicle by manually pushing front door open.
9. Operator removes garbage and other messes that would require further cleaning.Operator checks for lost items and suspicious packages.
10. Operator checks and records vehicle mileage from dash odometer or hubometer.
11. Operator ensures there are no obstacles in vehicle’s path (including opening door if vehicle stored in a barn).
12. Operator prepares to start the vehicle by double-checking:
13.1. Battery switch is fully in “on” position
13.2. Parking brake is activated
13.3. Vehicle is in neutral
13.4. Vehicle is not in kneeling position
13.5. Rear start switch is not enabled
13.6. Vehicle destination sign and assignment in automated operations system is correct (“Not in Service,” “Garage,” etc.)
14. Operator starts vehicle engine.
Operator Checks Vehicle Systems15. Systems include lighting (interior and exterior); fare collection;
destination signage; automated operations systems (GPS, etc.); communications radio; HVAC; emergency exit door releases, windows, and hatches; service doors; bells and buzzers (stop request, indicator light panel, etc.); wheelchair ramp or lift; parking brake (hold test – set the parking brake and depress accelerator to ensure vehicle does not move); service brake (fan test – repeatedly depress service brake treadle
15 Comprehensive pre-trip inspection list available from Federal Motor Carrier Safety Administration.
APPENDIX C: ANALYSIS OF NON-DRIVING OPERATOR RESPONSIBILITIES
FEDERAL TRANSIT ADMINISTRATION 54
to ensure low-air alarm and parking brake activate after air pressure loss)
16. Operator adjusts seat, mirrors, fans, etc. for comfort and safety.
17. Operator enables air pressure to front service door.
18. Operator fastens safety belt.
Operator Pulls Vehicle from YardThe vehicle pull-out can vary depending on lot configuration (pull-through lot, backing lot, pull-through barn, backing barn, etc.). This example uses a backing barn.
19. Operator verifies that door to garage is open and at proper clearance and that no obstacles are in way of bus.
20. Operator depresses service brake treadle.
21. Operator deactivates parking brake.
22. Operator shifts vehicle from Neutral to Drive.
23. Operator slowly eases pressure on brake treadle to disengage the transmission interlock (if equipped), then fully releases brake treadle.
24. Operator depresses accelerator to move vehicle forward.
25. Operator navigates through yard to exit (varies based on yard configuration).
26. Operator drives vehicle on public streets to location in which revenue service begins (see Starting Movement, Turning the Vehicle, and Slowing and Stopping).
During Revenue ServiceThese actions apply to vehicles and operators in revenue service.
Preparing for Revenue Service1. Operator ensures vehicle is in correct location and at correct time.
2. Operator signs bus in-service by entering route code into sign panel.
3. Operator sets automated vehicle locator to correct route variation (e.g., route 1, morning, inbound); this action can vary based on automated operation systems that are currently in place at larger agencies.
4. Operator begins revenue service.
Operating the Vehicle on StreetsThis section describes moving, slowing and stopping, and turning the vehicle.
APPENDIX C: ANALYSIS OF NON-DRIVING OPERATOR RESPONSIBILITIES
FEDERAL TRANSIT ADMINISTRATION 55
Starting Movement5. Operator ensures vehicle is ready for movement:
5.1. Operator checks passengers inside vehicle using interior mirrors to ensure passengers and items are properly secured before vehicle begins to move.
5.2. Operator checks surroundings of vehicle using mirrors and windows to ensure nothing is in path of vehicle, along sides of vehicle, or near wheel wells of vehicle.
5.3. Operator ensures parking brake is disengaged.
5.4. Operator ensures bus is not in a kneeling position.
5.5. Operator ensures doors are closed.
6. Operator regularly scans across windshields, windows, and mirrors of vehicle to check interior and exterior of vehicle.
7. Operator has both hands on steering wheel and is ready to control vehicle.
8. Operator eases off brake treadle until interlock (transmission or brake) disengages.
9. Operator completely disengages brake treadle when ready to begin movement.
10. Operator moves foot from brake treadle to accelerator.
11. Operator smoothly depresses accelerator to begin movement.
Slowing and Stopping12. Operator ensures vehicle is ready for slowing and stopping:
12.1. Operator firmly grips steering wheel to prepare for any unexpected movement resulting from braking.
12.2. Operator checks passengers inside vehicle using interior mirrors to ensure passengers and items are properly secured before vehicle begins to slow or stop.
12.3. Operator checks surroundings of vehicle using mirrors and windows to ensure nothing is in path of vehicle, along sides of vehicle, or near wheel wells of vehicle.
12.4. Operator considers alternate paths for vehicle to slow and stop if primary path becomes obstructed or distance is too short to bring vehicle safely to a stop.
13. Operator scans across windows and mirrors of vehicle to check interior and exterior of vehicle.
14. Operator continues to keep both hands on brake treadle.
15. Operator determines if hazard lights are needed for slowing or stopping:
APPENDIX C: ANALYSIS OF NON-DRIVING OPERATOR RESPONSIBILITIES
FEDERAL TRANSIT ADMINISTRATION 56
15.1. Operator considers minimum speed limits for roadway.
15.2. Operator considers if slowing or stopping motion is in preparation for a passenger stop.
15.3. Operator considers other circumstances, such as vehicle malfunction or other emergency that would require use of hazard lights.
16. Operator begins slowing or stopping motion:
16.1. Operator lifts foot off accelerator and moves it to brake treadle (a passive retarder or regenerative brake will engage at this time; slowly reducing pressure on accelerator may be necessary depending on vehicle type and powertrain type).
16.2. Operator places foot on brake treadle without applying pressure.
16.3. Operator applies light pressure to brake treadle to engage transmission interlock (if equipped).
16.4. Operator applies harder and steadier pressure to brake treadle to engage brake.
17. Vehicle slows and eventually stops.
Turning the Vehicle18. Operator ensures vehicle is ready for turning motion:
18.1. Operator checks for signage to ensure that turns are legal for transit vehicles.
18.2. Operator checks passengers inside vehicle using interior mirrors to ensure passengers and items are properly secured before vehicle begins to turn.
18.3. Operator checks surroundings of vehicle using mirrors and windows to ensure nothing is in path of vehicle, along sides of vehicle, or near wheel wells of vehicle.
18.4. Operator assesses number of turning lanes:
18.4.1. At intersections where there are two turning lanes, operator must consider additional turning clearance required vs. road space available, as well as other traffic turning in adjacent turn lanes.
18.4.2. Operator considers action of vehicle directly after turning and how lane positioning affects that action (e.g., if a passenger stop is on curb after turning, transit vehicle must be in curb lane).
18.5. Operator assesses intersection to ensure that vehicle is able to turn, looking for and considering physical road infrastructure; curb clearance; street fixtures or other fixed items on curb such as sign
APPENDIX C: ANALYSIS OF NON-DRIVING OPERATOR RESPONSIBILITIES
FEDERAL TRANSIT ADMINISTRATION 57
post brackets, specifically where front of vehicle might overhang curb over course of turn; overhead clearance; side clearance; obstructions in intersection, such as illegally parked cars, cars ahead of stop line, debris, construction equipment, etc.; street fixtures such as light posts, fire hydrants, newspaper boxes, etc.; other vehicles, pedestrians, cyclists, etc.
19. Operator regularly scans across windshields, windows, and mirrors of vehicle to check interior and exterior of vehicle.
20. Operator firmly grips steering wheel in preparation for turning vehicle.
21. Operator slows vehicle as it approaches turn (see Slowing and Stopping).
22. Operator continues to scan in all directions, but primarily looks in direction of turn for pedestrians, vehicles, or cyclists that might enter turning area of vehicle.
23. Operator activates turn signal:
23.1. Operator depresses proper signal with left foot (most transit vehicles have foot pedals because steering requires two hands).
23.2. Operator continues to rest foot on turn signal pedal for duration of turn; turn signals do not automatically deactivate.
24. Operator turns vehicle:
24.1. Operator continues to slow vehicle.
24.2. Operator directs vehicle straight into intersection until rear wheel on turning side approaches start of turn in curb (or other indicator for left-hand turn).
24.3. Operator smoothly steers the wheel in direction of curb using a hand-over-hand motion (approximately 720 degrees, depending on tightness of turn and type of vehicle).
24.4. Approximately ¾ through turn, operator begins to accelerate vehicle again (see Starting Movement).
24.5. Operator begins to smoothly counter-steer vehicle, straightening vehicle into destination lane of traffic.
25. Operator deactivates turn signal by lifting foot off turn signal pedal.
26. Operator surveys roadway ahead, sweeping across path of vehicle and checking mirrors.
27. Operator centers vehicle in lane by looking in side view mirrors and adjusting vehicle positioning.
Fare PaymentFare payment systems and policies can vary greatly by agency.
APPENDIX C: ANALYSIS OF NON-DRIVING OPERATOR RESPONSIBILITIES
FEDERAL TRANSIT ADMINISTRATION 58
Special Considerations
• Fare media type (cash, ticket, smart card, phone, etc.)
• Payment on-vehicle or off-vehicle
• Time per passenger required to process and collect payment
• Dispute resolution (operator/passenger, passenger/passenger, technology/passenger, etc.)
• Fare types (full fare, senior, student, monthly pass, 10-ride pass, etc.)
• Collection of fares and fare data (over-air, download at garage by “probing,” etc.)
• Cash management (“cash drop” at garage, transporting cash to counting rooms, etc.)
• Enforcement of fare policy:
– Police action (operator notifies police, who meet vehicle along line)
– Operator action (operator continues to ask for fare or asks passenger to leave)
– Validation and verification (riders asked periodically to verify they have paid fare, typically by showing pass or receipt when asked by specialized staff)
– Camera enforcement (images of fare evaders posted and distributed to transit agency police and other staff)
– Other enforcement actions
• Technology malfunction and related policy (return vehicle to garage but lose revenue service, continue revenue service without collecting revenue, etc.)
Communicating via RadioOperators must be in communication with dispatchers via radio or other means. Some agencies have open radios, meaning operators can communicate openly to the entire radio channel when necessary. Other agencies have closed radios, meaning an operator has to request the ability to communicate from a dispatcher.
Many agencies use computer-aided dispatch systems (CAD). These systems help dispatchers track and control radio communications, which can open and assign tickets to specific dispatchers based on the originating vehicle, and connect on-vehicle radio systems to field supervisors, other dispatchers, or even law enforcement when necessary.
Radios are also used to communicate to multiple operators at one time, such as in the case of detour, emergency, or other system- or route-wide announcements. Digital radios provide more communications functionality
APPENDIX C: ANALYSIS OF NON-DRIVING OPERATOR RESPONSIBILITIES
FEDERAL TRANSIT ADMINISTRATION 59
outside of voice, sometimes providing the communications link between automated vehicle locator systems, automated operations software, or other technology.
Unlike a cellular phone, operators can communicate via radio while operating the vehicle, but agency policies can vary on radio communications.
Interacting with PassengersIn addition to safely operating the transit vehicle, operators serve as the face of the agency. Operators answer not only questions about the specific route or system, but also about local landmarks and destinations.
Example Questions
• Does this bus go to the transit center?
• What route is this bus?
• How do I get to (location)?
• How do I operate the fare machine?
• Where is the nearest hospital? (see Medical Incidents )
Furthermore, operators must deescalate situations in which a passenger is agitated and potentially dangerous. Altercations can occur not only between the operator and the passenger, but also between passengers, individually (a passenger acts erratically or suspiciously on his own), or between the passenger and an unrelated bystander. Operators must know how to contact authorities, sometimes indiscreetly, and deescalate the situation until help can arrive. This is a critical safety and security responsibility of the operator.
Passenger StopsThis section describes the various types of passengers stops made by transit vehicles. All passenger stop types within this section will require the operator to perform the actions detailed in the Slowing and Stopping section when approaching the stop, and the Starting Movement section when leaving the stop. The passenger stop type sections below will focus on how each requires a different set of actions outside of those detailed in the Slowing and Stopping or Starting Movement sections.
In addition to those actions, the operator also completes the following when approaching any passenger stop:
28. Operator determines whether a stop is required:
28.1. Operator checks time to ensure vehicle is not ahead of schedule (transit can operate behind schedule but never ahead of schedule).
APPENDIX C: ANALYSIS OF NON-DRIVING OPERATOR RESPONSIBILITIES
FEDERAL TRANSIT ADMINISTRATION 60
28.2. Operator may receive direction from dispatcher or supervisor to wait at stop for transfer, supervisor, or different reason.
28.3. Operator checks for stop request or passenger assistance light on indicator panel or listens for bell.
28.4. Operator looks for passengers waiting at stop, who may be waiting inside a bus shelter, nearby building, car in nearby parking space; running to catch bus from ahead of vehicle, behind vehicle, or across street (from either in front of vehicle or from behind vehicle); inattentive or standing facing away from vehicle; standing at the bus stop but not waiting for bus; waiting for different bus that also serves that stop; or wearing dark clothing or is otherwise difficult to see.
28.5. Operator checks for safety and security concerns at stop, such as taller people standing directly on curb in which their heads could be hit by mirror of approaching bus, people sitting on curb as bus approaches, people with weapons that could threaten operator or passenger safety if stop is made; or debris or other trip hazards at stop.
29. If a stop is required and safe, operator completes actions in Slowing and Stopping when approaching stop, using turn signal to indicate that vehicle is moving into a stop (or closer to a curb) and using hazard lights to indicate that vehicle is stopped and loading or unloading.
30. Operator considers space available at stop when positioning vehicle so a passenger in a mobility device can maneuver around street fixtures to access vehicle’s ramp or lift and so no door on vehicle opens to an obstructed location such as a utility box or sign post.
31. Operator opens doors. Mechanisms may vary, and agency policies can affect this action. Fare collection can also affect this action depending on where, when, and how passengers pay fare.
32. Operator announces stop, route, and direction (or automated system makes announcements).
33. Passengers board vehicle:
33.1. Operator kneels or leans vehicle; this action is required when using ramp. Agency policies can affect this action.
33.1.1. Vehicle lowers or leans several inches to ease boarding.
33.2. Operator collects fare (see Fare Payment) and answers passenger questions.
33.3. Operator assists passengers who require assistance (see Passengers with Mobility Devices).
APPENDIX C: ANALYSIS OF NON-DRIVING OPERATOR RESPONSIBILITIES
FEDERAL TRANSIT ADMINISTRATION 61
33.4. Operator stops passengers from boarding when vehicle is full (by law, no passengers are allowed in front of standee line).
33.5. Operator denies boarding to passengers with items that violate agency policy or are unsafe, such as hazardous materials, non-service animals, or weapons.
34. Operator closes doors (mechanisms can vary).
35. Operator un-kneels or un-leans the bus (or interlock will not allow it to move; some vehicles un-kneel automatically when front door is closed).
36. Operator leaves stop:
36.1. Operator deactivates hazard lights.
36.2. Operator activates signal with foot pedal to indicate intent to enter traffic.
36.3. Operator looks in direction vehicle is moving (generally left) to ensure safe entry into traffic; note that this typically will be in opposite direction of where passenger stop was made.
36.3.1. Operator must also pay attention to passengers who might have approached vehicle while it was waiting to re-enter traffic to ensure they are not endangered when vehicle pulls away.
36.4. Operator pulls into traffic and lifts foot off turn signal pedal (see Starting Movement section).
Bulb-out
At a bulb-out stop, the curb extends into the roadway (often through a parallel parking area) so that buses do not have to pull out of the traffic lane to pick up or drop off passengers.
Special Considerations
• Vehicles stopped at bulb-out stops are more susceptible to rear-end collisions because they are still in an active traffic lane.
• Operator must align the vehicle properly when approaching the stop to ensure an appropriate distance to the curb.
• Operator must stop the vehicle at the correct location to ensure both doors open onto a curb and to provide more efficient boarding. These stops are sometimes more efficient because they do not require the vehicle to wait before entering traffic again
Curb-cut
At a curb-cut stop, the curb is cut away so the bus can pull into a dedicated area for loading and unloading without obstructing a traffic lane.
APPENDIX C: ANALYSIS OF NON-DRIVING OPERATOR RESPONSIBILITIES
FEDERAL TRANSIT ADMINISTRATION 62
Special Considerations
• As the vehicle pulls into the curb cut, the operator must consider the correct angle that ensures:
– Rear tire does not hit curb as vehicle pulls in
– Front tire does not hit curb inside curb-cut as vehicle pulls in
– Vehicle will stop with appropriate distance to curb, which is more difficult for this type of stop
• The operator must also check the curb clearance, because this type of stop requires that the front of the bus hangs over the curb as the vehicle pulls into the stop.
– Potholes along curb-cut can increase clearance height of curb, even if curb is unaltered.
– Hitting frame of bus on a curb is very loud and can seriously damage components of the vehicle, such as the ramp motor (if equipped) or other components.
• Illegal standing or parking can occur in curb-cuts.
Dedicated Curbside
A dedicated curbside stop is a stop along an unmodified curb that is dedicated for only bus loading and unloading.
Special Considerations
• Typically, there is parallel parking around dedicated curbside stops, so operators who miscalculate pulling in or out of a stop might hit or scrape a parked car.
• The emerging best practice for location of these stops is on the far side of an intersection, which helps prevent a common type of collision that occurs when a vehicle turns right in front of a bus as it is pulling away from a near-side dedicated curbside stop (these near-side stops still exist, so operators must take the stop’s specific configurations into consideration).
• Illegal standing or parking can occur at these stops.
Roadside with Parking
This type of stop is along a road, but without a dedicated area for the bus to load and unload. Passengers potentially walk between parked cars to access the bus.
Special Considerations
• Vehicles that are in an active traffic lane are more susceptible to rear-end collisions.
APPENDIX C: ANALYSIS OF NON-DRIVING OPERATOR RESPONSIBILITIES
FEDERAL TRANSIT ADMINISTRATION 63
• Passengers will have to board the vehicle between parked cars; vehicle should be positioned in a location that allows for access to the sidewalk (for example, not alongside a semi-truck trailer).
• The vehicle should be kneeling or leaning down to accommodate for the significantly higher step.
• These stops may not be accessible for passengers in mobility devices.
Roadside without Parking
This type of stop is along a road but without a curb. It is more common in rural systems.
Special Considerations
• Vehicles that are in an active traffic lane are more susceptible to rear-end collisions.
• These stops might be along a roadway with a higher speed limit, increasing the risk to the vehicle and passengers.
• Vehicle should be kneeling or leaning down, to accommodate for the significantly higher step.
• Loading or unloading on a soft shoulder can further increase the distance a passenger has to step up or down onto the vehicle.
• These stops may not be accessible for passengers in mobility devices.
Flagged Service
A flag stop requires passengers to wave to the bus operator to indicate they need to be picked up. Sometimes these stops are at pre-determined locations, but other times they are system-wide, only on a specific route, or only along a specific roadway. Some systems operate flag service at specific times of day (such as after dark, so fewer customers must walk at night).
Special Considerations
• Flag stop locations vary based on agency policy.
• Passengers can be difficult to see when flagging the bus.
• Stop types can vary greatly, because locations can vary greatly.
• When stopping, operators must determine:
– Safe location of the stop.
– How to communicate a slightly different location to the passenger flagging the bus.
APPENDIX C: ANALYSIS OF NON-DRIVING OPERATOR RESPONSIBILITIES
FEDERAL TRANSIT ADMINISTRATION 64
Passengers with Mobility DevicesThis section describes loading and securing passengers with mobility devices. The actions described here occur after the vehicle has already made a stop, as detailed in the Passenger Stops section. The operator completes the following actions prior to loading or unloading a passenger with a mobility device, regardless of vehicle equipment:
37. Operator ensures stopping location is appropriate for loading or unloading mobility devices, including consideration of space available in unloading area and accessible exits from loading area (curb cuts, sidewalk condition, etc.).
38. Operator secures vehicle once it is stopped:
38.1. Operator activates parking brake by pulling valve.
38.2. Operator activates vehicle interlock by kneeling bus or opening rear door.
38.3. Operator shifts vehicle into Neutral.
39. Operator prepares vehicle for assistive device use (ramp, lift, etc.).
39.1. Operator kneels or leans vehicle (if equipped; depends on assistive device).
39.2. Operator turns on power to assistive device or assistive device automatically powers on.
39.3. Operator arranges seats and asks passengers to move to make space for boarding mobility device and passenger. Passengers generally cannot be forced to leave vehicle to make space for mobility device and passenger. Passengers must vacate designated seats to make space, but on a full vehicle this might not be possible.
39.3.1. Operator physically flips seats up to make space for mobility device and passenger (mechanism varies by vehicle).
40. Operator operates assistive device to load mobility device and passenger.
Loading with a Ramp
Low-floor vehicles typically are front-door equipped with a ramp, which flips out from the floor via a motor underneath the boarding area, providing a low-assistance, barrier-free entry for passengers with a mobility device.
Special Considerations
• Ramps provide the easiest and least conspicuous boarding process for passengers with mobility devices, and are also easy for operators to use.
APPENDIX C: ANALYSIS OF NON-DRIVING OPERATOR RESPONSIBILITIES
FEDERAL TRANSIT ADMINISTRATION 65
• Ramp components are very susceptible to failure due to freezing, corrosion, or curb strikes that physically damage the under-floor components.
• Dirt and debris from the floor can clog the area between the ramp and its stowage area, preventing the ramp from stowing properly and further damaging some components.
• Loading or unloading a passenger with a mobility device using the ramp requires ample space on the curb for the passenger to maneuver the mobility device onto or off of the ramp.
• Operators must ensure there are no pedestrians or other obstructions to the curb area when deploying the ramp, including pedestrians or cyclists who may be approaching; the ramp protrudes approximately 3–4 feet from the side of the vehicle and is a pedestrian trip hazard.
• Ramps are difficult for mechanics to service because the components can only be accessed from underneath the vehicle and are very heavy.
Manual Operation
• This operation is relatively easy for operators with varying physical ability.
• Newer ramps require a special tool, a metal hook, to reset the solenoid prior to manual operation:
– Dip metal hook into a loop in floor.
– Pull up on loop to reset solenoid and unlock ramp.
– Re-attempt automatic operation. Manual operation may still be required.
– Physically lift ramp and push it through door threshold, allowing it to fall to curb. Ramp must be physically lifted again for manual stowing.
Loading with a Folding Lift
A folding lift is a platform lift that is stowed vertically, often behind a large door in the side or rear of a vehicle. The lift flips down from a vertical position to horizontal, which becomes the platform on which a passenger with mobility device is loaded. The platform is then raised and lowered to allow for loading a passenger with a mobility device. Folding lifts typically are found on standard- or high-floor vehicles for which ramps are impossible due to the vehicle’s floor height. The lifts usually are operated with a physically-attached remote control to allow the operator to stand out of the way of the lift when it is being deployed or stowed.
Special Considerations
• Passengers with mobility devices must be secured to the lift with a seatbelt-like attachment. As the lift rises several feet into the air, the platform can
APPENDIX C: ANALYSIS OF NON-DRIVING OPERATOR RESPONSIBILITIES
FEDERAL TRANSIT ADMINISTRATION 66
become a fall hazard. The securement is typically interlock-enabled, which will not allow unsecured operation.
• Deploying the lift (flipping from vertical to horizontal) and lowering it can be a crush hazard to the operator or pedestrians, specifically to the operator’s feet as the lift descends to the boarding level.
• Loading or unloading a passenger with a mobility device using the lift requires ample space on the curb for the passenger to maneuver the mobility device onto or off of the lift.
• Operators must ensure there are no pedestrians or other obstructions to the curb area when deploying the lift, including pedestrians or cyclists who may be approaching. The lift protrudes approximately 3-4 feet from the side of the vehicle and is a pedestrian trip hazard.
• Folding lifts typically take up the space required for 4–6 seats, reducing capacity of the transit vehicle.
• Folding lifts operate using hydraulic fluid, which can leak into the passenger compartment of the vehicle, causing a chemical hazard and causing components to fail.
Manual Operation
• Operators must manually pump mechanism to raise lift. This is challenging, even for physically fit individuals.
• Operators must manually release mechanism to lower lift by twisting a valve, sometimes resulting in a hard crash onto the ground. This is not recommended with a passenger with mobility device on the lift but is sometimes necessary if the passenger with mobility device is stuck on board with a non-functioning lift.
Loading Passengers with a Step Lift
Step lifts are platform lifts that fold out from the front steps of a standard- or high-floor transit vehicle. Some steps flip down, opening an area from which the lift slides out from the stepwell. The platform is then raised and lowered to load a passenger with mobility device. Unlike a cassette lift (see Loading with a Cassette Lift), the operator can operate a step lift without leaving the seat.
Special Considerations
• Step lift components are susceptible to freezing, corrosion, and dirt buildup because of their location in a high-traffic area and partially exposed components in the stepwell.
• Loading or unloading a passenger with a mobility device using the lift requires ample space on the curb for the passenger to maneuver the mobility device onto or off the lift.
APPENDIX C: ANALYSIS OF NON-DRIVING OPERATOR RESPONSIBILITIES
FEDERAL TRANSIT ADMINISTRATION 67
• Operators must ensure there are no pedestrians or other obstructions to the curb area when deploying the lift, including pedestrians or cyclists who may be approaching. The lift protrudes approximately 3-4 feet from the side of the vehicle and is a pedestrian trip hazard. Either front or rear doors can be equipped with a step lift.
Manual Operation
Manual operation is not possible in the field; this requires service staff or mechanic assistance.
Loading with an Under-vehicle Lift
An under-vehicle lift, sometimes called a cassette lift, slides out from underneath a vehicle via a wired remote control. Side rails for the lift platform are manually unfolded by the operator, who uses the remote again to complete the loading or unloading action. Standard- and high-floor vehicles could be equipped with an under-vehicle lift, which is normally found on a rear door.
Special Considerations
• Under-vehicle lifts are susceptible to freezing, corrosion, and dirt buildup because of their location underneath the floor of the vehicle.
• Passengers with mobility devices must be secured to the lift with a seatbelt-like attachment, as the lift rises several feet into the air and the platform can become a fall hazard. The securement is typically interlock-enabled, which will not allow unsecured operation.
• Loading or unloading a passenger with a mobility device using the lift requires ample space on the curb for the passenger to maneuver the mobility device onto or off of the lift.
• Operators must ensure there are no pedestrians or other obstructions to the curb area when deploying the lift, including pedestrians or cyclists who may be approaching. The lift protrudes approximately 3–4 feet from the side of the vehicle and is a pedestrian trip hazard.
• Side guards and securements for the lift manually stow on top of the floor of the lift platform. They must be manually removed and installed on the sides of the lift platform by the operator prior to lift operation, then removed and re-stowed after operation prior to stowing the lift platform again.
Securing Passengers with Mobility Devices
Mobility device securements vary from fleet to fleet and sometimes from vehicle to vehicle. Agency policy also varies on securement of mobility devices, with some agencies requiring securement of the physical mobility device in addition to a seatbelt that secures the passenger to the mobility device.
APPENDIX C: ANALYSIS OF NON-DRIVING OPERATOR RESPONSIBILITIES
FEDERAL TRANSIT ADMINISTRATION 68
Special Considerations
• Securements generally are stored within the vehicle and attach to the floors and walls of a transit vehicle.
• Securements are susceptible to loss or misplacement and often become dirty from storage.
• Floor receptacles for attaching securements can become clogged with dirt, making attachment difficult or impossible.
• Passengers with a mobility device might refuse mobility device securement or seatbelt securement, which may or may not be allowed by the agency.
• Passenger and mobility device securement policy can vary by agency.
Securing Vehicle for Breaks in ServiceOccasionally, operators take breaks outside the vehicle or must otherwise leave the vehicle unattended in a public area. Securing the vehicle in these situations can vary slightly, from securing the vehicle in a controlled environment, such as a bus yard or parking area that is secured and maintained by the agency.
Special Considerations
• Security and legality of the parking area—some agencies designate specific bus parking on public streets or schedule parking for operators based on when and where breaks occur.
• Ability of the operator to secure service door while still being able to re-enter the vehicle (e.g., keeping the door pressurized but the operator’s window unlatched so the operator can reach through the window to re-open the door, even though both might appear closed and secured).
– Maintaining the stationary state of the vehicle through wheel chocks, disabling the vehicle from the rear ignition switch, or other methods.
– Placing cones or hazard triangles around the vehicle to indicate it will not be moving.
– Lighting considerations (parking lights, hazard lights, etc.).
– Signage considerations (“Not in Service” on destination sign, etc.).
After Concluding Revenue ServiceIndividual agencies have varying procedures on completing revenue service, often with specialized staff to complete each task.
Ending Revenue ServicePrior to ending revenue service, the bus operator announces to any remaining passengers that service is about to end. The operator changes destination
APPENDIX C: ANALYSIS OF NON-DRIVING OPERATOR RESPONSIBILITIES
FEDERAL TRANSIT ADMINISTRATION 69
signage to reflect that the vehicle is no longer in service and properly reassigns the vehicle in any auxiliary systems.
When service continues using a different vehicle and operator, the operator may wait with passengers on the out-of-service vehicle until the continuing vehicle arrives, depending on agency policy and procedure. In remote areas or during inclement weather, this practice may be more common.
Pulling into YardThe operator checks that there are no other passengers on board, then drives the vehicle to the appropriate facility. Depending on agency policy and procedure, the operator may leave the vehicle with yard staff, who then service and park the vehicle. Yard staff or the operator also inspect the vehicle for any damage that may have occurred during the shift.
The operator or other staff drive the vehicle between each of the following service locations. The same staff member may not stay with the vehicle through the entire servicing process.
Fare Probing and Cash DroppingAgency fare collection procedure varies based on technology and policy. Agencies with electronic fare collection “probe” the vehicle to download information, or information transmits wirelessly throughout the vehicle run. Some agencies use this electronic information only for accounting purposes, whereas others update databases to support smart card and other fare payment systems. For agencies that allow cash payment of fare, the collected cash is removed from the vehicle through a “cash drop” and processed.
Fueling and ServicingSpecialized agency staff refuel the vehicle and check fluids, including diesel exhaust fluid (for hybrid vehicles), motor oil, transmission fluid, wiper fluid, and others. These staff are specially trained for handling hazardous materials and can safely respond to emergencies such as spills and fires. Staff record the vehicle serviced and the amount of fluids added to each vehicle for advanced diagnosis of mechanical issues by maintenance staff. Some properties partly automate refueling and fluid tracking through fuel cards and other systems.
Cleaning Vehicle InteriorDepending on agency staffing, cleaning the vehicle interior may be the responsibility of the operator, fueling staff, or specialized cleaning staff. Interior cleaning entails checking for lost and suspicious items; removing garbage from collection bins, the floor, and on seats; removing stickers and graffiti; cleaning spills or other messes; cleaning windows; and responding to other cleanliness
APPENDIX C: ANALYSIS OF NON-DRIVING OPERATOR RESPONSIBILITIES
FEDERAL TRANSIT ADMINISTRATION 70
concerns. Occasionally, cleaning staff may address larger issues such as seat upholstery cleaning, bedbug prevention or remediation, and duct cleaning. Cleaners also may receive specialized training and equipment for dealing with biohazardous materials, such as bodily fluids.
Cleaning Vehicle ExteriorMany agencies operate a vehicle wash to keep vehicle exteriors clean. Some washes are automatic and require staff only to drive through, whereas others are operated manually by agency staff. Manually-operated vehicle washes require service staff to stand behind the unit and physically wheel it alongside the vehicle. Because washing large vehicles is resource-intensive, practices vary by agency.
Parking VehicleDepending on the facility, vehicles can be parked in a variety of locations, including gravel or paved parking lots, canopied lots, barns, or indoor facilities. Some parking facilities require the driver to back the vehicle into or out of parking spaces, whereas others are designed with only pull-through spaces. Vehicles may be blocked by other parked vehicles, requiring staff to move other vehicles around to access a specific one. For example, some routes may require specialized on-vehicle equipment, or a certain vehicle may require maintenance. Some agencies assign vehicles to specific parking spaces, record where vehicles are parked upon their return to the facility, or keep ranges of vehicles in certain areas of the facility to reduce the amount of time spent searching for specific vehicles.
Service staff or bus operators walk to and from service stations or the report location to retrieve vehicles for their assigned tasks, which can be time-intensive and can lead to increased pedestrian traffic within the yard.
Ending ShiftAfter parking the vehicle, the operator walks from the parking location to the report vehicle location. The operator arrives at the report location and completes any applicable paperwork, including passenger counts, vehicle maintenance reports, and accident reports. The operator may also provide dispatchers with pertinent information regarding operations in general or other observances made throughout the course of the shift. The operator’s paid time ends after completing required duties at the report location.
Special SituationsThis section describes special situations that may occur on or around a transit vehicle.
APPENDIX C: ANALYSIS OF NON-DRIVING OPERATOR RESPONSIBILITIES
FEDERAL TRANSIT ADMINISTRATION 71
CollisionsA collision involving a transit vehicle typically requires an on-the-road supervisor or service inspector to process the scene, in collaboration with dispatchers, law enforcement, and others. Collisions become more complicated when injuries, fatalities, or towing is involved. Supervisors who respond to the scene also must be aware of legal requirements for drug testing or medical surveillance to maintain operational compliance.
General Procedure
After assessing injuries and damage and alerting the appropriate authorities, transit agency staff must consider the following in any collision situation.
Passenger Recovery
Agencies should provide a way for the passengers who were on the transit vehicle to make it to their destination, or to transfer to another service. This can include providing passengers with a safe location to wait for the next transit vehicle along the same line, commissioning an additional vehicle to recover the passengers, or dispatching multiple smaller vehicles to bring passengers to their final destinations (such as via a supervisor vehicle if there are few passengers or if the collision occurs near the end of the service day). Passengers might find their own way to their destination without agency intervention. Witness statements from passengers can be important, especially if there is the potential for legal action related to the collision.
Service Recovery
Agencies also must recover the service that is lost from the transit vehicle that is detained as a result of the collision. Although the remainder of the interrupted trip is likely unable to be recovered, the service recovery could begin with the next time point, the next change in trip direction, or the beginning of the next round trip. Passengers who are waiting further down the line on the interrupted or cancelled trips should also be notified, if possible.
Transit Vehicle Recovery
The transit vehicle involved in the collision may require inspection or repair at a maintenance facility or, depending on the severity of the collision, may be seized as evidence by law enforcement. If the agency is taking custody of the vehicle, towing or other removal arrangements must be made to transport the vehicle back to the maintenance facility. At the facility, the vehicle must be secured while it awaits inspection or repair.
APPENDIX C: ANALYSIS OF NON-DRIVING OPERATOR RESPONSIBILITIES
FEDERAL TRANSIT ADMINISTRATION 72
Operator Recovery
Depending on agency policy, federal, State, and local laws, and the severity of the collision, the operator may require medical attention, or may be required to undergo drug testing or medical surveillance (see Post-Accident Drug Testing). This may require a supervisor or other agency staff to transport the operator to a medical facility because the operator may not be permitted to drive a transit vehicle until investigation of the collision is complete. Furthermore, the supervisor or dispatcher must complete administrative actions in response to these outcomes. For example, the operator’s work on subsequent days may need to be covered by a different operator.
Post-Accident Drug Testing
The Federal Motor Carrier Safety Administration (FMCSA), which administers Commercial Driver’s Licenses, required to operate transit vehicles, requires post-accident drug testing under the following post-accident circumstances:
• Fatality
• Injury requiring transport of injured from scene for immediate medical attention
• Damage requiring any involved vehicle to be towed away from scene
In addition to FMCSA requirements, agency policy may outline additional post-accident requirements as a condition of continued employment. Furthermore, agencies also may allow operators to request a post-accident drug test if it is not required by FMCSA or the agency. An operator might request a post-accident drug test to remove the suspicion of drug use in any potential future legal or employment action arising from the collision.
Reporting
All involved parties, including witnesses on or outside the transit vehicle, drivers of other vehicles, the operator of the transit vehicle, and the responding supervisor should complete a collision report promptly to preserve evidence and retain complete records. Witness contact information is particularly important, although some witnesses may be reluctant to give information or attempt to leave the scene quickly after the incident. Collision reports and incident reports are essential to the agency should legal action pertaining to the collision occur.
Incidental Contact
An incidental contact collision involves no injuries and little damage. Examples of incidental contact include scraping or bumping a mirror on a street sign, bending or scraping a side panel of the bus on a tree branch or snow bank, or other cosmetic damage that does not affect operation of the vehicle. Typically,
APPENDIX C: ANALYSIS OF NON-DRIVING OPERATOR RESPONSIBILITIES
FEDERAL TRANSIT ADMINISTRATION 73
incidental contact does not involve another vehicle, but occasionally a minor sideswipe or mirror knock with no or scuff-only damage could be considered incidental contact. Reporting on incidental contact varies greatly by agency, but typically involves submitting a damage report upon returning to the garage.
Non-injury Collisions with Property DamageThis type of collision can include property damage to the transit vehicle, another vehicle, other property such as landscaping or street fixtures, or some combination thereof. Depending on the specific collision, the incident could be resolved quickly and the vehicle could continue operating. However, a collision that results in issuing a citation to the transit vehicle operator, towing any involved vehicle from the scene, or damage costs exceeding a certain threshold may prompt FMCSA-required drug testing (see Post-Accident Drug Testing).
Injury Collisions
This type of collision involves injury or injuries to occupants of the transit vehicle (including the operator), other vehicles, or others outside the transit vehicle. Injury collisions may or may not include damage to the transit vehicle, other vehicles, or other property. The specific collision will likely prompt FMCSA-required drug testing (see Post-Accident Drug Testing).
Special Considerations
• Not all injuries will require medical attention, but even minor injuries should be reported to avoid legal exposure to the agency.
• Injured parties may choose to leave the scene instead of receiving treatment or providing information. For the operator’s and agency’s protection, a thorough report should be completed in case the injured party seeks medical attention later.
• Depending on the severity of injuries, an injury collision can become a fatal collision, even several days or weeks after the collision has occurred.
Fatal CollisionsThis type of collision involves one or multiple deaths of the transit vehicle operator, transit vehicle occupants, other vehicle occupants, or parties outside the transit vehicle. Fatal collisions may or may not involve other injuries or property damage.
Special Considerations
• An initial injury collision may become a fatal collision, sometimes days or weeks after the incident occurs, if injured parties die from those injuries.
APPENDIX C: ANALYSIS OF NON-DRIVING OPERATOR RESPONSIBILITIES
FEDERAL TRANSIT ADMINISTRATION 74
• The transit vehicle will likely be seized as evidence until a mechanical inspection occurs and the investigation is completed, which can sometimes take months or years depending on legal proceedings.
• The transit vehicle operator (if not deceased) will likely be arrested at the scene, but may also require medical attention, even if not physically harmed.
• The transit vehicle operator (if not deceased) will be required by FMCSA to undergo a medical examination and drug testing (see Post-Accident Drug Testing).
• The transit vehicle operator (if not deceased) will be removed from service pending investigation, but may have to remain in the agency’s employ during legal proceedings, depending on agency policy and labor contracts.
• A fatal collision can greatly impact the agency, potentially leading to workforce-related issues and customer-related issues.
Blocked RoadwaysRoadways can become blocked for a variety of reasons. Transit vehicles may have to temporarily violate rules of the road to pass a roadway obstruction. For example, a bus might have to cross over the double yellow line temporarily to get around a double-parked car. Some roadway obstructions are passable by light-duty vehicles but not by heavy-duty vehicles. For example, a water main break (as indicated by water bubbling through pavement) can be safely passable for a light-duty vehicle, but a transit vehicle could sink into the roadway.
Traffic Light OutagesWhen a traffic light is out, vehicles typically treat the intersection as an all-way stop. For transit vehicles, however, their slow-moving nature and the impatience of other light-duty vehicle drivers often make this situation difficult. Transit vehicle operators sometimes have to “nose out” into the intersection to make their way through.
Mechanical FailuresA mechanical failure can occur at any point during vehicle operation. Operators are sometimes able to predict a failure by the way the vehicle handles, or notable sounds and smells. When a mechanical failure does occur, the operator will investigate the issue, alert dispatchers, and inform passengers.
Air Pressure LossGauges on the vehicle dashboard show air pressure for brakes and suspension. Air leaks can occur from wearing or ruptured air system components. Preliminary leaks may be noticed by listening for a hissing sound during pre-trip inspection and during vehicle operation, or by looking at the vehicle to see if it
APPENDIX C: ANALYSIS OF NON-DRIVING OPERATOR RESPONSIBILITIES
FEDERAL TRANSIT ADMINISTRATION 75
leans to one side. If an air pressure loss occurs and the vehicle’s air compressor is unable to overcome the loss, the operator is alerted by an indicator light or sign and an audible signal. The operator should safely stop the vehicle and call a dispatcher for assistance. If a major air pressure loss occurs, the spring brakes will automatically activate and will stop the vehicle abruptly. The operator will need assistance from maintenance personnel, and the vehicle may require towing.
Electric System FailuresDuring an electric system failure, the vehicle may continue operating, but auxiliary electrical systems may stop functioning. The operator may not be able to communicate with a dispatcher if the communications radio is affected, and may need to use a cellular phone or flag down another operator to communicate the problem to a dispatcher. Other than failure of auxiliary electrical systems, indicator lights and gauges may provide advanced warning of an electrical failure.
Electrical issues sometimes arise from poor contact on the battery shut-off switch. The operator should first check that the switch is fully in the “on” position by manually moving the switch between positions multiple times. If this does not resolve the issue, the vehicle can usually be driven to a maintenance facility without maintenance staff assistance.
Fluid LeaksWearing or broken hoses or other broken components can result in fluid leaks. Operators should check the ground beneath the vehicle for fluid leaks before beginning revenue service. When leaks do occur during revenue service, the operator is often unaware. Other operators, passengers, or other road users may report the leak. Many fluids on the vehicle are flammable and hazardous, so identifying the type of fluid leaking is important before beginning cleanup. Maintenance staff can identify leaked fluid by the location of the leak on the vehicle, smell, color, and viscosity. To contain the leak and minimize vehicle damage, the vehicle should stop in a safe location immediately after a leak is discovered. Depending on the severity and type of leak, the vehicle may need to be towed to a maintenance facility.
Stuck InterlockTransit vehicles employ interlocks to prevent the vehicle from moving in certain situations, such as when the wheelchair ramp is deployed or when the rear door is open. Some vehicles use an additional brake instead of a transmission interlock. The interlock can become stuck, resulting in the vehicle’s immobilization. Some vehicles have an interlock override switch, but depending on agency policy, maintenance staff may have to intervene.
APPENDIX C: ANALYSIS OF NON-DRIVING OPERATOR RESPONSIBILITIES
FEDERAL TRANSIT ADMINISTRATION 76
Stuck DoorVehicle doors are manually-, electronically-, or pneumatically-operated. Electric and pneumatic doors can be manually-operated when an override switch is activated. Doors can become stuck because of a mechanical failure or physical obstruction, such as a snow bank. When a door is stuck, the operator checks for obstructions. If an obstruction is preventing the door from closing, the operator attempts to resolve the issue. If a mechanical failure occurs, the vehicle will need service from maintenance staff. The vehicle can usually be driven to a maintenance facility without assistance, but should not carry passengers in revenue service until the issue is resolved.
Indicator PanelThe indicator panel often communicates mechanical issues before they become more serious. However, the indicator panel also can fail and is checked during pre-trip inspection to ensure all indicator lights are working properly.
Stop EngineThe stop engine indicator light and alarm indicate that a serious issue is affecting the vehicle that requires an immediate shutdown. Depending on the vehicle model, some vehicles will automatically shut down within a short period of time from when the light and alarm activate. However, in many cases the vehicle shuts down very soon after the alarm. When the vehicle is in an unsafe location for stopping—for example, while crossing over railroad tracks or through an intersection—the operator can attempt to manually override an engine shutdown through the stop engine override switch. Activating the override switch will prevent engine shutdown for a short amount of time, potentially allowing the operator to move the vehicle to a safer stopping location. A stop engine alarm typically indicates a more serious issue that requires maintenance staff intervention and potential towing to the maintenance facility. Immediately following a stop engine alarm, operators should notify dispatch and check for leaks, which may require environmental cleanup response in addition to maintenance staff response.
Vehicle FiresMany transit vehicles have rear engine compartments, so bus operators may be unable to see or smell smoke and flames. Buses are equipped with two audible alarms and an indicator light to alert operators of an engine compartment fire. Fire alarms usually are accompanied by other alarms as well. Some vehicles, particularly hybrid buses, are equipped with fire suppression systems.
When the fire alarm is activated in a transit vehicle, the operator has a short amount of time to move the vehicle to safety before it shuts down. The
APPENDIX C: ANALYSIS OF NON-DRIVING OPERATOR RESPONSIBILITIES
FEDERAL TRANSIT ADMINISTRATION 77
operator must quickly evacuate passengers from the vehicle and alert emergency personnel and agency dispatchers. The operator also must encourage evacuated passengers and other witnesses to stand away from the engine compartment where there are many flammable and combustible fluids and materials.
Medical IncidentsA medical incident can affect the transit vehicle operator, a passenger on the vehicle, or even someone outside the transit vehicle. For example, a passenger might pass out while waiting for the bus or trip and fall while boarding or alighting.
In a medical incident, the transit vehicle operator should alert authorities and the dispatcher, then stop the vehicle and wait for further direction or assistance.
If an operator feels he/she is about to have a medical incident, an attempt should be made to secure the vehicle while allowing for first responder access from the vehicle exterior. Reporting and documentation of medical incidents is an important part of limiting agency liability and improving agency policy and procedure.
Security IncidentsSecurity incidents typically involve a weapon, unattended package, or threatening behavior. Less common security incidents can include a variety of more severe situations, such as a hostage situation or other violent event. Operators rely on their training and knowledge of agency policy and procedure when reacting to these situations. Some transit vehicles are equipped with a silent alarm that can be secretly activated by an operator. The silent alarm will notify the dispatch center and authorities automatically and may display a message on the outside of the vehicle to alert others to an emergency. For the safety of the vehicle occupants, silent alarms typically do not show any interior indication of their activation.
Security incidents require alerting a dispatcher and law enforcement as soon as possible, and can result in significant service disruptions while law enforcement and agency staff respond to the situation. Depending on the circumstances of the event, the operator may continue operating the vehicle along the route, or pull the vehicle over and wait for authorities. The course of action will depend on instruction from the dispatcher and the operator’s own assessment of the situation.
Reporting and documenting security incidents is an important part of limiting agency liability and improving agency policy and procedure.
APPENDIX C: ANALYSIS OF NON-DRIVING OPERATOR RESPONSIBILITIES
FEDERAL TRANSIT ADMINISTRATION 78
Unruly PassengersIn the case of an unruly or agitated passenger, the transit vehicle operator should attempt to de-escalate the situation to keep all occupants of the vehicle safe. At a minimum, the operator should avoid further escalating the situation. The primary goal of dealing with an unruly passenger is to ensure the safety of all parties involved by deescalating the situation. The operator may need to stop the vehicle to safely accomplish this and may need to contact a dispatcher or law enforcement to resolve the situation.
Construction ZonesSometimes construction zones are designed without heavy-duty vehicles in mind. Transit vehicles might experience lanes that are too narrow for passage, temporary lanes or cones that do not allow for the proper turning radius of a transit vehicle, or height and side clearance issues related to swinging ballast from a crane or backhoe movement. Furthermore, roadways that are under construction could also have weight restrictions that require detouring the transit vehicle. Finally, delays and detours related to road construction can lead to service impacts, which may require adding transit vehicles to maintain the same level of service.
DetoursOccasionally, transit vehicles must detour. Detours can be planned, such as during road construction or special events, or in response to an immediate need, such as when an intersection is blocked by a collision. All detours must take passenger impact into consideration, particularly when considering social equity. Transit service planners should attempt to serve as many original stops as possible when drawing the detour route or should provide alternative, temporary stops as close as possible to the original stops. Additionally, special facilities such as wheelchair ramps should be replicated at temporary stop locations, if possible.
Temporary, short-term detours in response to an immediate need should attempt to accommodate passengers who are already on the vehicle, in addition to passengers who may be waiting at an affected stop. These disruptions could also result in some transit vehicles becoming stuck at the obstruction, requiring the deployment of additional transit vehicles to maintain service frequency.
Communication between dispatchers and transit vehicle operators, as well as between the agency and its stakeholders, is important in both detour situations. In a planned detour, communication with both groups can occur prior to the detour through stop-specific signage, announcements, and additional operator paperwork or check-ins. Immediate detours present a communication challenge that often relies on online resources and social media, but may even involve
APPENDIX C: ANALYSIS OF NON-DRIVING OPERATOR RESPONSIBILITIES
FEDERAL TRANSIT ADMINISTRATION 79
dispatching of a road supervisor to affected areas to communicate with passengers.
Inclement WeatherWeather events can impact transit schedules. Some agencies may operate an increased schedule (to reduce the amount of time passengers are waiting in extreme temperatures) or reduced schedule (to allow for more durable recovery of impacted services) during inclement weather. Adjusting schedules and communicating these adjustments to agency stakeholders is important. Inclement weather policy also focuses on immediate extreme weather events. For example, some agencies might suspend service during an imminent tornado threat.
During a weather event that results in suspended service, agencies must secure transit vehicles, operators, and passengers. Furthermore, when the event is over, agency staff must plan to have the vehicles and operators in place to restart service appropriately. Throughout the event, communication among staff and with the public is key.
Assistance in EmergenciesTransit agencies often are asked to assist in emergencies. These requests can include providing evacuation assistance in times of a natural or man-made disaster, temporary shelter assistance for emergencies such as apartment building fires, or replacing transit service during a subway or other rapid transit line closure, among many others. Agency policy dictates how these requests are accommodated and financed, but transit agencies are unlikely to deny such requests because of the positive goodwill involved with their participation.
Assistance in EventsTransit agencies often are asked to leverage their resources for special events. Event assistance can include extending schedules or increasing capacity for concerts or sporting events, changing routes or stop locations in response to security procedures for visiting dignitaries, or any number of special requests that fall outside the typical realm of transit operations. Agency policy dictates how these requests are accommodated and financed.
Stopping at Railroad TracksTransit vehicles are required to stop at railroad tracks before crossing. However, some crossings exempt commercial vehicles. A crossing can be exempt because it is controlled by an additional traffic device, such as when railroad tracks pass through an intersection with crossing lights and a traffic light. Other crossings could be exempt because it is too dangerous for a transit vehicle to stop, such as on a steep hill or around a blind curve. These crossings may or may not be
APPENDIX C: ANALYSIS OF NON-DRIVING OPERATOR RESPONSIBILITIES
FEDERAL TRANSIT ADMINISTRATION 80
marked as commercial vehicle-exempt, but transit vehicle operators will have been trained on the location of any such crossings.
BicyclesSome agencies equip their vehicles with bicycle racks, which are generally passenger-operated and typically can accommodate 2–3 bicycles. Depending on agency policy, bicycles might be allowed on all, some, or no trips. Bicycles might also be allowed within the passenger compartment of the transit vehicle.
On rack-equipped vehicles, the operator must take care to allow additional clearance in front of the vehicle when the rack is deployed. Furthermore, the operator must be aware of passengers who are loading or unloading bicycles to avoid putting the vehicle in motion with a passenger still operating the bicycle rack.
StrollersDepending on agency policy, passengers might be required to remove children and/or fold strollers when the transit vehicle is in motion; other agencies might leave accommodation of strollers up to the discretion of the operator. However, unsecured strollers can move throughout the vehicle and result in injuries to the child in the stroller or to other passengers.
APPENDIX
FEDERAL TRANSIT ADMINISTRATION 81
D TransitAutomationBenefit-CostAnalysis ReportIntroductionThis report presents an overview of the potential benefits and costs of selected vehicle automation technologies and applications for transit vehicles. The scope of the analysis is generally limited to bus transit and excludes rail modes. As part of an earlier stage of the project, the research team identified five technology packages that could be used to structure stakeholder communications and solicit feedback. The technology packages are comprised of individual use cases. While not a comprehensive list, the use cases represent a range of vehicle types, operating environments, and automation levels. These five technology packages are:
• Transit Bus Advanced Driver Assistance System
• Automated Shuttles
• Automation for Maintenance, Yard, and Parking/Storage Operations
• Automation for Mobility-on-Demand Service
• Automated Bus Rapid Transit (BRT)
The subsequent sections are organized by technology package. Each section describes the technology package and addresses benefits and costs for selected use cases within the package.
Overview and MethodologyThis analysis is designed to support FTA and agency prioritization decisions by presenting information on the internal business case for transit automation capabilities. The calculations should not be viewed as definitive due to the many data limitations and uncertainties in this field, particularly those related to forecasting the future path of technology costs and capabilities. Indeed, a secondary aim of this analysis is to help identify research needs, since reviewing published benefit and cost information is often a useful means of detecting gaps in the available research.
As noted above, the focus here is on supporting investment decisions through analysis of the direct financial impacts of automation technologies on transit agencies and their operations. This should be distinguished from the “societal” accounting framework of benefit-cost analysis, in which all costs and benefits are included, regardless of to whom they accrue, and in which non-market impacts are monetized to the extent possible. The analysis in this report, by focusing on agency impacts, generally does not capture benefits to users such as
APPENDIX D: TRANSIT AUTOMATION BENEFIT-COST ANALYSIS REPORT
FEDERAL TRANSIT ADMINISTRATION 82
improved travel times or comfort, or benefits to non-users such as air quality improvements, though these impacts are noted in the text and could be the subject of future research that takes a broader perspective on benefits and costs.
In the sections that follow, the five technology packages are introduced and a separate analysis is presented for each of the use cases within each package. The analysis generally includes an overview of how the use case would work, what the impacts would be for transit agencies, and the assumptions used in generating a quantitative estimate (where applicable). Financial benefits and costs are generally compared against a baseline of the “next best” non-automated option; for example, a bus with an automated lane-keeping system would be compared against a similar bus without the technology.
The building blocks of the analysis are the results from field operational tests, case studies, published estimates from the literature, and other sources. Calculations generally are scaled to a relevant unit of investment analysis, such that use cases that involve a fixed cost per bus, per corridor, or per maintenance facility will be calculated and presented on that same per-bus, per-corridor, or per-facility basis. To do so, the analysis also draws on contextual information from specific agencies or facilities with the goal of providing a more realistic presentation. However, the figures presented should not be viewed as providing a precise model of any particular deployment.
Automation technologies have evolved significantly from earlier field tests. Not only have equipment costs fallen, but new solutions have emerged for existing use cases, often with lidar- and vision-based sensing to replace approaches that were based on magnets or other extensive wayside infrastructure. The research team has attempted to gather the most recent cost information, but this area continues to evolve, and many of the automation capabilities that are discussed in the technology packages are not yet commercially-available in the transit market. Costs for other elements such as vehicle operations are drawn largely from the National Transit Database (NTD), along with Bureau of Labor Statistics (BLS) data on employee compensation.
Benefits to transit agencies have been estimated using available data from tests, simulations, and other published work. The impacts of any particular use case will vary significantly according to local conditions, as each agency, corridor, and facility is different. Since many automation use cases involve potential labor savings, the differences across agencies with regard to labor contracts may be particularly noteworthy. Another limitation is that the benefits and costs have been calculated on a standalone basis for each use case, even though there may be cases in which there is overlap in the required technology, allowing a single equipment investment to provide for multiple applications and benefit areas. In these cases, the figures presented here for the business case should be regarded as conservative.
APPENDIX D: TRANSIT AUTOMATION BENEFIT-COST ANALYSIS REPORT
FEDERAL TRANSIT ADMINISTRATION 83
More detailed information on analytical assumptions is presented in the sections below. In general, the analysis period was chosen to align with the investment timeframe, such as a 12-year transit bus lifetime, with all figures in real (inflation-adjusted) 2017 dollars. In comparing costs and benefits across multiple time periods, a discount rate was used to account for the time value of money. Current guidance from the White House Office of Management and Budget recommends the use of a 7% real discount rate (and a 3% sensitivity case) for societal benefit-cost analyses (BCAs), and the cost of borrowing (i.e., the yield on Treasury bonds, currently around 0.5%) for cost-effectiveness analysis. In this analysis, present values were calculated using all three rates, but most summary tables in this report present the 3% case as a mid-range estimate that is generally consistent with transit agency bond yields.
Transit Bus Advanced Driver Assistance SystemThe Transit Bus Advanced Driver Assistance System (ADAS) technology package includes partial automation technologies that can be added to a typical 40-foot bus, cutaway bus, or articulated bus. These systems can be factory installed or installed on existing buses as retrofit systems. Depending on the specific ADAS application, the technology may increase the safety of operations, provide a better and more accessible service to customers, or improve driving performance in terms of fuel economy, network efficiency, or other metrics.
ADAS capabilities are generally classified as SAE Level 1 or Level 2 (L1/L2) systems because they involve partial automation of one or more aspects of vehicle control, such as longitudinal or lateral control, while the human operator maintains overall responsibility for the driving task. However, systems that provide only momentary intervention, such as automated emergency braking (AEB), may be classified as L0. Appendix B provides more detail on automation levels.
ADAS on buses can use inputs from sensor systems (e.g., cameras, radar units, and lidar units) to provide information for actuators controlling throttle, braking, and steering systems. These components can enable a variety of applications, including:
• Smooth acceleration and deceleration to improve fuel economy
• Automated emergency braking (AEB) and pedestrian detection for collision avoidance
• Precision docking at bus stops and curb avoidance during bus stop approaches and turns
• Operations in narrow lanes or road shoulders (e.g., for Bus-on-Shoulder or BRT guideway)
• Bus platooning to enhance throughput in constrained corridors
APPENDIX D: TRANSIT AUTOMATION BENEFIT-COST ANALYSIS REPORT
FEDERAL TRANSIT ADMINISTRATION 84
These applications can be used in a variety of settings, including highways, expressways, busways, urban roads, and tunnels, depending on the specific application.
From a user perspective, adding an L1 or L2 ADAS system to a bus will result in a minimal visual difference, as the driver is still present and operating the bus. Some features may improve the ride experience, although it may be difficult for users to perceive. Precision docking can make boarding and alighting easier and faster for passengers, especially for those with mobility challenges. Use of road shoulders in traffic or platooning16 to increase throughput could result in faster trips and improved reliability. Early generation systems could potentially have sharper stops when AEB is activated, causing discomfort for some passengers or even injuries to standees; however, such issues are expected to be mitigated as the technology matures.
From an operator perspective, ADAS may reduce workload and the associated stress and fatigue. Lack of trust in the system or poor design could result in disuse, while overestimation or overreliance on ADAS capabilities could result in unintended uses and lapses in safe operation. These human factors issues require additional study and are largely beyond the scope of this assessment, though they will ultimately affect the benefits and costs of ADAS.
Individual ADAS use cases are presented in the sections below.
Smooth Acceleration and DecelerationThis use case is predicated on the use of wireless communication between the transit bus and the traffic signal controller. With knowledge of the signal phase, the bus can adjust its speed on the approach and departure from the intersection to improve fuel economy—for example, maintaining speed to be able to pass through on the green phase or decelerating to a red signal in an efficient way. This helps to reduce idling as well as the excess fuel that is consumed when a vehicle accelerates toward an intersection only to have the signal turn red. With the addition of partial automation of longitudinal control, acceleration and deceleration can be coordinated with the signal phase and optimized, with greater fuel savings relative to manual driving. This concept has been demonstrated through the USDOT GlidePath prototype application, which is a cooperative adaptive cruise control (CACC) system with dedicated short range communications (DSRC) based vehicle-to-infrastructure (V2I) communications.
This use case is modeled at the level of an individual bus over the expected 12-year lifespan of the vehicle. The baseline for comparison is a comparable
16 Platooning uses vehicle-to-vehicle (V2V) communications technology, in combination with automation for acceleration and braking, to enable vehicles to safely travel in the same lane with reduced headways.
APPENDIX D: TRANSIT AUTOMATION BENEFIT-COST ANALYSIS REPORT
FEDERAL TRANSIT ADMINISTRATION 85
bus without this ADAS function. In essence, this means that the costs of the components necessary for the use case—adaptive cruise control (ACC) and DSRC equipment—are compared against the forecast fuel savings.
Assumptions and Data Sources
• The analysis is based on a transit bus over a 12-year lifespan, with the ADAS equipment installed for Smooth Acceleration and Departure in year 1. Separate calculations were prepared for diesel and hybrid electric buses due to their differences in fuel use.
• Average annual mileage per bus and average fuel economy are drawn from the Alternative Fuels Data Center,17 which draws on NTD reporting.
• Diesel prices for the 12-year analysis period are taken from the U.S. Energy Information Administration (EIA) Annual Energy Outlook 2017.18
• The GlidePath project estimated a 22.2% fuel savings compared to uninformed manual driving in a simplified scenario. This level may not be achievable for transit vehicles due to their frequent passenger stops and their varied operational environments, including congested city centers.19 As a more conservative estimate, a figure of 7.4% (i.e., one-third of the GlidePath figure) was used in calculations.
• Use of the system was assumed to have little to no impact on overall travel times and transit schedule adherence. This is an area that requires additional research, although it is possible that reduced stops at red lights could translate into improved travel times.
• Capital costs for equipment were estimated at $1800 for Adaptive Cruise Control20 and $350 for DSRC.21 Although ACC systems exist at lower price points for light-duty vehicles, this estimate reflects the additional complexity in a transit bus setting. These systems are assumed to last for the life of the vehicle, though there may be upgrades and sensor replacements.
17 AFDC (2016), “Vehicles: Fuel Consumption and Efficiency,” Alternative Fuels Data Center. http://www.afdc.energy.gov/data/.
18 EIA (2017), “Annual Energy Outlook 2017,” U.S. Energy Information Administration, January 5. https://www.eia.gov/outlooks/aeo/.
19 USDOT (2016), “AERIS: GlidePath Prototype Application,” Intelligent Transportation Systems Joint Program Office. https://www.its.dot.gov/research_archives/aeris/aeris_factsheet_glidepath.htm.
20 Roland Berger. (2016), “Automated Trucks: The Next Big Disruptor in the Automotive Industry?” Presentation, April. https://www.rolandberger.com/publications/publication_pdf/roland_berger_automated_trucks_20160517.pdf.
21 NHTSA (2014), “NHTSA Issues Advance Notice of Proposed Rulemaking and Research Report on Ground-Breaking Crash Avoidance Technology: ‘Vehicle-To-Vehicle Communications: Readiness of V2V Technology for Application,’” Factsheet, National Highway Traffic Safety Administration (NHTSA), U.S. Department for Application,’” Factsheet, National Highway Traffic Safety Administration (NHTSA), U.S. Department of Transportation. August. https://www.safercar.gov/staticfiles/safercar/v2v/V2V_Fact_Sheet_101414_v2a.pdf.

APPENDIX D: TRANSIT AUTOMATION BENEFIT-COST ANALYSIS REPORT
FEDERAL TRANSIT ADMINISTRATION 86
• Very little information was available on annual operating and maintenance(O&M) costs for the equipment. As a rough estimate, annual O&M costswere assumed to be 10% of capital costs. This could include periodicinspection, repair, and upgrades of electronic components.
• Costs for DSRC roadside infrastructure and signal controller upgrades, tothe extent not already present, are assumed to be borne by the relevantlocal streets/highway department, and not by the transit agency.
• Deployment of the system could require some driver training andfamiliarization, although transit agencies would be somewhat unlikely todeploy a system that does not provide an intuitive interface. In this analysis,it is assumed that such training time can be incorporated into the agency’sexisting practices and schedules, with no incremental cost.
Analysis
Using the assumptions above, estimated fuel savings exceed equipment costs by a considerable margin. In the 3% discount rate case, the benefit/cost ratio is 6.1 for diesel buses (see Table D-1a). For hybrid or electric buses, net benefits are lower because their regenerative braking capabilities and ability to stop without idling reduce the potential fuel savings associated with smoother braking and reduced time stopped at red signals. These vehicles also generally have lower fuel costs to begin with, reducing the scope of potential savings. For a hybrid-electric bus, the benefit/cost ratio was estimated in a range from 3.9 to 5.2 (3% discount rate) depending on assumptions such as braking strategy, drive cycle, and overall fuel economy.22 Table D-1b presents a benefit-cost summary for a hybrid bus with an intermediate level of regenerative braking and energy recapture.
In cases in which the transit agency would also be responsible for the DSRC roadside equipment used for V2I communication—as might be the case with a dedicated transitway, or in localities that manage both transit services and roads—costs would be considerably higher. Information on these costs is still somewhat preliminary and varies according to site conditions and assumptions about backhaul telecommunications, security, and signal controller upgrades.23 Published estimates list the cost for a DRSC roadside unit in the range of $18,000 plus costs for backhaul telecommunications.24 Thus, a network of DSRC roadside units dedicated solely to this application would only be cost-effective
22 Sangtarash, F., V. Esfahanian, H. Nehzati, S. Haddadi, M. A. Bavanpour, and B. Haghpanah (2009), “Effect of Different Regenerative Braking Strategies on Braking Performance and Fuel Economy in a Hybrid Electric Bus Employing CRUISE Vehicle Simulation,” SAE International Journal of Fuels and Lubricants 1(1):828-837. doi:10.4271/2008-01-1561. http://sites.uci.edu/haghpanah/files/2016/12/Effect-of-Different-Regenerative-Braking-Strategies-on-Braking-Performance-and-Fuel-Economy-in-a-Hybrid-Electric-Bus-Employing-CRUISE-Vehicle-Simulation.pdf.
23 GAO (2015), “Intelligent Transportation Systems: Vehicle-to-Infrastructure Technologies Expected to Offer Benefits, but Deployment Challenges Exist,” GAO-15-775, U.S. Government Accountability Office, September 15. https://www.gao.gov/products/GAO-15-775.
24 AASHTO (2014), “National Connected Vehicle Field Infrastructure Footprint Analysis: Final Report.” http://sp.stsmo.transportation.org/Documents/Exec%20Summary%20Final.pdf.
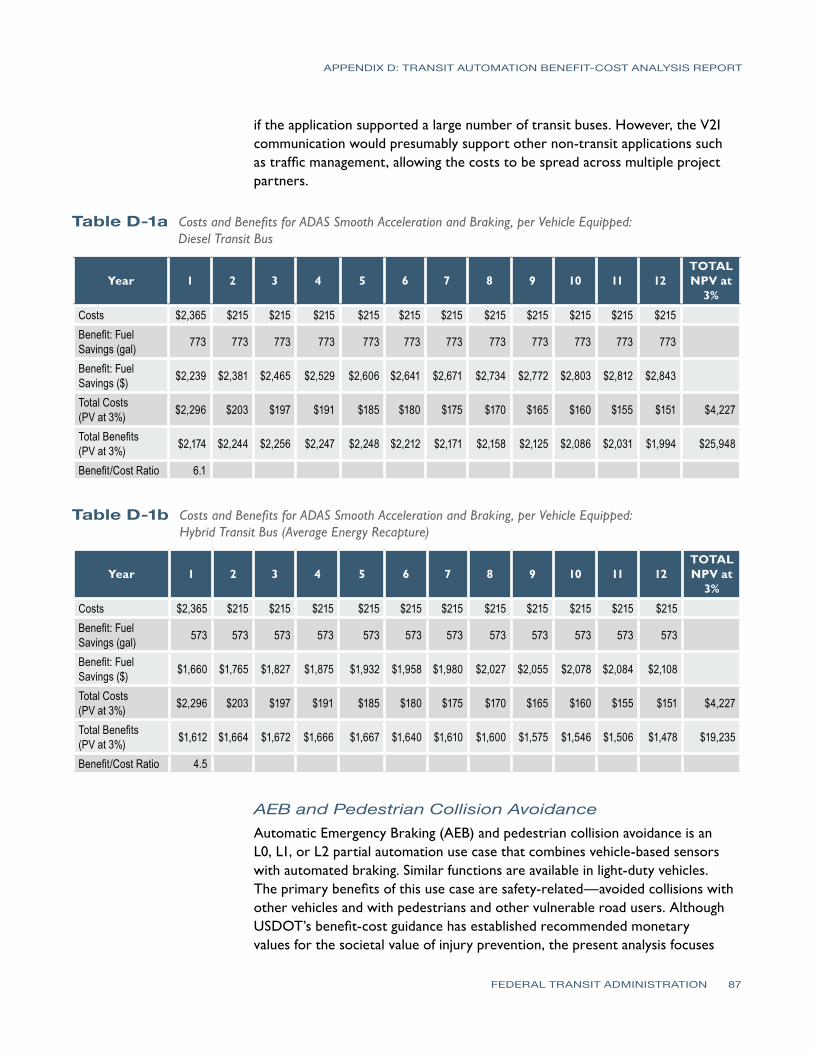
APPENDIX D: TRANSIT AUTOMATION BENEFIT-COST ANALYSIS REPORT
FEDERAL TRANSIT ADMINISTRATION 87
if the application supported a large number of transit buses. However, the V2I communication would presumably support other non-transit applications such as traffic management, allowing the costs to be spread across multiple project partners.
Table D-1a Costs and Benefits for ADAS Smooth Acceleration and Braking, per Vehicle Equipped: Diesel Transit Bus
Year 1 2 3 4 5 6 7 8 9 10 11 12TOTAL NPV at
3%
Costs $2,365 $215 $215 $215 $215 $215 $215 $215 $215 $215 $215 $215Benefit: Fuel Savings (gal) 773 773 773 773 773 773 773 773 773 773 773 773
Benefit: Fuel Savings ($) $2,239 $2,381 $2,465 $2,529 $2,606 $2,641 $2,671 $2,734 $2,772 $2,803 $2,812 $2,843
Total Costs (PV at 3%) $2,296 $203 $197 $191 $185 $180 $175 $170 $165 $160 $155 $151 $4,227
Total Benefits (PV at 3%) $2,174 $2,244 $2,256 $2,247 $2,248 $2,212 $2,171 $2,158 $2,125 $2,086 $2,031 $1,994 $25,948
Benefit/Cost Ratio 6.1
Table D-1b Costs and Benefits for ADAS Smooth Acceleration and Braking, per Vehicle Equipped: Hybrid Transit Bus (Average Energy Recapture)
Year 1 2 3 4 5 6 7 8 9 10 11 12TOTAL NPV at
3%
Costs $2,365 $215 $215 $215 $215 $215 $215 $215 $215 $215 $215 $215Benefit: Fuel Savings (gal) 573 573 573 573 573 573 573 573 573 573 573 573
Benefit: Fuel Savings ($) $1,660 $1,765 $1,827 $1,875 $1,932 $1,958 $1,980 $2,027 $2,055 $2,078 $2,084 $2,108
Total Costs (PV at 3%) $2,296 $203 $197 $191 $185 $180 $175 $170 $165 $160 $155 $151 $4,227
Total Benefits (PV at 3%) $1,612 $1,664 $1,672 $1,666 $1,667 $1,640 $1,610 $1,600 $1,575 $1,546 $1,506 $1,478 $19,235
Benefit/Cost Ratio 4.5
AEB and Pedestrian Collision AvoidanceAutomatic Emergency Braking (AEB) and pedestrian collision avoidance is an L0, L1, or L2 partial automation use case that combines vehicle-based sensors with automated braking. Similar functions are available in light-duty vehicles. The primary benefits of this use case are safety-related—avoided collisions with other vehicles and with pedestrians and other vulnerable road users. Although USDOT’s benefit-cost guidance has established recommended monetary values for the societal value of injury prevention, the present analysis focuses
APPENDIX D: TRANSIT AUTOMATION BENEFIT-COST ANALYSIS REPORT
FEDERAL TRANSIT ADMINISTRATION 88
on direct financial impacts on the transit agencies themselves. As such, the monetary values assigned to avoided crashes are based on transit agency casualty and liability costs. Otherwise, the analysis for this use case employs a similar approach as for the Smooth Acceleration and Deceleration use case: the analysis is conducted on a per-vehicle basis, and the costs of the automation equipment are compared against the stream of crash-related cost savings over the life of the vehicle.
Assumptions and Data Sources
• The analysis is based on a conventional bus over a 12-year lifespan, with the ADAS equipment installed for AEB and Pedestrian Collision Avoidance in year 1.
• Average casualty and liability costs are estimated at $6,565 per bus per year, which is the historical average for the Motor Bus mode.25 This includes crashes and incidents of all types, most but not all of which are potentially addressable by the AEB and pedestrian detection technology.26
• The effectiveness of the technology in avoiding crashes is not known with certainty. For a similar technology package, Mangones et al. (2016) draw on an expert panel to present estimates of crash reduction for New York City buses ranging from 1% to 65%. Kockelman et al. (2016) estimate the Crash Reduction Factor for AEB from 27% to 54% depending on the crash scenario. The same report more specifically estimates an overall reduction in rear-end crashes for trucks and transit buses from AEB of 71%. For the purposes of this analysis, a mid-range value of 45% was selected and applied to the casualty and liability cost estimate. This lower estimate also reflects the fact that an estimated 10% of the incidents and crashes contributing to casualty and liability costs cannot be addressed through the AEB use case.
• Capital costs for equipment were estimated at $4,750 for AEB and blind spot detection systems, consistent with recent estimates from Kockelman et al. (2016) and Mangones et al. (2016). Other estimates for similar truck-based systems are lower27 but the higher estimate was used to be conservative, and to reflect the potentially more complex transit application. The systems are assumed to last for the life of the vehicle, but with periodic updates and repair (see below).
• Annual O&M costs were assumed to be 10% of capital costs. Again, this is a rough estimate used in the absence of long-term operating experience
25 Lutin, J. M., A. L. Kornhauser, J. Spears, L. F. Sanders (2016), “A Research Roadmap for Substantially Improving Safety for Transit Buses through Autonomous Braking Assistance for Operators,” Transportation Research Board Annual Meeting 2016, 16-1246.
26 Lutin et al. (2016) estimate that approximately 10% of crashes are not addressable through these systems.
27 For example, see Roland Berger (2016).
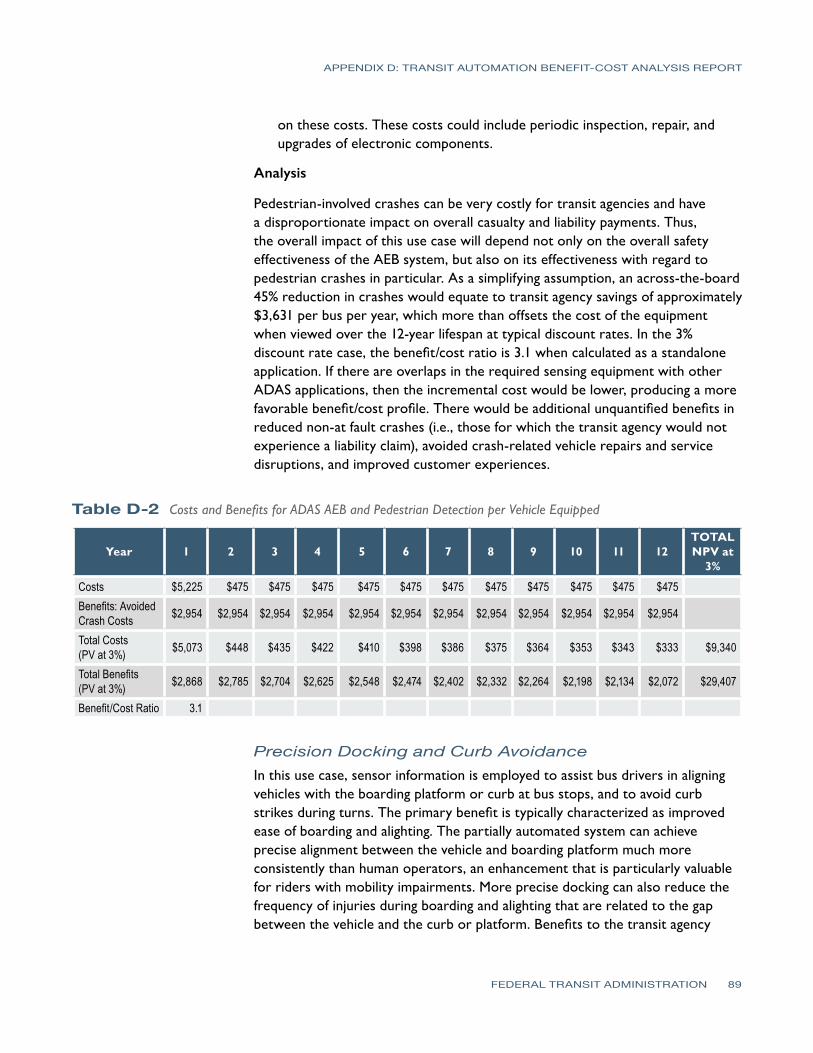
APPENDIX D: TRANSIT AUTOMATION BENEFIT-COST ANALYSIS REPORT
FEDERAL TRANSIT ADMINISTRATION 89
on these costs. These costs could include periodic inspection, repair, and upgrades of electronic components.
Analysis
Pedestrian-involved crashes can be very costly for transit agencies and have a disproportionate impact on overall casualty and liability payments. Thus, the overall impact of this use case will depend not only on the overall safety effectiveness of the AEB system, but also on its effectiveness with regard to pedestrian crashes in particular. As a simplifying assumption, an across-the-board 45% reduction in crashes would equate to transit agency savings of approximately $3,631 per bus per year, which more than offsets the cost of the equipment when viewed over the 12-year lifespan at typical discount rates. In the 3% discount rate case, the benefit/cost ratio is 3.1 when calculated as a standalone application. If there are overlaps in the required sensing equipment with other ADAS applications, then the incremental cost would be lower, producing a more favorable benefit/cost profile. There would be additional unquantified benefits in reduced non-at fault crashes (i.e., those for which the transit agency would not experience a liability claim), avoided crash-related vehicle repairs and service disruptions, and improved customer experiences.
Table D-2 Costs and Benefits for ADAS AEB and Pedestrian Detection per Vehicle Equipped
Year 1 2 3 4 5 6 7 8 9 10 11 12TOTAL NPV at
3%
Costs $5,225 $475 $475 $475 $475 $475 $475 $475 $475 $475 $475 $475Benefits: Avoided Crash Costs $2,954 $2,954 $2,954 $2,954 $2,954 $2,954 $2,954 $2,954 $2,954 $2,954 $2,954 $2,954
Total Costs (PV at 3%) $5,073 $448 $435 $422 $410 $398 $386 $375 $364 $353 $343 $333 $9,340
Total Benefits (PV at 3%) $2,868 $2,785 $2,704 $2,625 $2,548 $2,474 $2,402 $2,332 $2,264 $2,198 $2,134 $2,072 $29,407
Benefit/Cost Ratio 3.1
Precision Docking and Curb AvoidanceIn this use case, sensor information is employed to assist bus drivers in aligning vehicles with the boarding platform or curb at bus stops, and to avoid curb strikes during turns. The primary benefit is typically characterized as improved ease of boarding and alighting. The partially automated system can achieve precise alignment between the vehicle and boarding platform much more consistently than human operators, an enhancement that is particularly valuable for riders with mobility impairments. More precise docking can also reduce the frequency of injuries during boarding and alighting that are related to the gap between the vehicle and the curb or platform. Benefits to the transit agency
APPENDIX D: TRANSIT AUTOMATION BENEFIT-COST ANALYSIS REPORT
FEDERAL TRANSIT ADMINISTRATION 90
include reduced wheel and tire damage from curb strikes, reduced driver stress and workload, and improved customer satisfaction. The literature on this topic also mentions the potential for reduced run times on bus routes with precision docking,28 in part because the ADAS reduces the time required for maneuvering and because the more precise docking can speed the boarding process and reduce dwell times.29
As noted above, this analysis focuses primarily on the internal business case for the transit agency. An improved boarding experience, although valuable to many passengers, generally does not produce direct cost savings for the transit agency, and its impacts on ridership and revenue are rather diffuse and difficult to quantify.
Improvements in dwell time and overall running time have a more direct impact on agency costs, as the small time savings can add up over the course of the day and allow for possible savings in labor and fuel. (Alternatively, the time savings could be converted into additional service, for example if the cumulative savings in dwell time permits an additional round-trip to be built into the schedule.) However, there is inconsistent evidence as to whether these time savings actually occur. FTA’s Vehicle Assist and Automation (VAA) program initially assumed that a time savings in the range of 5% might be achievable, based on limited observations from a similar system in Rouen, France. However, actual results from the VAA deployment in Eugene, Oregon, showed slight increases in average run times during periods when the VAA was engaged vs. manual operation.30 The Eugene deployment included two ADAS applications, including lane-keeping and precision docking, but presented information on changes in dwell time, if any, that were experienced with the ADAS functions enabled. A conservative assumption would be that precision docking itself has little to no impact on operating speeds and running times. This would be consistent with BRT planning guidance which, although noting the potential for improved dwell times, does not specifically identify precision docking among the design elements that may improve run times or ridership.31
Another potential benefit to transit agencies would be reduced costs associated with curb strikes, including tire and wheel damage. Analysis of the VAA deployment in Eugene found that the precision docking system reduced impacts with station platforms and reduced tire wear. However, these impacts were not
28 Mitretek (2005), “Multimodal Vehicle Assist and Automation: Transit Operating Scenario Analysis,” Mitretek Systems, prepared for FHWA and FTA, April.
29 TRB (2007), “Bus Rapid Transit Practitioner’s Guide,” TCRP Report 118, 1-256, Transportation Research Board, Washington, DC. https://nacto.org/docs/usdg/tcrp118brt_practitioners_kittleson.pdf.30 FTA (2016a), “Vehicle Assist and Automation (VAA) Demonstration Evaluation Report,” Report 0093, Federal Transit Administration, U.S. Department of Transportation, January. https://www. transit.dot.gov/sites/fta.dot.gov/files/docs/FTA_Report_No._0093.pdf.
31 TRB (2007).
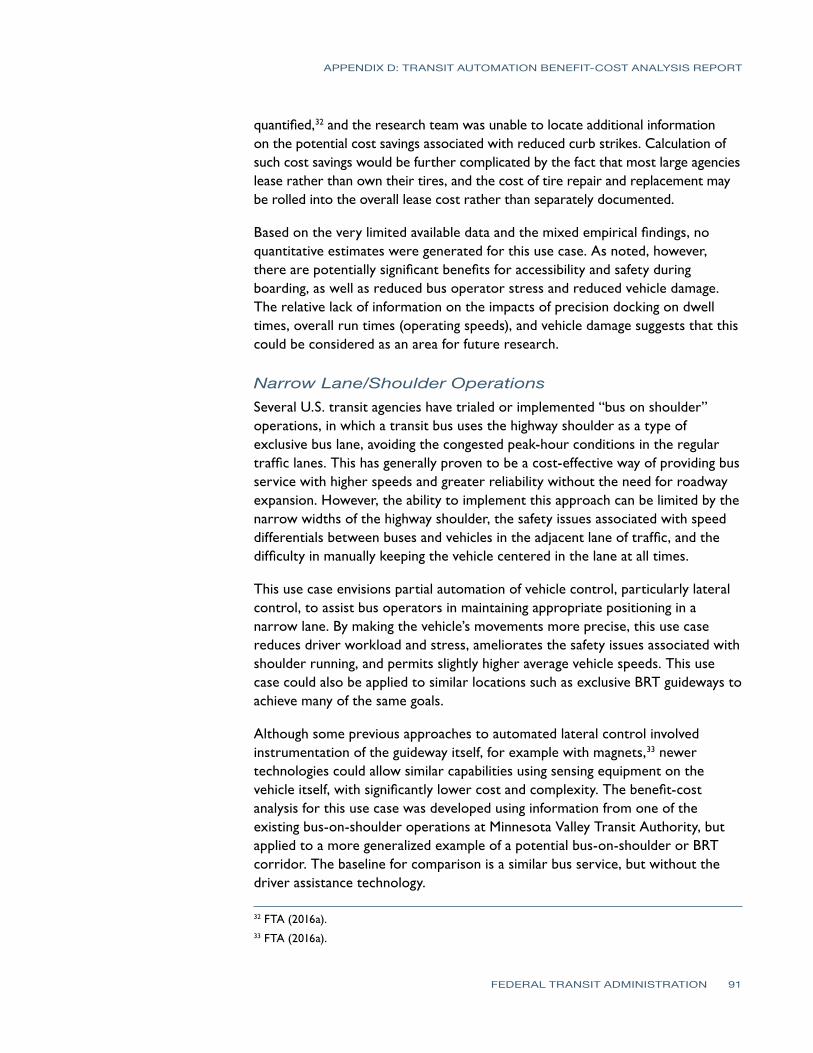
APPENDIX D: TRANSIT AUTOMATION BENEFIT-COST ANALYSIS REPORT
FEDERAL TRANSIT ADMINISTRATION 91
quantified,32 and the research team was unable to locate additional information on the potential cost savings associated with reduced curb strikes. Calculation of such cost savings would be further complicated by the fact that most large agencies lease rather than own their tires, and the cost of tire repair and replacement may be rolled into the overall lease cost rather than separately documented.
Based on the very limited available data and the mixed empirical findings, no quantitative estimates were generated for this use case. As noted, however, there are potentially significant benefits for accessibility and safety during boarding, as well as reduced bus operator stress and reduced vehicle damage. The relative lack of information on the impacts of precision docking on dwell times, overall run times (operating speeds), and vehicle damage suggests that this could be considered as an area for future research.
Narrow Lane/Shoulder OperationsSeveral U.S. transit agencies have trialed or implemented “bus on shoulder” operations, in which a transit bus uses the highway shoulder as a type of exclusive bus lane, avoiding the congested peak-hour conditions in the regular traffic lanes. This has generally proven to be a cost-effective way of providing bus service with higher speeds and greater reliability without the need for roadway expansion. However, the ability to implement this approach can be limited by the narrow widths of the highway shoulder, the safety issues associated with speed differentials between buses and vehicles in the adjacent lane of traffic, and the difficulty in manually keeping the vehicle centered in the lane at all times.
This use case envisions partial automation of vehicle control, particularly lateral control, to assist bus operators in maintaining appropriate positioning in a narrow lane. By making the vehicle’s movements more precise, this use case reduces driver workload and stress, ameliorates the safety issues associated with shoulder running, and permits slightly higher average vehicle speeds. This use case could also be applied to similar locations such as exclusive BRT guideways to achieve many of the same goals.
Although some previous approaches to automated lateral control involved instrumentation of the guideway itself, for example with magnets,33 newer technologies could allow similar capabilities using sensing equipment on the vehicle itself, with significantly lower cost and complexity. The benefit-cost analysis for this use case was developed using information from one of the existing bus-on-shoulder operations at Minnesota Valley Transit Authority, but applied to a more generalized example of a potential bus-on-shoulder or BRT corridor. The baseline for comparison is a similar bus service, but without the driver assistance technology.
32 FTA (2016a).33 FTA (2016a).
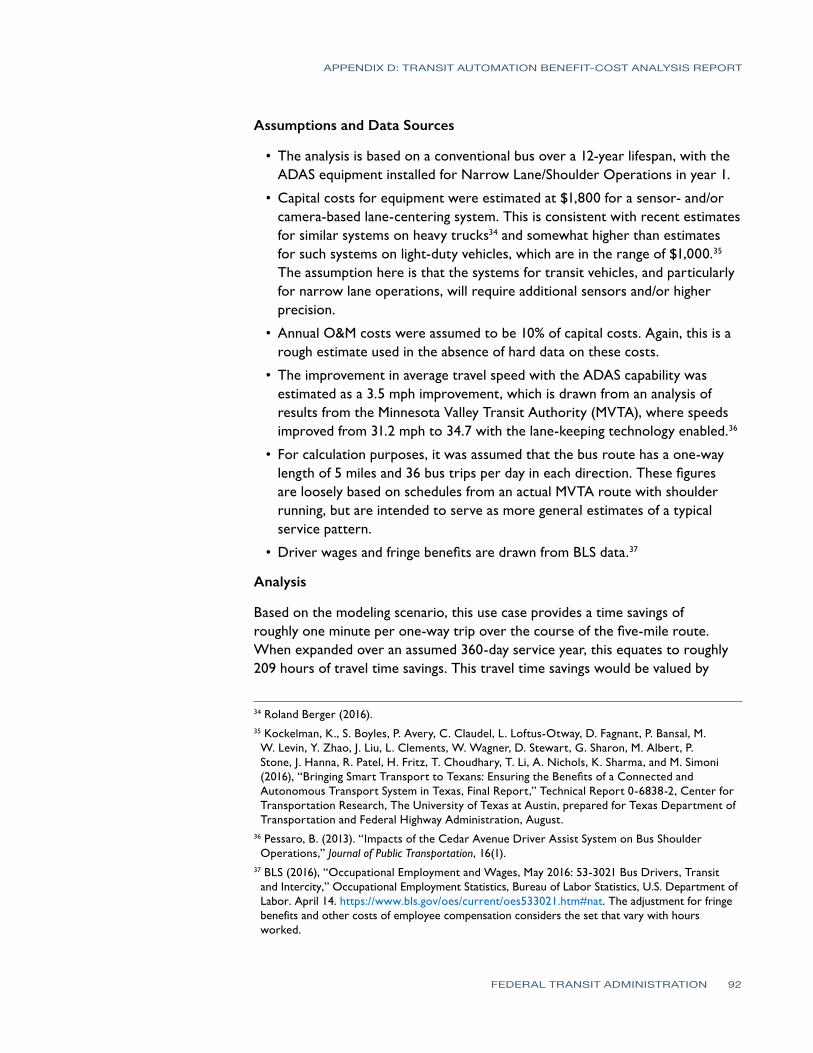
APPENDIX D: TRANSIT AUTOMATION BENEFIT-COST ANALYSIS REPORT
FEDERAL TRANSIT ADMINISTRATION 92
Assumptions and Data Sources
• The analysis is based on a conventional bus over a 12-year lifespan, with theADAS equipment installed for Narrow Lane/Shoulder Operations in year 1.
• Capital costs for equipment were estimated at $1,800 for a sensor- and/orcamera-based lane-centering system. This is consistent with recent estimatesfor similar systems on heavy trucks34 and somewhat higher than estimatesfor such systems on light-duty vehicles, which are in the range of $1,000.35
The assumption here is that the systems for transit vehicles, and particularlyfor narrow lane operations, will require additional sensors and/or higherprecision.
• Annual O&M costs were assumed to be 10% of capital costs. Again, this is arough estimate used in the absence of hard data on these costs.
• The improvement in average travel speed with the ADAS capability wasestimated as a 3.5 mph improvement, which is drawn from an analysis ofresults from the Minnesota Valley Transit Authority (MVTA), where speedsimproved from 31.2 mph to 34.7 with the lane-keeping technology enabled.36
• For calculation purposes, it was assumed that the bus route has a one-waylength of 5 miles and 36 bus trips per day in each direction. These figuresare loosely based on schedules from an actual MVTA route with shoulderrunning, but are intended to serve as more general estimates of a typicalservice pattern.
• Driver wages and fringe benefits are drawn from BLS data.37
Analysis
Based on the modeling scenario, this use case provides a time savings of roughly one minute per one-way trip over the course of the five-mile route. When expanded over an assumed 360-day service year, this equates to roughly 209 hours of travel time savings. This travel time savings would be valued by
34 Roland Berger (2016).35 Kockelman, K., S. Boyles, P. Avery, C. Claudel, L. Loftus-Otway, D. Fagnant, P. Bansal, M. W. Levin, Y. Zhao, J. Liu, L. Clements, W. Wagner, D. Stewart, G. Sharon, M. Albert, P.Stone, J. Hanna, R. Patel, H. Fritz, T. Choudhary, T. Li, A. Nichols, K. Sharma, and M. Simoni(2016), “Bringing Smart Transport to Texans: Ensuring the Benefits of a Connected andAutonomous Transport System in Texas, Final Report,” Technical Report 0-6838-2, Center forTransportation Research, The University of Texas at Austin, prepared for Texas Department ofTransportation and Federal Highway Administration, August.
36 Pessaro, B. (2013). “Impacts of the Cedar Avenue Driver Assist System on Bus Shoulder Operations,” Journal of Public Transportation, 16(1).
37 BLS (2016), “Occupational Employment and Wages, May 2016: 53-3021 Bus Drivers, Transit and Intercity,” Occupational Employment Statistics, Bureau of Labor Statistics, U.S. Department of Labor. April 14. https://www.bls.gov/oes/current/oes533021.htm#nat. The adjustment for fringe benefits and other costs of employee compensation considers the set that vary with hours worked.
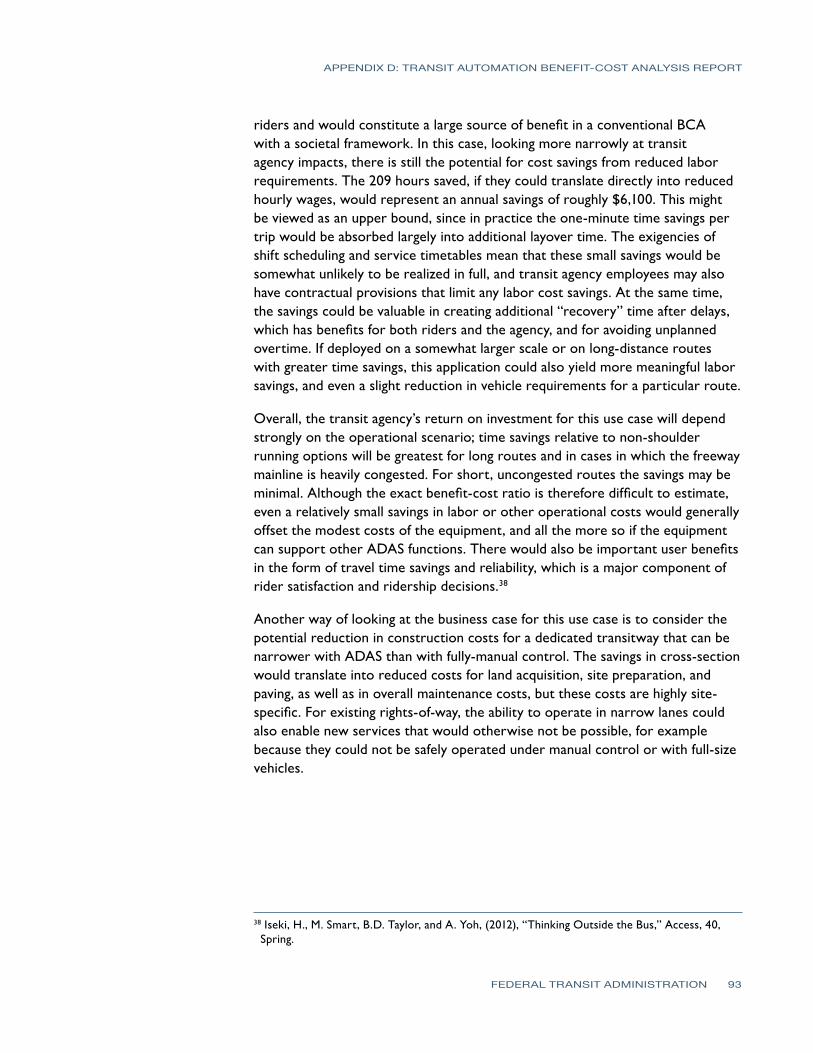
APPENDIX D: TRANSIT AUTOMATION BENEFIT-COST ANALYSIS REPORT
FEDERAL TRANSIT ADMINISTRATION 93
riders and would constitute a large source of benefit in a conventional BCA with a societal framework. In this case, looking more narrowly at transit agency impacts, there is still the potential for cost savings from reduced labor requirements. The 209 hours saved, if they could translate directly into reduced hourly wages, would represent an annual savings of roughly $6,100. This might be viewed as an upper bound, since in practice the one-minute time savings per trip would be absorbed largely into additional layover time. The exigencies of shift scheduling and service timetables mean that these small savings would be somewhat unlikely to be realized in full, and transit agency employees may also have contractual provisions that limit any labor cost savings. At the same time, the savings could be valuable in creating additional “recovery” time after delays, which has benefits for both riders and the agency, and for avoiding unplanned overtime. If deployed on a somewhat larger scale or on long-distance routes with greater time savings, this application could also yield more meaningful labor savings, and even a slight reduction in vehicle requirements for a particular route.
Overall, the transit agency’s return on investment for this use case will depend strongly on the operational scenario; time savings relative to non-shoulder running options will be greatest for long routes and in cases in which the freeway mainline is heavily congested. For short, uncongested routes the savings may be minimal. Although the exact benefit-cost ratio is therefore difficult to estimate, even a relatively small savings in labor or other operational costs would generally offset the modest costs of the equipment, and all the more so if the equipment can support other ADAS functions. There would also be important user benefits in the form of travel time savings and reliability, which is a major component of rider satisfaction and ridership decisions.38
Another way of looking at the business case for this use case is to consider the potential reduction in construction costs for a dedicated transitway that can be narrower with ADAS than with fully-manual control. The savings in cross-section would translate into reduced costs for land acquisition, site preparation, and paving, as well as in overall maintenance costs, but these costs are highly site-specific. For existing rights-of-way, the ability to operate in narrow lanes could also enable new services that would otherwise not be possible, for example because they could not be safely operated under manual control or with full-size vehicles.
38 Iseki, H., M. Smart, B.D. Taylor, and A. Yoh, (2012), “Thinking Outside the Bus,” Access, 40, Spring.
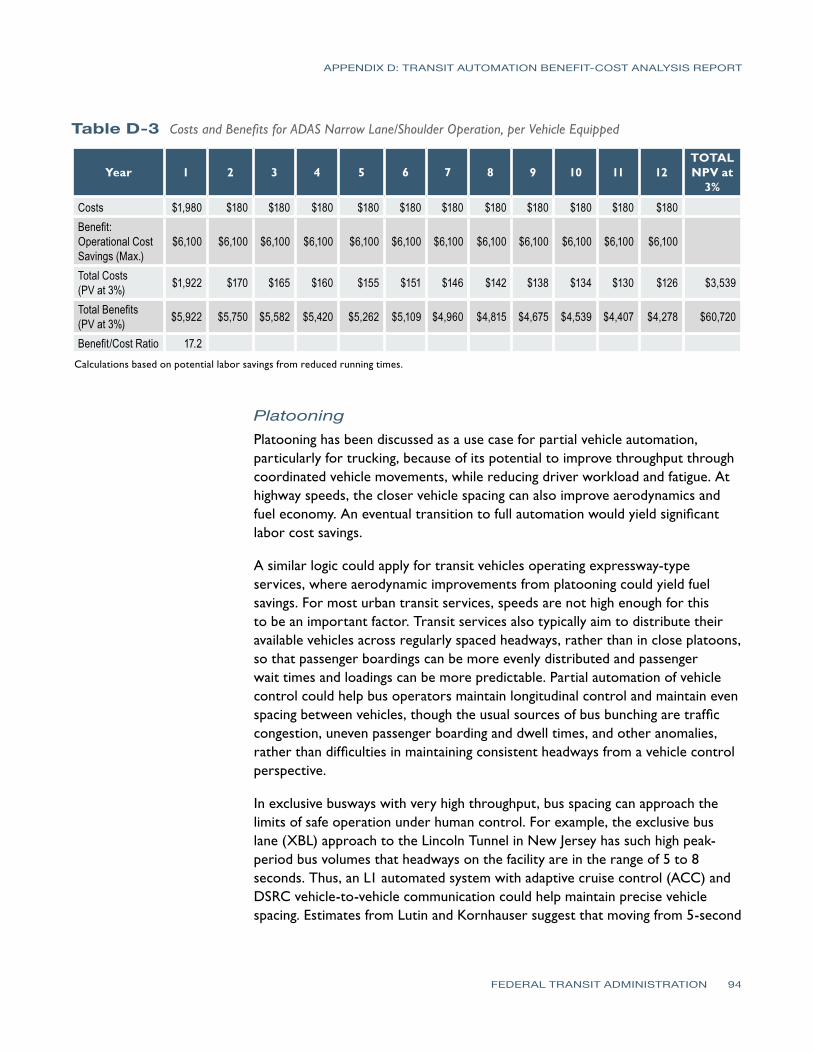
APPENDIX D: TRANSIT AUTOMATION BENEFIT-COST ANALYSIS REPORT
FEDERAL TRANSIT ADMINISTRATION 94
Table D-3 Costs and Benefits for ADAS Narrow Lane/Shoulder Operation, per Vehicle Equipped
Year 1 2 3 4 5 6 7 8 9 10 11 12TOTAL NPV at
3%
Costs $1,980 $180 $180 $180 $180 $180 $180 $180 $180 $180 $180 $180Benefit: Operational Cost Savings (Max.)
$6,100 $6,100 $6,100 $6,100 $6,100 $6,100 $6,100 $6,100 $6,100 $6,100 $6,100 $6,100
Total Costs (PV at 3%) $1,922 $170 $165 $160 $155 $151 $146 $142 $138 $134 $130 $126 $3,539
Total Benefits (PV at 3%) $5,922 $5,750 $5,582 $5,420 $5,262 $5,109 $4,960 $4,815 $4,675 $4,539 $4,407 $4,278 $60,720
Benefit/Cost Ratio 17.2 Calculations based on potential labor savings from reduced running times.
PlatooningPlatooning has been discussed as a use case for partial vehicle automation, particularly for trucking, because of its potential to improve throughput through coordinated vehicle movements, while reducing driver workload and fatigue. At highway speeds, the closer vehicle spacing can also improve aerodynamics and fuel economy. An eventual transition to full automation would yield significant labor cost savings.
A similar logic could apply for transit vehicles operating expressway-type services, where aerodynamic improvements from platooning could yield fuel savings. For most urban transit services, speeds are not high enough for this to be an important factor. Transit services also typically aim to distribute their available vehicles across regularly spaced headways, rather than in close platoons, so that passenger boardings can be more evenly distributed and passenger wait times and loadings can be more predictable. Partial automation of vehicle control could help bus operators maintain longitudinal control and maintain even spacing between vehicles, though the usual sources of bus bunching are traffic congestion, uneven passenger boarding and dwell times, and other anomalies, rather than difficulties in maintaining consistent headways from a vehicle control perspective.
In exclusive busways with very high throughput, bus spacing can approach the limits of safe operation under human control. For example, the exclusive bus lane (XBL) approach to the Lincoln Tunnel in New Jersey has such high peak-period bus volumes that headways on the facility are in the range of 5 to 8 seconds. Thus, an L1 automated system with adaptive cruise control (ACC) and DSRC vehicle-to-vehicle communication could help maintain precise vehicle spacing. Estimates from Lutin and Kornhauser suggest that moving from 5-second
APPENDIX D: TRANSIT AUTOMATION BENEFIT-COST ANALYSIS REPORT
FEDERAL TRANSIT ADMINISTRATION 95
headways to 3-second headways on the XBL would increase hourly bus capacity from 720 vehicles to 1,200 vehicles, thereby increasing hourly passenger capacity from 41,040 to 68,400, a nearly 67% increase.39
Implementing platooning through ADAS would require onboard equipment similar to the Smooth Acceleration and Braking use case, namely an ACC system ($1,800 per vehicle) and DSRC ($350 per vehicle). Wayside infrastructure could also be required to provide overall traffic management and positioning.
In calculating the business case for platooning, the costs of achieving capacity expansion through ADAS might be compared against the cost of achieving it through other approaches, such as larger buses (articulated or double-decker), expansion of the facility, alternative routes or services, or other investments. Costs for these alternatives would be highly site-specific, making it difficult to present a meaningful benefit-cost analysis. Moreover, very few transit facilities or services in the U.S. have such frequent service as to require this kind of approach. In those locations, however, the platooning use case could be highly cost-effective relative to more infrastructure-intensive alternatives. The platooning system could also have safety benefits in the form of reduced crashes or hard braking events, along with improved fuel economy (similar to the impacts described above under Smooth Acceleration and Braking). Additional research may be needed to understand the potential applications of platooning and their impacts. An L1 platooning use case could also lay the groundwork for a future Level 4 and Level 5 (L4/L5) fully-driverless system, which would create a wide range of operational flexibilities and cost savings.
Automated ShuttlesThe automated shuttle technology package uses a small, L4 shuttle vehicle, such as the low-speed automated buses available from EasyMile, Local Motors, and Navya. As L4 vehicles, these shuttles do not require a human operator, although many of the early demonstrations include an on-board human attendant to observe passengers, record data, answer questions, and serve as a safety operator if needed. Beyond initial prototype testing, these vehicles have been designed to run without an operator, which may enable additional transit services that would be cost prohibitive to provide if a human driver were required. Due to their low speeds (≤ 25 mph), these vehicles may be limited to operating in certain (limited speed) environments, such as parking lots, busways, campuses, downtown districts, and retirement communities.
From a user perspective, passengers may be attracted by the initial novelty in using automated technology, though the absence of a driver is a major departure
39 Lutin, J. M., and A. L. Kornhauser (2014), “Application of Autonomous Driving Technology to Transit: Functional Capabilities for Safety and Capacity,” presentation to 93rd Annual TRB Meeting, Washington, DC.
APPENDIX D: TRANSIT AUTOMATION BENEFIT-COST ANALYSIS REPORT
FEDERAL TRANSIT ADMINISTRATION 96
from normal transit operations, and could lead to concerns about trust and perceived safety. With the current generation of vehicles, the ride may feel slow compared to some other options (e.g., driving or traditional transit). The service can replace short driving trips, bicycle trips, or long walks to access local destinations or transit, which users may find beneficial.
From an operator perspective, automated shuttles are entirely new technology and are still in development. Early adopters must be comfortable with some uncertainty regarding cost and performance. Since the shuttles will not require on-board operators, their use may raise concern from labor unions. New skills may also be required to plan for, operate, and maintain these shuttles. If the shuttles help riders to access high-capacity transit options, they may improve overall system effectiveness and ridership.
While low-speed automated shuttles are flexible and could be used to provide service for a variety of situations, the use cases that were developed for this technology package and considered here are:
• Circulators: fixed-route, fixed-waypoint service (i.e., fully-fixed route ora route that provides some deviation but always serves a set of definedwaypoints)
• Feeder service to high-capacity transit lines
These service types are distinct in terms of their passenger profiles and their role in the regional transit network, but for initial benefit-cost purposes they can be considered as variations on the same use case—i.e., they both connect two points, with the distinction being that in the case of feeder service, one of the two points is a high-capacity transit facility. The analysis below is based on a simplified model of a transit service that could be offered using the L4 automated shuttle concept, relative to a baseline of providing the same service with conventional vehicles and drivers. The analysis framework used for this simple use case could be expanded to include services with more stops and more complex routes.
Circulator or Feeder Bus ServiceThis analysis was modeled at the route level using information from existing and planned test deployments of L4 shuttle vehicles. Specifically, the benefit-cost analysis for this use case envisions a two-mile transit route with two stops, one at each end of the route. This concept is depicted in Figure D-1 as a two-mile connection between an airport terminal and a rail station. In practice, this type of route could represent a connection between any two activity centers or transit stops, such as a between a central business district, airport, shopping center, or office park.
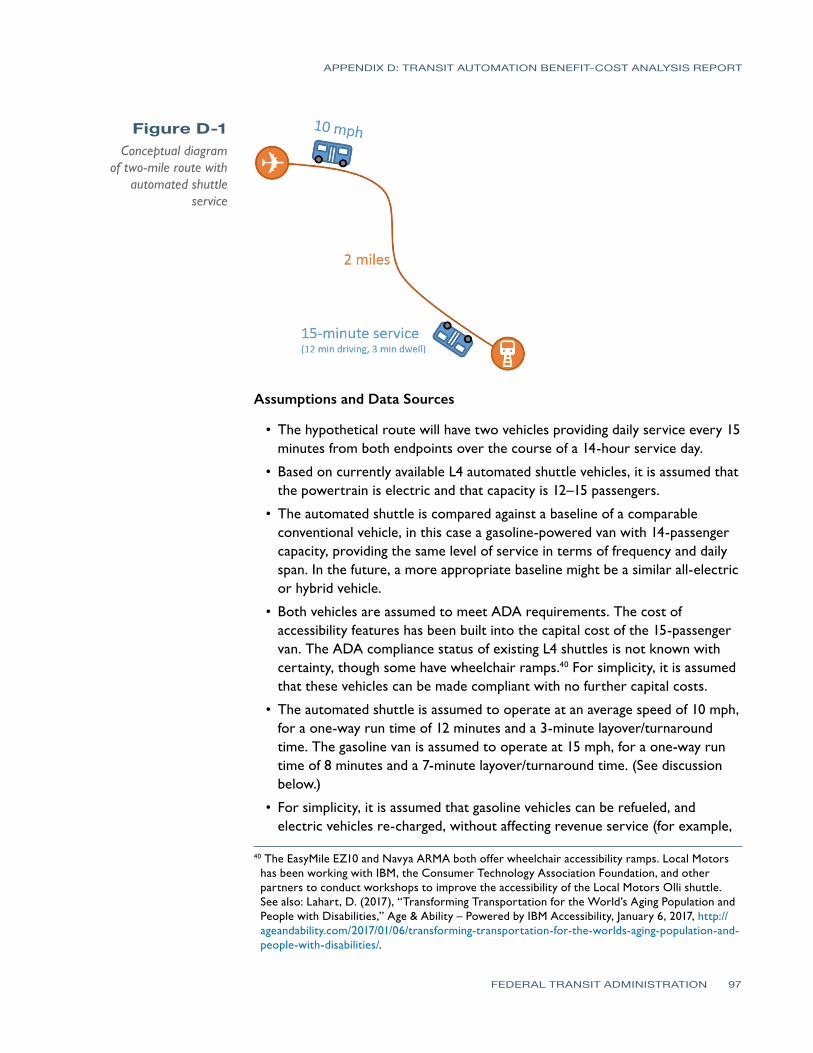
APPENDIX D: TRANSIT AUTOMATION BENEFIT-COST ANALYSIS REPORT
FEDERAL TRANSIT ADMINISTRATION 97
Assumptions and Data Sources
• The hypothetical route will have two vehicles providing daily service every 15 minutes from both endpoints over the course of a 14-hour service day.
• Based on currently available L4 automated shuttle vehicles, it is assumed that the powertrain is electric and that capacity is 12–15 passengers.
• The automated shuttle is compared against a baseline of a comparable conventional vehicle, in this case a gasoline-powered van with 14-passenger capacity, providing the same level of service in terms of frequency and daily span. In the future, a more appropriate baseline might be a similar all-electric or hybrid vehicle.
• Both vehicles are assumed to meet ADA requirements. The cost of accessibility features has been built into the capital cost of the 15-passenger van. The ADA compliance status of existing L4 shuttles is not known with certainty, though some have wheelchair ramps.40 For simplicity, it is assumed that these vehicles can be made compliant with no further capital costs.
• The automated shuttle is assumed to operate at an average speed of 10 mph, for a one-way run time of 12 minutes and a 3-minute layover/turnaround time. The gasoline van is assumed to operate at 15 mph, for a one-way run time of 8 minutes and a 7-minute layover/turnaround time. (See discussion below.)
• For simplicity, it is assumed that gasoline vehicles can be refueled, and electric vehicles re-charged, without affecting revenue service (for example,
Figure D-1Conceptual diagram
of two-mile route with automated shuttle
service
40 The EasyMile EZ10 and Navya ARMA both offer wheelchair accessibility ramps. Local Motors has been working with IBM, the Consumer Technology Association Foundation, and other partners to conduct workshops to improve the accessibility of the Local Motors Olli shuttle. See also: Lahart, D. (2017), “Transforming Transportation for the World’s Aging Population and People with Disabilities,” Age & Ability – Powered by IBM Accessibility, January 6, 2017, http://ageandability.com/2017/01/06/transforming-transportation-for-the-worlds-aging-population-and-people-with-disabilities/.
APPENDIX D: TRANSIT AUTOMATION BENEFIT-COST ANALYSIS REPORT
FEDERAL TRANSIT ADMINISTRATION 98
at the end of the day). Both vehicles have adequate range for the 14-hour, 112-mile service day in this scenario, based on listed vehicle specifications.
• The analysis includes a scenario with an onboard attendant to assistpassengers (“staffed”) and a scenario with no operator (“unstaffed”).
• The total cost of service provision, including vehicle purchase/depreciation,maintenance, refueling, and labor, is compared for the automated vehicle(AV) and non-automated vehicle options over a 10-year period. The 10-yearperiod is equal to the lifespan of the automated shuttle. For the gasoline van,recapitalization is assumed at the 5-year mark, at roughly 200,000 revenuemiles.
• Fuel cost calculations are estimated using EIA forecasts of energy priceselectricity and gasoline.41
• Capital costs for the vehicles are estimated at $200,000 for automatedshuttles and $45,000 for vans. These costs were based on a market survey oflow-speed automated shuttles and 15-passenger vans.42
• The automated vehicles also require an estimated $15,000 for routeprogramming and mapping.
• Costs for the automated vehicle do not include field testing, safetyevaluations, or staff training. These items can be significant whenimplementing new technologies, but cost should fall over time as theautomated shuttle technology becomes more mainstream.
• Additional capital costs for electric shuttle recharging equipment wereestimated at $22,558 for each charging station.43
• Maintenance and insurance costs for the shuttles were based on modelparameters for a similar analysis of an automated demand-responsivetransport system;44 they total $5,100 per year. Costs for the vans were basedon typical gasoline van costs and total $1,080 for insurance and $849 formaintenance.45
41 EIA (2017).42 Cost estimates for the automated shuttles are subject to much more variability and uncertainty than for conventional 15-passenger vans. The estimate for automated shuttles used here is in the low-to-average portion of the range of cost estimates reviewed by the Volpe Center team.
43 Pessaro, B. (2016), “Evaluation of Automated Vehicle Technology for Transit – 2016 Update,” Center for Urban Transportation Research, University of South Florida. https://www.nctr.usf.edu/wp-content/uploads/2016/04/77060-21-Evaluation-of-Automated-Vehicle-Technology-for-Transit-2016-Update.pdf.
44 Winter, K., O. Cats, G. Homem de Almeida Correia, and B. van Arem (2016), “Designing an Automated Demand-Responsive Transport System: Fleet Size and Performance Analysis for a Campus–Train Station Service.” Transportation Research Record, 2542, 75–83. http://trrjournalonline.trb.org/doi/abs/10.3141/2542-09.
45 Carpenter (2017), “Cost and Feature Comparisons between 15-Passenger Vans & 15-Passenger Buses”.
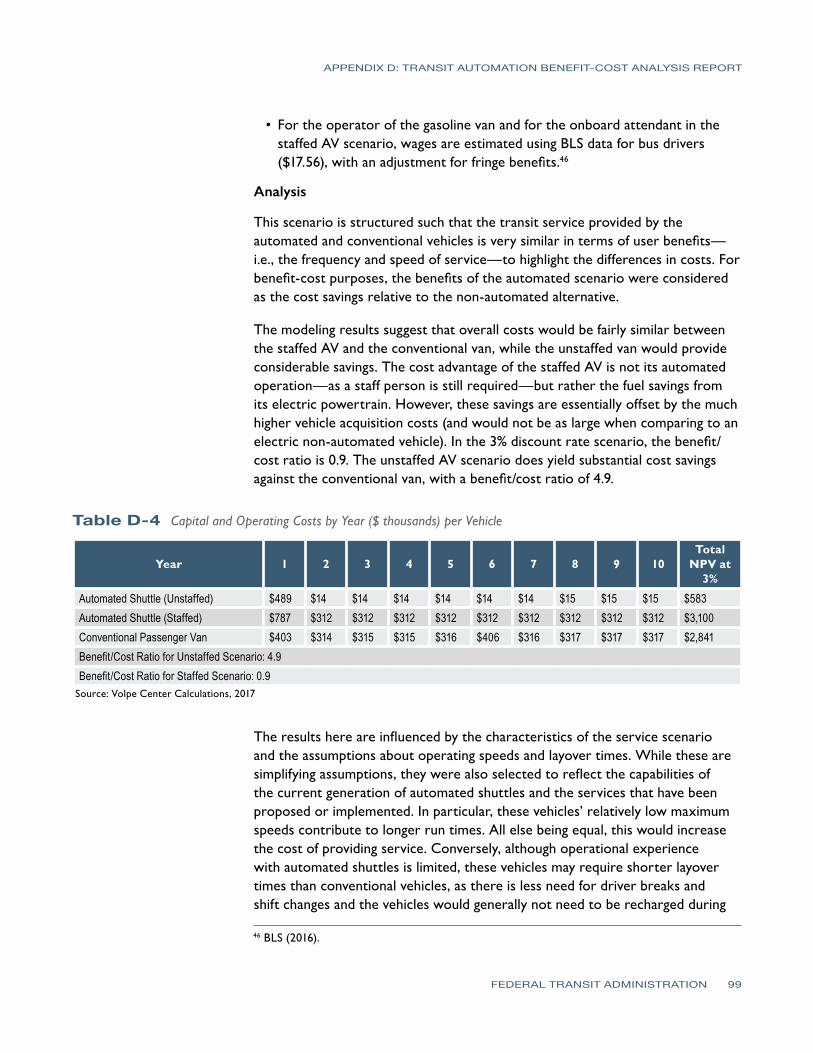
APPENDIX D: TRANSIT AUTOMATION BENEFIT-COST ANALYSIS REPORT
FEDERAL TRANSIT ADMINISTRATION 99
• For the operator of the gasoline van and for the onboard attendant in thestaffed AV scenario, wages are estimated using BLS data for bus drivers($17.56), with an adjustment for fringe benefits.46
Analysis
This scenario is structured such that the transit service provided by the automated and conventional vehicles is very similar in terms of user benefits—i.e., the frequency and speed of service—to highlight the differences in costs. Forbenefit-cost purposes, the benefits of the automated scenario were consideredas the cost savings relative to the non-automated alternative.
The modeling results suggest that overall costs would be fairly similar between the staffed AV and the conventional van, while the unstaffed van would provide considerable savings. The cost advantage of the staffed AV is not its automated operation—as a staff person is still required—but rather the fuel savings from its electric powertrain. However, these savings are essentially offset by the much higher vehicle acquisition costs (and would not be as large when comparing to an electric non-automated vehicle). In the 3% discount rate scenario, the benefit/cost ratio is 0.9. The unstaffed AV scenario does yield substantial cost savings against the conventional van, with a benefit/cost ratio of 4.9.
Table D-4 Capital and Operating Costs by Year ($ thousands) per Vehicle
Year 1 2 3 4 5 6 7 8 9 10Total
NPV at 3%
Automated Shuttle (Unstaffed) $489 $14 $14 $14 $14 $14 $14 $15 $15 $15 $583Automated Shuttle (Staffed) $787 $312 $312 $312 $312 $312 $312 $312 $312 $312 $3,100Conventional Passenger Van $403 $314 $315 $315 $316 $406 $316 $317 $317 $317 $2,841Benefit/Cost Ratio for Unstaffed Scenario: 4.9Benefit/Cost Ratio for Staffed Scenario: 0.9
Source: Volpe Center Calculations, 2017
The results here are influenced by the characteristics of the service scenario and the assumptions about operating speeds and layover times. While these are simplifying assumptions, they were also selected to reflect the capabilities of the current generation of automated shuttles and the services that have been proposed or implemented. In particular, these vehicles’ relatively low maximum speeds contribute to longer run times. All else being equal, this would increase the cost of providing service. Conversely, although operational experience with automated shuttles is limited, these vehicles may require shorter layover times than conventional vehicles, as there is less need for driver breaks and shift changes and the vehicles would generally not need to be recharged during
46 BLS (2016).

APPENDIX D: TRANSIT AUTOMATION BENEFIT-COST ANALYSIS REPORT
FEDERAL TRANSIT ADMINISTRATION 100
the service day. Their (generally) bidirectional design also allows the vehicle to be prepared for the next trip more quickly, without the need for a turnaround loop. In this analysis, the differences in operating speeds and required layover times were assumed to be fairly small and to cancel out, in the sense that the 15-minute service frequency could be achieved using two vehicles in both theautomated and conventional approaches. With some changes to assumptionsabout the route length, service frequency, or attainable speeds, the resultscould be significantly different. For example, a longer route with a greater speeddifferential between the L4 shuttle and the conventional vehicle could necessitateadditional automated vehicles on the route to maintain the 15-minute servicefrequency, raising costs significantly.
The staffed AV scenario was estimated to have slightly higher costs than a conventional van providing equivalent service, based on the characteristics of the hypothetical route and service scenario. In other scenarios, it may have a cost advantage. One example would be in an area with heavy traffic congestion (and/or low speed limits) where the AV’s lower maximum speed would not be a constraint, and where the gasoline-powered van would experience reduced fuel economy. In addition, there may be significant non-quantified benefits to the automated shuttle, such as the novelty of the automated shuttles and bolstering the transit agency’s image through the demonstration of advanced technologies. This use case also provides the ability to test automation functions and customer reactions in a relatively low-risk way.
Sensitivity testing with longer and shorter route lengths, as well as different service frequencies, indicated that the relative costs of the staffed automated shuttle, unstaffed automated shuttle, and the human operated 15-passenger van remained quite consistent across different scenarios. However, because the current generation of automated shuttles is limited to fairly low speeds, the cost advantage of the unstaffed shuttle would be eroded if the operating environment permitted the conventional van to operate at higher speeds, such as a 40-mph suburban arterial.
In that situation, the difference in operating speeds would be such that more than one automated shuttle could be required to provide the same service frequency as a single 15-passenger van. In Table D-5, various route lengths (1–10 miles) and average van speeds (10–40 mph) are shown along with the number of shuttles required (at 5 and 10 mph speeds) to provide the same level of service.
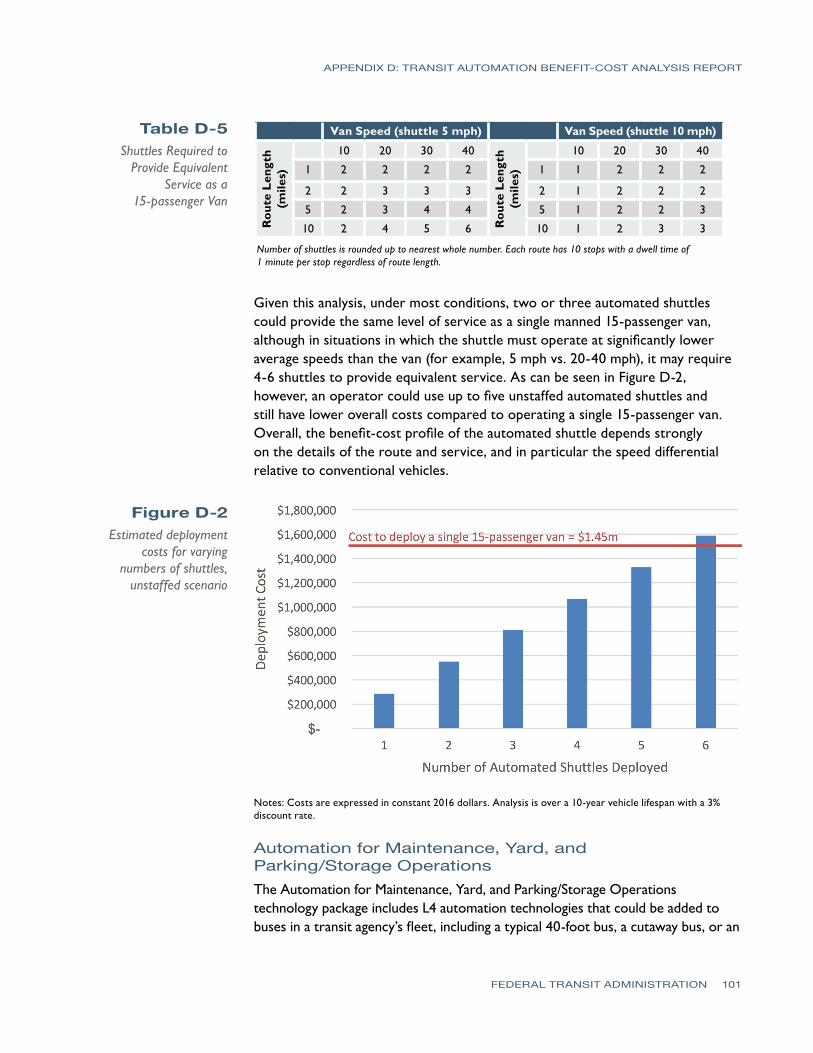
APPENDIX D: TRANSIT AUTOMATION BENEFIT-COST ANALYSIS REPORT
FEDERAL TRANSIT ADMINISTRATION 101
Van Speed (shuttle 5 mph) Van Speed (shuttle 10 mph)
10 20 30 40 10 20 30 40
1 2 2 2 2 1 1 2 2 2
2 2 3 3 3 2 1 2 2 2
5 2 3 4 4 5 1 2 2 3
10 2 4 5 6 10 1 2 3 3
Number of shuttles is rounded up to nearest whole number. Each route has 10 stops with a dwell time of 1 minute per stop regardless of route length.
Given this analysis, under most conditions, two or three automated shuttles could provide the same level of service as a single manned 15-passenger van, although in situations in which the shuttle must operate at significantly lower average speeds than the van (for example, 5 mph vs. 20-40 mph), it may require 4-6 shuttles to provide equivalent service. As can be seen in Figure D-2,however, an operator could use up to five unstaffed automated shuttles andstill have lower overall costs compared to operating a single 15-passenger van.Overall, the benefit-cost profile of the automated shuttle depends stronglyon the details of the route and service, and in particular the speed differentialrelative to conventional vehicles.
Rou
te L
engt
h (m
iles)
Rou
te L
engt
h (m
iles)
Table D-5Shuttles Required to
Provide Equivalent Service as a
15-passenger Van
Figure D-2Estimated deployment
costs for varying numbers of shuttles,
unstaffed scenario
Notes: Costs are expressed in constant 2016 dollars. Analysis is over a 10-year vehicle lifespan with a 3% discount rate.
Automation for Maintenance, Yard, and Parking/Storage OperationsThe Automation for Maintenance, Yard, and Parking/Storage Operations technology package includes L4 automation technologies that could be added to buses in a transit agency’s fleet, including a typical 40-foot bus, a cutaway bus, or an
APPENDIX D: TRANSIT AUTOMATION BENEFIT-COST ANALYSIS REPORT
FEDERAL TRANSIT ADMINISTRATION 102
articulated bus. These systems are not currently available, either as factory-installed or as retrofitted systems, so assumptions about system cost and performance parameters as listed below represent the best available estimates at this time.
As defined in this technology package, the operational design domain (ODD) for the vehicles comprises the maintenance facility. Outside of the ODD, the vehicles will still require a human operator; within the ODD, they will be capable of operating without anyone in the vehicle.
This technology package is primarily designed to increase efficiency in transit agency facilities, but could also potentially have implications for safety of operations within the yard. As with the other technology packages, this package uses inputs from sensor systems (e.g., cameras, radar units, and lidar units) to provide information for actuators controlling throttle, braking, and steering systems. These components can enable a variety of applications, including:
• Precision docking and maneuvering for bus wash, service bay, refueling, andother yard or maintenance operations
• Fully-automated driving for parking and recall
These applications can be used only within the ODD and may require intensive mapping of the facilities or, in some cases, reconfiguration of the infrastructure at the facility. Precision docking and maneuvering includes fully-automated operation for some maintenance and service activities, such as pulling through the bus wash or into the service bay. Maintenance staff will still be needed for some daily operations, such as refueling diesel buses, as well as for other maintenance activities.
From a user perspective, little will change—the buses will still have human operators during revenue service and will function identically to conventional buses. If the automation of maintenance and yard operations simplifies operator responsibilities and makes it easier to leave facilities on schedule, the system may potentially provide better on-time service, but the rider will not recognize the reason for the improvement. Similarly, if automation frees up more time for cleaning and other activities, riders could experience cleaner buses.
From an operator perspective, the technology will streamline the start and end of driving shifts. Labor expenses may be reduced if the fleet operator needs fewer yard staff or if the duration of vehicle pull-out and pull-in becomes shorter. The system may improve spatial efficiency of lots if buses can be parked closer together. Similarly, facilities such as parking areas, yards, and maintenance areas may be reconfigured or built with a reduced footprint due to higher precision in vehicle movements. Talent attraction, retention, and training issues may arise if the technology requires more advanced technology skills for maintenance staff. Yard safety may also be improved by reducing conflicts between vehicles and maintenance staff, pedestrians, fixed objects and other vehicles.
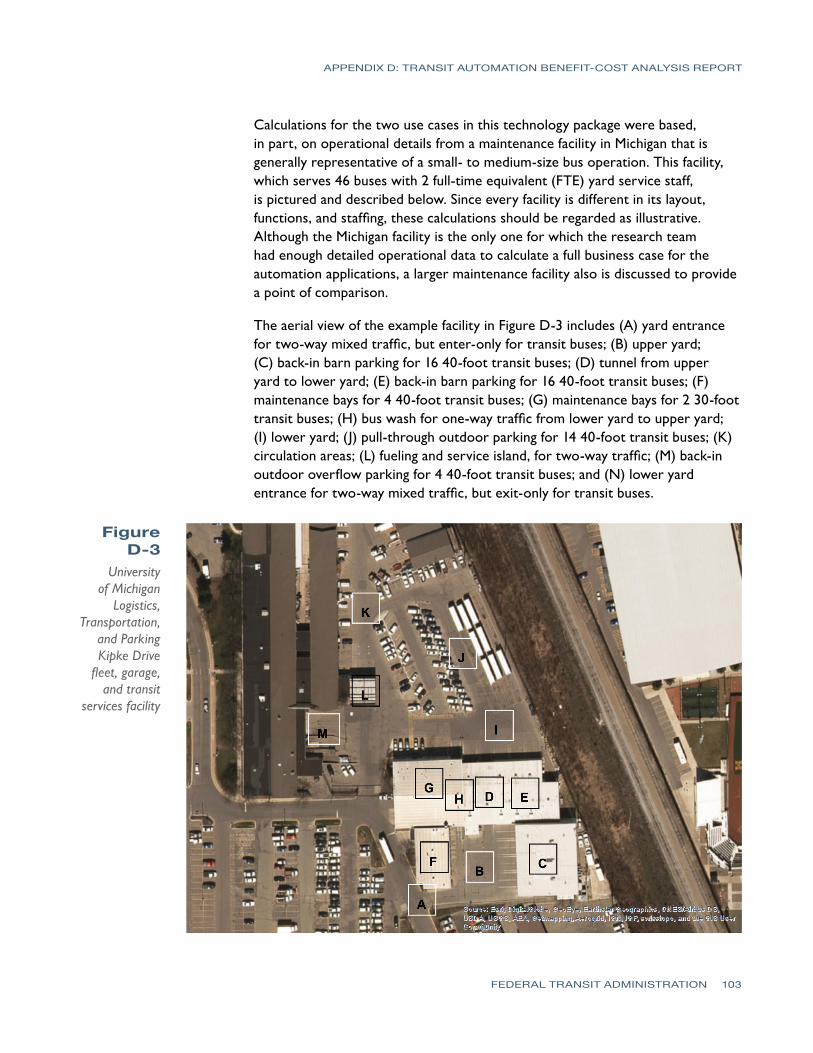
APPENDIX D: TRANSIT AUTOMATION BENEFIT-COST ANALYSIS REPORT
FEDERAL TRANSIT ADMINISTRATION 103
Calculations for the two use cases in this technology package were based, in part, on operational details from a maintenance facility in Michigan that is generally representative of a small- to medium-size bus operation. This facility, which serves 46 buses with 2 full-time equivalent (FTE) yard service staff, is pictured and described below. Since every facility is different in its layout, functions, and staffing, these calculations should be regarded as illustrative. Although the Michigan facility is the only one for which the research team had enough detailed operational data to calculate a full business case for the automation applications, a larger maintenance facility also is discussed to provide a point of comparison.
The aerial view of the example facility in Figure D-3 includes (A) yard entrance for two-way mixed traffic, but enter-only for transit buses; (B) upper yard; (C) back-in barn parking for 16 40-foot transit buses; (D) tunnel from upper yard to lower yard; (E) back-in barn parking for 16 40-foot transit buses; (F) maintenance bays for 4 40-foot transit buses; (G) maintenance bays for 2 30-foot transit buses; (H) bus wash for one-way traffic from lower yard to upper yard; (I) lower yard; (J) pull-through outdoor parking for 14 40-foot transit buses; (K) circulation areas; (L) fueling and service island, for two-way traffic; (M) back-in outdoor overflow parking for 4 40-foot transit buses; and (N) lower yard entrance for two-way mixed traffic, but exit-only for transit buses.
Figure D-3
University of Michigan
Logistics, Transportation,
and Parking Kipke Drive
fleet, garage, and transit
services facility
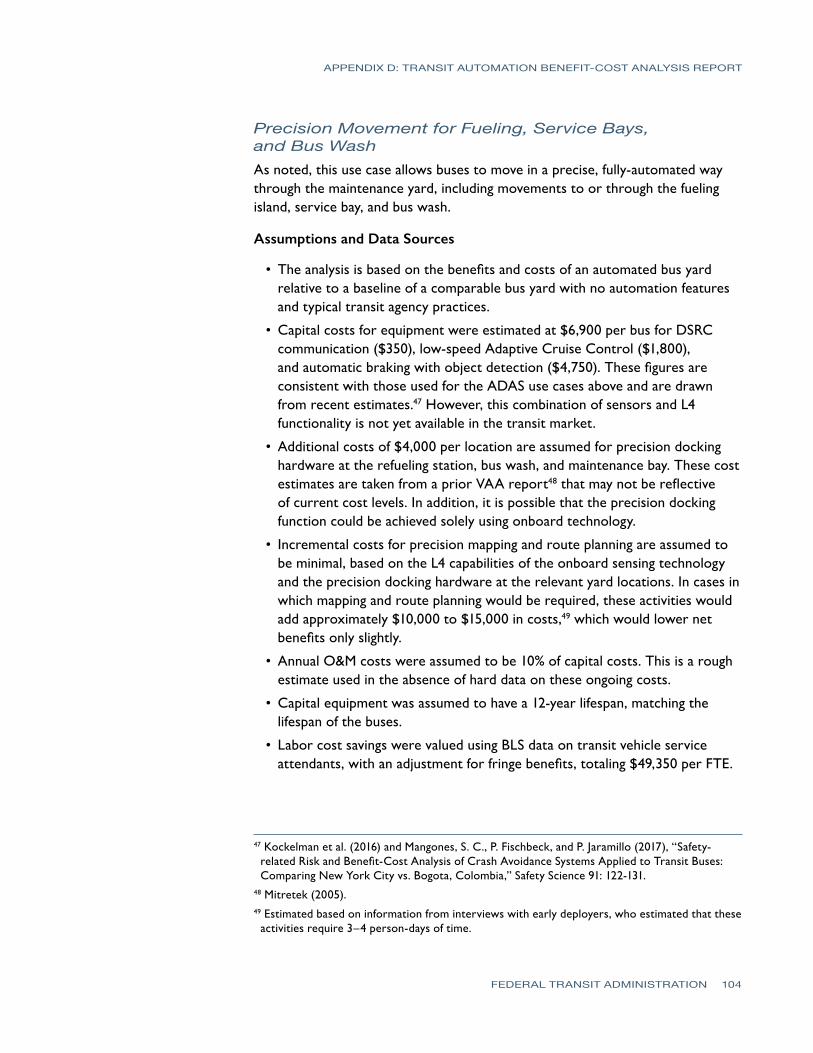
APPENDIX D: TRANSIT AUTOMATION BENEFIT-COST ANALYSIS REPORT
FEDERAL TRANSIT ADMINISTRATION 104
Precision Movement for Fueling, Service Bays, and Bus WashAs noted, this use case allows buses to move in a precise, fully-automated way through the maintenance yard, including movements to or through the fueling island, service bay, and bus wash.
Assumptions and Data Sources
• The analysis is based on the benefits and costs of an automated bus yardrelative to a baseline of a comparable bus yard with no automation featuresand typical transit agency practices.
• Capital costs for equipment were estimated at $6,900 per bus for DSRCcommunication ($350), low-speed Adaptive Cruise Control ($1,800),and automatic braking with object detection ($4,750). These figures areconsistent with those used for the ADAS use cases above and are drawnfrom recent estimates.47 However, this combination of sensors and L4functionality is not yet available in the transit market.
• Additional costs of $4,000 per location are assumed for precision dockinghardware at the refueling station, bus wash, and maintenance bay. These costestimates are taken from a prior VAA report48 that may not be reflectiveof current cost levels. In addition, it is possible that the precision dockingfunction could be achieved solely using onboard technology.
• Incremental costs for precision mapping and route planning are assumed tobe minimal, based on the L4 capabilities of the onboard sensing technologyand the precision docking hardware at the relevant yard locations. In cases inwhich mapping and route planning would be required, these activities wouldadd approximately $10,000 to $15,000 in costs,49 which would lower netbenefits only slightly.
• Annual O&M costs were assumed to be 10% of capital costs. This is a roughestimate used in the absence of hard data on these ongoing costs.
• Capital equipment was assumed to have a 12-year lifespan, matching thelifespan of the buses.
• Labor cost savings were valued using BLS data on transit vehicle serviceattendants, with an adjustment for fringe benefits, totaling $49,350 per FTE.
47 Kockelman et al. (2016) and Mangones, S. C., P. Fischbeck, and P. Jaramillo (2017), “Safety-related Risk and Benefit-Cost Analysis of Crash Avoidance Systems Applied to Transit Buses: Comparing New York City vs. Bogota, Colombia,” Safety Science 91: 122-131.
48 Mitretek (2005).49 Estimated based on information from interviews with early deployers, who estimated that these activities require 3–4 person-days of time.
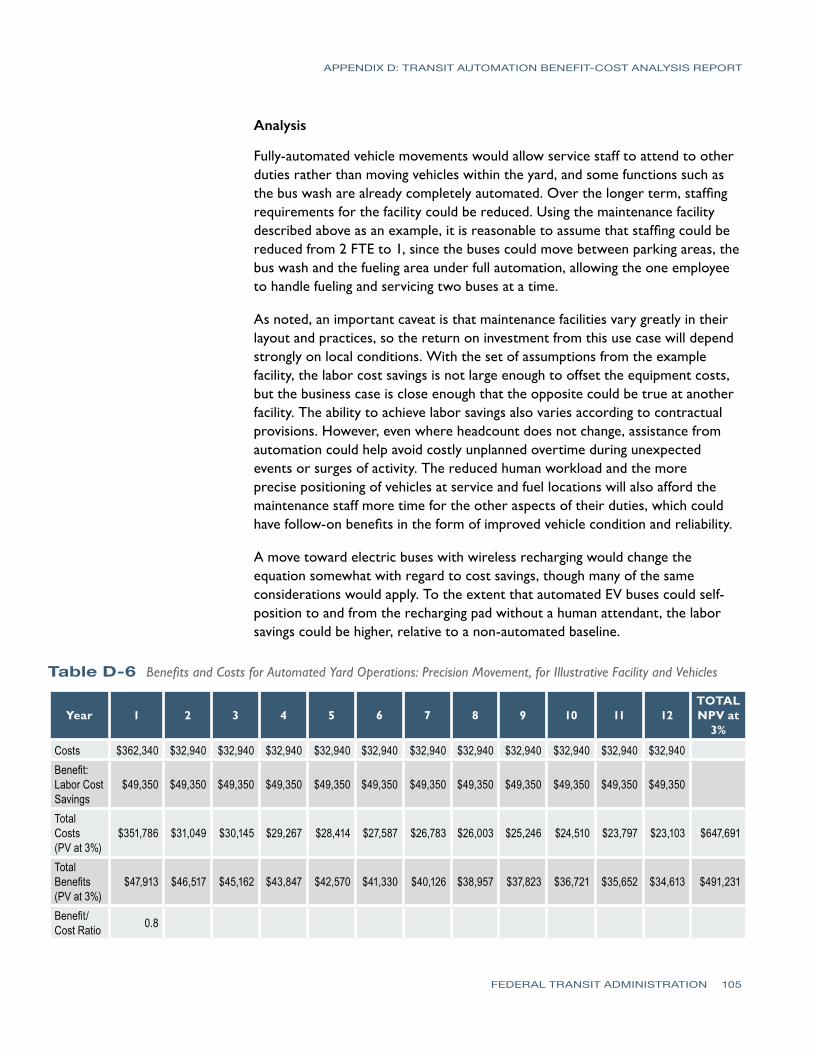
APPENDIX D: TRANSIT AUTOMATION BENEFIT-COST ANALYSIS REPORT
FEDERAL TRANSIT ADMINISTRATION 105
Analysis
Fully-automated vehicle movements would allow service staff to attend to other duties rather than moving vehicles within the yard, and some functions such as the bus wash are already completely automated. Over the longer term, staffing requirements for the facility could be reduced. Using the maintenance facility described above as an example, it is reasonable to assume that staffing could be reduced from 2 FTE to 1, since the buses could move between parking areas, the bus wash and the fueling area under full automation, allowing the one employee to handle fueling and servicing two buses at a time.
As noted, an important caveat is that maintenance facilities vary greatly in their layout and practices, so the return on investment from this use case will depend strongly on local conditions. With the set of assumptions from the example facility, the labor cost savings is not large enough to offset the equipment costs, but the business case is close enough that the opposite could be true at another facility. The ability to achieve labor savings also varies according to contractual provisions. However, even where headcount does not change, assistance from automation could help avoid costly unplanned overtime during unexpected events or surges of activity. The reduced human workload and the more precise positioning of vehicles at service and fuel locations will also afford the maintenance staff more time for the other aspects of their duties, which could have follow-on benefits in the form of improved vehicle condition and reliability.
A move toward electric buses with wireless recharging would change the equation somewhat with regard to cost savings, though many of the same considerations would apply. To the extent that automated EV buses could self-position to and from the recharging pad without a human attendant, the labor savings could be higher, relative to a non-automated baseline.
Table D-6 Benefits and Costs for Automated Yard Operations: Precision Movement, for Illustrative Facility and Vehicles
Year 1 2 3 4 5 6 7 8 9 10 11 12TOTAL NPV at
3%
Costs $362,340 $32,940 $32,940 $32,940 $32,940 $32,940 $32,940 $32,940 $32,940 $32,940 $32,940 $32,940Benefit: Labor Cost Savings
$49,350 $49,350 $49,350 $49,350 $49,350 $49,350 $49,350 $49,350 $49,350 $49,350 $49,350 $49,350
Total Costs (PV at 3%)
$351,786 $31,049 $30,145 $29,267 $28,414 $27,587 $26,783 $26,003 $25,246 $24,510 $23,797 $23,103 $647,691
Total Benefits (PV at 3%)
$47,913 $46,517 $45,162 $43,847 $42,570 $41,330 $40,126 $38,957 $37,823 $36,721 $35,652 $34,613 $491,231
Benefit/Cost Ratio 0.8
APPENDIX D: TRANSIT AUTOMATION BENEFIT-COST ANALYSIS REPORT
FEDERAL TRANSIT ADMINISTRATION 106
Automated Parking and RecallThis use case allows for buses to position themselves within the ODD of the maintenance facility in ways that optimize the flow of buses during pull-out and pull-in. Buses could move in a fully-automated mode from their parking space to the departure point at the start of the shift. Buses that are returning to the facility from revenue service could move in automated mode to a designated parking space. In both cases, the bus operator would not be required to be onboard or to operate the vehicle during this time, potentially creating a time savings that could be used for other activities (e.g., safety briefing, paperwork) or to reduce shift times slightly.
Assumptions and Data Sources
• The analysis is based on the benefits and costs of an automated bus yardrelative to a baseline of a comparable bus yard with no automation featuresand typical transit agency practices.
• Capital costs for equipment were estimated at $6,900 per bus for DSRCcommunication ($350), low-speed Adaptive Cruise Control ($1,800),and automatic braking with object detection ($4750). These figures areconsistent with those used for the ADAS use cases above and are drawnfrom recent estimates.50 This combination of sensors and L4 functionality isnot yet available in the transit market.
• High-resolution mapping and route planning for the facility is estimated tocost $15,000, based on interviews with other automation projects. Mappingand route planning are more likely to be required for this use case due to thelonger and more complex vehicle movements required for parking and recall.
• Additional costs of $4,000 per location are assumed for precision dockinghardware at each of 48 designated bus parking spots (for 46 vehicles) in theexample facility. These cost estimates are taken from a prior VAA report51
that may not be reflective of current cost levels. In addition, it is possiblethat the precision docking function could be achieved solely using onboardtechnology.
• Annual O&M costs were assumed to be 10% of capital costs. Again, this is arough estimate used in the absence of hard data on these costs.
• All capital equipment was assumed to have a 12-year lifespan, matching thelifespan of the buses.
• Labor cost savings are based on an analysis of operator scheduling practicesat the example yard across for 74 reports (driver shifts) per day; additionaldetails follow. Wages are based on BLS data on bus operator wages andbenefits.
50 Kockelman et al. (2016); Mangones et al. (2016).51 Mitretek (2005).
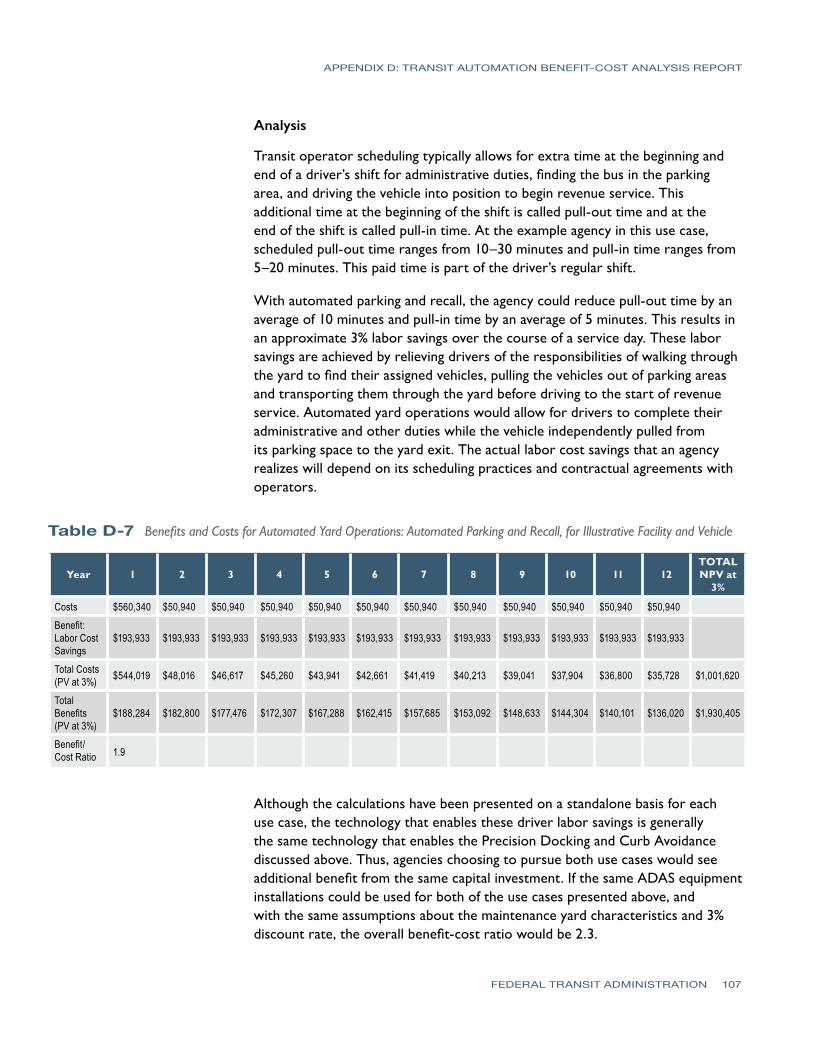
APPENDIX D: TRANSIT AUTOMATION BENEFIT-COST ANALYSIS REPORT
FEDERAL TRANSIT ADMINISTRATION 107
Analysis
Transit operator scheduling typically allows for extra time at the beginning and end of a driver’s shift for administrative duties, finding the bus in the parking area, and driving the vehicle into position to begin revenue service. This additional time at the beginning of the shift is called pull-out time and at the end of the shift is called pull-in time. At the example agency in this use case, scheduled pull-out time ranges from 10–30 minutes and pull-in time ranges from 5–20 minutes. This paid time is part of the driver’s regular shift.
With automated parking and recall, the agency could reduce pull-out time by an average of 10 minutes and pull-in time by an average of 5 minutes. This results in an approximate 3% labor savings over the course of a service day. These labor savings are achieved by relieving drivers of the responsibilities of walking through the yard to find their assigned vehicles, pulling the vehicles out of parking areas and transporting them through the yard before driving to the start of revenue service. Automated yard operations would allow for drivers to complete their administrative and other duties while the vehicle independently pulled from its parking space to the yard exit. The actual labor cost savings that an agency realizes will depend on its scheduling practices and contractual agreements with operators.
Table D-7 Benefits and Costs for Automated Yard Operations: Automated Parking and Recall, for Illustrative Facility and Vehicle
Year 1 2 3 4 5 6 7 8 9 10 11 12TOTAL NPV at
3%
Costs $560,340 $50,940 $50,940 $50,940 $50,940 $50,940 $50,940 $50,940 $50,940 $50,940 $50,940 $50,940Benefit: Labor Cost Savings
$193,933 $193,933 $193,933 $193,933 $193,933 $193,933 $193,933 $193,933 $193,933 $193,933 $193,933 $193,933
Total Costs (PV at 3%) $544,019 $48,016 $46,617 $45,260 $43,941 $42,661 $41,419 $40,213 $39,041 $37,904 $36,800 $35,728 $1,001,620
Total Benefits (PV at 3%)
$188,284 $182,800 $177,476 $172,307 $167,288 $162,415 $157,685 $153,092 $148,633 $144,304 $140,101 $136,020 $1,930,405
Benefit/Cost Ratio 1.9
Although the calculations have been presented on a standalone basis for each use case, the technology that enables these driver labor savings is generally the same technology that enables the Precision Docking and Curb Avoidance discussed above. Thus, agencies choosing to pursue both use cases would see additional benefit from the same capital investment. If the same ADAS equipment installations could be used for both of the use cases presented above, and with the same assumptions about the maintenance yard characteristics and 3% discount rate, the overall benefit-cost ratio would be 2.3.
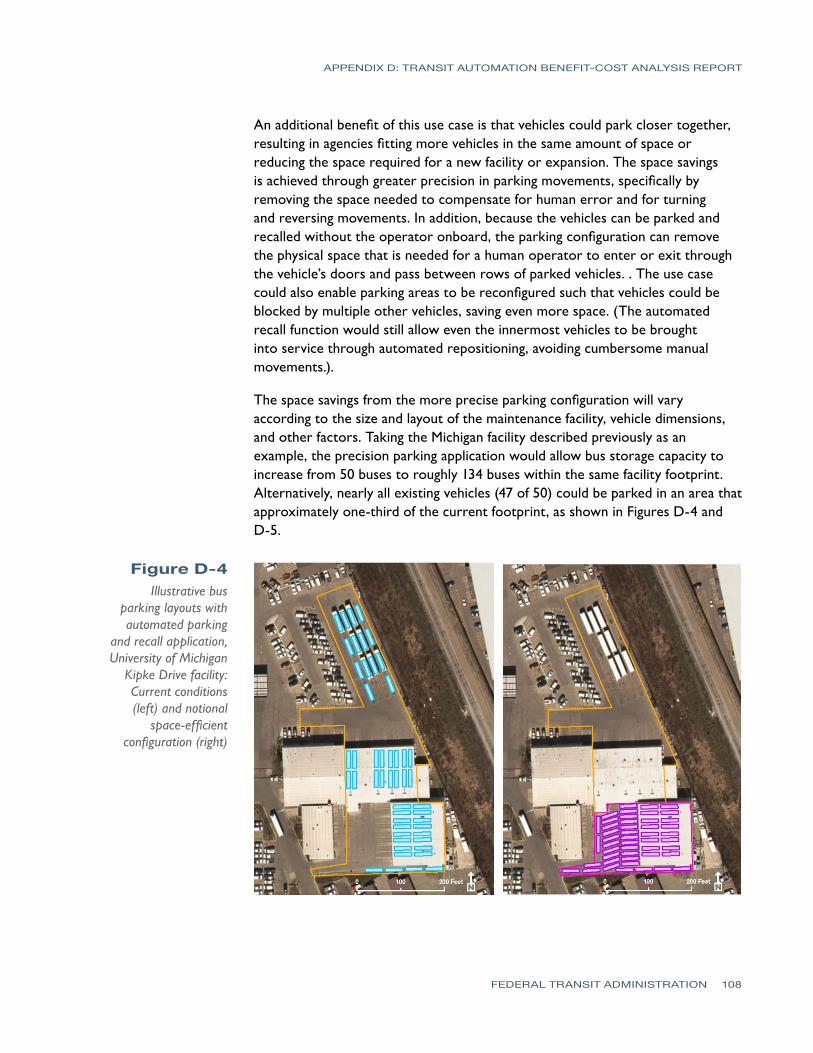
APPENDIX D: TRANSIT AUTOMATION BENEFIT-COST ANALYSIS REPORT
FEDERAL TRANSIT ADMINISTRATION 108
An additional benefit of this use case is that vehicles could park closer together, resulting in agencies fitting more vehicles in the same amount of space or reducing the space required for a new facility or expansion. The space savings is achieved through greater precision in parking movements, specifically by removing the space needed to compensate for human error and for turning and reversing movements. In addition, because the vehicles can be parked and recalled without the operator onboard, the parking configuration can remove the physical space that is needed for a human operator to enter or exit through the vehicle’s doors and pass between rows of parked vehicles. . The use case could also enable parking areas to be reconfigured such that vehicles could be blocked by multiple other vehicles, saving even more space. (The automated recall function would still allow even the innermost vehicles to be brought into service through automated repositioning, avoiding cumbersome manual movements.).
The space savings from the more precise parking configuration will vary according to the size and layout of the maintenance facility, vehicle dimensions, and other factors. Taking the Michigan facility described previously as an example, the precision parking application would allow bus storage capacity to increase from 50 buses to roughly 134 buses within the same facility footprint. Alternatively, nearly all existing vehicles (47 of 50) could be parked in an area that approximately one-third of the current footprint, as shown in Figures D-4 and D-5.
Figure D-4Illustrative bus
parking layouts with automated parking
and recall application, University of Michigan
Kipke Drive facility: Current conditions (left) and notional
space-efficient configuration (right)
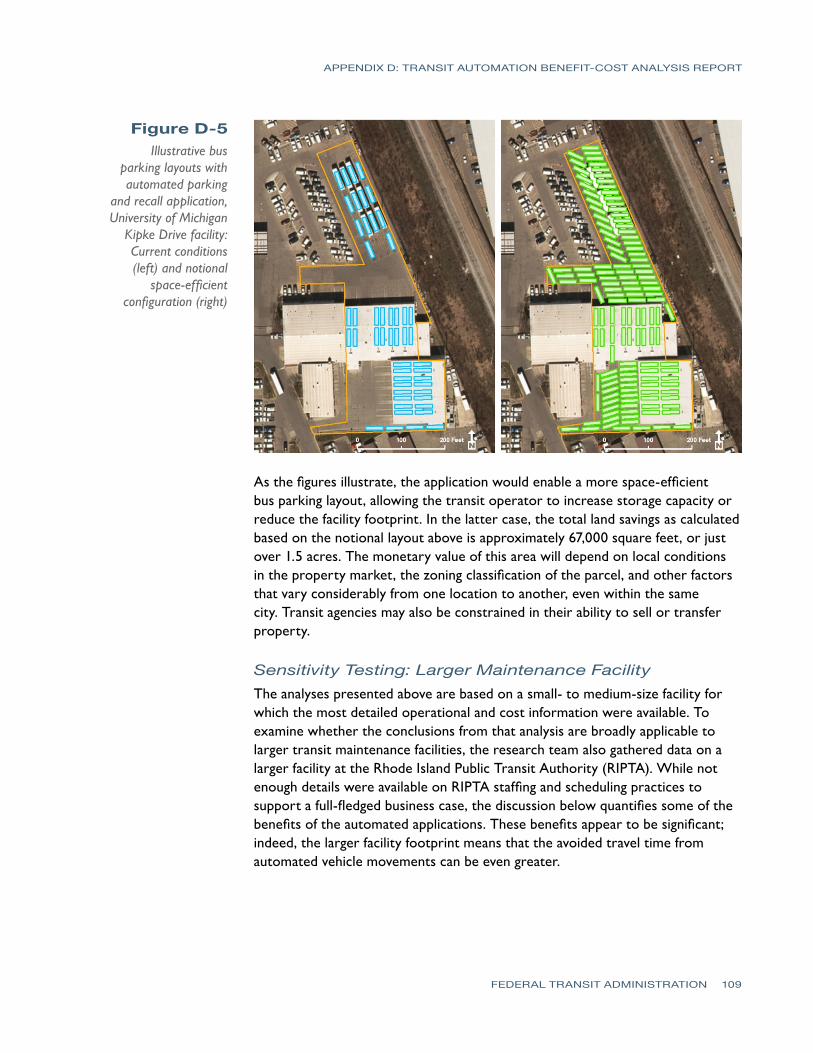
APPENDIX D: TRANSIT AUTOMATION BENEFIT-COST ANALYSIS REPORT
FEDERAL TRANSIT ADMINISTRATION 109
As the figures illustrate, the application would enable a more space-efficient bus parking layout, allowing the transit operator to increase storage capacity or reduce the facility footprint. In the latter case, the total land savings as calculated based on the notional layout above is approximately 67,000 square feet, or just over 1.5 acres. The monetary value of this area will depend on local conditions in the property market, the zoning classification of the parcel, and other factors that vary considerably from one location to another, even within the same city. Transit agencies may also be constrained in their ability to sell or transfer property.
Sensitivity Testing: Larger Maintenance FacilityThe analyses presented above are based on a small- to medium-size facility for which the most detailed operational and cost information were available. To examine whether the conclusions from that analysis are broadly applicable to larger transit maintenance facilities, the research team also gathered data on a larger facility at the Rhode Island Public Transit Authority (RIPTA). While not enough details were available on RIPTA staffing and scheduling practices to support a full-fledged business case, the discussion below quantifies some of the benefits of the automated applications. These benefits appear to be significant; indeed, the larger facility footprint means that the avoided travel time from automated vehicle movements can be even greater.
Figure D-5Illustrative bus
parking layouts with automated parking
and recall application, University of Michigan
Kipke Drive facility: Current conditions (left) and notional
space-efficient configuration (right)
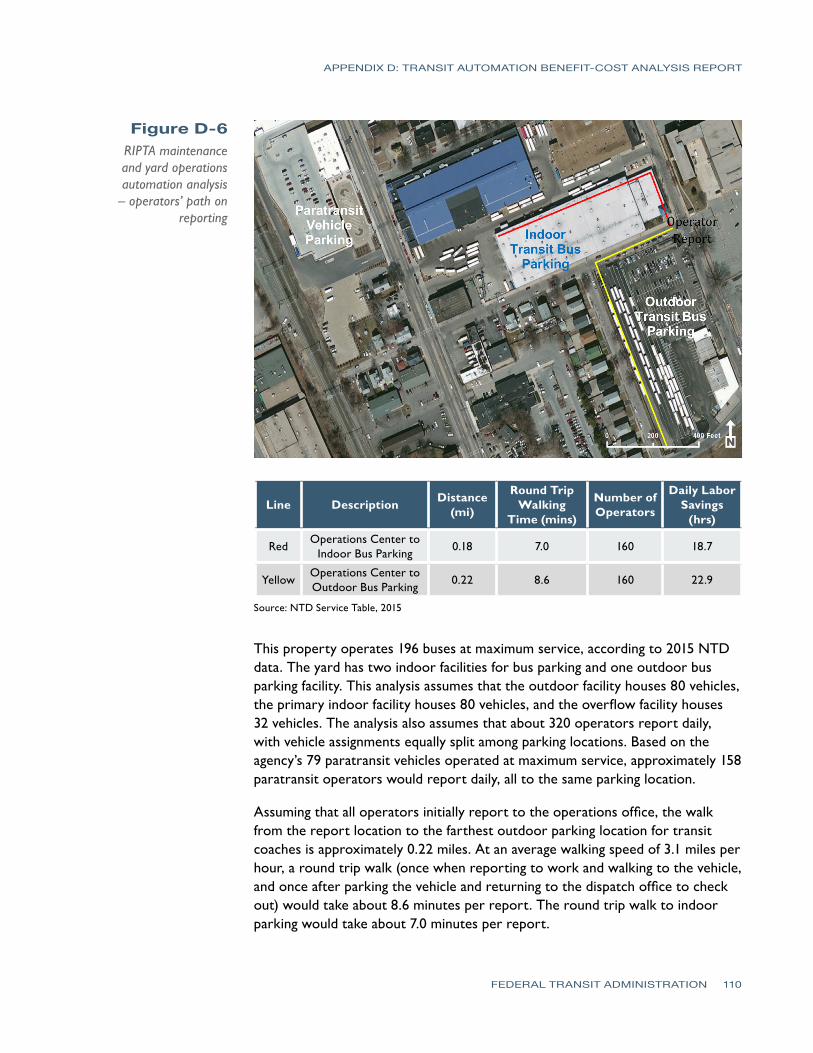
APPENDIX D: TRANSIT AUTOMATION BENEFIT-COST ANALYSIS REPORT
FEDERAL TRANSIT ADMINISTRATION 110
Line Description Distance (mi)
Round Trip Walking
Time (mins)
Number of Operators
Daily Labor Savings
(hrs)
RedOperations Center to
Indoor Bus Parking0.18 7.0 160 18.7
YellowOperations Center to Outdoor Bus Parking
0.22 8.6 160 22.9
Source: NTD Service Table, 2015
This property operates 196 buses at maximum service, according to 2015 NTD data. The yard has two indoor facilities for bus parking and one outdoor bus parking facility. This analysis assumes that the outdoor facility houses 80 vehicles, the primary indoor facility houses 80 vehicles, and the overflow facility houses 32 vehicles. The analysis also assumes that about 320 operators report daily, with vehicle assignments equally split among parking locations. Based on the agency’s 79 paratransit vehicles operated at maximum service, approximately 158 paratransit operators would report daily, all to the same parking location.
Assuming that all operators initially report to the operations office, the walk from the report location to the farthest outdoor parking location for transit coaches is approximately 0.22 miles. At an average walking speed of 3.1 miles per hour, a round trip walk (once when reporting to work and walking to the vehicle, and once after parking the vehicle and returning to the dispatch office to check out) would take about 8.6 minutes per report. The round trip walk to indoor parking would take about 7.0 minutes per report.
Figure D-6RIPTA maintenance and yard operations automation analysis – operators’ path on
reporting
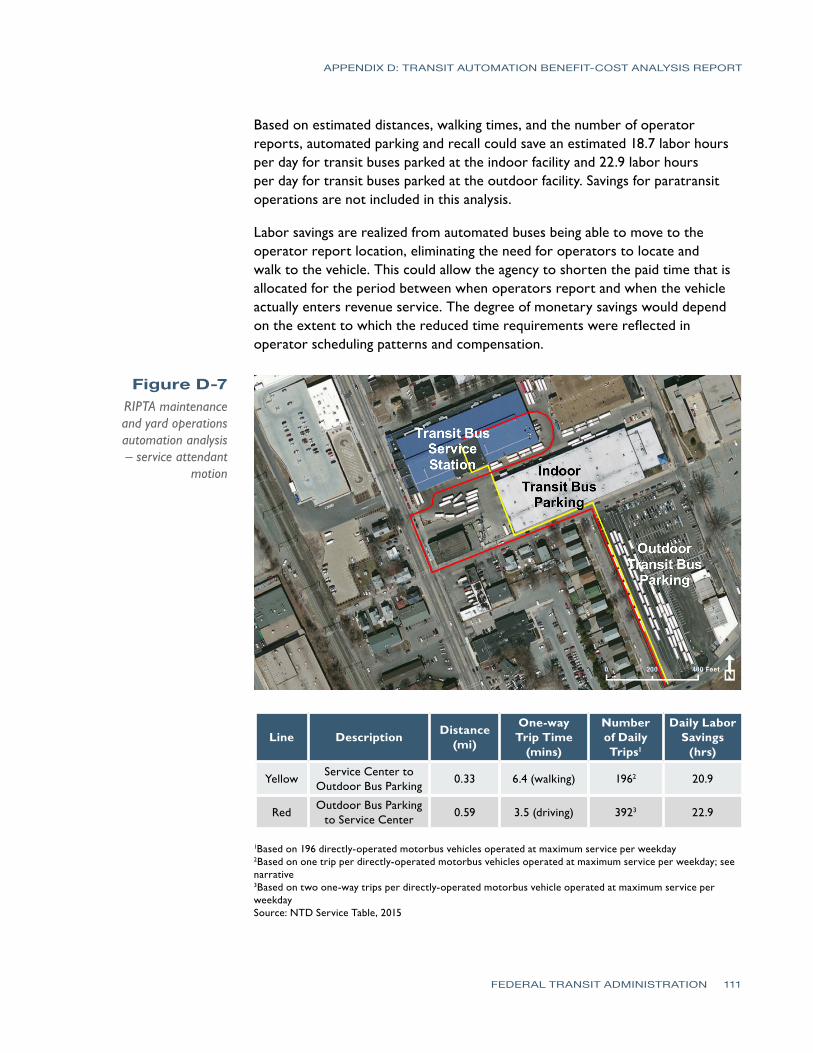
APPENDIX D: TRANSIT AUTOMATION BENEFIT-COST ANALYSIS REPORT
FEDERAL TRANSIT ADMINISTRATION 111
Based on estimated distances, walking times, and the number of operator reports, automated parking and recall could save an estimated 18.7 labor hours per day for transit buses parked at the indoor facility and 22.9 labor hours per day for transit buses parked at the outdoor facility. Savings for paratransit operations are not included in this analysis.
Labor savings are realized from automated buses being able to move to the operator report location, eliminating the need for operators to locate and walk to the vehicle. This could allow the agency to shorten the paid time that is allocated for the period between when operators report and when the vehicle actually enters revenue service. The degree of monetary savings would depend on the extent to which the reduced time requirements were reflected in operator scheduling patterns and compensation.
Figure D-7RIPTA maintenance and yard operations automation analysis – service attendant
motion
Line Description Distance (mi)
One-way Trip Time
(mins)
Number of Daily Trips1
Daily Labor Savings
(hrs)
YellowService Center to
Outdoor Bus Parking0.33 6.4 (walking) 1962 20.9
RedOutdoor Bus Parking
to Service Center0.59 3.5 (driving) 3923 22.9
1Based on 196 directly-operated motorbus vehicles operated at maximum service per weekday 2Based on one trip per directly-operated motorbus vehicles operated at maximum service per weekday; see narrative 3Based on two one-way trips per directly-operated motorbus vehicle operated at maximum service per weekday Source: NTD Service Table, 2015
APPENDIX D: TRANSIT AUTOMATION BENEFIT-COST ANALYSIS REPORT
FEDERAL TRANSIT ADMINISTRATION 112
For transit bus fueling and servicing, RIPTA’s service facility is separate from a main indoor transit bus parking facility, an indoor overflow transit bus parking facility, and an outdoor transit bus parking facility. The service station is located within an indoor maintenance facility, requiring attendants to retrieve vehicles, service them, and return the vehicles to their proper parking locations.
Assuming that service staff are based at the service station inside the maintenance facility, each bus service event requires a round trip drive (one trip to bring the vehicle from its parked location to the service station, and one trip to return the vehicle to its parking location) and a one-way walking trip for the attendant to retrieve the vehicle (or search for another vehicle to service after parking the first serviced vehicle). Based on this workflow, walking and searching time per vehicle is assumed to be equivalent to a one-way walking trip from the service station. In reality, the time required between parking one vehicle, locating the next vehicle to be serviced, then walking to that vehicle could be greater or less.
Based on 196 transit buses serviced daily, an average walking speed of 3.1 miles per hour, and an average yard driving speed of 10.0 miles per hour, daily labor savings from walking to retrieve transit coaches is estimated at 20.9 hours. Daily labor savings from driving transit coaches is estimated at 22.9 hours. Paratransit vehicle servicing is not included in this model, but would lead to additional savings.
Labor savings originate from eliminating the time required for service staff to locate and retrieve transit coaches through a combination of walking and driving. Transit bus automation within the maintenance facility would allow these service staff to remain at the service station while vehicles drive themselves to the service station and park themselves when service is completed. This time savings could be used to service more vehicles in the same amount of labor hours, or could reduce the labor hours needed without reducing the number of vehicles serviced.
Automation for Mobility-on-Demand ServiceThe Automation for Mobility-on-Demand (MOD) Service technology package uses L5 automation in a small- to medium-size vehicle (such as a minibus on a cutaway van chassis, although new designs may emerge) to provide on-demand service between any two addresses within a defined service area. The concept is similar to the automated shuttle technology package; however, it is not restricted to predefined routes and waypoints, and users can request pick-ups and drop-offs rather than being restricted to scheduled service. In addition, rather than operating only in dense, high-demand areas, the MOD service can provide rides to users in neighborhoods and other less-dense areas, such as suburban and rural roads. Use cases identified for the MOD service include:
APPENDIX D: TRANSIT AUTOMATION BENEFIT-COST ANALYSIS REPORT
FEDERAL TRANSIT ADMINISTRATION 113
• ADA Paratransit Service
• Automated First/Last Mile
• On-Demand Shared Ride
From a user perspective, passengers may be attracted by the initial novelty in using a new technology, though the absence of a driver is a major departure from normal transit operations, and could lead to concerns about trust and perceived safety. Because the service will use different systems compared to conventional vehicles, passengers may not understand how to request service, input destinations, pay fares, or change destinations. If the passenger’s primary interface with the vehicle is an electronic device, such as a smartphone or a tablet, potential riders who do not own or are less proficient in using these devices may be at a disadvantage for accessing the service. In addition, passengers with disabilities may struggle to board, secure mobility devices, and alight without assistance from an operator. Some operator tasks (such as providing informal wayfinding or a sense of security) cannot be automated, which may lead to a perceived decrease in service quality if the shuttle is completely unstaffed. Overall, if the many challenges can be overcome, passengers may benefit from new or expanded mobility services.
From a fleet operator perspective, changes in fleet size and composition may be necessary to support service concepts that move from a fixed-route, hub-and-spoke model toward a more point-to-point model. This would have implications for maintenance, fuel costs, and storage capacity. Labor cost savings may create opportunities to expand service coverage or improve service quality. Planning and deploying new service types will include many initial risks and may require new skills (e.g., to maintain the advanced technology vehicles). Passenger assistance needs are an important consideration, especially for potential use in paratransit service.
Automated ADA ParatransitUnder the Americans with Disabilities Act (ADA), transit agencies providing fixed route public transportation are required to provide comparable paratransit service to persons with disabilities (49 CFR 37.121). The 2015 National Transit Summary and Trends report states that, “Demand response (DR) is the second largest transit service type (26 thousand [vehicles operating at maximum service (VOMS)] and almost 53 billion [vehicle revenue hours (VRH)]) and is the main provider of service in rural and sparsely populated areas.”52 Given the importance of paratransit as a service, it is critical to understand the possible benefits and implications of automating paratransit.
Transit operators generally use smaller vehicles to provide their paratransit services, which reduces their capital expenses, especially compared to bus and rail
52 FTA (2016b), “2015 National Transit Summary and Trends,” FTA Office of Budget and Policy, October. https://www.transit.dot.gov/sites/fta.dot.gov/files/docs/2015%20NTST.pdf.
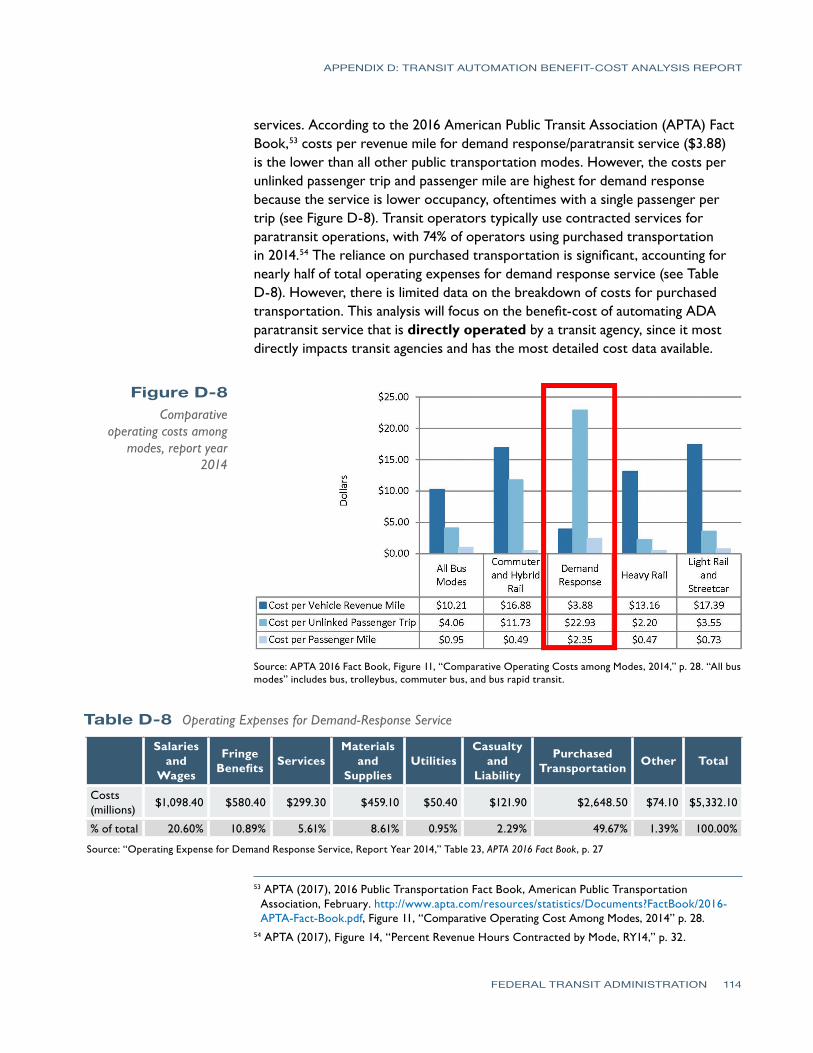
APPENDIX D: TRANSIT AUTOMATION BENEFIT-COST ANALYSIS REPORT
FEDERAL TRANSIT ADMINISTRATION 114
services. According to the 2016 American Public Transit Association (APTA) Fact Book,53 costs per revenue mile for demand response/paratransit service ($3.88) is the lower than all other public transportation modes. However, the costs per unlinked passenger trip and passenger mile are highest for demand response because the service is lower occupancy, oftentimes with a single passenger per trip (see Figure D-8). Transit operators typically use contracted services for paratransit operations, with 74% of operators using purchased transportation in 2014.54 The reliance on purchased transportation is significant, accounting for nearly half of total operating expenses for demand response service (see Table D-8). However, there is limited data on the breakdown of costs for purchasedtransportation. This analysis will focus on the benefit-cost of automating ADAparatransit service that is directly operated by a transit agency, since it mostdirectly impacts transit agencies and has the most detailed cost data available.
53 APTA (2017), 2016 Public Transportation Fact Book, American Public Transportation Association, February. http://www.apta.com/resources/statistics/Documents?FactBook/2016-APTA-Fact-Book.pdf, Figure 11, “Comparative Operating Cost Among Modes, 2014” p. 28.
54 APTA (2017), Figure 14, “Percent Revenue Hours Contracted by Mode, RY14,” p. 32.
Figure D-8Comparative
operating costs among modes, report year
2014
Source: APTA 2016 Fact Book, Figure 11, “Comparative Operating Costs among Modes, 2014,” p. 28. “All bus modes” includes bus, trolleybus, commuter bus, and bus rapid transit.
Table D-8 Operating Expenses for Demand-Response Service
Salaries and
Wages
Fringe Benefits Services
Materials and
SuppliesUtilities
Casualty and
Liability
Purchased Transportation Other Total
Costs (millions)
$1,098.40 $580.40 $299.30 $459.10 $50.40 $121.90 $2,648.50 $74.10 $5,332.10
% of total 20.60% 10.89% 5.61% 8.61% 0.95% 2.29% 49.67% 1.39% 100.00%
Source: “Operating Expense for Demand Response Service, Report Year 2014,” Table 23, APTA 2016 Fact Book, p. 27
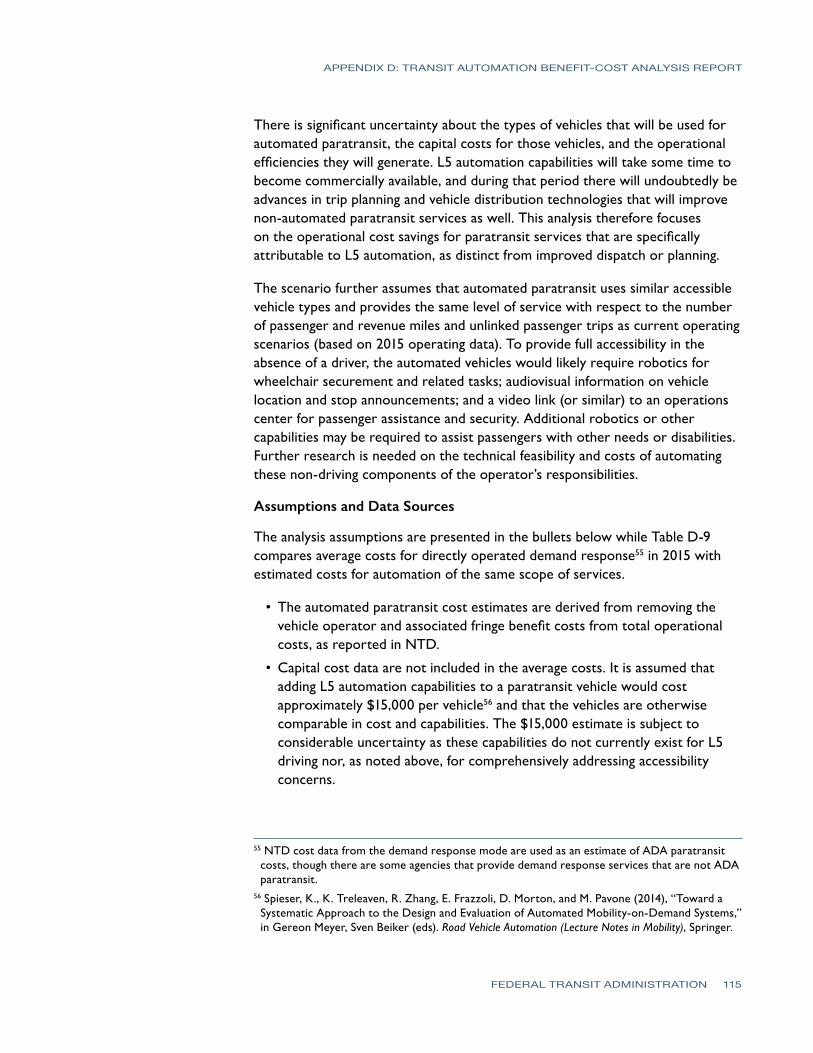
APPENDIX D: TRANSIT AUTOMATION BENEFIT-COST ANALYSIS REPORT
FEDERAL TRANSIT ADMINISTRATION 115
There is significant uncertainty about the types of vehicles that will be used for automated paratransit, the capital costs for those vehicles, and the operational efficiencies they will generate. L5 automation capabilities will take some time to become commercially available, and during that period there will undoubtedly be advances in trip planning and vehicle distribution technologies that will improve non-automated paratransit services as well. This analysis therefore focuses on the operational cost savings for paratransit services that are specifically attributable to L5 automation, as distinct from improved dispatch or planning.
The scenario further assumes that automated paratransit uses similar accessible vehicle types and provides the same level of service with respect to the number of passenger and revenue miles and unlinked passenger trips as current operating scenarios (based on 2015 operating data). To provide full accessibility in the absence of a driver, the automated vehicles would likely require robotics for wheelchair securement and related tasks; audiovisual information on vehicle location and stop announcements; and a video link (or similar) to an operations center for passenger assistance and security. Additional robotics or other capabilities may be required to assist passengers with other needs or disabilities. Further research is needed on the technical feasibility and costs of automating these non-driving components of the operator’s responsibilities.
Assumptions and Data Sources
The analysis assumptions are presented in the bullets below while Table D-9 compares average costs for directly operated demand response55 in 2015 with estimated costs for automation of the same scope of services.
• The automated paratransit cost estimates are derived from removing the vehicle operator and associated fringe benefit costs from total operational costs, as reported in NTD.
• Capital cost data are not included in the average costs. It is assumed that adding L5 automation capabilities to a paratransit vehicle would cost approximately $15,000 per vehicle56 and that the vehicles are otherwise comparable in cost and capabilities. The $15,000 estimate is subject to considerable uncertainty as these capabilities do not currently exist for L5 driving nor, as noted above, for comprehensively addressing accessibility concerns.
55 NTD cost data from the demand response mode are used as an estimate of ADA paratransit costs, though there are some agencies that provide demand response services that are not ADA paratransit.
56 Spieser, K., K. Treleaven, R. Zhang, E. Frazzoli, D. Morton, and M. Pavone (2014), “Toward a Systematic Approach to the Design and Evaluation of Automated Mobility-on-Demand Systems,” in Gereon Meyer, Sven Beiker (eds). Road Vehicle Automation (Lecture Notes in Mobility), Springer.
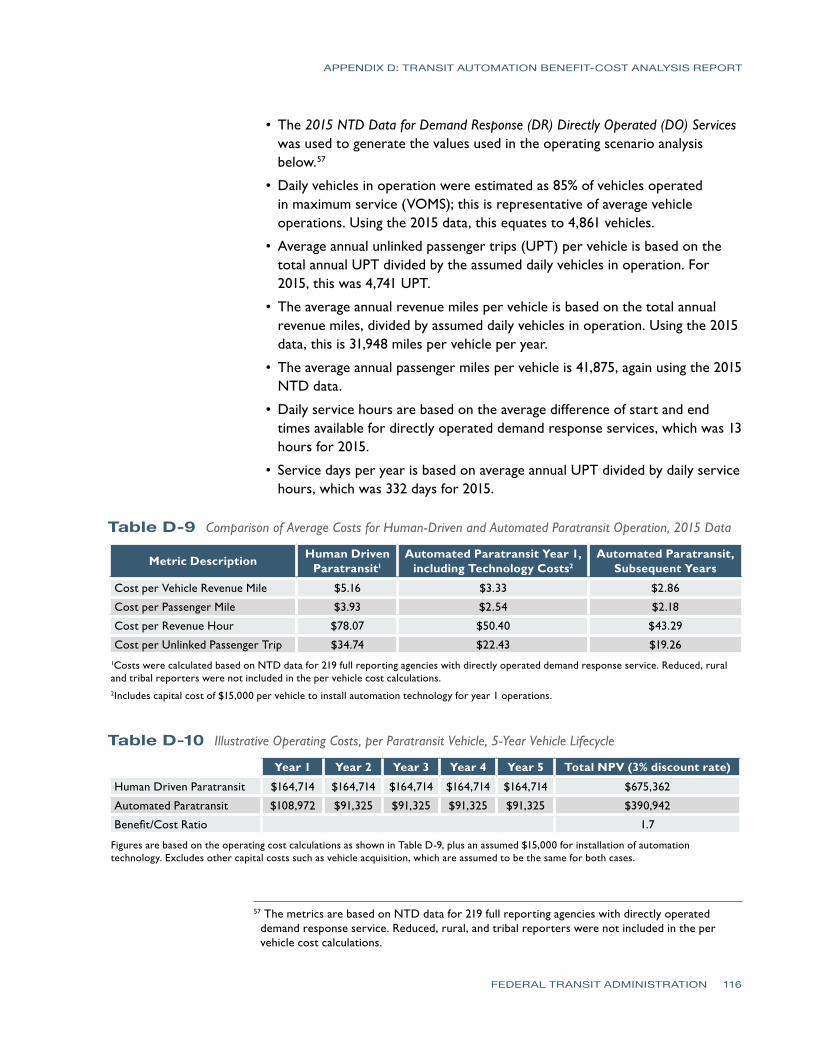
APPENDIX D: TRANSIT AUTOMATION BENEFIT-COST ANALYSIS REPORT
FEDERAL TRANSIT ADMINISTRATION 116
• The 2015 NTD Data for Demand Response (DR) Directly Operated (DO) Services was used to generate the values used in the operating scenario analysis below.57
• Daily vehicles in operation were estimated as 85% of vehicles operated in maximum service (VOMS); this is representative of average vehicle operations. Using the 2015 data, this equates to 4,861 vehicles.
• Average annual unlinked passenger trips (UPT) per vehicle is based on the total annual UPT divided by the assumed daily vehicles in operation. For 2015, this was 4,741 UPT.
• The average annual revenue miles per vehicle is based on the total annual revenue miles, divided by assumed daily vehicles in operation. Using the 2015 data, this is 31,948 miles per vehicle per year.
• The average annual passenger miles per vehicle is 41,875, again using the 2015 NTD data.
• Daily service hours are based on the average difference of start and end times available for directly operated demand response services, which was 13 hours for 2015.
• Service days per year is based on average annual UPT divided by daily service hours, which was 332 days for 2015.
57 The metrics are based on NTD data for 219 full reporting agencies with directly operated demand response service. Reduced, rural, and tribal reporters were not included in the per vehicle cost calculations.
Table D-9 Comparison of Average Costs for Human-Driven and Automated Paratransit Operation, 2015 Data
Metric Description Human Driven Paratransit1
Automated Paratransit Year 1, including Technology Costs2
Automated Paratransit, Subsequent Years
Cost per Vehicle Revenue Mile $5.16 $3.33 $2.86
Cost per Passenger Mile $3.93 $2.54 $2.18
Cost per Revenue Hour $78.07 $50.40 $43.29
Cost per Unlinked Passenger Trip $34.74 $22.43 $19.261Costs were calculated based on NTD data for 219 full reporting agencies with directly operated demand response service. Reduced, rural and tribal reporters were not included in the per vehicle cost calculations. 2Includes capital cost of $15,000 per vehicle to install automation technology for year 1 operations.
Table D-10 Illustrative Operating Costs, per Paratransit Vehicle, 5-Year Vehicle Lifecycle
Year 1 Year 2 Year 3 Year 4 Year 5 Total NPV (3% discount rate)
Human Driven Paratransit $164,714 $164,714 $164,714 $164,714 $164,714 $675,362
Automated Paratransit $108,972 $91,325 $91,325 $91,325 $91,325 $390,942
Benefit/Cost Ratio 1.7
Figures are based on the operating cost calculations as shown in Table D-9, plus an assumed $15,000 for installation of automation technology. Excludes other capital costs such as vehicle acquisition, which are assumed to be the same for both cases.
APPENDIX D: TRANSIT AUTOMATION BENEFIT-COST ANALYSIS REPORT
FEDERAL TRANSIT ADMINISTRATION 117
In 2015, the operator salaries and wages with associated fringe benefits were approximately 45% of total operating costs for directly operated demand response service. As such, the average costs of operating automated demand response service after the initial year when automation capital is included is about 45% less than service operated with human drivers. Even during the first year, when the full technology investment costs are included, automated paratransit would have operational costs that compare favorably to current levels.
The information in Tables D-9 and D-10 represents a simplified scenario that does not include several potential cost items, notably remote operators or supervisors and recurring technology update needs. Since these capabilities do not yet exist, there may be other capital or maintenance costs not considered. Most importantly, these cost estimates hinge on the assumption that wheelchair securements and other assistance for disabled passengers can be accomplished via advanced robotics. A service that is driverless but requires an onboard attendant would have significantly higher labor costs and lose much or all of its cost advantage. Average costs expressed on a per-passenger basis would also vary with any ridership changes that are associated with automation.
Automated First/Last MileThis use case is conceptually similar to the second technology package with the L4 automated shuttle, but moving to L5 capabilities and thus with flexibility to serve a wider geographic area and range of operational environments. This type of first- and last-mile service is designed to connect a transit station with a wider catchment area, particularly for travelers whose origin or destination is beyond walking distance from the station. These types of services can operate as fully-fixed routes or incorporate various forms of route deviation.
Transit vehicles with L5 capabilities do not currently exist, and it is unclear whether the additional technology costs required for L5 automation would raise vehicle costs significantly above those for L4 vehicles. If the additional costs are modest, then the benefit-cost profile relative to a non-automated vehicle will be similar to the one calculated above for L4 shuttles. As with the L4 shuttle, overall cost savings will also depend strongly on labor costs, and whether the vehicle continues to require an onboard attendant for safety, accessibility, or customer acceptance. It is also likely that transit agencies would consider making more fundamental changes to their overall service patterns to leverage the capabilities of the L5 vehicles, rather than simply automating their existing service, as was assumed in the discussion above for paratransit. Overall, because this use case is more speculative and there are no data are available on fundamentals such as vehicle purchase costs, the research team did not pursue a quantitative benefit-cost analysis in this area. The costs, capabilities, and future availability of L5 automated transit vehicles are noted as important research needs.
APPENDIX D: TRANSIT AUTOMATION BENEFIT-COST ANALYSIS REPORT
FEDERAL TRANSIT ADMINISTRATION 118
As noted, the primary benefits of this use case include the ability to provide lower-cost transit service through the use of automation. There are also opportunities to provide more flexible service options and to improve the customer experience through reduced wait times and trip circuity – both of which could lead to increased ridership and fare revenue. Strictly speaking, many of these benefits also can be achieved at lower levels of automation or through the application of ITS and service planning, although L5 automation may represent a breakthrough technology that would significantly lower the costs of transit service in lower-density areas.
On-Demand Shared RideThis use case represents a large paradigm shift where some transit services would move from a fixed-route, fixed-schedule model to a point-to-point, on-demand model using a fleet of fully-automated L5 vehicles. Applications of this model include rural uses, as it is expected to be able to provide coverage in low-density areas for lower operating costs. Traditional fixed route bus service is difficult to cost effectively operate in low-density locations. Shared automated vehicles have also been proposed as a replacement for personal automobile ownership, allowing travelers to avoid the high fixed costs of ownership.
The research and analysis of automated MOD is limited in its ability to inform what an automated MOD service would look like and cost. Much of the research that has been reviewed is based on medium-size urban areas and focused on a shared fleet of vehicles but not on shared rides, which is the basis of current public transportation models. The available research also discusses the overall growth in vehicle miles traveled (VMT) from shifting to more continuously used automated vehicles; however, it does not discuss the potential increase in congestion that could result from increased VMT or the potentially higher travel time costs for passengers.
One research team looked at the combination of automated shared vehicles alongside high-capacity transit compared to single passenger automated vehicles without high-capacity transit. They conclude that both scenarios could result in a reduction of personally owned vehicles and elimination of the need for 80–90% of vehicles overall required to conduct the same number of passenger trips.58 The total reduction in vehicles during peak times is lower. The rise in VMT is estimated to be 13% for shared ride automated vehicles and 24% for single passenger automated vehicles. This specific research did not consider cost as part of its methodology, so although it provides some insight into vehicle requirements and scenarios, it does not support a benefit-cost assessment.
58 OECD (2015), “Urban Mobility System Upgrade: How Shared Self-Driving Cars Could Change City Traffic,” OECD International Transport Forum.
APPENDIX D: TRANSIT AUTOMATION BENEFIT-COST ANALYSIS REPORT
FEDERAL TRANSIT ADMINISTRATION 119
Another research team investigated using a combination five “innovative mobility approaches,” including automated trip routing, and driverless vehicles.59 These researchers assumed a high level of vehicle “right sizing” by establishing an automated fleet comprised of 1-2 passenger and 3-5 passenger vehicles. The theoretical applications of these automated fleets are limited to large urban (Manhattan), medium urban (Ann Arbor) and suburban (Babcock Ranch) locations. It is unclear how the service would translate to rural areas. More broadly, there is significant uncertainty as to whether existing, public sector transit agencies would be involved in providing these sorts of highly individualized point-to-point services.
There are substantial uncertainties about the mechanics and costs associated with a complete replacement of transit buses on fixed routes with point-to-point service in small capacity automated vehicles. While this research is highly theoretical at this time, it is a point of continued investigation that should be monitored.
Automated Bus Rapid TransitThe automated Bus Rapid Transit (BRT) technology package uses a full-size or articulated bus with L4 automation to provide BRT service without a driver on board the vehicle. According to FTA, BRT is a “high-quality bus-based transit system that delivers fast and efficient service that may include dedicated lanes, busways, traffic signal priority, off-board fare collection, elevated platforms and enhanced stations.”60 BRT systems use buses to provide cost-effective service at metro-level capacities—by including features similar to a light rail or metro system, BRT systems are faster and more reliable than regular bus service.61 These features focus on eliminating causes of delay that typically slow regular bus services (e.g., being stuck in other road traffic and on-board payment for passengers). Over the past decade, BRT has become more common, and today such systems operate in big cities such as Los Angeles and Pittsburgh, as well as mid-size metropolitan areas such as Eugene, Oregon.62 Fully-automated BRT could be of interest to cities that are considering cost-effective alternatives to light rail transit or other high-capacity transit systems.
As L4 vehicles, these automated BRT buses will not require a human operator, though such a system has yet to be demonstrated. Some work has already been
59 Burns, L. D., W. C. Jordan, B. A. Scarborough (2013), Transforming Personal Mobility. The Earth Institute, Columbia University.
60 FTA (2017). “Bus Rapid Transit,” Federal Transit Administration, U.S. Department of Transportation, updated January 6, 2017. https://www.transit.dot.gov/research-innovation/bus-rapid-transit.
61 ITDP (2017). “What is BRT?” Institute for Transportation & Development Policy. https://www.itdp.org/library/standards-and-guides/the-bus-rapid-transit-standard/what-is-brt/, accessed September 2017.
62 FTA (2017).
APPENDIX D: TRANSIT AUTOMATION BENEFIT-COST ANALYSIS REPORT
FEDERAL TRANSIT ADMINISTRATION 120
done to test automated features on BRT systems, including applications such as lane centering and precision docking at boarding platforms, though those applications have been tested with a driver on board and were considered L1 or L2 systems.63
From a user perspective, passengers may be attracted by the initial novelty in using automated technology, though the absence of a driver is a major departure from normal transit operations, and could lead to concerns about trust and perceived safety. The service is a direct replacement for existing BRT, so service should remain mostly unchanged, though precision docking may result in smaller gaps between the boarding platform and the vehicle floor, which may improve accessibility for users. Although this scenario is not analyzed here, automated operation could also enable more frequent service, giving the Automated BRT a higher capacity and making it a potential alternative to light-rail transit.
From an operator perspective, automated BRT would be an entirely new technology as it is still in development and has not been tested with L4 automation. Early adopters must be comfortable with some uncertainty regarding cost and performance. Since the buses will not require on-board operators, their use may raise concern from labor unions. New skills may also be required to plan for, operate, and maintain these buses.
Illustrative BRT CaseAs classified by NTD, there are roughly a dozen BRT services in operation in the U.S. Each of these services is unique, and very few (if any) have every element of full-fledged BRT service, from dedicated lanes to expedited fare collection. For this analysis, rather than calculate a business case for a particular existing BRT system, an illustrative case is presented for a hypothetical automated BRT system. Specifically, the benefit-cost analysis for this use case envisions a BRT service with a single, 5-mile route and 12 vehicles operated in annual maximum service (VOMS). These assumptions are in line with rough average metrics from existing BRT services in NTD 2015.
Assumptions and Data Sources
• Automated BRT is compared against a baseline of a comparable BRT service without automation.
• The hypothetical BRT line is 5 miles long with service in each direction (i.e., 10 directional route-miles) and operates partly on a separated guideway and partly in mixed traffic.
63 FTA (2016a), “Vehicle Assist and Automation (VAA) Demonstration Evaluation Report,” Report 0093, Federal Transit Administration, U.S. Department of Transportation, January. https://www.transit.dot.gov/sites/fta.dot.gov/files/docs/FTA_Report_No._0093.pdf; Daimler (2017), “Mercedes-Benz Future Bus: Safe, Ecological, Comfortable—Semi-Automated Driving with the CityPilot,” Daimler Media, accessed September 2017. http://media.daimler.com/marsMediaSite/ko/en/12776483.
APPENDIX D: TRANSIT AUTOMATION BENEFIT-COST ANALYSIS REPORT
FEDERAL TRANSIT ADMINISTRATION 121
• The service will have 12 vehicles providing daily service. Including backupvehicles, there will be 16 vehicles equipped with the automation system(average 33% spare ratio).64
• Revenue vehicles will travel an average of 35,000 miles per year, for a total of420,000 miles annually.65
• On-vehicle hardware is assumed to cost $6,900 per vehicle, including DSRCcommunication ($350), low-speed Adaptive Cruise Control ($1,800), andautomatic braking with object detection ($4,750). To instrument all 16vehicles, hardware costs total $110,400. These figures are consistent withthose used for the previous use cases and are drawn from recent estimates.66
This combination of sensors and L4 functionality is not yet available in thetransit market, so these costs are subject to change. In particular, theremay be additional costs for implementing automated steering, parking, andpassenger assistance functions.
• Total costs associated with mapping the route are assumed to be $15,000per directional route-mile, or $150,000 for the BRT route.67
• Annual O&M costs were assumed to be 10% of capital costs. This is a roughestimate used in the absence of hard data on these ongoing costs.
• Vehicle-related costs are otherwise assumed to be the same between theautomated and non-automated cases, though there may be opportunities forfuel economy improvements through fully-automated operation. Operatingexpense per vehicle revenue mile are assumed to be $5.00 for operatorlabor (for systems with an onboard attendant) and $7.50 for all other costs.68
Unstaffed systems would have no direct labor costs.
• Operating speeds, dwell times, run times, and other operational factors arealso assumed to be the same between the automated and non-automatedcases. More research is needed on the operational impacts of fully-driverlessoperation.
• The lifespan of the automation technology is assumed to be 12 years, whichmatches the bus lifespan.
• The automated BRT scenario is assumed to be fully-driverless and doesnot include an onboard attendant or other employee. Further, this analysis
64 Rough average spare ratio based on FTA (2015), National Transit Database, Federal Transit Administration, U.S. Department of Transportation, accessed September 2017. https://www.transit.dot.gov/ntd/ntd-data.
65 Rough average revenue miles per VOMS per year based on FTA (2015). 66 Kockelman et al. (2016); Mangones et al. (2016).67 Estimate based on similar estimations for mapping activities used in the Automated Shuttle and Automation for Maintenance, Yard, and Parking/Storage Operations use cases.
68 Rough average operating expense per vehicle revenue mile based on FTA (2015). NTD does not provide a breakdown of non-wage compensation costs (such as employee benefits), so these costs were allocated to operator labor in proportion to operators’ overall share of wage compensation.
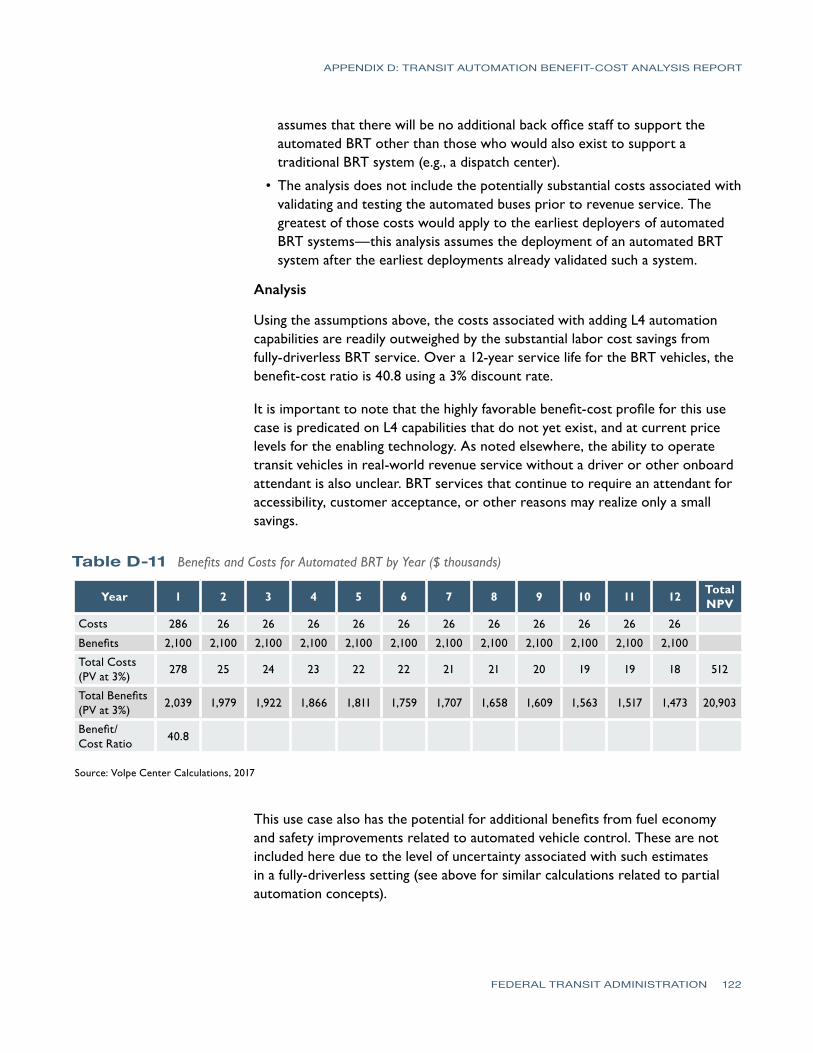
APPENDIX D: TRANSIT AUTOMATION BENEFIT-COST ANALYSIS REPORT
FEDERAL TRANSIT ADMINISTRATION 122
assumes that there will be no additional back office staff to support the automated BRT other than those who would also exist to support a traditional BRT system (e.g., a dispatch center).
• The analysis does not include the potentially substantial costs associated with validating and testing the automated buses prior to revenue service. The greatest of those costs would apply to the earliest deployers of automated BRT systems—this analysis assumes the deployment of an automated BRT system after the earliest deployments already validated such a system.
Analysis
Using the assumptions above, the costs associated with adding L4 automation capabilities are readily outweighed by the substantial labor cost savings from fully-driverless BRT service. Over a 12-year service life for the BRT vehicles, the benefit-cost ratio is 40.8 using a 3% discount rate.
It is important to note that the highly favorable benefit-cost profile for this use case is predicated on L4 capabilities that do not yet exist, and at current price levels for the enabling technology. As noted elsewhere, the ability to operate transit vehicles in real-world revenue service without a driver or other onboard attendant is also unclear. BRT services that continue to require an attendant for accessibility, customer acceptance, or other reasons may realize only a small savings.
Table D-11 Benefits and Costs for Automated BRT by Year ($ thousands)
Year 1 2 3 4 5 6 7 8 9 10 11 12 Total NPV
Costs 286 26 26 26 26 26 26 26 26 26 26 26
Benefits 2,100 2,100 2,100 2,100 2,100 2,100 2,100 2,100 2,100 2,100 2,100 2,100
Total Costs (PV at 3%)
278 25 24 23 22 22 21 21 20 19 19 18 512
Total Benefits (PV at 3%)
2,039 1,979 1,922 1,866 1,811 1,759 1,707 1,658 1,609 1,563 1,517 1,473 20,903
Benefit/ Cost Ratio
40.8
Source: Volpe Center Calculations, 2017
This use case also has the potential for additional benefits from fuel economy and safety improvements related to automated vehicle control. These are not included here due to the level of uncertainty associated with such estimates in a fully-driverless setting (see above for similar calculations related to partial automation concepts).
APPENDIX D: TRANSIT AUTOMATION BENEFIT-COST ANALYSIS REPORT
FEDERAL TRANSIT ADMINISTRATION 123
Summary and Next StepsThis report presents initial findings on the benefits and costs for selected bus transit automation use cases from the perspective of the transit agency’s internal business case. The analysis is intended to provide decision-support to FTA and its stakeholders as they consider priorities for further research and potential tests or deployments. In light of the data limitations noted throughout the report—and particularly the rapidly changing lineup of automation costs and capabilities—all figures should be regarded as preliminary. This analysis has also not attempted to quantify benefits that accrue to transit users, such as travel time improvements, or intangible benefits such as improved transit agency marketing or customer satisfaction. Thus, the benefit-cost figures presented here should not be used to produce strict rankings of the use cases, but only to give initial indications of their cost-effectiveness and to highlight the factors that influence their return on investment, as an input to further research.
As noted in the section above, the analysis highlights the fact that the business case for automation applications is highly influenced by the specific characteristics of the transit service or facility, as no two are alike. For example, a particular use case that is highly cost-effective for a two-mile, low-speed circulator route may not be cost-effective for a longer route or in a different operational environment. Additional sensitivity testing can help identify the breakeven points for cost-effective investment for agencies with different service characteristics.
With those caveats in mind, the results do indicate that ADAS capabilities such as smooth acceleration and braking, automatic emergency braking, and narrow lane/shoulder operation all have a favorable investment profile at current cost levels, with the costs for onboard sensing and other equipment more than offset by long-term savings in fuel, crash costs, and/or operating costs. Since there is overlap in the equipment required for each use case, transit agencies may find that implementing these capabilities as a package is more cost-effective than any single application. Calculations for the Automated Maintenance Yard Operations use cases also showed the potential for a positive return on investment, based on the prospect of reducing labor requirements, though these results are contingent on the specifics of yard layout and agency policies.
For fully-driverless shuttle vehicles and paratransit, as well as for Automated BRT, the results suggest the potential for large cost savings relative to conventional service with human operators, but only in scenarios without an onboard attendant. There is limited operational experience with these vehicles, and more research is needed on the safety, security, and accessibility implications of fully-unattended operation, as well as customer acceptance.
APPENDIX D: TRANSIT AUTOMATION BENEFIT-COST ANALYSIS REPORT
FEDERAL TRANSIT ADMINISTRATION 124
Other automated Mobility-on-Demand concepts are discussed in the report, but information on costs, availability, and overall service and business models is currently too speculative to support quantitative benefit and cost estimates. These areas are all candidates for additional research. Other research needs identified in the report include work on the operational implications of precision docking, user benefits of ADAS applications, including improved travel time and reliability, and applications of partial automation for platooning.
This analysis will be presented to stakeholders for feedback and will ultimately inform development of a Transit Automation Research Program Plan.
APPENDIX D: TRANSIT AUTOMATION BENEFIT-COST ANALYSIS REPORT
FEDERAL TRANSIT ADMINISTRATION 125
Appendix D References
AFDC. (2016). Vehicles: Fuel Consumption and Efficiency. Alternative Fuels Data Center. http://www.afdc.energy.gov/data/.
APTA. (2017). 2016 Public Transportation Fact Book. American Public Transportation Association. February 2017. http://www.apta.com/resources/statistics/Documents/FactBook/2016-APTA-Fact-Book.pdf.
BLS. (2016). “Occupational Employment and Wages, May 2016.” Occupational Employment Statistics, Bureau of Labor Statistics, U.S. Department of Labor. April 14, 2017. https://www.bls.gov/oes/current/oes533021.htm#nat.
Burns, L.D., W.C. Jordan, and B.A. Scarborough. (2013). Transforming Personal Mobility. The Earth Institute, Columbia University.
Carpenter. (2017). Cost and Feature Comparisons between 15-Passenger Vans & 15-Passenger Buses. Carpenter Bus Sales.
Daimler. (2017). “Mercedes-Benz Future Bus: Safe, Ecological, Comfortable—Semi-Automated Driving with the CityPilot.” Daimler Media Website, http://media.daimler.com/marsMediaSite/ko/en/12776483, accessed September 2017.
EIA. (2017). Annual Energy Outlook 2017. U.S. Energy Information Administration. January 5, 2017. https://www.eia.gov/outlooks/aeo/.
FTA. (2015). National Transit Database. Federal Transit Administration, U.S. Department of Transportation. https://www.transit.dot.gov/ntd/ntd-data, accessed September 2017.
FTA. (2016a). “Vehicle Assist and Automation (VAA) Demonstration Evaluation Report,” Report 0093, Federal Transit Administration, U.S. Department of Transportation, January. https://www.transit.dot.gov/sites/fta.dot.gov/files/docs/FTA_Report_No._0093.pdf.
FTA. (2016b). “2015 National Transit Summary and Trends.” FTA Office of Budget and Policy, October. https://www.transit.dot.gov/sites/fta.dot.gov/files/docs/2015%20NTST.pdf.
FTA. (2017). “Bus Rapid Transit.” Federal Transit Administration, U.S. Department of Transportation, updated January 6, 2017. https://www.transit.dot.gov/research-innovation/bus-rapid-transit.
GAO. (2015). “Intelligent Transportation Systems: Vehicle-to-Infrastructure Technologies Expected to Offer Benefits, but Deployment Challenges Exist.” GAO-15-775, U.S. Government Accountability Office, September 15. http://www.gao.gov/products/GAO-15-775.
Iseki, H., M. Smart, B.D. Taylor, and A. Yoh. (2012). “Thinking Outside the Bus.” Access, 40, Spring.
APPENDIX D: TRANSIT AUTOMATION BENEFIT-COST ANALYSIS REPORT
FEDERAL TRANSIT ADMINISTRATION 126
ITDP. (2017). “What is BRT?” Institute for Transportation & Development Policy, https://www.itdp.org/library/standards-and-guides/the-bus-rapid-transit-standard/what-is-brt/, accessed September 2017
Kockelman, K., S. Boyles, P. Avery, C. Claudel, L. Loftus-Otway, D. Fagnant, P. Bansal, M. W. Levin, Y. Zhao, J. Liu, L. Clements, W. Wagner, D. Stewart, G. Sharon, M. Albert, P. Stone, J. Hanna, R. Patel, H. Fritz, T. Choudhary, T. Li, A. Nichols, K. Sharma, and M. Simoni. (2016). “Bringing Smart Transport toTexans: Ensuring the Benefits of a Connected and Autonomous TransportSystem in Texas—Final Report.” Technical Report 0-6838-2, Center forTransportation Research, The University of Texas at Austin, prepared forTexas Department of Transportation and Federal Highway Administration,August.
Lahart, D. (2017). “Transforming Transportation for the World’s Aging Population and People with Disabilities.” Age & Ability – Powered by IBM Accessibility, January 6. http://ageandability.com/2017/01/06/transforming-transportation-for-the-worlds-aging-population-and-people-with-disabilities/.
Lutin, J. M., and A. L. Kornhauser. (2014). “Application of Autonomous Driving Technology to Transit: Functional Capabilities for Safety and Capacity,” presentation to 93rd Annual TRB Meeting, Washington, DC.
Lutin, J. M., A. L. Kornhauser, J. Spears, and L.F. Sanders. (2016). “A Research Roadmap for Substantially Improving Safety for Transit Buses through Autonomous Braking Assistance for Operators.” Transportation Research Board Annual Meeting 2016, 16-1246.
Mangones, S. C., P. Fischbeck, and P. Jaramillo. (2017). “Safety-related Risk and Benefit-Cost Analysis of Crash Avoidance Systems Applied to Transit Buses: Comparing New York City vs. Bogota, Colombia.” Safety Science 91, 122-131.
Mitretek. (2005). “Multimodal Vehicle Assist and Automation: Transit Operating Scenario Analysis.” Prepared for FHWA and FTA, April.
NHTSA. (2014). “NHTSA Issues Advance Notice of Proposed Rulemaking and Research Report on Ground-Breaking Crash Avoidance Technology: ‘Vehicle-To-Vehicle Communications: Readiness of V2V Technology for Application.’” National Highway Traffic Safety Administration (NHTSA), U.S. Department of Transportation, August. https://www.safercar.gov/staticfiles/safercar/v2v/V2V_Fact_Sheet_101414_v2a.pdf.
OECD. (2015). “Urban Mobility System Upgrade: How Shared Self-Driving Cars Could Change City Traffic.” OECD International Transport Forum.
Pessaro, B. (2013). “Impacts of the Cedar Avenue Driver Assist System on Bus Shoulder Operations.” Journal of Public Transportation, 16(1).
Pessaro, B. (2016). “Evaluation of Automated Vehicle Technology for Transit – 2016 Update.” Center for Urban Transportation Research, University of South Florida. April. https://www.nctr.usf.edu/wp-content/
APPENDIX D: TRANSIT AUTOMATION BENEFIT-COST ANALYSIS REPORT
FEDERAL TRANSIT ADMINISTRATION 127
uploads/2016/04/77060-21-Evaluation-of-Automated-Vehicle-Technology-for-Transit-2016-Update.pdf.
Roland Berger. (2016). “Automated Trucks: The Next Big Disruptor in the Automotive Industry?” Presentation, April. https://www.rolandberger.com/publications/publication_pdf/roland_berger_automated_trucks_20160517.pdf.
SAE. (2016). “Taxonomy and Definitions for Terms Related to Driving Automation Systems for On-Road Motor Vehicles” SAE International, September 30. http://standards.sae.org/j3016_201609/.
Sangtarash, F., V. Esfahanian, H. Nehzati, S. Haddadi, M. A. Bavanpour, and B. Haghpanah. (2009). “Effect of Different Regenerative Braking Strategies on Braking Performance and Fuel Economy in a Hybrid Electric Bus Employing CRUISE Vehicle Simulation,” SAE International Journal of Fuels and Lubricants 1(1): 828-837. doi:10.4271/2008-01-1561. http://papers.sae.org/2008-01-1561/.
Spieser, K., K. Treleaven, R. Zhang, E. Frazzoli, D. Morton, and M. Pavone. (2014). “Toward a Systematic Approach to the Design and Evaluation of Automated Mobility-on-Demand Systems.” In G. Meye and S. Beiker (editors), Road Vehicle Automation (Lecture Notes in Mobility), Springer.
TRB. (2007). “Bus Rapid Transit Practitioner’s Guide,” TCRP Report 118. Transportation Research Board, Washington, DC, 1-256, https://nacto.org/docs/usdg/tcrp118brt_practitioners_kittleson.pdf.
USDOT. (2016). GlidePath Prototype Application. AERIS, Intelligent Transportation Systems Joint Program Office. https://www.its.dot.gov/research_archives/aeris/aeris_factsheet_glidepath.htm.
Winter, K., O. Cats, G. Homem de Almeida Correia, and B. van Arem. (2016). “Designing an Automated Demand-Responsive Transport System: Fleet Size and Performance Analysis for a Campus–Train Station Service.” Transportation Research Record, 2542, Transportation Research Board, Washington, D.C., 75-83. http://trrjournalonline.trb.org/doi/abs/10.3141/2542-09.
APPENDIX
FEDERAL TRANSIT ADMINISTRATION 128
E Stakeholders ConsultedFTA conducted significant stakeholder outreach through workshops, interviews, and webinars to, among other items, obtain information on risks and barriers, help develop technology packages and use cases, and inventory early demonstration projects.
Academics• California PATH – Steven Shladover, Wei-Bin Zhang
• USF Center for Urban Transportation Research (CUTR) – Dennis Hinebaugh
• MIT – Jonathan How
• New Jersey Institute of Technology – Jerome Lutin
• Purdue – Michael Cline, Jason Wasson, Darcy Bullock, Cliff Wojtalewicz
• TRB Committee AP040 – Walter Kulyk
• University of Minnesota – Max Donath
• University of Nevada, Reno – Carlos Cardillo
Federal Partners• FHWA – Bob Sheehan, Carl Andersen, Dale Thompson, Gene McHale,
Kevin Dopart, Crystal Frederick, FMCSA – Jeff Loftus
• NHTSA – Dee Williams, Paul Rau, Robert Heilman
• OST-R – Chris Gerdes
Federal Transit Administration • Budget and Policy Office – Kimberly Gayle
• Chief Council’s Office – Ellen Partridge (formerly of FTA), Helen Serassio
• Civil Right Office – Kimberly Brown-Mason
• Office of the Administrator – Carolyn Flowers (formerly of FTA), Kate Roetzer, Richard Steinmann
• Planning and Environment – Sherry Riklin, Elissa McDade
• Program Management – Bruce Robinson
• Region 1 – Mary Beth Mello
• Region 3 – Terry Garcia Crews
• Region IX – Leslie Rogers, Ray Tellis, Ed Carranza, Ray Tsukis
• Research, Demonstration and Innovation – Jamie Pfister, Vincent Valdes, Gwo-Wei Torng, Tyler Messa (formerly of FTA)
• Transit Safety Oversight – Aloha Ley, Thomas Littleton, Angela Dluger
• Local Government/Municipal Planning Organization
APPENDIX E: STAKEHOLDERS CONSULTED
FEDERAL TRANSIT ADMINISTRATION 129
• Corridor MPO/Linn County LIFTS – Brandon Whyte, Tom Hardecopf
• LA DOT – Seleta Reynolds, Marcel Porras, Michael Lim, Jay Kim
• SANDAG – Peter Thompson
Industry• Continental – Hiren Desai
• Gillig – Joseph Policarpio, Vince Chan
• HNTB – Robert James
• Local Motors – Hugh Palmer
• May Mobility – Steve Vozar
• Mobileye – Uri Tamir
• Munich Reinsurance America – Michael Scrudato, Bruce Weisgerber
• Nexteer – Brian Darling
• nuTonomy – Emilio Frazzoli
• Proterra – Gary Horvat
• Rosco Vision – Ben Englander
Non-ProfitsorAssociations• AASHTO – Gummada Murthy, Patrick Zelinski
• American Public Transportation Association (APTA) – Lou Sanders, Art Guzzetti
• Shared Use Mobility Center – Sharon Feigon, Al Benedict, Colin Murphy
• Specialty Equipment Market Association (SEMA) – John Waraniak
State Departments of Transportation• CalTrans – Balwinder Tarlok, Greg Larson, Pete Hansra
• Minnesota Department of Transportation – Jay Hietpas
• Virginia DRPT – Jennifer Debruhl, Jitender Ramchandani
Transit Agencies• AC Transit – Jim Cunradi
• Access Services LA – William Tsuei
• Bi-State Development Agency – Kerry Kinkade, Ted Zimmerman, and Paul Stefanski
• Blacksburg Transit – Tim Witten
• Denton County Transportation Authority – Jonah Katz, Raymond Suarez
APPENDIX E: STAKEHOLDERS CONSULTED
FEDERAL TRANSIT ADMINISTRATION 130
• Greater Cleveland Regional Transit Authority – Michael Lively
• Hillsborough Area Regional Transit – Justin Begley
• IndyGo – Justin Stuehrenberg
• KCATA – Jameson Auten, Mike Grigsby, Tyler Means
• LA METRO – Marla Westervelt
• LYNX – Doug Jamison
• MBTA – David Block-Schachter
• MetroLINK – Jeff Nelson
• NYCT/MTA – Sunil Nair
• Rhode Island Public Transit Authority – Sarah Ingle
• Valley Metro – Angie Devore, Carol Ketcherside, Rob Antoniak
APPENDIX
FEDERAL TRANSIT ADMINISTRATION 131
F Technology Literature Review and Analysis IntroductionThe FTA transit automation research team is preparing a Strategic Transit Automation Research Plan. An essential step in developing a research plan is understanding the current state of the practice. The research team conducted a literature review to gauge the level of research and development in automated bus transit in the United States and internationally. This report is divided into three sections: an annotated bibliography, which reviews the state of the practice; a summary of transit automation pilots and demonstrations; and a scan of enabling technologies for bus transit automation.
The state-of-the-practice scan reviewed articles published in the last five years relevant to bus transit automation. The articles were selected based on their applicability to bus transit applications that do not require a fixed guideway. This intentionally excludes automated transit networks (ATN) and rail applications, since these do not align with the research plan goals.
Enabling technologies were selected in the categories of communications, sensing, positioning, processing, and control systems. The scan focused on current technologies, but also included more niche technologies such as wire-in-pavement, which have been used in proof-of-concept demonstrations for transit automation. Please note that USDOT is not endorsing a particular enabling technology or set of technologies by including them in this report. They are included purely for informational purposes.
Literature SummaryOverall, the literature review revealed that bus transit automation research and development in the United States lags behind that which is taking place in Europe and Asia. There were relatively few relevant domestic projects identified in the review; all of the completed American automated bus demonstrations have been supported by funding from FTA, primarily through its Vehicle Assist and Automation (VAA) program.
Several benefits of bus transit automation were identified in the literature review articles. Overall, transit automation is expected to address problems of road capacity, safety and connectivity to other modes. The articles that focused on safety generally agreed that automation is a potential tool to mitigate crash risks for transit buses. The literature included consideration of how automated taxis and similar services could reduce the costs of first/last mile trips, and change the nature or role of public transit in this area, essentially redefining public
APPENDIX F: TECHNOLOGY LITERATURE REVIEW AND ANALYSIS
FEDERAL TRANSIT ADMINISTRATION 132
transportation from what it is today. Some articles also investigated the benefit automation could have on equity. Automated services will help eliminate driver bias/discrimination in first/last mile applications while expanding the reach of transit to areas that are currently underserved.
The literature also covered a number of barriers to implementation. A common barrier to implementation discussed in the articles was high cost, especially compared to applications for light-duty vehicles. Buses and other heavy-duty vehicles require a different approach to automation adaption than light-duty vehicles, which have received more research and development attention. Bus characteristics require additional consideration from light-duty vehicles for the development of collision avoidance and other automated safety applications. Some of the technical challenges identified in the articles were:
• Passenger comfort and ride quality
• System integration
• Telecommunication integration (e.g., unstable GPS signals)
• Inaccurate technology readings (e.g., false warnings)
• Safety concerns (e.g., vehicle malfunction)
• Environmental impacts (e.g., heat waves, drought)
Non-technical issues revealed by the demonstration projects were legal permissions to operate vehicles without drivers or without vehicle components (such as steering wheels), liability, procurement issues/delays, as well as issues of public perception and trust. Some of the literature asked whether, when, and how the general public will accept ride-sharing in automated vehicles. The general conclusion is that acceptance and trust are critical for integrating automated vehicles into shared transportation. Passengers express a sense of security from the presence of an operator; when surveyed, about 40% indicate a preference for higher fares with staff on board for all services. However, the majority of individuals surveyed preferred automated service to non-automated services. This result indicates a general public acceptance of automated bus service, especially among younger people and male participants. Overall, the research recommends an incremental approach to automation that provides users with hands-on experience at every phase.
The literature review also included documentation of transit automation deployment projects from the U.S. and abroad. The completed FTA VAA demonstrations in Oregon and California were included, as well as non-VAA projects which are currently planned or underway. The international demonstration projects were from France, Germany, the Netherlands, United Kingdom, Japan, Australia, and three from the CityMobil2 initiative in Europe (France, Switzerland, and Greece). None of the demonstrations included
APPENDIX F: TECHNOLOGY LITERATURE REVIEW AND ANALYSIS
FEDERAL TRANSIT ADMINISTRATION 133
automation of yard or maintenance facilities. The demonstrations used a variety of automation technologies – magnetic markers, GPS, radar, lidar, cameras, and electric drives. The technologies were used for lane keeping, precision docking, transit signal priority (TSP), automated taxis, and urban circulators. One article identified several characteristics unique to bus operations compared to light-duty vehicles, including blind spot locations, component replacement and maintenance requirements, forces acting on seated and standing passengers, operator training and workload, proximity of pedestrians and waiting passengers, sensor placement, and vehicle lifespan.
State of the Practice: Annotated BibliographyGe, Y., Knittel, C. R., MacKenzie, D., and Zoepf, S. (2016) “Racial and Gender Discrimination in Transportation Network Companies.” NBER Working Paper. 22776 (1-47).
The paper summarizes research conducted to ascertain the degree of race and gender discrimination present in two larger Transportation Network Companies (TNC) in Seattle and Boston. The experiment investigated differences in wait times and the frequency of ride cancellations between Caucasian and African American passengers. The results show that African Americans had to wait significantly longer than Caucasians for Company A than Company B. Company B reveals the profile of the rider in advance of the driver accepting the ride, whereas Company A reveals the passenger only after the ride has been accepted. The African American participants also experienced a rate of cancellation three times higher than their Caucasian counterparts. None of the companies captured in the research have policies related to discriminatory behavior; rather, it is a result of the behavior of individual TNC drivers. TNCs often are considered a solution to the first/last mile connection for transit service. The potential presence of discriminatory practices among TNC drivers limits the benefits of the service for minority and underserved communities. The presence of discrimination among TNC drivers could translate to a benefit to the automating the services. Given the evidence from this study, one could hypothesize that an automated service would treat all ride requests equally and be a more equitable system.
Gregg, R., and Pessaro, B. (2016). “Vehicle Assist and Automation (VAA) Demonstration Evaluation Report.” Federal Transit Administration, Report 0093.
This report, prepared by the USF Center for Urban Transportation Research (CUTR) for FTA, summarizes results from a pilot test of a Vehicle Assist and Automation (VAA) program providing a lateral control and precision docking application for full-size transit buses. The project was conducted on a 1.5-mile BRT segment at Lane Transit District (LTD) in Eugene, Oregon, in 2013–2015, with a total of 10 months of operational data.
APPENDIX F: TECHNOLOGY LITERATURE REVIEW AND ANALYSIS
FEDERAL TRANSIT ADMINISTRATION 134
The VAA technology was based on magnetic markers in the roadway with a GPS backup. Technical results indicate that the VAA did improve lateral control. For example, the maximum deviation from the lane center was 11 cm with VAA vs. 44 cm for manual driving; at the boarding platform, the maximum deviation was 2 cm with VAA vs. 11 cm for manual driving. The safety impacts were assessed by comparing incident rates for VAA and non-VAA buses on the test segment. The VAA vehicle had fewer preventable incidents, but more data would likely be needed to draw more definitive conclusions. Vehicle speeds were also slightly slower with VAA enabled. One unintended result of the VAA system was higher lateral acceleration and a perception of a “jerky” ride from some passengers and operators. This was due to tight adherence to lane-centering over the curvy route. There was also one incident during the testing phase in which a bus under VAA control hit a bump and jumped a curb; this led to an interruption of the project while the VAA was reprogrammed. The project schedule was also interrupted due to issues related to legal liability and indemnification. These institutional issues are worth noting, as they delayed the project at LTD and led one of the other intended project partners, Alameda-Contra Costa Transit, to drop out of the pilot entirely. The report also has more detailed technical and operational lessons learned, though many relate to the magnetic guidance technology and may be less relevant for future automation approaches. Overall, LTD staff considered the precision docking to be the most successful part of the project, which is consistent with findings from the rider survey.
Huang, J., and Tan, H-S. (2016). “Development and Validation of an Automated Steering Control System for Bus Revenue Service.” IEEE Transactions on Automation Science and Engineering, 13(1), 227-37.
The study retrofitted an articulated New Flyer bus for LTD in Eugene, Oregon, to allow for more consistent operation, better safety, and improved rider experience on a narrow and winding urban BRT route, the Franklin EmX. Using magnetic sensors in the roadway, the pilot project successfully implemented lane keeping assistance and precision docking. Because of cost concerns, the project wanted to prove the feasibility of using double redundancy instead of triple redundancy for sensing and computing systems. By implementing a variety of software approaches, there was no negative impact on the safety of the system, despite eliminating one layer of redundancy. This article also includes visualizations of lane deviation under manual control vs. automated lane keeping assist control, as well as images of manual docking vs. precision docking. Additionally, there are a number of engineering-specific measurements and formulae to describe the automated system’s attributes. The system was the first in the U.S. to operate revenue service using these automated assistance approaches, and it operated from June 2013 to May 2015.
Lesh, M. (2016). “Automation Advancing into Transit Bus Operations: Lane Assist, Crash Avoidance—and More.” Transportation Research News, 303, 32.
APPENDIX F: TECHNOLOGY LITERATURE REVIEW AND ANALYSIS
FEDERAL TRANSIT ADMINISTRATION 135
The article provides a brief overview of automation for transit in general, including lane assist technology for BRT, crash avoidance systems for transit vehicles, and slow-moving, automated shuttles for circulator or first-/last-mile service. The article identifies advanced driver assistance systems (ADAS—lane keep and collision avoidance) and Society of Automotive Engineers (SAE) Level 4/5 automation using radar, camera, lidar, and GPS technologies. However, the article does not discuss technical aspects relating to strengths and weaknesses of the technologies. It does note that lane assist technology can help BRT safely operate on more narrow lanes (e.g., freeway shoulder). There are several automation pilots identified in the article, including the Minnesota Valley Transit Authority (MVTA) and LTD in Oregon operating buses with lane assist technology. Several transit agencies are working with the Washington State Transit Insurance Pool to test collision avoidance systems, and Local Motors demonstrating an automated shuttle in Maryland.
Liu, R., Fagnant, D. J., and Zhang, W-B. (2016). “Beyond Single Occupancy Vehicles: Automated Transit and Shared Mobility.” In G. Meyer and S. Beiker (eds.), Road Vehicle Automation 3, Lecture Notes in Mobility, 259-275.
This paper documents the content of the two-day session on Automated Transit and Shared Mobility Track (ATSM) that was held during the 2015 Automated Vehicle Symposium (AVS). It serves as a formal record in identifying past, current, and planned deployment projects; classifying various technologies and service models; discussing questions around the definition of transit and the implications for the changing roles of transit and shared mobility as vehicle automation progresses. The paper opens by asking the following broad questions:
• How will vehicle automation disrupt traditional transit systems?
• What new and different types of market-driven and publicly-run frameworks will emerge?
• How should we invest our limited public resources?
The article documents several deployments around the world. Deployments in the U.S. include tests of precision docking, lane centering, and platooning technologies by PATH and VAA, as well as the FTA/ITS JPO’s Mobility On Demand (MOD) Program. European demonstration projects cover automated transit in France, Germany, the Netherlands, and United Kingdom that use lane centering, electronic guidance, and precision docking. Other international deployments include Japan (automated buses for World Expo) and Australia (mechanical guidance system for buses). The paper also discusses the evolving role of TNCs and other “sharing-economy” models. As automated on-demand shared-use vehicle fleets become closer to reality, the distinctions between shared mobility and transit systems will be more blurred; potentially the only difference may be the difference of public or private ownership. While the

APPENDIX F: TECHNOLOGY LITERATURE REVIEW AND ANALYSIS
FEDERAL TRANSIT ADMINISTRATION 136
distinctions between what does and does not constitute transit may seem somewhat arbitrary, they have real world consequences (e.g., regulatory and public funding environment for transit is dramatically different from the shared mobility space).
Lutin, J. M., and Kornhauser, A. L. (2014). “Application of Autonomous Driving Technology to Transit – Functional Capabilities for Safety and Capacity.” TRB 93rd Annual Meeting Compendium of Papers, 14-207.
The article is based on two use cases for automated technology—decreasing liability for transit agencies through safer operations and increasing capacity along transit routes through shorter following distances within a dedicated bus lane. The study projects impacts of implementing these technologies for New Jersey Transit and its express commuter bus routes into Manhattan. The first case is based on the cost of equipping buses with a system similar in function and cost to the 2014 Mercedes S-class automated assistance package. Recognizing that a transit bus adaptation could be more expensive than for the sedan adaptation, the authors provide cost estimates at various multipliers, then weigh those costs of implementation with the projected liability savings at multiple levels of risk reduction. The authors estimate the amount of time to recoup investment ranges from 0.6 years (with a 90% annual claims reduction per bus and $2,800 retrofit cost) to 28.8 years (with a 10% annual claims reduction per bus and $14,000 retrofit cost). The second case is based on using automation technology (adaptive cruise control in conjunction with V2V technology for speed/braking) to drastically decrease the following distance between buses in a dedicated bus lane. The authors estimate that capacity on the study corridor could be increased by approximately 164,160 passengers per hour (a 300% increase) by using the technologies to safely decrease average following distance from 212 feet to 6 feet.
Lutin, J. M., Kornhauser, A. L., Spears, J., and Sanders, L. F. (2016). “A Research Roadmap for Substantially Improving Safety for Transit Buses through Autonomous Braking Assistance for Operators.” TRB Annual Meeting 2016, 16-1246.
The authors argue that partial automation could both improve safety and reduce casualty and liability expenses. Although significant progress is being made in bringing autonomous collision avoidance and autonomous emergency braking to automobiles and commercial vehicles, development of these technologies for the transit industry is extremely slow. The authors estimate that forward-collision avoidance could address more than 60% of claims greater than $100,000 related to bus collisions. They also note that the Insurance Institute for Highway Safety (IIHS) has found that collision avoidance systems are effective for light-duty passenger vehicles, as well as heavy-duty Class 8 trucks. These systems will need to address unique bus characteristics including blind spot locations, component replacement and maintenance requirements, forces acting on seated and standing
APPENDIX F: TECHNOLOGY LITERATURE REVIEW AND ANALYSIS
FEDERAL TRANSIT ADMINISTRATION 137
passengers, operator training and workload, proximity of pedestrians and waiting passengers, sensor placement, and vehicle lifespan. The authors identify an important point about the role of aftermarket/retrofit systems—autonomous collision avoidance systems should not be expected to last for the life of the bus. Software and electronic components in the systems will be replaced by newer versions over time as the original versions will no longer be available. Sensors and processors are subjected to harsh environmental conditions in the transit operating environment. It is expected that components and even entire systems will need to be replaced over the life of the vehicle. The authors’ objectives are to 1) educate the industry on the magnitude of the problem, 2) provide a draft program that would lead to the desired outcomes, and 3) seek stakeholder involvement to refine the program and support to pursue funding for it. The paper suggests a research plan with four phases:
• Phase 1 – Create a broad, inclusive stakeholder group of transit agencies and others and form technical working groups
• Phase 2 – Conduct a research assessment related to casualty and liability claims for buses
• Phase 3 – Develop functional requirements and standards for transit bus automation
• Phase 4 – Develop testing capacity, including a prototype test bed, simulator, and data logger/analyzer, as well as perform field operational testing.
Lutin, J. M., Spears, J., Wang, Y., Englander, B, and Clancy, S. M. (2016). “Testing Transit Bus Collision Avoidance Warning Systems in Revenue Operations – Active Safety Collision Warning Pilot in Washington State.” Transportation Research Board (submitted), 17-01283.
This paper documents a research project to test bus collision avoidance warning systems (CAWS) being performed by the Washington State Transit Insurance Pool (WSTIP) and the University of Washington (research is currently in progress). The research is funded with a grant from the Innovations Deserving Exploratory Analysis (IDEA) program of TRB. The project includes CAWS installed on 38 buses across 8 transit agencies (6 different types of transit buses produced by 3 manufacturers, including high-floor, low-floor, diesel, hybrid, and electric trolley buses). The CAWS equipment includes indicator lights on the windshield—a yellow light flashes to indicate the presence of pedestrians that are 2.5 seconds away from a collision with the bus and a red light flashes (plus an alarm) if pedestrians are 1 second away.
Equipment was installed from 8/2015–3/2016; incident and video data collection occurred from 3/2016–7/2016. No CAWS-equipped buses were involved in any collision with cyclists or pedestrians during the data collection period. Although 10 incidents were reported for CAWS-equipped buses, none of the events
APPENDIX F: TECHNOLOGY LITERATURE REVIEW AND ANALYSIS
FEDERAL TRANSIT ADMINISTRATION 138
resulted in injuries, and none of the incident types would have generated alerts from the systems. Data analysis is ongoing, and the University of Washington is developing the methodology and video processing software for near-miss detection and classification (the analysis included computer vision techniques, such as pedestrian detection and optical flow analysis). The authors identified three critical issues—reducing product development costs, determining the cost-effectiveness of the product to potential customers, and providing efficient paths to reduce the cost of the installation—and referenced many risks and barriers with respect to this project:
• Calibration and installation required calls to the supplier in Israel, which were difficult to schedule due to time differences.
• Installation required custom fitting for different bus types (“one size fits all” did not always work for the installation kit), increasing the time and expense for installation.
• Agency scheduling pressures limited out-of-service time for buses and affected the ability of the research team to efficiently use labor.
• There are already too many buttons on the dashboard—CAWS systems contribute to the already congested instrumentation.
• The testing procedure for testing pedestrian detection and warning is dangerous (pedestrians walking towards a moving bus), and a better procedure is needed.
• Various actors (e.g., transit agencies and vendors) need to understand each other’s business models.
Mangones, S.C., Fischbeck, P., and Jaramillo, P. (2017). “Safety-related Risk and Benefit-Cost Analysis of Crash Avoidance Systems Applied to Transit Buses: Comparing New York City vs. Bogota, Colombia,” Safety Science, 91, 122-131.
The authors present a prospective benefit-cost analysis of automation-enabled safety applications for transit buses in New York, New York and Bogota, Colombia, focusing on forward- and side-collision warning and avoidance. As distinct from the limited existing research on transit automation safety benefits, which focuses on direct financial impacts to agencies, the authors estimate benefits using societal values of avoided injuries. These are estimated using a value of statistical life (VSL) for each city, with the New York value similar to USDOT’s recommendation. Crash avoidance potential was estimated using historical crash data and solicitation of expert opinion on the likely range of impacts of the safety applications in the two cities, with Monte Carlo simulation of the experts’ distributions. Equipment costs were based on existing technologies available in the light-duty market. Modeling results indicated that the technology would have positive net benefits in most scenarios (83–100%) for NYC, but less so in Bogota
APPENDIX F: TECHNOLOGY LITERATURE REVIEW AND ANALYSIS
FEDERAL TRANSIT ADMINISTRATION 139
due to the locally lower VSL. However, there would be other benefits that were not captured in the modeling, including reduced crash-related congestion.
One interesting finding is that the collision prevention systems appear to be more cost-effective than the warning systems, due largely to higher assumed safety effectiveness. However, collision avoidance systems that have been developed for other vehicle types will need significant modification for use in transit buses. The authors note that automation technology for transit buses has not necessarily received as much attention as for light-duty vehicles and heavy-duty trucks, but that greater public interest could spur innovation and cost reductions. One of the limitations of the research is that it appears to be based on overall crash reductions rather than a more detailed analysis of specific crash scenarios. The cost side of the ledger would also benefit from additional exploration of technology lifecycle costs, as well as “soft” costs, such as operator training. There is relatively little available information to support benefit estimation or benefit-cost analysis, either for transit agency decision-makers or for overall evaluation of impacts.
Merat, N., Madigan, R., and Nordhoff, S. (2016) “Human Factors, User Requirements, and User Acceptance of Ride-Sharing in Automated Vehicles.” Roundtable on Cooperative Mobility Systems and Automated Driving.
This article provides an overview of human factors that will likely impact whether, when and how the general public will accept ride-sharing in automated vehicles. Understanding and responding to how potential passengers perceive automated vehicles will greatly improve how they are integrated into the existing public transportation system. In general, the research indicates that high rider trust and acceptance of the automated vehicles is paramount to their integrated use. Interaction and hands-on experience with a new technologies generally increases the level of acceptance and trust; however, there have been limited opportunities to investigate this with automated shared vehicles. Acceptance of automated vehicles will be built on their ability to operate reliably while optimizing connectivity with other parts of the transportation system. The usability of an automated system impacts the degree of trust the public has in it. The public must also be made aware of the capabilities of the system to manage expectations since trust comes in part from appropriate expectations for automated transit. The authors refer to several other research papers documenting differences across cultural, gender and age groups in their willingness to trust automated vehicles. While the research is not based on hands-on experience with the vehicles, they identify a need for automated systems to be responsive to cultural and demographic preferences to be accepted and trusted. This is important for both system and vehicle design, as well as how the vehicle communications with passengers and others on the street (cars, pedestrians and bicyclists).
APPENDIX F: TECHNOLOGY LITERATURE REVIEW AND ANALYSIS
FEDERAL TRANSIT ADMINISTRATION 140
Regarding communications, there are specific implicit and explicit communications between pedestrians and drivers that represent an enormous challenge for automated vehicle use. To date, there have not been many experimental studies to better understand communication techniques and their acceptance for automated vehicles. One key result of research is that the most important message to a pedestrian or bicyclist is that the automated vehicle has detected their presence. The report suggests development of new, universally acceptable communication standards for use in automated vehicles. Research has also been conducted on the extent to which automated vehicles can serve mobility-impaired users. One suggested benefit of automated shared vehicles is the opportunity for older adults who have given up driving to be able to resume social participation lost by not being able to drive. However, this group has been shown to generally have a lower level of trust in self-driving vehicles (again without hands-on experience). For those with limited mobility, use of automated shared vehicles needs to be easy to access and use and non-intrusive to gain their trust and acceptance. Overall, the authors “recommend that the pathway to adoption and acceptance of AVs should be incremental and iterative, providing users with hands-on experience of the systems at every stage. This removes unrealistic, idealized, expectations, which can ultimately hamper acceptance.”
Nowakowski, C., Shladover, S.E., and Tan, H.-S. (2015). “Heavy Vehicle Automation: Human Factors Lessons Learned.” Procedia Manufacturing: 6th International Conference on Applied Human Factors and Ergonomics and the Affiliated Conferences, AHFE 2015, 3, 2945-2952.
This paper highlights some of the potential differences between heavy vehicle and passenger car automation concepts. The authors identify different basic motivations for automation of heavy-duty vehicles (e.g., increased productivity, decreased fuel consumption, and minimizing losses due to avoidable crashes) as compared to light-duty passenger vehicles. These different motivations may lead to different use cases and system designs. Institutional considerations may also influence design and implementation of automation systems and driver interfaces. Special use cases must be considered when designing of heavy vehicle automation—they may challenge conventional design wisdom and require more driver training than is practical for passenger vehicles. While much of the discussion was focused on Class 8 combination trucks, there were several bus-related applications. These include lane assist (enables narrow transit lanes, hence reduced infrastructure costs), automated docking (allows faster and more convenient boarding/alighting) and higher speed travel through narrow toll plazas (decreases travel time and lower risk of vehicle damage).
The paper also discusses principles and design considerations between heavy and light-duty vehicles. For instance, the display and controls for heavy-duty vehicles may be different than for light-duty vehicles. Auditory collision warning systems for buses may irritate and alarm passengers or lead to other issues. Heavy-duty
APPENDIX F: TECHNOLOGY LITERATURE REVIEW AND ANALYSIS
FEDERAL TRANSIT ADMINISTRATION 141
applications prioritize maintaining driver focus and minimizing training needs for system operation (e.g., use of simple LED displays rather than more complex LCD displays used in passenger vehicles). Other design considerations from the article include:
• The value of partial automation for buses to create operational efficiency is greater compared to passenger vehicles.
• Fleets may be able to provide more training to drivers, which increases the feasibility of additional applications that are otherwise impractical for passenger cars.
• Bus operation systems need to account for a full range of driver motions and activities. For instance, low adjustability of seating in a bus can lead to issues with steering wheel touching driver’s clothing, which may override/disengage an automated feature. Crowded instrument panels and need for extreme reaches for some controls may make it difficult to make new controls easily accessible while avoiding accidental contact and activation.
• Tests with automated transit bus docking have shown that system initiated automation can be acceptable if the driver expects it, as it removes an extra step and allows the driver to keep both hands on the wheel
Pessaro, B. (2015). “Evaluation of Automated Vehicle Technology for Transit.” National Center for Transit Research (NCTR) Report BDV26 977-07, USF Center for Urban Transportation Research.
The report summarizes CUTR research on the use of AV technology in transit vehicles on behalf of the Florida Department of Transportation (FDOT). FDOT is interested in AV applications for transit and, according to the report, is testing collision avoidance technology on transit vehicles. The study includes results from research and outreach to domestic and international transit vehicle manufacturers, the VAA program pilots (MVTA, LTD, and San Diego Association of Governments (SANDAG)), transit AV applications related to the Connected Vehicle safety pilot in Ann Arbor, Michigan, and international personal rapid transit (PRT) demonstrations. Overall, the research concludes that the state of AV technology in transit is very limited and most planned demonstration projects have been cancelled or scaled back significantly. Of the bus manufacturers contacted,69 only Nova Bus/Volvo reports working on a pedestrian/bicycle warning system on transit buses. Their efforts do not include technology that automates vehicle operations.
The purpose of the SANDAG Bus on Shoulder System (BOSS) was to demonstrate the feasibility of increasing express train capacity by running express service on the narrow should lane. SANDAG worked with AV technology
69 CUTR contacted New Flyer/NABI, Gillig, El Dorado National and Nova Bus/Volvo in the U.S. and the International Association of Public Transport (UITP).
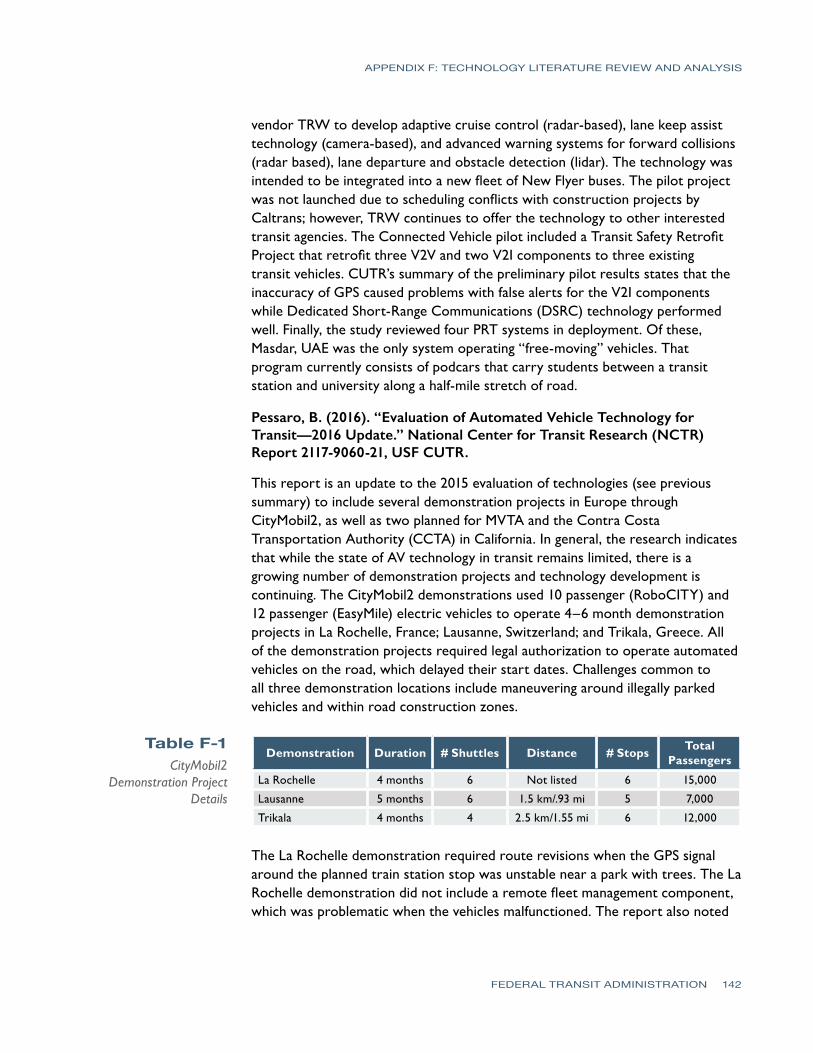
APPENDIX F: TECHNOLOGY LITERATURE REVIEW AND ANALYSIS
FEDERAL TRANSIT ADMINISTRATION 142
vendor TRW to develop adaptive cruise control (radar-based), lane keep assist technology (camera-based), and advanced warning systems for forward collisions (radar based), lane departure and obstacle detection (lidar). The technology was intended to be integrated into a new fleet of New Flyer buses. The pilot project was not launched due to scheduling conflicts with construction projects by Caltrans; however, TRW continues to offer the technology to other interested transit agencies. The Connected Vehicle pilot included a Transit Safety Retrofit Project that retrofit three V2V and two V2I components to three existing transit vehicles. CUTR’s summary of the preliminary pilot results states that the inaccuracy of GPS caused problems with false alerts for the V2I components while Dedicated Short-Range Communications (DSRC) technology performed well. Finally, the study reviewed four PRT systems in deployment. Of these, Masdar, UAE was the only system operating “free-moving” vehicles. That program currently consists of podcars that carry students between a transit station and university along a half-mile stretch of road.
Pessaro, B. (2016). “Evaluation of Automated Vehicle Technology for Transit—2016 Update.” National Center for Transit Research (NCTR) Report 2117-9060-21, USF CUTR.
This report is an update to the 2015 evaluation of technologies (see previous summary) to include several demonstration projects in Europe through CityMobil2, as well as two planned for MVTA and the Contra Costa Transportation Authority (CCTA) in California. In general, the research indicates that while the state of AV technology in transit remains limited, there is a growing number of demonstration projects and technology development is continuing. The CityMobil2 demonstrations used 10 passenger (RoboCITY) and 12 passenger (EasyMile) electric vehicles to operate 4–6 month demonstration projects in La Rochelle, France; Lausanne, Switzerland; and Trikala, Greece. All of the demonstration projects required legal authorization to operate automated vehicles on the road, which delayed their start dates. Challenges common to all three demonstration locations include maneuvering around illegally parked vehicles and within road construction zones.
Table F-1CityMobil2
Demonstration Project Details
Demonstration Duration # Shuttles Distance # Stops Total Passengers
La Rochelle 4 months 6 Not listed 6 15,000
Lausanne 5 months 6 1.5 km/.93 mi 5 7,000
Trikala 4 months 4 2.5 km/1.55 mi 6 12,000
The La Rochelle demonstration required route revisions when the GPS signal around the planned train station stop was unstable near a park with trees. The La Rochelle demonstration did not include a remote fleet management component, which was problematic when the vehicles malfunctioned. The report also noted
APPENDIX F: TECHNOLOGY LITERATURE REVIEW AND ANALYSIS
FEDERAL TRANSIT ADMINISTRATION 143
that more identifiable markings along the route would have promoted better bicycle and pedestrian interactions. The Lausanne demonstration did include remote fleet management, which enabled operators to take control of the vehicle when a malfunction occurred. However, a heat wave and dry weather caused dusty roads that hindered lidar sensors in detecting obstacles and required increase air conditioning use, which impacted batteries and thus the vehicles’ operations. Two other European demonstrations were conducted in 2016 but were not completed prior to publication of the document. WEPod is being tested on the Wageningen University in Guilderland, Netherlands. The EZ10 shuttles will operate in a loop on campus using cameras, radar and laser-based sensors for about six months. CarPostal is the first European public transportation company to incorporate an automated vehicle into its service. Two Navya Arma vehicles will be demonstrated for two years in Sion, Switzerland. A key part of the CarPostal projects is to evaluate the use of automated vehicles in regions not already served by public transportation. The report identified two U.S. demonstration projects being conducted by MVTA and CCTA. The MVTA project expands the 2015 driver assist system (DAS) for bus-on-shoulder (BOS) operations to 11 additional buses with improved technology. The new system will include a series of LEDs, an LCD touch panel, lidar for front collision sensing and radar for side collision sensing. CCTA will be testing two EZ10 shuttles over the course of two years starting in 2016. The phased project will start on private roads at a large business park before moving to public streets. At the time of writing this report, there is a legislative challenge in that California law does not permit testing of autonomous vehicles on public roads without a steering wheel, brake pedal and accelerator.
Piao, J., McDonald, M., Hounsell, N., Graindorge, M., Graindorge, T., and Malhene, N. (2015) “Public Opinions towards Implementation of Automated Buses in Urban Areas.” ITS World Congress, ITS-2632.
Public perception of automated transit is an important consideration in the development and deployment of increasingly automated systems. If the transit riding population is not confident in the service, it will not succeed. The article reports on the results of a survey of 425 individuals in La Rochelle, France after completion of a CityMobil2 demonstration of automated mini buses.70 The researchers asked questions related to public awareness and understanding about automated vehicles and about the attractiveness and concerns of automated buses. Overall, the vast majority of participants had heard about automated vehicles (87%). The highest expected benefits (“very likely”) identified were reduced energy consumption (45%) and reduced pollutant emissions (51%). Reduced accidents were also expected to some degree by 58% of those surveyed. The least positive expectations from automated buses were for
70 In total, 500 people in total were questioned but 75 were thrown out after resampling for representative demographics. Surveys were conducted online and by phone.
APPENDIX F: TECHNOLOGY LITERATURE REVIEW AND ANALYSIS
FEDERAL TRANSIT ADMINISTRATION 144
reducing congestion and smoother vehicle movements. Regarding safety, about 70% of respondents responded automated buses would be at least as safe as a human driver. More than 60% of those surveyed said lower bus fares were “very attractive;” however, 40% of respondents also indicated preference for higher fares with staff on board the vehicle in all services (vs. no services and night services). Nearly 70% of participants foresee automated buses as a way to provide feeder service that complements existing service; 54% also felt that the service could be used within tourist zones. With regard to preferences for automated vs. non-automated service, 63% of respondents preferred automated services (38% preferred automated with staff on board). Across the surveyed group, younger participants and male participants were more confident in improved safety and less concerned about security. While the survey results appear to show confidence in automated transit after a successful demonstration, there remain concerns about personal security and whether automation will reduce congestion. It is difficult to translate the results of this survey to a broader public that has not been in a community experiencing an automated bus demonstration project.
Polzin, Steven E. (2016). “Implications to Public Transportation of Emerging Technologies.” National Center for Transit Research (NCTR), Center for Urban Transportation Research, University of South Florida.
Technologies such as automation, wireless telecommunications, sensing, and machine learning are reshaping transportation across multiple modes and services. This discussion paper provides an overview of these changes and their potential impacts on public transit. Automation of transit vehicle control has received the most attention and could lead to significant labor cost savings, as well as the ability to redesign vehicles to optimize service rather than labor productivity. However, automation and other technologies may be equally important for other improvements to bus service, such as fare collection, passenger counting, and driver assistance. Over the longer term, traffic management technologies could potentially create a virtual bus lane for BRT-type services as a cost-effective alternative to right-of-way acquisition. The author emphasizes that the same technological forces that may affect transit services also have the potential to change travel behavior more broadly, including changes to overall levels of travel and to mode choice decisions. One particular risk to transit is that improvements to other modes will cause defections from transit, leading to ridership losses. To the extent that these are concentrated among wealthier transit riders, this could create equity issues, social polarization, and a decline in public support for transit subsidies.
Transit services should be an attractive testbed for automation experiments, since the vehicles operate in complex, urban environments, have high vehicle utilization, and are professionally maintained. Nonetheless, most work to date has been in the light-duty and truck segments, which are larger markets. As a
APPENDIX F: TECHNOLOGY LITERATURE REVIEW AND ANALYSIS
FEDERAL TRANSIT ADMINISTRATION 145
result, there is limited data on which to draw when assessing the net impacts of technology changes, and the author concludes that it is too early to make predictions. However, two key research needs are identified as (1) the impacts of automation on transit labor, and (2) the impacts of automation and other technologies on long-range planning and infrastructure investment.
Stam, D., and Alessandrini, A. (2014). “Evaluation of Automated Transport Systems.” TRB 93rd Annual Meeting Compendium of Papers, 01519247.
This paper focuses on evaluating four types of automated transportation: personal rapid transit (PRT), CyberCars, High Tech Buses, and Dual-mode Vehicles. The authors identified fifteen opportunities for evaluation across thirteen European cities. The evaluation objectives were diverse, but the findings were less comprehensive. In general, the authors found that public acceptance of automated transportation would be high (specifically for PRT systems), and that PRT systems were more effective in smaller cities whereas High Tech Bus systems were more effective in larger cities. It is noteworthy that none of the High Tech Bus systems envisioned by the authors were in fact driverless. The paper also mentions origin and destination studies based on automated transportation systems, as well as their impacts on mode share. The paper does not specifically focus on any vehicle-based technologies outside of simple classification into evaluation categories.
Van Themsche, S. (2016). “Will Electric Driverless Cars Kill Bus and Light Train Operations?” International Journal of Transport Development and Inte-gration, 303(32), 137-147.
The author considers with some supporting data how public transportation will be impacted by growth in automated vehicles. Ride-pooling, automation, and electrification of taxi fleets could potentially make them competitive with buses. In addition, using platooning technology, they could provide throughput that rivals other transit modes (with the exception of heavy rail). The article is not so much whether or not transit will be obsolete in the future, but rather that transit might look quite different in the future (perhaps a greater number of smaller vehicles). The key takeaway is that the definition of public transportation may change as automation becomes more prevalent and changes overall mobility.
Transit Automation Example ProjectsThis section discusses selected examples of transit automation projects. Most of these examples have been used in pilots and demonstrations, as very few bus transit automation technologies have been used in revenue service. These projects will be referenced in the subsequent “Scan of Enabling Technologies” section. The selected transit automation projects include low-speed automated shuttles, which have been tested in many locations around the world, as well as
APPENDIX F: TECHNOLOGY LITERATURE REVIEW AND ANALYSIS
FEDERAL TRANSIT ADMINISTRATION 146
larger buses that have been tested in the Netherlands, Singapore, Minnesota, Oregon, and Washington.
Low-speed Automated ShuttlesThere are several companies that produce small (10–15 passenger), low-speed (25 mph) automated shuttles. The most well-known shuttles are the EasyMile EZ10, the Local Motors Olli, and the Navya Arma (though there are other companies with similar shuttles, including 2getthere and Auro Robotics). These vehicles have been tested in various locations in Asia, Europe, and North America. The three shuttles are electric vehicles, and each is outfitted with camera, radar, lidar, and GPS units for localization and object detection. The Local Motors Olli also uses an ultrasonic sensor for object detection. These shuttles have primarily been tested in protected environments, such as parking lots, hospitals, and campuses. While they are designed to operate without a driver, many of the tests have initially included an on-board operator who can step in if needed. The concept of operations varies by deployment, but must have been used as circulators that follow a fixed route and stop at all predefined stops. Some concepts involve operating back and forth along a single lane, in a loop, or “on-demand” using an applications from a smartphone or kiosk.
Mercedes-Benz “Future Bus with CityPilot”In July 2016, the Mercedes-Benz “Future Bus with CityPilot” navigated through traffic lights and tunnels to complete a 12-mile trip from Amsterdam’s Schiphol airport to Haarlem. The system fuses data from a combination of radar, “nearly a dozen cameras,” and a GPS unit (Daimler, 2016). The bus can automatically accelerate, steer, brake, and approach bus stops. The sensors enable the bus to detect and identify pedestrians and other obstacles on the road. The bus does require an operator in the driver’s seat who can take control of the bus if necessary. Mercedes’ CityPilot system was based on its Highway Pilot system it developed for automated trucks. The system operates in dedicated bus lanes.
LTA-NTU Automated BusesIn 2016, Singapore’s Land Transport Authority (LTA) began a collaboration with Nanyang Technological University (NTU) to convert 2 12-meter hybrid electric buses to fully-automated vehicles. The vehicles are currently in development. The aim of the pilot is for the automated buses to effectively navigate through local roads between NTU and CleanTech Park (LTA, 2016). The buses will feature navigation and localization with 3D lidar mapping and differential GPS, lane detection, obstacle and pedestrian detection with day and night operations, traffic light and sign detection, and V2V and V2I communication. In addition to lidar, DGPS, and V2X on-board units, each bus will include an IMU, stereoscopic cameras, a radar unit, and processing and embedded software computing units. The two buses in the trial will operate in Singapore’s local road traffic, which is
APPENDIX F: TECHNOLOGY LITERATURE REVIEW AND ANALYSIS
FEDERAL TRANSIT ADMINISTRATION 147
different from the “protected lane” use case scenario that has been suggested for near-term transit automation opportunities in the U.S. (Shladover and Bishop, 2015; Walker, 2014).
Minnesota Valley Transit Authority (MVTA) Bus on ShoulderIn 2010, USDOT funded a pilot implementation in Minnesota for a driver-assistive system using DGPS and lidar to enable a bus to travel on typically unused shoulder right-of-way, bypassing congestion during peak rush hours (RITA, 2011; Pessaro, 2016). When highway speeds on general purpose lanes drop below 35 mph, MVTA buses are authorized to use the shoulder along a 22-mile stretch between Apple Valley and Minneapolis. The DGPS aided with triangulation and positioning, while the lidar system scanned the environment for objects to avoid collisions. DGPS provided position estimates accurate to five to eight centimeters at a frequency of 10 Hz. Lidar provided augmented location information during brief (less than 15 seconds) periods when DGPS position was not available (GPS World, 2010). If the lidar detects an object, the system warns the driver through visual (head-up display) and haptic (seat vibration and steering wheel resistance) feedback (Pessaro, 2016).
Transit Vehicle Assist and AutomationThe California PATH program demonstrated a lateral guidance system using magnetic sensing between 1990 and 1993 (Guy and Zhang, 2009) and has continued its development. In 2003, PATH retrofitted two 40-foot CNG buses and one 60-foot diesel bus with magnetic guidance capabilities to enable precision docking and stopping maneuvers, which were successfully demonstrated. Additionally, lane assist, lane change, and automated/manual transitions were demonstrated on Interstate 15 HOV lanes at high speeds. In 2008, a magnetic test track was built in San Leandro, California, for field testing with AC Transit. Since then the technical feasibility of a magnetic and GPS-based guidance system to enable buses to negotiate docking stations, tolling lanes, and right-of-way lanes with precision has been successfully demonstrated.
In March 2009, California Department of Transportation and California PATH launched a two-year pilot program to demonstrate a vehicle assist and automation (VAA) system on transit buses (Guy and Zhang, 2009). The VAA system used magnets embedded in the roadway to guide vehicles. Applications of VAA include lane keeping and precision docking at BRT stops. The system was deployed in Eugene, Oregon on a Lane Transit District 60-foot articulated bus (Larson, 2015). The on-board equipment included two magnetometer sensor bars (one in front and one under the middle door), a steering actuator, a computer controller, and a human-machine interface display. Magnets were installed along three miles of a 23-mile BRT line.
APPENDIX F: TECHNOLOGY LITERATURE REVIEW AND ANALYSIS
FEDERAL TRANSIT ADMINISTRATION 148
Pierce Transit Bus AutomationIn January 2017, Pierce Transit received a $1.66 million FTA grant to install collision-avoidance technology and emergency braking technology on its buses (Pierce Transit, 2017). With winding from partners and matching funds from Pierce Transit, the total project cost is approximately $2.9 million. All 176 of Pierce Transit buses will be equipped with Shield+ collision avoidance warning system from Mobileye/Rosco Vision (Pierce Transit had previously tested Mobileye/Rosco Vision collision-avoidance technology on seven buses in 2016), and 30 buses will be equipped with an emergency braking system which works in conjunction with the collision avoidance system. Those 30 buses will automatically decelerate when they detect an imminent pedestrian or vehicle collision. The vision system uses multiple cameras to detect other motor vehicles, bicyclists, and pedestrians.
Scan of Enabling TechnologiesThis section describes various enabling technologies required for transit automation. The topics covered include systems related to visioning, communications, vehicle positioning and motion, processing and software, and actuators. The scan focuses on current technologies available on the market, as well as those being developed. It includes systems for transit vehicles when information on those systems is available, but also covers information on relevant systems for other heavy-duty vehicles, as well as light-duty vehicles. Information on product availability, suppliers, and cost is provided based on literature searches conducted in Fall 2016. Please note that USDOT is not endorsing a particular enabling technology or set of technologies by including them in this report. They are included purely for informational purposes.
Visioning SystemsRadar
Vehicle radar is an active sensor71 that detects objects surrounding the vehicle using radio waves (Sun, Bebis, and Miller, 2006). The sensor transmits radio waves into the environment; some of the waves strike objects, which reflect back to the receiver. A computer, often integrated with the radar, processes and analyzes the patterns of returning radio waves to detect objects and derive additional information, such as object location, speed, and heading (Honma and Uehara, 2001).
The automotive industry has included radar sensors in personal vehicles since the late 1990s for low-level automation and driver assistance features (Hasch et
71 Active sensors—such as radar, lidar, and ultrasonic—function by emitting a signal and measuring its return. Passive sensors—such as cameras—acquire data by unobtrusively observing the environment (Sun, Bebis, and Miller, 2006).
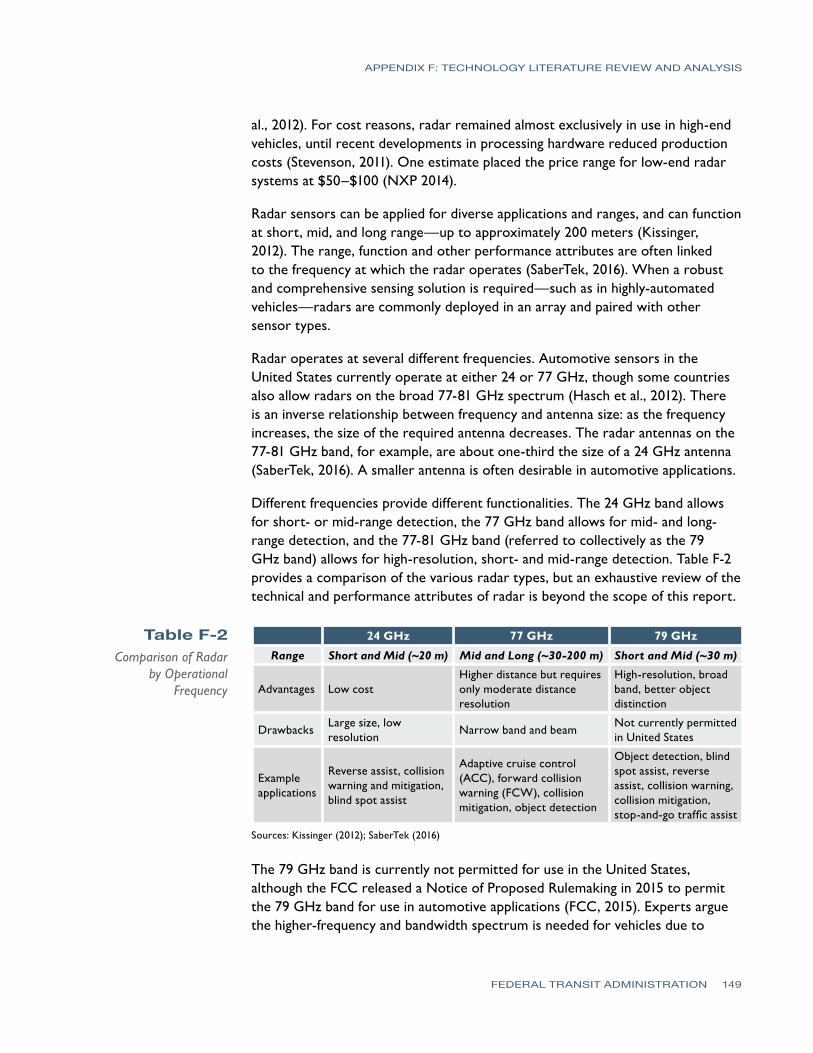
APPENDIX F: TECHNOLOGY LITERATURE REVIEW AND ANALYSIS
FEDERAL TRANSIT ADMINISTRATION 149
al., 2012). For cost reasons, radar remained almost exclusively in use in high-end vehicles, until recent developments in processing hardware reduced production costs (Stevenson, 2011). One estimate placed the price range for low-end radar systems at $50–$100 (NXP 2014).
Radar sensors can be applied for diverse applications and ranges, and can function at short, mid, and long range—up to approximately 200 meters (Kissinger, 2012). The range, function and other performance attributes are often linked to the frequency at which the radar operates (SaberTek, 2016). When a robust and comprehensive sensing solution is required—such as in highly-automated vehicles—radars are commonly deployed in an array and paired with other sensor types.
Radar operates at several different frequencies. Automotive sensors in the United States currently operate at either 24 or 77 GHz, though some countries also allow radars on the broad 77-81 GHz spectrum (Hasch et al., 2012). There is an inverse relationship between frequency and antenna size: as the frequency increases, the size of the required antenna decreases. The radar antennas on the 77-81 GHz band, for example, are about one-third the size of a 24 GHz antenna (SaberTek, 2016). A smaller antenna is often desirable in automotive applications.
Different frequencies provide different functionalities. The 24 GHz band allows for short- or mid-range detection, the 77 GHz band allows for mid- and long-range detection, and the 77-81 GHz band (referred to collectively as the 79 GHz band) allows for high-resolution, short- and mid-range detection. Table F-2 provides a comparison of the various radar types, but an exhaustive review of the technical and performance attributes of radar is beyond the scope of this report.
Table F-2Comparison of Radar
by Operational Frequency
24 GHz 77 GHz 79 GHz
Range Short and Mid (~20 m) Mid and Long (~30-200 m) Short and Mid (~30 m)
Advantages Low costHigher distance but requires only moderate distance resolution
High-resolution, broad band, better object distinction
DrawbacksLarge size, low resolution
Narrow band and beamNot currently permitted in United States
Example applications
Reverse assist, collision warning and mitigation, blind spot assist
Adaptive cruise control (ACC), forward collision warning (FCW), collision mitigation, object detection
Object detection, blind spot assist, reverse assist, collision warning, collision mitigation, stop-and-go traffic assist
Sources: Kissinger (2012); SaberTek (2016)
The 79 GHz band is currently not permitted for use in the United States, although the FCC released a Notice of Proposed Rulemaking in 2015 to permit the 79 GHz band for use in automotive applications (FCC, 2015). Experts argue the higher-frequency and bandwidth spectrum is needed for vehicles due to

APPENDIX F: TECHNOLOGY LITERATURE REVIEW AND ANALYSIS
FEDERAL TRANSIT ADMINISTRATION 150
several benefits: improved accuracy, resolution, reliability, and reduced sensor size (79GHz Project, 2013). The large bandwidth allocated to the spectrum would allow for “high spatial resolution and a much better capability of distinguishing between objects” (Brizzolara, 2013). The higher resolution would reduce the frequency of false alarms and improve the ability to distinguish between many small objects (Figure F-1). The higher position on the GHz spectrum also allows for smaller antennas.
Figure F-1Comparison of object recognition in low and high spatial resolution
Source: 79GHz Project (2013)
Technology Capabilities
Radar is frequently selected for many different automotive applications, due in part to its ability to function under conditions that would cause other sensors to struggle or fail. Most inclement weather, such as rain, snow, or fog, does not decrease radar performance (Rasshofer and Gresser, 2005). Performance is also unaffected if mud or dirt builds up on the sensor, and unlike cameras, radar does not require specific lighting conditions to function optimally. Many radar sensors are also compact, which can allow for discreet placement. Table F-3 compares the strengths and weaknesses of various sensor types (Rasshofer and Gresser, 2005).
Long-range radar sensors can function accurately up to 200 meters, and at least one study found that a 77 GHz radar can correctly detect 95% of pedestrians under optimal conditions (Bartsch, Fitzek, and Rasshofer, 2012). Pedestrian detection performance decreases substantially, however, under non-ideal but common real-world conditions, such as when the view of a pedestrian is partially occluded by a parked vehicle. Because of these challenges radar is not currently used as the sole or primary sensor for pedestrian detection.
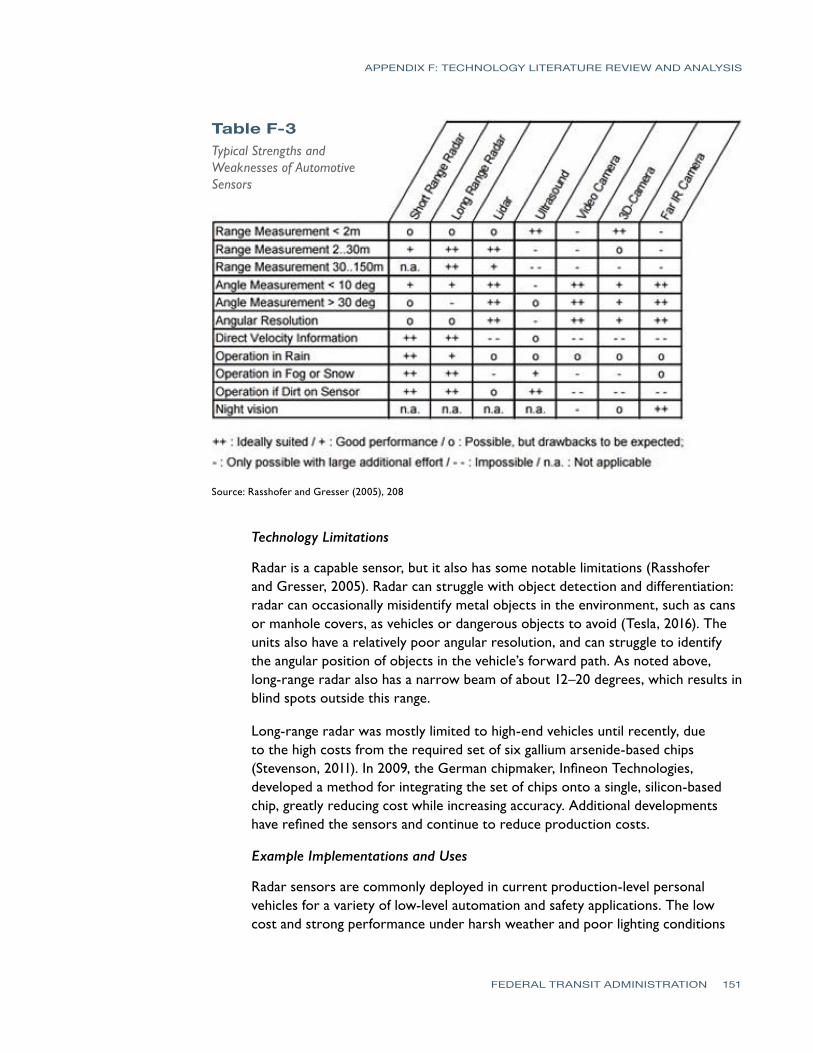
APPENDIX F: TECHNOLOGY LITERATURE REVIEW AND ANALYSIS
FEDERAL TRANSIT ADMINISTRATION 151
Source: Rasshofer and Gresser (2005), 208
Table F-3Typical Strengths and Weaknesses of Automotive Sensors
Technology Limitations
Radar is a capable sensor, but it also has some notable limitations (Rasshofer and Gresser, 2005). Radar can struggle with object detection and differentiation: radar can occasionally misidentify metal objects in the environment, such as cans or manhole covers, as vehicles or dangerous objects to avoid (Tesla, 2016). The units also have a relatively poor angular resolution, and can struggle to identify the angular position of objects in the vehicle’s forward path. As noted above, long-range radar also has a narrow beam of about 12–20 degrees, which results in blind spots outside this range.
Long-range radar was mostly limited to high-end vehicles until recently, due to the high costs from the required set of six gallium arsenide-based chips (Stevenson, 2011). In 2009, the German chipmaker, Infineon Technologies, developed a method for integrating the set of chips onto a single, silicon-based chip, greatly reducing cost while increasing accuracy. Additional developments have refined the sensors and continue to reduce production costs.
Example Implementations and Uses
Radar sensors are commonly deployed in current production-level personal vehicles for a variety of low-level automation and safety applications. The low cost and strong performance under harsh weather and poor lighting conditions
APPENDIX F: TECHNOLOGY LITERATURE REVIEW AND ANALYSIS
FEDERAL TRANSIT ADMINISTRATION 152
make radar a frequent choice when pairing with other low-cost sensors, especially cameras.
The EasyMile EZ10 vehicle (used in many pilot projects around the world, including WEpods pilot in the Netherlands) uses radar, along with cameras and lidar, to sense the surrounding environment (Hsu, 2016). Other small automated shuttles (e.g., Local Motors Olli and Navya Arma) also use radar units in conjunction with other sensors. Several companies offer ADAS packages for heavy-duty vehicles that use radar (e.g., WABCO’s the OnGuardACTIVE and OnGuardMAX products—WABCO 2017a), and the Mercedes-Benz Future Bus with CityPilot concept uses radar along with other sensing technologies.
Suppliers and Costs
A wide variety of automotive suppliers and electronics producers sell radar sensors for vehicle applications. Unit costs will vary across manufacturers and models, and most manufacturers do not publically list prices. One estimate, however, placed the range for lower-end units across the market from $50–$100 (NXP, 2014).
• Autoliv offers a range of radar sensors that enable low-level automated and driver assistance systems (Autoliv, 2017). The company offers the following sensors:
– 25GHz ultra-wide band radars
– 24GHz narrow-band radars
– 77GHz multi-mode radars
The sensors enable the following features:
– Blind spot detection
– Rear cross-traffic alert
– Lane change assist
– Forward collision warning
– Autonomous emergency braking
– Adaptive cruise control
• Bosch, an automotive supplier, offers several different radar systems that support a variety of low-level automated and driver assistance applications (Bosch, 2017). These include:
– Integrated radar and camera
– 77 GHz mid-range radar
– 77 GHz long-range radar.
APPENDIX F: TECHNOLOGY LITERATURE REVIEW AND ANALYSIS
FEDERAL TRANSIT ADMINISTRATION 153
• Continental, a Tier 1 automotive supplier, provides radar systems for commercial and light-duty vehicles alike, which facilitate a variety of low-level automated and driver assist applications. Some of their products include:
– Long-range 77GHz industrial or vehicular radar
– ARS410 vehicle radar w/170 meter range
– ARS 408-21 long range radar 77 GHz
• Delphi, an automotive supplier, provides several radar and radar-fused systems for low-level and driver assistance applications (Delphi, 2016). These include an integrated radar and camera system, as well as an electronically-scanning radar that uses both a mid-range and long-range radar.
• Denso, a Japanese automotive supplier, markets a millimeter-wave radar that enables driver assist and low-level automated applications, such as ACC and collision prevention (Denso, 2012).
• NXP Semiconductors, a Dutch semiconductor manufacturer, produces and sells an integrated multi-mode, long- and mid-range 77 GHz radar for in-vehicle applications (NXP, 2011).
• ZF TRW, an automotive supplier, provides a line of radars for driver assistance and low-level automated applications (ZF TRW, 2016). The product offerings include:
– AC3 77 GHz long range
– AC100 24 GHz mid-range
– AC1000 79 GHz, 360 degree-sensing scalable platform
Lidar
Lidar is a relatively recently-developed sensor technology that uses lasers to measure distance to objects. It is conceptually similar to radar. The sensor emits a series of invisible lights, usually within the 600-1,000 nanometer (nm) spectrum, which reflect off any objects in range and return to the sensor (Sivaraman and Manubhai, 2013). An on-board computer analyzes patterns from the returning light, and uses the data to infer environmental and behavioral information, such as object classification, distance, velocity relative to the sensor, and the predicted path of travel, among other information (Lange et al., 2016).
Lidar sensors can be broadly classified as either spinning or solid-state. Spinning lidar sensors, as the name implies, have moving parts that physically spin to distribute the sensor’s light in a 360° field. Spinning lidar sensors are typically higher cost (as much as $85,000 for some models) and may be more susceptible to damage or mechanical failure due to moving parts (Ackerman, 2016). A newer development in lidar technology, solid-state lidar sensors, emit light in a static array without spinning. The removal of moving parts reduces the likelihood of mechanical failure. However, these fixed systems may require multiple lidar units
APPENDIX F: TECHNOLOGY LITERATURE REVIEW AND ANALYSIS
FEDERAL TRANSIT ADMINISTRATION 154
to achieve a 360-degree view of the environment (Olsen et al., 2013). The solid-state variety is much lower in cost, and some estimate that unit costs will likely drop below $100 per unit as economies of scale continue to increase (Ross, 2015).
Lidar sensors suffer from some limitations, such as susceptibility to inclement weather. As such, lidar is often paired with other sensor types (Sivaraman and Manubhai, 2013). Radars and digital cameras are both common pairing options to mitigate a lidar unit’s individual weaknesses and to bolster data integrity.
Technology Capabilities
Lidar sensors enable vehicles to accurately locate, identify, and track surrounding objects (Sivaraman and Manubhai, 2013). The exact capabilities of a lidar unit will vary across manufacturers and models, but in general, lidar sensors are more precise and more accurate than many other sensor types. Lidar emits many lasers multiple times per second, which results in a high-resolution rendering of the vehicle’s surroundings. In ideal conditions, lidar covers a medium-long range distance in comparison to some other sensor types. Lidar does not require specific lighting conditions to function effectively; it works in a variety of conditions (e.g., day and night) and does not require additional illumination or special filters. Lidar’s many advantages make it a standard choice for high-level automation, and some experts expect that the development of low-cost lidar will facilitate the introduction of affordable AVs (Ackerman, 2016).
Technology Limitations
Lidar sensors function using light, and as such, when objects in the air block or scatter the light, the sensor will fail or erroneously detect “ghost objects” (Rasshofer and Gresser, 2005). Rain, snow, fog, dust, and other weather can reduce the efficacy of lidar sensors. Generally, if weather conditions challenge human drivers’ sight, they will also impair lidar sensors.
Lidar is a newer sensor, and until recently, it was not well-suited to broad use in the vehicle fleet (Sivaraman and Manubhai, 2013). Some early lidar models were, in comparison to other vehicle sensors, very high-cost, bulky, obtrusive, and fragile due to the use of mechanical moving parts. As a result, these sensors were mostly used on test vehicles or for research, mapping, or for other niche purposes.
Several companies have developed and begun marketing solid-state lidar in recent years (Denso, 2016; Ross, 2015; European Association of Automotive Suppliers, 2016). Solid-state lidar does not spin, but instead projects light in a fixed array. Miniaturization and the removal of moving parts reduces costs and the likelihood the lidar sensor will break. It also improves the ability to integrate the sensor with traditional vehicle design conventions.
APPENDIX F: TECHNOLOGY LITERATURE REVIEW AND ANALYSIS
FEDERAL TRANSIT ADMINISTRATION 155
One common concern with lidar sensors is the large amount of data they produce, which can be unwieldy and require careful data management practices (Olsen et al., 2013). Because lidar maps the environment in three dimensions, multiple times per second, and at a high resolution, these sensors can generate a large amount of data very quickly. If an organization wishes to store and use lidar data, the entity should develop data management practices to help manage and make sense of the large volume of data.
Example Implementations and Uses
Under an Urban Partnership Agreement with the USDOT, MVTA began using lidar sensors in 2010 as a part of its bus-on-shoulder operations in Minnesota (Pessaro, 2016). If the lidar sensor detects an object, the system warns the driver through visual (head-up display) and haptic (seat vibration and steering wheel resistance) feedback. Several small shuttles, including the EasyMile EZ10, Local Motors Olli, and Navya Arma, use lidar (in conjunction with other sensors) to sense the surrounding environment.
Suppliers and Costs
There are a variety of lidar products, with wide range of cost estimates (Technavio, 2016a). Many of the suppliers are traditional Tier 1 automotive suppliers. Several of these larger firms have purchased or invested in smaller suppliers and startups as a method of gaining intellectual property and increasing production capacity. Older generation lidar units cost as much as $85,000 per unit, while newer models are expected to cost as little as $100 per unit for production-level systems.
• Bosch, an automotive supplier, announced its intentions to begin selling lidar sensors, although they will not be available until 2020 (Nelson, 2014). Cost data were not available.
• Continental, an automotive supplier, recently acquired the “Hi-res 3D Flash Lidar” business from Advanced Scientific Concepts, Inc. (Continental, 2016). No unit cost data were readily available (Ramsey 2016).
• Delphi, an automotive supplier, invested $90 million in Quanenergy (Yvkoff, 2016). The start-up company has developed a solid state lidar with no moving parts and a sensing range of 10 cm to 150 meters. The lower-cost sensor is reported to retail for $250.
• Denso, an automotive supplier, invested an undisclosed amount into a small Albuquerque, NM lidar producer, TriLumina (Denso, 2016). The investment is expected to speed commercialization of the start up’s solid-state lidar system. Pricing was not available.
• First Sensor develops sensor systems for “industrial, medical, and mobility” markets (First Sensor, 2016). The company supplies OEMs, retrofitters, and
APPENDIX F: TECHNOLOGY LITERATURE REVIEW AND ANALYSIS
FEDERAL TRANSIT ADMINISTRATION 156
integrators. It combines lidar with camera systems for increased “range, accuracy and reliability” for advanced driver assistance systems (ADAS). Cost data were not available.
• Google, for many of its earliest test vehicles, purchased the high-cost Velodyne lidar, but Google is now producing its lidar sensors in-house (Harris, 2015).
• Novariant produces “precision steering solutions,” including a lidar sensor (Novariant, 2016). Cost and technical details were unavailable.
• Phantom Intelligence/Osram Opto Semiconductors partnered to develop a low-cost, solid-state lidar (Ross, 2015). According to an Institute of Electrical and Electronics Engineers (IEEE) interview, the company intends for their sensors to eventually cost less than $100.
• Valeo/LeddarTech, an automotive supplier, is partnering with a smaller Canadian firm, LeddarTech, to develop and market a solid-state lidar without moving parts (CLEPA, 2016). The new sensor will be available by 2018, and cost data were not provided.
• Velodyne is best known for the spinning lidar used by Google on many of its early test AVs (Velodyne, 2016). The earlier units cost $85,000, while a recent update, named the Puck, retails for $7,999. Velodyne recently announced a price goal of $500 for its newer solid-state lidar units. The Velodyne lidar system provides an example of these characteristics (Velodyne, 2016). This specific model (the “Puck”) has a 328 feet (100 meter) range, records 300,000 data points per second, spins 5 to 20 times per second, and is accurate within ±3 cm (Velodyne, 2016). This latest generation of lidar uses much less power than the previous generation (8 watts vs. 12 watts) and is significantly smaller (104 mm × 72 mm and 0.83 kg vs. 86 mm × 145 mm and 1 kg), although some performance characteristics are comparatively diminished as well. A previous model—the HDL-64, for example—records more than 1 million data points per second, is accurate within 2 cm, and has a 20% longer range (120 meters). The price of the current generation has dropped an order of magnitude, although at nearly $8,000, this specific model is still prohibitively expensive for many applications. Velodyne has announced a price goal of $500/unit for a new generation of solid-state lidar units, which automotive Original Equipment Manufacturers (OEMs) are using on test automated vehicles (Velodyne, 2016).
Computer Vision Systems (Cameras and Infrared)
Computer vision systems are a set of integrated technologies that collaboratively work to see, analyze, and understand the environment around a vehicle (Guan, Bayless, and Neelakantan, 2012). Cameras or other vehicle sensors collect images of the surrounding environment. Those images are sent to a processor, which performs algorithm-based analyses in real time to determine a wide variety of
APPENDIX F: TECHNOLOGY LITERATURE REVIEW AND ANALYSIS
FEDERAL TRANSIT ADMINISTRATION 157
information, depending on a specific application’s needs (Sun, Bebis, and Miller, 2006).
Depending on the purpose, the computer vision system can perform object identification, classification, and tracking, as well as identify infrastructure features such as traffic signs, signals, and pavement markings. AVs use this information to aid in collision prevention, navigation and decision making. In comparison to other sensor types, computer vision is relatively low-cost and has broad functionality. For these reasons, it is commonly used in many current ADAS and in low-level automated vehicles when a single-sensor solution is required.
Computer vision systems come in a variety of shapes and sizes, with widely varying costs, configurations, and use cases. Computer vision can use single or multiple cameras. A dual-camera configuration is known as stereo, which facilitates the extraction of 3D data by combining and analyzing images from both cameras (Kovacic, Ivanjko, and Gold, 2013). Multiple cameras oriented on the exterior of a vehicle can be aggregated and displayed to enable a 360° view of a vehicle’s immediate surroundings.
There are two common digital camera sensors used in most computer vision systems: complementary metal-oxide-semiconductor (CMOS) and charge-coupled devices (CCD) (Guan, Bayless, and Neelakantan, 2012; Teledyne DALSA, 2016). CMOS are smaller, consume less power, and produce less heat, so they are often used when a smaller form factor is required. Size requirements depend largely on the specific requirements of a vehicle’s design or use case. For example, if the manufacturer wishes for the camera to conform within the vehicle’s existing design, they might use a smaller imager such as CMOS. If size is not a concern, but image fidelity is more important, the manufacturer might choose a larger imager such as CCD. The comparably-priced CCD sensors offers improved image quality and sensitivity. Neither system is considered superior for all applications, so selection is often driven by specific use cases.
CMOS systems have characteristics that make them better suited to machine learning applications, which are used in many AV applications (Teledyne DALSA, 2017). CMOS imagers have lower noise (distortion) and can more quickly translate light to digital information (Figure F-2). CMOS chips have a high bandwidth for information transformation and transmission as a result of a “massively parallel” front end data path. A CCD chip, in comparison, collects and transmits analog data through linear linescan imagers, which create a transmission bottleneck. The increasing importance of machine learning in AV applications, especially at higher levels of automation, makes this technical aspect particularly salient for future transit applications. There are, however, other areas in which CCD chips outperform CMOS for AV applications.
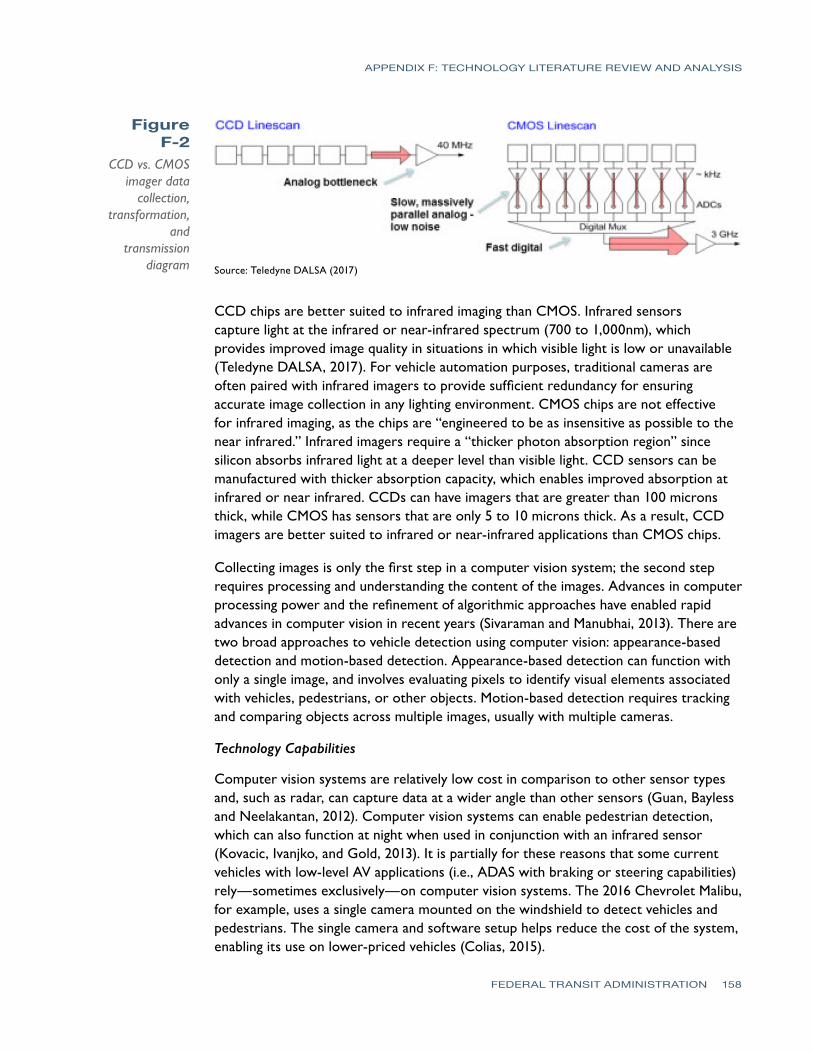
APPENDIX F: TECHNOLOGY LITERATURE REVIEW AND ANALYSIS
FEDERAL TRANSIT ADMINISTRATION 158
Source: Teledyne DALSA (2017)
CCD chips are better suited to infrared imaging than CMOS. Infrared sensors capture light at the infrared or near-infrared spectrum (700 to 1,000nm), which provides improved image quality in situations in which visible light is low or unavailable (Teledyne DALSA, 2017). For vehicle automation purposes, traditional cameras are often paired with infrared imagers to provide sufficient redundancy for ensuring accurate image collection in any lighting environment. CMOS chips are not effective for infrared imaging, as the chips are “engineered to be as insensitive as possible to the near infrared.” Infrared imagers require a “thicker photon absorption region” since silicon absorbs infrared light at a deeper level than visible light. CCD sensors can be manufactured with thicker absorption capacity, which enables improved absorption at infrared or near infrared. CCDs can have imagers that are greater than 100 microns thick, while CMOS has sensors that are only 5 to 10 microns thick. As a result, CCD imagers are better suited to infrared or near-infrared applications than CMOS chips.
Collecting images is only the first step in a computer vision system; the second step requires processing and understanding the content of the images. Advances in computer processing power and the refinement of algorithmic approaches have enabled rapid advances in computer vision in recent years (Sivaraman and Manubhai, 2013). There are two broad approaches to vehicle detection using computer vision: appearance-based detection and motion-based detection. Appearance-based detection can function with only a single image, and involves evaluating pixels to identify visual elements associated with vehicles, pedestrians, or other objects. Motion-based detection requires tracking and comparing objects across multiple images, usually with multiple cameras.
Technology Capabilities
Computer vision systems are relatively low cost in comparison to other sensor types and, such as radar, can capture data at a wider angle than other sensors (Guan, Bayless and Neelakantan, 2012). Computer vision systems can enable pedestrian detection, which can also function at night when used in conjunction with an infrared sensor (Kovacic, Ivanjko, and Gold, 2013). It is partially for these reasons that some current vehicles with low-level AV applications (i.e., ADAS with braking or steering capabilities) rely—sometimes exclusively—on computer vision systems. The 2016 Chevrolet Malibu, for example, uses a single camera mounted on the windshield to detect vehicles and pedestrians. The single camera and software setup helps reduce the cost of the system, enabling its use on lower-priced vehicles (Colias, 2015).
Figure F-2
CCD vs. CMOS imager data
collection, transformation,
and transmission
diagram
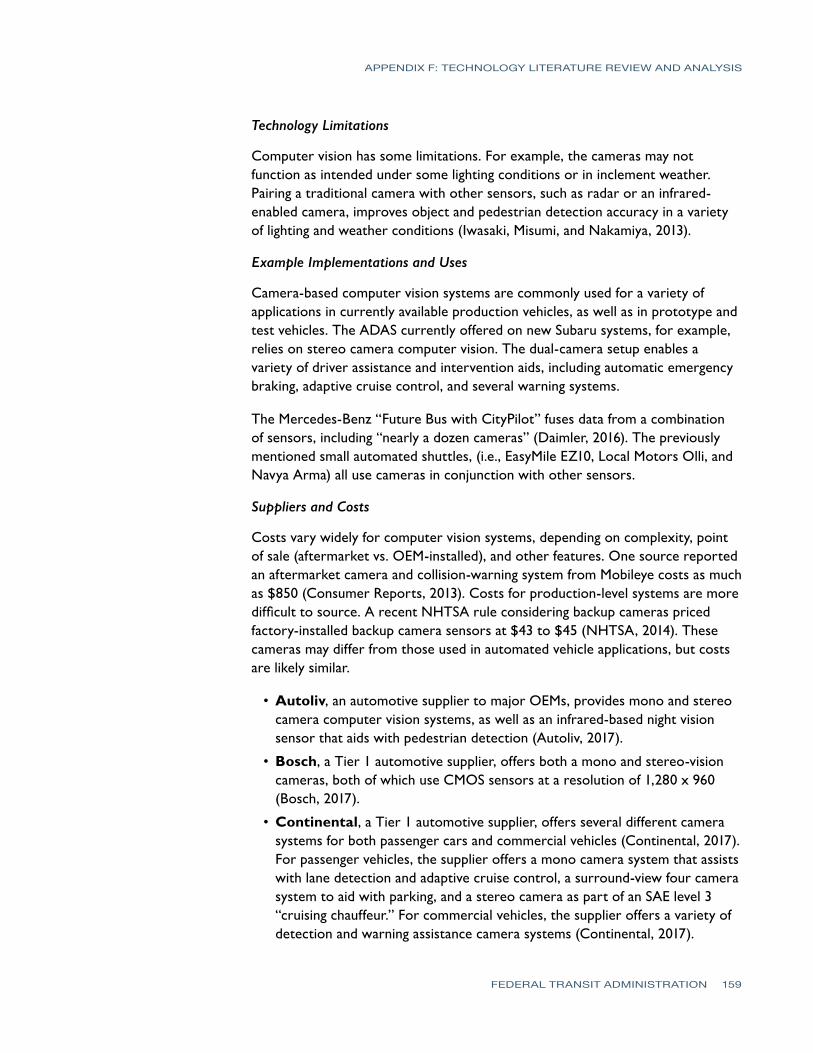
APPENDIX F: TECHNOLOGY LITERATURE REVIEW AND ANALYSIS
FEDERAL TRANSIT ADMINISTRATION 159
Technology Limitations
Computer vision has some limitations. For example, the cameras may not function as intended under some lighting conditions or in inclement weather. Pairing a traditional camera with other sensors, such as radar or an infrared-enabled camera, improves object and pedestrian detection accuracy in a variety of lighting and weather conditions (Iwasaki, Misumi, and Nakamiya, 2013).
Example Implementations and Uses
Camera-based computer vision systems are commonly used for a variety of applications in currently available production vehicles, as well as in prototype and test vehicles. The ADAS currently offered on new Subaru systems, for example, relies on stereo camera computer vision. The dual-camera setup enables a variety of driver assistance and intervention aids, including automatic emergency braking, adaptive cruise control, and several warning systems.
The Mercedes-Benz “Future Bus with CityPilot” fuses data from a combination of sensors, including “nearly a dozen cameras” (Daimler, 2016). The previously mentioned small automated shuttles, (i.e., EasyMile EZ10, Local Motors Olli, and Navya Arma) all use cameras in conjunction with other sensors.
Suppliers and Costs
Costs vary widely for computer vision systems, depending on complexity, point of sale (aftermarket vs. OEM-installed), and other features. One source reported an aftermarket camera and collision-warning system from Mobileye costs as much as $850 (Consumer Reports, 2013). Costs for production-level systems are more difficult to source. A recent NHTSA rule considering backup cameras priced factory-installed backup camera sensors at $43 to $45 (NHTSA, 2014). These cameras may differ from those used in automated vehicle applications, but costs are likely similar.
• Autoliv, an automotive supplier to major OEMs, provides mono and stereo camera computer vision systems, as well as an infrared-based night vision sensor that aids with pedestrian detection (Autoliv, 2017).
• Bosch, a Tier 1 automotive supplier, offers both a mono and stereo-vision cameras, both of which use CMOS sensors at a resolution of 1,280 x 960 (Bosch, 2017).
• Continental, a Tier 1 automotive supplier, offers several different camera systems for both passenger cars and commercial vehicles (Continental, 2017). For passenger vehicles, the supplier offers a mono camera system that assists with lane detection and adaptive cruise control, a surround-view four camera system to aid with parking, and a stereo camera as part of an SAE level 3 “cruising chauffeur.” For commercial vehicles, the supplier offers a variety of detection and warning assistance camera systems (Continental, 2017).
APPENDIX F: TECHNOLOGY LITERATURE REVIEW AND ANALYSIS
FEDERAL TRANSIT ADMINISTRATION 160
• Delphi, a major automotive supplier, provides CMOS mono and stereo camera systems, as well as camera systems that integrate with radar for additional functionality (Delphi, 2016).
• Denso, a Japanese automotive supplier, provides computer vision systems that enable various applications, including surround vehicle monitoring, traffic sign recognition, and other driver assistance systems (Denso, 2016).
• Mobileye’s Israeli technology focuses on vision-based driver assistance systems, which enables a variety of driver assistance systems, including pedestrian, lane, and forward collision warnings (Mobileye, 2017). The CMOS cameras can be equipped on passenger or commercial vehicles. The Mobileye 560 aftermarket camera system is priced at $850, which does not include installation costs (Consumer Reports, 2013).
• Valeo, a French automotive supplier, offers a CMOS “compact camera” that operates in all light levels and weather conditions to facilitate a variety of driver assistance and low-level automated functions (Valeo, 2015). The company also offers a multi-camera, surround-view system for additional driver assistance.
Ultrasonic Sensors
Ultrasonic sensors are devices that enable object detection using ultrasonic sound waves. Ultrasonic sound waves have frequencies above human perception, exceeding 20 kHz (Jo & Jung 2014). Ultrasonic sensors emit an ultrasonic pulse (or “chirp”) that bounces off of an object and is echoed back to the sensor (Figure F-3). The sensor can measure characteristics of the echo, including how long it took for the echo to return and, in certain sensors, the amplitude and frequency of the echo. Based on these characteristics, the sensor can estimate the distance between the sensor and the detected object, as well as the speed of the detected object (Massa, 1999; Rephlo et al., 2008). One of the main advantages of ultrasonic sensors over other forms of object detection (e.g., radar, lidar, etc.) is their relatively low cost (Yu & Li, 2016) and low energy consumption (Jo & Jung, 2014).
Figure F-3Measuring distance
to object using sonar principle utilized by
ultrasonic sensors
Source: George Wiora (2005)
APPENDIX F: TECHNOLOGY LITERATURE REVIEW AND ANALYSIS
FEDERAL TRANSIT ADMINISTRATION 161
There are two basic types of ultrasonic sensors: pulse and continuous wave (Rephlo et al., 2008). Pulse sensors determine presence and distance of objects by measuring the “flight time” of the sound wave (i.e., the time between the chirp and the echo). Continuous wave sensors output a sound wave at a steady frequency and use the Doppler Effect72 to detect a moving object’s relative speed.
Technology Capabilities
Ultrasonic sensors have various capabilities and configurations. However, the data they provide must be processed for use in automated systems. The main uses of ultrasonic sensors are for detection, distance measurement, and speed estimation for objects within a 10 meter range of the sensor (Rockwell Automation 2016). The minimum detectable object distance varies across sensors as a function of chirp duration. Ultrasonic sensors can operate in conditions in which some other sensing technologies may break down:
• Ultrasonic sensors are reliable in conditions with a significant amount of dirt, dust, or mist (Balluff, 2016).
• Ultrasonic sensors can detect an object regardless of its transparency, color, or optical reflectivity (for example, ultrasonic sensors can be used to measure fluid levels).
• Ultrasonic sensors are reliable in low- and no-light conditions.
Vehicle Automation
In the case of vehicle automation, ultrasonic sensors have been deployed to detect objects along the side of a vehicle (Aeberhard et al., 2015; Rephlo et al., 2008; Yu & Li, 2016), for obstacle detection during parking maneuvers (Bengler et al., 2014, 2015; Wagner et al., 2014), and for object detection for forward collision avoidance (Lewis et al., 2016). Ultrasonic sensors have also been used to measure the distance between the bottom of a vehicle and the ground (Carullo & Parvis, 2001). To accomplish these tasks, ultrasonic sensors can deployed as single units and as arrays.
• Slow-Speed Object Detection Applications – Ultrasonic sensors for object avoidance are limited in their use to applications in which the stopping distance is greater than the maximum sensing distance of the sensor. Once the vehicle is travelling fast enough that stopping distance is greater than sensing distance, the ultrasonic sensor ceases to be useful because the sensor would provide information too late for it to be used to avoid an object.
72 The frequency of the echo will be higher or lower than the chirp frequency, depending on whether an object is moving toward or away from the ultrasonic sensor, respectively. Based on the difference in the frequency of the chirp and the echo, it is possible to estimate the object’s velocity relative to the sensor. Object speed can also be determined by calculating the distance the object traveled between chirps.
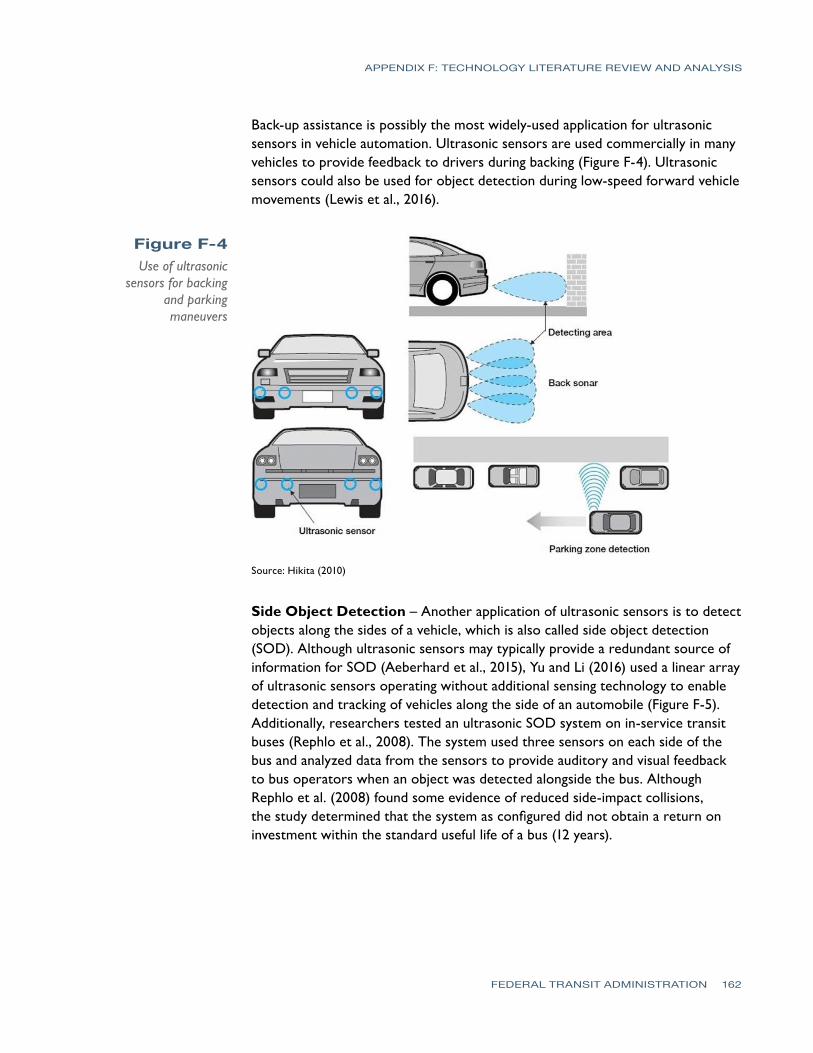
APPENDIX F: TECHNOLOGY LITERATURE REVIEW AND ANALYSIS
FEDERAL TRANSIT ADMINISTRATION 162
Back-up assistance is possibly the most widely-used application for ultrasonic sensors in vehicle automation. Ultrasonic sensors are used commercially in many vehicles to provide feedback to drivers during backing (Figure F-4). Ultrasonic sensors could also be used for object detection during low-speed forward vehicle movements (Lewis et al., 2016).
Figure F-4Use of ultrasonic
sensors for backing and parking maneuvers
Source: Hikita (2010)
Side Object Detection – Another application of ultrasonic sensors is to detect objects along the sides of a vehicle, which is also called side object detection (SOD). Although ultrasonic sensors may typically provide a redundant source of information for SOD (Aeberhard et al., 2015), Yu and Li (2016) used a linear array of ultrasonic sensors operating without additional sensing technology to enable detection and tracking of vehicles along the side of an automobile (Figure F-5). Additionally, researchers tested an ultrasonic SOD system on in-service transit buses (Rephlo et al., 2008). The system used three sensors on each side of the bus and analyzed data from the sensors to provide auditory and visual feedback to bus operators when an object was detected alongside the bus. Although Rephlo et al. (2008) found some evidence of reduced side-impact collisions, the study determined that the system as configured did not obtain a return on investment within the standard useful life of a bus (12 years).
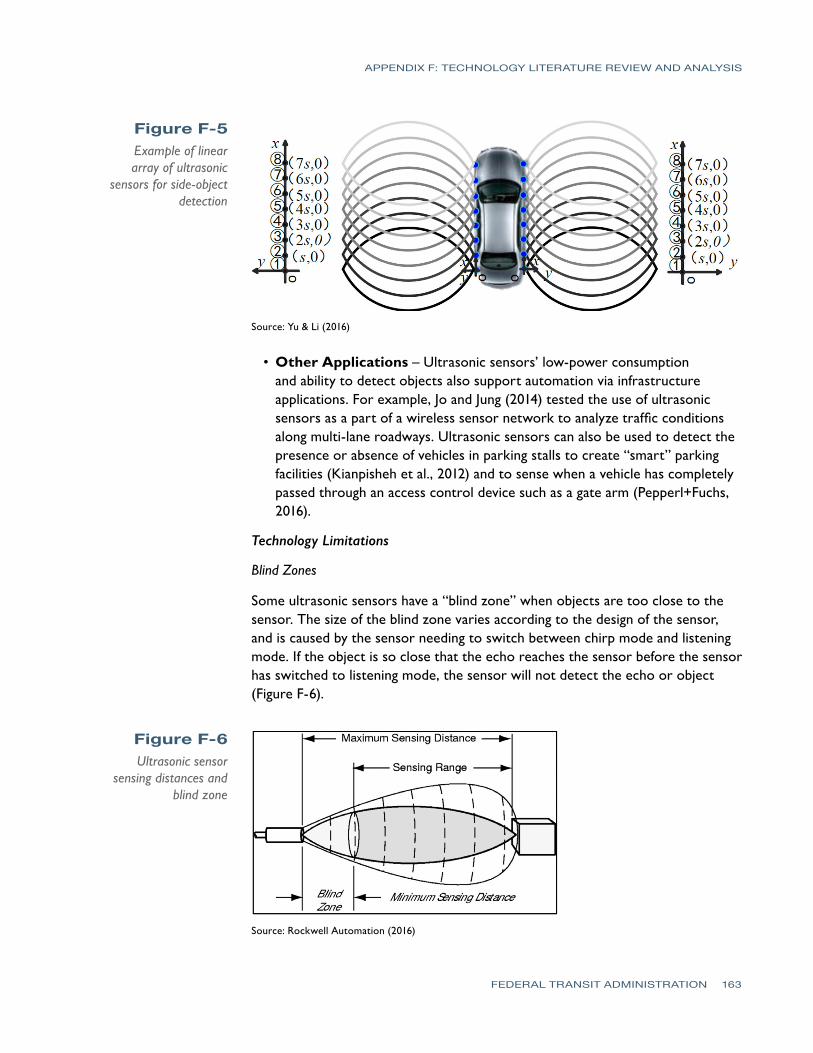
APPENDIX F: TECHNOLOGY LITERATURE REVIEW AND ANALYSIS
FEDERAL TRANSIT ADMINISTRATION 163
Source: Yu & Li (2016)
• Other Applications – Ultrasonic sensors’ low-power consumption and ability to detect objects also support automation via infrastructure applications. For example, Jo and Jung (2014) tested the use of ultrasonic sensors as a part of a wireless sensor network to analyze traffic conditions along multi-lane roadways. Ultrasonic sensors can also be used to detect the presence or absence of vehicles in parking stalls to create “smart” parking facilities (Kianpisheh et al., 2012) and to sense when a vehicle has completely passed through an access control device such as a gate arm (Pepperl+Fuchs, 2016).
Technology Limitations
Blind Zones
Some ultrasonic sensors have a “blind zone” when objects are too close to the sensor. The size of the blind zone varies according to the design of the sensor, and is caused by the sensor needing to switch between chirp mode and listening mode. If the object is so close that the echo reaches the sensor before the sensor has switched to listening mode, the sensor will not detect the echo or object (Figure F-6).
Figure F-5Example of linear array of ultrasonic
sensors for side-object detection
Figure F-6Ultrasonic sensor
sensing distances and blind zone
Source: Rockwell Automation (2016)
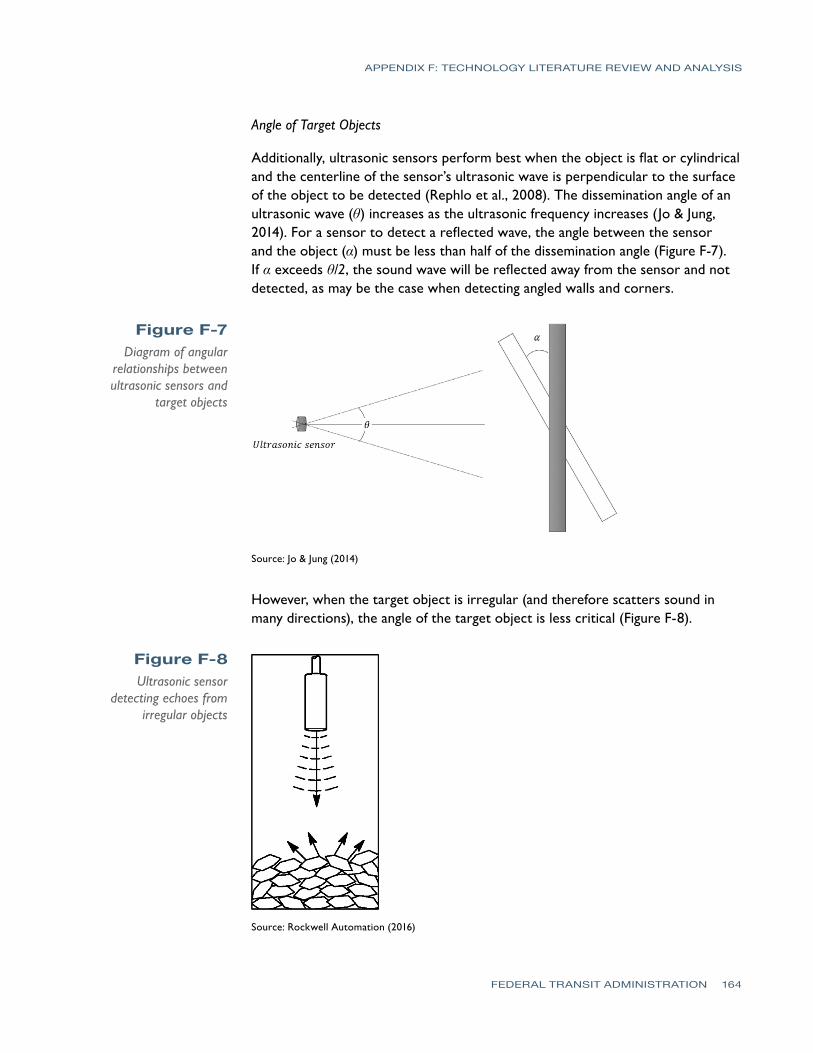
APPENDIX F: TECHNOLOGY LITERATURE REVIEW AND ANALYSIS
FEDERAL TRANSIT ADMINISTRATION 164
Angle of Target Objects
Additionally, ultrasonic sensors perform best when the object is flat or cylindrical and the centerline of the sensor’s ultrasonic wave is perpendicular to the surface of the object to be detected (Rephlo et al., 2008). The dissemination angle of an ultrasonic wave (θ) increases as the ultrasonic frequency increases (Jo & Jung, 2014). For a sensor to detect a reflected wave, the angle between the sensor and the object (α) must be less than half of the dissemination angle (Figure F-7). If α exceeds θ/2, the sound wave will be reflected away from the sensor and not detected, as may be the case when detecting angled walls and corners.
Figure F-7Diagram of angular
relationships between ultrasonic sensors and
target objects
Source: Jo & Jung (2014)
However, when the target object is irregular (and therefore scatters sound in many directions), the angle of the target object is less critical (Figure F-8).
Figure F-8Ultrasonic sensor
detecting echoes from irregular objects
Source: Rockwell Automation (2016)
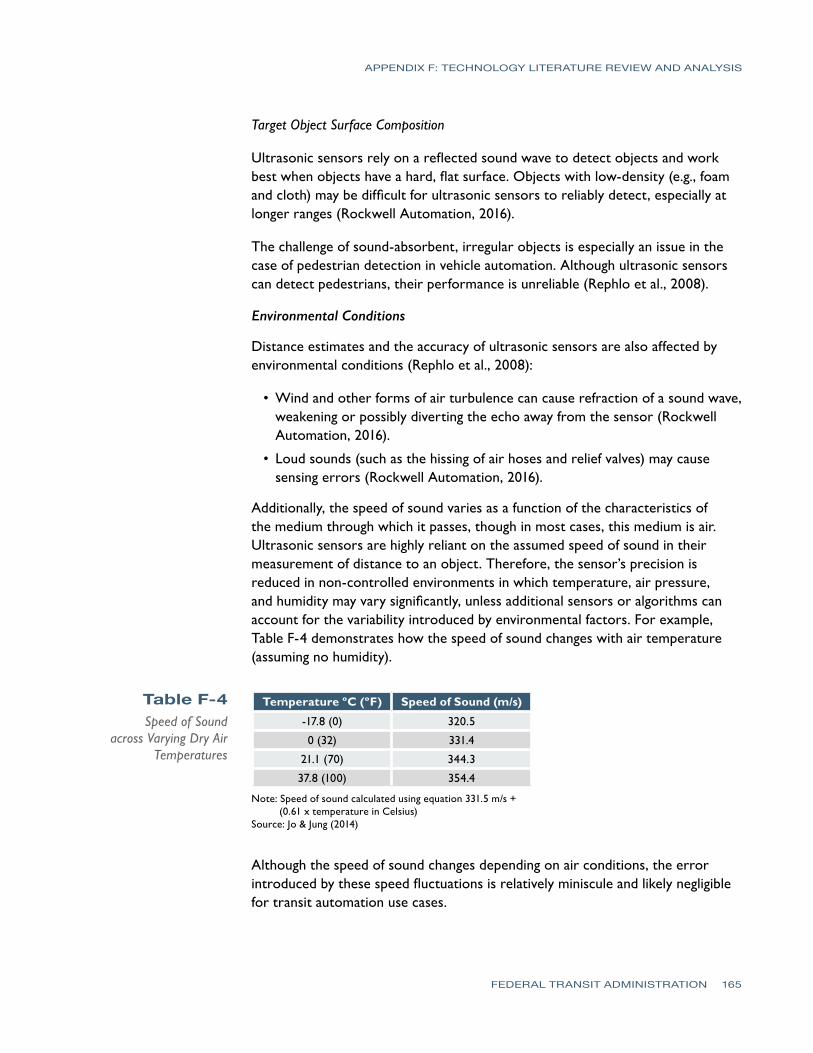
APPENDIX F: TECHNOLOGY LITERATURE REVIEW AND ANALYSIS
FEDERAL TRANSIT ADMINISTRATION 165
Target Object Surface Composition
Ultrasonic sensors rely on a reflected sound wave to detect objects and work best when objects have a hard, flat surface. Objects with low-density (e.g., foam and cloth) may be difficult for ultrasonic sensors to reliably detect, especially at longer ranges (Rockwell Automation, 2016).
The challenge of sound-absorbent, irregular objects is especially an issue in the case of pedestrian detection in vehicle automation. Although ultrasonic sensors can detect pedestrians, their performance is unreliable (Rephlo et al., 2008).
Environmental Conditions
Distance estimates and the accuracy of ultrasonic sensors are also affected by environmental conditions (Rephlo et al., 2008):
• Wind and other forms of air turbulence can cause refraction of a sound wave, weakening or possibly diverting the echo away from the sensor (Rockwell Automation, 2016).
• Loud sounds (such as the hissing of air hoses and relief valves) may cause sensing errors (Rockwell Automation, 2016).
Additionally, the speed of sound varies as a function of the characteristics of the medium through which it passes, though in most cases, this medium is air. Ultrasonic sensors are highly reliant on the assumed speed of sound in their measurement of distance to an object. Therefore, the sensor’s precision is reduced in non-controlled environments in which temperature, air pressure, and humidity may vary significantly, unless additional sensors or algorithms can account for the variability introduced by environmental factors. For example, Table F-4 demonstrates how the speed of sound changes with air temperature (assuming no humidity).
Table F-4Speed of Sound
across Varying Dry Air Temperatures
Temperature ºC (ºF) Speed of Sound (m/s)
-17.8 (0) 320.5
0 (32) 331.4
21.1 (70) 344.3
37.8 (100) 354.4
Note: Speed of sound calculated using equation 331.5 m/s + (0.61 x temperature in Celsius) Source: Jo & Jung (2014)
Although the speed of sound changes depending on air conditions, the error introduced by these speed fluctuations is relatively miniscule and likely negligible for transit automation use cases.
APPENDIX F: TECHNOLOGY LITERATURE REVIEW AND ANALYSIS
FEDERAL TRANSIT ADMINISTRATION 166
Suppliers and Costs
Ultrasonic sensors are heavily utilized in industrial settings (e.g., factories seeking to measure tank fluid levels), and many suppliers specialize in providing various models of sensors with varying sensing ranges, beam widths, and resistance to chemicals and vibrations.
• Texas Instruments offers a $5.85 sensor with integrated microcontroller (with quantity pricing of $2.60 per unit for quantities of 1,000–9,999).
• One of Bosch’s ultrasonic sensors, the URF6, is commercially-deployed in passenger vehicles for back-up assistance and is available from third parties, with prices ranging from $15–$60.
• MaxBotix offers various models of sensors from basic to high-precision. Several sensors are specifically promoted for use in outdoor vehicle detection applications and range in price from $89.95–$149.95.
• Datalogic manufactures various models of ultrasonic sensors for $140–$681.
There are many other sensors on the market with a wide range of special purposes. The most basic model of ultrasonic sensors is a unit created for use with the Arduino platform.73 This sensor can be purchased for as little as $2–$3.
The technology supplier DigiKey has 90 ultrasonic sensors for sale ranging in price from $2–$2,338. More expensive models usually have greater precision, a higher sensing distance, greater durability, and more built-in features (e.g., temperature sensing and compensation, multi-sensor interference prevention, etc.). Additional manufacturers of ultrasonic sensors found on DigiKey’s site include:
• Adafruit Industries, LLC
• Digilent, Inc.
• Honeywell Sensing and Productivity Solutions
• Murata Electronics North America
• Omron Automation and Safety
• Panasonic Industrial Automation Sales
• Parallax Inc
• PUI Audio, Inc
• Pepperl+Fuchs
73 “Arduino is an open-source electronics platform based on easy-to-use hardware and software. Arduino boards are able to read inputs—light on a sensor, a finger on a button, or a Twitter message—and turn it into an output, activating a motor, turning on an LED, publishing something online. You can tell your board what to do by sending a set of instructions to the microcontroller on the board.” (Arduino, 2016).
APPENDIX F: TECHNOLOGY LITERATURE REVIEW AND ANALYSIS
FEDERAL TRANSIT ADMINISTRATION 167
Communication SystemsDSRC
Dedicated Short-Range Communications (DSRC) is a Wi-Fi derivative technology developed to meet specialized needs for secure,74 low latency,75 wireless mobile data communications (USDOT, 2015; ITS JPO 2016a). DSRC enables two-way short- to medium-range (1 km)76 wireless communications with very high data transmissions (up to 27 Mbps) where minimizing latency and isolating relatively small communications zones are important (Maitipe and Hayee, 2010). In October 1999, the FCC allocated the 75 MHz of bandwidth at 5.9 GHz band for DSRC-based Intelligent Transportation System (ITS) applications. In December 2016, NHTSA issued a Notice of Proposed Rulemaking (NPRM) that would require all new light vehicles to be equipped with DSRC devices that would transmit and receive basic safety messages.
Currently, there are two broad categories of DSRC-based communications: broadcast messaging, which transmits a new dataset77 to all nearby devices; and Internet Protocol, which can route messages across one or more IP networks in the local area. These communications capabilities support Vehicle-to-Vehicle (V2V) communication and Vehicle-to-Infrastructure (V2I) communications.78 The NHTSA NPRM covers V2V communications. V2I communications are enabled by DSRC but are not specified under the NHTSA NPRM.
Each DSRC-equipped vehicle (equipped either through manufacturing or retro-fitting) communicates through “over-the-air transmitted in small packets of data containing vehicle situational elements, including vehicle size, vehicle location (GPS coordinates and timestamp), speed, heading, steering angle, and brake status. The small size of the data packets enables messages to be broadcast frequently (about every 1,000 microseconds) and processed quickly (Abboud et al., 2016; eInfochips, 2016). Similar messaging can be provided by mobile devices (i.e., smart phones or aftermarket devices) as well as infrastructure devices.
74 Security ensures that messages are authentic (not altered) and from a trusted source rather than secure. Messages are not encrypted.
75 Latency is a measure of the time delay experienced in a system, usually between the sending, and subsequent reception, of information. The lower the latency the faster the transmission.
76 Generally, at 5.8 to 5.9 GHz, communication can occur at data rates of 6–27 Mbps at distances of several hundred meters.
77 Primarily a “basic safety message” (BSM) but inclusive of other types of messages that support crash-imminent safety such as Signal Phase and Timing (SPaT) messages; MAP (intersection geometry message); GNSS location correction messages, a subset of Radio Technical Commission for Maritime (RTCM) messages; and the Traveler Information Message (TIM)/Basic Infrastructure Message (BIM), particularly at intersections. The messages are described in detail in SAE J2735 and J2945/0.
78 V2X is also used to denote vehicle-to-everything communications, wherein everything refers to other vehicles, infrastructure, pedestrians, bicyclists, etc.
APPENDIX F: TECHNOLOGY LITERATURE REVIEW AND ANALYSIS
FEDERAL TRANSIT ADMINISTRATION 168
Enabling DSRC equipment comprises On-Board Units (OBUs) installed in the vehicle and Roadside Units (RSUs) installed as part of the infrastructure (FCC, 2004). An OBU is a transceiver that is normally mounted in or on a vehicle. OBUs communicate using IEEE 802.11p standard. An RSU is a transceiver that is mounted along a road or pedestrian passageway. Under V2V communications, OBUs can communicate with other OBUs within their communications zone. Under V2I, an RSU can broadcast data to OBUs or exchange data with OBUs within its communications zone. These enabling technologies can support a range of public-benefit applications including: crash-imminent safety, system efficiency, mobility, and environmental performance applications. With the exception of V2V and V2I safety applications, the communications requirements associated with other transportation applications can be supported through other types of technologies such as cellular, fiber, Wi-Fi, or satellite communications.
Each DSRC-equipped vehicle communicates the Basic Safety Message (BSM) over the air. There are several advantages to using DSRC for vehicle-based communications. Unlike other sensors such as radar, lidar, or cameras, DSRC it is not limited by line of sight or blocked by buildings or other vehicles because it uses radio frequencies. DSRC provides 360 degrees of coverage, whereas vehicle-based sensors such as camera or radar sensors can be more limited in terms of direction and distance at which they are able to detect a potential conflict (USDOT, 2015). Additionally, in comparison to cellular communications, DSRC can provide higher transfer rates and smaller communication latencies for small communication zones defined by the communication radius of the technology (Popescu-Zeletin et al., 2010). Other advantages to DSRC are that it supports high vehicle speed conditions (address multi-path and Doppler shift effects), has a high tolerance for message loss, and is immune to extreme weather conditions (Maitipe and Hayee, 2010).
Technology Capabilities
DSRC communications devices and V2V and V2I applications can be factory-installed, retrofitted, or aftermarket-installed. As an additional option, the devices could potentially be carried into vehicles by drivers in the form of a handheld device (Harding, 2014). Although fully-integrated systems, as currently designed, and retrofit packages can both transmit and receive messages, aftermarket device capabilities can vary significantly from system to system. The simplest designs may only transmit (and not receive) messages. More sophisticated options may have the ability to both receive and transmit messages to nearby vehicles and may also connect to the vehicle data bus (similar to fully-integrated devices).79
79 A vehicle data bus is a specialized internal communications network that interconnects components inside a vehicle. The common protocol is Controller Area Network (CAN).
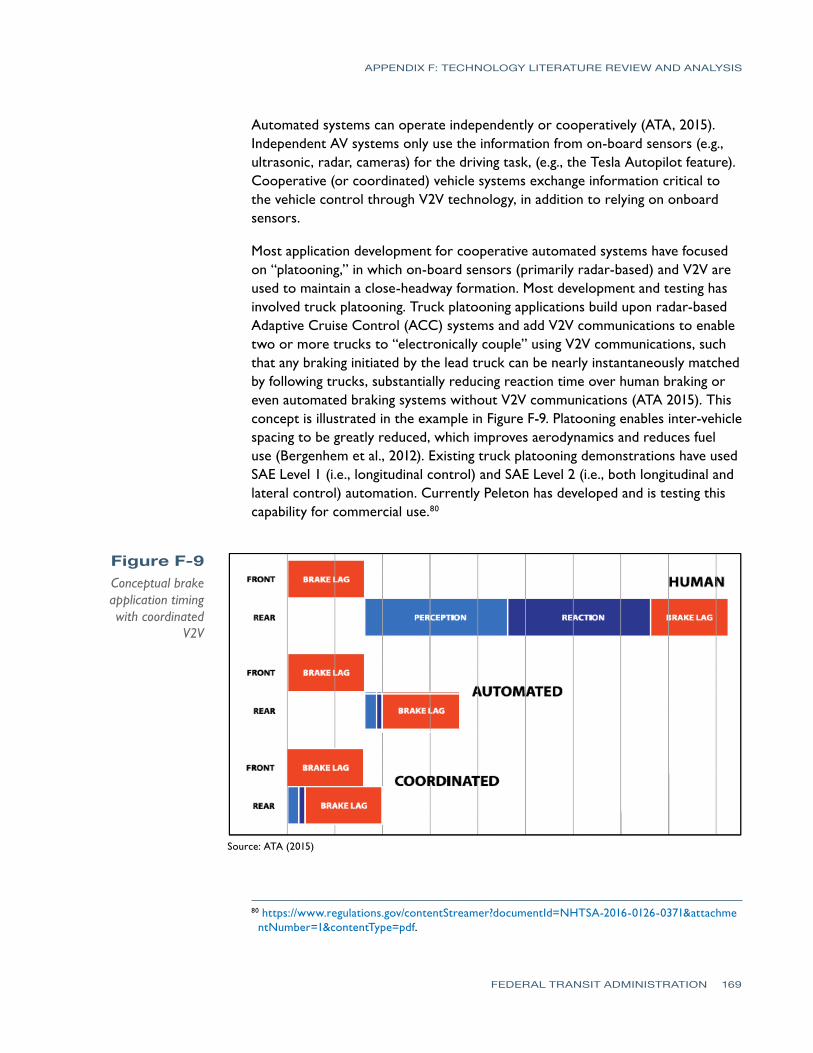
APPENDIX F: TECHNOLOGY LITERATURE REVIEW AND ANALYSIS
FEDERAL TRANSIT ADMINISTRATION 169
Automated systems can operate independently or cooperatively (ATA, 2015). Independent AV systems only use the information from on-board sensors (e.g., ultrasonic, radar, cameras) for the driving task, (e.g., the Tesla Autopilot feature). Cooperative (or coordinated) vehicle systems exchange information critical to the vehicle control through V2V technology, in addition to relying on onboard sensors.
Most application development for cooperative automated systems have focused on “platooning,” in which on-board sensors (primarily radar-based) and V2V are used to maintain a close-headway formation. Most development and testing has involved truck platooning. Truck platooning applications build upon radar-based Adaptive Cruise Control (ACC) systems and add V2V communications to enable two or more trucks to “electronically couple” using V2V communications, such that any braking initiated by the lead truck can be nearly instantaneously matched by following trucks, substantially reducing reaction time over human braking or even automated braking systems without V2V communications (ATA 2015). This concept is illustrated in the example in Figure F-9. Platooning enables inter-vehicle spacing to be greatly reduced, which improves aerodynamics and reduces fuel use (Bergenhem et al., 2012). Existing truck platooning demonstrations have used SAE Level 1 (i.e., longitudinal control) and SAE Level 2 (i.e., both longitudinal and lateral control) automation. Currently Peleton has developed and is testing this capability for commercial use.80
80 https://www.regulations.gov/contentStreamer?documentId=NHTSA-2016-0126-0371&attachmentNumber=1&contentType=pdf.
Figure F-9Conceptual brake application timing with coordinated
V2V
Source: ATA (2015)
APPENDIX F: TECHNOLOGY LITERATURE REVIEW AND ANALYSIS
FEDERAL TRANSIT ADMINISTRATION 170
Platooning could be a useful application for public transit, for example, to mitigate a phenomenon called bus bunching (Cheong, 2016). Bus bunching refers to variations in successive bus arrivals, or headways, among buses circulating on a route. While not always the case, service can be optimized when times between headways are equal. Platooning could create a situation of self-equalizing headways. However, there were few demonstrations of the technology applied to automated public transit vehicles found in the literature, with the exception of some bus platooning work from PATH (Tan et al., 2014).
Technology Evolution
Technologically, DSRC has existed for over a decade and is considered a mature technology. For vehicle communications, DSRC is allocated for safety applications due to its reliability, secure data transmission, and low latency (eInfochips, 2016).
Although proponents of DSRC point out that it can accommodate all necessary V2V and V2I communications in modules that are already commercially available, some technology experts have argued 5G wireless networks will soon supplant DSRC and that installing DSRC in the meantime is merely a stopgap measure (Nordrum, 2016). However, the vision, specifications, and standards that define 5G, are still very much in the draft stages and it is estimated that it could take up to 15 years for tested 5G devices to be commercially available that could support critical transportation communications. The USDOT recognizes the potential opportunities of 5G and is working on research to be able to evaluate its capabilities for transportation, when specifications become available.
Example Implementation and Uses
Within transit, primary categories of benefits for DSRC-enabled vehicle communications include safety operation, and convenience benefits. Most of the near-term focus has been on applications to provide safety “warnings” (including some transit applications), rather than using DSRC for automation (ITS JPO, 2016b). Land Transport Authority (LTA) and Nanyang Technological University (NTU) Self-driving Bus Trial in Singapore is one of the few examples of DSRC-enabled technologies applied to automated buses.
The literature search did not identify any cooperative automation projects in the public transit sector, other than the previously mentioned PATH bus platooning demonstrations and the pilot in Singapore. Most of the automated transit shuttle demonstrations (e.g., CityMobil2, EasyMile, Navya, Local Motors) use on-board sensors or other technology, rather than relying on DSRC, although there are some automation projects that do include vehicle communication technologies. However, there are several current public-private research projects that are focused on truck platooning development and testing, both within the United Stated and abroad (ATA, 2015). These projects use DSRC to coordinate a line of
APPENDIX F: TECHNOLOGY LITERATURE REVIEW AND ANALYSIS
FEDERAL TRANSIT ADMINISTRATION 171
Class 8 trucks that are usually capable of SAE Level 1 automation (braking and acceleration), but are sometimes capable of SAE Level 2 automation (braking, acceleration, steering). Platoons can help reduce fuel consumption or increase road capacity by reducing the headway between vehicles. Platooning technology is potentially relevant for transit buses used for BRT or long-haul routes on highways to provide high-capacity transit service.
Suppliers and Costs
NHTSA’s preliminary estimates found that V2V equipment and supporting communications functions (such as a security management system) would cost approximately $341–$350 per vehicle in 2020, but then decrease to approximately $209–$235 by 2058 as manufacturers gain experience producing the equipment (NHTSA, 2016). A 2012 survey of experts indicated that costs for a DSRC unit may soon come down to $175 and will drop as low as $75 by 2022 (CAR, 2012). However, these costs are for light-duty vehicles. There are no cost figures for DSRC-enabled OBUs for buses.
Manufacturers of DSRC radio equipment include the following firms (ITSA, 2016; Lukuc, TTI):
• Arada Systems http://www.aradasystems.com
• Bosch http://products.bosch-mobility-solutions.com/en/de/driving_comfort/driving_comfort_systems_for_passenger_cars_1/connectivity_solutions_2/connectivity_solutions_3.html
• Cohda Wireless http://www.cohdawireless.com/
• Continental http://www.continental-its.com/www/its_de_EN/themes/ITS_overview/verkehrsmanagement_en.html
• Delphi http://www.delphi.com/manufacturers/auto/connection-systems
• Denso http://www.densocorp-na.com/default.php
• Kapsch http://www.kapsch.net/en/Pages/default.aspx
• Mark IV (now Kapsch) http://www.ivhs.com/
• Panasonic http://business.panasonic.com/solutions-automotivesolutions
• Savari-networks http://www.savarinetworks.com/
• Siemens https://www.siemens.com/innovation/en/home/pictures-of-the-future/mobility-and-motors/urban-mobility-radar-technology-for-highways.html
• Sirit (Federal Signal) http://www.sirit.com/
• Transcore http://www.transcore.com/

APPENDIX F: TECHNOLOGY LITERATURE REVIEW AND ANALYSIS
FEDERAL TRANSIT ADMINISTRATION 172
Cellular/Wireless
Cellular/wireless communication (cellular) is a communication technology that allows for the wireless transmission of data and voice between mobile devices, the internet, or other services across long distances. Data are transmitted between devices using various bands of the radio spectrum, depending on the specific technology and service provider. To date, cellular communication relies on base stations (cell towers) that provide coverage for a given area, or “cell.” These cells are arranged in clusters, and clusters are arranged adjacent to one another to provide almost continuous coverage (Figure F-10). Because of this arrangement of cells, radio frequencies can be reused by the cells. For example, in Figure F-10, all cells with the same number are using the same radio frequency. Reusing radio frequencies allows the system to save bandwidth.
Figure F-10Basic units of
providing cellular communication: base
station or cell and cell clusters
Source: Introduction to Cellular Communications, GSMFavorites.com (2017)
The cells are connected to several back-end systems that handle traffic, connect mobile devices together, and manage handoff of mobile devices from one cell to another (Figure F-11).
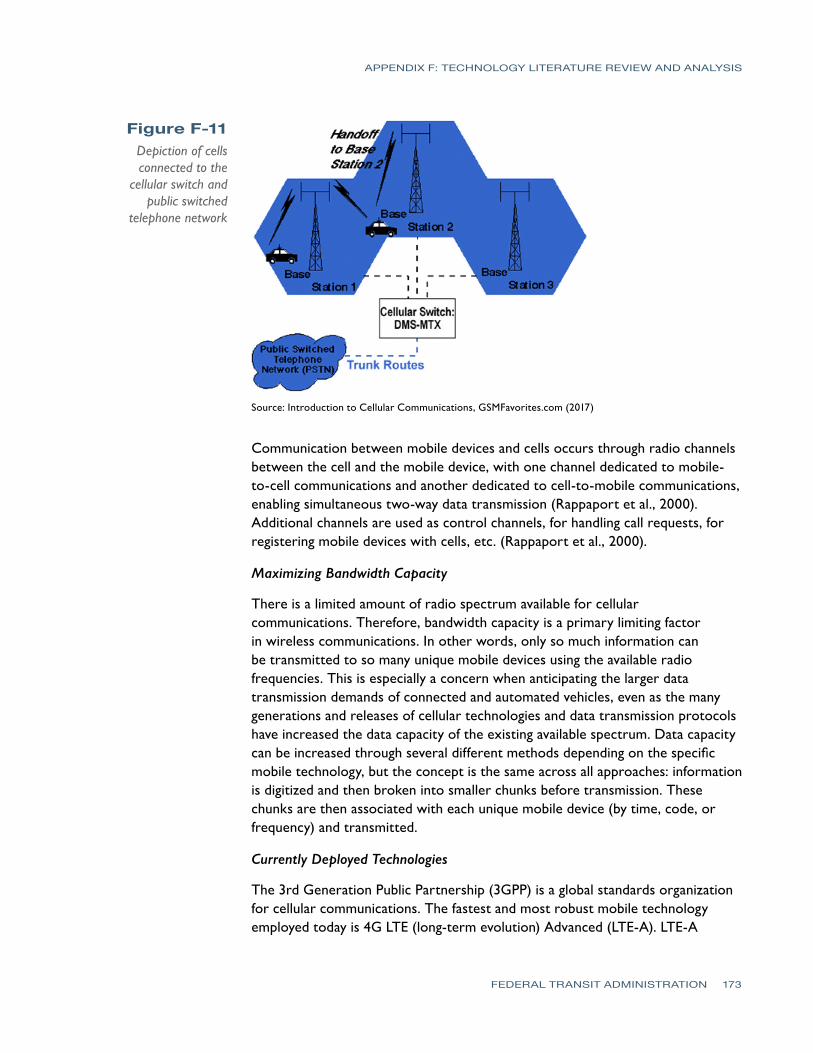
APPENDIX F: TECHNOLOGY LITERATURE REVIEW AND ANALYSIS
FEDERAL TRANSIT ADMINISTRATION 173
Source: Introduction to Cellular Communications, GSMFavorites.com (2017)
Communication between mobile devices and cells occurs through radio channels between the cell and the mobile device, with one channel dedicated to mobile-to-cell communications and another dedicated to cell-to-mobile communications, enabling simultaneous two-way data transmission (Rappaport et al., 2000). Additional channels are used as control channels, for handling call requests, for registering mobile devices with cells, etc. (Rappaport et al., 2000).
Maximizing Bandwidth Capacity
There is a limited amount of radio spectrum available for cellular communications. Therefore, bandwidth capacity is a primary limiting factor in wireless communications. In other words, only so much information can be transmitted to so many unique mobile devices using the available radio frequencies. This is especially a concern when anticipating the larger data transmission demands of connected and automated vehicles, even as the many generations and releases of cellular technologies and data transmission protocols have increased the data capacity of the existing available spectrum. Data capacity can be increased through several different methods depending on the specific mobile technology, but the concept is the same across all approaches: information is digitized and then broken into smaller chunks before transmission. These chunks are then associated with each unique mobile device (by time, code, or frequency) and transmitted.
Currently Deployed Technologies
The 3rd Generation Public Partnership (3GPP) is a global standards organization for cellular communications. The fastest and most robust mobile technology employed today is 4G LTE (long-term evolution) Advanced (LTE-A). LTE-A
Figure F-11Depiction of cells connected to the
cellular switch and public switched
telephone network
APPENDIX F: TECHNOLOGY LITERATURE REVIEW AND ANALYSIS
FEDERAL TRANSIT ADMINISTRATION 174
was first propagated in the 10th wireless communications standard released by 3GPP and has become more advanced through release 12. For example, in release 12, LTE-A included specifications that allowed for device-to-device (D2D) communications with little to no involvement of a cell (Liu et al., 2015). LTE-A is designed for high-speed data applications. LTE-A networks offer a theoretical data transfer capability of up to 3 Gbps in the downlink and about 1.5 Gbps in the uplink (Bleicher, 2013). LTE-A Pro was released in 2015 (3GPP release 13+; 3GPP 2015) and made further enhancements to data transmission and reliability, but currently no consumer wireless carriers offer service on such a network.
Next-Generation Mobile Communications (4G LTE Updates and 5G)
Although cellular communications technology has already undergone significant advancement since its creation, work is underway to further develop the mobile communication standards to meet increasing data transmission demands. In September 2016, 3GPP completed a cellular standard (4G release 14) to “keep track with the increasing needs of the automotive industry…. [and to enable] direct communication (between vehicles, vehicle to pedestrian, and vehicle to infrastructure) and for cellular communications with networks” (Flore, 2016). 4G release 14 is targeted for deployment in March 2017.
Additional work is underway to develop the next generation of mobile communication technology, called 5G (5th generation). Some predictions are that 5G will be up to 100 times faster than LTE (Wilson Amplifiers, 2016). Due to the anticipated speed, reliability, and features of 5G, proponents suggest 5G as a potential alternative to dedicated short-range communication (DSRC).81
Because of continuous 3GPP updates, what was once considered solely “cellular” wireless communication (i.e., communication between mobile devices and cell towers) is now a platform that supports multiple types of communications over heterogeneous networks, including D2D communications (i.e., direct communication between mobile devices). To maintain clarity, the remainder of this section will refer to the current wireless communication standards and technologies as “LTE” and will refer to the next generation of 3GPP standards as “5G.”
Technology Capabilities
Research on Comparative Performance to IEEE 802.11p
Mir and Filali (2014) conducted simulations to compare the relative strengths and weaknesses of LTE when compared to IEEE 802.11p in a V2X framework. The simulations involved altering the frequency of transmission of data packets, the number of vehicles transmitting packets, and the vehicles’ speed. The study’s
81 For example, see Seo et al., 2016.
APPENDIX F: TECHNOLOGY LITERATURE REVIEW AND ANALYSIS
FEDERAL TRANSIT ADMINISTRATION 175
findings indicated that the “LTE standard scales better, delivers data reliably, and meets the latency requirements posed by several vehicular networking applications. The IEEE 802.11p standard, on the other hand, exhibits lower… latencies and higher delivery… throughput in scenarios in which there are fewer than 50 vehicles. However, as the number of vehicles increases, the standard is unable to support the performance requirements” (Mir and Filali, 2014).
Long-Distance Communication
Because LTE/5G is historically built around an infrastructure that supports long-distance communication, the only real limit on the distance mobile units (e.g., two vehicles, a vehicle and a central fleet manager, etc.) can communicate is whether each unit is within the range of a cell tower. This long-range communication becomes increasingly important in places where road-side communications infrastructure is absent or undesirable. APTA suggests that cellular communication can be used for long-distance exchange of live data for BRT services, but recommends that the data sent over cellular should be limited to small packets of live (i.e., real-time) information, because cellular data transmission is usually priced based on the quantity of bytes transmitted (APTA, 2010). Cellular communication can also be used by information displays at bus stops to receive real-time customer information (APTA, 2010).
Connectivity to Internet and Cloud Resources
Inherent in the LTE/5G technology is cellular networks’ connection to the internet and therefore any internet-based technologies and services, including cloud-based services (Johri et al., 2016). Therefore, any vehicle applications that utilize internet resources could rely on LTE/5G communications. The data connection available from LTE/5G can also be used to provide Wi-Fi and infotainment to transit riders onboard transit vehicles and at transit facilities (APTA 2010; VIA Metropolitan Transit 2015).
Capable of Device-to-Device Communications
Traditional cellular communications technology relies solely on cellular networks for communications, implying that even if two people were talking to each other on cell phones in the same room, their phones would be communicating via a cellular tower and other backend management hardware and software. 4G LTE-Advanced (and 5G) supports device-to-device (D2D) communications, which allow mobile devices to transmit locally instead of to a cellular tower (Flore, 2016; Qualcomm, 2016). D2D communications supported by LTE can help by offloading cellular network traffic, reducing cellular congestion, reducing power consumption, and enabling location-based services (Nshimiyimana, Agrawal, & Arif, 2016). D2D detection and communication appears possible up to around 500 meters (Fodor et al., 2011); however, more research is needed to determine
APPENDIX F: TECHNOLOGY LITERATURE REVIEW AND ANALYSIS
FEDERAL TRANSIT ADMINISTRATION 176
the actual algorithms and processes to enable the most energy-efficient, highest speed, and most reliable D2D communications at various distances and with and without additional support from a cellular network (e.g., see Fodor et al., 2011; de H.M. Barros et al., 2012; Hong et al., 2013; Xu, Song, & Han, 2013).
Although not explicitly discussed as an application of D2D communication, Schweiger’s (2016) Intelligent Transportation primer on public transportation mentions that cellular networks could be used by transit vehicles to communicate with way-side equipment, for example, communicating with traffic signals for transit-signal prioritization, which could be accomplished by using cell towers or by directly using D2D.
Technology Limitations
Reliance on Cellular Networks
Aside from D2D communication, LTE/5G still relies on cellular networks, which have several limitations:
• Loss of communication ability in areas that are not covered by cellularnetworks.
• Longer end-to-end latency (as compared to short-range, directcommunications between devices) due to the multiple protocols andtransmissions required to enable cellular communications. The reportedlatency of the latest LTE release (LTE Advanced Pro) boasts a 2 mslatency (5G.co.uk 2017), which is highly competitive with other wirelesscommunications technologies.
Limits on Relative Speed
4G networks can support communication scenarios only up to 250 km/h or 155.3 mph (Wang et al. 2014). For instance, this limitation could reduce the use of 4G on high-speed trains. Under normal vehicular speeds (including most transit speeds), Mir and Filali (2014) found no evidence of communication degradation.
Reliance on Carriers
Another limitation to LTE/5G is reliance on cellular carriers for system functionality. As is the case with mobile phones which require data plans, vehicles and other mobile devices accessing cellular LTE/5G networks need permission to do so, which usually involves payment to a carrier. The pricing mechanisms and user fees for connected vehicles are uncertain, but access to cellular networks is unlikely to be free.
APPENDIX F: TECHNOLOGY LITERATURE REVIEW AND ANALYSIS
FEDERAL TRANSIT ADMINISTRATION 177
Suppliers and Costs
The nature of cellular, LTE, and 5G technologies and their application to transit is such that there are several suppliers involved—data transmission suppliers, hardware suppliers, and, optionally, intelligent transportation system (ITS) providers.
Data Transmission Suppliers
The standards that govern LTE/5G technologies are free and are used by the marketplace to enable seamless communication between multiple devices and providers. However, cellular networks and the corresponding radio frequency bandwidth are still managed by providers (e.g., Verizon, AT&T, etc.), and passing data from vehicles and mobile devices to cellular networks currently requires a payment of fees. These fees vary significantly and are often a function of data transmission speed and bytes transferred (e.g., monthly caps on data usage).
Hardware Suppliers
There are several suppliers who provide hardware to enable cellular (3G, 4G, and 4G LTE) communications. The list below is merely a sampling of available vendors of hardware—and some devices require a provider-supplied (e.g., Verizon) modem to actually connect to a cellular network; these companies do not post the cost of their products online:
• Cisco http://www.cisco.com/c/en/us/solutions/collateral/industry-solutions/solution-overview-c22-735799.pdf
• Teldat http://www.teldat.com/telecommunications-solutions/transport-routers/automotive-bus-car-rugged-router-lte-4g-3g-wifi/
• Cradlepoint https://cradlepoint.com/products-and-services/wireless_routers
• BEC Technologies http://bectechnologies.net/in-vehicle-lte-connectivity/
• REI http://www.radioeng.com/default.aspx
ITS Providers
In addition, some companies offer turn-key complete intelligent transportation system packages for transit that include both the hardware and software to enable various applications and processes that rely on wireless communications, including cellular (3G, 4G, 4G LTE). Some of the largest of these companies include:
• INIT Innovations in Transportation http://www.initag.com/en/index.php
• Avail Technologies http://www.availtec.com/
APPENDIX F: TECHNOLOGY LITERATURE REVIEW AND ANALYSIS
FEDERAL TRANSIT ADMINISTRATION 178
• Clever Devices http://www.cleverdevices.com/index.htm
• Trapeze http://www.trapezegroup.com/intelligent-transportation-systems
• Xerox (now Conduent) https://www.conduent.com/solution/transportation-solutions/public-transportation-management/
Although these companies do not provide pricing online, one report from 2007 estimated the cost of transit mobile data terminals (devices onboard transit vehicles that collect and communicate data over wireless networks) to range between $1,000 and $4,000 per unit, with installation costs between $500 and $1,000 per unit (Harman & Shama, 2007). However, it can be difficult to estimate costs solely related to the cellular communication technologies, because it is rare for transit agencies to add cellular capabilities as a stand-alone project. Additionally, mobile data terminals are only one component of a transit ITS system; therefore, the full cost of a complete system will be higher than the mobile data terminal cost estimates reported here.
Vehicle Positioning and Motion Systems
High Precision Global Navigation Satellite Systems
Global Navigation Satellite Systems (GNSS) provide global geolocation and time information to users in all weather conditions by connecting to four or more satellites. The United States developed the first GNSS system, called the Global Positioning System (GPS). Several other GPS-like systems have since launched. The term GNSS is now used to describe the collection of satellite positioning systems currently operating (Novatel, 2016):
• GPS (U.S.) was initially launched in the late 1970s by the U.S. Departmentof Defense. GPS uses a constellation of 27 satellites and provides globalcoverage. GPS continues to be updated and is now managed jointly by theU.S. Departments of Defense and Transportation to provide for both militaryand civilian uses.
• GLONASS (Russia) became fully-operational in 1995. GLONASS currentlyuses 23 operational satellites and provides global coverage.
• Galileo (European Union), which began in 2014, is a civil GNSS systemoperated by the European Global Navigation Satellite Systems Agency.Galileo will use 27 satellites when completed in 2020 and will provide globalcoverage.
• BeiDou (China) began regional service for China in 2012. BeiDou will use 35satellites when completed in 2020 and will provide global coverage.
Basic GNSS systems geo-locate a user device in five operational steps, illustrated in Figure F-12 (Novatel, 2016):
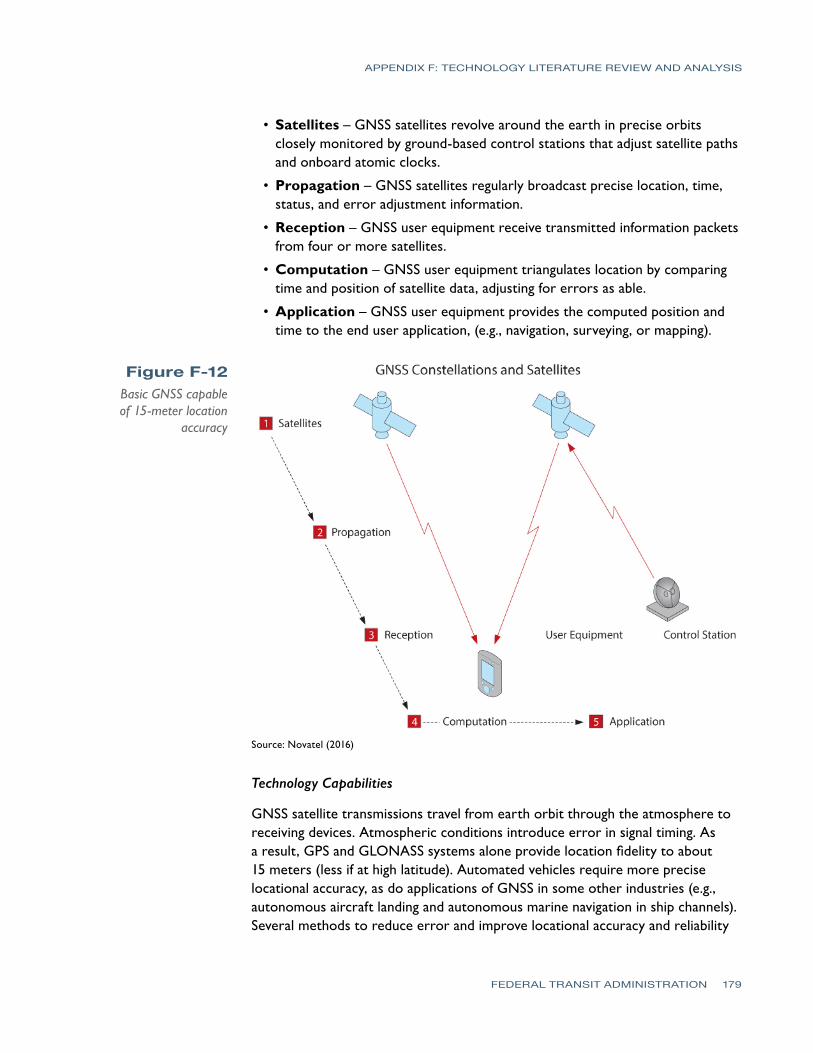
APPENDIX F: TECHNOLOGY LITERATURE REVIEW AND ANALYSIS
FEDERAL TRANSIT ADMINISTRATION 179
• Satellites – GNSS satellites revolve around the earth in precise orbits closely monitored by ground-based control stations that adjust satellite paths and onboard atomic clocks.
• Propagation – GNSS satellites regularly broadcast precise location, time, status, and error adjustment information.
• Reception – GNSS user equipment receive transmitted information packets from four or more satellites.
• Computation – GNSS user equipment triangulates location by comparing time and position of satellite data, adjusting for errors as able.
• Application – GNSS user equipment provides the computed position and time to the end user application, (e.g., navigation, surveying, or mapping).
Figure F-12Basic GNSS capable of 15-meter location
accuracy
Source: Novatel (2016)
Technology Capabilities
GNSS satellite transmissions travel from earth orbit through the atmosphere to receiving devices. Atmospheric conditions introduce error in signal timing. As a result, GPS and GLONASS systems alone provide location fidelity to about 15 meters (less if at high latitude). Automated vehicles require more precise locational accuracy, as do applications of GNSS in some other industries (e.g., autonomous aircraft landing and autonomous marine navigation in ship channels). Several methods to reduce error and improve locational accuracy and reliability
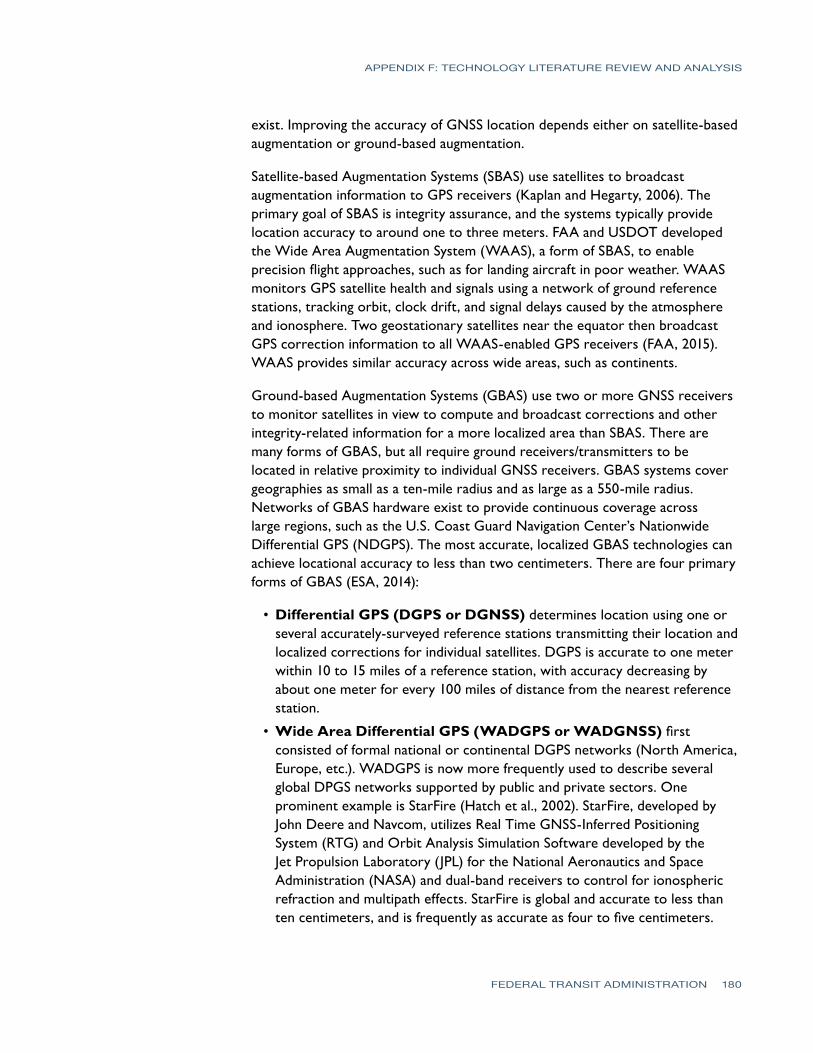
APPENDIX F: TECHNOLOGY LITERATURE REVIEW AND ANALYSIS
FEDERAL TRANSIT ADMINISTRATION 180
exist. Improving the accuracy of GNSS location depends either on satellite-based augmentation or ground-based augmentation.
Satellite-based Augmentation Systems (SBAS) use satellites to broadcast augmentation information to GPS receivers (Kaplan and Hegarty, 2006). The primary goal of SBAS is integrity assurance, and the systems typically provide location accuracy to around one to three meters. FAA and USDOT developed the Wide Area Augmentation System (WAAS), a form of SBAS, to enable precision flight approaches, such as for landing aircraft in poor weather. WAAS monitors GPS satellite health and signals using a network of ground reference stations, tracking orbit, clock drift, and signal delays caused by the atmosphere and ionosphere. Two geostationary satellites near the equator then broadcast GPS correction information to all WAAS-enabled GPS receivers (FAA, 2015). WAAS provides similar accuracy across wide areas, such as continents.
Ground-based Augmentation Systems (GBAS) use two or more GNSS receivers to monitor satellites in view to compute and broadcast corrections and other integrity-related information for a more localized area than SBAS. There are many forms of GBAS, but all require ground receivers/transmitters to be located in relative proximity to individual GNSS receivers. GBAS systems cover geographies as small as a ten-mile radius and as large as a 550-mile radius. Networks of GBAS hardware exist to provide continuous coverage across large regions, such as the U.S. Coast Guard Navigation Center’s Nationwide Differential GPS (NDGPS). The most accurate, localized GBAS technologies can achieve locational accuracy to less than two centimeters. There are four primary forms of GBAS (ESA, 2014):
• Differential GPS (DGPS or DGNSS) determines location using one or several accurately-surveyed reference stations transmitting their location and localized corrections for individual satellites. DGPS is accurate to one meter within 10 to 15 miles of a reference station, with accuracy decreasing by about one meter for every 100 miles of distance from the nearest reference station.
• Wide Area Differential GPS (WADGPS or WADGNSS) first consisted of formal national or continental DGPS networks (North America, Europe, etc.). WADGPS is now more frequently used to describe several global DPGS networks supported by public and private sectors. One prominent example is StarFire (Hatch et al., 2002). StarFire, developed by John Deere and Navcom, utilizes Real Time GNSS-Inferred Positioning System (RTG) and Orbit Analysis Simulation Software developed by the Jet Propulsion Laboratory (JPL) for the National Aeronautics and Space Administration (NASA) and dual-band receivers to control for ionospheric refraction and multipath effects. StarFire is global and accurate to less than ten centimeters, and is frequently as accurate as four to five centimeters.
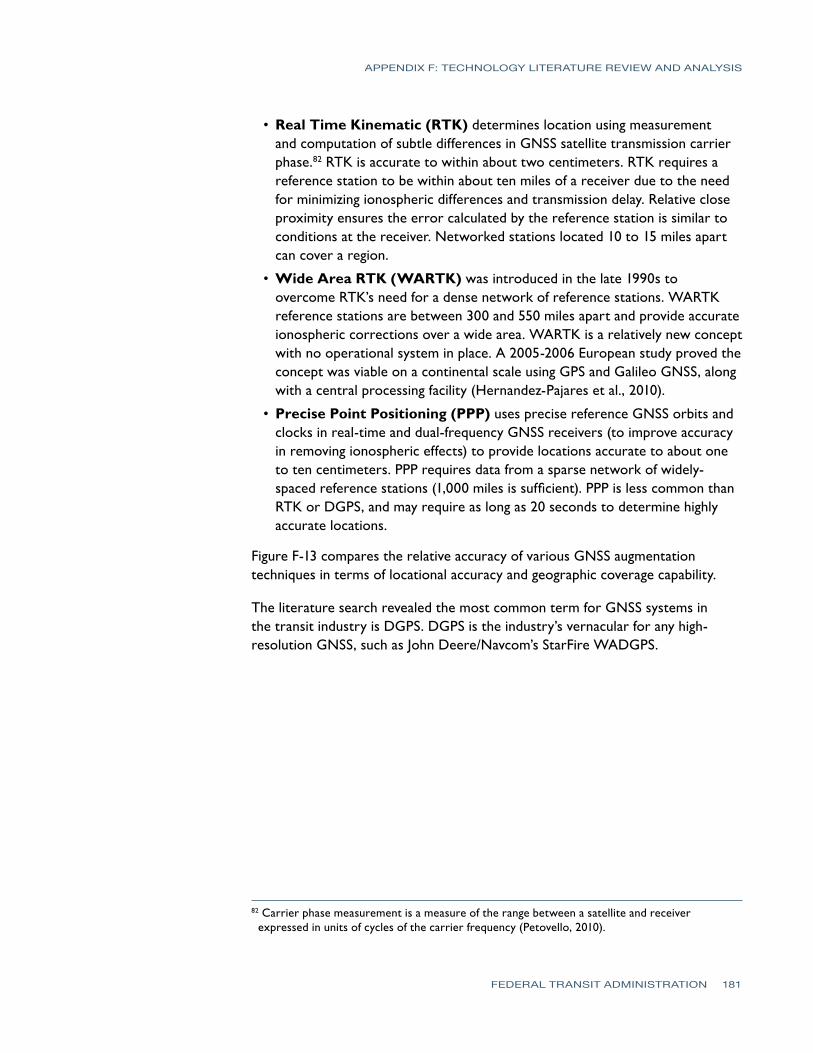
APPENDIX F: TECHNOLOGY LITERATURE REVIEW AND ANALYSIS
FEDERAL TRANSIT ADMINISTRATION 181
• Real Time Kinematic (RTK) determines location using measurement and computation of subtle differences in GNSS satellite transmission carrier phase.82 RTK is accurate to within about two centimeters. RTK requires a reference station to be within about ten miles of a receiver due to the need for minimizing ionospheric differences and transmission delay. Relative close proximity ensures the error calculated by the reference station is similar to conditions at the receiver. Networked stations located 10 to 15 miles apart can cover a region.
• Wide Area RTK (WARTK) was introduced in the late 1990s to overcome RTK’s need for a dense network of reference stations. WARTK reference stations are between 300 and 550 miles apart and provide accurate ionospheric corrections over a wide area. WARTK is a relatively new concept with no operational system in place. A 2005-2006 European study proved the concept was viable on a continental scale using GPS and Galileo GNSS, along with a central processing facility (Hernandez-Pajares et al., 2010).
• Precise Point Positioning (PPP) uses precise reference GNSS orbits and clocks in real-time and dual-frequency GNSS receivers (to improve accuracy in removing ionospheric effects) to provide locations accurate to about one to ten centimeters. PPP requires data from a sparse network of widely-spaced reference stations (1,000 miles is sufficient). PPP is less common than RTK or DGPS, and may require as long as 20 seconds to determine highly accurate locations.
Figure F-13 compares the relative accuracy of various GNSS augmentation techniques in terms of locational accuracy and geographic coverage capability.
The literature search revealed the most common term for GNSS systems in the transit industry is DGPS. DGPS is the industry’s vernacular for any high-resolution GNSS, such as John Deere/Navcom’s StarFire WADGPS.
82 Carrier phase measurement is a measure of the range between a satellite and receiver expressed in units of cycles of the carrier frequency (Petovello, 2010).
APPENDIX F: TECHNOLOGY LITERATURE REVIEW AND ANALYSIS
FEDERAL TRANSIT ADMINISTRATION 182
Source: ESA (2014)
Technology Limitations
Since GNSS technology alone does not have suitable precision for automation applications, most modern GNSS receivers use some form of augmentation to ensure accuracy is acceptable per the application. All GNSS technologies require a relatively clear line-of-sight between satellites and receiving antennas, such as those installed on most buses as part of automatic vehicle location (AVL) systems. Buildings, overpasses, and tunnels degrade or entirely block satellite transmissions. Densely developed urban areas are especially problematic due to the urban canyon created between tall structures blocking or reflecting signals, causing poor location accuracy or multipath interference (Chivers, 2016; Morgan, 2015). Key aspects to GNSS deployment in safety-sensitive applications include system reliability and augmentation data frequency. Yaw, inertial, speed, and odometer sensors can be used to ascertain accurate location during short periods of time when a GNSS signal is not available.
Example Implementations and Uses
There are several examples of GNSS inclusion in automated transit vehicles, though most of these vehicles are prototypes used in pilots and demonstrations:
• Bus-on-shoulder (BOS) pilot in Minnesota – DGPS and RTK
• LTA/NTU automated bus in Singapore – DGPS
• Mercedes-Benz “Future Bus” in Amsterdam, Netherlands – DGPS for location
• Local Motors Olli in the United States and Germany – DGPS for location
Figure F-13GNSS
augmentation comparison

APPENDIX F: TECHNOLOGY LITERATURE REVIEW AND ANALYSIS
FEDERAL TRANSIT ADMINISTRATION 183
• “WEpods” in the Netherlands, as well as other EasyMile EZ10 deployments – DPGS for location
• Navya Arma in France and other deployments across the world – RTK for location
Suppliers and Costs
GPS technology, consisting of hardware and software, is manufactured by many companies throughout the world. Internet searches in December 2016 revealed more than 50 manufacturers with product lines including GNSS/GPS technology. The following list includes some of the manufacturers providing high-precision GNSS vehicle receivers:
• Antcom
• Avail
• Clever Devices
• GPS Networking
• Hemisphere
• INIT
• NavCom
• navXperience
• NovAtel
• Orbital
• PCTEL
• Septentrio
• Siemens
• SPG
• Tallysman Wireless
• Trimble Navigation
The initial capital cost associated with implementing high-precision GNSS, typically either DGPS or RTK, has ranged from $1,000 to $10,000 per vehicle (Schweiger, 2003; Parker, 2008; APTA, 2010). This excludes installation, any required data subscriptions, or other reference/control station costs. Ongoing capital costs associated with GNSS are minimal and primarily related to software or sensor damage repair.
Inertial Measurement Units
Inertial measurement units (IMUs) are devices that typically contain three orthogonal rate gyroscopes to measure angular velocity and three orthogonal
APPENDIX F: TECHNOLOGY LITERATURE REVIEW AND ANALYSIS
FEDERAL TRANSIT ADMINISTRATION 184
accelerometers to measure linear acceleration.83 Inertial navigation uses measurements provided by IMUs to track the position and orientation of an object relative to a known starting point, orientation, and velocity (Woodman, 2007). By processing the electronic signals from IMUs it is possible to track the position and orientation of an object, including yaw rate, longitudinal and lateral acceleration, and pitch and roll rates (Schweber, 2016). IMUs can also measure shock to detect sudden impact (Mathas, 2011).
The IMU is self-contained, allowing it to be used in almost any location without fixed infrastructure or prior knowledge of the environment. Other systems either rely on an external reference system (e.g., GPS satellites, cameras, or stationary sensors) or require line of sight for mapping and localization (e.g., ultrasonic systems, mobile cameras, laser scanners) for tracking (Vincent, 2013). An IMU establishes position, orientation, and velocity by receiving information directly from its motion sensors.
Historically used in aerospace applications, advancements in IMUs have focused on portable design, security, wireless sensor networks, and consumer applications. In recent years, IMUs have become a very important and widespread sensor technology with multiple and diverse uses, including industrial, ergonomic, biomechanical, life science, animation, and virtual reality applications (Oberlander, 2015).
Technology Capabilities
One of the key technology components to an automated vehicle is the sensor system that assists the vehicle in understanding its environment and the context within it. The IMU complements other vehicle sensors in providing information about how a vehicle is moving through the immediate environment. An inertial navigation system (INS) is the combination of an IMU and a computer running navigation equations (Gade, 2005). An INS measures the acceleration and angular velocity experienced by a vehicle, typically in three dimensions, and integrates those measurements over time to produce estimates of the linear velocity, position, and orientation (Barrett, 2014). Inertial navigation is particularly useful because it can be implemented on almost any type of vehicle and in almost any type of environment.
Data from the IMU identifies the most likely location of the vehicle, provides data related to velocity and the acceleration toward obstructions sensed by onboard imaging sensors (e.g., lidar), and measures differences between the direction in which the vehicle is heading and where it is actually tracking. Specifically, accelerometers measure forward, backward, sideways, up, and down acceleration relative to the moving vehicle, but not relative to the Earth (Mathas 2011). Gyroscopes measure the angular velocity of a system. The original
83 IMUs also sometimes contain magnetometers.
APPENDIX F: TECHNOLOGY LITERATURE REVIEW AND ANALYSIS
FEDERAL TRANSIT ADMINISTRATION 185
system orientation is used as an initial condition. Together, accelerometers and gyroscopes provide data on the rotational and linear movements of the IMU platform which then are used to calculate the motion and position of the vehicle, independent of speed or any sort of signal obstruction (Gade, 2005). The IMU provides the data which enables an automated driving system to not only know where it is but also how it is moving. Such data, when integrated with other sensor data, enables an automated vehicle to identify routes and obstructions, and provides feedback to the driving system so that it can continually adjust its parameters.
Technology Limitations
Inertial navigation is a form of dead reckoning.84 A major limitation is that IMUs typically suffer from accumulated error. Like any other sensor, IMUs do not produce perfect measurements of acceleration and angular velocity. Because the IMU is continually adding detected changes to its previously-calculated positions, any errors in measurement, however small, are accumulated from point to point (Barrett, 2014). This leads to drift, or an ever-increasing difference between where the system thinks it is located and the actual location.
Because the devices are only able to collect data in a finite time interval, IMUs are always working with averages. So if an accelerometer is able to retrieve the acceleration once per second, the device will have to work as if that had been the acceleration throughout the entire second, although the acceleration could have varied drastically in that time period. Due to integration, a constant error in acceleration results in a linear error in velocity and a quadratic error growth in position. A constant error in attitude rate (measured by gyro) results in a quadratic error in velocity and a cubic error growth in position (Siciliano and Khatib, 2016).
To compensate for the imperfections in the IMU measurements, an INS typically has one or more secondary navigation sensor that provides direct measurements of the linear velocity, position and/or orientation of a vehicle. The information from these secondary navigation sensors is incorporated into the INS using an Extended Kalman Filter (EKF), which produces correction terms that are used to adjust the initial estimates of linear velocity, position, and orientation calculated from the imperfect IMU measurements (Barrett, 2014; Gade, 2005). Adding secondary navigation sensors into an INS greatly increases its ability to produce accurate estimates of the linear velocity, position, and orientation of a vehicle over long periods of time.
84 Dead reckoning is the process of calculating a current position by using a previously-determined position in conjunction with information on direction and distance traveled.
APPENDIX F: TECHNOLOGY LITERATURE REVIEW AND ANALYSIS
FEDERAL TRANSIT ADMINISTRATION 186
Example Implementations and Uses
IMUs have been used for the past decade in automotive applications, such as anti-lock braking systems (ABS), electronic stability control (ESC), roll stability control (RSC), and anti-theft systems (Mathas, 2011). For example, Continental’s IMU for ESC provides all control units in the vehicle with the vehicle’s current movement status. The signals are transmitted to the data bus via a standardized interface. In complex control algorithms, these signals are used to initiate vehicle stabilization when ESC is activated.
Prototype automated vehicles have commonly obtained their acceleration and rotation measurements from IMUs that surpass the capabilities of accelerometers and yaw rate sensors for ESC systems (Schwarz et al., 2013). IMU data are commonly fused with GPS data because the sensors’ strengths and weaknesses are complementary. While IMU measurements drift, GPS measurements are absolute, and while GPS measurements may drop out or experience jumps, IMU data are continuous (Varghese and Boone, 2015).
Suppliers and Costs
Historically, IMUs for research vehicles have been expensive (Wang, Thorpe, and Thrun, 2003). However, with the use of IMUs in a growing number of consumer applications, the number of suppliers has been increasing and the cost of the products has been decreasing. Additionally, the introduction of several regulations addressing passenger safety has encouraged the automotive industry to implement advanced safety and driver assistance devices, thereby increasing demand for IMUs. Industry analysts have forecast a compound annual growth rate of more than 32% by 2020 for the global automotive IMU sensors market (Technavio, 2016b).
There are two basic types of IMU technology: Micro-Electro-Mechanical Systems (MEMS) and Fiber Optic Gyro (FOG). MEMS is a newer and less expensive technology. FOG traditionally has provided greater accuracy but at a higher cost. Advancement in MEMS technology has tightened its comparative performance (Goodall et al. 2013). Top suppliers of MEMS for automotive applications include Bosch, Sensata, NXP (Freescale), Denso, Analog Devices, Panasonic, Infineon, Murata, Delphi, and STMicroelectronics (IHS 2016). Other suppliers include Honeywell, Texas Industries, LORD, ZF TRW, and Continental (Technavio, 2016b).
Inertial sensors span an enormous range of products, and there are six orders of magnitude difference in terms of price and performance between the highest-end and lowest-end inertial systems (Vectornav, 2016). The cost varies by the type of system, presence of GPS capability, and durability. Devices used in missiles, aircraft, and the space industry are the most expensive, costing from
APPENDIX F: TECHNOLOGY LITERATURE REVIEW AND ANALYSIS
FEDERAL TRANSIT ADMINISTRATION 187
the low thousands up to $30,000 or more. Also, devices used for research and prototyping may be much more expensive than those used in production vehicles. The lowest grade of inertial sensors is often referred to as automotive grade. Devices used in production vehicle applications would cost as little as $7 up to $100.
Digital Mapping
The advent of computers, geographic information systems (GIS), and global navigation satellite systems (GNSS) created a revolution in the content and media of maps by introducing entirely digital maps. The earliest digital maps were made available to users via digital storage in a device, such as an onboard navigation system. Digital mapping techniques improved as computing power and sensor quality/type (cameras, GNSS) afforded economical creation of detailed maps. The advent of smartphones with mobile broadband internet connections sparked a new wave of innovation in digital mapping. Digital maps are now frequently provided on-demand to user devices and are used for a variety of purposes, such as routing, timing, and planning.
Digital maps are an important enabling technology for automated vehicles. High-fidelity digital maps for automated vehicles (hereafter referred to as digital mapping) contain detailed information geo-referenced to within a few centimeters about the operating environment and adjacent roadways.
Technology Capabilities
Private companies are creating high-fidelity digital maps to refine safety and function of automated vehicles. Fleet vehicles outfitted with sensors drive roadways to collect data using a combination of cameras, lidar, high precision GNSS, inertia sensors, and onboard computers/servers. Data are typically uploaded each day from each vehicle for processing elsewhere. Companies use proprietary software to convert raw sensor data into compressed, formal digital maps. These digital maps typically inventory features such as road lanes, road edges, shoulders, dividers, traffic signals, signage, paint markings, poles, buildings, obstructions (e.g., tree branches), and other critical data needed for the safe navigation of roadways and intersections. Digital maps are updated periodically due to movement of temporary structures, road conditions (e.g., pothole formation), construction, and other dynamic conditions impacting their accuracy and utility. The frequency of map updates varies based on application scenario requirements and practice or policy of the respective digital mapping company.
The exact nature of a digital map will vary based on operating requirements and level of automation. A digital map dataset for lane departure warnings could be integrated into an automated vehicle equipped with comparable GNSS geolocation sensors. A digital map dataset for automated vehicles will likely
APPENDIX F: TECHNOLOGY LITERATURE REVIEW AND ANALYSIS
FEDERAL TRANSIT ADMINISTRATION 188
include much more information about static conditions in which the vehicle will be operating, relying on onboard sensors (lidar, inertia, GNSS, ultrasonic, cameras, etc.) for live adjustments when operating conditions are dissimilar to those documented in the digital map. Digital maps are not a replacement for onboard sensors in automated vehicles. Rather, digital maps offer a way to improve overall automation safety and function by enabling the vehicle to know what is typically ahead on the route. Incorporating digital maps into an automated vehicle allows onboard systems to focus on safety and adaptation in situations in which conditions are changed from the digital map.
Automated vehicles have systems of onboard sensors, which provide data that can be digitally combined. These sensors support automated travel through real-time data processing. Automated vehicles may also employ pre-loaded, periodically-updated, high-fidelity digital maps or use a broadband internet connection to obtain maps on demand. Digital maps tailored to automated vehicles complement onboard sensor functions and provide fail-safe protection. For example, digital maps can provide accurate location information by comparing known environmental features in the digital map to sensed features (such as by lidar or cameras) using simultaneous localization and mapping (SLAM) algorithms, in the event satellite signals or other geo-referencing systems are not functional (e.g., under a bridge or in a tunnel). SLAM algorithms enable the vehicle to reconcile real-time sensor data and digital maps to identify the vehicle’s location and orientation relative to environmental landmarks. In other words, vehicles with digital maps and SLAM algorithms possess exceptionally accurate and redundant information about the vehicle’s location and its relationship to other features and road users (Seif and Hu, 2016).
Digital maps also may be implemented to improve one or several aspects of automated vehicles, such as providing active lane keeping or enabling the vehicle to avoid previously identified hazards that are outside the detectable range of onboard sensors. An advantage of automated transit vehicles using digital maps is that vehicles operating on defined routes will be better able to maintain up-to-date digital maps, as onboard sensors will be routinely collecting data in the same corridor (Barrie, 2014).
Technology Limitations
The primary limitation of high-fidelity digital mapping is keeping information updated. Conditions may change (e.g., obstructed lanes, roadway construction, or other dynamic conditions) and require an automated vehicle to employ onboard sensors to make course adjustments. Automated transit vehicles may be especially capable of maintaining more up-to-date maps, as they operate along defined routes multiple times a day (Barrie, 2014).
APPENDIX F: TECHNOLOGY LITERATURE REVIEW AND ANALYSIS
FEDERAL TRANSIT ADMINISTRATION 189
The accuracy of the onboard GNSS sensor or matching algorithms for cameras/lidar, as well as the vehicle’s ability to accurately geo-locate, can limit the usefulness of digital maps. Digital maps are georeferenced to tolerances at or under 10 cm (Boyd, 2016; Kent, 2015; TomTom, 2016), which is compounded by the accuracy of automated vehicle onboard GNSS sensors or cameras/lidar derived location system.
Example Implementations and Uses
Digital mapping has been used for automated vehicle projects in North America, Europe, Asia, and Oceania. German automakers acquired HERE and began piloting digital maps in automated vehicles in 2015. Google’s automated vehicle program, now referred to as Waymo, created high-precision digital maps of Mountain View, California, as part of vehicle testing and development (Harris, 2015). Recent pilot implementations of automated transit vehicles, ranging from pods to minibuses to full-size buses, have utilized digital maps and various suites of sensors and software, but all vehicles have relied in part on digital maps to safely operate. In most cases, a human operator drove the vehicle along its route while sensors stored data, which technicians later tweaked and loaded back onto the vehicle as a digital map.
Suppliers and Costs
Digital mapping technology does not have discernible unit costs. The following companies are developing digital maps specifically for automated vehicle operation, including light-duty and heavy-duty vehicle applications.
HERE
HERE is a digital mapping company owned by a consortium of German automotive companies, including Audi, BMW, and Mercedes-Benz. HERE uses fleet vehicles with roof-mounted wide-angle 24-megapixel cameras and lidar sensors to collect digital map data (Newcomb 2015). HERE and partners began pilot testing their digital maps with automated vehicles in 2015 at these locations (Kent, 2015):
• U.S. (California) – Route 101 and Interstate 280
• U.S. (Michigan) – University of Michigan Mobility Transformation Center’s 32-acre Mcity test site
• Germany – Autobahn A9 from Munich to the Holledau interchange, in both directions
• France – Francilienne (N104) between the A6 and A10 motorways
APPENDIX F: TECHNOLOGY LITERATURE REVIEW AND ANALYSIS
FEDERAL TRANSIT ADMINISTRATION 190
NVIDIA
NVIDIA is a hardware and software vendor to many digital mapping companies. According to NVIDIA, a typical onboard suite of digital mapping sensors includes an artificial intelligence computer, inertial sensors, GPS, and high-resolution stereo cameras or lidar.
Civil Maps
Civil Maps is a startup technology company that raised seed funding from Ford Motor Company, Motus Ventures, and AME Cloud Ventures in 2016 (Civil Maps, 2016). Civil Maps processes lidar data to identify “salient points, line strings, and polygons humans see as traffic lights, lane lines, and crosswalks” and thus reduces the storage size necessary to accommodate digital maps for automation (Davies, 2016).
Sanborn
Sanborn is a geospatial services company based in Colorado. Sanborn’s Advanced Technology group develops Highly-automated Driving Mapping technology and maps using high-resolution aerial imagery, aerial lidar, and onboard ground-vehicle Lidar (Sanborn, 2016).
TomTom
TomTom has a Highly-automated Drive Map based on Lidar and precision GNSS. TomTom released complete digital maps for California and Michigan in 2016 (Amirtha, 2016). The digital maps’ robust localization correlation is highly adaptable to changes in reality (TomTom, 2016). Bosch is a corporate partner with TomTom for digital mapping and vehicle automation (Hammerschmidt, 2015; Bosch, 2017).
Mitsubishi Electric (consortium lead)
Mitsubishi Electric leads a consortium of 15 Japanese automakers (Toyota, Honda, Nissan, Mitsubishi, etc.) and manufacturers partnered with Japan’s national government for the Dynamic Map Planning project. The consortium’s goal is to create digital maps to enable automated vehicles to operate in Tokyo during the Olympics in 2020. The consortium’s mobile mapping system (MMS) collects data using lidar, cameras, GNSS, and other sensors. A notable difference from other efforts is that the consortium uses a single detachable sensor unit, mountable on a vehicle’s roof and powered by the car’s standard interior power connection. The system is capable of capturing objects up to seven meters away while the vehicle is moving 40 km/h (Boyd, 2016).
APPENDIX F: TECHNOLOGY LITERATURE REVIEW AND ANALYSIS
FEDERAL TRANSIT ADMINISTRATION 191
Google/Waymo
Google uses a proprietary method and sensor array to create detailed maps for the company’s self-driving car development program, Waymo. Velodyne manufactured the lidar sensors used during the early years of Google’s development of automated vehicles and digital maps, but Google is now developing their own lidar hardware in-house. Google’s self-driving cars rely heavily on active lidar sensors combined with digital maps for automated driving (Harris, 2015).
Magnetic Guidance
A Magnetic Guidance System (MGS) enables lateral and longitudinal unmanned control of a vehicle. Lateral controls focus on steering, while longitudinal controls help with speed management. An MGS is composed of two parts: a series of permanent magnets embedded in roadway infrastructure, and vehicle-based sensing and processing units (Amirouche et al., 2004). The sensors are typically, but not always, mounted on the rear bumper. The data collected by each sensor are sent to a signal processor in a vehicle host computer, which performs both calculation of the absolute position and orientation of the vehicle and actuation for automated driving. Key advantages over other positioning technologies are that MGS is not sensitive to weather conditions, has relatively low maintenance costs, and relatively simple construction on existing road infrastructure (Byun et al., 2015).
Technology Capabilities
An MGS system can either be implemented as (Chan et al., 2000):
• Magnetic markers – a series of magnetic pieces installed under a roadway surface at a specified spacing.
• Magnetic tape – magnetic materials embedded in a thin and narrow strip, which is laid on or under the surface of a roadway.
Most of the literature reviewed in this document focused on magnetic markers. However, 3M has developed and carried out several demonstration projects of its “Smart Tape” that was first developed in the 1990s as a lateral guidance system for specialty vehicles, such as snowplows, and for vehicle safety warnings (Hopstock and Wald, 1996). The position accuracy of the magnetic tape is not as high as that of the magnetic markers (Chan et al., 2000).
Magnetic sensing is a “relative positioning” technology (Lu et al., 2005). Relative positioning determines object location in terms of distance relative to other known local objects to provide speed and direction of a vehicle.85 As a vehicle
85 Relative positioning is different from absolute positioning, which uses satellites to determine object location in terms of longitude, latitude, and sometimes altitude to provide both absolute position and velocity.
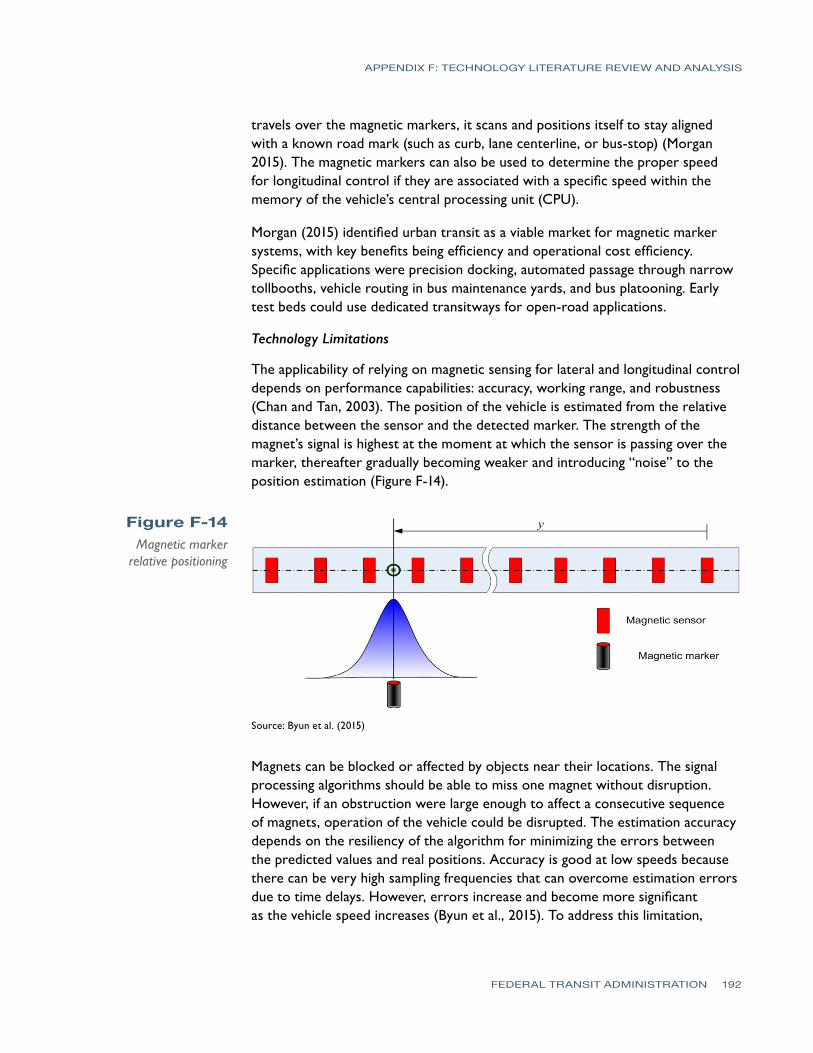
APPENDIX F: TECHNOLOGY LITERATURE REVIEW AND ANALYSIS
FEDERAL TRANSIT ADMINISTRATION 192
travels over the magnetic markers, it scans and positions itself to stay aligned with a known road mark (such as curb, lane centerline, or bus-stop) (Morgan 2015). The magnetic markers can also be used to determine the proper speed for longitudinal control if they are associated with a specific speed within the memory of the vehicle’s central processing unit (CPU).
Morgan (2015) identified urban transit as a viable market for magnetic marker systems, with key benefits being efficiency and operational cost efficiency. Specific applications were precision docking, automated passage through narrow tollbooths, vehicle routing in bus maintenance yards, and bus platooning. Early test beds could use dedicated transitways for open-road applications.
Technology Limitations
The applicability of relying on magnetic sensing for lateral and longitudinal control depends on performance capabilities: accuracy, working range, and robustness (Chan and Tan, 2003). The position of the vehicle is estimated from the relative distance between the sensor and the detected marker. The strength of the magnet’s signal is highest at the moment at which the sensor is passing over the marker, thereafter gradually becoming weaker and introducing “noise” to the position estimation (Figure F-14).
Figure F-14Magnetic marker
relative positioning
Source: Byun et al. (2015)
Magnets can be blocked or affected by objects near their locations. The signal processing algorithms should be able to miss one magnet without disruption. However, if an obstruction were large enough to affect a consecutive sequence of magnets, operation of the vehicle could be disrupted. The estimation accuracy depends on the resiliency of the algorithm for minimizing the errors between the predicted values and real positions. Accuracy is good at low speeds because there can be very high sampling frequencies that can overcome estimation errors due to time delays. However, errors increase and become more significant as the vehicle speed increases (Byun et al., 2015). To address this limitation,
APPENDIX F: TECHNOLOGY LITERATURE REVIEW AND ANALYSIS
FEDERAL TRANSIT ADMINISTRATION 193
researchers at the Korea Railroad Research Institute (KRRI) developed and tested an additional algorithm to compensate for time delays in signal processing by using a modified golf cart on a pilot network of roads implemented on the institute grounds. The test concluded that incorporating the additional algorithm, coupled with odometer readings, compensated for the time delays and proved as accurate as a differential global positioning system (DGPS). Still, the highest speeds the technology could accommodate were below 30 km/h (Byun et al., 2015). The researchers have since conducted an additional study to estimate the vehicle’s heading angle and improve positioning accuracy (Byun and Kim, 2016). Researchers employed a gyroscope to assist in the real-time heading estimation at sample times when marker detection data are not available. Results were comparable to those of DGPS in real-time.
Durability is another concern, especially for large-scale implementation (Chan et al., 2000). Durability is tied to the lifecycle of the roadway surface because the magnetic markers are installed on or near the surface of pavement. The replacement cycle of pavement must be considered along with the integrity of the MGS system, especially under a long period of usage.
Another potential limitation is cost. In calculating of the total cost of magnetic sensing system, it is important to consider the roadway material, environment (e.g., background and noise signals), installation, maintenance, repair, and lifecycle (Chan et al., 2000).
Demonstrations/Pilots
There is a long history and wide application of MGS in industrial applications to move materials around a manufacturing facility or a warehouse (Schneier and Bostelman, 2015). This literature review avoids discussion of such applications to focus on transportation system applications.
The California PATH program has demonstrated several automated transit bus applications using MGS, including precision docking, stopping maneuvers, lane assist, lane change, and automated/manual transitions. Lane Transit District in Eugene partnered with the California Department of Transportation and California PATH to demonstration of the applicability of magnetic markers for BRT (Pessaro, 2015).
Some companies, such as 2getthere, provide small shuttles that rely on embedded magnets for guidance. In 2016, 2getthere announced that it would be working with Singapore’s multimodal public transport provider, SMRT Services, to operate an automated transit service (Yap, 2016).
In 2014, the Volvo Car Group completed a research project at its testing facilities outside of Gothenburg, Sweden, which involved the use of magnet markers in
APPENDIX F: TECHNOLOGY LITERATURE REVIEW AND ANALYSIS
FEDERAL TRANSIT ADMINISTRATION 194
the road striping (Volvo, 2014). The results indicated that magnetic markers could be used to overcome limitations of other positioning technologies such as GPS and cameras in certain locations and under inclement conditions. In addition to enabling automation, road-integrated magnets could prevent run-off road accidents, facilitate accuracy of winter road maintenance, and enable more efficient utilization of road space by allowing narrower lanes.
Suppliers and Costs
An internet search identified suppliers for industrial applications which are not discussed in this literature review. Major players in the industrial market are Daifuku (Japan), JBT Corporation (U.S.), Bastian Solutions (U.S.), Swisslog (Switzerland), Seegrid Corp. (U.S.), Egemin International NV (U.S.), and Dematic GmbH & Co. Ltd. (Germany). Information about suppliers involved in on-road applications is presented below.
Aichi Micro Intelligent Corporation
Researchers at the KRRI procured the devices in its 2015 study from Aichi Steel, Toaki-shi (now Aichi Micro Intelligent Corporation), in Aichi, Japan (Byun et al., 2015). The supplier of the device for the 2016 study was not mentioned in the article. The Aichi sensors are high-sensitivity magnetic field sensors with MI sensor elements and a driver circuit mounted on a printed circuit board. Costs were not presented on the firm’s website.
PATH
PATH developed its own magnetic sensing and guidance technology in the 1990s in partnership with IMRA America, a research subsidiary of Aisin Seiki (Guy and Zhang, 2009). According to Chan and Tan (2003), PATH had procured magnetic markers from All Magnets, Inc., in Placentia, California, and Toda America, Inc., Schaumburg, Illinois. PATH used a Neodymium magnet of 2.5 cm length in its applications. PATH provided a cost model for magnetic market systems that took account of the marker materials, installation, vehicle instrumentation, and labor. It populated the model for illustration purposes based on number of magnets needed (1,341 magnets to cover a road length of 1,609 meters, spaced at 1.2 meters) (see Table F-5). Also included in the model was a discount rate of 6% (e.g., equivalent interest to calculate cost variation year over year). The model assumed a cost of $1 per magnet. While the price of magnets depends on a number of factors (e.g., shape, size, magnetization, material, strength), a 2016 internet search revealed such magnets averaged $6 to $15 each.

APPENDIX F: TECHNOLOGY LITERATURE REVIEW AND ANALYSIS
FEDERAL TRANSIT ADMINISTRATION 195
YearFixed Cost Vehicle Cost Year
TotalAccumulated
TotalMaterials Installation No. of Vehicles Unit Cost
1 $1,341 $10,000 1 $5,000 $16,341 $16,341
2 1 $5,000 $5,000 $22,321
3 1 $5,000 $5,000 $28,660
4 2 $2,000 $4,000 $34,380
5 2 $2,000 $4,000 $40,443
Source: Chan and Tan (2003)
Table F-5PATH – Exemplar
Cost Estimation Model
2getthere
2getthere is a subsidiary of FROG AGV Systems (an acronym for “Free Ranging On Grid”). FROG AGV Systems is based in Utrecht, Netherlands. FROG’s original reference markers were Texas Instruments radio frequency transponders, but since 1998 it has been developing MGS, which are cheaper, last longer, permit higher operating speeds, require much smaller sensors on the vehicles, and use less computer power (Shladover et al., 2007). In 2007, it was acquired by U.S.-based Oceaneering Advanced Technologies Group. 2getthere works based on system requirements and develops passenger service systems based on the characteristics of customized applications, taking into account the spatial planning, client preferences, and other specifics to ensure the passenger service is optimized and the capital and operating costs are minimized. Cost information for component parts of 2getthere projects is not available.
3M Corporation
PATH evaluated two types of magnetic systems: its own marker system (discussed previously in this paper) and magnetic Smart Tape from 3M (Chan et al., 2000). The magnetic tape was found to be a valid candidate only for guidance of specialty vehicles because of limitations in accuracy. Smart Tape was installed in a 2002 demonstration project of a magnet snowplow guidance system conducted in partnership with Alaska Department of Transportation (see http://www.dot.state.ak.us/iways/proj-MSG.shtml). However, more recent references or other demonstration projects could not be found. The website of the 3M Corporation does not reference any product resembling a magnetic Smart Tape that could have been used in the Alaska demonstration. Costs were found for specific applications—precision docking and automaton/driver assist systems for BRT.
Precision Docking
As part of a feasibility assessment to evaluate Cooperative Vehicle-Highway Automation Systems (CVHAS), PATH conducted a study to estimate the costs of implementing precision docking technology, automated steering controls, collision warning systems, and transit signal priority for BRT (Shladover et al., 2004). Cost estimates for in-vehicle components ranged from $2,700 to
APPENDIX F: TECHNOLOGY LITERATURE REVIEW AND ANALYSIS
FEDERAL TRANSIT ADMINISTRATION 196
$14,000 per bus depending on the number of units produced, including the cost of magnetic sensors ($5,000 in near-term unit cost), installation of magnetic reference markings at bus stops ($500 per stop), and the construction of boarding platforms ($2,000 per stop).
Although some systems have used magnetic guidance for precision docking purposes, other technologies can be used to enable precision docking applications. For instance, Proterra electric buses use wireless communications to enable a form of precision docking that allows the buses to automatically connect to overhead charging stations. A TRB study examined the costs, impacts, and effectiveness of several BRT systems (Kittelson & Associates, 2007). Costs for precision docking components were $4,000 per station for optical/magnetic sensors and $50,000 per vehicle for hardware integration.
Vehicle Guidance
The TRB study also provided costs for in-vehicle ITS for driver assist and automation systems. Costs for on-board vehicle guidance were $20,000 per mile for optical/magnetic sensors and $50,000 per vehicle for hardware integration. Caltrans, in a 2015 presentation at the Automated Vehicle Symposium sponsored by TRB and AUSVI, provided cost estimates for a magnetic marker system (Larson, 2015). The system was to support tight lane guidance and precision docking. The infrastructure installation was estimated at $20,000 to $30,000 per mile for magnet installation.
Wire in Pavement
Wire-guided systems provide navigation for vehicles or robots using wires in the floor for guidance. They are most often used in industrial applications, such as moving materials around factories. Application of the automatic guided vehicle broadened during the late 20th century. Due to high installation cost, lack of flexibility, and difficulty of maintenance, wire guided systems have limited to no applicability for transit operations.
Wire-guided systems were the earliest applications of automated guided vehicle (AGV) technology. The first model, built in 1953 by Barett Electronics, was a modified tow truck that followed a wire in the floor instead of a rail and operated in a grocery warehouse (Han 2013). AVGs are mobile robots, typically used in industrial applications to move materials around a manufacturing facility or warehouse. Wire guidance was the principal AGV guidance technology through the 1970s (Lohmann, 2007). In the 1980s, non-wire guided AGV systems were introduced (e.g., laser target triangulation, gyroscope navigation), and these enabling technologies soon eclipsed the wire-guided systems (Thamma, 2004). The term “AGV” was not introduced until the 1980s. Prior to that, such vehicles were known simply as driverless vehicles.
APPENDIX F: TECHNOLOGY LITERATURE REVIEW AND ANALYSIS
FEDERAL TRANSIT ADMINISTRATION 197
Technology Capabilities
Automated vehicles can either use fixed-path or free-ranging navigation. Wire guidance represents a fixed-path system. With this system, a wire was typically installed in a cut in the floor, and the wire was charged with a radio-frequency signal from a transmitter (Lohmann, 2007). An antenna on the vehicle was positioned above the guide wire in such a way that the signal from the antenna was proportional to the displacement of the center of the antenna from the center of the guide wire. The signal from the antenna was then used to steer the vehicle down the guide wire. As the intelligence of the system was in the floor controllers, these systems were typified as “smart floors, dumb vehicles.”
Technology Limitations
Although widely accepted and very reliable, wire-guided vehicle systems had drawbacks that led to their losing favor as a vehicle guidance technology. The guide wire and associated transmitter were expensive to install, and multiple paths usually required multiple wires and transmitters, increasing the expense. The exact path of the AGV needed to be cut in the floor to bury the wire, and the cut for a turn had to follow the radius curve that the vehicle would make when turning. Many systems had to embed four wires—three for guidance and one for communications. Often, rebar or electronic signals would interfere with the guidance signals imposed on the wires. Also, in industrial applications installing the path initially was disruptive and time consuming to factory or warehouse operations, and changing the path to accommodate material flow changes required removing or abandoning existing wires and installing new ones (Lohmann, 2007). Because of these disadvantages, this technology was overtaken by newer technologies that offered advantages (i.e., installation costs, flexibility, and maintainability) over the wire-guided AGV technology. This technology is still applied, but only for very basic applications (AVG Kennis Institute, 2016).
Demonstrations/Pilots
Although the primary applications of wire-guided vehicle system were in industrial settings, there were two demonstrations that involved outdoor test tracks. In mid-1990s, Chrysler tested wire in the road for vehicle guidance around a newly constructed 1.3-mile road in Chelsea, Michigan, named the Automated Durability Road (Kennan, 1996). This project represented early research and development of “smart highways and vehicles.” Wiring the road and the adjacent staging and service areas cost $250,000. Guidance systems (a robot and a computer which occupied both front seats) cost $50,000 each. The wire in the road carried a vehicle guidance tone at 2,500 Hz. Two coils mounted on the test vehicle’s front bumper picked up the frequency as volts. When the car moved from side to side, it changed the voltage between the wire and each coil. The guidance computer then instructed the robot to steer to stay on course. An engineer in a nearby control
APPENDIX F: TECHNOLOGY LITERATURE REVIEW AND ANALYSIS
FEDERAL TRANSIT ADMINISTRATION 198
room gave the command to accelerate, change lanes, and brake. An antenna on the rear of the vehicle worked with transponders embedded every 100 ft. in the road to report the vehicle’s location to the control room. The researchers experienced some technical glitches with vehicle automation technology during its implementation, and Chrysler abandoned the project in 2000.
Also in the mid-1990s, wire guided vehicles were used in pavement testing at WesTrack, the Federal Highway Administration’s (FHWA) accelerated pavement testing facility in Nevada (Eskandarian et al., 1996). The wire-guided vehicles were used to take a driver out of the pavement testing activity, in which heavily-laden triple trailer trucks traveled around a 1.8-mile track at precisely 40 miles per hour for at least 15 hours every day of the year, which was a highly repetitive, monotonous, and potentially dangerous driving situation. Although this represented a pavement testing study, the WesTrack researchers needed to examine automated vehicle operation. The team used a wire-in-the-road approach with GPS vehicle location as a back-up. Cables were installed around the track at the top of the base layer during WesTrack construction. The front bumper of each truck was equipped with a guidance antenna array that picked up guide signals emitted by the wires under the pavement. A vehicle control computer mounted in the sleeper area of the truck’s cab activated steering, braking, and accelerating actuators to adjust the vehicles speed and path. Each truck cab was outfitted with two computers: one for controlling the truck’s path and speed, and one for monitoring the condition of various truck components and systems. Over 2.5 years, the four automated trucks traveled more than 1.3 million km (820,000 mi). The testing ended in 1999, concluding that the automated system performed well for its special purpose task but was not suitable for mass deployment (Thorpe et al., 2012).
Suppliers and Costs
According to the Savant Automation website, there are approximately half a dozen major AGV manufacturers in the U.S. that account for about 80% of the systems installed each year (http://www.agvsystems.com/faqs/). All are industrial applications, and according to their promotional materials, none appear to specialize in wire-guided systems.
• Savant Automation, Inc. (Walker, MI)
• America In Motion (Charlotte, NC)
• Ward Systems, Inc. (Grass Valley, CA)
• JBT Corporation (Chalfont, PA)
• Transbotics Corporation (Charlotte, NC)
• Seegrid (Pittsburgh, PA)
• Egemin Automation Inc. (Holland, MI).
APPENDIX F: TECHNOLOGY LITERATURE REVIEW AND ANALYSIS
FEDERAL TRANSIT ADMINISTRATION 199
Processing and Software Systems
CPUs and GPUs
Central Processing Units (CPUs) and Graphical Processing Units (GPUs) process sensed data and physically react to appropriately maneuver the vehicle. CPUs, as their name implies, have been the traditional center of processing power for many computer systems. CPUs have one or a few very fast cores that excel at processing individual task data in a linear fashion, but the amount of data that can be processed simultaneously is limited (Zhislina, 2014). A GPU has hundreds or thousands of cores that can each process information simultaneously.86
For many years, the performance metrics of CPUs increased at an exponential rate. This pace slowed over the last decade for a variety of reasons, and while CPUs have continued to improve in other ways,87 it has been very difficult to reach a threshold clock speed (10 GHz) without generating tremendous amounts of heat that can melt the processor (Zhislina, 2014). The applications enabling automated vehicles to both operate and improve an AI’s driving performance require processing a large amount of data simultaneously, which is limited by a CPU’s linear processing bottleneck. This bottleneck led data scientists to develop novel methods of data processing using GPU acceleration, which powered several breakthroughs in fundamental applications enabling automated driving.
One such application is the use of machine learning to recognize objects. Machine learning is an artificial intelligence software tool that enables a program to train and improve itself at a data processing task (such as identifying a pedestrian or vehicle in an image) by analyzing the image’s contents (LeCun et al., 2015). When an AI analyzes an image and either correctly or incorrectly identifies an object, it can remember the result and recall the knowledge to inform and improve its future analyses (Copeland, 2016). As the process repeats over millions of iterations, the AI improves its ability to correctly identify objects. GPUs enable machine learning, because CPUs (which process information linearly) would be prohibitively time-consuming and resource-intensive for most applications.
In 2012, data scientists developed the largest convolutional neural network (ConvNet)88 to date, which uses GPUs to simultaneously process many iterations of an object-classification software (Krizhevsky, et al., 2012). The GPU-enabled ConvNet approach yields a much higher accuracy rate than the previous best approach, and data scientists have continued to refine and apply GPU-enabled
86 This technique is known as parallel processing.87 In recent years, CPU makers have begun using multiple cores on a single chip to increase parallel data processing.
88 A ConvNet is a type of machine learning that mimics the neural networks in a human brain by using multiple artificial neurons to analyze data, then aggregate the predictions (Copeland, 2016).
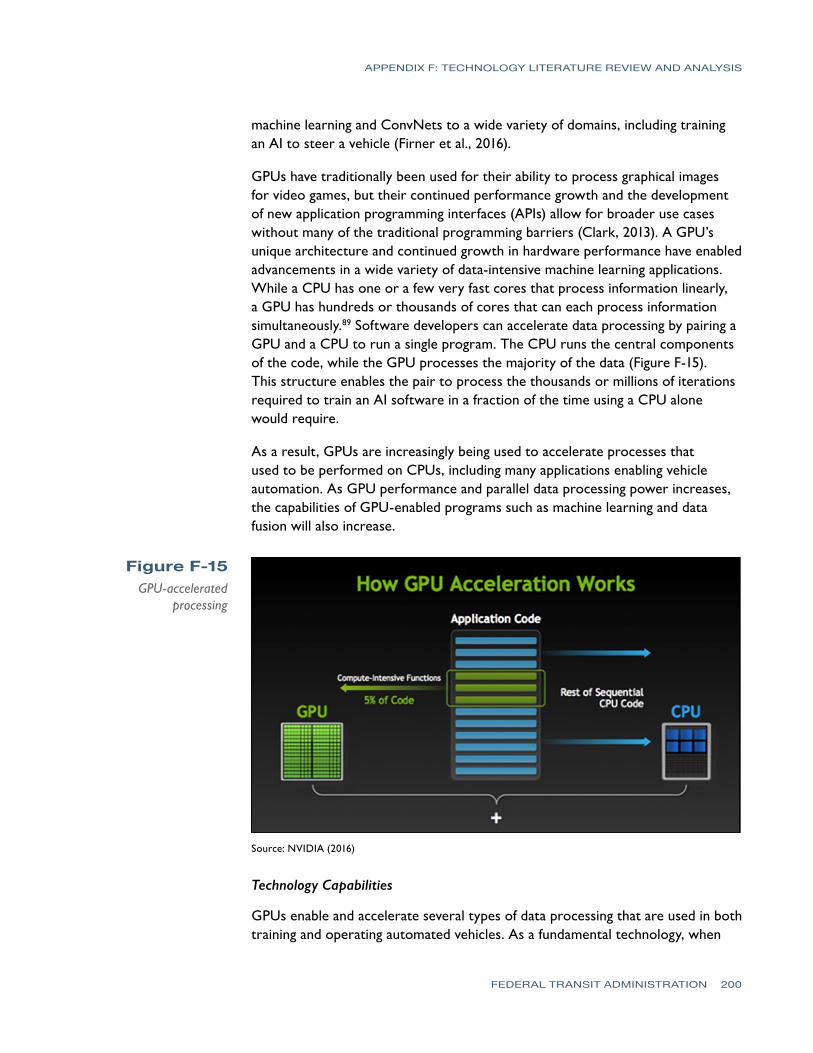
APPENDIX F: TECHNOLOGY LITERATURE REVIEW AND ANALYSIS
FEDERAL TRANSIT ADMINISTRATION 200
machine learning and ConvNets to a wide variety of domains, including training an AI to steer a vehicle (Firner et al., 2016).
GPUs have traditionally been used for their ability to process graphical images for video games, but their continued performance growth and the development of new application programming interfaces (APIs) allow for broader use cases without many of the traditional programming barriers (Clark, 2013). A GPU’s unique architecture and continued growth in hardware performance have enabled advancements in a wide variety of data-intensive machine learning applications. While a CPU has one or a few very fast cores that process information linearly, a GPU has hundreds or thousands of cores that can each process information simultaneously.89 Software developers can accelerate data processing by pairing a GPU and a CPU to run a single program. The CPU runs the central components of the code, while the GPU processes the majority of the data (Figure F-15). This structure enables the pair to process the thousands or millions of iterations required to train an AI software in a fraction of the time using a CPU alone would require.
As a result, GPUs are increasingly being used to accelerate processes that used to be performed on CPUs, including many applications enabling vehicle automation. As GPU performance and parallel data processing power increases, the capabilities of GPU-enabled programs such as machine learning and data fusion will also increase.
Figure F-15GPU-accelerated
processing
Source: NVIDIA (2016)
Technology Capabilities
GPUs enable and accelerate several types of data processing that are used in both training and operating automated vehicles. As a fundamental technology, when

APPENDIX F: TECHNOLOGY LITERATURE REVIEW AND ANALYSIS
FEDERAL TRANSIT ADMINISTRATION 201
the processing power and performance of GPUs increase, the overall capabilities and intelligence of automated vehicles can also improve. GPUs are often partnered with CPUs, and are used in automated vehicles to train AI software to develop and improve driving skills through machine learning. GPUs and CPUs are also used to fuse sensor data and operate the vehicle.
Training AI Software
Programmers will typically use a form of machine learning, such as deep learning or ConvNets, to optimize a specific task such as steering or recognizing street signs. To accomplish this, a neural network analyzes multi-dimensional input data, such as photographs of objects or video recordings of driving, by running the input data through “a multilayer stack of simple modules” that each analyze certain elements of the data (LeCun et al., 2015). The layers in each module analyze and transform elements of a training image, moving from simple geometric elements to abstract concepts, and learn by compiling a weighted average of error rates of the analyses made at each layer of the network (Figure F-16). The first layer might be composed of lines and edges, and each additional layer deals with increasingly abstract or complex aspects, such as wheels or windows. The layers are all connected, and the higher layers’ analyses are informed by the analyses performed at lower levels. The highest levels are most specific (e.g., determining the make and model of the vehicle in an image). The model improves itself by automatically integrating information learned from past trials. After many iterations of training, the error rate decreases and the software’s predictive accuracy improves.
Source: Csongor (2017)
Figure F-16 Neural network illustration
APPENDIX F: TECHNOLOGY LITERATURE REVIEW AND ANALYSIS
FEDERAL TRANSIT ADMINISTRATION 202
This type of training is useful to develop and refine an AI’s ability in many areas, including specific driving-related tasks. As referenced above, machine learning through GPU acceleration can improve object recognition, which can be applied for use in automated vehicles (Teichman and Thrun, 2011; Zeynep et al., 2014). ConvNets can also be applied to learn steering and other elements of the driving task (Chen et al., 2015; Firner et al., 2016).
Fusing Sensor Data and Vehicle Operations
GPUs are also used in fusing sensor data and powering vehicle operations (NVIDIA, 2017). Automated vehicles use radars, cameras, and other sensors to detect their environment, and use a combination or integrated set of CPUs and GPUs as the hardware to process sensor input. Software executes the enabling applications.
Commercial examples include the current NVIDIA Drive PX2 and upcoming NVIDIA Xavier chip (NVIDIA, 2017; Shapiro, 2016). The current generation automotive computer facilitates “autocruise driving and HD mapping” through an integrated CPU and GPU, and a suite of supporting software. For more information, see the Suppliers and Costs section.
As an applied example of GPU training, data fusion, and vehicle operations, NVIDIA recently used a ConvNet to teach an AI to steer a vehicle. The AI analyzed visual driving data from a forward-facing camera and the corresponding human-input steering data as learning instructions in various environments. The neural network analyzed the visual and steering input data, and learned how to interpret the scene to self-optimize towards the goal of steering. The trained neural net software was then implemented in a vehicle, which was able to learn the unique visual features of a road and execute steering commands on various roadway environments, including paved and unpaved roads.
Technology Limitations
Current deep learning techniques are extremely computationally intensive, with 10–20 sets of layers in a network, “hundreds of millions of weights, and billions of connections between units” (LeCun et al., 2015). Training at this scale was not feasible due to the high computational load, until recent developments in machine learning techniques and improvements in GPU performance.
The growth in GPU performance in recent years has enabled improvements in image processing and machine learning, both of which facilitate automated driving tasks. Figure F-17 illustrates the growth of several key performance metrics for a specific line of NVIDIA GPUs: the higher-end “80” series (GeForce 2016).90
90 The decision to focus on a single level of a specific product line over time was made to enable a relatively consistent illustrative comparison of performance over time. Similar growth in hardware performance has occurred in other GPU makes and models.
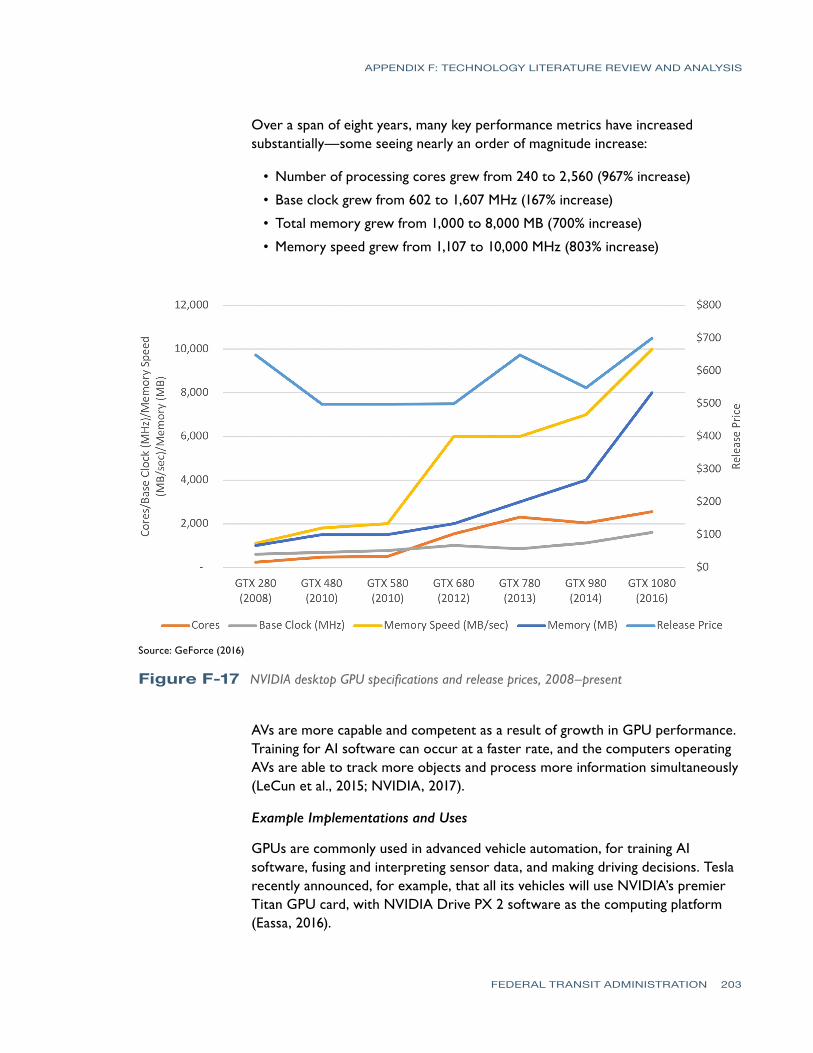
APPENDIX F: TECHNOLOGY LITERATURE REVIEW AND ANALYSIS
FEDERAL TRANSIT ADMINISTRATION 203
Over a span of eight years, many key performance metrics have increased substantially—some seeing nearly an order of magnitude increase:
• Number of processing cores grew from 240 to 2,560 (967% increase)
• Base clock grew from 602 to 1,607 MHz (167% increase)
• Total memory grew from 1,000 to 8,000 MB (700% increase)
• Memory speed grew from 1,107 to 10,000 MHz (803% increase)
Source: GeForce (2016)
Figure F-17 NVIDIA desktop GPU specifications and release prices, 2008–present
AVs are more capable and competent as a result of growth in GPU performance. Training for AI software can occur at a faster rate, and the computers operating AVs are able to track more objects and process more information simultaneously (LeCun et al., 2015; NVIDIA, 2017).
Example Implementations and Uses
GPUs are commonly used in advanced vehicle automation, for training AI software, fusing and interpreting sensor data, and making driving decisions. Tesla recently announced, for example, that all its vehicles will use NVIDIA’s premier Titan GPU card, with NVIDIA Drive PX 2 software as the computing platform (Eassa, 2016).
APPENDIX F: TECHNOLOGY LITERATURE REVIEW AND ANALYSIS
FEDERAL TRANSIT ADMINISTRATION 204
NVIDIA announced at the 2017 Consumer Electronics Show (CES, 2017) that it would partner with two major automotive OEMs to develop AV systems, both of which currently supply commercial vehicles. ZF, a major European automotive supplier for commercial vehicles, is partnering with NVIDIA to develop an “artificial intelligence system for autonomous cars, trucks and industrial applications” (ZF 2017a). NVIDIA will also partner with Bosch to “develop AI self-driving computers for production cars” (Csongor, 2017).
Suppliers and Costs
There are two main desktop GPU suppliers that split the GPU market—NVIDIA and AMD (Mercury Research, 2016). Intel also produces CPUs with integrated GPUs that claim a large share of the total market, but these chips have much lower technical capabilities and are less likely to be used in advanced AV operations. Competition in the GPU and automotive-specific computing sector has grown, and several chipmakers and technology companies have recently announced new products targeting the sector.
AMD
In comparison to NVIDIA, AMD has a much newer presence for applications focused on automated vehicles and machine learning. The company has recently announced new products targeting the machine learning market (Ung, 2016). The company announced a new “strategy to accelerate machine intelligence” through a line of video cards, GPU-based servers, and optimized software tools. AMD claims these tools, collectively entitled Instinct, will “dramatically increase performance, efficiency, and ease of implementation of deep learning workloads” (AMD, 2016). Many of the technical details regarding the company’s upcoming product offerings are not yet available.
Intel
Intel, a CPU maker, has recently announced new hardware and software targeting deep learning. The company developed the Intel Xeon Phi processor that promises optimized architecture to enable parallel processing for deep learning applications (Dubey, 2016). The company has also developed software tools, such as an SDK and user tutorials, to enable deep learning applications using their CPUs.
Mobileye
Mobileye, a computer vision sensor developer, developed its own chip for use in its cameras (Mobileye, 2017). The chips, known as Mobileye EyeQ®, provide a low-power and inexpensive computing platform that enables low-level automated driving applications.
APPENDIX F: TECHNOLOGY LITERATURE REVIEW AND ANALYSIS
FEDERAL TRANSIT ADMINISTRATION 205
NVIDIA
To accelerate deep learning and AV applications, NVIDIA has developed a custom suite of hardware and optimized software (NVIDIA, 2017). The company offers a variety of GPUs specifically designed for automated vehicle applications. The system scales from a small chip that runs low-level automation and sensor fusion to sophisticated supercomputers for training advanced automation and deep learning. The palm-size PX2 is the smallest vehicle-focused card, and provides a variety of automated driving and HD-mapping functionality. At the high end of the market, the DGX-1 supercomputer combines eight of the company’s P100 GPUs, each designed and optimized for deep learning applications, and includes 128 GB of RAM, runs 28,672 cores, weighs 134 lbs., and costs $129,000. The company offers several software tools that accompany their automated vehicle-focused GPUs (NVIDIA, 2017). The DriveWorks software development kit (SDK) contains a reference architecture that enables developers to build new applications. Reference applications and tools include sensor processing and fusion, computer vision, HD mapping, and deep neural networks.
At CES 2017, NVIDIA announced partnerships with two major automotive suppliers to develop AI driving for production and commercial vehicles, and a partnership with a major automotive OEM to develop self-driving vehicles by 2020. The partnerships with automotive suppliers Bosch, and especially ZF, may have implications for commercial vehicles, including transit (Csongor, 2017). In its partnership announcement, ZF specifically mentioned “trucks and industrial applications” as potential use cases for the new hardware (ZF 2017a). Bosch has previously developed sensor fusion and collision warning systems for transit buses and other commercial vehicles, and the partnership may result in additional products for these applications. NVIDIA also announced a partnership with Audi to develop the “world’s most advanced AI car on the road by 2020” (Adabi, 2017).
Qualcomm
Qualcomm, a mobile processor developer, announced an offering for the automotive space at CES 2016 (CES; Tilley, 2016). The integrated CPU/GPU, known as the Snapdragon 820 A, is meant as a low-power processor for understanding sensor data in low-level automated applications. Exact technical specifications are not available (Qualcomm, 2017).
Machine Learning in Computer Vision
Machine learning is an automatic method of analysis for large datasets (Murphy, 2012). Machine learning considers a set of methods that can detect patterns in data and help transform knowledge discovery into decision making. These methods have generated huge technological and social impacts in a wide range
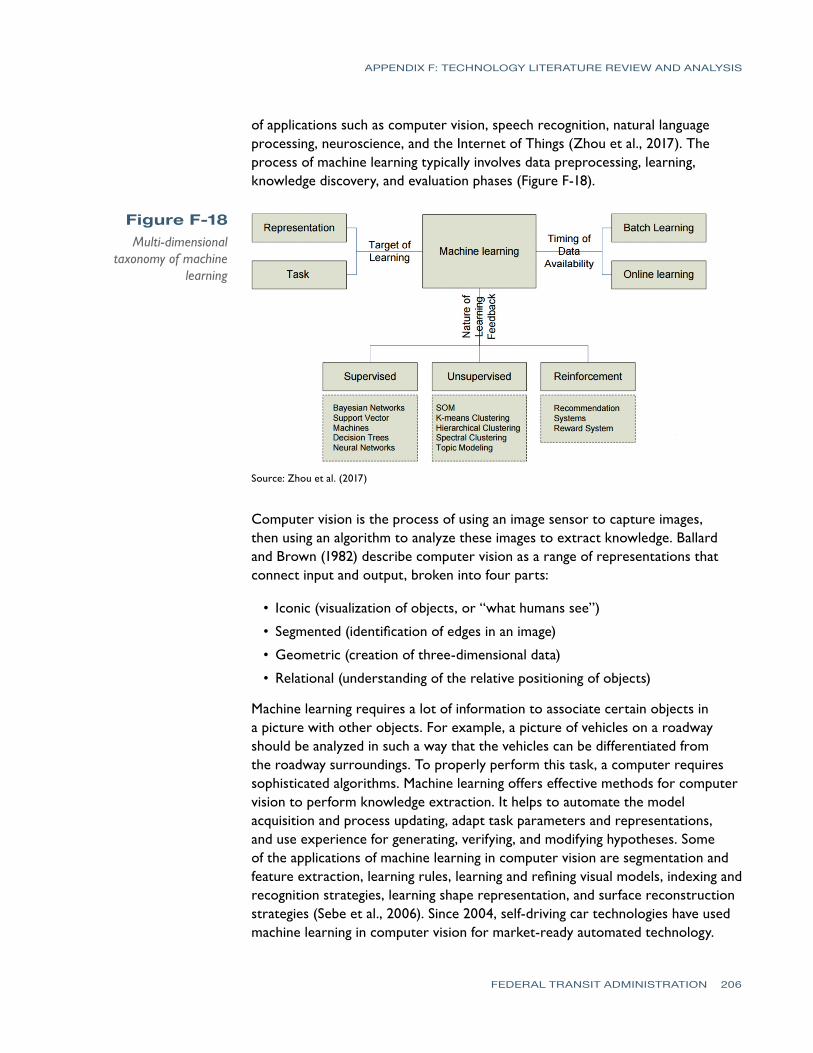
APPENDIX F: TECHNOLOGY LITERATURE REVIEW AND ANALYSIS
FEDERAL TRANSIT ADMINISTRATION 206
of applications such as computer vision, speech recognition, natural language processing, neuroscience, and the Internet of Things (Zhou et al., 2017). The process of machine learning typically involves data preprocessing, learning, knowledge discovery, and evaluation phases (Figure F-18).
Figure F-18Multi-dimensional
taxonomy of machine learning
Source: Zhou et al. (2017)
Computer vision is the process of using an image sensor to capture images, then using an algorithm to analyze these images to extract knowledge. Ballard and Brown (1982) describe computer vision as a range of representations that connect input and output, broken into four parts:
• Iconic (visualization of objects, or “what humans see”)
• Segmented (identification of edges in an image)
• Geometric (creation of three-dimensional data)
• Relational (understanding of the relative positioning of objects)
Machine learning requires a lot of information to associate certain objects in a picture with other objects. For example, a picture of vehicles on a roadway should be analyzed in such a way that the vehicles can be differentiated from the roadway surroundings. To properly perform this task, a computer requires sophisticated algorithms. Machine learning offers effective methods for computer vision to perform knowledge extraction. It helps to automate the model acquisition and process updating, adapt task parameters and representations, and use experience for generating, verifying, and modifying hypotheses. Some of the applications of machine learning in computer vision are segmentation and feature extraction, learning rules, learning and refining visual models, indexing and recognition strategies, learning shape representation, and surface reconstruction strategies (Sebe et al., 2006). Since 2004, self-driving car technologies have used machine learning in computer vision for market-ready automated technology.
APPENDIX F: TECHNOLOGY LITERATURE REVIEW AND ANALYSIS
FEDERAL TRANSIT ADMINISTRATION 207
Technology Capabilities
Computer vision is applicable for a wide range of transportation engineering problems. It has the capability of transforming an image into information, which is particularly useful for roadway modeling. Computer vision systems are currently used for the following applications:
• Measuring distance between vehicles
• Detecting lane markings, signs, and signals
• Classifying and categorize vehicles
• Detecting obstacles and animals
• Monitoring driver behavior using facial recognition
• Detecting surface cracks and other abnormalities on roadways
• Enabling Advanced Driver Assistance Systems (ADAS)
Many studies were conducted to improve different functionalities of computer vision. Key functions are described below.
Lane Detection
Many computer vision algorithms emerged as components of fully-automatic vehicle navigation systems (McCall and Trivedi, 2006). Earlier studies focused on well-paved roadway that is easily separated from its surroundings. After the DARPA Grand Challenge (DARPA, 2004), a competition between automated off-road vehicles, many studies attempted to investigate automated driving on different types of roadways. However, little progress has been made in developing a generalized algorithm that can be applicable for different types of roads. To determine lane markings effectively, some of the key algorithms are color cue (He et al., 2004; Chiu and Lin, 2005; Sun, Tsai, and Chan, 2006), Hough Transform (Yu and Jain, 1997; Southhall and Taylor, 2001), steerable filters (McCall and Trivedi, 2006), spline model (Jung and Kelber, 2004; Wang et al., 2004), and AdaBoost based segmentation (Alon et al., 2006). These algorithms are applicable for roadways with clear lane markings. Yi et al. (2015) improved the Hough Transformation algorithm in a computationally efficient manner that is suitable for real-time lane detection even at night.
Object Detection
In many cases, connected and automated vehicle technologies require deeper understanding of the roadway environment for accurate decision making. Object detection is an important computer vision task. It adopts many functions of computer vision technologies such as image search, image auto-annotation, and image perception. However, many studies have focused on refining the algorithms due to the complexity of object classes and images. Studies focusing
APPENDIX F: TECHNOLOGY LITERATURE REVIEW AND ANALYSIS
FEDERAL TRANSIT ADMINISTRATION 208
on object detection can be divided into three categories: top-down, bottom-up, and a combination of the two.91 Top-down approaches usually consider a “train modeling approach” to determine object classification (Borenstein and Ullman, 2002; Felzenszwalb and Huttenlocher, 2005; Dalal and Triggs, 2005). Bottom-up approaches start from low-level or mid-level image features (Ferrari et al., 2006; Ren et al., 2005; Mori et al., 2005; Srinivasan and Shi, 2007). These approaches develop hypotheses from image features, extend them by association rules and then evaluate them by certain cost functions. The third category of approaches combines both methods by taking advantage of both aspects.
Use of an ‘Image segmentation’ algorithm helps convert the undifferentiated image plane into some measure of discrete objects and many studies have been developed to refine this task over the years. The scene flow segmentation or optical flow utilizes temporal correlation between different frames of a scene captured by stereo cameras to classify obstacles that are in motion (Wedel et al., 2009; Franke et al., 2005; Lenz et al., 2011). This approach thus naturally handles tracking moving obstacles.
Vehicle Detection
Computer vision is an important tool for vehicle identification and classification. To minimize computational complexity, many studies considered segmenting video data into a background image and a moving object image. Background images tend to be motionless over a long period of time, and moving object images only contain foreground objects. Change detection (Kim et al. 2001; Foresti et al., 1999) is the simplest method for video segmentation. Jung et al. (2001) proposed an adaptive background update method to collect background images. He et al. (2004) applied the Gaussian distribution to model background images. A few studies have used spectral features (colors at each pixel) to model background images (Stauffer and Grimson, 2000; Haritaoglu et al., 2000; Wren et al., 1997). Some spatial features have also been exploited to improve performance in different illumination conditions (Li and Leung, 2002; Javed et al., 2002; Paragios and Ramesh, 2001). Chen et al. (2011) investigated the effectiveness of state-of-the-art classification algorithms to classify vehicles for urban roadways. Chen et al. (2004) proposed a statistical algorithm to efficiently extract color backgrounds and moving vehicles. Daigavane et al. (2011) developed an application based on neural networks for vehicle detection and classification. Pang et al. (2004) applied a cubical model of the foreground image to detect occlusion and separate merged vehicles from a monocular image. Song and Nevatia (2005) developed a model-based vehicle segmentation method to detect vehicles. A deep learning tool such
91 Some relevant studies focusing on object detection include Viola and Jones, 2001; Borenstein and Ullman, 2002; Levin and Weiss, 2005; Leibe et al., 2005; Ferrari et al., 2006; Kokkinos et al., 2006; Zhao and Davis, 2005; Ren et al., 2005; Mori et al., 2005; Srinivasan and Shi, 2007; Felzenszwalb and Huttenlocher, 2005; Dalal and Triggs, 2005; and Hariyono and Jo, 2017.
APPENDIX F: TECHNOLOGY LITERATURE REVIEW AND ANALYSIS
FEDERAL TRANSIT ADMINISTRATION 209
as the convolution neural network, or ConvNet, discussed in the CPUs and GPUs section, could assist in improving the current performance. For example, one study used the ConvNet and training data from less than a hundred hours of driving to train the car to operate in diverse conditions on different roadways during sunny, cloudy, and rainy conditions (Bojarski et al., 2016).
Sign and Signal Detection
• Color-based – The prevalence of detecting traffic signs based on color has been used in many studies. One of major difficulties in this approach is that color is unreliable depending on the time of day, weather conditions, and different illumination criteria. Since red-green-blue (RGB) color space is very sensitive to illumination, many studies have carried out the color-based segmentation in other color spaces. Different approaches were developed to refine color based sign and signal detection: detection and recognition of a small subset of traffic signs that contain red components (Estevez and Kehtarnavaz, 1996), determination of influences of daily illumination changes (Benallal and Meunier, 2003), detection of red in hue intensity saturation (HIS) color space (Escalera et al., 2003), classification of colors based on their similarity with pre-stored hues (Fang et al. 2003), overcoming of color dependency on light sources (Broggi et al., 2007), and performance of color-based segmentation as a starting stage in traffic sign recognition (Ruta et al., 2008).
• Shape-based – Current literature provides several approaches for shape-based detection of traffic signs. One of the most commonly used techniques is the Hough transform. Generalized Hough transform finds arbitrary shapes in an image. Other common approaches are corner detection followed by reasoning and simple template matching. Gavrila (1999) used distance transform based template matching for shape detection. Different approaches were developed to perform shape-based sign and signal detection, such as developing a general regular polygon detector to detect traffic signs (Loy and Barnes 2004), applying the Harris corner detector to identify triangular and rectangular signs (Paulo and Correia, 2007), and developing a variant of histogram of oriented gradients (HOG) that exploited the symmetry shape of traffic sign images for classification (Kassani and Teoh, 2017).
Technology Limitations
Computational Resources
Computer vision acquires tremendous amounts of image data. Image processing and pattern recognition in computer vision systems is extensive and requires large amounts of computational resources and memory. Although this is currently technologically possible, processing larger amounts of data for real-time decision making requires faster and more efficient algorithms. Moreover, current
APPENDIX F: TECHNOLOGY LITERATURE REVIEW AND ANALYSIS
FEDERAL TRANSIT ADMINISTRATION 210
computer vision technology suffers from the problem of reliability in inclement weather and varying lighting conditions. This limitation can be overcome by integrating computer vision information with data from other external sensors in a process known as sensor fusion, which also requires computational resources. Sensor fusion helps in combining data from different sensors to produce multiple inferences for effective decision choice (Guan et al., 2012). For example, a radar or lidar can provide supporting information while determining distance of a target vehicle independently from the computer vision system.
Environmental Conditions
The most significant and fundamental technical limitation to computer vision is its reliability under inclement weather conditions. Many transportation applications operate outdoors and are very susceptible to lighting variation such as shadows or other low lighting conditions. Although some vision-based transportation applications (e.g., infrared night vision) can overcome illumination issues, many other computer vision technologies still struggle to overcome these environmental conditions.
Suppliers and Costs
There is a large variety of computer vision technologies in the market. Over the next several years, computer vision tools will become more common in transportation (Rajaram, 2012). According to CB Insights, thirty-three companies are currently working on self-driving cars. Some startup companies attempted to provide cheap computer vision tools for self-driving cars. For example, Comma.ai92 aimed to sell their start-up kit product for $999 with a $24 per month software update. This venture did not go forward due to NHTSA non-compliance issues (Techcrunch, 2017). Morgan Stanley (2013) reported that the various hardware components (computer vision, radar, lidar, and other accessories) needed to achieve full automated driving capability could cost less than $5,000 per car, which means that, together with other associated costs, the customer would pay a premium less than $10,000. For transit vehicles, installation of these devices may be more costly due to different requirements and lower volumes.
Actuator SystemsSteering Systems
The steering mechanism converts the driver’s rotational input at the steering wheel into a change in the steering angle of the vehicle’s wheels. Today’s trucks and buses are exclusively equipped with power-assisted steering systems, in which steering force is produced by both the driver and an energy source (Duffy
92 http://comma.ai.
APPENDIX F: TECHNOLOGY LITERATURE REVIEW AND ANALYSIS
FEDERAL TRANSIT ADMINISTRATION 211
& Wright, 2016). In some power steering systems, the system is capable of steering wheels with an electronic signal input and a power source, but in many, the steering system still requires physical input from the driver.
Power steering assist systems are commonly grouped into two sets: electric power steering and hydraulic power steering. Electric power steering systems generate assist force from an electric motor, based on control inputs. Hydraulic power steering systems generate assist force by shuttling high-pressure fluid through a valve to either side of a piston in the steering gear, with the orientation of the valve being controlled by the steering wheel position. Traditionally, vehicles maintain the high-pressure fluid reserve by spinning a power steering pump with the accessory drive belt. Some modern hydraulic systems use an electro-hydraulic-assisted power steering (EHPS) pump. EHPS decouples the pump from the accessory drive belt, and spins the pump with an electric motor. EHPS systems still require the mechanical orientation of the flow control valve to provide assist force.
Many light-duty vehicles rely on electric power steering, but due to onboard electrical power limitations these systems often cannot generate enough assistive force to perform on larger vehicles (e.g., heavy-duty trucks and buses). Most heavy-duty vehicles still use hydraulic systems. Because EHPS systems pump fluid only when needed, these systems provide some of the same energy efficiency benefits as electric power steering systems, but can still provide the needed hydraulic pressure for the power steering system to perform.
For large commercial vehicles, EHPS with integrated valve control is typically used when automating steering functions (Bosch, 2017). EHPS provides power to assist the driver through a hydraulic pump, which is driven by an electric motor. The electronic control unit (ECU) is responsible for controlling the motor so that an adequate amount of power is provided at varying speeds. In addition to the basic function of power assist, the linking of the vehicle’s ECU in EHPS and the on-board network also enables new driver assistance functions and intelligent steering systems. The ECU’s connection to all other vehicle systems ensures that it is capable of receiving additional steering commands from the on-board network and that it steers the wheel automatically by controlling the electric motor. Notably, not all EHPS system have integrated valve control, so inclusion of EHPS does not necessarily enable automated control of the steering system.
Technology Capabilities
A vehicle’s steering system is an essential component in vehicle automation. Many automated steering applications have been demonstrated in production vehicles. Some of these are discussed below.
APPENDIX F: TECHNOLOGY LITERATURE REVIEW AND ANALYSIS
FEDERAL TRANSIT ADMINISTRATION 212
Active Steering
Active steering influences the steering angle and steering forces set by the driver. It overrides the steering angle set by the driver with an additional steering angle (BMW, 2017a). The planetary gear set integrated into the steering column is a key component in active steering systems. An electric motor in the joint adjusts the front wheels’ steering angle in proportion to the vehicle’s current speed. When driving at lower speeds, active steering increases the size of the steering angle. At medium speeds, active steering reduces the amount of change in the steering angle for every movement of the steering wheel. This gives the driver the advantage of more precise steering at higher speeds and ensures greater stability and more comfort.
The application of active steering on commercial vehicles has been extensively studied and validated. Research papers (Imine, et al. 2012; Kim et al., 2016) and patents (Rothhämel, 2012; Yang and Chen, 2016) indicate that active steering could greatly improve the maneuverability and stability of large vehicles, and especially that of articulated buses or trucks. Furthermore, General Motors has already applied the technology to its trucks (Goebel, 2015) and X-Drive B.V. is offering an active steering system for semi-trailers (X-Drive B.V., 2017).
Lane Keeping
Lane keeping systems help drivers keep the vehicle within a lane (Ford, 2017c). Lane keeping systems usually use cameras to monitor road lane markings and detect unintentional drifting toward the edges of a lane. If cameras detect an impending unintentional drift, the system uses the steering system and the instrument cluster display to alert and/or aid driver to stay in the lane. Some lane keeping systems use the braking system to influence the vehicle’s heading rather than the steering system. The braking system will generate a braking torque and bring the vehicle away from the lane boundary (MBUSA, 2017a). Some lane keeping systems use GPS (Tan et al., 2009; University of Minnesota, 2017) or other positioning technologies, such as magnetic markers (Donath et al., 2003; Shladover et al., 2007; Tan et al., 2009) to monitor drift, regardless of the type of the vehicle.
Lane keeping technology has been widely applied to passenger cars. Though lane keeping has seen only limited application in commercial vehicles (Daimler 2017a), it may be more broadly used in the future as it can be transferred from light-duty vehicles to commercial vehicles and there has been a considerable amount of research and patents in this area (Gaedke et al., 2015; Kaufmann, 2010; Marino et al., 2011).
Parking Assist
Parking assist technology is an ADAS system that can assist drivers with parallel parking or garage parking. The vehicle must be able to sense the environment,
APPENDIX F: TECHNOLOGY LITERATURE REVIEW AND ANALYSIS
FEDERAL TRANSIT ADMINISTRATION 213
plan the required path and motion, and follow the planned motion sequences to finish the parking process (Xu et al., 2000).
Steering systems play a vital role in parking assist technology, because these systems typically require drivers to control the brake and throttle while the vehicle is responsible for controlling the steering wheel and providing driver guidance. Similar to lane keeping, automatic parking systems are increasingly available on many current light-duty vehicle brands, including Ford (Ford, 2017a), Mercedes-Benz (MBUSA, 2017b), Toyota (Toyota, 2017a), and Tesla (Tesla, 2017).
Steering in Collision Avoidance Systems
While collision avoidance systems always include automatic braking, they may also include automatic steering (Eidehall et al., 2007; Vahidi & Eskandarian, 2003). The cooperation of the two systems may enable vehicles to avoid more collisions than systems that rely exclusively on braking (Hac & Dickinson, 2006). For instance, the current version of Tesla Autopilot may steer away from vehicles that appear to be drifting lanes. Collision avoidance systems with assisted steering generally use in-vehicle cameras or lasers to help detect obstacles. When a potential collision is detected and evasive maneuvering is necessary, the ECU will take over the steering system and apply the calculated steering angle automatically to avoid the obstacle (Ross, 2013).
Despite many patents addressing the technology (Breuer & Kitterer, 2013; Flehmig & Braeuchle, 2016; Moshchuk et al., 2014), few automotive manufacturers have implemented steering-assisted collision avoidance in their production vehicles. Nonetheless, this technology has been considered in research, as well (Faber et al., 2006; Jeon et al., 2015; Stahn et al., 2007).
Automated Driving
Steering plays an essential role in automated driving. Much research focuses on steering control for automated vehicles (Walter et al., 2014; J. Wei et al., 2014; Junqing Wei et al., 2013). For an automated driving system, vehicles need the ability to perform lane changes, turns, avoid collisions, and carry out other complicated actions through precise, automated control of the steering system (Tesla, 2017; Waymo, 2017).
Technology Limitations
Human factors are a major consideration for steering automation in most automation use cases. Control algorithms must rationalize real-world driver inputs and sensor data for many situations. As the technology evolves, drivers may be asked to adapt their behavior to equipment that performs in new ways and unlocks additional functionality.
APPENDIX F: TECHNOLOGY LITERATURE REVIEW AND ANALYSIS
FEDERAL TRANSIT ADMINISTRATION 214
Generating intelligent steering behavior is more difficult to achieve than intelligent longitudinal behavior. Many manufacturers have been wary to include steering overrides in contemporary collision avoidance technologies (Nissan, 2017b; Toyota, 2017b; Volvo, 2017a). Keller et al. (2011) also indicated that steering-enabled collision avoidance had not been covered in depth in the literature, while many braking-focused collision avoidance systems had already been well studied. In many situations, the process of calculating a steering path in real-time pushes the limits of on-board sensing, computing, and artificial intelligence.
Suppliers
Bosch and ZF are major steering system suppliers. ZF (2017b) offers the ZF TRW Electrically Assisted Hydraulic Steering system. According to the company’s description, the platform provides the basis for future automated vehicle applications. Other suppliers of steering systems for commercial vehicles include NSK, Nexteer, Jtekt, Mando, Thyssenkrupp, Hydrosteer, and Knorr-Bremse. Volvo Trucks has its own proprietary system that has been used in its truck platooning vehicles.
Some products that support electronic steering control for heavy-duty vehicles include:
• ZF TRW “REAX” system, which can be attached to the steering column or to the large hydraulic gear under the hood. If applied under the hood, the system can assist even in the case of hydraulic failure (unlike steering column systems).
• Bosch “Servotwin” system, a belt-driven system that provides the same function as the ZF TRW system and can also assist even with hydraulic failure.
• Knorr-Bremse (Tedrive) intelligent Hydraulic Steering Assist (iHSA) system, which manipulates the rotary valve to move hydraulic fluid from left to right, creating pressure differential and steering the vehicle. If the hydraulics fail, so does this system (because in the event of a failure, there would be no fluid to move).
• Nexteer Magnasteer torque overlay system, which is a magnetic sleeve around the hydraulic system. Magnets manipulate the valve to move hydraulic fluid. If the hydraulics fail, so does this system.
Brake Systems
The function of the vehicle braking system is to reduce a vehicle’s speed, stop the vehicle, or hold the vehicle stationary if already stopped (Heißing & Ersoy, 2010). Drivers apply traditional braking systems with a foot pedal, and power braking systems supplement driver input forces to slow or stop the vehicle. Additionally, drivers may apply a parking brake with hand or foot control. In some cases,
APPENDIX F: TECHNOLOGY LITERATURE REVIEW AND ANALYSIS
FEDERAL TRANSIT ADMINISTRATION 215
powertrain components such as transmission clutches or electric motors may be used to reduce vehicle speed.
There are two common engineering architectures of power brake systems for large vehicles—air brakes and hydraulic brakes. These systems generate supplemental braking forces mechanically. Although less common today, some vehicles use electric brakes. An air brake, also known as a compressed air brake system, uses compressed air pressing on a piston to apply pressure to the brake pad, as requested by the driver. An air brake is the most common choice for a heavy-duty combination vehicle (i.e., a semi-truck) because of the limitless supply of operating fluid (air), easy connection between tractor and trailer, and insensitivity to altitude (Duffy & Wright, 2016). Air brakes are also the most common choice for bus vehicles. Contemporary commercial vehicle air brake systems are electrified. An air compressor is the source of energy for the air brake system. Actuators convert the air pressure being applied into a mechanical push-rod force acting on the foundation brakes, wheel speed sensors gather wheel speed information, and an electronic control unit coordinates all the components to generate the desired braking torque.
Hydraulic brakes are often used on medium-/light-duty vehicles and passenger cars. Hydraulic brakes use hydraulic fluid to transfer pressure to the brake shoe and stop the vehicle. This pressure is generally built up from both the driver’s manual power and an assisted power source (commonly derived from vacuum pressures in the intake manifold of the internal combustion engine, or from a vacuum pump). In a hydraulic brake system, a hydraulic pump builds up sufficient pre-pressure. Solenoid valves receive commands from the electronic control unit (ECU), which regulates the hydraulic pressure in the braking circuits. The master cylinder is thus moved, generating braking torque to stop the vehicle.
Regardless of the braking system’s power source, air or hydraulic fluid, both types of systems are fully capable of precisely applying the braking torque requested by the driver and Advanced Driver Assistance Systems (ADAS), such as an Anti-lock Braking System (ABS), Traction Control System (TCS), and Electronic Stability Control (ESC).
Technology Capabilities
Many brake systems today provide the ability for a computer to augment or override driver inputs to the brake system via the electronic control unit. Brake systems with advanced electronic control units already demonstrate the capability to enable many higher forms of automation.
APPENDIX F: TECHNOLOGY LITERATURE REVIEW AND ANALYSIS
FEDERAL TRANSIT ADMINISTRATION 216
Anti-lock Braking System (ABS), Traction Control System (TCS) and Electronic Stability Control (ESC)
ABS, TCS, and ESC are typical examples of automation in braking systems. These features are generally implemented in braking systems with other ADAS functions as part of a product family (Gardinalli et al., 2007; VW, 2017a).
Anti-lock Braking System (ABS) technology prevents the wheels from locking when the vehicle is over-braked. The system constantly monitors wheel speed information provided by the wheel speed sensors. When a wheel lock-up is detected, the ECU manages the braking pressure through the modulator valve to reduce the slip rate and resolve wheel lock-up. This enables the vehicle’s directional stability and steering control to be retained even under emergency braking or on a slippery road surface (Bosch, 2007). According to regulation 49 CFR 393.55 C.F.R. on Anti-lock Braking Systems, the U.S. government requires that transit buses are equipped with ABS systems (49 CFR 393.55 2010).
A Traction Control System (TCS) is an enhancement to ABS and is used to improve vehicle stability when accelerating. TCS reduces wheel slippage or excess torque generated from the drivetrain. Specifically, when TCS detects wheel slippage in wheel sensor data, it invokes the ABS electronic control unit to apply brake friction to the wheels that are spinning with lessened traction, thus eliminating wheel slippage and helping the driver maintain control of the vehicle’s acceleration (Duffy & Wright, 2016).
Electronic Stability Control (ESC) is an extension of the ABS system and controls not only longitudinal motion but also transverse dynamics. If there are inconsistencies between steering, throttle, and brake inputs and the vehicle’s behavior, ESC intervenes by automatically and dynamically applying brakes to individual wheels. Advanced ESC systems may also cut throttle to the powertrain in some circumstances. ESC constantly measures the driver’s steering intent based on information from the steering wheel sensors, wheel speed sensors, and the IMU. If ESC detects that the driver is trying to steer left while the vehicle is not moving in that direction, the system will automatically apply the brake to the wheel. The counter-clockwise torque generated by the additional brake torque could adjust the vehicle’s direction of motion and help the driver maintain or regain control of the vehicle (Bosch, 2007). According to 49 CFR 571.126 and 571.136, buses with a gross vehicle weight rating (GVWR) of 4,536 kg (10,000 pounds) or less and larger buses with a gross vehicle weight rating of greater than 11,793 kilograms (26,000 pounds), respectively, are required to have an ESC system (49 CFR 571.126 2007, 49 CFR 571.136 2015).
The name of this technology varies by manufacturer. Volkswagen and GM call the technology Electronic Stability Program (ESP), whereas BMW calls it Dynamic Stability Control (DSC). Toyota refers to the technology as Vehicle
APPENDIX F: TECHNOLOGY LITERATURE REVIEW AND ANALYSIS
FEDERAL TRANSIT ADMINISTRATION 217
Stability Control (VSC). Despite having different names, these systems all share similar principles. Some form of ESC is required by Federal Motor Vehicle Safety Standards for many types of new vehicles.
Automatic Emergency Braking (AEB)
Automatic Emergency Braking (AEB) allows the vehicle to automatically brake in a sensed emergency situation. When the vehicle detects an impending forward crash the automatic emergency braking system will automatically activate the braking system in an attempt to avoid the collision and slow the vehicle prior to impact (Volvo, 2017b). Other scenarios in which AEB systems may intervene include backing up into traffic, or backing up into a pedestrian. Automatic emergency braking has been the subject of many research papers (Keller et al., 2011; Tang & Yip, 2010) and patents (Breuer & Kitterer, 2008; Hoetzer, 2008). Additionally, vehicle manufacturers such as Volvo (2017a) and Daimler (2017c) already offer automatic emergency braking in their commercial vehicles.
Hill Descent Control (HDC)
HDC allows a smooth and controlled hill descent in rough terrain without driver intervention (Farnsworth, 2011; Edge, 2015). Manufacturers include Nissan (2017c), Volkswagen (2017b), and GM (FLETCH’S GMC BUICK Audi, 2017). When activated, the system coordinates the powertrain and brakes to hold the vehicle steadily at a pre-determined speed, assisting with braking control so that the driver can concentrate completely on steering. HDC is particularly helpful when driving on changeable, loose, or slippery downhill surfaces, such as gravel, snow or grass. When HDC deactivates, it gradually reduces braking force, providing the driver with enough time to resume control of the vehicle’s speed (BMW, 2017b). Although this technology is not yet available on transit buses, the basic principle of the technology should apply to all kinds of vehicles.
Regenerative Braking
Regenerative braking recovers kinetic energy of a vehicle as the vehicle slows. This technology is common in electric vehicles and hybrid electric vehicles, including passenger cars, trucks, and transit buses (Li et al., 2009; Muncrief et al., 2012; Sangtarash et al., 2008; Xu et al., 2011).
Traditional brake systems convert kinetic energy into wasted heat while slowing the vehicle. With regenerative braking, a portion of the kinetic energy is recovered as the vehicle decelerates, and this stored energy may be used again later. Regenerative braking is most common on hybrid and electric vehicles, as tractive motors may be used to both accelerate and decelerate the vehicle, and on-board batteries may be used to supply and store electrical energy. Some
APPENDIX F: TECHNOLOGY LITERATURE REVIEW AND ANALYSIS
FEDERAL TRANSIT ADMINISTRATION 218
vehicles use hydraulic regenerative braking, which stores energy mechanically; these systems are far less common.
Transit bus manufacturers that provide hybrid electric and electric transit vehicles often include regenerative braking systems in their products. Regenerative braking is a crucial component of these vehicles, as it drastically improves the vehicle’s range in stop and go driving.
Suppliers
Bendix Commercial Vehicle Systems develops and supplies brake systems for medium- and heavy-duty trucks, tractors, trailers, buses, and other commercial vehicles (Bendix, 2017a). Other suppliers of braking systems for trucks and buses include Bosch, WABCO, HALDEX, Marathon Brake Systems, MGM Brakes, TSE Brakes, Tramec Sloan, Marmon Group, and Precision Rebuilders. Both WABCO and Bendix have provided brakes for heavy-duty truck platoons (NDTA, 2014; Knorr-Bremse, 2016). Some products that support automated braking for heavy-duty vehicles include:
• Bendix Wingman Fusion system, which uses information from radar, video, and the brake system to assist drivers and automatically engage the brakes avoiding or reduce the severity of some collisions (Bendix 2017b).
• WABCO OnGuardACTIVE™ and OnGuardMAX™ systems assist drivers and automatically engage the brakes avoiding or reduce the severity of some collisions (WABCO, 2017a). WABCO has also announced a partnership to develop a commercial vehicle system that will combine Mobileye’s vision and mapping technologies with WABCO’s control and actuation technologies, including electronic braking, stability, and emergency braking systems, as well as active steering control (TTT, 2016b).
Powertrain Systems
The powertrain system contains all the components that propel the vehicle. These components include the engine, transmission, drive shafts, differentials, and the drive wheels. These are discussed below for medium/heavy commercial vehicles.
In traditional vehicle configurations, a driver demands torque from the engine by pressing an accelerator pedal. In older systems, the accelerator pedal is physically connected to a throttle body. On new vehicles, powertrain systems often use electronic signals generated from the accelerator position as an input to powertrain control. Electronically controlled powertrains are a key enabler for highly-automated on-road capabilities.
APPENDIX F: TECHNOLOGY LITERATURE REVIEW AND ANALYSIS
FEDERAL TRANSIT ADMINISTRATION 219
Diesel Engine
The Internal Combustion Engine (ICE) is the most frequently-employed power source for motor vehicles. The ICE converts chemical energy in fuel into mechanical work. For commercial vehicles, diesel engines are the primary choice due to low maintenance costs, high torque output, and high reliability. Additionally, today’s diesel ICEs have a substantially lower environmental impact than gasoline ICEs (Duffy & Wright, 2016).
Due to the digital electronic control system of modern diesel engines, computer inputs for automated driving systems may be used to control the powertrain. Specifically, the Engine Control Unit (ECU) receives the torque/speed request from the controller of the ADAS system to control the engine, accurately achieving the desired state with the help of actuators and sensors.
The control of a modern diesel engine is dependent on three parts—air control, fuel control, and exhaust gas recirculation. Air and fuel controls provide the correct quantity of air and fuel for efficient combustion to the proper cylinder. Control of the exhaust gas recirculation to the combustion process reduces harmful emissions, including smog precursors and particulates (Cook et al., 1996).
Control of the diesel engine is achieved by coordination between sensors (engine position, temperature, etc.), the ECU, and actuators (fuel injector, compressor, throttle, etc.). Given the torque/speed requirement, the ECU gathers the information from several sensors and determines the optimal variables, such as air-fuel ratio, then passes them to the actuators. The feedback control loop formed by the actuators and their sensors ensure the actuators behave exactly as the ECU requested.
Compressed Natural Gas (CNG) Engine
CNG engines use compressed natural gas to power the vehicle. CNG is becoming a popular substitute for gas and diesel fuel for many reasons, including stability of the natural gas supply, lower emissions, lower price, and suitability for a traditional internal combustion engine (Mitchell 2015). The working principle of a CNG engine system resembles that of a diesel or gas engine. Therefore, the control principle mentioned above also applies to CNG engines (Ryu, 2013).
Hybrid Electric Vehicle (HEV)
A Hybrid Electric Vehicle (HEV) combines an Electric Vehicle (EV) powertrain system with an internal combustion engine. Such features extend vehicle performance and fuel economy while reducing emissions relative to an ICE—without sacrificing driving range (Cikanek & Bailey, 2002; Hu et al., 2013). The hybrid architecture of an HEV also provides inherent automation capability because it is already quasi-automated for efficient powertrain management.
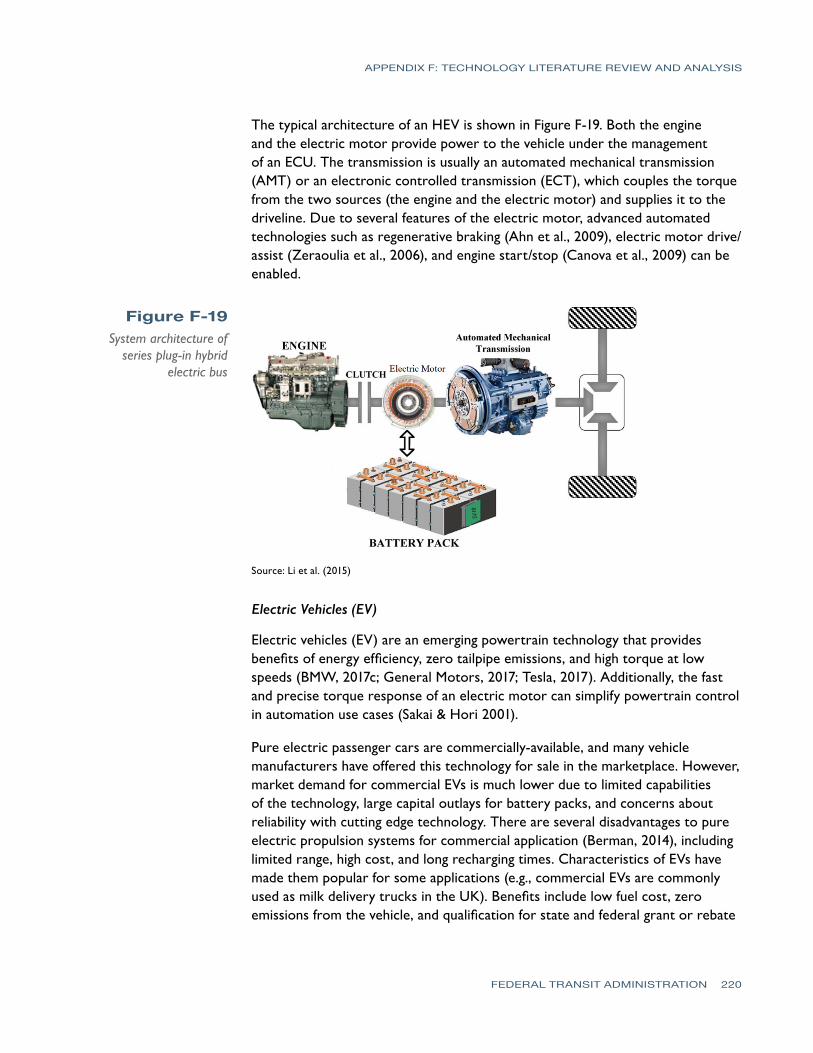
APPENDIX F: TECHNOLOGY LITERATURE REVIEW AND ANALYSIS
FEDERAL TRANSIT ADMINISTRATION 220
The typical architecture of an HEV is shown in Figure F-19. Both the engine and the electric motor provide power to the vehicle under the management of an ECU. The transmission is usually an automated mechanical transmission (AMT) or an electronic controlled transmission (ECT), which couples the torque from the two sources (the engine and the electric motor) and supplies it to the driveline. Due to several features of the electric motor, advanced automated technologies such as regenerative braking (Ahn et al., 2009), electric motor drive/assist (Zeraoulia et al., 2006), and engine start/stop (Canova et al., 2009) can be enabled.
Figure F-19System architecture of
series plug-in hybrid electric bus
Source: Li et al. (2015)
Electric Vehicles (EV)
Electric vehicles (EV) are an emerging powertrain technology that provides benefits of energy efficiency, zero tailpipe emissions, and high torque at low speeds (BMW, 2017c; General Motors, 2017; Tesla, 2017). Additionally, the fast and precise torque response of an electric motor can simplify powertrain control in automation use cases (Sakai & Hori 2001).
Pure electric passenger cars are commercially-available, and many vehicle manufacturers have offered this technology for sale in the marketplace. However, market demand for commercial EVs is much lower due to limited capabilities of the technology, large capital outlays for battery packs, and concerns about reliability with cutting edge technology. There are several disadvantages to pure electric propulsion systems for commercial application (Berman, 2014), including limited range, high cost, and long recharging times. Characteristics of EVs have made them popular for some applications (e.g., commercial EVs are commonly used as milk delivery trucks in the UK). Benefits include low fuel cost, zero emissions from the vehicle, and qualification for state and federal grant or rebate
APPENDIX F: TECHNOLOGY LITERATURE REVIEW AND ANALYSIS
FEDERAL TRANSIT ADMINISTRATION 221
programs. In the transit sector, electric buses are becoming more common. Two manufacturers, Proterra and BYD, already provide electric buses in North America, and Volvo and Daimler are developing and testing electric buses in Europe. Smaller low-speed, automated shuttles, such as those being produced by EasyMile, Navya, and Local Motors, are also typically electric vehicles. EV powertrain architectures are well-suited to include automation control inputs.
Technology Capabilities
Many forms of automation require control of the powertrain to perform. With control of the powertrain, a computer can generate signals to manage vehicle acceleration and speed. Automated vehicle applications that require powertrain control include adaptive cruise control, platooning, and other highly-automated capabilities.
Adaptive Cruise Control (ACC)
ACC helps to avoid accidents by keeping the equipped vehicle at a safe distance from the traffic ahead. Using signals from a radar sensor, the control unit computes the distance to the vehicle ahead and the equipped vehicle’s speed relative to it. If the equipped vehicle is approaching a slower vehicle, or if another vehicle cuts in front of it, ACC slows the equipped vehicle by providing a signal of lower reference speed to the engine control unit and, if necessary, a braking request to the braking system (VW, 2016). This technology is already available for buses and trucks (MAN, 2017; WABCO, 2017b; Volvo, 2017c). ACC systems often allow a computer to control steering, brake, and throttle systems.
Vehicle Platooning
Vehicle platooning has been widely recognized as a means to improve fuel economy and reduce exhaust emissions, especially in heavy-duty trucks (Al Alam et al., 2010; Tsugawa et al., 2011). By governing vehicle platoons with an automated control strategy, overall traffic flow is expected to improve.
Control in vehicle platooning generally includes both longitudinal and lateral direction. Computers use information from sensors on the vehicle and from signals generated by other vehicles, often transmitted through radio communication, to control the powertrain and brake systems and maintain short headways between vehicles. The lateral control is similar to vehicle lane keeping technology. With the help of a camera to determine the position of the vehicle with respect to the center of the road, the ECU of a steering system could process the data and command the steering actuators to maintain constant distance to the center of the lane (Hobert, 2012).
APPENDIX F: TECHNOLOGY LITERATURE REVIEW AND ANALYSIS
FEDERAL TRANSIT ADMINISTRATION 222
Automated Driving
The powertrain system is a key part of an automated vehicle. A few companies, including Daimler (Daimler 2017d), DeNA (BI Intelligence, 2016), EasyMile (EasyMile, 2017), have built their own automated buses and have proven the feasibility of the idea.
Pros and Cons
Electronically-controlled powertrain systems can enable many types of automated technologies. In terms of different types of powertrain-enabling automation, a diesel engine with electronic control is an economic solution for general implementation of automation, and hybrid or electric propulsion systems are also an attractive choice. One limitation of any powertrain system is that the achievement of automated operation requires research into the control strategy. Automation largely depends on the design of its controller rather than the design of the chosen powertrain. Coordination between the powertrain and other actuator systems is another potential limitation because the powertrain system only controls longitudinal motion; it does not control vehicle steering and it has limited control over vehicle deceleration.
Whereas this section has focused on on-road control of the powertrain for automated vehicles, fuel management and maintenance are also noteworthy powertrain considerations for many future highly-automated vehicle applications.
Suppliers and Costs
Diesel Engine
In North America, the main suppliers of heavy-duty, commercial diesel engines are Navistar, Volvo-Mack, Caterpillar, Detroit Diesel, and Cummins.
CNG Engine
Major suppliers of CNG engines include Cummins, Caterpillar Inc., MAN, GE Energy Waukesha, and Deutz.
Hybrid Electric Bus and Hybrid Electric Powertrain
The hybrid electric bus is considered a mature technology and many bus manufacturers such as Gillig, Nova, Orion, and New Flyer offer hybrid electric buses. In terms of suppliers of hybrid electric powertrains, the list includes Siemens, EVDRIVE, BAE, Allison Transmission, and Voith.
Overall Outlook for Application to Transit
Several sensors, such as radar, cameras, and ultrasonic sensors, are well-established and commonly used on current light-duty production vehicles. Lidar
APPENDIX F: TECHNOLOGY LITERATURE REVIEW AND ANALYSIS
FEDERAL TRANSIT ADMINISTRATION 223
units are not yet common in light-duty vehicles, but are available in some high-end models, and have been used in research prototype vehicles, including on transit vehicles. Communications technologies, such as cellular or DSRC radios are also available, but are not yet common in transit safety applications (other than in test environments).
GNSS and IMU technologies are common in buses (e.g., as part of automatic vehicle locator systems), but higher-end GNSS equipment necessary for automation (e.g., bus on shoulder operations) is currently too expensive for widespread adoption—with further development lower-cost systems may be able to provide adequate coverage, or the existing high-end systems may become more affordable. Infrastructure-based systems such as magnetic sensing and wire in pavement have proven applicability in limited environments, but as they can only operate in equipped environments, they are likely to be relatively less attractive as on-vehicle sensors continue to improve.
In addition to light-duty vehicles, sensors are also beginning to show up in heavy-duty vehicles, including transit vehicles, as components in ADAS (e.g., pedestrian detection and collision-warning systems). Some of these systems include level 1 automation (e.g., emergency braking systems to be installed on 30 Pierce Transit buses in Washington), though for the most part transit projects beyond level 1 or 2 automation are confined to research prototypes. As vehicles become more highly-automated, sensors may be used for new applications, such as for passenger detection on an unmanned vehicle.
Overall, many of these sensors are becoming less bulky, lower cost, and more durable. Many of these improvements are driven by demand for these sensors in the light-duty vehicle market, as well as in heavy-duty vehicles and other industries, such as military, aviation, medical devices, and consumer electronics. Although specialized systems for transit vehicles will suffer from low scale, prices may come down as components become commodities as a result of scaling up in other markets. Many of the new technologies have already seen significant cost reductions—lidar units now cost a fraction of what they did only a few years ago. For example, in 2013 a Velodyne lidar unit cost up to $85,000, but by the end of 2014, Velodyne had introduced a lidar unit with a $7,999 price point. More recently, the company has announced a target of $500 for its newer solid-state lidar units.
While each sensor is unique and the various sensors have strengths and weaknesses (e.g., lighting for cameras and weather for lidar), many of these weaknesses can be at least partially addressed through the utilization of additional sensors (e.g., radar and infrared cameras) to compensate. Additional sensors can also provide redundancy to the system in case one of the other sensors fails. The term “sensor fusion” describes the concept that automated systems will
APPENDIX F: TECHNOLOGY LITERATURE REVIEW AND ANALYSIS
FEDERAL TRANSIT ADMINISTRATION 224
increasingly amalgamate all onboard technologies to create robust, safe solutions in all conditions.
As automated transit vehicles begin revenue service operations, digital maps will likely be a vital component of their automation systems. Much of the mapping and machine vision/learning needed for automation will require GPUs working in conjunction with CPUs. Computer vision techniques, such as optical flow, texture recognition, and stereo vision are useful in automated vehicle applications. Because transit vehicles typically operate at lower speeds and have set routes and service areas, they may have less intensive requirements for onboard mapping and vision capabilities.
Actuators are a key part of automated vehicle systems, but the actuators being used in light-duty vehicles may not directly translate to transit buses. For instance, light-duty vehicles use electronic steering systems, which allow for relatively easy automation of steering functions; however, such systems are inappropriate for heavy-duty vehicles which require hydraulic systems. There are several commercially available actuators which provide similar automation functionality for hydraulic systems.
Similarly, for automated braking, companies such as Bendix and WABCO have developed braking systems for heavy-duty vehicles that have been used for low-level automation applications (e.g., truck platooning and emergency automated braking systems for trucks and buses). Both companies offer ADAS packages (e.g., Bendix Wingman Fusion, WABCO OnGuardACTIVE, and WABCO OnGuardMAX systems) that use sensors (e.g., camera and radar) to enable automated braking. Both companies use vision technology from Mobileye, and WABCO recently announced a partnership with Mobileye to develop a commercial system with emergency braking and active steering control.
Modern engines rely on many sensors, electronic control units, and actuators, so conventional internal combustion engine vehicles can be automated in a relatively straightforward manner. Because electric vehicles may be easier to automate, and as a result, most of the small automated shuttle buses (e.g., those produced by EasyMile, Local Motors, and Navya) are electric vehicles. Some existing electric buses already use limited automation in the form of precision docking for connecting to charging stations.
High costs may continue to be an obstacle for the application of these technologies to transit, but continued demand for these sensors in the light- and heavy-duty truck markets may enhance the quality and reduce the cost of these products over time. Continued research and demonstrations in the application of these technologies to transit can help inform how they may best be deployed and implemented to advance automated transit in the United States.
FEDERAL TRANSIT ADMINISTRATION 225
REFERENCES 3GPP. (2015). “LTE-Advanced Pro Ready to Go.” Retrieved January 10, 2017, from http://www.3gpp.org/news-events/3gpp-news/1745-lte-advanced_pro.
4 Wheel Parts. (2017). “Trail Gear Hydraulic Steering Kit-130305-1-KIT.” Retrieved from http://www.4wheelparts.com.
49 CFR 393.55 (2010). “Antilock Brake Systems.” September 21, 2010.5G.co.uk. (2017). “What is LTE-Advanced Pro?” Retrieved January 6, 2017, from
https://5g.co.uk/guides/lte-advanced-pro/. 79 GHz Project. (2013). “Technology Benefits.” Retrieved December 2016 from
http://www.79ghz.eu/index.php/technology. Abboud, K., Omar, H., and Zhuang, W. (2016). “Interworking of DSRC and Cellular
Network Technologies for V2X Communications: A Survey.” IEEE Transactions on Vehicular Technology, 65(12).
Abernethy, B., Andrews, S., and Pruitt, G. (2011). “Vehicle Position Trade Study for ITS Applications: Final Report.” Report No. FHWA-JPO-12-064, Federal High-way Administration, USDOT.
Ackerman, E. (2016). “Cheap Lidar: The Key to Making Self-Driving Cars Afford-able.” IEEE Spectrum. September 22. Retrieved December 2016 from http://spectrum.ieee.org/transportation/advanced-cars/cheap-lidar-the-key-to-mak-ing-selfdriving-cars-affordable.
Adabi, F. (2017). “NVIDIA, AUDI Partner to Put World’s Most Advanced AI Car on Road by 2020.” Retrieved January 2017 from http://nvidianews.nvidia.com/news/nvidia-audi-partner-to-put-world-s-most-advanced-ai-car-on-road-by-2020.
Aeberhard, M., Rauch, S., Bahram, M., Tanzmeister, G., Thomas, J., Pilat, Y., Homm, F., Huber, W., and Kaempchen, N. (2015). “Experience, Results and Lessons Learned from Automated Driving on Germany’s Highways.” IEEE Intelligent Transportation Systems Magazine, 43.
Ahn, J., Jung, K., Kim, D., Jin, H., Kim, H., and Hwang, S. (2009). “Analysis of a Regen-erative Braking System for Hybrid Electric Vehicles Using an Electro-Mechani-cal Brake.” International Journal of Automotive Technology, 10(2), 229-234.
Al Alam, A., Gattami, A., and Johansson, K. H. (2010). “An Experimental Study on the Fuel Reduction Potential of Heavy-duty Vehicle Platooning.” Presented at 13th International IEEE Conference on Intelligent Transportation Systems (ITSC).
Alessandrini, A. (2017). “CityMobil2: Experience and Recommendations.” Retrieved January 25, 2017, from http://www.citymobil2.eu/en/upload/Deliverables/PU/CityMobil2%20booklet%20web%20final_17%2011%202016.pdf.
Alon, Y., Ferencz, A., and Shashua, A. (2006). “Off-road Path Following Using Region Classification and Geometric Projection Constraints.” Computer Vision and Pat-tern Recognition.
Altavilla, D. (2016). “NVIDIA Doubles Down on Self-Driving Cars with Xavier AI Chip and a Hat Tip to Next Gen Volta GPU.” September 28. Retrieved December 2016 from http://www.forbes.com/sites/davealtavilla/2016/09/28/nvidia-doubles-down-on-self-driving-cars-with-xavier-ai-chip-and-a-hat-tip-to-next-gen-volta-gpu/#142b53357588.
Amirouche, F., Mahmudi, K., and Zavaterro, D. (2004). “Virtual Automated Transit
REFERENCES
FEDERAL TRANSIT ADMINISTRATION 226
System (VATS) and Intelligent Transportation Systems (ITS) Application to In-termodal Freight Movements in Northeastern Illinois.” Proceedings of IMECE04 2004 ASME International Mechanical Engineering Congress and Exposition, Ana-heim, CA.
Amirtha, T. (2016). “How TomTom is Plotting a Route into U.S. Driverless Car In-dustry.” ZDNet. Retrieved December 14, 2016, from http://www.zdnet.com/article/how-tomtom-is-plotting-a-route-into-us-driverless-car-industry/.
Aoki, K., and Suyama, T. (2000). “A Concept of Intelligent Multi-Mode Transit Sys-tem Based on Automated Bus.” IEEE Intelligent Vehicles Symposium, 590-59.
APTA. (2010). “Implementing BRT Intelligent Transportation Systems.” BTS-BRT-RP-005-10, APTA Standards Development Program Recommended Practice. Re-trieved December 7, 2016, from http://www.apta.com/resources/standards/documents/apta-bts-brt-rp-005-10.pdf.
Arduino. (2016). “Introduction.” Retrieved December 13, 2016, from https://www.arduino.cc/en/Guide/Introduction.
Arpin, E., Shankwitz, C., and Donath, M. (2014). “A High Accuracy Vehicle Position-ing System Implemented in a Lane Assistance System when GPS Is Unavail-able.” Final Report. Intelligent Transportation Systems Institute, Center for Transportation Studies, University of Minnesota. Retrieved January 27, 2017, from file:///C:/Users/j-zmud/Downloads/CTS11-18.pdf.
ATA. (2015). “White Paper: Automated Driving and Platooning Issues and Oppor-tunities.” ATA Technology and Maintenance Council, Future Truck Program, Automated Driving and Platooning Task Force. September 21, 2015.Retrieved January 3, 2017, from http://orfe.princeton.edu/~alaink/SmartDrivingCars/ITFVHA15/ITFVHA15_USA_FutureTruck_ADP_TF_WhitePaper_Draft_Fi-nal_TF_Approved_Sept_2015.pdf.
Autoliv. (2017). “Products & Innovations.” Retrieved January 2017 from www.au-toliv.com/ProductsAndInnovations/.
AVG Kennis Institute. (2016). “History of Automated Guided Vehicles.” Retrieved December 9, 2016, from http://www.frog.nl/Oplossingen/AGV_Kennis_Institu-ut.
Ballard, D., and Brown, C. (1982). Computer Vision, First Edition. Prentice Hall.Balluff. (2016). “Ultrasonic Sensors.” Retrieved December 9, 2016, from http://
www.balluff.com/balluff/MDE/en/products/overview-ultrasonic-sensors.jsp. Barrett, J. (2014). “Analyzing and Modeling Low-cost MEMS IMUs for Use in an In-
ertial Navigation System.” Master Thesis, Worcester Polytechnic Institute, May. Retrieved December 14, 2016, from https://web.wpi.edu/Pubs/ETD/Available/etd-043014-163543/unrestricted/jbarrettMSThesis.pdf.
Barrie, J. (2014). “Google May Have Got It Wrong with Driverless Cars – Automat-ed Buses are the Real Future.” Business Insider, December 1. Retrieved January 4, 2017, from http://www.businessinsider.com/the-future-of-driverless-bus-es-2014-12.
Bartsch, A., Fitzek, F., and Rasshofer, R. (2012). “Pedestrian Recognition Using Au-tomotive Radar Sensors.” Advances in Radio Science, (10), 40-55. Retrieved De-cember 2016 from http://www.adv-radio-sci.net/10/45/2012/ars-10-45-2012.pdf.
REFERENCES
FEDERAL TRANSIT ADMINISTRATION 227
Behrisch, M., Bieker, L., Erdmann, J., and Krajzewicz, D. (2011). “SUMO–simulation of urban mobility: an overview.” Proceedings of the Third International Conference on Advances in System Simulation (SIMUL 2011).
Benallal, M. and Meunier, J. (2003). “Real-time Color Segmentation of Road Signs.” Canadian Conference on Electrical and Computer Engineering (CCECE), May 4-7, 2003, 1823–1826.
Bendix (2009). Air Brake Handbook. Bendix Commercial Vehicle Systems LLC.Bendix (2017a). Bendix Commercial Vehicle Systems LLC Website. Retrieved Janu-
ary 2017 from http://www.bendix.com/en/products/products_1.jsp. Bendix. (2017b). Bendix® Wingman® Fusion™. Bendix Commercial Vehicle Sys-
tems LLC. Retrieved January 2017 from http://www.bendix.com/media/docu-ments/products_1/wingman_fusion/BW3025_Fusion_Brochure.pdf.
Bengler, K., Dietmayer, K., Farber, B., Maurer, M., Stiller, C., and Winner, H. (2014). “Three Decades of Driver Assistance Systems: Review and Future Perspec-tives.” IEEE Intelligent Transportation Systems Magazine, 6(4), 6-22.
Bergenheim, C., Hedin, E., and Skarin, D. (2012). “Vehicle-to-Vehicle Communica-tion for Platooning System.” Procedia: Social and Behavioral Sciences (48), 1222-1233.
Berman, B. (2014). Electric Cars Pros and Cons. PluginCars.com. April 22. Retrieved from http://www.plugincars.com/electric-cars-pros-and-cons-128637.html.
Berman, B. (2016). “Whoever Owns the Maps Owns the Future of Self-Driving Cars.” Popular Mechanics, July 1. Retrieved December 13, 2016, from http://www.popularmechanics.com/cars/a21609/here-maps-future-of-self-driving-cars/.
BI Intelligence. (2016). “Japanese Company DeNA to Start Transit Service Using Self-Driving Buses.” Business Insider, July 8. Retrieved from http://www.busines-sinsider.com/japanese-company-dena-to-start-transit-service-using-self-driv-ing-buses-2016-7.
BMW. (2017a). BMW Technology Guide: Active Steering. Retrieved January 2017 from http://www.bmw.com/com/en/insights/technology/technology_guide/articles/mm_active_steering.html.
BMW. (2017b). BMW Technology Guide: Hill Descent Control (HDC). Retrieved January 2017 from http://www.bmw.com/com/en/insights/technology/technol-ogy_guide/articles/hill_descent_control.html.
BMW. (2017c). BMW i3 Model Overview. BMW North America. Retrieved from https://www.bmwusa.com/vehicles/bmwi/i3.html.
Bojarski, M., Testa, D., Dworakowski, D., Firner, B., Flepp, B., Goyal, P., Jackel, L., Mon-fort, M., Muller, U., Zhang, J., Zhang, X., Zhao, J., and Zieba, K. (2016). End to End Learning for Self-Driving Cars. NVIDIA. April 25. Retrieved December 2016 from https://arxiv.org/pdf/1604.07316.pdf.
Borenstein, E., and Ullman, S. (2002). “Class-Specific, Top-Down Segmentation.” Proceedings of the 7th European Conference on Computer Vision, May 28-31, 2002, 109-124.
Bosch (2017). Bosch Mobility Solutions. Retrieved January 2017 from http://prod-ucts.bosch-mobility-solutions.com/en/de/homepage/homepage_1.html.
Bosch. (2006). Class 5 to 7 Truck and Bus Hydraulic Brake System Diagnosis Guide.
REFERENCES
FEDERAL TRANSIT ADMINISTRATION 228
Robert Bosch GmbH.Bosch. (2007). Automotive Handbook 7th: Bosch. Robert Bosch GmbH.Boyd, J. (2016). “Japan’s Upgraded Mobile Mapping Technology Aims to Make Au-
tonomous Driving Safer.” IEEE Spectrum. November 22. Retrieved Decem-ber 14, 2016, from http://spectrum.ieee.org/cars-that-think/transportation/self-driving/japans-upgraded-mobile-mapping-technology-aims-to-make-auton-omous-driving-safer.
Breuer, K., and Kitterer, H. (2013). U.S. Patent 8,538,674. U.S. Patent and Trademark Office.
Breuer, K., and Kitterer, H. (2008). U.S. Patent No. 12/735,217. U.S. Patent and Trademark Office.
Brizzolara, D. (2013). Future Trends for Automotive Radars: Towards the 79 GHz Band. International Telecommunication Union. Retrieved December 2016 from http://itunews.itu.int/en/3935-Future-trends-for-automotive-radars-Towards-the-79GHz-band.note.aspx.
Broggi, A., Cerri, P., Medici, P., Porta, P., and Ghisio, G. (2007). “Real Time Road Signs Recognition.” IEEE Intelligent Vehicles Symposium 2007, 981-986.
Buechel, M., Jelena, F., Klaus, B., Stephan, S., Christian, B., Michael, A., Andre, M., Andreas, Z., Cornel, K., and Alois, K. (2015). “An Automated Electric Vehicle Prototype Showing New Trends in Automatic Architectures.” 2015 IEEE 18th International Conference on Intelligent Transportation Systems. September 15-18.
Byun, R. and Y. Kim. (2016). “Heading Estimation Based on Magnetic Markers for In-telligent Vehicles.” Journal of Dynamic Systems, Measurement and Control, 138(7).
Byun, Y., Jeong, R., and Kang., S. (2015). “Vehicle Position Estimation Based on Mag-netic Markets: Enhanced Accuracy by Compensation in Time Delays.” Sensors, 15(11), 28807-28825. November 2015.
Canova, M., Guezennec, Y., and Yurkovich, S. (2009). “On the Control of Engine Start/Stop Dynamics in a Hybrid Electric Vehicle.” Journal of Dynamic Systems, Measurement, and Control, 131(6), 061005.
CAR. (2012). “Connected Vehicle Technology Industry Delphi Study.” Center for Automotive Research. Prepared for Michigan Department of Transportation. Retrieved from http://www.michigan.gov/documents/mdot/09-27-2012_Con-nected_Vehicle_Technology_-_Industry_Delphi_Study_401329_7.pdf.
Carullo, A., and Parvis, M. (2001). “An Ultrasonic Sensor for Distance Measurement in Automotive Applications.” IEEE Sensors Journal, 1(2), 143-147.
Chaiken, A., and Kinney., J. (2014). “Technology, Business and Regulation of the “Connected Car.” Presentation, Mentor Embedded Software and Toyota In-foTechnology Center, December 11, 2013. Retrieved December 20, 2016. Ac-cessed from http://www.slideshare.net/mentoresd/v2-x-hangoutacfinal.
Chan, C., and Tan, H. (2003). “Evaluation of Magnetic Markers as a Position Ref-erence System for Ground Vehicle Guidance and Control.” Research Report UCB-ITS-PRR-2003-8. California, Partners for Advances Transportation Tech-nology, Berkeley, March.
Chan, C., Bougler, B., Nelson, D., Kretz, P., Tan, H., and Zhang, W. (2000). “Character-ization of Magnetic Tape and Magnetic Markers as a Positioning Sensing System for Vehicle Guidance and Control.” Proceedings of the American Control Confer-
REFERENCES
FEDERAL TRANSIT ADMINISTRATION 229
ence. Chicago, IL. June 28-30, 2000.Chen, C., Chiu, C., Wu, B., Lin, S., and Huang, C. (2004). “The Moving Object Seg-
mentation Approach to Vehicle Extraction.” Proceedings of IEEE International Conference on Networking, Sensing and Control, 1, 19-23.
Chen, C., Seff, A., Kornhauser, A., and Xiao, J. (2015). “DeepDriving: Learning Af-fordance for Direct Perception in Autonomous Driving.” Proceedings of 15th IEEE International Conference on Computer Vision (ICCV2015). Retrieved January 2017, from http://deepdriving.cs.princeton.edu/.
Chen, Z., and Ellis, T. (2011). “Multi-shape Descriptor Vehicle Classification for Ur-ban Traffic.” International Conference on Digital Image Computing: Techniques and Applications (DICTA). December 6-8, 2011.
Cheong, L. (2016). “V2X Applications for Public Transport.” 2nd ITS AP Workshop – Innovative Transport Management. Intelligent Transport Systems Asia-Pacific. June 23, 2016. Retrieved January 3, 2017, from http://itsasia-pacific.com/pdf/LeongH-inCheong.pdf.
Chiu, K., and Lin, S. (2005). “Lane Detection Using Color-based Segmentation.” Pro-ceedings of the IEEE Intelligent Vehicles Symposium. June 6-8, 2005.
Chivers, M. (2016). Differential GPS Explained. ESRI. Retrieved December 6, 2016, from http://www.esri.com/news/arcuser/0103/differential1of2.html.
Christ, G. (2016) “RTA Bringing Connected Vehicle Technology to Its Bus Fleet.” October 4, 2016. Retrieved January 3, 2017. Accessed from http://www.cleve-land.com/metro/index.ssf/2016/ 10/rta_bringing_connected_vehicle.html.
Cikanek, S., and Bailey, K. (2002). “Regenerative Braking System for a Hybrid Elec-tric Vehicle.” Proceedings of the 2002 American Control Conference.
Civil Maps. (2016). Retrieved December 15, 2016, from https://www.civilmaps.com/.Clark, J. (2013). “Will the GPU Replace the CPU?” The Data Center Journal, August
6. Retrieved December 2016 from http://www.datacenterjournal.com/gpu-re-place-cpu/.
CLEPA. (2016). “Valeo to Offer New Low-Cost Solid-State Lidar.” CLEPA - Euro-pean Association of Automotive Suppliers, February 6, 2016. Retrieved De-cember 2016 from http://clepa.eu/mediaroom/valeo-offer-new-low-cost-solid-state-lidar/.
Colias, M. (2015). “Chevrolet Plans Low-Cos Pedestrian Avoidance on Malibu.” Automotive News, July 24. Retrieved January 2017 from http://www.autonews.com/article/20150724/OEM06/150729917/chevrolet-plans-low-cost-pedestri-an-avoidance-on-malibu.
Consumer Reports. (2013). “Safety Upgrades for Your Car.” Consumer Reports. Retrieved December 2016, from http://www.consumerreports.org/cro/maga-zine/2013/11/safety-upgrades-for-your-car/index.htm.
Continental. (2016). “Hi-Res 3D Flash LIDAR Will Supplement Existing Portfo-lio for Automated Driving.” Continental Press Portal, March 3, 2016. Retrieved December 2016 from http://www.continental-corporation.com/www/press-portal_com_en/themes/press_releases/3_automotive_group/chassis_safety/press_releases/pr_2016_03_03_3dlidar_en.html.
Continental. (2017). Automotive Group. Retrieved December 2016 from www.continental-automotive.com.
REFERENCES
FEDERAL TRANSIT ADMINISTRATION 230
Cook, J., Grizzle, J., and Sun, J. (1996). Engine Control. Control System Applications, 87-100. Retrieved from http://web.eecs.umich.edu/~grizzle/papers/CRC_hand-book1996.pdf.
Copeland, M. (2016). “What’s the Difference between Artificial Intelligence, Ma-chine Learning, and Deep Learning?” NVIDIA, July 29, 2016. Retrieved Decem-ber 2016 from https://blogs.nvidia.com/blog/2016/07/29/whats-difference-arti-ficial-intelligence-machine-learning-deep-learning-ai/.
Cregger, J. and R. Wallace. (2014). “International Survey of Best Practices in Con-nected and Automated Vehicle Technologies.” Prepared by Center for Au-tomotive Research for Michigan Department of Transportation, September. Retrieved January 27, 2017, from http://www.cargroup.org/?module=Publica-tions&event=View&pubID=135.
Csongor, R. (2017). “AI in Self-Driving Cars – Sci-Fi No Longer.” Bosch Website, January 5, 2017. Retrieved January 2017 from http://blog.bosch-si.com/catego-ries/mobility/2017/01/ai-self-driving-cars-nvidia-bosch/.
D’Orazio, D. (2015). “Obama Administration Reaches Goal to Provide LTE to 98% of Americans.” The Verge. Retrieved January 10, 2017 from http://www.thev-erge.com/2015/3/23/8273759/obama-administration-passes-goal-lte-for-98-percent-of-americans.
Daigavane, P., Bajaj, P., and Daigavane, M. (2011). “Vehicle Detection and Neural Network Application for Vehicle Classification.” International Conference on Computational Intelligence and Communication Systems. October 7-9, 2011.
Daimler. (2016). The Mercedes-Benz Future Bus. Retrieved December 2016 from https://www.daimler.com/innovation/autonomous-driving/future-bus.html.
Daimler. (2017a). Active Lane Keeping Assist. Retrieved January 2017 from http://www.daimler.com/innovation/safety/special/keeping-in-lane.html.
Daimler. (2017b). Emergency Braking. Daimler AG Website. Retrieved from http://www.daimler.com/innovation/safety/special/emergency-braking.html.
Daimler. (2017c). Daimler Buses: Undoubtedly the Number One for Safety in Europe. Retrieved from http://media.daimler.com/marsMediaSite/en/instance/ko/Daimler-Buses-undoubtedly-the-number-one-for-safety-in-Europ.xhtm-l?oid=9919516.
Daimler. (2017d). The Mercedes-Benz Future Bus. Retrieved January 2017 from http://www.daimler.com/innovation/autonomous-driving/future-bus.html.
Dalal, N., and Triggs, B. (2005). “Histograms of Oriented Gradients for Human De-tection.” Computer Vision and Pattern Recognition, June 20-25, 2005.
DARPA. (2004). DARPA Grand Challenge. Defense Advanced Research Projects Agency. Retrieved January 10, 2017, from http://www.darpa.mil/grandchallenge.
Davies, A. (2016). “Clever AI Turns a World of Lasers into Maps for Self-Driving Cars.” Digital Trends, July 15, 2016. Retrieved December 15, 2016 from http://www.digitaltrends.com/cars/ford-investment-civil-maps-autonomous-car-tech/.
de H. M. Barros, H., Rêgo, M., Lucena, E., Maciel, T., Freitas, W., and Cavalcanti, F. R. (2012). “A Distance-Based Study for Device-To-Device Communication Un-derlaying a Cellular System.” XXX Simpósio Brasileiro de Telecomunicações, Sep-tember 13-16, 2012.
Delphi. (2016). Safety Electronics: Active Safety. Retrieved December 2016 from

REFERENCES
FEDERAL TRANSIT ADMINISTRATION 231
http://www.delphi.com/manufacturers/auto/safety/active. Deng, Q., and Ma, X. (2015). “A Simulation Platform for Autonomous Heavy-duty
Vehicle Platooning in Mixed Traffic.” Paper presented at the TRB 94th Annual Meeting.
Denso. (2016). “Denso Invests in Semiconductor Laser Technology Startup Tri-lumina.” PRNewswire, April 7. Retrieved December 2016 from http://www.prnewswire.com/news-releases/denso-invests-in-semiconductor-laser-technol-ogy-startup-trilumina-300247871.html.
Denso. 2016. Driving Control & Safety. Denso. (2012). DENSO Develops Higher Performance Millimeter-Wave Radar.
Retrieved December 2016 from http://www.globaldenso.com/en/newsreleas-es/121121-01.html. Donath, M., Shankwitz, C., Alexander, L., Gorjestani, A., Cheng, P.-M., and New-
strom, B. (2003). “Bus Rapid Transit Lane Assist Technology Systems, Volume 1: Technology Assessment.” Retrieved January 2017 from http://www.its.umn.edu/Research/FeaturedStudies/brt/laneassist/LAfinal1.pdf.
Dubey, P. (2016). “How Intel Xeon Phi Processors Benefit Machine Learning/Deep Learning Apps and Frameworks.” Intel Website. June 20, 2016. Retrieved Janu-ary 2017 from https://software.intel.com/en-us/blogs/2016/06/20/how-xeon-phi-processors-benefit-machine-and-deep-learning-apps-frameworks.
Duffy, O. C., and Wright, G. (2016). Fundamentals of Medium/Heavy-duty Commercial Vehicle Systems. Jones & Bartlett Learning.
Eassa, A. (2016). “NVIDIA Corporation Scores Massive Automotive Win with Tesla Motors Inc.” October 22. The Motley Fool. Retrieved January 2017 from http://www.fool.com/investing/2016/10/22/nvidia-corporation-scores-massive-auto-motive-win-w.aspx.
EasyMile. (2017). Driverless Vehicles for the Last Mile. Retrieved from http://easymile.com/about-us/.
Edge, A. (2015). “Hill Descent Control.” Clemson University Vehicular Electronics Laboratory. Retrieved February 2017 from http://www.cvel.clemson.edu/auto/ECE470_Projects_2015/Adam_Edge_project.html.
Eidehall, A., Pohl, J., Gustafsson, F., and Ekmark, J. (2007). “Toward Autonomous Collision Avoidance by Steering.” IEEE Transactions on Intelligent Transportation Systems, 8(1), 84-94.
eInfochips. (2016). “Vehicle to Vehicle Communication for Crash Avoidance Systems.” White paper, eInfochips. Retrieved January 3, 2017, from https://www.einfochips.com/resources/publications/vehicle-to-vehicle-communica-tion-for-crash-avoidance-systems/.
ESA. (2014). GNSS Augmentation. European Space Agency - Navipedia. Retrieved December 6, 2016, from http://www.navipedia.net/index.php/GNSS_Augmen-tation.
Escalera, A., Armingol, J., and Mata, M. (2003). “Traffic Sign Recognition and Analysis for Intelligent Vehicles.” Image and Vision Computing, 21(3), 247-258.
Eskandarian, A., Bedewi, N., and Meczkowski, L. (1996). “Westrack: The Road to Solutions.” Public Roads 60(2).
REFERENCES
FEDERAL TRANSIT ADMINISTRATION 232
Estevez, L., and Kehtarnavaz, N. (1996). “A Real-time Histographic Approach to Road Sign Recognition.” Proceedings of the IEEE Southwest Symposium on Image Analysis and Interpretation, April 8-9, 1996, 95-100.
FAA. (2015). Satellite Navigation - WAAS - How It Works. Federal Aviation Ad-ministration. Retrieved December 7, 2016 from https://www.faa.gov/about/office_org/headquarters_offices/ ato/service_units/techops/navservices/Gnss/waas/howItWorks/.
Faber, H., Hamester, J., Kokes, M., Ludwig, R., Oeffinger, B., Paasche, S., Schwar-zhaupt, A., and Spiegelberg, G. (2006). DE102005022421 A1. Patent. October 19, 2006.
Fang, C., Chen, S., and Fuh, C. (2003). “Road-sign Detection and Tracking.” IEEE Transactions on Vehicular Technology. 52(5), 1329-1341.
Farnsworth, J. M. (2011). US8033955 B2. Patent.FCC. (2004). About DSRC. Federal Communications Commission. Retrieved
December 16, 2016, from http://wireless.fcc.gov/services/index.htm?-job=about&id=dedicated_src.
FCC. (2015). Operation of Radar Services in the 76-81 GHz Band. Federal Com-munications Commission. Retrieved December 2016 from https://www.fcc.gov/document/operation-radar-services-76-81-ghz-band.
Felzenszwalb, P., and Huttenlocher, D. (2005). “Pictorial Structures for Object Rec-ognition.” International Journal of Computer Vision, 61(1), 55-79.
Ferrari, V., Tuytelaars, T., and Gool, L. (2006). “Object Detection by Contour Seg-ment Networks.” European Conference on Computer Vision (ECCV 2006), 3953, Lecture Notes in Computer Science, 14-28.
Firner, B., Flepp, B., Zieba, K., Jackel, L., Bojarski, M., and Muller, U. (2016). End-to-End Deep Learning for Self-Driving Cars. NVIDIA. Retrieved January 2017 from https://devblogs.nvidia.com/parallelforall/deep-learning-self-driving-cars/.
First Sensor. (2016). Advanced Driver Assistance Systems – ADAS. Retrieved De-cember 2016 from http://www.first-sensor.com/en/applications/mobility/ad-vanced-driver-assistance-systems/.
Flehmig, F., and Braeuchle, C. (2016). US9296383 B2. Patent. U.S. Patent and Trade-mark Office.
Fletch’s GMC Buick Audi. (2017). Buy Commercial Vehicles in Michigan. Retrieved from http://www.fletchs.com/commercial-trucks-and-cars-for-sale-in-michigan.htm.
Flore, D. (2016). Initial Cellular V2X Standard Completed. Retrieved January 5, 2017, from http://www.3gpp.org/news-events/3gpp-news/1798-v2x_r14.
Fodor, G., Dahlman, E., and Mildh, G. (2011). “Design Aspects of Network Assisted Device-To-Device Communications.” IEEE Communications Magazine, 50(3), 2-9.
Ford. (2017a). Active Park Assist. Retrieved January 2017 from https://owner.ford.com/how-tos/vehicle-features/convenience-and-comfort/active-park-assist.html.
Ford. (2017b). “Ford’s New Active Park Assist Aims To Curb Stress.” Moto123. Re-trieved January 2017 from http://www.moto123.com/imprimer_article.spy?ar-tid=108365.
REFERENCES
FEDERAL TRANSIT ADMINISTRATION 233
Ford. (2017c). Lane Keeping System. Retrieved January 2017 from https://owner.ford.com/how-tos/vehicle-features/safety/lane-keeping-system.html.
Foresti, G., Murino, V., and Regazzoni, C. (1999). “Vehicle Recognition and Tracking from Road Image Sequences.” IEEE Transactions on Vehicular Technology, 48(1), 301-318.
Franke, U., Rabe, C., Badino, H., and Gehrig, S. (2005). “6dvision: Fusion of Stereo and Motion for Robust Environment Perception.” Pattern Recognition, 3663, Lecture Notes in Computer Science, 216-223.
Gade, K. (2005). Introduction to Inertial Navigation. Tutorial for Geodesi- og Hy-drografidagene. Hoenefoss, Norway.
Gaedke, A., Greul, R., Kanngießer, S., and Boos, N. (2015). “Driver Assistance for Trucks–From Lane Keeping Assistance to Smart Truck Maneuvering.” Paper presented at 6th International Munich Chassis Symposium, 2015.
Gardinalli, G. J., Schilling, S., Luber, A., and Canale, A. C. (2007). “ABS for Low Price Vehicles.” SAE Technical Paper 2007-01-2752. Retrieved from http://dx.doi.org/10.4271/2007-01-2752.
Gavrila, D. (1999). “Traffic Sign Recognition Revisited.” DAGM-Symposium, 86–93.GeForce. (2016). Desktop GPUs. Retrieved December 2016 from http://www.ge-
force.com/hardware/desktop-gpus. General Motors. (2017). 2017 Bolt EV: All-Electric Vehicle. Retrieved from http://
www.chevrolet.com/bolt-ev-electric-vehicle.html. Girard, A. R., Howell, A. S., and Hedrick, J. K. (2005). “Hybrid Supervisory Control
for Real-Time Embedded Bus Rapid Transit Applications.” IEEE Transactions on Vehicular Technology, 54(5), 1684-1696.
Goebel, B. (2015). 2016 Sierra HD Lineup Offers New, Advanced Technologies. Retrieved January 2017 from http://media.gmc.com/media/us/en/gmc/news/news_archive.detail.html/content/Pages/news/us/en/2015/aug/0819-sierrraHD.html.
Goodall, C., Carmichael, S., Scannell, B. (2013). “The Battle between MEMS and FOGs for Precision Guidance.” Analog Devices. Retrieved December 15, 2016, from http://www.analog.com/media/en/technical-documentation/technical-ar-ticles/The-Battle-Between-MEMS-and-FOGs-for-Precision-Guidance-MS-2432.pdf.
GPS World. (2010). Elbow Room on the Shoulder: DGPS-Based Lane-Keeping Enlists Laser Scanners for Safety and Efficiency. Retrieved December 5, 2016, from http://gpsworld.com/transportationroadelbow-room-shoulder-10159/.
GSMFavorites.com. (2017). Introduction to Cellular Communications. Retrieved January 5, 2017, from http://www.gsmfavorites.com/documents/introduction/gsm/.
Guan, A., Bayless, S., and Neelakantan, R. (2012). “Connected Vehicle Insights: Trends in Computer Vision.” ITS America. Retrieved December 2016 from http://transportationops.org/tools/connected-vehicle-insights-trends-computer-vision.
Guizzo, E. (2011). “How Google’s Self-Driving Car Works.” IEEE Spectrum. Re-trieved January 10, 2017, from http://spectrum.ieee.org/automaton/robotics/artificial-intelligence/how-google-self-driving-car-works.
REFERENCES
FEDERAL TRANSIT ADMINISTRATION 234
Guy, A., and Zhang, W. (2009). “Next Step in Vehicle Assist and Automation.” Intel-limotion: Keeping up with California PATH Research in Intelligent Transportation Sys-tems, 15(1). Retrieved January 2017 from http://www.path.berkeley.edu/sites/default/files/documents/IM_15-1_low%20(2).pdf.
Hac, A. B., and Dickinson, J. E. (2006). U.S. Patent 7,016,783. U.S. Patent and Trade-mark Office.
Hadi, R., Sulong, G., and George, L. (2014). “Vehicle Detection and Tracking Tech-niques: A Concise Review.” Signal & Image Processing: An International Journal (SIPIJ) 5(1).
Hammerschmidt, C. (2015). “Bosch, TomTom Develop Digital Maps for Automat-ed Cars.” EE Times Europe. Retrieved December 14, 2016 from http://www.electronics-eetimes.com/news/bosch-tomtom-develop-digital-maps-automat-ed-cars.
Han, L. H. Qian, W. Kwong, K. Hou, K. Lee, X. Chen, G. Zhang, and Y. Xu. 2013. “Sys-tem and Design of a Compact and Heavy-Payload AGV System for Flexible Production Line.” Proceedings of the IEEE International Conference on Robotics and Biomimetics (ROBIO), Shenzhen, China. Retrieved December 8, 2016, from http://ieeexplore.ieee.org/stamp/stamp.jsp?arnumber=6739844.
Harding, J., Powell, G., Yoon, R., Fikentscher, J., Doyle, C., Sade, D., Lukuc, M., Simons, J., and Wang, J. (2014), “Vehicle-to-Vehicle Communications: Readiness of V2V Technology for Application.” DOT HS 812 014. Available from the National Technical Information Service, www.ntis.gov.
Haritaoglu, I., Harwood, D., and Davis, L. (2000). “W4: Real-time Surveillance of People and Their Activities.” IEEE Transactions on Pattern Analysis and Machine Intelligence, 22(8), 809-830.
Hariyono, J., and Jo, K. (2017). “Detection of Pedestrian Crossing Road: A Study on Pedestrian Pose Recognition.” Neurocomputing, in press.
Harman, L. and Shama, U. (2007). “TCRP Synthesis 70: Mobile Data Terminals.” Transportation Research Board, Washington, DC.
Harris, M. (2015). “Google’s Self-Driving Car Pals Revealed.” IEEE Spectrum, January 19, 2015. Retrieved January 23, 2017 from http://spectrum.ieee.org/cars-that-think/transportation/self-driving/googles-selfdriving-car-pals-revealed.
Hasch, J., Topak, E., Schnabel, R., Zwick, T., Weigel, R., and Waldschmidt. (2012). “Millimeter-Wave Technology for Automotive Radar Sensors in the 77 GHz Frequency Band.” IEEE Transactions on Microwave Theory and Techniques, 60(3). Retrieved December 2016 from http://ieeexplore.ieee.org/stamp/stamp.jsp?ar-number=6127923.
Hatch, R., Sharpe, T., and Galyean, P. (2002). StarFire: A Global High Accuracy Dif-ferential GPS System. NavCom Technology Inc., October 30, 2002. Retrieved December 5, 2016, from http://www.cnavgnss.com/Files/Articles/StarFireA-GlobalHighAccuracySystem.pdf.
Hawes, C. (2016). “Truck Platooning Technology Advances, But Some Are Skepti-cal.” Trucks.com Website. Retrieved January 27, 2017, from https://www.trucks.com/2016/08/28/truck-platooning-technology-advances/.
He, Y., Wang, H., and Zhang, B. (2004). “Color-based Road Detection in Urban Traf-fic Scenes.” IEEE Transactions on Intelligent Transportation Systems, 5(4), 309-318.
REFERENCES
FEDERAL TRANSIT ADMINISTRATION 235
He, Z., Liu, J., and Li, P. (2004). “New Method of Background Update for Vid-eo-Based Vehicle Detection.” Proceedings of IEEE Conference on Intelligent Trans-portation Systems, 580-584.
Heißing, B., and Ersoy, M. (2010). Chassis Handbook: Fundamentals, Driving Dynamics, Components, Mechatronics, Perspectives. Springer Science & Business Media.
Hernandez-Pajares, M., Juan, J. M., Sanz, J., Aragon-Angel, A., Ramos-Bosch, P., Sam-son, J., Tossaint, M., Albertazzi, M., Odijk, D., Teunissen, P., Bakker, P., Verhagen, S., and Van der Marel, H. (2010). “Wide-Area RTK: High Precision Positioning on a Continental Scale.” InsideGNSS, March/April, 35-46.
Hikita, M. (2010). An Introduction to Ultrasonic Sensors for Vehicle Parking. New-electronics Website. Retrieved December 12, 2016, from http://www.new-electronics.co.uk/electronics-technology/an-introduction-to-ultrasonic-sen-sors-for-vehicle-parking/24966/.
Hirai, S., Ogawa, T., Yoshinaga, H., Imamura, T., and Yamada, H. (2006). “A Field Trial of Highway Bus Location System Utilizing DSRC.” Ministry of Land, Infrastruc-ture and Transport and Highway Industry Development Organization, Japan. Retrieved January 27, 2017, from http://www.nilim.go.jp/lab/qcg/english/3paper/pdf/2006_10_itswc_5.pdf.
Hobert, L. (2012). “A Study on Platoon Formations and Reliable Communication in Vehicle Platoons.” University of Twente.
Hoetzer, D. (2008). US8165796B2. Patent.Hong, J., Park, S., Kim, H., Choi S., Lee, K. B. (2013). “Analysis of Device-To-Device
Discovery and Link Setup in LTE Networks.” IEEE 24th International Symposium on Personal, Indoor and Mobile Radio Communications: Mobile and Wireless Net-works, September 8-11.
Honma, S., and Uehara, N. (2001). Milimeter-Wave Radar Technology for Automo-tive Application. Mitsubishi Electric. Retrieved December 2016 from https://pdfs.semanticscholar.org/62b7/ff45c6577f3116a233ace7077eb1aea870f3.pdf.
Hopstock, D., and Wald, L. (1996). “Verification of Field Model for Magnetic Pave-ment Marking Tape.” IEEE Transactions on Magnetics, V (33), 5.
Hsu, J. (2016). “Driverless Dutch Bus Takes Passengers on Public Test” IEEE Spec-trum, February 2. Retrieved February 2017 from http://spectrum.ieee.org/cars-that-think/transportation/self-driving/driverless-dutch-bus-takes-passengers-on-public-test.
Hu, X., Murgovski, N., Johannesson, L., and Egardt, B. (2013). “Energy Efficiency Analysis of a Series Plug-in Hybrid Electric Bus with Different Energy Manage-ment Strategies and Battery Sizes.” Applied Energy, 111: 1001-1009.
Huff, K. H., Matute, J., Garcia, A., and Zhao, D. (2015). “Transit Applications of Ve-hicle-to-vehicle and Vehicle-to-Infrastructure Technology.” Proceedings of the 2015 TRB Annual Meeting. Retrieved January 10, 2017, from http://docs.trb.org/prp/15-4840.pdf.
IHS. (2016). “Automotive MEMS Sensor Unit-Shipments Rose in 2015, Even as Revenue Stalled.” Retrieved from http://news.ihsmarkit.com/press-release/technology/automotive-mems-sensor-unit-shipments-rose-2015-even-revenue-stalled.
REFERENCES
FEDERAL TRANSIT ADMINISTRATION 236
Imine, H., Fridman, L. M., and Madani, T. (2012). “Steering Control for Rollover Avoidance of Heavy Vehicles.” IEEE Transactions on Vehicular Technology, 61(8), 3499-3509.
ITS JPO. (2016a). Dedicated Short-Range Communications (DSRC): The Future of Safer Driving. Factsheet. Intelligent Transportation Systems Joint Program Office, USDOT. Retrieved December 16, 2016, from http://www.its.dot.gov/factsheets/dsrc_factsheet.htm.
ITS JPO. (2016b) Transit Connected Vehicle Program.. Intelligent Transportation Systems Joint Project Office. Retrieved December 21, 2016, from http://www.its.dot.gov/factsheets/transit_connectedvehicle.htm.
ITSA. (2016). Manufacturers of Dedicated Short Range Communications (DSRC) Radio Equipment.
Iwasaki, Y., Misumi, M., and Nakamiya, T. (2013). “Robust Vehicle Detection under Various Environmental Conditions Using an Infrared Thermal Camera and Its Application to Road Traffic Flow Monitoring.” Sensors 13(6), 7756-7773. Retrieved December 2016 from https://www.ncbi.nlm.nih.gov/pmc/articles/PMC3715224/pdf/sensors-13-07756.pdf.
Javed, O., Shafique, K., and Shah, M. (2002). “A Hierarchical Approach to Robust Background Subtraction Using Color and Gradient Information.” Proceedings of
IEEE Workshop on Motion Video Computing, 22-27.Jeon, D. S., Min, S. K., and Sung, D. H. (2015). Vehicle Collision Avoidance Apparatus
and Method. Google Patents.Jo, Y., and Jung, I. (2014). “Analysis of Vehicle Detection with WSN-based Ultrasonic
Sensors.” Sensors, 14(8), 14050-14069.Johri, R., Rao, J., Yu, H., and Zhang, H. (2016). “A Multi-Scale Spatiotemporal Perspective of Connected and Automated Vehicles: Applications and Wireless Networking.” IEEE Intelligent Transportation Systems Magazine, 65-73.JRC. (2012). "An On-Vehicle DSRC Unit is Released." Japan Radio Corporation, April.
Retrieved December 20, 2016, from http://www.jrc.co.jp/eng/100th/event-sin-gle/event141/index.html.
Jung, C., and Kelber, C. (2004). “A Robust Linear-Parabolic Model for Lane Follow-ing.” 17th Brazilian Symposium on Computer Graphics and Image Processing.
Jung, Y., Lee, K., and Ho, Y. (2001). “Content-based Event Retrieval Using Semantic Scene Interpretation for Automated Traffic Surveillance.” IEEE Transactions on Intelligent Transportation Systems, 2(3), 151-163.
Kailasam, C. (2013). “Strategic Analysis of Global Hybrid and Electric Heavy-Duty Transit Bus Market” Presentation, Frost & Sullivan. Retrieved January 2017 from http://www.frost.com/sublib/display-report.do?id=NC7C-01-00-00-00.
Kaplan, E., and Hegarty, C. (2006). Understanding GPS: Principles and Applications. Norwood, MA.
REFERENCES
FEDERAL TRANSIT ADMINISTRATION 237
Kassani, P., and Tech, A. (2017). “A New Sparse Model for Traffic Sign Classifica-tion Using Soft Histogram of Oriented Gradients.” Applied Soft Computing, 52, 231–246.
Kaufmann, T. W. (2010). US7711464 B2. Patent.Keller, C. G., Dang, T., Fritz, H., Joos, A., Rabe, C., and Gavrila, D. M. (2011). “Active
Pedestrian Safety by Automatic Braking and Evasive Steering.” IEEE Transactions on Intelligent Transportation Systems, 12(4), 1292-1304.
Kennan, T. (1996). “Intelligent Transportation: Chrysler Learns Valuable ITS Lessons from Automated Test Track.” Ward’s Automotive. Retrieved December 8, 2016, from http://wardsauto.com/news-analysis/intelligent-transportation-chrys-ler-learns-valuable-its-lessons-fromautomated-test-track.
Kent, L. (2015). "HERE Introduces HD Maps for Highly-automated Vehicle Testing." Retrieved December 14, 2016, from http://360.here.com/2015/07/20/here-in-
troduces-hd-maps-for-highly-automated-vehicle-testing/.Kianpisheh, A., Mustaffa, N., Limtrairut, P., and Keikhosrokiani, P. (2012). “Smart
Parking Systems (SPS) Architecture Using Ultrasonic Detector.” International Journal of Software Engineering and Its Applications, 6(3).
Kim, J., Lee, C., Lee, K., Yun, T. and Kim, H. (2001). “Wavelet-based Vehicle Tracking for Automatic Traffic Surveillance.” Proceedings of IEEE International Conference on Electrical and Electronic Technology, 1, 313-316.
Kim, K.-I., Guan, H., Wang, B., Guo, R., and Liang, F. (2016). “Active Steering Control Strategy for Articulated Vehicles.” Frontiers of Information Technology & Electronic Engineering, 17(6), 576-586. doi:10.1631/fitee.1500211.
Kissinger, D. (2012). Millimeter-Wave Receiver Concepts for 77GHz Automotive Radar in Silicon-Germanium Technology: Chapter 2, Radar Fundamentals. Re-trieved December 2016 from http://www.springer.com/cda/content/doc-ument/cda_downloaddocument/9781461422891-c1.pdf?SGWID=0-0-45-1332150-p174269969.
Kittelson and Associates. (2007). “TCRP Report 118: Bus Rapid Transit Practi-tioner’s Guide.” Produced in association with Herbert S. Levinson Transpor-tation Consultants and DMJM-Harris. Washington, DC: Transit Cooperative Research Program, Transportation Research Board.
Knorr-Bremse. (2016). "Knorr-Bremse Prepares Field Testing of Truck Platoon-ing in North America." Press release. Retrieved September 26, 2016, from http://www.knorr-bremse.com/media/documents/press/press_releas-es/2016_1/33_2016_cvs_platooning_1/KB_332016_IAA_Platooning_e.pdf.
Koehn, P., and Eckrich, M. (2004). “Active Steering-the BMW Approach towards Modern Steering Technology” (0148-7191). SAE Technical Paper 2004-01-1105.
Kokkinos, I., Maragos, P., and Yuille, A. (2006). “Bottom-up & Top-down Object De-tection Using Primal Sketch Features and Graphical Models.” Computer Vision and Pattern Recognition.
Kovacic, K., Ivanjko, E., and Gold, H. (2016). “Computer Vision Systems in Road Vehicles: A Review.” Retrieved December 2016 from http://www.fer.unizg.hr/_download/repository/0014-0002.pdf.
Krivhevsky, A., Sutskever, I., and Hinton, G. (2012). “ImageNet Classification with Deep Convolutional Neural Networks.” Retrieved December 2016 from
REFERENCES
FEDERAL TRANSIT ADMINISTRATION 238
https://papers.nips.cc/paper/4824-imagenet-classification-with-deep-convolu-tional-neural-networks.pdf.
Lange, S., Ulbrich, F., and Goehring, D. (2016). “Online Vehicle Detection using Deep Neural Networks and Lidar based Preselected Image Patches.” IEEE Intelligent Vehicles Symposium (IV), Gothenburg, Sweden, June.
Larson, G. (2015). “Vehicle Assist and Vehicle Assist and Automation (VAA): Using Bus Steering Automation Technology to Improve Safety, Costs, and Efficiency.” Presentation, 2015 Automated Vehicle Symposium. Retrieved December 8, 2016, from http://higherlogicdownload.s3.amazonaws.com/AUVSI/c2a3ac12-b178-4f9c-a654-78576a33e081/UploadedImages/Proceedings/Breakouts/Be-yond%20Single%20Occ/VAA%20Presentation%20AVS%202015.pdf.
LeCun, Y., Benigo, Y., and Hinton, G. (2015). “Deep Learning: A Review.” Nature, 521, 436-444. Retrieved January 2017 from http://www.nature.com/nature/journal/v521/n7553/abs/nature14539.html.
Lee, H., Grosse, R., Ranganah, R., and Ng, A. (2009). “Convolutional Deep Belief Networks for Scalable Unsupervised Learning of Hierarchical Representa-tions.” Retrieved January 2017 from http://web.eecs.umich.edu/~honglak/icml09-ConvolutionalDeepBeliefNetworks.pdf.
Leibe, B., Seemann, E., and Schiele, B. (2005). “Pedestrian Detection in Crowded Scenes.” Computer Vision and Pattern Recognition.
Lenz, P., Ziegler, J., Geiger, A., and Roser, M. (2011). “Sparse Scene Flow Segmenta-tion for Moving Object Detection in Urban Environments.” Intelligent Vehicles Symposium (IV), 2011 IEEE, 92-932.
Levin, A., and Weiss, Y. (2006). “Learning To Combine Bottom-Up and Top-Down Segmentation.” European Conference on Computer Vision.
Levinson, J., and Thrun, S. (2010). Robust Vehicle Localization in Urban Environments Using Probabilistic Maps. Stanford Artificial Intelligence Laboratory. Retrieved December 15, 2016, from http://driving.stanford.edu/papers/ICRA2010.pdf.
Lewis, J., Madhyastha, K. B., Lobo, J. M., Valder, J., and M., R. (2016). “Fabrication of an Automated Collision Avoidance System Using Ultrasonic Sensor.” Journal of Mechanical Engineering and Automation, 6(5A), 97-101.
Li, G.-f., Lin, Y., and He, H.-W. (2009). “Regenerative Braking Control Strategy for Electric Vehicle.” Transactions of Beijing Institute of Technology, 6, 013.
Li, L., and Leung, M. (2002). “Integrating Intensity and Texture Differences for Ro-bust Change Detection.” IEEE Transactions on Image Processing, 11(2), 105-112.
Li, L., Yang, C., Zhang, Y., Zhang, L., and Song, J. (2015). “Correctional DP-based En-ergy Management Strategy of Plug-in Hybrid Electric Bus for City-Bus Route.” IEEE Transactions on Vehicular Technology, 64(7), 2792-2803.
Lim, A. (2016). “SMRT Ties Up with Dutch Company in Plans to Bring Driverless ‘Pod’ Travel into Singapore.” The Straits Times, April 20. Retrieved from http://www.straitstimes.com/singapore/transport/smrt-ties-up-with-dutch-company-in-plans-to-bring-driverless-pod-travel-into.
Liu, J., Kato, N., Ma, J., and Kadowaki, N. (2005). “Device-to-device Communication in LTE-Advanced Networks: A Survey.” IEEE Communication Surveys & Tutorials, 17(4).
Lohmann, R. (2007). “Personal Rapid Transit: Innovation Lasting.” Retrieved Decem-ber 11, 2015, from http://www.2getthere.eu/company/archive/papers/.
REFERENCES
FEDERAL TRANSIT ADMINISTRATION 239
Loy, G., and Barnes, N. (2004). “Fast Shape-based Road Sign Detection for a Driver Assistance System.” IEEE/RSJ International Conference on Intelligent Robots and Systems (IROS), 70-75.
LTA. (2016). AV Buses between NTU and CleanTech Park. Land Transport Author-ity. Retrieved December 7, 2016, from https://www.facebook.com/WeKeep-YourWorldMoving/posts/1208030822600485.
Lu, M., Wevers, K., and Van der Heijden, R. (2005). “Technical Feasibility of Advanced Driver Assistance Systems (ADAS) for Road Traffic Safety.” Transportation Plan-ning and Technology, 28(3).
Lutin, J. M., and Kornhauser, A. L. (2013). “Application of Autonomous Driving Tech-nology to Transit-Functional Capabilities for Safety and Capacity.” Presentation, TRB 93rd Annual Meeting, Washington, DC. January 14, 2014.
Maitipe, B. and Hayee, M. (2015). “Development and Field Demonstration of DS-RC-based V2I Traffic Information System for the Work Zone.” ITS Institute. Center for Transportation Studies, University of Minnesota.
MAN. (2017). Adaptive Cruise Control. MAN Truck & Bus AG. Retrieved from http://www.bus.man.eu/de/en/man-world/technology-and-competence/safe-ty-and-assistance-systems/adaptive-cruise-control/Adaptive-Cruise-Control.html.
Marino, R., Scalzi, S., and Netto, M. (2011). “Nested PID Steering Control for Lane Keeping in Autonomous Vehicles.” Control Engineering Practice, 19(12), 1459-1467.
Massa, D. P. (1999). “Choosing an Ultrasonic Sensor for Proximity or Distance Measurement, Part 1: Acoustic Considerations.” Sensors. Retrieved December 9, 2016, from http://archives.sensorsmag.com/articles/0299/acou0299/index.htm.
Mathas, C. (2011). “Inertial Sensor Overview—Performance, Size, and Power Ad-vantages.” Retrieved December 15, 2016, from http://www.digikey.com/en/ar-ticles/techzone/2011/may/inertial-sensor-overviewperformance-size-and-pow-er-advantages.
MBUSA. (2017a). Active Lane Keeping Assist. Retrieved January 2017 from https://www.mbusa.com/mercedes/technology/videos/detail/title-safety/videoId-e84b-9423c67a7410VgnVCM100000ccec1e35RCRD.
MBUSA. (2017b). Active Parking Assist. Retrieved January 2017 from https://www.mbusa.com/mercedes/technology/videos/detail/title-claclass/videoId-d165b-63245537410VgnVCM100000ccec1e35RCRD.
McCall, J., and Trivedi, M. (2006). “Video Based Lane Estimation and Tracking for Driver Assistance: Survey, System, and Evaluation.” IEEE Transactions on Intelli-gent Transportation Systems, 20-37.
Mercury Research. (2016). “Desktop GPU Average Selling Prices Rocket to New Record; Discrete Desktop GPU Shipments Continue On-Year Growth.” Mer-cury Research, August 22. Retrieved January 2017 from http://www.mercuryre-search.com/graphics-pr-2016-q3.pdf.
Meritor WABCO. (2013). Anti-Lock Braking System (ABS) and Electronic Stability Controls (ESC) For E Version ECUs 12-Volt and 24-Volt Systems. Retrieved from http://www.meritorwabco.com/MeritorWABCO_document/mm0112.pdf.
REFERENCES
FEDERAL TRANSIT ADMINISTRATION 240
Mir, Z. H., and Filali, F. (2014). “LTE and IEEE 802.11p for Vehicular Networking: A Performance Evaluation.” EURASIP Journal on Wireless Communications and Net-working, 89.
Mitchell, G. (2015). “Developing a Natural Gas-Powered Bus Rapid Transit Service: A Case Study.” National Renewable Energy Laboratory.
Mitsubishi Electric. (2016). Mobile Mapping System – High Accuracy GPS Mobile Measuring Equipment. Retrieved December 28, 2016, from http://www.mitsub-ishielectric.com/bu/mms/.
Mobileye. (2017). Our Technology. Retrieved January 2017 from www.mobileye.com/our-technology/.
Morgan Stanley. (2013). Autonomous Cars: Self-Driving the New Auto Industry Paradigm. Blue paper, November 6.
Morgan, Y. (2015). “Assessment of Alternative Precision Positioning Systems.” Inter-national Journal of Information Technology Convergence and Services (IJITCS), 5(5), 11-26.
Mori, G., Ren, X., Efros, A., and Malik, J. (2004). “Recovering Human Body Configu-rations: Combining Segmentation and Recognition.” Computer Vision and Pattern Recognition.
Moshchuk, N. K., Chen, S.-K., Zagorski, C. T., and Chatterjee, A. (2014). U.S. Patent No. 8,849,515. U.S. Patent and Trademark Office.
MTS. (2016). “MTS and University of Minnesota Deliver Driver Assistance System for ‘Bus on Shoulder’ Transportation.” Retrieved January 2017 from http://in-vestor.mts.com/phoenix.zhtml?c=68100&p=irol-newsArticle&ID=2185274.
Muncrief, R. L., Cruz, M., Ng, H., and Harold, M. (2012). “Impact of Auxiliary Loads on Fuel Economy and Emissions in Transit Bus Applications” (0148-7191). SAE Technical Paper.
Murphy, K. P. (2012). Machine Learning: A Probabilistic Perspective, 1st Edition. MIT Press.
Neloson, G. (2014). “Bosch to Sell Laser-based Radar by ’20.” Automotive News, August 4. Retrieved December 2016 from http://www.autonews.com/arti-cle/20140804/OEM10/308059989/bosch-to-sell-laser-based-radar-by-20.
Newcomb, D. (2015). “How Mapping Experts Keep Driverless Cars on the Road.” PC Magazine. Retrieved December 15, 2016, from http://www.pcmag.com/arti-cle2/0,2817,2494963,00.asp.
NGMN Alliance. (2015). “5G.” White paper. Retrieved January 10, 2017, from https://www.ngmn.org/fileadmin/ngmn/content/downloads/Technical/2015/NGMN_5G_White_Paper_V1_0.pdf.
NHTSA. (2014). Federal Motor Vehicle Safety Standards; Rear Visibility. National Highway Traffic Safety Administration. Retrieved January 2017 from https://www.federalregister.gov/documents/2014/04/07/2014-07469/federal-mo-tor-vehicle-safety-standards-rear-visibility.
NHTSA. (2016). “U.S. DOT Advances Deployment of Connected Vehicle Technol-ogy to Prevent Hundreds of Thousands of Crashes.” 49 CFR Part 571. Docket No. NHTSA-2016-0126, RIN 2127-AL55. Retrieved January 6, 2017, from www.nhtsa.gov/press-releases/us-dot-advances-deployment-connected-vehi-cle-technology-prevent-hundreds-thousands.
REFERENCES
FEDERAL TRANSIT ADMINISTRATION 241
Nissan. (2017a). Electro-Hydraulic Power Steering System. Retrieved January 2017 from http://www.nissan-global.com/EN/TECHNOLOGY/OVERVIEW/ehpss.html.
Nissan. (2017b). Forward Collision Avoidance Assist Concept. Retrieved January 2017 from http://www.nissan-global.com/EN/TECHNOLOGY/OVERVIEW/fcaac.html.
Nissan. (2017c). Nissan Commercial Vehicles: Cargo Vans, Work Vans, Utility Vans & Fleet Vehicles. Retrieved from http://www.nissancommercialvehicles.com/fleet/nissan/vehicles/detail/PTH/2017.
Nodine, E., Stevens, S., Najm, W. G., Jackson, C., and Lam, A. (2015). “Independent Evaluation of the Transit Retrofit Package Safety Applications.” Report. FHWA-JPO-14-175, Federal Highway Administration, USDOT, Washington, DC.
Nordrum, A. (2016). “Autonomous Driving Experts Weigh 5g Cellular Network Against Dedicated Short Range Communications.” IEEE Spectrum. Retrieved December 20, 2016, from http://spectrum.ieee.org/cars-that-think/trans-portation/self-driving/autonomous-driving-experts-weigh-5g-cellular-net-work-against-shortrange-communications-to-connect-cars.
Novariant. (2016). Vision Sensors. Retrieved December 2016 from http://www.no-variant.com/content/index.php/solutions-vision-sensors.
NovAtel. (2016a). An Introduction to GNSS. Retrieved December 7, 2016, from www.novatel.com/an-introduction-to-gnss/.
Nshimiyimana, A., Agrawal, D., and Arif, W. (2016). “Comprehensive Survey of V2V Communication for 4G Mobile and Wireless Technology.” IEEE WiSPNET 2016 Conference.
NTDA. (2014). “Meritor WABCO, Peloton, Denso to Showcase Technology at In-telligent Transportation Society’s World Congress.”
NVIDIA. (2016). What is GPU-Accelerated Computing? NVIDIA Website. Re-trieved December 2016 from http://www.nvidia.com/object/what-is-gpu-com-puting.html.
NVIDIA. (2017). DRIVE Automotive Technology. Retrieved January 2017 from http://www.nvidia.com/object/drive-automotive-technology.html.
NXP Semiconductors. (2011). Automotive Radar: High-Resolution 77 GHz radar. Retrieved from http://www.nxp.com/assets/documents/data/en/fact-sheets/AUTORADARFS.pdf.
NXP Semiconductors. (2014). Increasing Automotive Safety with 77/79GHz Radar Solutions for ADAS Applications. Retrieved December 2016 from http://cache.freescale.com/files/training/doc/ftf/2014/FTF-AUT-F0086.pdf.
Oberlander, K. (2015). “Inertial Measurement Unit (IMU) Technology: Inverse Kine-matics—Joint Considerations and the Math for Deriving Anatomical Angles.” Retrieved December 14, 2016, from http://www.noraxon.com/wp-content/uploads/2015/09/IMU-Tech-Report.pdf.
REFERENCES
FEDERAL TRANSIT ADMINISTRATION 242
Olsen, M., Roe, G., Gelnnie, C., Persi, F., Reedy, M., Hurwitz, D., Squellati, A., and Knodler, M. (2013). “Guidelines for the Use of Mobile LIDAR in Transportation Applications,” NCHRP Report #748. Retrieved December 2016 from http://onlinepubs.trb.org/onlinepubs/nchrp/nchrp_rpt_748.pdf.
Pang, C., Lam, W., and Yung, N. (2004). “A Novel Method for Resolving Vehicle Oc-clusion in a Monocular Traffic-Image Sequence.” IEEE Transactions on Intelligent Transportation Systems, 5(3), 129-141.
Paragios, N., and Ramesh, V. (2001). “A MRF-based Approach for Real-Time Subway Monitoring.” Proceedings of IEEE International Conference on Computer Vision and Pattern Recognition, 1, 1034-1040.
Parker, D. (2008). “TCRP Synthesis 73, AVL Systems for Bus Transit: Update.” Trans-portation Research Board, Washington, DC.
Paulo, C., and Correia, P. (2007). “Automatic Detection and Classification of Traffic Signs.” Image Analysis for Multimedia Interactive Services, WIAMIS ’07.
Pepperl+Fuchs. (2016). Vehicle Detection in Barrier Systems with Ultrasonic Sen-sors. Retrieved December 12, 2016, from http://www.pepperl-fuchs.us/usa/en/24814.htm.
Pessaro, B. (2015). “Evaluation of Automated Vehicle Technology in Transit.” NCTR Report BDV26 977-07, prepared for Florida Department of Transportation. Retrieved December 2016 from http://www.nctr.usf.edu/wp-content/up-loads/2015/09/77975-Evaluation-of-Automated-Vehicle-Technology-for-Transit.pdf.
Pessaro, B. (2016). “Evaluation of Automated Vehicle Technology in Transit—2016 Update.” NCTR Report 2117-9060-21, Center for Urban Transportation Re-search. Retrieved December 2016 from http://www.nctr.usf.edu/wp-content/uploads/2016/04/Evaluation-of-Automated-Vehicle-Technology-for-Tran-sit-2016-Update-UPDATED-FINAL.pdf.
Petovello, M., and O’Driscoll, C. (2010). “Carrier Phase and Its Measurement for GNSS.” InsideGNSS, July-August, 18-22. Retrieved December 27, 2016, from http://www.insidegnss.com/auto/julaug10-solutions.pdf.
Pierce Transit. (2017). “Pierce Transit Receives $1.66 Million Grant to Install Bus Safety Technology.” Retrieved January 2017 from http://www.piercetransit.org/news/?id=265.
Pocovi, G., Lauridsen, M., Soret, B., Pedersen, K.I., and Mogensen, P. (2016). “Auto-mation for On-Road Vehicles: Use Cases and Requirements for Radio Design.” 2015 IEEE 82nd Vehicular Technology Conference.
Popescu-Zeletin, R., Radusch, I., and Rigani, M. (2010). Vehicle-2-X Communication: State-of-the-Art Research in Mobile Vehicular ad hoc Networks. Berlin: Springer.
Purohit, K. (2015) “Connected Cars–Cellular Network, a Back-up of DSRC.” Retrieved December 20, 2016, from https://www.linkedin.com/pulse/connect-ed-cars-lbs-cellular-networks-backup-dsrc-purohit.
Qualcomm. (2016). Leading the Path towards 5G with LTE Advanced Pro. Re-trieved December 2016 from https://www.qualcomm.com/documents/leading-path-towards-5g-lte-advanced-pro.
Qualcomm. (2017). Snapdragon 820 Automotive. Retrieved January 2017 from https://www.qualcomm.com/products/snapdragon/processors/820-automotive.
REFERENCES
FEDERAL TRANSIT ADMINISTRATION 243
Rajaram, S. (2016). “Global Market for Machine Vision Technologies.” BCC Re-search, Wellesley, MA.
Ramsey, M. (2016). “Continental Buys Sensor Technology for Self-Driving Cars.” Wall Street Journal, March 3. Retrieved December 2016 from http://www.wsj.com/articles/continental-buys-sensor-technology-for-self-driv-ing-cars-1457042039.
Rappaport, T. S., Muhamed, R., Buehrer, M., and Doradla, A. (2000). “Mobile and Cel-lular Radio Communications.” The Engineering Handbook, R. C. Dort, Ed. CRC Press LLC.
Rasshofer, R., and Gresser, K. (2005). “Automotive Radar and Lidar Systems for Next Generation Driver Assistance Functions.” Advances in Radio Science 3, 2005-2009. Retrieved December 2016 from http://www.adv-radio-sci.net/3/205/2005/ars-3-205-2005.pdf.
Ren, X., Berg, A., and Malik, J. (2005). “Recovering Human Body Configurations Using Pairwise Constraints Between Parts.” IEEE International Conference on Computer Vision.
Rephlo, J., Miller, S., Haas, R., Saporta, H., Stock, D., Miller, D., Feast, L., and Brown, B. (2008). “Side Object Detection System Evaluation: Final Evaluation Report.”Science Applications International Corporation (SAIC). Retrieved December 9, 2016, from http://ntl.bts.gov/lib/30000/30700/30704/14461.pdf.
RITA (2011). “Technology Aids Bus Drivers on Narrow Shoulder Lanes.” Spotlight, January, U.S. Department of Transportation. Retrieved December 5, 2016, from http://www.rita.dot.gov/utc/publications/spotlight/2011_01/html/spot-light_1101.html.
Rockwell Automation. (2016). Ultrasonic Sensing. Retrieved De-cember 12, 2016, from http://www.ab.com/en/epub/cata-logs/12772/6543185/12041221/12041229/Ultrasonic-Sensing.html.
Ross, J. N. (2013). “Toyota Develops New Pre-Collision System with Steering As-sist.” AutoBlog. October 13. Retrieved January 2017 from http://www.autoblog.com/2013/10/13/toyota-pre-collision-system-steering-assist/.
Ross, P. (2015). “Cheap Lidar for Automatic Braking.” IEEE Spectrum, June 4. Re-trieved December 2016 from http://spectrum.ieee.org/cars-that-think/trans-portation/sensors/cheap-lidar-for-automatic-braking.
Rothhämel, M. (2012). US20120261208 A1. Patent.Ruta, A., Li, Y., and Liu, X. (2008). “Detection, Tracking and Recognition of Traffic
Signs from Video Input.” Proceedings of the 11th International IEEE Conference on Intelligent Transportation Systems, Beijing, China.
Ryu, K. (2013). “Effects of Pilot Injection Pressure on the Combustion and Emis-sions Characteristics in a Diesel Engine Using Biodiesel–CNG Dual Fuel.” En-ergy Conversion and Management, 76, 506-516.
SaberTek. (2016). Automotive Radar. Retrieved December 2016 from http://www.sabertek.com/automotive-radar.html.
Sakai, S.-I., and Hori, Y. (2001). “Advantage of Electric Motor for Anti-Skid Control of Electric Vehicle.” EPE Journal, 11(4), 26-32.
Sanborn (2016). Highly-Automated Driving (HAD) Maps for Autonomous Vehicles. Retrieved December 15, 2016, from http://www.sanborn.com/highly-automat-ed-driving-maps-for-autonomous-vehicles/.
REFERENCES
FEDERAL TRANSIT ADMINISTRATION 244
Sangtarash, F., Esfahanian, V., Nehzati, H., Haddadi, S., Bavanpour, M. A., and Hagh-panah, B. (2008). “Effect of Different Regenerative Braking Strategies on Braking Performance and Fuel Economy in a Hybrid Electric Bus Employing CRUISE Vehicle Simulation.” SAE International Journal of Fuels and Lubricants, 1(2008-01-1561), 828-837.
Schneier, M., and Bostelman, R. (2015). “Literature Review of Mobile Robots for Manufacturing.” NISTIR 8022. Washington, DC: National institute of Standards
and Technology, U.S. Department of Commerce.Schwarz, C., Thomas, G., Nelson, K., McCrary, M., and Schlarmann, N. (2013). “To-
wards Autonomous Vehicles.” Final Reports & Technical Briefs from Mid-America Transportation Center, 92. Retrieved from http://digitalcommons.unl.edu/matcre-ports/92.
Schweber, B. (2016) The Autonomous Car: A Diverse Array of Sensors Drive Navigation, Driving, and Performance. Mouser Electronics Website. Retrieved December 14, 2016, from http://www.mouser.com/applications/autono-mous-car-sensors-drive-performance/.
Schweiger, C. L. (2003). “TCRP Synthesis 48, Real-Time Bus Arrival Information Systems.” Transportation Research Board. Washington, DC.
Schweiger, C. L. (2016). “Module 7: Public Transportation.” ITS ePrimer. Retrieved January 9, 2017, from https://www.pcb.its.dot.gov/eprimer/module7.aspx.
Sebe, N., Cohen, I., Garg, A., and Huang, T. (2006). Machine Learning in Computer Vision: 29 (Computational Imaging and Vision). Springer.
Seif, H. G., and Hu, X. (2016). “Autonomous Driving in the iCity—HD Maps as a Key Challenge of the Automotive Industry.” Engineering, 2(2), 159-162. Re-trieved December 15, 2016, from http://www.sciencedirect.com/science/arti-cle/pii/S2095809916309432.
Seo, H., Lee, K., Yasukawa, S., Peng, Y., and Sartori, P. (2016). “LTE Evolution for Vehi-cle-to-Everything Services.” IEEE Communications Magazine, June.
Shapiro, D. (2016). Introducing Xavier, the NVIDIA AI Supercomputer for the Fu-ture of Autonomous Transportation. NVIDIA Website. Retrieved January 2017 from https://blogs.nvidia.com/blog/2016/09/28/xavier/.
Shladover, S., and Bishop, R. (2015). “Road Transport Automation as a Public-Pri-vate Enterprise.” EU-U.S. Symposium on Automated Vehicles, White Paper 1. Retrieved January 3, 2017, from http://www.ssti.us/wp/wp-content/up-loads/2015/10/2015-EU-US-Symposium-White-Paper-I_Public-Private-Enter-prise-002.pdf.
Shladover, S., Miller, M., Yin, Y., Balvanyos, T., Bernheim, L., Fishman, S., Amirouchi, F., Mahmudi, K., Gonzalez-Mohino, P., Solomon, J., Rawling, G., Iris, A., and Bozic, C. (2004). “Assessment of the Applicability of Cooperative Vehicle-HighwayAutomation Systems to Bus Transit and intermodal Freight: Case Study Fea-sibility Analyses in the Metropolitan Chicago Region.” Report No. UCB-ITS-PRR-2004-26, University of California at Berkeley, PATH Program.
Shladover, S., Zhang, W., Jamison, D., Carey, G., Viggiano, S., Angelillo, D., Cunradi, J., Sheehan, B., Schumacher, D., Oropeza, M., Hardy, M., Kulyk, W., and Gross, Y. (2007). “Lane Assist Systems for Bus Rapid Transit, Volume 1: Technology As-
REFERENCES
FEDERAL TRANSIT ADMINISTRATION 245
sessment. Report on Technical Visit to Europe on Electronic Guidance Technol-ogies. Final Report.” RTA 65A0160, University of California at Berkeley, PATH Program.
Siciliano, B., and Khatib, O. (eds). (2016). Springer Handbook of Robotics. Sickle, J. V., and Dutton, J. A. (2014). “Real-Time Kinematic and Differential GPS.”
Geography 862 Course: GPS and GNSS for Geospatial Professionals, College of Earth and Mineral Sciences, Pennsylvania State University. Retrieved De-cember 6, 2016, from https://www.e-education.psu.edu/geog862/node/1828.
Simpson, B. (2015). “Silicon Valley Buses Adopt DSRC and V2I to Speed Rides, Cut Fuel Use.” Driverless Transportation. Retrieved January 3, 2017, from http://www.driverlesstransportation.com/silicon-valley-buses-adopt-dsrc-and-v2i-to-speed-rides-cut-fuel-use-11041.
Sivaraman, S., and Manubhai, M. (2013). “Looking at Vehicles on the Road: A Survey of Vision-Based Vehicle Detection, Tracking, and Behavioral Analysis.” IEEE Trans-actions on Intelligent Transportation Systems, 14(4).
Soezean, M. (2016). “LTA: First Driverless Bus Trial in Jurong.” The Online Citizen, October 19. Retrieved from http://www.theonlinecitizen.com/2016/10/19/lta-first-driverless-bus-trial-in-jurong/.
Song, X., and Nevatia, R. (2005). “A Model-based Vehicle Segmentation Method for Tracking.” Proceedings of IEEE International Conference on Computer Vision, 2, 1124-1131.
Southhall, J., and Taylor, C. (2001). “Stochastic Road Shape Estimation.” IEEE Interna-tional Conference on Computer Vision, 205–212.
Srinivasan, P., and Shi, J. (2007). “Bottom-up Recognition and Parsing of the Human Body.” Computer Vision and Pattern Recognition.
Stahn, R., Heiserich, G., and Stopp, A. (2007). “Laser Scanner-Based Navigation for Commercial Vehicles.” Paper presented at IEEE Intelligent Vehicles Symposium, 2007.
Stanton, R. (2014). “Hybrid Bus Dilemma: AAATA Not Sure Environmental Benefits Justify Extra Cost.” MLive. Retrieved from http://www.mlive.com/news/ann-ar-bor/index.ssf/2014/10/hybrid_buses_aaata.html.
Stauffer, C., and Grimson, W. (2000). “Learning Patterns of Activity Using Real-Time Tracking.” IEEE Transactions on Pattern Analysis and Machine Intelligence, 22, 747-757.
Stevenson, R. (2011). “Long-Distance Car Radar.” IEEE Spectrum, September 29. Retrieved December 2016 from http://spectrum.ieee.org/transportation/ad-vanced-cars/longdistance-car-radar.
Subaru. (2016). Subaru EyeSight: Driver Assist Technology. Retrieved December 2016 from http://www.subaru.com/engineering/eyesight.html#Legacy.
Sun, T., Tsai, S. and V. Chan. (2006). “HSI Color Model Based Lane Marking Detec-tion.” IEEE Intelligent Transportation Systems Conference, 1168–1172.
REFERENCES
FEDERAL TRANSIT ADMINISTRATION 246
Sun, Z., Benis, G., and Miller, R. (2006). “On-Road Vehicle Detection: A Review.” IEEE Transactions on Pattern Analysis and Machine Intelligence, 28(5). Retrieved December 2016 from http://ieeexplore.ieee.org/stamp/stamp.jsp?arnum-ber=1608034.
Tan, H.-S., Huang, J., and Zhang, W.-B. (2014). “Field Operational Tests of Transit Ve-hicle Assist and
Automation Technologies.” Intellimotion: Keeping up with California PATH Research in Intelligent Transportation Systems, 19(1), 5-9. Retrieved February 2017 from http://www.path.berkeley.edu/sites/default/files/documents/FINAL%20Intel-limotion%20FY2014%20Draft%2010%20SPREAD-12172014.pdf.
Tan, H.-S., and Huang, J. (2006). “DGPS-Based Vehicle-to-Vehicle Cooperative Col-lision Warning: Engineering Feasibility Viewpoints.” IEEE Transaction on Intelligent Transportation Systems, 7(4), 415-428.
Tan, H.-S., Bu, F., Johnston, S., Bougler, B., Zhang, W.-B., & Sun, S. (2009). “Field Demonstration and Tests of Lane Assist/Guidance and Precision Docking Tech-nology.” California PATH Program, Institute of Transportation Studies, Univer-sity of California Berkeley. Retrieved January 2017 from https://merritt.cdlib.org/d/ark%3A%2F13030%2Fm5rj4kh0/2/producer%2FPRR-2009-12.pdf.
Tang, A., and Yip, A. (2010). “Collision Avoidance Timing Analysis of DSRC-based Ve-hicles.” Accident Analysis & Prevention, 42(1), 182-195.
TDL (2006). Heavy-Duty Truck Sytems Chapter 25. Retrieved from http://www.augusta.k12.va.us/cms/lib01/VA01000173/Centricity/Domain/1902/Chap-ter_25-Bennet.ppt.
Techcrunch. (2016). “Comma.ai Cancels the Comma One Following NHTSA let-ter.” Retrieved January 10, 2017, from https://techcrunch.com/2016/10/28/comma-ai-cancels-the-comma-one-following-nhtsa-letter/.
Technavio. (2016a). Top Companies in the Global Automotive Lidar Sensor Market. Retrieved December 2016 from http://www.technavio.com/blog/top-compa-
nies-global-automotive-lidar-sensors-market. Technavio. (2016b). Global Inertial Measurement Unit Sensors Market 2016-2020.
Accessed January 26, 2017, from http://www.technavio.com/report/glob-al-automotive-electronics-global-automotive-inertial-measurement-unit-sen-sors-market-2016.
Teichman, A., and Thrun, S. 2011. “Practical Object Recognition in Autonomous Driving and Beyond.” Retrieved January 2017 from http://cs.stanford.edu/peo-ple/teichman/papers/arso2011.pdf.
Teledyne DALSA. (2016). CCD vs. CMOS. Retrieved December 2016 from https://www.teledynedalsa.com/imaging/knowledge-center/appnotes/ccd-vs-cmos/.
Tesla. (2016). Upgrading Autopilot: Seeing the World in Radar. Tesla Motors Website. September 11, 2016. Retrieved December 2016, from https://www.tesla.com/blog/upgrading-autopilot-seeing-world-radar.
Tesla. (2017). Tesla Motors Website. Retrieved January 2017 from https://www.tes-la.com/.
Thamma, R. (2004). “Theory and Prediction of Position Error for Automated Guided Vehicles with Ultrasonic Sending Based on Time-of-Flight Theory.” Ph.D. dissertation, Iowa State University. Retrieved December 11, 2016, from
REFERENCES
FEDERAL TRANSIT ADMINISTRATION 247
https://books.google.com/books?id=rVATEq6VD8IC&pg=PA10&lpg=PA10&d-q=wire+guided+systems+1980s&source=bl&ots=Lt6_jEzzEC&sig=szyO8fdW-zpdRjGtBlUT7RzzWsq4&hl=en&sa=X&ved=0ahUKEwjU4_qNlu3QAhUL-q1QKHUuKAzoQ6AEIOzAG#v=onepage&q=wire%20guided%20systems%201980s&f=false.
Thorpe, C., Jochem, T., and Pomerleau, D. (1997). “Automated Highways and the Free Agent Demonstration.” Robotics Research: The Eighth International Sym-posium (Shirai and Hirose, eds.).
Tilley, A. (2016). “New Qualcomm Chip Brings Deep Learning to Cars.” Forbes, January 5. Retrieved December 2016 from http://www.forbes.com/sites/aaron-tilley/2016/01/05/along-with-nvidia-new-qualcomm-chip-brings-deep-learning-to-cars/#54d7caa75357.
TomTom. (2016). Highly Detailed Map: Info Sheet RoadDNA. TomTom International BV Website. Retrieved December 14, 2016 from http://automotive.tomtom.com/en/highly-automated-driving/highly-detailed-map.
Toyota. (2009). “TMC Develops Onboard DSRC Unit to Improve Traffic Safety—Vehicle-Infrastructure Communications Aid Driver.” Press Release. Toyota Motor Corporation. Retrieved December 20, 2016, from http://www2.toyota.co.jp/en/news/09/09/0903.html.
Toyota. (2017a). Toyota Parking Aid Systems. Retrieved January 2017 from https://www.toyota-europe.com/world-of-toyota/safety-technology/parking-aids.
Toyota. (2017b). Toyota Safety Sense. Retrieved January 2017 from http://www.toy-ota.com/safety-sense/.
Tsugawa, S. (2008). “A History of Automated Highway Systems in Japan and Future Issues.” Paper presented at IEEE International Conference on Vehicular Elec-tronics and Safety (ICVES 2008).
Tsugawa, S., Kato, S., and Aoki, K. (2011). “An Automated Truck Platoon for Energy Saving.” Paper presented at 2011 IEEE/RSJ International Conference on Intelli-gent Robots and Systems. September 25-30, 2011.
TTT. (2016a). “Joint Venture to Launch Automated Vehicle System in Singapore.” Traffic Technology Today. Retrieved November 20, 2016, from http://www.traf-fictechnologytoday.com/news.php?NewsID=78990.
TTT. (2016b) “WABCO Announces New Partnerships and Systems Paving the Way for Autonomous Trucks.” Traffic Technology Today, September 22. Retrieved from http://traffictechnologytoday.com/news.php?NewsID=81599.
Ung, G. (2016). “AMD Chases the AI Trend with Its Radeon Instinct GPUs for Ma-chine Learning.” PC World, December 12. Retrieved January 2016 from http://www.pcworld.com/article/3148693/hardware/amd-announces-radeon-instinct-gpus-and-jumps-into-the-deep-learning-game.html.
University of Minnesota. (2017). “Bus Rapid Transit.” ITS Institute, University Min-nesota. Retrieved January 2017 from http://www.its.umn.edu/Research/Fea-turedStudies/brt/index.html.
REFERENCES
FEDERAL TRANSIT ADMINISTRATION 248
USDOT. (2015). “Status of the Dedicated Short-Range Communications Technol-ogy and Applications: Report to Congress.” FHWA-JPO-15-218. Produced by Volpe National Transportation Systems Center, Cambridge, MA, for Federal Highway Administration, USDOT, Washington, DC.
Vahidi, A., and Eskandarian, A. (2003). “Research Advances in Intelligent Collision Avoidance and Adaptive Cruise Control.” IEEE Transactions on Intelligent Trans-
portation Systems, 4(3), 143-153. Valeo. (2015). LaneGuide. Retrieved December 2016 from https://www.valeo.com/en/laneguide/.Varghese, J., and Boone, R. (2015). “Overview of Autonomous Vehicle Sensors and
Systems.” Proceedings of 2015 International Conference on Operations Excellence and Service Engineering. Retrieved December 14, 2016, from http://ieomsociety.org/IEOM_Orlnado_2015/papers/140.pdf.
VBOX (2016). VBOX Inertial Measurement Unit. Retrieved December 2016 from http://www.vboxautomotive.co.uk/index.php/en/products/modules/iner-tial-measurement-unit.
VDC Research. (2014). “Business-critical Communications: Benefits of Selecting Two-way Radios over Cellular Phones.” Motorola Solutions. Retrieved January 10, 2017, from http://www.motorolasolutions.com/content/dam/msi/docs/busi-ness/_documents/_staticfiles/vdc_benefits_of_digital_radios.pdf.
Vectornav. (2016). Inertial Measurement Units and Inertial Navigation. Retrieved December 2016 from http://www.vectornav.com/support/library/imu-and-ins.
Velodyne. (2016). Velodyne Lidar Website. Retrieved December 2016 from http://velodynelidar.com/.
VIA Metropolitan Transit. (2015). “VIA Expands WiFi to Entire Fleet and Facilities.” Retrieved January 10, 2017, from https://www.prnewswire.com/news-
releases/via-expands-wifi-connections-becomes-first-large-public-transportation-provider-in-the-nation-to-offer-wifi-throughout-its-fleet-and-facilities-300135826.html.Vincent, D. (2013). “Accurate Position Tracking using Inertial Measurement Units.”
PNI White Paper, written in association with Miami University. Retrieved De-cember 15, 2016, from https://www.pnicorp.com/wp-content/uploads/Accu-rate-PositionTracking-Using-IMUs.pdf.
Viola, P., and Jones, M. (2001). “Rapid Object Detection Using a Boosted Cascade of Simple Features.” Computer Vision and Pattern Recognition.
Volvo. (2014). “Volvo Car Group Tests Road Magnets for Accurate Positioning of Self-driving Cars.” Retrieved from https://www.media.volvocars.com/us/en-us/media/pressreleases/140760/volvo-car-group-tests-road-magnets-for-accurate-positioning-of-self-driving-cars.
Volvo. (2017a). City Safety by Volvo Cars – Outstanding Crash Prevention That Is Standard in the All-new XC90. Retrieved January 2017 from https://www.me-dia.volvocars.com/us/en-us/media/pressreleases/154717/city-safety-by-volvo-cars-outstanding-crash-prevention-that-is-standard-in-the-all-new-xc90.
Volvo. (2017b). Collision Warning System. Retrieved from http://support.volvocars.com/uk/cars/Pages/owners-manual.aspx?mc=Y556&my=2015&sw=14w46&ar-ticle=c2aa4a930c8b6746c0a801e801ce49be.
REFERENCES
FEDERAL TRANSIT ADMINISTRATION 249
Volvo. (2017c). Volvo Buses. Retrieved from http://www.volvobuses.com/bus/global/en-gb/_layouts/CWP.Internet.VolvoCom/NewsItem.aspx?News.ItemId=148011&News.Language=en-gb.
VW. (2016). Adaptive Cruise Control (ACC). Retrieved from http://www.volkswa-gen.co.uk/technology/adaptive-cruise-control-acc.
VW. (2017a). ESP Electronic Stability Programme Design and Function. Volkswagen AG.
VW. (2017b). Volkswagen Driver Assistance Systems. Retrieved from http://www.volkswagen-commercial-vehicles.com/en/models/multivan/highlights.suffix.html/uspCategories~2Fuspcategory_4.html.
WABCO. (2017a). Advanced Driver Assistance Systems. Retrieved February 2, 2017, from http://www.wabco-auto.com/en/products/category-type/ad-vanced-driver-assistance-systems/.
WABCO. (2017b). Adaptive Cruise Control (ACC). Retrieved January 2017 from http://www.wabco-auto.com/products/category-type/advanced-driver-assis-tance-systems/onguard-family/adaptive-cruise-control-acc/.
WABCO. (2017c). New Generation Adaptive Cruise Control (ACC) for Trucks and Buses from WABCO and Continental Temic. Retrieved January 2017 from http://www.wabco-auto.com/fr/media/media-center/communiques-de-presse/press-releases-single-view/news-article/new-generation-adaptive-cruise-con-trol-acc-for-trucks-and-buses-from-wabco-and-continental-temic/.
Wagner, J., Baker, T., Goodin, G., and Maddox, J. (2014). “Automated Vehicles: Policy Implications Scoping Study.” Report No. SWUTC/14/600451-00029-1.
Wagner, J. (2013). Original photograph. Palo Alto, CA. Walker, J. (2014). “Vehicle Automation and the Future of Transit.” Human Transit.
Retrieved January 3, 2017, from http://humantransit.org/2014/03/guest-post-vehicle-automation-and-the-future-of-transit.html.
Walter, M., Nitzsche, N., Odenthal, D., and Muller, S. (2014). “Lateral Vehicle Guid-ance Control for Autonomous and Cooperative Driving.” Paper presented at the European Control Conference (ECC), 2014.
Wang, C., Thorpe, C., and Thrun, S. (2003). “Online Simultaneous Localization and Mapping with Detection and Tracking of Moving Objects: Theory and Results from a Ground Vehicle in Crowded Urban Areas.” Proceedings of the IEEE In-ternational Conference on Robotics and Automation, 2003 (ICRA’03). Retrieved December 15, 2016, from http://ieeexplore.ieee.org/document/1241698/?ar-number=1241698&tag=1.
Wang, C.-X., Haider, F., Gao, X., You, X.-H., Yang, Y., Yuan, D., Aggoune, H., Haas, H., Fletcher, S., and Hepsaydir, E. (2014). “Cellular Architecture and Key Technolo-gies for 5G Wireless Communication Networks.” IEEE Communications Maga-zine, 122-130.
Wang, Y., Teoh, E., and Shen, D. (2004). “Lane Detection and Tracking Using B-Snake.” Image and Vision Computing, 269–280.
Waymo. (2017). Waymo Website. Retrieved January 2017 from https://waymo.com/.
Wedel, A., Meiner, A., Rabe, C., Franke, U., and Cremers, D. (2009). “Detection and Segmentation of Independently Moving Objects from Dense Scene Flow.” In
REFERENCES
FEDERAL TRANSIT ADMINISTRATION 250
Energy Minimization Methods in Computer Vision and Pattern Recognition, 14–27. Springer.
Wei, J., Snider, J. M., Gu, T., Dolan, J. M., & Litkouhi, B. (2014). “A Behavioral Planning Framework for Autonomous Driving.” Paper presented at the 2014 IEEE Intel-ligent Vehicles Symposium, June 8-11, 2014.
Wei, J., Snider, J. M., Kim, J., Dolan, J. M., Rajkumar, R., & Litkouhi, B. (2013). “Towards a Viable Autonomous Driving Research Platform.” Paper presented at the IEEE Intelligent Vehicles Symposium (IV), 2013.
WEpods. 2016. About WEpods. Retrieved December 2016 from http://wepods.com/about-wepods/.
Wilson Amplifiers. (2016). 5G: What You Need To Know. Retrieved January 5, 2017 from https://www.wilsonamplifiers.com/blog/5g-what-you-need-to-know/.
Wiora, G.. (2005). File: Sonar Principle EN.svg. Wikimedia Commons. Retrieved December 12, 2016, from https://commons.wikimedia.org/wiki/File:Sonar_Principle_EN.svg.
Woodman, O. (2007). “An Introduction to Inertial Navigation.” Technical Report, University of Cambridge, Computer Laboratory, UCAM-CL-TR-696. Retrieved December 15, 2016, from http://ieomsociety.org/IEOM_Orlnado_2015/pa-pers/140.pdf.
Woyke, E. (2016). “The Pint-Sized Supercomputer That Companies are Scrambling to Get.” Technology Review, December 14. Retrieved December 2016 from https://www.technologyreview.com/s/603075/the-pint-sized-supercomputer-that-companies-are-scrambling-to-get/.
Wren, C., Azarbaygaui, A., Darrell, T., and Pentland, A. (1997). “Pfinder: Real-time Tracking of the Human Body.” IEEE Transactions on Pattern Analysis and Machine Intelligence, 19, 780-785.
Wright J., Garrett, K., Hill, C., Krueger, G., Evans, J., Andrews, S., Wilson, C., Ra-jbhandari, R., and Burkhard, B. (2014). “National Connected Vehicle Field Infra-structure Footprint Analysis, Final Report.” FHWA-JPO-14-125. Washington, DC: FHWA.
X-Drive B.V. (2017). X-steering Website. Retrieved January 2017 from https://ww-w.x-steering.com/.
Xu, C., Song, L, and Han, Z. (2013). Resource Management for Device-to-Device Under-lay Communication. Springer.
Xu, G., Li, W., Xu, K., and Song, Z. (2011). “An Intelligent Regenerative Braking Strategy for Electric Vehicles.” Energies, 4(9), 1461-1477.
Xu, J., Chen, G., and Xie, M. (2000). “Vision-guided Automatic Parking for Smart Car.” Paper presented at the IEEE Intelligent Vehicles Symposium (IV), 2000.
Yang, A. A., and Chen, G. C. (2016). US20160280260 A1. Patent.Yap, J. (2016). “Sh** Is Getting Real: SMRT Is Introducing 24-Seaters Driverless
Cars End of this Year in Singapore.” Vulcan Post. Retrieved December 6, 2016, from https://vulcanpost.com/573390/shit-is-getting-real-smrt-is-bringing-in-24-seaters-driverless-cars-end-of-this-year-in-singapore/.
Yi, S., Chen, Y., and Chang, C. (2015). “A Lane Detection Approach Based on Intelli-gent Vision.” Computers and Electrical Engineering, 42, 23–29.
Yu, B. and Jain, A. (1997). “Lane Boundary Detection Using a Multiresolution Hough Transform.” Proceedings of International Conference on Image Processing (ICIP), 2, 748–751.
Yu, J. and Li, S. E. (2016). “Dynamical Tracking of Surrounding Objects for Road Vehi-cles Using Linearly-Arrayed Ultrasonic Sensors.” 2016 IEEE Intelligent Vehicles Symposium (IV).
Yvkoff, L. (2016). “Quanenergy, Backed by Delphi, Quietly Joins the Unicorn Club. ” Forbes, August 24. Retrieved December 2016 from https://www.forbes.com/sites/
lianeyvkoff/2016/08/24/quanergy-joins-the-unicorn-club/#af07370194f6. Zanjireh, M., and Larijani, H. (2015) “A Survey on Centralised and Distributed Clus-
tering Routing Algorithms for WSNs.” IEEE 81st Vehicular Technology Con-ference. Retrieved December 20, 2016, from https://www.researchgate.net/publication/274638337_A_Survey_on_Centralised_and_Distributed_Cluster-ing_Routing_Algorithms_for_WSNs.
Zeraoulia, M., Benbouzid, M. E. H., and Diallo, D. (2006). “Electric Motor Drive Se-lection Issues for HEV Propulsion Systems: A Comparative Study.” IEEE Transac-tions on Vehicular Technology, 55(6), 1756-1764.
Zeynep, A., Perronnin, F., Harchaoui, Z., and Schmid, C. (2014). “Good Practice in Large-Scale Learning for Image Classification.” IEEE Transactions on Pattern Anal-ysis and Machine Intelligence, 36(3). Retrieved January 2017 from http://ieeex-plore.ieee.org/document/6574852/?arnumber=6574852&tag=1.
ZF. (2017a). “ZF and NVIDIA Announce Artificial Intelligence System for Autono- mous Cars, Trucks and Industrial Applications.” Retrieved January 2017 from http://www.zf.com/corporate/en_de/press/list/release/release_29147.html. ZF. (2017b). ReAX Electrically Assisted Hydraulic Steering - Gear Mounted. Re-
trieved January 2017 from http://www.zf.com/corporate/en_de/products/prod-uct_range/buses/trucks_css_reax_gear_mounted.shtml.
Zhang, Y., Owen, L., and Clark, J. (1998). “Multiregime Approach for Microscopic Traffic Simulation.” Transportation Research Record, 1644, 103-114.
Zhao, L., and Davis, L. (2005). “Closely Coupled Object Detection and Segmenta-tion.” IEEE International Conference on Computer Vision.
Zhislina, V. (2014). Why has CPU Frequency Ceased to Grow? Retrieved December 2016 from https://software.intel.com/en-us/blogs/2014/02/19/why-has-cpu-fre-quency-ceased-to-grow.
Zhou, L., Pan, S., Wang, J., and Vasilakos, A. (2017). “Machine Learning on Big Data: Opportunities and Challenges.” Neurocomputing. in press.
Zimmer, R. E., Burt, M., Zink, G. J., Valentine, D. A., Knox, W. J. Jr. (2014). “Transit Safety Retrofit Package Development Final Report.” Report No. FHWA-JPO-14-142, Federal Highway Administration, USDOT, Washington, DC.
U.S. Department of TransportationFederal Transit Administration
East Building1200 New Jersey Avenue, SE
Washington, DC 20590https://www.transit.dot.gov/about/research-innovation