Embed Size (px)
Citation preview

STRATEGIC RESPONSES ADOPTED BY COMMERCIAL BANKS TO
ENHANCE MARKET PENETRATION OF THE UNBANKED POPULATION
IN KENYA
OKELLO ELVIS GILBERTS OPICHE
A RESEARCH PROJECT SUBMITTED IN PARTIAL
FULFILLMENT OF THE REQUIREMENTS FOR THE AWARD
OF THE DEGREE OF MASTER OF BUSINESS
ADMINISTRATION, SCHOOL OF BUSINESS, UNIVERSITY OF
NAIROBI
2014

ii
DECLARARATION
This research project is my original work and has not been submitted for examination
to any other university.
Signature _________________ Date _______________
OKELLO ELVIS GILBERTS OPICHE
D61/60238/2010
This research project has been submitted for examination with my approval as the
University Supervisor.
Signature _________________ Date _______________
DR. MARY W. KINOTI
SENIOR LECTURER
DEPARTMENT OF BUSINESS ADMINISTRATION
SCHOOL OF BUSINESS
UNIVERSITY OF NAIROBI

iii
ACKNOWLEDGEMENTS
First and foremost, I would like to thank the Almighty God for this far He has brought
me. It is not lost to me, even for one moment, that God is able to do exceedingly and
abundantly above all that we ask or think. Ephesians 3:20. For His unending Grace
and Blessings, I am eternally Grateful.
To my friends and family – 'One looks back with appreciation to brilliant teachers, but
with gratitude to those who touched our human feelings. Curriculums are so much
necessary raw material, but warmth family and friends are the vital element for the
soul,' Unknown. Thank you.
My sincere gratitude goes to my supervisor Dr. Mary W. Kinoti whose patient and
brilliant guidance will never cease to amaze me.
To my Boss and work colleagues. Thank you for enduring all my leaves of absence
and constant barrage of ideas. In spite of the numerous inconveniences, you went out
of your way to accommodate me each and every day, for the entire duration of this
study.
And finally, my respondents are my heroes for making this study possible. Without
your insights, input and ideas, this paper would never have seen the light of day.
Thank you for giving me so much.

iv
DEDICATION
This study is dedicated to my late Mother who got her Angel wings too soon. A wise
man once said, 'Offspring are the living messages we send to a time we will not see'.

v
ABSTRACT
The business environment is constantly changing and has shifted considerably over
the past several years, presenting both; Threats and Opportunities to the banking
sector in Kenya. In light of this dynamic landscape, commercial banks must manage
rapid environmental changes and make difficult decisions in order to survive, navigate
and compete effectively in the Kenyan banking industry. Organizations need to create
and implement an effective strategy in order to excel in today's marketplace. While
setting and implementing strategy is never easy, organizations that make the
investment in time, effort, and thinking are better equipped to excel in the
marketplace and outperform their competitors. On the other hand, the quest for
financial inclusion is generating a lot of interest, not just in Kenya but throughout
developing economies. Financial exclusion is thus a key policy concern, because the
options for operating a household budget, or an enterprise, without mainstream
financial services can often be expensive. This study sought to determine what
strategic responses commercial banks are adopting in order to reach the unbanked
population in Kenya and the influence of these strategic responses on enhancing
market penetration of the unbanked population in the country. The descriptive
research design was used for the purpose of this study, which allows the researcher to
describe the phenomena under study. The population of this study was drawn from the
Heads of strategy or their equivalent in 43 commercial banks registered and licensed
under the Banking Act of Kenya as at June 2014. Primary and Secondary data were
used for the purpose of this study. Primary data sources were through self-
administered drop and pick questionnaires for quantitative and qualitative data.
Secondary data sources, Articles, books, Newspapers, the internet, journals and
magazines were also used where the banks had granted interviews on their
competitive strategies. The data collected was edited for completeness and accuracy,
coded and entered in SPSS for analysis. Descriptive statistics were used to understand
the characteristics and relationship between the established strategic responses and
market penetration of the unbanked population in Kenya. Statistical tests such as
independent sample t-test and ANOVA were used to analyse the differences in the
data. Correlation and simple regression models were also used to understand the
relationship between the dependent and the independent variables. The study
concluded that Commercial banks employed strategic responses like, Market
Segmentation, Mobile Banking, Agency Banking and Microfinance to reach the
unbanked population in the country. This is testament to the fact that Commercial
banks were indeed, embracing technological advances to get around cost barriers and
help in reaching customers where they are located - overcoming infrastructural
deficiencies and costs involved in physically reaching out to clients. Organizational
strategy is one of the broadest and most complex concepts used in studying
organizations. Many, if not most, organizations simultaneously pursue a combination
of two or more strategies, but a combination strategy can be exceptionally risky if
carried too far. No organization can afford to pursue all the strategies that might
benefit the organization. Difficult decisions must be made and priorities established.
In short, organizations just like individuals have limited resources.

vi
TABLE OF CONTENTS
DECLARARATION.................................................................................................................. ii
ACKNOWLEDGEMENTS ...................................................................................................... iii
DEDICATION .......................................................................................................................... iv
ABSTRACT ............................................................................................................................... v
LIST OF ACRONYMS ............................................................................................................ ix
CHAPTER ONE: INTRODUCTION .................................................................................... 1
1.1 Background of the Study ................................................................................................ 1
1.1.1 The Concept of Strategy .......................................................................................... 2
1.1.2 The Concept of Strategic Response......................................................................... 3
1.1.3 The Concept of Market Penetration ........................................................................ 5
1.1.4 The Unbanked Population in Kenya ....................................................................... 6
1.1.5 The Banking Industry in Kenya .............................................................................. 7
1.1.6 Commercial Banks in Kenya ................................................................................... 8
1.2 Research Problem ........................................................................................................... 9
1.3 Research Objectives ..................................................................................................... 10
1.4 Value of The Study ....................................................................................................... 11
CHAPTER TWO: LITERATURE REVIEW ..................................................................... 12
2.1 Introduction .................................................................................................................. 12
2.2 Theoretical Foundation of the Study ............................................................................ 12
2.2.1 Resource Based Theory ......................................................................................... 12
2.2.2 Resource Dependence Theory ............................................................................... 13
2.3 Types of Strategies ....................................................................................................... 14
2.3.1 Hierarchical Levels of Strategy ............................................................................. 14
2.3.2 Ansoff’s Product-Market Growth Matrix Strategies ............................................. 16
2.3.3 Michael Porter’s five Generic Strategies ............................................................... 17
2.4 Strategy and Market Penetration .................................................................................. 19
CHAPTER THREE: RESEARCH METHODOLOGY .................................................... 21
3.1 Introduction .................................................................................................................. 21
3.2 Research Design ........................................................................................................... 21
3.3 Population of the Study ................................................................................................ 21
3.5 Data Collection Methods .............................................................................................. 21
3.6 Data Analysis ................................................................................................................ 22
CHAPTER FOUR: DATA ANALYSIS, RESULTS AND DISCUSSION ........................ 23
4.1 Introduction ................................................................................................................... 23
4.1.1 Response rate ......................................................................................................... 23
4.2 Demographic Characteristics of the respondents .......................................................... 23

vii
4.2.1 The respondents Job Role or Title .......................................................................... 23
4.2.2 Experience of the Respondents .............................................................................. 24
4.2.3 Level of the respondents Involvement in Strategy formulation process ................ 24
4.3 Background Information of the Commercial Banks ...................................................... 25
4.3.1 Size of Commercial Banks ..................................................................................... 25
4.3.2 Innovation and Commercial Banks ........................................................................ 25
4.4 Strategic Responses to enhance the Market Penetration of the Unbanked .................... 25
4.4.1 Strategic Responses Adopted by Commercial Banks ............................................ 26
4.4.2 Factors influencing Commercial banks' strategic responses .................................. 28
4.5 Market Penetration of Unbanked Populations in Kenya ............................................... 29
4.5.1 Customer Attrition.................................................................................................. 29
4.5.2 Customer Growth ................................................................................................... 29
4.5.3 Classification of newly acquired customers ........................................................... 30
4.5.4 Main Market segments targeted by Commercial Banks......................................... 31
4.5.5 Alternative financial channels used by the unbanked population .......................... 31
4.6 Influence of Strategy on Market Penetration of the unbanked population .................... 33
4.6.1 Impact of Strategy on Market Penetration of the unbanked population ................. 33
4.6.2 Correlation Analysis ............................................................................................... 33
4.6.3 Regression Analysis ............................................................................................... 35
CHAPTER FIVE: SUMMARY, CONCLUSION AND RECOMMENDATIONS ......... 38
5.1 Introduction ................................................................................................................... 38
5.2 Summary and Discussion of the Findings ..................................................................... 38
5.2.1 Strategic Responses Adopted by Commercial Banks ............................................ 38
5.2.2 Market Penetration of the Unbanked Population ................................................... 40
5.2.3 Influence of Strategy on Market Penetration ......................................................... 41
5.3 Conclusion ..................................................................................................................... 42
5.4 Recommendations from the Study ................................................................................ 44
5.5 Limitations of the Study ................................................................................................ 45
5.6 Recommendations for further Studies ........................................................................... 45
REFERENCES ....................................................................................................................... 46
APPENDICES ........................................................................................................................ 52
Appendix I: List of Commercial Banks in Kenya ............................................................... 52
Appendix II: Research Questionnaire .................................................................................. 53

viii
LIST OF TABLES
Table 4. 1: The respondents’ length of service in their Current Positions ............................... 24
Table 4. 2: Level of the respondents Involvement in the Strategy Formulation Process of
Commercial banks ................................................................................................ 24
Table 4. 3: Classification of Commercial Banks by size ......................................................... 25
Table 4. 4: Whether Commercial banks encourage innovation ............................................... 25
Table 4. 5: Strategic responses adopted by commercial banks to reach unbanked populations
.............................................................................................................................. 26
Table 4. 6: Customer perceptions that drive Commercial banks' strategic responses to reach
unbanked populations in the country .................................................................... 28
Table 4. 7: Customers lost in the last five years ...................................................................... 29
Table 4. 8: Customers acquired in the last five years .............................................................. 29
Table 4. 9: Classification of newly acquired customers .......................................................... 30
Table 4. 10: Main market segments targeted by strategic responses adopted by Commercial
Banks to reach unbanked populations in Kenya ................................................... 31
Table 4. 11: Alternative financial channels that majority of unbanked populations tend to use
.............................................................................................................................. 32
Table 4. 12: Whether the strategies used by Commercial banks succeeded in enhancing
market penetration of unbanked populations ....................................................... 33
Table 4. 13: Correlation Matrix .............................................................................................. 34
Table 4. 14: Model Summary .................................................................................................. 35
Table 4. 15: Summary of One-Way ANOVA results .............................................................. 36
Table 4. 16: Regression coefficients of the relationship between strategic responses adopted
by commercial banks and market penetration of the unbanked population in
Kenya ................................................................................................................... 36

ix
LIST OF ACRONYMS
CBK Central Bank of Kenya
FSD Financial Sector Deeping
KBA Kenya Bankers Association
HDFC Housing Development Finance Corporation
SME Small and Medium Enterprises
CAK Communication Authority of Kenya
R & D Research and Development
ANOVA Analysis of Variance
MFI’s Microfinance.Institutions

1
CHAPTER ONE: INTRODUCTION
1.1 Background of the Study
The business environment is constantly changing and has shifted considerably over
the past several years, presenting both; Threats and Opportunities to the banking
sector in Kenya. In light of this dynamic landscape, commercial banks must manage
rapid environmental changes and make difficult decisions in order to survive, navigate
and compete effectively in the Kenyan banking industry. Some of these changes
include shifts in regulatory compliance requirements, challenges in improving asset
quality, efforts to enhance customer centricity, focus on digital convergence,
emerging technological trends in banking and the need to tackle, stiff competition
from non-banks (Rishi & Vanshi, 2013).
Strategic management provides a framework that ensures decisions concerning the
future of organizations are taken in a systematic and purposeful way. It offers a
methodology by which a firm can anticipate and project the future and be internally
equipped to face it. Strategic management also helps to develop processes, systems,
mechanisms and managerial attitude that are essential for this purpose. Since business
environments are constantly changing, strategy needs to be continuous and the very
formulation of strategy should be based on a long-term approach. For this to happen,
and borrowing from Chandler (1962), a firm needs to clearly define its long-term
goals and objectives and how it would attain them through some predefined courses
of action and resource allocation decisions. Strategy lends a frame of reference for
investment decisions and aids in the concentration of resources on vital areas of best
potential. The resource-based view, as described by Barney (2001) and others,
provides a framework for firms to invest in valuable, rare, and inimitable resources.
This is possible, only if, the focus is on heterogeneous resources that are not perfectly
mobile (Peteraf, 1993).
If an organization understands the environment in which it operates, then half the
problem is solved. It is for this reason that commercial banks are continuously making
business and technological investments, in order to adapt to new business models.

2
These efforts position the banks to revolutionize the industry, comply with new
regulatory requirements, enhance capital adequacy benchmarks, sustain steady roll
out of new channels such as agency banking, mobile money, internet banking, social
media presence, and leverage on customer data analytics and predictive analytics to
further customer understanding and reach. Indeed, these are just some of the many
strategies adopted by commercial banks in Kenya to retain their existing customers
and reach out to unbanked populations in the country. This is a study on, ‘strategic
responses adopted by commercial banks to enhance market penetration of the
unbanked population in Kenya’.
1.1.1 The Concept of Strategy
According to Lewis (1999), the term strategy derives from the Greek word ‘strategos’,
meaning the art of the general. The concept of strategy has been borrowed from the
military and adapted for use in business. The term strategy has been defined by many
authors and has evolved systematically over the years. Strategy involves the
formulation and implementation of major goals and initiatives by an organization
based on the consideration of available resources and an assessment of the internal
and external environments in which the organization operates. The development of
resources and capabilities should be carried out with the objective of creating
sustainable competitive advantage.
Advanced by Mintzberg (1994), Strategy can be defined as the process through which
organizations develop plans for the future and also evolve patterns out of their past.
Intentions that are fully realized are known as deliberate strategies and he goes on to
recognize emergent strategies where a realized pattern was not expressly intended by
the organization. That is to say, actions were taken, one by one, which converged in
time into some sort of consistency or pattern. He implies, few, if any, strategies can be
purely deliberate or purely emergent and that organizations need a mix of both;
deliberate intended strategies and emergent strategies, in order to succeed. He argues
that corporate strategy consists of plan, pattern, position, perspective and ploy.

3
In a 1996 Harvard Business Review article and in an earlier book (1987), Porter
argues that competitive strategy is about being different. It means deliberately
choosing a different set of activities to deliver a unique mix of value for an
organization. He postulates that strategy is about competitive position, about
differentiating yourself in the eyes of the customer and about adding value through a
mix of activities different from those that are used by competitors. Thus, Porter seems
to embrace strategy as both plan and position.
Robert takes a somewhat different view of strategy in, Strategy Pure & Simple
(1997). He argues that the real issues are strategic management and thinking
strategically. For Robert, this boils down to decisions pertaining to four factors. He
claims that decisions about which products and services to offer, the customers to be
served, the market segments in which to operate, and the geographical areas of
operation should be made on the basis of a single driving force. The 10 driving forces
cited by Robert are: product-service, sales-marketing method, user-customer,
distribution method, market type, natural resources, production capacity-capability,
size/growth, technology and return/profit.
From the definitions above, it is clear that many authors define strategy in many
different ways, and it can be safely deduced that there is no one universally agreed
definition for the concept of strategy (Lynch, 2006).
1.1.2 The Concept of Strategic Response
Organizations need to create and implement an effective strategy in order to excel in
today's marketplace. While setting and implementing strategy is never easy,
organizations that make the investment in time, effort, and thinking are better
equipped to excel in the marketplace and outperform their competitors. Mike
Freedman in The Art and Discipline of Strategic leadership offers business strategists
an integrated five-phase model for setting and implementing strategy. Proven
effective at a diverse range of organizations worldwide, the model provides
executives with a powerful framework for assessing and tweaking current strategy, or
charting a bold new strategic course using five phases as follows; Strategic

4
Intelligence gathering and analysis, Strategy Formulation, Strategic master project
planning, Strategy Implementation and Strategy monitoring, reviewing and updating
(Freedman, 2004).
Strategic intelligence gathering and analysis is important as it ensures that the depth
and breadth of information on which strategic decisions are based is up to date,
accurate, and relevant. The quality of strategic decisions heavily depends on this
process. The intelligence gathered includes; competition, technology, markets,
macroeconomic, political and social trends, and regulations among other subjects of
more specificity to each organization. Key to this phase is the determination of the
implications of the intelligence gathered to the organization during its strategic life
time if implemented (Freedman, 2004).
Strategy formulation and choice. This sequence coming after intelligence gathering
and analysis, results in the creation of a strategic vision or profile. Here, strategic
choices are made. Strategy choice is the evaluation of alternative strategies and
selection of the best alternative for the organization. Once a choice has been selected,
a strategic plan is crafted. During this stage, the plan for strategy implementation is
developed and helps in guiding the organization on how these projects should be
prioritized, defined in detail, sequenced, scheduled, researched, executed and
monitored. The formulation of a strategic plan document provides a means not only to
formalize the effort that goes into strategic planning, but also for communicating to
insiders and outsiders what the company stands for, and what it plans to do in the
given time period. Strategic planning may also refer to control mechanisms used to
implement the strategy once it is determined (Mintzberg et al, 1996).
Strategy implementation is the process by which strategies and policies are put into
action through the development of programs. This might involve changes within the
overall culture, structure and/or management system of the entire organization.
Strategies are implemented through a set of programs, budgets and procedures.
Planned actions are taken, implementation is monitored, and the strategic master
project plan is modified as circumstances change and projects are amended,

5
completed, or abandoned and new ones added. During strategy implementation, the
involvement of a significant number of employees is a vital ingredient in its
successful execution (Tregoe, 2004).
Evaluation, monitoring and control is the final process through which corporate
activities and results can be compared with the desired performance. An important
phase, it can pinpoint weaknesses in previously implemented strategic plans which in
turn, stimulates control towards achieving desired performance. Based on
performance results, management may need to make adjustments in its strategy
formulation or implementation or both. Given the rate and pace of change in the 21st
century, continuous monitoring of strategic progress, goals, and indicators of success
is a full time task and a key input for regular reviews. Such reviews examine whether
the assumptions underpinning the strategy are still valid and whether the
organizations strategic direction is still robust and viable to move the organization
forward (Kepner-Tregoe, 2001).
1.1.3 The Concept of Market Penetration
Market penetration can be defined as the proportion of people in the target who
bought -at least once in the period under review- a specific brand or a category of
goods in the context of marketing metrics. Two key measures of a product’s
'popularity' are penetration rate and penetration share. The penetration rate (also
called penetration, brand penetration or market penetration as appropriate) is the
percentage of the relevant population that has purchased a given brand or category at
least once in the time period under study. A brand’s penetration share, in contrast to
penetration rate, is determined by comparing that brand’s customer population to the
number of customers for its category in the relevant market as a whole. Here again, to
be considered a customer, one must have purchased the brand or category at least
once during the period (Farris et al, 2010).
Market penetration is one of the four alternative growth strategies of the Product-
Market Growth Matrix as defined by Ansoff. A market penetration strategy involves
focusing on selling your existing products or services into your existing markets to

6
gain a higher market share. This is the first strategy most organizations will consider
because it often carries the lowest amount of risk. Market penetration strategy is the
least risky since it leverages many of the firm’s existing resources and capabilities.
However, market penetration has its limits, and once the market approaches saturation
another strategy must be pursued if the firm is to continue to grow (Harvard Business
Review on Strategies for Growth 1998). There are four approaches an organization
can adopt when implementing this strategy; Retain or increase your product’s market
share, dominate growth markets, drive out your competitors or increase existing
customer usage (free management e-books).
Firming up on the concept, Market penetration is also a low pricing strategy adopted
by companies for new and existing products to attract a larger number of buyers and a
larger market share (Kotler and Armstrong, 2009). In the banking context,
commercial banks can embrace technological advances to get around cost barriers and
help in reaching customers where they are located - overcoming infrastructural
deficiencies and the costs involved in physically reaching out to clients. In rapidly
evolving financial markets, applied technologies and pricing can make the difference
between a larger market share or decline in market share.
1.1.4 The Unbanked Population in Kenya
According to the Central bank of Kenya, Kenya’s financial inclusion/exclusion
landscape has undergone considerable transformation since 2006. This is largely due
to emerging policy strategies, reforms and initiatives by the government of Kenya, the
Central Bank of Kenya (CBK) as well as financial sector players’ with regard to
innovation. While the proportion of the financially excluded has been falling steadily
from 39.3% in 2006 to 31.4% in 2009, the figure as at December 2013 still stood at
25.4%, providing tremendous opportunity for commercial banks. These are market
segments of the Kenyan population that do not access financial services from formal,
prudentially regulated institutions and financial services from any type of formal
financial services provider (FSD Kenya, 2013).

7
A growing body of empirical evidence shows that access to the right financial service
at the right time helps households build assets, generate income, smooth consumption,
and protect themselves from risks. At the policy level, decision-makers have
recognized that an inclusive financial system that reaches all citizens also allows for
more effective and efficient execution of other social policies. And at the macro level,
we know that deeper financial intermediation in an economy leads to more growth,
and less inequality. It is therefore no surprise that the quest for financial inclusion is
generating a lot of interest, not just in Kenya but throughout developing economies
(CGAP, 2013).
1.1.5 The Banking Industry in Kenya
In Kenya, the Central Bank (CBK) is responsible for the regulation and supervision of
banks. The Central Bank of Kenya is tasked with formulating and implementing
monetary and fiscal policies in the country. The Central bank is the lender of last
resort in Kenya and is the principal banker to all other banks. The CBK ensures the
proper functioning of the Kenyan financial system, controls liquidity in the country
and monitors the solvency of the Kenyan shilling. The Central Bank of Kenya is
guided by the following legislation; The Constitution of Kenya 2010, The Central
Bank of Kenya Act 2014; The Banking Act 2014; The Microfinance Act 2006, The
National Payment System Act 2011 and The Kenya Deposit Insurance Act of 2012.
As at 31st December 2013, the banking sector comprised of the Central Bank of
Kenya, as the regulatory authority, 44 banking institutions (43 commercial banks and
1 mortgage finance company), 7 representative offices of foreign banks, 9
Microfinance Banks, 2 credit reference bureaus and 101 forex bureaus. Out of the 44
banking institutions, 30 were locally owned, comprising of 3 banks with public
shareholding and 27 banks that are privately owned. The remaining 14 are foreign
owned. These comprise of 10 locally incorporated foreign banks and 4 branches of
foreign incorporated banks. The 9 microfinance banks, 2 Credit reference bureaus and
101 forex bureaus are privately owned (CBK Annual Report, 2013).

8
1.1.6 Commercial Banks in Kenya
Commercial Banks and Mortgage Finance Institutions are licensed and regulated
pursuant to the provisions of the Banking Act and the Regulations and Prudential
Guidelines issued there under. Currently there are 43 licensed commercial banks and
1 mortgage finance company in the country. The banks in Kenya have come together
under the Kenya Bankers Association (KBA), which works as a lobby for the local
banking industry. KBA also serves as a forum to address issues affecting the banking
sector. The industry has over the past few years enjoyed exponential growth is assets,
profitability and products offering, mainly attributed to automation of services and
branch network expansion both locally and regionally. This growth has brought about
increased competition among players and new entrants into the banking sector.
Thanks to stiff competition, banks are now focusing on diverse customer needs rather
than traditional banking products such as over the counter cash deposits and
withdrawals (Kenyan Business Review, 2013).
Commercial banks in the country recorded improved performance as at end of June
2014, with the size of net assets standing at Ksh.2.97 trillion, loans & advances worth
Ksh.1.78 trillion, while the deposit base was Ksh.2.15 trillion. Over the same period,
the number of bank customer deposit and loan accounts stood at 25,328,428 and
3,841,666 respectively. During the 2nd
quarter of 2014, the sector recorded Ksh.37.61
billion pre-tax profits, which was an increase of 12.5 percent from Ksh.33.42 billion
registered in the quarter ending March 2014. Similarly, total income stood at
Ksh.104.0 billion in the second quarter being an increase of 9.4 percent from
Ksh.95.05 billion in the first quarter of 2014. On an annual basis, the profitability of
the sector increased by 15.6 percent from the Ksh.61.47 billion registered in June
2013 to Ksh.71.03 billion in June 2014. Interest on loans and advances, fees and
commissions and government securities were the major sources of income accounting
for 58.5 percent, 19.4 percent and 15.1 percent of total income respectively. On the
other hand, interest on deposits, staff costs and other expenses were the main
components of expenses, accounting for 32.7%, 28.4% and 24.3% respectively (CBK
Banking sector performance report for the period ended 30th
June, 2014).

9
1.2 Research Problem
The quest for financial inclusion is generating a lot of interest, not just in Kenya but
throughout developing economies. Financial exclusion is thus a key policy concern,
because the options for operating a household budget, or an enterprise, without
mainstream financial services can be difficult. This process becomes self-reinforcing
and can often be an important factor in social exclusion, especially for communities
with limited access to financial products, particularly in rural areas (Sharma, 2008). In
the past decade or so, Kenyan banks have experimented with alternative service
delivery channels to reduce costs, facilitate greater outreach to hard-to-reach areas,
and increase customer convenience. While the proportion of the financially excluded
has been falling steadily from 39.3% in 2006 to 31.4% in 2009, the figure as at
December 2013 still stood at 25.4%. This can be attributed to mobile money services
and more specifically, Mpesa (FSD Kenya, 2013).
Several studies have been done, both locally and internationally in the area of
strategic responses adopted by commercial banks in different contexts.
Internationally, Uma, Indra and Panchanatham (2012) did a study on strategies
adopted by HDFC Bank in India. The study concluded that the bank’s strategy is
influenced by its business Banking products, Marketing Strategies, Customer
satisfaction, Documentation, Interest rates and the Banks Marketing Strategy. Further
across the seas, Hawkins and Dubravko (2001) have written a research paper on, the
banking industry in the emerging market economies: competition, consolidation and
systemic stability - an overview of East Asia, Latin America and Central Europe. The
paper reviews the main forces for change in the emerging economies in the banking
industry and then analyses how these forces are affecting the structure of their
banking systems through privatizations, domestic mergers and entry of foreign banks.
These raise a number of microeconomic questions about economies of scale and
scope, competition within the banking market, and the business focus of domestic and
foreign banks.
Closer home, Angara (2010) studied, strategic responses adopted by Kenya
commercial bank to changes in the environment. The findings of the study indicated

10
that the bank had succeeded in the adoption of its strategies by aligning strategies to
the structure, adequate resource allocation to projects, ensuring supportive policies
and staff commitment. Chepkiyeng (2011) did research on Analysis of strategic
responses of commercial banks towards attaining competitive advantage in Kenya.
The study established that commercial banks are faced with many challenges.
Liberalization was established as one challenge that is the biggest threat to the
industry. Among many others, there has also been a study by Abishua (2010) on
Strategic Responses used by Equity Bank to compete in the Kenyan Banking
Industry. The study found that Equity Bank uses the following strategies to respond to
competition in the banking industry: product offering diversification, branch and
regional expansion, relationship marketing, customer-care, innovation and
information technology strategies. The study found Equity bank to be a very adaptive
bank with a versatile reactionary mechanism to exploit any emerging gaps in the
banking industry. It also found that historically, equity was focused on the low end
market segment and that it had now created infrastructure and organizational
structures that included SME’s and Corporate banking in its evolving strategy.
Against this backdrop and to the best of my knowledge this study has never been done
before, in the context of market penetration and the unbanked population in Kenya.
This study seeks to obtain answers to the following research questions:
i. What strategic responses are commercial banks adopting in order to enhance
market penetration of the unbanked population in Kenya?
ii. What is the influence of the strategic responses adopted by Commercial Banks
on enhancing market penetration of the unbanked population in Kenya?
1.3 Research Objectives
i. To determine the strategic responses adopted by commercial banks in order to
enhance market penetration of the unbanked population in Kenya.
ii. To determine the influence of the strategic responses adopted by commercial
banks on enhancing market penetration of the unbanked population in Kenya.
11
1.4 Value of The Study
This study will be valuable to academia. The academic community can gain a greater
understanding of the dynamics of strategic responses by commercial banks in an
effort to deepen financial inclusion. The study will also help expand on existing body
of knowledge with regard to financial inclusion and generation of hypotheses on the
subject. This study will also serve to enrich The Resource-Based and The Resource
Dependence theories of strategic management.
Management of Commercial banks will benefit immensely from this paper. Up until
seven years ago, the formal financial system in the country (while not adequately
inclusive) was mostly dominated by banks. This is not the case anymore as seen by
competition from mobile money operators. This research will be useful in giving
financial institutions insights into sustainable ways of reaching unbanked populations
in light of competition from other quarters, like the telecommunication companies.
Policy makers. Innovation and the use of technology platforms are giving rise to new
challenges on how to establish effective regulatory infrastructures to provide
oversight for converging banking and non- financial sector players who offer financial
solutions. This is a delicate balance between providing risk mitigating oversight and
encouraging innovation in a bid to expand the primary and secondary industries. This
research will assist the Central Bank of Kenya (CBK) and other regulators like the
Communication Authority Kenya (CAK) to keep abreast with new developments in
this sector and improve on oversight and overlapping interests within the industries.

12
CHAPTER TWO: LITERATURE REVIEW
2.1 Introduction
This chapter of the study explores, The Theoretical Foundation of the Study, literature
review on different Types of Strategy, and the link between Strategy and Market
Penetration.
2.2 Theoretical Foundation of the Study
There are two distinct theories often cited on strategy among many others in literature.
These are Resource Based Theory and Resource Dependence Theory.
2.2.1 Resource Based Theory
Known as 'Resource-based view' it is regarded by some, as a paradigm in the field of
strategic management (Peteraf, 1993). Organisations are a bundle of resources and
capabilities. These resources and capabilities are made up of physical, financial,
human and intangible assets. This theory is conditioned on the fact that resources are
not homogenous and are limited in mobility. Heterogeneity implies that firms of
varying capabilities are able to compete in the market place and, at least, breakeven.
Firms with marginal resources can only expect to break even. Firms with superior
resources will earn rents (Peteraf, 1993). An organisation can translate these resources
and capabilities into a strategic advantage if they are valuable, rare, inimitable and the
firm is organized to exploit them. The classic approach to strategy formulation, for
example, begins with an appraisal of organizational competencies and resources
(Andrews, 1971). Those which are distinctive or superior relative to those of rivals,
may become the basis for competitive advantage if they are matched appropriately to
environmental opportunities (Andrews 1971; Thompson and Strickland, 2010).
The resource based model of strategy is fundamentally concerned with the internal
accumulation of assets, with asset specificity, and, less directly, with transactional
costs. Thus it lends itself naturally to the consideration of questions regarding the
boundaries of the firm. A number of researchers have utilized a resource based view
to analyse issues regarding the scope of the firm. For example Montgomery and

13
Hariharan (1991) have shown that firms with broad resource bases tend to pursue
diversification. More generally, the prevailing theory of diversification can be
characterised as resource-based (Peteraf, 1993). On the other hand Barney (2001)
addressed the issue of whether bidding firms may realize abnormal returns from
strategically related acquisitions.
Organisational strategy is one of the broadest and most complex concepts used in
studying organisations. Many, if not most, organisations simultaneously pursue a
combination of two or more strategies, but a combination strategy can be
exceptionally risky if carried too far. No organisation can afford to pursue all the
strategies that might benefit the organisation. Difficult decisions must be made and
priorities established. In short, organisations like individuals have limited resources.
(David, 2011)
2.2.2 Resource Dependence Theory
As much as organizations compete, they also cooperate in order to survive. Research
writings by Pfeffer and Salancik in 1978 suggested that resources are often controlled
by organizations not in the control of the organization needing them. They implied
that no organization can secure the resources and capabilities required to survive
without interacting with organizations and individuals beyond their boundaries as they
seek to improve their chances of survival through adaptation to the environment.
Organizations’ are engaged in co-optition (a mix of cooperation and competition).
Organizations’ coordinate in many ways; co-optition, trade associations, cartels,
reciprocal trade agreements, coordinating councils, advisory boards, boards of
directors, joint ventures, and social norms. Each represents a way of sharing power
and social agreement which stabilizes and coordinates mutual interdependence among
firms (Pfeffer and Salancik, 1978). Coordination has the advantage of being more
flexible than managing dependence through ownership. Relationships established
through communication and consensus can be established, renegotiated, and re-
established with more ease than the integration of organizations by merger can be
altered. (P 144)

14
Direct ties, indirect ties, and innovation. The more direct ties that a firm maintains, the
greater the firms subsequent innovation output. The number of direct ties a firm
maintains can affect its innovative output positively by providing three substantive
benefits: knowledge sharing, complementarity, and scale (Berg et al, 1982). When
firms collaborate to develop a technology, the resultant knowledge is available to all
partners. Thus, each partner can potentially receive a greater amount of knowledge
from a collaborative project than it would obtain from a comparable research
investment made independently (Arora and Gambardella, 1990). By tapping into
developed competencies of other firms, firms can enhance their own knowledge base
and thereby improve their innovation performance. A third positive effect of direct
ties emerges through scale economies in research. If individual firms have the
wherewithal to invest an amount X in a given project, then two firms combining
resources can potentially invest twice as much. If the transformation technology is
characterized by increasing returns, such an investment will lead to a more than
proportionate return in terms of innovation output, benefiting both firms significantly
(Ahuja, 2000).
2.3 Types of Strategies
The literature on the concept of strategic management and types of strategies is vast.
Strategy making is not just a task for top executives. Middle and lower level managers
must also be involved in the strategic planning process to the extent possible.
Therefore, there are different alternatives of strategies that an organization could
pursue (David, 2011). In this sub-topic, the study explores; Hierarchical levels of
strategy, Ansoff’s Product-Market growth matrix and Porter’s Generic strategies most
relevant to this study.
2.3.1 Hierarchical Levels of Strategy
Strategy can be formulated on three different levels as corporate level strategies,
business level strategies and functional unit strategies.
Corporate level strategy is defined in terms of variation in the deployment of a firm’s
resources among the portfolios of industries within which all business firms compete.

15
Ireland, Hoskisson, Hitt (2003) defined corporate strategy as a mix of actions,
undertaken by a business, aiming to gain a competitive advantage, through selecting
and managing a group of different businesses competing in different markets. Hofer
and Schendel (1978) propound this view: Corporate strategy deals with issues of
strategic management at the level of the firm as a whole which involve the basic
character, capability and competence of the firm; the direction in which it should
develop its activities; the nature of its internal architecture; governance and structure;
the nature of its relationships within its sector, its competitors and the wider
environment. Corporate level strategies are mainly concerned with: what business are
we in? What business should we be in? What are our basic directions for the future?
What is our culture and leadership style? What is our attitude to strategic change and
what should it be (Lynch, 2006, p 6)?
Brown and Blackmon (2005) have defined business-level strategy as a process of
decision making at the strategic business level and succeeding in the chosen markets.
According to them, it primarily identifies how strategic business units support the
organizational goals. While corporate strategy deals with the question of what
businesses the company should compete in, business unit level strategy decides on
how to compete in these particular businesses (Beard, Dess, 1981). Johnson et al
(2009) points out that business-level strategy deals with the ways in which various
businesses included in the corporate strategy should compete in their particular
market. Business level strategies are mainly concerned with: How do we compete
successfully? What is our sustainable competitive advantage? How can we innovate?
Who are our customers? What value do we add (Lynch, 2006, p 6)?
Functional Strategy is the approach that a functional area in an organization takes to
achieve corporate and business unit objectives and strategies by maximizing on
resources productivity. It is concerned with developing and nurturing a distinctive
competence to provide a company or business unit with competitive advantages.
(Strategy Safari). Each function within a company (e.g., R&D, marketing or
manufacturing) should strive to acquire and develop the resources necessary for it to

16
become a functional-level core competency that can be converted into a competitive
advantage for the company as a whole (Hendrickson and Psarouthakis, 1998).
2.3.2 Ansoff’s Product-Market Growth Matrix Strategies
To portray alternative corporate growth strategies, Ansoff in 1957 presented a matrix
that focused on the firm’s present and potential products and markets. By considering
ways to grow via existing products and new products, and in existing markets and
new markets, there are four possible product-market combinations. One dimension of
the matrix considers ‘products’ (existing and new) and the other dimension considers
‘markets’ (existing and new). The resulting matrix offers a structured way to asses
potential strategies for growth. That is to say, Market penetration, Market
development, Product development and diversification (Chisnal, 1995)
Market penetration is a strategy in which the organization is targeting new markets, or
new areas of the market. In this strategy, the organization strives to sell more of the
same product(s) to different people. It usually covers products that are already in
existence and explores the full exploitation of the product without necessarily
changing the product or the outlook of the product. This is usually possible through
the use of promotional methods, introducing pricing policies that may attract more
clientele, or expanding distribution channels and making them more extensive. The
risks involved in market penetration are usually the least of the four strategies, since
the products are already familiar to the consumers and so is the established market.
However, market penetration has its limitations. At some point, the marketplace
becomes saturated, meaning that almost all customers with interest in the product or
service eventually become satisfied. It is also possible that the additional customers
you gain through more investment in marketing don't provide enough return on
investment to justify continuing with this strategy. Aggressive market penetration
through competitive advertising methods may help attract some customers, but it can
also lead to responsive attacks from competitors (Lambin, Jean-Jacques, 1996).
Market development options include the pursuit of additional market segments or
geographical regions. It may also be known as market extension. The development of

17
new markets for the product may be a good strategy if the organizations core
competencies are related more to the specific product than to its experience with a
specific market segment. This can be made possible through further market
segmentation to aid in identifying a new clientele base. This strategy assumes that the
existing markets have been fully exploited, thus the need to venture into new markets.
The major risk of market development is that it typically requires capital investment
in expansion, either to build new locations or to expand marketing efforts to new
territories. If the new opportunity doesn't pay off, the company wastes capital and
resources it could have invested in other strategies. A company may also spread itself
too thin, by expanding into new markets and incurring cost associated with new
distribution channels, new product packaging or different pricing policies (Wilson,
1992).
In product development growth strategy, new products are introduced into existing
markets. Product development can involve the introduction of a new product in an
existing market or it can involve the modification (changing its outlook or
presentation, or increase the products performance or quality) of an existing product.
This strategy is appropriate if the organizations strengths are related to its specific
customers rather than to the specific product itself (Ansoff, 1957). Diversification is
the most risky of the four growth strategies since it requires both product and market
development that may be outside the core competencies of the organization. There are
two types of diversification. There is related diversification and unrelated
diversification. In related diversification, the organization remains in the same
industry in which it is familiar with. In unrelated diversification, there are usually no
previous industry relations or market experiences (Jain, 1997).
2.3.3 Michael Porter’s five Generic Strategies
The term competitive advantage is the ability gained through attributes and resources
to perform at a higher level than others in the same industry or market (Christensen
and Fahey 1984, Kay 1994, Porter 1980 cited by Chacarbaghi and Lynch, 1999, p.
45). Michael Porter defined types of competitive advantage an organization can
achieve relative to its rivals as lower costs and/or differentiation, as well as focus.

18
A cost leadership strategy can sometimes revolutionize an industry in which the
historical competitors are ill-prepared either perceptually or economically to take the
steps necessary for cost minimization. The goal of Cost Leadership Strategy is to offer
products or services at the lowest cost in the industry. Cost leadership requires
aggressive construction of efficient-scale facilities, vigorous pursuit of cost reductions
from experience, tight cost and overhead control, avoidance of marginal customer
accounts, and cost minimization in areas like R&D, service, sales force, advertising,
and so on. A great deal of managerial attention to cost control is necessary to achieve
these aims. However, the challenge of this strategy is to earn a suitable profit for the
organization while maintaining these low costs (Porter, 1980 and cited by Gamble et
al, 2010).
Differentiation, if achieved, is a viable strategy for marginally higher returns vis-à-vis
competition in an industry because it creates a defensible position for coping with the
five competitive forces by Michael Porter. The goal of Differentiation Strategy is to
provide a variety of products, services, or features to consumers that competitors are
not yet offering or are unable to offer. This gives a direct advantage to the company
which is able to provide a unique product or service that none of its competitors is
able to offer. This can be achieved by introducing completely new or better products
or services into the market through innovation or use of exclusive technologies. Many
companies invest heavily in their research and development departments in order to
achieve exclusive differentiation with their innovations. Operational Effectiveness can
also help differentiate a company. Operational Effectiveness aims to push the
organization into performing internal business activities better than competitors,
making the company easier or more pleasurable to do business with than other market
choices. It often leads to brand recognition and uptake of the company’s products or
services more easily in the market (Porter, 1980 and cited by Miller, 1992).
The final generic strategy is focusing on a particular buyer group, segment of the
product line, or geographic market. As with differentiation, focus may take many
forms. Although low cost and differentiation strategies are aimed at achieving their
objectives industry wide, the entire focus strategy is built around serving a particular

19
target very well, and each functional policy is developed with this in mind. The
strategy rests on the premise that the firm is thus able to serve its narrow strategic
target more effectively or efficiently than competitors who are competing more
broadly. As a result, the firm achieves either differentiation from better meeting the
needs of the particular target, or lower costs in serving this target, or both
(Chacarbaghi and Lynch, 1999).
2.4 Strategy and Market Penetration
There is wide literature on market penetration that is often largely dependent on the
context in which it is used. For instance, Kotler and Armstrong, opine that Market
penetration is a low pricing strategy adopted by companies for new and existing
products, to attract a larger number of buyers and a larger market share (Kotler and
Armstrong, 2009). This strategy increases the product sales in the company's present
markets through an aggressive marketing mix. It is usually introduced to: increase the
rate of product/service usage; encourage repeat purchases; attract consumers away
from competitors; or attract current non-users of the product (Drummond et al., 2008).
To increase market penetration, a business can employ the following strategies: price
adjustments, increased promotions, increased distribution channels, and product
improvements. One common market penetration strategy is to make price
adjustments. By lowering prices, a business definitely hopes to generate more sales
volumes by increasing the number of units purchased when prices are made more
appealing to consumers when compared to competition. Companies may also pursue a
strategy of higher prices in the hope to gain higher revenues per unit sold, which
would translate into higher sales volumes and a resulting increase in market
penetration. With this strategy, a concern is that higher prices could deter customers
from making a purchase. Organizations may choose to increase market penetration
through greater promotional efforts. They may launch an advertising campaign to
generate greater brand awareness or implement a short-term promotion with a finite
ending date. A promotion is often linked with pricing, such as advertising a special
sale price for a limited period (McGrath, 2000).

20
Various schools of thought suggest two basic dynamic pricing strategies for new
products; Skimming and Penetration strategy (kotler and Armstrong, 2005). A
skimming strategy involves the charging of a high introductory price, which is
subsequently lowered. The rationale of this strategy is to skim the surplus from
customers early in the early stages of the product’s life cycle in order to exploit a
monopolistic position by the firm (Dean, 1976). A penetration strategy involves the
charging of a low price to rapidly penetrate the market. Penetration pricing aims at
exploiting economies of scale or experience (Nagle and Hogan, 2006). To expound
further, if word of mouth is important in the market, then achieving a large amount of
early sales, increases word-of-mouth and enables more rapid market penetration
(Clarke, Darrough and Heineke, 1982)
A company can attempt to increase market penetration by increasing the methods it
uses to get products into the hands of consumers, making them more readily available.
For instance, a company that traditionally sells its products through retail outlets may
add distribution channels such as sending direct mail offerings or instituting a
telemarketing operation. It may also attempt to gain additional selling space in current
distribution channels, by purchasing additional display space in retail stores. Making
product improvements can be used to create new interest in a stagnating product or to
offer an extra benefit to consumers when using the commodity. Manufacturers of
consumer products have often used the "new and improved" claim to entice customers
to give a product another fighting chance or to improve the perception of a products
quality. Companies can also change the product's packaging to give it a more modern
design that might appeal to a younger customer base (McGrath, 2000).

21
CHAPTER THREE: RESEARCH METHODOLOGY
3.1 Introduction
This chapter presents the research methodology that was used for the study.
Specifically it describes the research design, population of the study, sample size, data
collection methods and the method of data analysis used in the study.
3.2 Research Design
The descriptive research design was used for the purpose of this study, which allows a
researcher to describe the phenomena under study. Finding out relationships among
variables in the descriptive research process is labeled as correlation study which,
according to Cooper and Schindler (2003), is a subset of descriptive study. This
design was the most suitable for this research since the study was about strategic
responses adopted by commercial banks to enhance market penetration of the
unbanked in Kenya.
3.3 Population of the Study
The population of this study was drawn from the Heads of strategy or their equivalent
in 43 commercial banks registered and licensed under the Banking Act of Kenya as at
June 2014 (CBK, 2014). According to Malhotra (1999), population is the aggregate of
all the elements that share some common set of characteristics and that comprise the
universe for the purpose of the research problem. This study took the form of a census
given that the population was only 43 Heads of strategy or their equivalent in all the
commercial banks operating in Kenya.
3.5 Data Collection Methods
Primary and Secondary data was used for the purpose of this study. Primary data was
obtained through self-administered drop and pick questionnaires for quantitative and
qualitative data. The structure of the questionnaire (4 parts) was used to collect data
from the Heads of strategy or their equivalent in each commercial bank in the country
whose headquarters are all situated in Nairobi. Secondary data sources, Articles,

22
books, Newspapers, the internet, journals and magazines were also used where the
banks had granted interviews on their competitive strategies.
3.6 Data Analysis
The data collected was edited for completeness and accuracy, coded and entered in
SPSS for analysis. Descriptive statistics were used to understand the characteristics
and relationship between strategic responses and market penetration of the unbanked
population in Kenya. Statistical tests such as independent sample t-test and ANOVA
were used to analyze the differences in the data. Correlation and simple regression
models were also used to understand the relationship between strategic responses
adopted by Commercial Banks and Market penetration of the unbanked population in
Kenya.
23
CHAPTER FOUR: DATA ANALYSIS, RESULTS AND DISCUSSION
4.1 Introduction
This chapter discusses the findings of the study based on the objectives which were;
i) To determine the strategic responses adopted by commercial banks in order to
enhance market penetration of the unbanked population in Kenya. ii) To determine
the influence of strategic responses adopted by commercial banks on enhancing
market penetration of the unbanked population in Kenya. It also presents the specific
findings of the study. Namely; The studys’ Demographic Characteristics of the
respondents; Strategic Responses adopted by Commercial Banks; Market Penetration
of the unbanked population in Kenya; The Influence of Strategy on market
penetration; and The Correlation Analysis & Regression Analysis of the dependent
and independent variables.
4.1.1 Response rate
Out of the forty three commercial banks that constituted the population of the
study, 34 questionnaires were filled and returned to the researcher, representing a
response rate of 79.1%. This response rate was considered adequate for the study and
conforms to Babbie's (2002) stipulation that any response of 50% and above is
adequate for analysis. Therefore the findings presented in this chapter are based on a
79.1% response rate.
4.2 Demographic Characteristics of the respondents
The study sought to establish the general information of the respondents. This
included: The respondents job role or title; Their duration of service in that role; and
Their level of involvement in their banks' strategy formulation process.
4.2.1 The respondents Job Role or Title
From the findings, most of the respondents’ job titles were: operations managers,
heads of branch customer service, chief managers, senior branch managers, credit
officers, senior officers, customer service managers, relationship managers, portfolio
managers and managers’ finance.

24
4.2.2 Experience of the Respondents
To rate their level of credibility, the study sought to find out how long the respondents
had worked in their current position.
Table 4. 1: The respondents’ length of service in their Current Positions
Years Frequency Percentage % Cumulative % 2 4 11.7 11.7
4 13 39.5 51.2
5 7 20.9 72.1
6 3 9.3 81.4
7 4 11.6 93.0
8 1 2.3 95.3
9 2 4.7 100.0
Total 34 100.0 100.0
Majority of the respondents (39.5%) had worked in their current position for 4 years.
20.9% for 5 years, 11.6% for 2 and 7 years. 9.3% for 6 years, 4.7% for 9 years and
2.3% for 8 years. These findings strongly suggested that all the respondents had held
their current position for a substantial duration of time and were therefore credible for
the purposes of this study, given their experienced knowledge and understanding of
the institutions.
4.2.3 Level of the respondents Involvement in Strategy formulation process
Table 4.2 below, rated the respondents level of involvement in their banks’ strategy
formulation process.
Table 4. 2: Level of the respondents Involvement in the Strategy Formulation Process of Commercial banks
Involvement Frequency Percentage % Cumulative % A lot 6 17.6 17.6
Fairly 22 64.7 82.3
Slightly 4 11.8 94.1
A little 2 5.9 100.0
Total 34 100.0 100.0
Asked to rate their level of involvement in their banks' strategy formulation process,
most of the respondents (64.7%) indicated that they were fairly involved in their
banks’ strategy formulation process. 17.6% said a lot, 11.8% slightly and 5.9% a
little. This implies that majority of the respondents had a strong/fair grasp in their
organizations strategy formulation process.

25
4.3 Background Information of the Commercial Banks
4.3.1 Size of Commercial Banks
The findings of the classification of commercial banks by size is presented in Table
4.3
Table 4. 3: Classification of Commercial Banks by size
Size Frequency Percentage % Cumulative % Large Bank 8 23.5 23.5
Middle tier Bank 15 44.1 67.6
Small Bank 11 32.4 100.0
Total 34 100.0 100.0
Majority of the Commercial banks (44.1%) that responded to the study were middle
tier banks. 32.4% were small banks and 23.5% were large banks. This is consistent
with the classification profiling by size, of commercial banks by the Central Bank of
Kenya.
4.3.2 Innovation and Commercial Banks
The study further sought to find out whether Commercial banks encouraged
innovation as presented in Table 4.4.
Table 4. 4: Whether Commercial banks encourage innovation
Innovation Frequency Percentage % Cumulative % Agree Strongly 25 73.5 73.5
Agree 6 17.7 91.2
Don’t Know/Neutral 3 8.8 100.0
Total 34 100.0 100.0
From Table 4.4 it is clear that a relatively large proportion of the respondents (73.5%)
agreed strongly that their banks encouraged innovation. 17.6% just agreed while 8.8%
were neutral. This represents a positive outlook and environment for strategy
formulation in Commercial banks.
4.4 Strategic Responses to enhance the Market Penetration of the Unbanked
The researcher sought to establish the strategic responses adopted by commercial
banks to enhance market penetration of the unbanked population in Kenya.

26
4.4.1 Strategic Responses Adopted by Commercial Banks
A diverse mix of strategic responses were presented to the respondents seeking to
establish which major undertakings, commercial banks used to reach the unbanked
populations. The findings are as presented in Table 4.5
Table 4. 5: Strategic responses adopted by commercial banks to reach unbanked populations
Strategic Response Mean Standard Deviation Market segmentation 4.5 0.977
Mobile banking 4.5 0.921
Agency Banking 4.4 1.033
Microfinance 4.4 0.676
Cultural accommodation e.g. sharia compliant banking 4.4 0.676
Credit enticement 4.4 0.659
Loan enticements/emergency loans and advances 4.2 1.011
Social media presence 4.2 1.329
Heavy Advertising 4.1 0.897
Reduction in account opening requirements 4.1 0.545
Simplified engagement 4.1 1.035
Lower interest rates 4.1 0.584
Pleasant service 4.1 0.715
Savings group services/ solutions for chamas 4.1 0.715
Access to customer funds 24 hours a day 7 days a week 4.0 0.820
Partnerships and strategic alliances 4.0 0.625
Increased marketing 4.0 0.876
Mass market targeting 4.0 1.173
Free value addition services 3.9 0.662
Fast service 3.9 0.623
Employer bulk salary payment solutions 3.9 1.694
High interest on deposits 3.9 1.011
Internet banking 3.9 0.477
New product development 3.9 0.774
Mergers and acquisitions 3.8 0.871
Cost cutting 3.8 1.156
Plastic money/credit cards 3.8 1.035
Transaction facilitation 3.7 0.662
Project financing 3.7 0.962
Club Memberships 3.7 1.268
Higher cost of deposits 3.7 0.774
Improved core banking system quality/no downtimes 3.7 1.515
Diversification- Insurance/property development etc. 3.6 0.818
Business/Club Trips 3.6 1.420
CSR activities 3.5 1.035
Asset financing 3.5 1.152
Freebies 3.4 0.975
High deposit interest rates 3.4 0.852
Branch network expansion 3.2 0.964
Investment banking 3.2 0.680
Average of Average 3.9 0.900
To a large extent, Market segmentation was the most popular of the strategies adopted
by commercial banks as shown by a mean score of 4.5. Mobile banking was the
second most frequently chosen strategy as indicated by a mean score of 4.5. Agency
banking came in third with a mean score of 4.4. Microfinance followed closely as
indicated with a mean score of 4.383. Cultural accommodation e.g. sharia compliant

27
banking was also rated among the top with a mean score of 4.4. The remaining
strategies were ranked as follows with their corresponding mean scores; Credit
enticement- 4.4, Loan enticements/emergency loans and advances- 4.2, Social media
presence- 4.2, Heavy Advertising- 4.1, Reduction in account opening requirements-
4.1, Simplified engagement- 4.1, Lower interest rates- 4.1, Pleasant service-
4.1, Savings group services/ solutions for chamas- 4.1, Access to customer funds 24
hours a day 7 days a week- 4.0, Partnerships and strategic alliances- 4.0, Increased
marketing- 4.0, Mass market targeting- 4.0, Free value addition services-3.9, Fast
service- 3.9, Employer bulk salary payment solutions- 3.9, High interest on deposits-
3.9, Internet banking- 3.9, New product development- 3.9.
To a moderate extent, respondents were neutral on , Mergers & acquisitions- 3.8, Cost
cutting- 3.8, Plastic money/credit cards- 3.8, Plastic money/credit cards- 3.8, Project
financing- 3.7, Club Memberships- 3.7, Higher cost of deposits- 3.7, Improved core
banking system quality/no downtimes- 3.7, Diversification- Insurance/property
development etc.-3.6, Business/Club Trips- 3.6, CSR activities- 3.5, Asset financing-
3.5, freebies as shown by a mean score of 3.4, High deposit interest rates as indicated
by a mean score of 3.4, Branch network expansion as expressed by a mean score of
3.2 and Investment Banking as shown by a mean score of 3.2.
To increase market penetration, a business can employ strategies like price
adjustments and increased distribution channels (McGrath, 2000). Mobile banking
helps to break-down cost barriers by reducing bureaucracy, paperwork and the need
for customers' to physically interface with Commercial Banks. This in turn helps to
reach unbanked populations due to the resultant cost reductions. On the other hand,
Agency banking (as well as mobile banking) increases the distribution channels of the
banks making banking services more available to previously hard-to-reach areas.
Further, one of the generic strategies postulated by Porter (1985) is focusing on a
particular buyer group, segment of the product line, or geographic market. The entire
focus strategy is built around serving a particular target very well. This strategy rests
on the premise that the firm is thus able to serve its narrow strategic target more
effectively or efficiently than competitors who are competing more broadly. As a

28
result, the firm achieves either differentiation from better meeting the needs of the
particular target, or lower costs in serving this target, or both (Chacarbaghi and
Lynch, 1999). Hence, the predictable high rating on Market Segmentation and
Microfinance.
4.4.2 Factors influencing Commercial banks' strategic responses
To further understand the concept of the study, the respondents were asked to rate
their customers’ perceptions that drove Commercial banks’ strategic responses to
reach the unbanked populations in the country. The findings are presented in table 4.6
Table 4. 6: Customer perceptions that drive Commercial banks' strategic responses to reach unbanked populations in the
country
Perception Mean Standard Deviation Unavailability of anywhere anytime banking 4.491 0.862
Distance from formal financial institutions 4.403 0.676
Ignorance on advantages of formal saving/savings 4.283 0.649
Minimum bank balance requirements 4.194 0.680
Numerous account opening requirements 4.176 0.968
High bank charges/ banking is too expensive 4.060 0.715
Complicated bank processes and procedures 3.955 1.173
Environment for the rich 3.910 1.011
Inflexible accessibility of funds 3.872 0.799
Inflexibility in operating an account 3.537 1.035
Poor customer service 3.368 0.948
Funds security concerns 2.914 1.093
Lack of transaction facilitation services 2.872 1.425
Lack of substantial finances to bank 2.863 1.143
A relatively large proportion of the respondents agreed that unavailability of
anywhere anytime banking drove their banks strategic responses to reach unbanked
populations in the country as shown by a mean score of 4.491. Second choice by
majority of the respondents was distance from formal financial institutions as shown
by a mean score of 4.403. And so on as follows; ignorance on advantages of formal
saving/savings as indicated by a mean score of 4.283, minimum bank balance
requirements as expressed by a mean score of 4.194, numerous account opening
requirements as shown by a mean score of 4.176, high bank charges/ banking is too
expensive as shown by a mean score of 4.060, complicated bank processes and
procedures as shown by mean score of 3.955, environment for the rich as shown by a
mean score of 3.910, inflexible accessibility to funds as indicated by a mean score of
3.872 and inflexibility in operating an account as shown by a mean score of 3.537.

29
The respondents were neutral on poor customer service, funds security concerns, lack
of transaction facilitation services and lack of substantial finances to bank (with low
mean scores of 3.368, 2.914, 2.872 and 2.863 respectively).
4.5 Market Penetration of Unbanked Populations in Kenya
The study sought to establish the extent of market penetration of the unbanked
population in Kenya.
4.5.1 Customer Attrition
Customer attrition and retention is a major challenge for any business operating in any
industry. The Commercial banks were asked to indicate how many customers their
bank had lost in the last five years.
Table 4. 7: Customers lost in the last five years
Customer Attrition Frequency Percentage % Cumulative % Below 50,000 29 85.3 85.3
Over 50,000 but below 100,000 5 14.7 100.0
Total 34 100.0 100.0
According to the findings, majority of the respondents (85.3%) had lost below 50,000
customers while 14.7% had lost between 50,000 and 100,000 customers. These results
are consistent with a net increase in acquired customers as hitherto established.
4.5.2 Customer Growth
Having established customer attrition levels, the study further sought to unravel
customer growth levels in the last five years. The findings are as presented below;
Table 4. 8: Customers acquired in the last five years
Newly Acquired Customers Frequency Percentage % Cumulative % Below 500,000 19 55.9 55.9
Over 500,000 but below 1 million 12 35.3 91.2
Over 1 million but below 2 million 3 8.8 100.0
Total 34 100.0 100.0
Presented with choices on the number of customers acquired by commercial banks in
the last five years, majority of the respondents (55.9%) indicated that their bank had
acquired below 500,000 customers. 35.3% had acquired between 500,000 and 1
million customers while 8.8% of the banks had acquired between 1 million and 2
million customers. This is representative of the classification of the banks and their

30
capabilities as small banks, middle tier banks and large banks. It also speaks to the
huge potential that awaits commercial banks if they continue to pursue strategies that
are targeted at the unbanked population in the country.
Customer growth numbers are significantly higher in comparison to the customer
attrition numbers. This implies an increase in customers' industrywide, and also shows
that previously unbanked populations have indeed been looped into the financial
system, thus deepening financial inclusion. Market penetration is a strategy in which
the organization is targeting new markets, or new areas of the market. In this strategy,
the organization strives to sell more of the same product(s) to different people. It
usually covers products that are already in existence and explores the full exploitation
of the product without necessarily changing the product or the outlook of the product.
(Lambin, Jean-Jacques, 1996).
4.5.3 Classification of newly acquired customers
To put into perspective whether newly acquired customers were exclusively,
previously unbanked Kenyan populations or otherwise, the study sought to establish
how the respondents would classify their newly acquired customers in the last one
year.
Table 4. 9: Classification of newly acquired customers
Classification Mean Standard Deviation Customers with regular incomes 4.057 0.757
Customers who formerly had accounts with other banks 3.975 0.804
Customers with irregular incomes 3.917 0.619
Customers who formerly had access to informal financial channels 3.781 0.574
Customers who formerly only had access to mobile money services 3.647 0.546
Customers who formerly had no accounts with other banks 3.563 0.822
The respondents indicated that their newly acquired Clients were Customers with
regular incomes as indicated by a mean score of 4.057, followed by Customers who
formerly had accounts with other banks as expressed by a mean score of 3.975, then
Customers with irregular incomes as indicated by a mean score of 3.917, Customers
who formerly had access to informal financial channels as indicated by a mean score
of 3.781, Customers who formerly only had access to mobile money services as
indicated by a mean score of 3.647 and lastly, Customers who formerly had no
accounts with other banks as shown by a mean score of 3.563. This is an indication

31
that while some of their strategies may specifically target unbanked Kenyan
populations, commercial banks inadvertently attract other market segments in the
process. It could also mean that commercial banks apply a wide array of strategies to
all market segments. This brings to light the interesting concept of underbanked
populations who opt to change banks, so as to access new, fresh and exciting products
and services.
4.5.4 Main Market segments targeted by Commercial Banks
The study sought to establish the main market segments targeted by strategic
responses adopted by Commercial Banks to reach unbanked populations in Kenya.
The findings are as below;
Table 4. 10: Main market segments targeted by strategic responses adopted by Commercial Banks to reach unbanked
populations in Kenya
Market Segment Mean Standard Deviation Customers in Rural Remote areas 4.492 0.826
Mobile money transfer users 4.457 0.742
Religious doctrine- e.g. sharia compliant populations 4.237 0.636
Students 3.831 0.743
Populations turning 18 3.671 0.784
Diaspora 3.252 0.744
Minors 3.126 0.683
Illiterate populations 3.047 0.747
The respondents agreed strongly that foremost, commercial banks targeted Customers
in Rural Remote areas, shown by a mean score of 4.492. Mobile money transfer users
were ranked second as indicated with a mean score of 4.457. Sharia compliant
populations were rated third by a mean score of 4.237. Students came forth as
expressed by a mean score of 3.831. The study also elicited, fair reactions on
populations turning 18 as shown by a mean score of 3.671. The respondents were
neutral on the banks strategic responses targeting the diaspora as indicated by a mean
score of 3.252, minors as shown by a mean score of 3.126 and illiterate populations as
demonstrated by a mean score of 3.047.
4.5.5 Alternative financial channels used by the unbanked population
The study recognized that the availability of alternatives to banking also affects the
uptake of banking services among the unbanked populations. It therefore sought to

32
establish the opinion of the respondents on alternative financial channels that majority
of unbanked populations tended to use.
Table 4. 11: Alternative financial channels that majority of unbanked populations tend to use
Alternative Channel Mean Standard Deviation Telecom companies e.g. Mpesa, Airtel money etc. 4.464 0.645
Hawalla Networks 4.122 0.500
Money transfer services e.g. MoneyGram, western union, Nation Hella etc. 4.106 1.113
Post office services 3.321 0.587
Shylocks 2.632 1.414
According to the findings in Table 4.12, the respondents indicated that the main
alternatives to banking channels that unbanked populations tended to use included
Mobile money services like: Mpesa, Airtel money, Tangaza etc. as shown by a mean
score of 4.464, Hawalla networks as expressed by a mean score of 4.122 and Money
transfer services like MoneyGram, western union, nation hella etc. as indicated by a
mean score of 4.106. The respondents also expressed mild opinions on post office
services and shylocks as indicated by mean scores of 3.321 and 2.632 respectively.
This underscores the fact that Kenya is a developing economy with its unique
peculiarities. A huge population of the citizens have access to a mobile phone but not
similar access to formal banking services.
The quest for financial inclusion is generating a lot of interest, not just in Kenya but
throughout developing economies. Financial exclusion is thus a key policy concern,
because the options for operating a household budget, or an enterprise, without
mainstream financial services can be difficult. This process becomes self-reinforcing
and can often be an important factor in social exclusion, especially for communities
with limited access to financial products, particularly in rural areas (Sharma,
2008). While the proportion of the financially excluded has been falling steadily from
39.3% in 2006 to 31.4% in 2009, the figure as at December 2013 still stood at 25.4%.
This can be attributed to mobile money services and more specifically, Mpesa (FSD
Kenya, 2013).
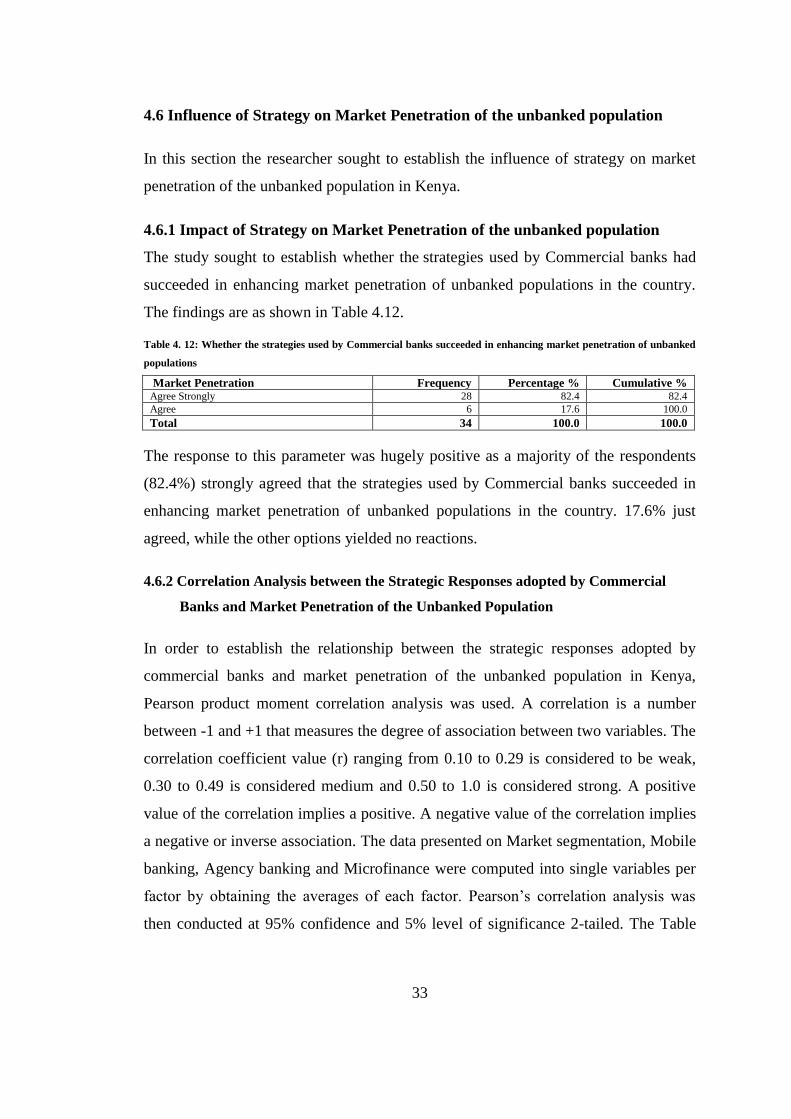
33
4.6 Influence of Strategy on Market Penetration of the unbanked population
In this section the researcher sought to establish the influence of strategy on market
penetration of the unbanked population in Kenya.
4.6.1 Impact of Strategy on Market Penetration of the unbanked population
The study sought to establish whether the strategies used by Commercial banks had
succeeded in enhancing market penetration of unbanked populations in the country.
The findings are as shown in Table 4.12.
Table 4. 12: Whether the strategies used by Commercial banks succeeded in enhancing market penetration of unbanked
populations
Market Penetration Frequency Percentage % Cumulative % Agree Strongly 28 82.4 82.4
Agree 6 17.6 100.0
Total 34 100.0 100.0
The response to this parameter was hugely positive as a majority of the respondents
(82.4%) strongly agreed that the strategies used by Commercial banks succeeded in
enhancing market penetration of unbanked populations in the country. 17.6% just
agreed, while the other options yielded no reactions.
4.6.2 Correlation Analysis between the Strategic Responses adopted by Commercial
Banks and Market Penetration of the Unbanked Population
In order to establish the relationship between the strategic responses adopted by
commercial banks and market penetration of the unbanked population in Kenya,
Pearson product moment correlation analysis was used. A correlation is a number
between -1 and +1 that measures the degree of association between two variables. The
correlation coefficient value (r) ranging from 0.10 to 0.29 is considered to be weak,
0.30 to 0.49 is considered medium and 0.50 to 1.0 is considered strong. A positive
value of the correlation implies a positive. A negative value of the correlation implies
a negative or inverse association. The data presented on Market segmentation, Mobile
banking, Agency banking and Microfinance were computed into single variables per
factor by obtaining the averages of each factor. Pearson’s correlation analysis was
then conducted at 95% confidence and 5% level of significance 2-tailed. The Table
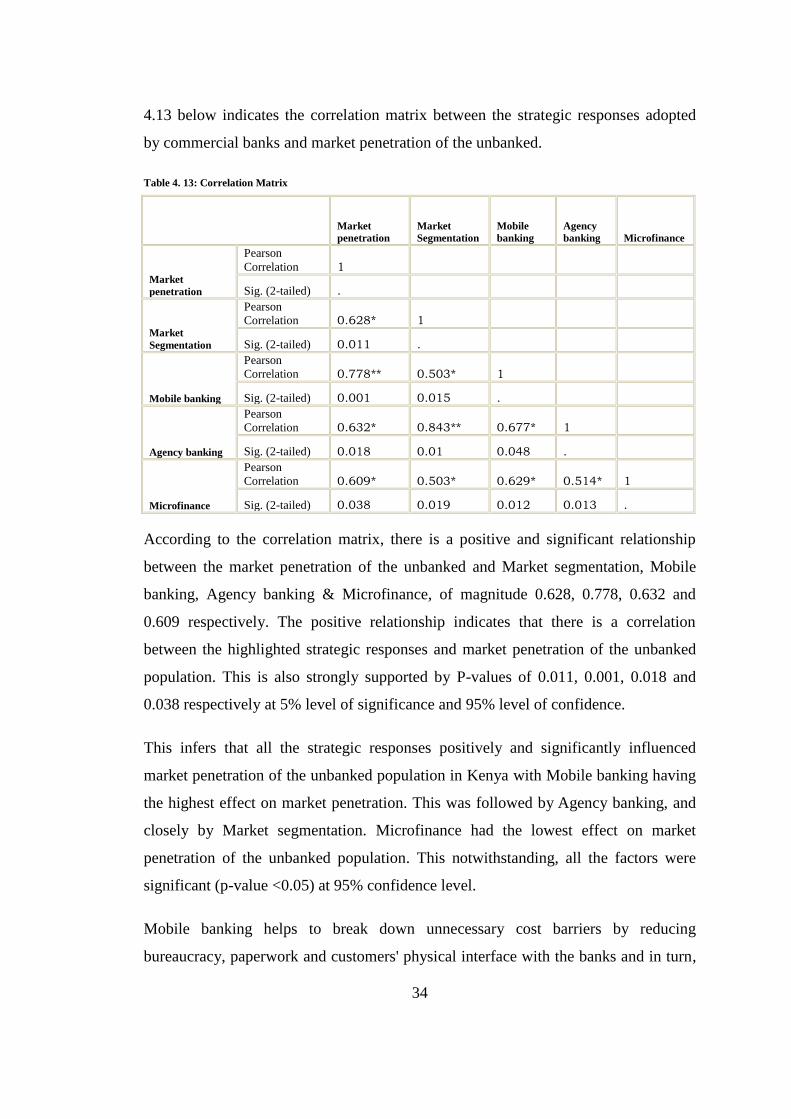
34
4.13 below indicates the correlation matrix between the strategic responses adopted
by commercial banks and market penetration of the unbanked.
Table 4. 13: Correlation Matrix
Market
penetration
Market
Segmentation
Mobile
banking
Agency
banking Microfinance
Market
penetration
Pearson
Correlation 1
Sig. (2-tailed) .
Market
Segmentation
Pearson
Correlation 0.628* 1
Sig. (2-tailed) 0.011 .
Mobile banking
Pearson
Correlation 0.778** 0.503* 1
Sig. (2-tailed) 0.001 0.015 .
Agency banking
Pearson
Correlation 0.632* 0.843** 0.677* 1
Sig. (2-tailed) 0.018 0.01 0.048 .
Microfinance
Pearson
Correlation 0.609* 0.503* 0.629* 0.514* 1
Sig. (2-tailed) 0.038 0.019 0.012 0.013 .
According to the correlation matrix, there is a positive and significant relationship
between the market penetration of the unbanked and Market segmentation, Mobile
banking, Agency banking & Microfinance, of magnitude 0.628, 0.778, 0.632 and
0.609 respectively. The positive relationship indicates that there is a correlation
between the highlighted strategic responses and market penetration of the unbanked
population. This is also strongly supported by P-values of 0.011, 0.001, 0.018 and
0.038 respectively at 5% level of significance and 95% level of confidence.
This infers that all the strategic responses positively and significantly influenced
market penetration of the unbanked population in Kenya with Mobile banking having
the highest effect on market penetration. This was followed by Agency banking, and
closely by Market segmentation. Microfinance had the lowest effect on market
penetration of the unbanked population. This notwithstanding, all the factors were
significant (p-value <0.05) at 95% confidence level.
Mobile banking helps to break down unnecessary cost barriers by reducing
bureaucracy, paperwork and customers' physical interface with the banks and in turn,

35
reaching unbanked populations due to cost reductions. On the other hand, Agency
banking (as well as mobile banking) increases the distribution channels of the banks,
making banking services more available to previously hard-to-reach areas.
Microfinance also featured strongly. Microfinance is the idea that low-income
individuals are capable of lifting themselves out of poverty if given access to financial
services. The target market for microfinance products is generally the unbanked, and
by seeking ways to bring this population into the financial system/fold commercial
banks can wrestle a piece of this important pie from MFIs.
Market penetration is a strategy in which the organization is targeting new markets, or
new areas of the market. In this strategy, the organization strives to sell more of the
same product(s) to different people. It usually covers products that are already in
existence and explores the full exploitation of the product without necessarily
changing the product or the outlook of the product (Lambin, Jean-Jacques, 1996).
4.6.3 Regression Analysis between the Strategic Responses adopted by Commercial
Banks and Market Penetration of the Unbanked Population
For further investigation, a simple regression analysis was also conducted to test the
relationship between the strategic responses adopted by commercial banks and market
penetration of the unbanked population in Kenya. The findings are as computed in
Tables 4.14, 4.15 and 4.16
Table 4. 14: Model Summary
Model R R Square Adjusted R Square Std. Error of the Estimate
1 0.8662 0.7503
0.6902
0.7325
R-Squared is a commonly used statistic to evaluate model fit. R-square is 1 minus the
ratio of residual variability. The adjusted R2, also called the coefficient of multiple
determinations, is the percentage of the variance in the dependent variable explained
uniquely or jointly by the independent variables. 69.02% of the market penetration of
the unbanked population in Kenya could be attributed to the combined effect of the
four strategic responses.

36
Table 4. 15: Summary of One-Way ANOVA results
Model Sum of
Squares
df Mean Square F Sig.
1 Regression 9.223 4 2.306 3.334 0.15
Residual 42.876 29 0.692
Total 52.099 33
The probability value of 0.015 indicates that the regression relationship was highly
significant in predicting how the different strategic responses affect market
penetration of the unbanked population given P-value < 0.05. From the findings, there
is also sufficient evidence to claim that there is a statistically significant difference in
the effect of the different strategic responses on market penetration of the unbanked
population as determined by the one-way ANOVA F(4,29) = 3.334 at 5% level of
significance. This strongly suggests that the succeeding model is relevant.
Table 4. 16: Regression coefficients of the relationship between strategic responses adopted by commercial banks and
market penetration of the unbanked population in Kenya
Model Unstandardized
Coefficients
Standardized
Coefficients
t Sig.
B Std. Error Beta
1
(Constant)
1.053 0.217 4.853 0.000
Market
segmentation 0.682* 0.149 0.613 4.577 0.011
Mobile banking 0.763** 0.091 0.138 8.385 0.001
Agency banking 0.701* 0.181 0.149 3.873 0.018
Microfinance 0.599* 0.196 0.234 3.056 0.038
As per the SPSS generated table above, the equation (Y = β0 + β1X1 + β2X2 +
β3X3 + β4X4+ ε) becomes:
Y= 1.053 + 0.682X1+ 0.763X2+ 0.701X3+ 0.599X4
The regression equation above has established that taking all factors into account
(Market segmentation, Mobile banking, Agency banking and Microfinance), the
37
Constant at zero market penetration of the unbanked population in Kenya will be
1.053. The findings presented also show that taking all other independent variables at
zero, a unit increase in the scores for Market segmentation would lead to a 0.682
increase in the scores of market penetration of the unbanked population in Kenya.
Similarly a unit increase in the scores of Mobile banking would lead to a 0.763
increase in the scores of market penetration of the unbanked population in Kenya.
Further, the findings show that a unit increases in Agency banking would lead to a
0.701 increase in the scores of market penetration of the unbanked population in
Kenya. The study also found that a unit increase in the scores of Microfinance would
lead to a 0.599 increase in the scores of market penetration of the unbanked
population in Kenya.
Overall, Mobile banking had the greatest effect on the market penetration of the
unbanked population in Kenya, followed by Agency banking, then Market
segmentation while Microfinance had the least effect on market penetration of the
unbanked population in Kenya. All the variables were significant (p<0.05).
Organisational strategy is one of the broadest and most complex concepts used in
studying organisations. Many, if not most, organisations simultaneously pursue a
combination of two or more strategies, but a combination strategy can be
exceptionally risky if carried too far. No organisation can afford to pursue all the
strategies that might benefit the organisation. Difficult decisions must be made and
priorities established. In short, organisations like individuals have limited resources.
(David, 2011)

38
CHAPTER FIVE: SUMMARY, CONCLUSION AND RECOMMENDATIONS
5.1 Introduction
This chapter presents the discussion of key findings, conclusions drawn from the
findings and recommendation made subsequently. This was a study on the strategic
responses adopted by commercial banks to enhance market penetration of the
unbanked population in Kenya. The conclusions and recommendations drawn were
focused on addressing the objectives of the study which were; i) To determine the
strategic responses adopted by commercial banks to enhance market penetration of
the unbanked population in Kenya. ii) To determine the influence of strategic
responses adopted by commercial banks on enhancing market penetration of the
unbanked population in Kenya.
5.2 Summary and Discussion of the Findings
5.2.1 Strategic Responses Adopted by Commercial Banks
The study established that Market segmentation was the most popular of the strategies
adopted by commercial banks in an effort to enhance market penetration of the
unbanked population in Kenya. One of the generic strategies postulated by Porter
(1985) is focusing on a particular buyer group, segment of the product line, or
geographic market. The entire focus strategy is built around serving a particular target
very well, and each functional policy is developed with this in mind. The strategy
rests on the premise that the firm is thus able to serve its narrow strategic target more
effectively or efficiently than competitors who are competing more broadly. As a
result, the firm achieves either differentiation from better meeting the needs of the
particular target, or lower costs in serving this target, or both (Chacarbaghi and
Lynch, 1999).
Mobile banking was the second most frequently chosen strategy by the commercial
banks followed closely by Agency banking. To increase market penetration, a
business can employ strategies like price adjustments, increased distribution channels,
and product improvements (McGrath, 2000). Mobile banking helps to break down

39
cost barriers by reducing bureaucracy, paperwork and the need for customers' to
physically interface with Commercial Banks. This in turn helps to reach unbanked
populations due to the resultant cost reductions. On the other hand, Agency banking
(as well as mobile banking) increases the distribution channels of the banks, making
banking services more available to previously hard-to-reach areas.
The study also established that Commercial banks employed Microfinance as a
strategy to reach the unbanked population in Kenya. This was despite the existence of
MFI institutions licensed to operate in the country by the Central Bank of Kenya,
alongside the commercial banks. This is in line with Wilson (1992) who propagated
the view that market development options include the pursuit of additional market
segments or geographical regions. It may also be known as market extension. The
development of new markets for the product may be a good strategy if the
organizations core competencies are related more to the specific product than to its
experience with a specific market segment. This can be made possible through further
market segmentation to aid in identifying a new clientele base. This strategy assumes
that the existing markets have been fully exploited thus the need to venture into new
markets.
The researcher’s interest was drawn to the customer perceptions that prompted
commercial banks to develop strategic responses to reach the unbanked population in
the country. The study established that unavailability of anywhere anytime banking
drove Commercial banks' strategic responses to reach unbanked populations in the
country. This was followed by customers' distance from formal financial
institutions, ignorance on advantages of formal saving/savings, existence of minimum
bank balance requirements, numerous account opening requirements and high bank
charges. That is to say, unbanked populations in Kenya deemed banking to be
inconvenient, too far, too expensive or they were simply ignorant on the advantages
of formal banking.
In summary, Commercial banks employed strategic responses like, Market
Segmentation, Mobile Banking, Agency Banking and Microfinance to reach the
40
unbanked population in the country. This is testament to the fact that Commercial
banks were indeed, embracing technological advances to get around cost barriers and
help in reaching customers where they are located - overcoming infrastructural
deficiencies and costs involved in physically reaching out to clients.
5.2.2 Market Penetration of the Unbanked Population
Presented with choices on customer growth, majority of the commercial banks
indicated that they had all acquired additional customers in the last five years. These
results were representative of the classification of the Commercial Banks and their
capabilities as small banks, middle tier banks and large banks. It also speaks to the
huge potential that awaits commercial banks if they continue to pursue strategies that
are targeted at the unbanked population in Kenya. Customer attrition and retention is
also a major challenge for any business operating in any industry. The Commercial
banks were asked to indicate how many customers their bank had lost in the last five
years. The results were minimal as compared to the number of customers
gained. These results were consistent with a net increase in acquired customers
industrywide.
To put into perspective whether newly acquired customers were exclusively,
previously unbanked Kenyan populations or otherwise, the study sought to establish
how the respondents would classify their newly acquired customers in the last one
year. The respondents indicated that their newly acquired Clients were Customers
with regular incomes, followed by Customers who formerly had accounts with other
banks, then Customers with irregular incomes, Customers who formerly had access to
informal financial channels, Customers who formerly only had access to mobile
money services and lastly, Customers who formerly had no accounts with other
banks. This is an indication that while some of their strategies may specifically target
unbanked Kenyan populations, commercial banks inadvertently attract other market
segments in the process. It could also mean that commercial banks apply a wide array
of strategies to all market segments. This brings to light the interesting concept of
underbanked populations who may opt to change banks, so as to access new, fresh
and exciting products and services.

41
The study also established that foremost, commercial banks targeted Customers in
Rural Remote areas. Mobile money transfer users were ranked second, followed by
Sharia compliant populations, Students, populations turning 18, Kenyans in the
Diaspora, minors and lastly- illiterate populations.
The study recognized that the availability of alternatives to banking also affects the
uptake of banking services among the unbanked populations. It therefore sought to
establish the opinion of the respondents on alternative financial channels that majority
of the unbanked population tended to use. The findings established that unbanked
populations tended to use; mobile money services like: Mpesa, Airtel money etc,
Hawalla networks and Money transfer services like MoneyGram, western union,
nation hella etc. These results reinforced the interesting choice of strategic responses
employed by commercial banks to reach the unbanked population in the country.
The quest for financial inclusion is generating a lot of interest, not just in Kenya but
throughout developing economies. Financial exclusion is thus a key policy concern,
because the options for operating a household budget, or an enterprise, without
mainstream financial services can be difficult. This process becomes self-reinforcing
and can often be an important factor in social exclusion, especially for communities
with limited access to financial products, particularly in rural areas (Sharma,
2008). While the proportion of the financially excluded has been falling steadily from
39.3% in 2006 to 31.4% in 2009, the figure as at December 2013 still stood at 25.4%.
This can be attributed to mobile money services and more specifically, Mpesa (FSD
Kenya, 2013).
5.2.3 Influence of Strategy on Market Penetration
In order to establish the relationship between the strategic responses adopted by
commercial banks and market penetration of the unbanked population in Kenya,
Pearson product moment correlation analysis was used. The data presented on Market
segmentation, Mobile banking, Agency banking and Microfinance were computed
into single variables per factor by obtaining the averages of each factor. According to
the correlation matrix, there was a positive and significant relationship between

42
market penetration and Market segmentation, Mobile banking, Agency banking and
Microfinance of magnitude 0.628, 0.778, 0.632 and 0.609 respectively. The positive
relationship indicated that there was a correlation between the strategic responses
employed by commercial banks and market penetration of the unbanked population.
The correlation findings infer that all the factors positively and significantly
influenced market penetration with Mobile banking having the highest effect on
market penetration, followed by Agency banking, followed by Market segmentation,
while microfinance had the lowest effect on market penetration. This notwithstanding,
all the factors were significant. The regression analysis yielded similar strong
relationships and inferences.
Organizational strategy is one of the broadest and most complex concepts used in
studying organizations. Many, if not most, organizations simultaneously pursue a
combination of two or more strategies, but a combination strategy can be
exceptionally risky if carried too far. No organization can afford to pursue all the
strategies that might benefit the organization. Difficult decisions must be made and
priorities established. In short, organizations like individuals have limited resources
(David 2011).
5.3 Conclusion
The study concludes that mobile banking positively and significantly influences
market penetration of the unbanked population in Kenya. The mobile money
revolution as exemplified by the unprecedented success of Mpesa is giving
commercial banks in Kenya, a run for their money. Another noteworthy example is
Mshwari. While banks have existed longer than mobile telecommunication
companies, their appetite for financial inclusion has been very low until recently.
Technological advancements in the area of mobile money is creating stiff competition
from non-traditional banking sector players and creating overlapping interests with
Commercial Banks. This is unfolding new regulatory and risk environments that have
to be managed carefully while improving oversight and encouraging innovation
within the sectors. By leveraging on mobile banking, commercial banks are in many

43
ways already realizing some hallmarks of Kenya's vision 2030 blueprint as customers
have access to their funds 24 hours a day 7 days a week. Effectively, mobile banking
creates a 24 hour financial system, on course to supporting a robust 24 hour economy.
Agency Banking too, positively and significantly influences market penetration of the
unbanked population in Kenya. In many ways it is the same platform (mobile money)
that drives Agency banking, as mobile handsets are essential for the operations of
bank Agents. By bringing banking services closer to the people (especially in the rural
and marginalised areas) and having it accessible from other ordinary small time
businesses, the perception of banking exclusivity is shattered, making the unbanked
population more open to formal financial services. In short, Decentralized banking
services through extensive Agent outlets enhances accessibility to previously hard-to-
reach areas.
The study also concludes that Microfinance has a positive effect on market
penetration among the unbanked population in Kenya. Microfinance is a general term
to describe financial services to low-income individuals or to those who do not have
access to formal banking services. Microfinance is also the idea that low-income
individuals are capable of lifting themselves out of poverty if given access to financial
services. The target market for microfinance products is generally the unbanked, and
by seeking ways to bring this population into the financial system/fold commercial
banks, with their financial muscle can steadily wrestle a piece of this pie from MFI's.
All the strategies captured above are given impetus by market segmentation which
also had a positive and significant effect on market penetration of the unbanked
population in Kenya. To further contextualize the concept of market segmentation, the
researcher chose to highlight the commercial banks’ outreach to sharia compliant
populations (also given favourable ratings by the respondents). The banking industry
has seen an upsurge in institutions offering Islamic Finance products which have been
driven by awareness of faith based concepts in financial markets globally. Kenya has
an estimated population of 12 million people who profess the Islamic faith. Current
market surveys indicate that a large proportion of this community remains unbanked

44
as it has - not been fully catered for due to faith related issues which forbid the
earning or payment of interest. Kenya has two fully fledged Islamic Banks and a few
conventional banks which have dedicated Islamic Banking units to serve this market
segment of the unbanked population (KCB Internal Circular, 2014).
5.4 Recommendations from the Study
In rapidly evolving financial markets, applied technologies can make the difference
between a larger market share or decline in market share. Commercial Banks can
embrace technologies like mobile banking to reach a larger market segment/specific
market segments and provide the much needed convenience to their existing
customers. For instance, in their outreach to the microfinance segment, commercial
banks need to be more efficient and productive by decreasing the cost of due diligence
mostly characteristic of Microfinance loans. Microfinance is a labour intensive
proposition and involves lending in small incremental amounts to a large number of
people. Essentially, it is about scale, in order to make a profit. This often means
higher staff numbers and costs, higher processing, monitoring and administration
costs as opposed to say lending the entire sum to one person. Due diligence is carried
out for each individual loanee in order to safeguard the quality of lending and
establish credit worthiness. Commercial banks need to get around these cost barriers
by embracing technological advances like mobile money/banking. Mobile banking
has the potential to help with customer data analytics and credit scoring. They also
help in reaching customers where they are located - overcoming infrastructural
deficiencies and related costs involved in physically reaching out to clients.
With the proliferation of cheaper mobile handsets by the day and the production of
sophisticated mobile applications looming even larger in the future, Commercial
banks in Kenya need to appreciate that customers and competitors alike are just a
dial/tap away. How they respond to this Threat/Opportunity could possibly determine
the future of their organizations.

45
Innovation and the use of technology platforms are giving rise to new challenges on
how to establish effective regulatory infrastructures to provide oversight for
converging banking and non- financial sector players who offer financial solutions.
This is a delicate balance between providing risk mitigating oversight and
encouraging innovation in a bid to expand the primary and secondary industries. The
findings of this study establish that partnerships and cooperation among different
industry players is inevitable in order to enhance the market penetration of the
unbanked population in Kenya. As much as organizations compete, they also
cooperate in order to survive. Research writings by Pfeffer and Salancik in 1978
suggested that resources are often controlled by organizations not in the control of the
organization needing them. They implied that no organization can secure the
resources and capabilities required to survive without interacting with organizations
and individuals beyond their boundaries as they seek to improve their chances of
survival through adaptation to the environment. It is not lost to the researcher that
during the writing of this paper, there was much heated debate on the introduction of
Thin-Mobile Sim technology into the market by one of the leading Commercial banks
in Kenya.
5.5 Limitations of the Study
The respondents were purely drawn from Heads of Strategy or their equivalent in all
the 43 Commercial banks registered and licensed under the Banking Act of Kenya.
The researcher would have loved to interview segments of the unbanked population as
well, but due to time constraints this was not possible.
5.6 Recommendations for further Studies
Other studies should be done to investigate the strategic responses adopted by
commercial banks in order to reach the underbanked population in Kenya. A similar
study should also be done on other sectors (mobile money services, microfinance and
agency banking) and how they influence financial inclusion/performance of
Commercial Banks in Kenya. Further studies should also be done on the influence of
customer data analytics and credit scoring on Commercial Bank strategies.

46
REFERENCES
Abishua Derek A (2010). Strategic Responses used by Equity Bank to compete in the
Kenyan Banking Industry: Unpublished MBA Research project, University
of Nairobi, Kenya
Ahuja Gautam (2000). The duality of collaboration: inducements and opportunities in
the formation of interfirm linkages: Strategic Management Journal
Andrews Kenneth R (1971). The concept of corporate strategy: Homewood, Ill.,
Dow Jones-Irwin
Angara Erick .O. (2010). Strategic responses adopted by Kenya commercial bank to
changes in the environment: Unpublished MBA Research project, University
of Nairobi, Kenya
Ansoff, I. (1957). Strategies for Diversification, Harvard Business Review, Vol. 35
Issue 5. pp. 113-124
Arora Ashish; Alfonso Gambardella, (1990). Complementarity and external linkages:
Stanford, CA: Center for Economic Policy Research, Stanford University
Babbie Earl R (2002). The basics of social research : Belmont, CA : Wadsworth
Thomson Learning
Barney, J.B.; Wright, M.; Ketchen Jr., D.J. (2001). The resource-based view of the
firm: Ten years after 1991. Journal of Management
Beard Donald W; Gregory G Dess, (1981). Corporate-Level Strategy, Business-Level
Strategy, and Firm Performance: The Academy of Management Journal
Berg, Sanford V., Philip Friedman, and Jerome Duncan, (1982). Joint. Venture
Strategy and Corporate Innovation: Cambridge: Olgeschlagen, Gunn and
Hain, Inc
Brown Steve; Kate Blackmon, (2005). Aligning Manufacturing Strategy and
Business-Level Competitive Strategy in New Competitive Environments: The
Case for Strategic Resonance: Blackwell Publishing
Bruce Robinson; Chet Lakhani, (1975). Dynamic Price Models for New-Product
Planning : Management Science, v21 n10 (197506
Central Bank of Kenya. (2014). Bank Supervision Annual Report 2013. Nairobi: CBK
Central Bank of Kenya. (2014). CBK Banking sector performance report 2014.
Nairobi: CBK

47
Central Bank of Kenya. (2014). Developments in the Kenyan Banking Sector for the
quarter ended 30th
June 2014. Nairobi: CBK
Chaharbaghi Kazem, Richard Lynch, (1999). Sustainable competitive advantage:
towards a dynamic resource‐based strategy: Management Decision, Vol. 37
Chandler, Alfred D., Jr. (1962/1998). Strategy and Structure: Chapters in the History
of the American Industrial Enterprise. Cambridge, MA: MIT Press
Chepkiyeng F (2011). Analysis of strategic responses of commercial banks towards
attaining competitive advantage in Kenya. Unpublished MBA Research
project, Kenyatta University, Kenya
Chisnall, Peter, (1995). Strategic Business Marketing: New York: Prentice Hall
Christensen, K. and Fahey, L. (1984). Building distinctive competences into
competitive advantage: Strategic Planning Management 2
Clarke Frank H; Masako N Darrough; John M Heineke, (1982). Optimal Pricing
Policy in the Presence of Experience Effects : The Journal of Business, v55
n4 (19821001)
Consultative Group to Assist the Poor. (2014). CGAP Annual Report 2013. CGAP
Website
Cooper Donald R; Pamela S Schindler, (2003). Business research methods. Boston:
McGraw-Hill/Irwin
David L Kurtz; Louis E Boone (2011). Contemporary business : Hoboken, N.J.:
Wiley
Dean G Palmer; Roman F Warmke; Carroll Anthony Nolan; Edward J Rowse, (1976).
Marketing in action: Cincinnati: South-Western Pub. Co
E- Journal, (2005). The Academy of Management Executive (1993-2005), New York:
Briarcliff Manor, NY
Farris, Paul W.; Neil T. Bendle; Phillip E. Pfeifer; David J. Reibstein
(2010). Marketing Metrics: The Definitive Guide to Measuring Marketing
Performance. Upper Saddle River, New Jersey: Pearson Education, Inc
Financial Sector Deepening Kenya. (2014). Fin-Access National Survey 2013.
Nairobi: FSD Kenya
Gamble, Arthur A. A.J, Thompson, Jr., Strickland III, John E. (2010). Crafting and
executing strategy: the quest for competitive advantage: concepts and cases.
Boston: McGraw-Hill/Irwin.
48
Gary Armstrong; Philip Kotler, (2005). Marketing: an introduction : Upper Saddle
River, NJ: Pearson/Prentice Hall
Drummond Graeme; John Ensor; Ruth Ashford, (2008). Strategic marketing:
planning and control : Amsterdam; London: Elsevier/Butterworth-
Heinemann
Hawkins John & Dubravko Mihaljek, (2001). The banking industry in the emerging
market economies: competition, consolidation and systemic stability: an
overview: Bank for International Settlements.
HBR Paperback Series. (1998). Harvard Business Review on Strategies for Growth
1998, Boston: Harvard Business school press
HBR Paperback Series. (1999). Harvard Business Review on Entrepreneurship 1999,
Boston: Harvard Business school press
Hendrickson Lorraine Uhlaner; John Psarouthakis, (1998). Dynamic management of
growing firms: a strategic approach : Ann Arbor: University of Michigan
Press
Ireland R. Duane, Michael Hitt, Robert Hoskisson, (2003). Strategic Management:
Concepts: Competitiveness and Globalization: Jossey Bass
Jain, Subhash C, (1997). Marketing Planning & Strategy: Cincinnati, Ohio: South-
Western Pub
Johnson Gerry, Kevan Scholes, Richard Whittington, (2009). Fundamentals of
Strategy: Financial Times Prentice Hall
Kay, J. Cronshaw, M., Davis, E. (1994). On Being Stuck in the Middle or Good Food
Costs Less at Sainsbury's: British Journal of Management
KCB Internal Circular, (2014). Introducing Sharia Compliant Products. Unpublished
article
Kent B Monroe, (2003). Pricing: making profitable decisions : Boston: McGraw-
Hill/Irwin
Kepner-Tregoe Business Issues Research Group (2001). Decision making in the
digital age. Is all this electronic gadgetry helping you make better, faster
business decisions? : Credit union executive journal, 41, no. 2
Kotler, Philip; Kevin Lane Keller (2009). A Framework for Marketing
Management (4th ed.). Pearson Prentice Hall
Kotler, Armstrong, Philip, Gary. (2008). Principles of Marketing. Pearson/Prentice
Hall

49
Lambin, Jean-Jacques (1996). Strategic marketing management : London [u.a.]
McGraw-Hill
Lewis John Gaddis; et al, (1999). Cold War statesmen confront the bomb: nuclear
diplomacy since 1945 : Oxford; New York: Oxford University Press
Lynch, R., (2006). Corporate Strategy, 4th edition, Harlow: FT/Prentice Hall
Malhotra Yogesh, Dennis F Galletta, (1999). Extending the technology acceptance
model to account for social influence: theoretical bases and empirical
validation: Proceedings of the 32nd Annual Hawaii International Conference
on system sciences
McGrath Rita Gunther; Ian C MacMillan, (2000). The entrepreneurial mindset:
strategies for continuously creating opportunity in an age of uncertainty:
Boston, Mass.: Harvard Business School Press
M V Marn; E V Roegner; C C Zawada, (2003). Pricing new products : New York,
McKinsey & Co
Mike Freedman; Benjamin B Tregoe (2004). The art and discipline of strategic
leadership: New York: McGraw-Hill
Miller, D., (1992). The generic strategy trap: The Journal of Business Strategy
Mintzberg, Henry (1994). The Rise and Fall of Strategic Planning: Reconceiving the
Roles for Planning, Plans, Planners, New York: Free Press
Mintzberg, Henry and, Quinn, James Brian (1996). The Strategy Process:Concepts,
Contexts, Cases. Prentice Hall.
Mintzberg Henry; Bruce W Ahlstrand; Joseph Lampel, (2009). Strategy safari: the
complete guide through the wilds of strategic management : Harlow, UK: FT
Prentice Hall
Montgomery Cynthia A; S Hariharan (1991). Diversified expansion by large
established firms: Journal of Economic Behavior and Organization
Murray, Johan & O'Driscoll, Aidan, (1996). Strategy and Process in Marketing:
London; New York: Prentice Hall
Nagle Thomas T; John E Hogan, (2006). The strategy and tactics of pricing: a guide
to growing more profitably : Upper Saddle River, NJ: Pearson/Prentice Hall
Peteraf, M. A. (1993). The cornerstones of competitive advantage: a resource-based
view; Strategic Management Journal

50
Pfeffer, J. and G. R. Salancik. (1978). The External Control of Organizations: A
Resource Dependence Perspective. New York, NY: Harper and Row
Porter, M. E. (1996). What is a strategy? Harvard Business Review (November-
December): 61-78.
Porter, Michael E (1987). From Competitive Advantage to Corporate Strategy:
Harvard Business Review May–June 1987
Porter, Michael E (1985). Competetive Strategy- Competitive Techniques for
Analysing industries and Competitors. New York, NY: The Free Press
Porter, Michael E (1985). Competitive Advantage. New York: The Free Press.
Rishi Yadav & Vamshi Suvarna. (2013). Trends in the Global Banking Industry 2013:
Capgemini
Robert Michael (1997). Strategy Pure & Simple II: How Winning Companies
Dominate Their Competitors; New York: McGraw Hill
Schendel Dan, Charles W Hofer; (1978). Strategy formulation: analytical concepts:
St. Paul: West Pub. Co
Schendel Dan; Charles W Hofer, (1979). Strategic management: a new view of
business policy and planning : Boston: Little, Brown
Sharma Manoranjan. (2008). Dymanics of Indian Banking, New Delhi: Atlantic
Publishers & Dist
Thompson, Jr., Gamble, Arthur A. A.J. Strickland III, John E. (2010). Crafting and
executing strategy: the quest for competitive advantage: concepts and cases:
Boston: McGraw-Hill/Irwin.
Tregoe Benjamin B; Mike Freedman (2004). The art and discipline of strategic
leadership: New York: McGraw-Hill
Uma Rani T.S., Dr. Rtn. N. Panchanatham, (2012). A Brainwave into Factors that
Influence Marketing Strategies Adopted by HDFC Bank: International Journal
of Management Research and Trends
Uma Sekaran, (2003). Research methods for business: a skill-building approach :
New York: John Wiley & Sons
Walter W Powell; Kenneth W Koput; Laurel Smith-Doerr, (1996).
Interorganizational Collaboration and the Locus of Innovation:
Administrative Science Quarterly

51
Weitz, Barton A. & Wensley, Robin, (1988). Readings in Strategic Marketing:
Chicago: Dryden Press
Wilson, Richard & Gilligan, Colin, (1992). Strategic Marketing Management:
Oxford; Boston: Butterworth-Heinemann
www.free-management-ebooks.com
www.kenyanbusinessreview.com

52
APPENDICES
Appendix I: List of Commercial Banks in Kenya
1. African Banking Corporation Limited
2. Bank of Africa Kenya Limited
3. Bank of Baroda (K) Limited
4. Bank of India
5. Barclays Bank of Kenya Limited
6. CFC Stanbic Bank Limited
7. Charterhouse Bank Limited (Under Statutory Management)
8. Chase Bank (K) Limited
9. Citibank N.A Kenya
10. Commercial Bank of Africa Limited
11. Consolidated Bank of Kenya Limited
12. Co-operative Bank of Kenya Limited
13. Credit Bank Limited
14. Development Bank of Kenya Limited
15. Diamond Trust Bank Kenya Limited
16. Dubai Bank Kenya Limited
17. Ecobank Kenya Limited
18. Equatorial Commercial Bank Limited
19. Equity Bank Limited
20. Family Bank Limited
21. Fidelity Commercial Bank Limited
22. Guaranty Trust Bank (K) Limited (Formely-Fina Bank Limited)
23. First Community Bank Limited
24. Giro Commercial Bank Limited
25. Guardian Bank Limited
26. Gulf African Bank Limited
27. Habib Bank A.G Zurich
28. Habib Bank Limited
29. Imperial Bank Limited
30. I & M Bank Limited
31. Jamii Bora Bank Limited
32. Kenya Commercial Bank Limited
33. K-Rep Bank Limited
34. Middle East Bank (K) Limited
35. National Bank of Kenya Limited
36. NIC Bank Limited
37. Oriental Commercial Bank Limited
38. Paramount Universal Bank Limited
39. Prime Bank Limited
40. Standard Chartered Bank Kenya Limited
41. Trans-National Bank Limited
42. UBA Kenya Bank Limited
43. Victoria Commercial Bank Limited

53
Appendix II: Research Questionnaire
This questionnaire is aimed at collecting data regarding the strategic responses adopted by commercial
banks to enhance market penetration of the unbanked population in Kenya. You have been selected to
participate in the study and are requested to take a few minutes of your time to kindly answer the
questions presented. Kindly give your most accurate response to all the questions as requested. We
assure you that your responses will be confidential. Your kind support is deeply appreciated.
SECTION A: GENERAL INFORMATION
1. What is your job role/title?
2. How long have you worked in your current position? ( ) years
3. How would you rate your level of involvement in your banks strategy formulation process?
(tick as appropriate)
A lot ( ) Slightly ( ) Fairly ( ) A little ( ) Not at All ( )
4. How would you classify the bank that you work for? (tick as appropriate)
Large bank ( ) Middle tier bank ( ) Small bank ( )
5. Does your bank encourage innovation? (tick as appropriate)
Strongly Disagree ( ) Disagree ( ) Agree Strongly ( ) Agree ( )
Don’t Know/Neutral ( )
SECTION B: STRATEGIC RESPONSES ADOPTED BY COMMERCIAL BANKS
6. Do your strategies fall into any of the following categories? (Key: 1 = To a large extent; 2 =
To a moderate extent; 3 = to a slight extent; 4 = to no extent; 5 = Don’t Know/Neutral)
STRATEGY 1 2 3 4 5
i) Branch network expansion
ii) New product development
iii) Increased marketing
iv) Market segmentation
v) Plastic money/credit cards
vi) Cost cutting
vii) Higher cost of deposits
viii) Improved core banking system quality/no downtimes
ix) Fast service
x) Pleasant service
xi) Mergers and acquisitions
xii) Out-sourcing of services e.g agency banking
xiii) Partnerships and strategic alliances

54
xiv) Simplified engagement
xv) Lower interest rates
xvi) Mobile banking
xvii) Diversification- Insurance/property development etc
xviii) Internet banking
xix) Mass market targeting
xx Investment banking
xxi) Cultural accommodation e.g Sharia Compliant Banking
xxii) CSR activities
xxiii) Reduction in account opening requirements
xxiv) Access to customer funds 24 hours a day 7 days a week
xxv) Loan enticements/emergency loans and advances
xxvi) Savings group services/ solutions for chamas
xxvii) Employer bulk salary payment solutions
xxviii) Transaction facilitation
xxix) Free value addition services
xxx) High interest on deposits
xxxi) Club Memberships
xxxii) Business/Club Trips
xxxiii) Freebies
xxxiv) Heavy Advertising
xxxv) Social Media presence
xxxvi) Credit enticement
xxxvii) High deposit interest rates
xxxviii) Microfinance
xxxiv) Asset financing
XL) Project financing
7. Which customer perceptions drive your strategic responses to reach unbanked populations in
the country? (Key: 1 = Strongly Disagree; 2 = Disagree; 3 = Agree; 4 = Strongly Agree; 5 =
Don’t Know/Neutral)
PERCEPTIONS 1 2 3 4 5
i) Complicated bank processes and procedures
ii) Numerous account opening requirements
iii) Lack of substantial finances to bank
iv) Ignorance on advantages of formal saving/savings
v) Distance from formal financial institutions
vi) High bank charges/ banking is too expensive
vii) Inflexible accessibility to funds
viii) Minimum bank balance requirements
ix) Poor customer service
x) Environment for the rich
xi) Inflexibility in operating an account
xii) Unavailability of anywhere anytime banking
xiii) Funds security concerns
xiv) Lack of transaction facilitation services

55
SECTION C: MARKET PENETRATION OF UNBANKED POPULATIONS
8. How many customers has your bank lost in the last five years? (tick as appropriate)
Below 50,000 ( )
Over 50,000 but below 100,000 ( )
Over 100,000 but below 150,000 ( )
Over 150,000 but below 200,000 ( )
Over 200,000 ( )
9. How many new customers has your bank acquired in the last five years? (tick as appropriate)
Below 500,000 ( )
Over 500,000 but below 1 million ( )
Over 1 million but below 2 million ( )
Over 2 million but below 3 million ( )
Over 3 million ( )
10. How would you classify your newly acquired customers in the last one year? (Key: 1 =
Strongly Disagree; 2 = Disagree; 3 = Agree; 4 = Strongly Agree; 5 = Don’t Know/Neutral)
TYPE 1 2 3 4 5
i) Customers who formerly had accounts with other banks
ii) customers with regular incomes
iii) customers with irregular incomes
iv) customers who formerly had no accounts with other banks
v) Customers who formerly had access to informal financial channels
vi) Customers who formerly only had access to mobile money services
11. Which populations do your strategies to reach unbanked populations target? (Key: 1 =
Strongly Disagree; 2 = Disagree; 3 = Agree; 4 = Strongly Agree; 5 = Don’t Know/Neutral)
TARGET 1 2 3 4 5
i) Customers in Rural Remote areas
ii) Populations turning 18
iii) Minors
iv) Students
v) Religious doctrine- eg sharia compliant populations
vi) Mobile money transfer users
vii) Diaspora
viii) Illiterate populations

56
12. In your opinion, which alternative channels do unbanked populations use? (Key: 1 = Strongly
Disagree; 2 = Disagree; 3 = Agree; 4 = Strongly Agree; 5 = Don’t Know/Neutral)
CHANNELS 1 2 3 4 5
i) Shylocks
ii) Hawalla
iii) Money transfer services e.g moneygram, western union etc
iv) Telecommunication companies
v) Post office services
vi) Other
SECTION D: INFLUENCE OF STRATEGY ON MARKET PENETRATION
13. Have your strategies succeeded in enhancing market penetration of unbanked populations?
(tick as appropriate)
Strongly Disagree ( ) Disagree ( ) Agree Strongly ( ) Agree ( )
Don’t Know/Neutral ( )
14. Would your attribute your answer above to your strategic responses? (tick as appropriate)
Strongly Disagree ( ) Disagree ( ) Agree Strongly ( ) Agree ( )
Don’t Know/Neutral ( )
15. Please add any specific or general comments on the issues raised in this questionnaire that you
feel have not been sufficiently addressed.
…………………………………………………………………………………
…………………………………………………………………………………
16. Would you be willing to take part in a short telephone interview to cover specific areas of the
survey in more detail?
If yes, please provide your telephone number
………………………………………………………
Thank you for taking time to complete this questionnaire. If you have any queries about specific
questions, or if you would like to know more about the study, please do not hesitate to contact the
researcher on [email protected]
THANK YOU