Embed Size (px)
Citation preview
Project Summary
Strategic Regional Transit PlanDecember 2008
A Growing NeedSouth Florida faces complex and diverse transportati on, land use, economic, and
development issues, which without a strategy will conti nue into the future. These issues
include increasing road congesti on and mobility problems stemming from conti nuing and
rapid growth and an essenti ally suburban patt ern of land use and development.
The future in South Florida must include transit. The days of adding more and more
pavement to our highway system are rapidly coming to an end, hastened by fl uctuati ng
land values, high gas prices, and the realizati on that future populati on and employment
growth can only be accommodated through compact high density land use served by transit.
Transit is a criti cal element of South Florida’s transportati on future. Benefi ts of transit
include promoti ng economic development and access to jobs, alleviati ng the congesti on
that threatens our region with gridlock, and miti gati ng the isolati on of the transportati on
disadvantaged.
Aft er months of technical analysis and coordinati on with regional transportati on partners,
the South Florida Regional Transportati on Authority (SFRTA) Strategic Regional Transit Plan
process has defi ned three potenti al transit networks. Each of these transit networks is
designed to serve diff erent community values
and diff erent desires, but all opti ons give the
region an opportunity to improve mobility.
As the SFRTA refi nes these opti ons and comes
to a recommendati on of a single vision for
transit in our region, we will look to our
broad, diverse community to be engaged in
helping us shape our future.
Working with Our PartnersIt is imperati ve to use the best resources available to ensure a successful plan. To do this,
throughout the Strategic Regional Transit Plan study process, the SFRTA acti vely engaged
the region’s transit partners (transportati on
planning agencies, and transit service
providers) through its Planning Technical
Advisory Committ ee (PTAC).
To ensure an open line of communicati on
throughout the project, the fi ndings were
discussed with the PTAC on a regular basis.
The committ ee’s comments resulted in
numerous modifi cati ons and provided
general project directi on.
The Strategic Regional Transit Plan was developed by the South Florida Regional Transportation Authority (SFRTA) to:
Think creatively to defi ne a bold vision and strategic plan for regional transit’s role in the overall regional transportation system to ensure mobility, economic viability, and quality of life in the South Florida region for the next generation.
Partner AgenciesBroward County Transit
Broward Metropolitan Planning OrganizationFlorida Department of Transportation, District 4Florida Department of Transportation, District 6
Miami-Dade Metropolitan Planning OrganizationMiami-Dade Transit
Palm Beach Metropolitan Planning OrganizationPalm Tran
South Florida Regional Planning CouncilSouth Florida Regional Transportation Authority
Treasure Coast Regional Planning Council
1DECEMBER 2008 - SFRTA STRATEGIC REGIONAL TRANSIT PLAN
Transit Options for a Region
Regional Activity Centers – RACs – are considered major destinations that could be potential hubs for transit. Premium transit services perform best when they are able to serve concentrated developments. In this study, RACs were determined using the following criteria:
Areas with a high concentration of jobs in the year • ,
Areas projected to experience signifi cant growth • in employment between the years and , and Areas that contain Developments of Regional • Impact (DRIs).
This criteria resulted in the identifi cation of RACs in the region: nine in Palm Beach County, seven in Broward County, and in Miami-Dade County.
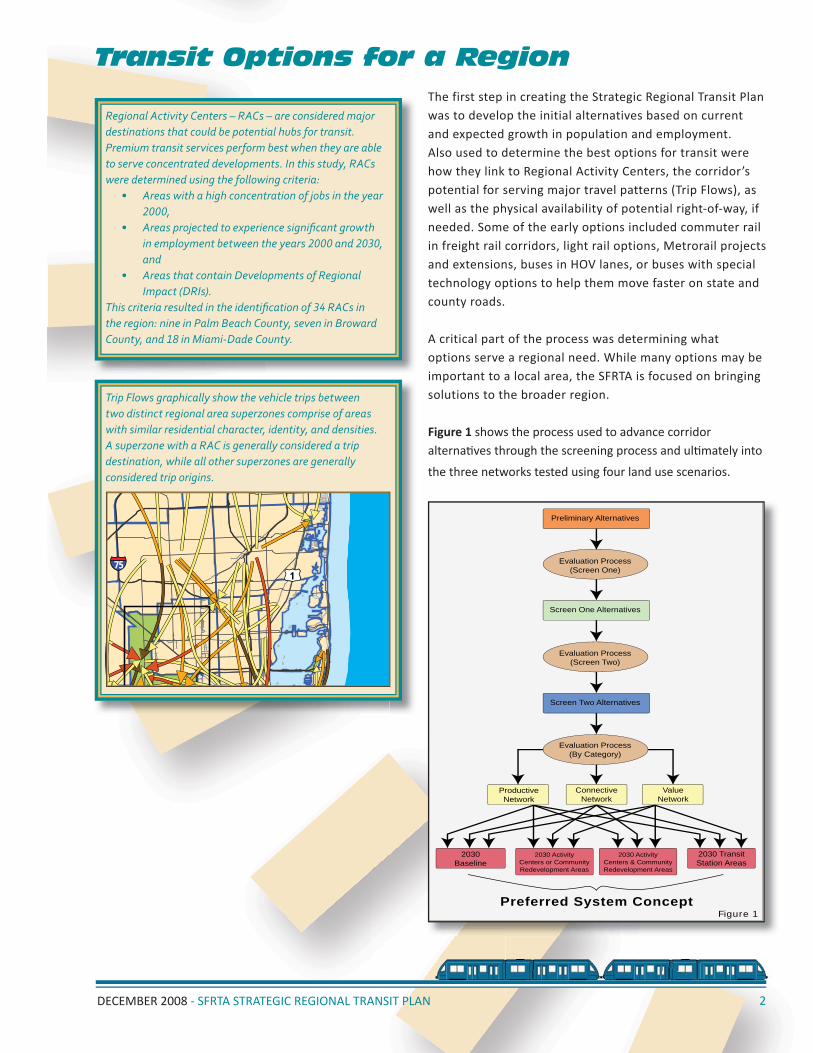
Trip Flows graphically show the vehicle trips between two distinct regional area superzones comprise of areas with similar residential character, identity, and densities. A superzone with a RAC is generally considered a trip destination, while all other superzones are generally considered trip origins.
§̈¦75£¤1
Figure 1
Preliminary Alternatives
Screen One Alternatives
Screen Two Alternatives
Evaluation Process(Screen One)
Evaluation Process(Screen Two)
Evaluation Process(By Category)
ValueNetwork
ProductiveNetwork
ConnectiveNetwork
2030 TransitStation Areas
2030 ActivityCenters or CommunityRedevelopment Areas
2030 ActivityCenters & CommunityRedevelopment Areas
2030Baseline
Preferred System Concept
2
The first step in creating the Strategic Regional Transit Plan was to develop the initial alternatives based on current and expected growth in population and employment. Also used to determine the best options for transit were how they link to Regional Activity Centers, the corridor’s potential for serving major travel patterns (Trip Flows), as well as the physical availability of potential right-of-way, if needed. Some of the early options included commuter rail in freight rail corridors, light rail options, Metrorail projects and extensions, buses in HOV lanes, or buses with special technology options to help them move faster on state and county roads.
A critical part of the process was determining what options serve a regional need. While many options may be important to a local area, the SFRTA is focused on bringing solutions to the broader region.
Figure 1 shows the process used to advance corridor alternati ves through the screening process and ulti mately into
the three networks tested using four land use scenarios.
DECEMBER 2008 - SFRTA STRATEGIC REGIONAL TRANSIT PLAN
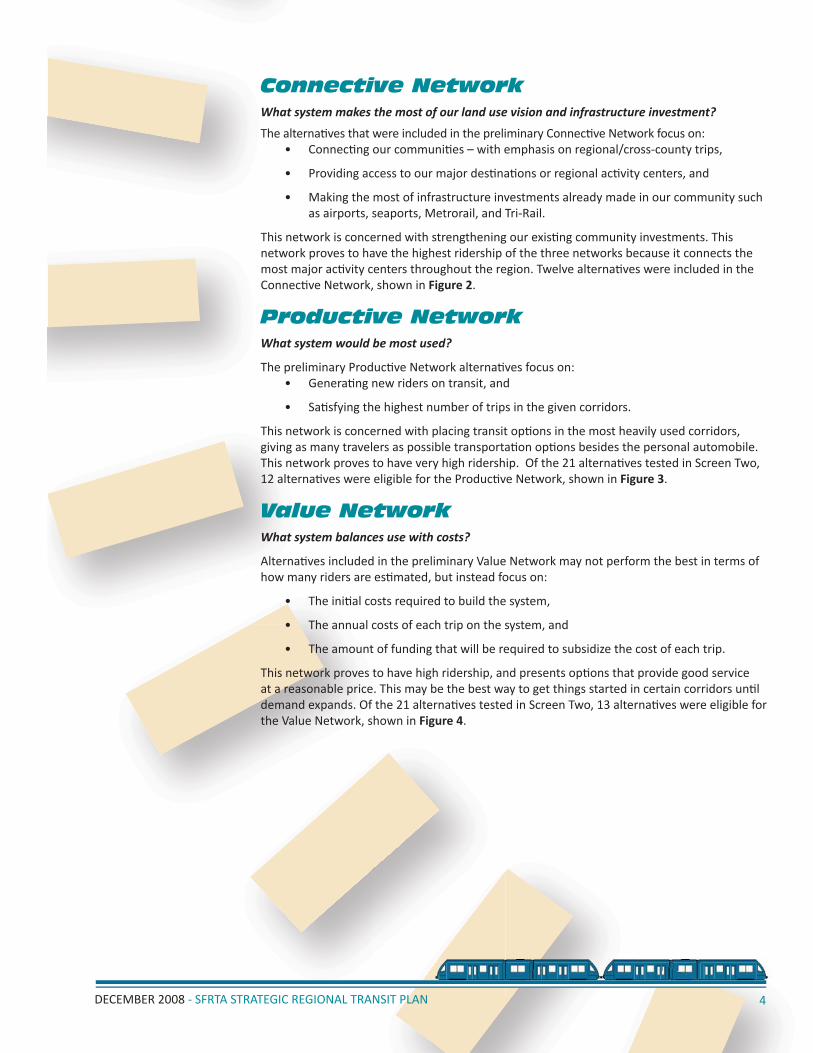
Alternative Name Mode Connective Productive
30D East-West Metrorail Extension South to Kendall Metrorail
31R 137th Rapid Bus BRT
31T Metrorail Extension plus 137th Avenue Rapid Bus CombinedMetrorail/BRT
Mia
mi
Bea
ch
30F Miami Beach LRT LRT
30G Broward East-West LRT LRT
32L Broward E-W LRT Sawgrass to CBD LRT
Broward E-W LRT SR 7 to Dntn Ft. Lauderdaleand SFEC to US 1 LRT
30V Jupiter Extension (7 Stations) Commuter Rail
31U Tri-Rail Extension to VA Hospital Commuter Rail
30J Tri-Rail Split to Miami CBD Commuter Rail
32K Tri-Rail Extension to Dadeland Commuter Rail
30K FEC Complete Commuter Rail
30L FEC Shorter Line Commuter Rail
32A FEC West Palm Beach to Miami Commuter Rail
31A North-South Premium Bus BRT
31S North-South Rapid Bus with Douglas Road BRT
31D University Drive Rapid Bus BRT
31K Wellington Rapid Bus BRT
31L Military Trail Rapid Bus BRT
31N Pines Rapid Bus BRT
32O Oakland Park - Cypress Creek Rapid Bus BRT
32P Sample Road Modified Rapid Bus BRT
32G Kendall Hybrid BRT-DELRT SW 137th Augmented CombinedDELRT/BRT
32Q Kendall Drive BRT Only Modified Service BRT
Total Projects 13 13
Mia
mi E
ast-W
est
Bro
war
dE
ast-W
est
Value
13
Bus
FEC
Jupi
ter
Tri-R
ail
Ext
ensi
ons
Ken
dall
Mia
mi
Tri-R
ail E
xt
The Process
3
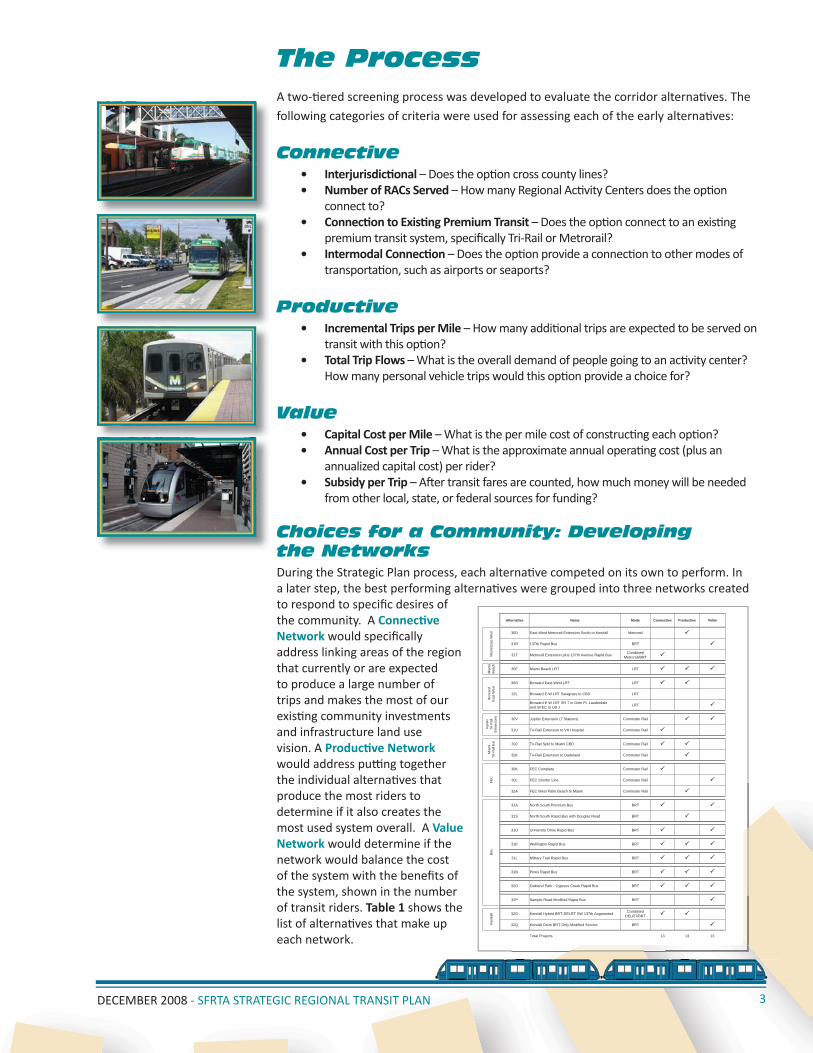
A two-ti ered screening process was developed to evaluate the corridor alternati ves. The
following categories of criteria were used for assessing each of the early alternati ves:
ConnectiveInterjurisdicti onal• – Does the opti on cross county lines?Number of RACs Served• – How many Regional Acti vity Centers does the opti on connect to?Connecti on to Existi ng Premium Transit• – Does the opti on connect to an existi ng premium transit system, specifi cally Tri-Rail or Metrorail?Intermodal Connecti on• – Does the opti on provide a connecti on to other modes of transportati on, such as airports or seaports?
ProductiveIncremental Trips per Mile• – How many additi onal trips are expected to be served on transit with this opti on?Total Trip Flows • – What is the overall demand of people going to an acti vity center? How many personal vehicle trips would this opti on provide a choice for?
ValueCapital Cost per Mile • – What is the per mile cost of constructi ng each opti on? Annual Cost per Trip • – What is the approximate annual operati ng cost (plus an annualized capital cost) per rider?Subsidy per Trip• – Aft er transit fares are counted, how much money will be needed from other local, state, or federal sources for funding?
Choices for a Community: Developing the NetworksDuring the Strategic Plan process, each alternati ve competed on its own to perform. In a later step, the best performing alternati ves were grouped into three networks created to respond to specifi c desires of the community. A Connecti ve Network would specifi cally address linking areas of the region that currently or are expected to produce a large number of trips and makes the most of our existi ng community investments and infrastructure land use vision. A Producti ve Network would address putti ng together the individual alternati ves that produce the most riders to determine if it also creates the most used system overall. A Value Network would determine if the network would balance the cost of the system with the benefi ts of the system, shown in the number of transit riders. Table 1 shows the list of alternati ves that make up each network.
DECEMBER 2008 - SFRTA STRATEGIC REGIONAL TRANSIT PLAN
4
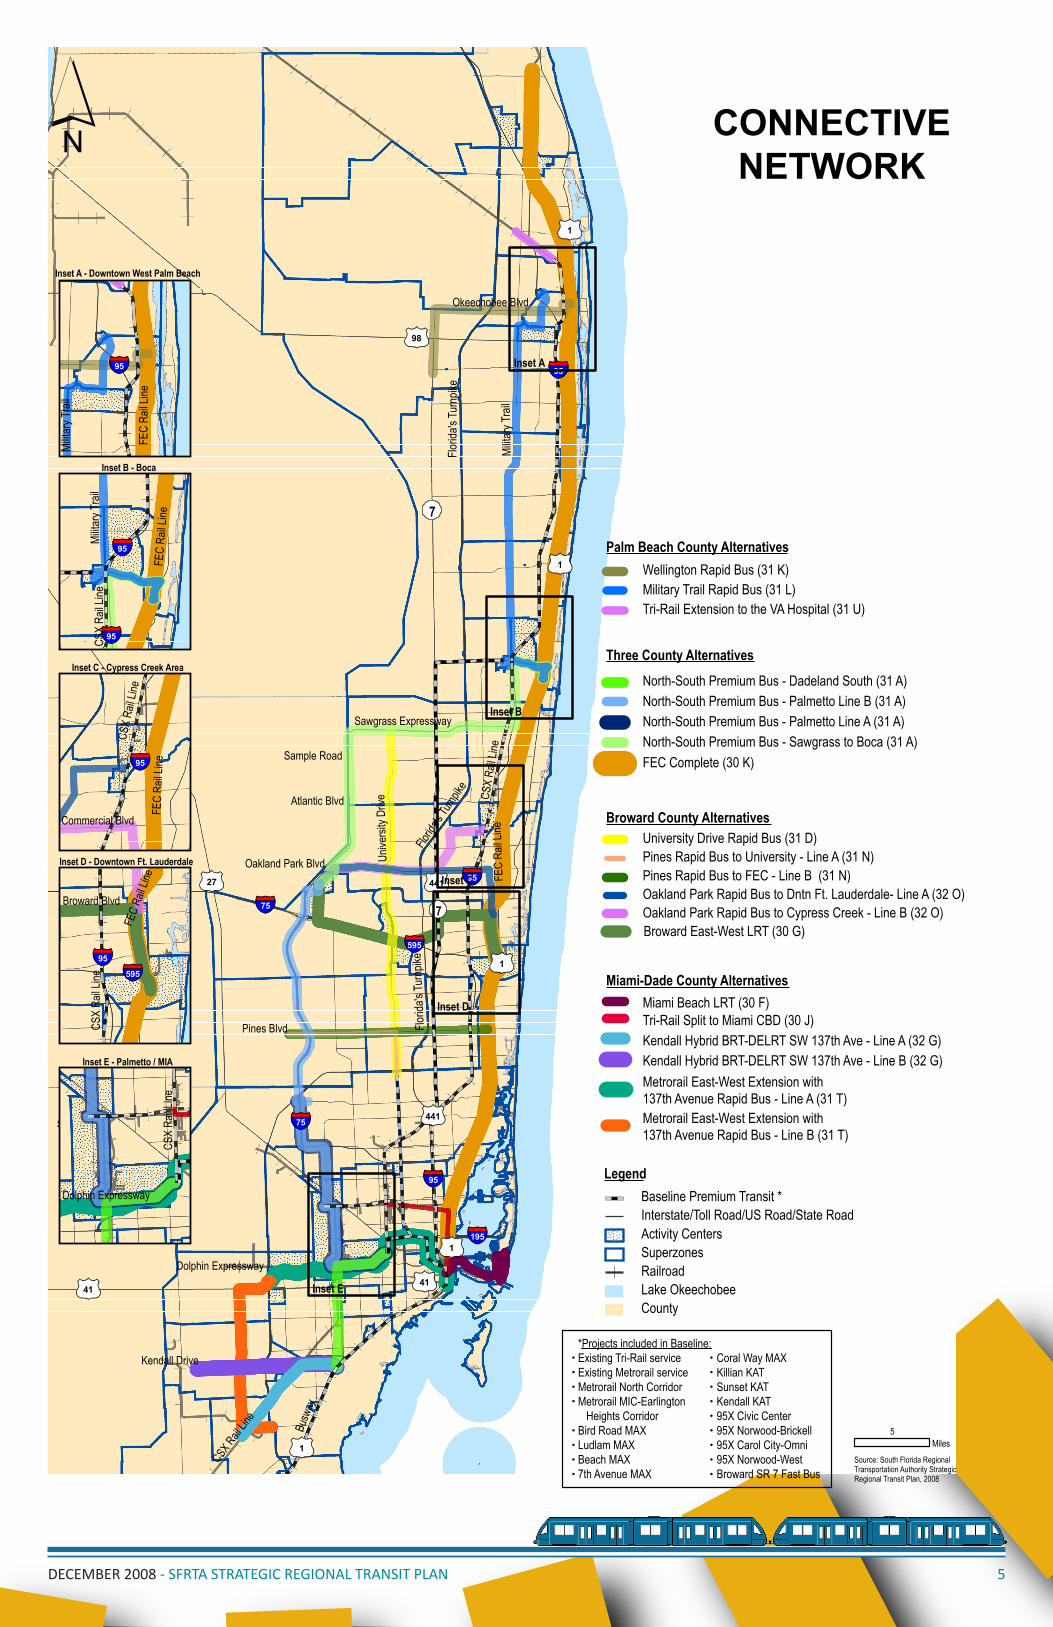
Connective NetworkWhat system makes the most of our land use vision and infrastructure investment?
The alternati ves that were included in the preliminary Connecti ve Network focus on:Connecti ng our communiti es – with emphasis on regional/cross-county trips,•
Providing access to our major desti nati ons or regional acti vity centers, and•
Making the most of infrastructure investments already made in our community such • as airports, seaports, Metrorail, and Tri-Rail.
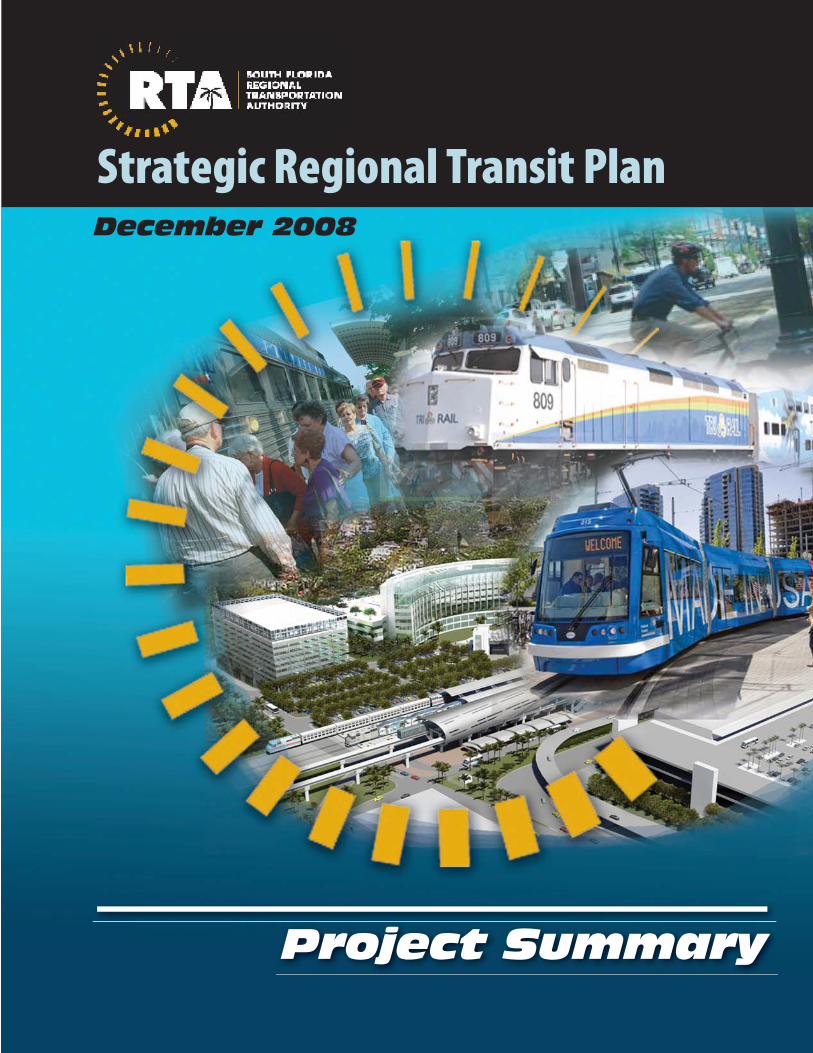
This network is concerned with strengthening our existi ng community investments. This network proves to have the highest ridership of the three networks because it connects the most major acti vity centers throughout the region. Twelve alternati ves were included in the Connecti ve Network, shown in Figure 2.
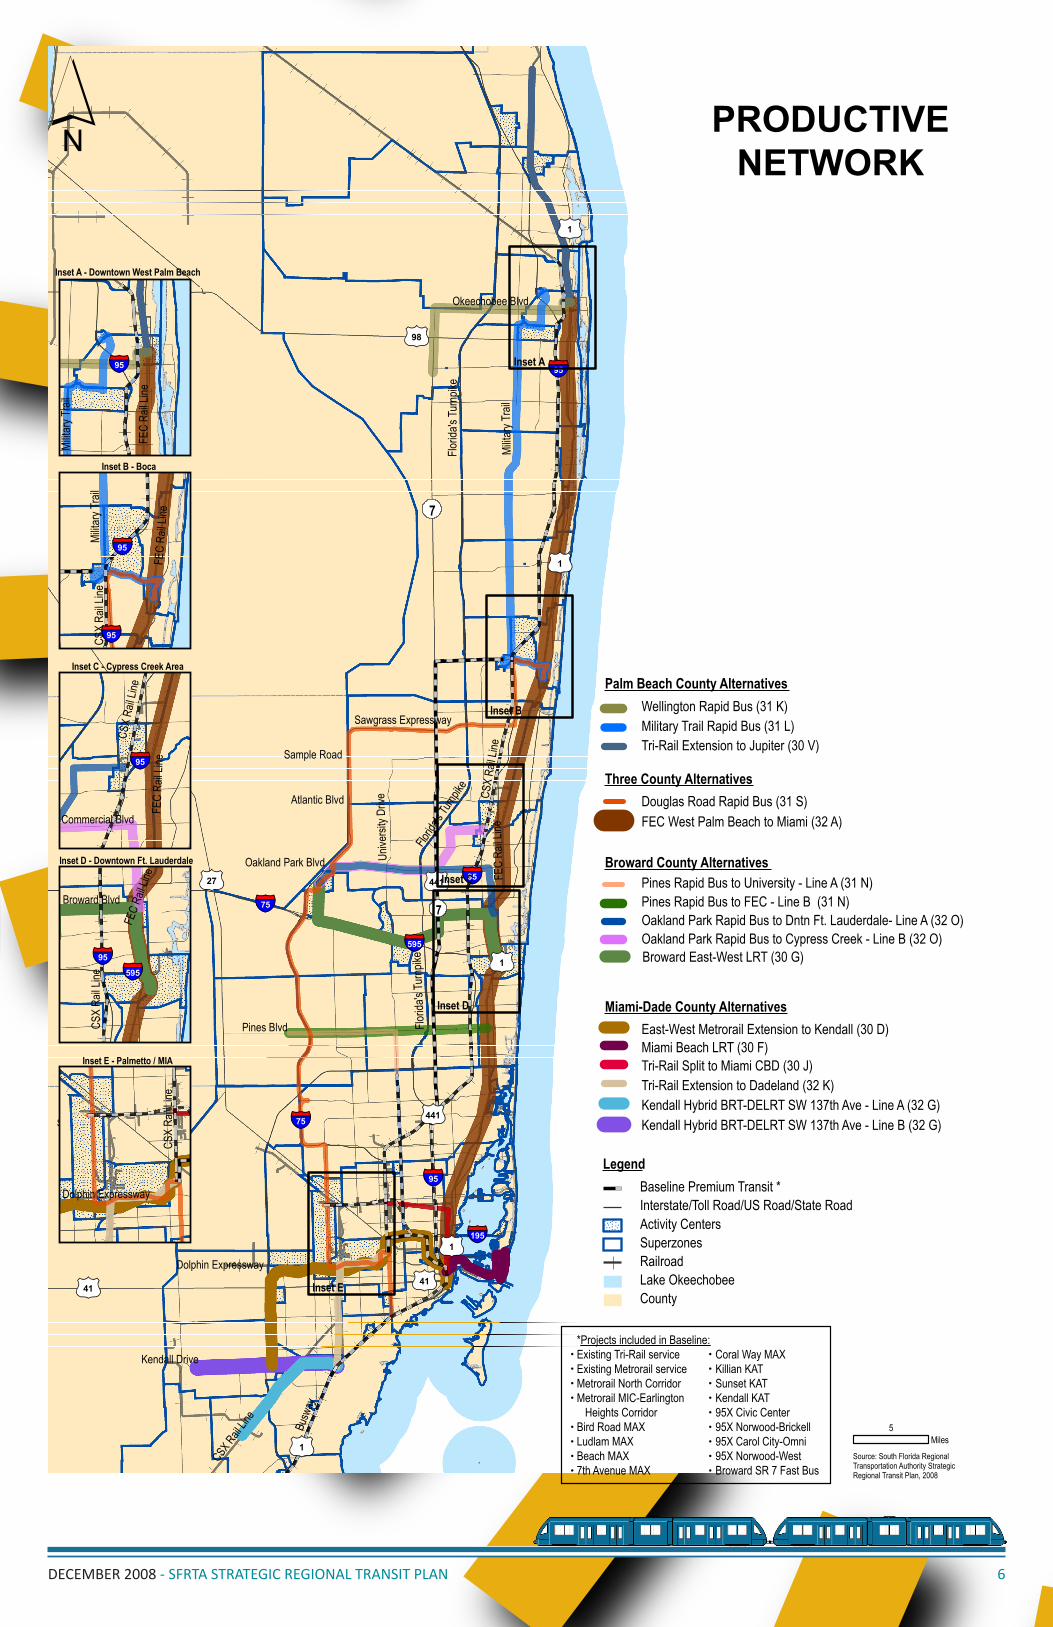
Productive NetworkWhat system would be most used?
The preliminary Producti ve Network alternati ves focus on:Generati ng new riders on transit, and•
Sati sfying the highest number of trips in the given corridors.•
This network is concerned with placing transit opti ons in the most heavily used corridors, giving as many travelers as possible transportati on opti ons besides the personal automobile. This network proves to have very high ridership. Of the 21 alternati ves tested in Screen Two, 12 alternati ves were eligible for the Producti ve Network, shown in Figure 3.
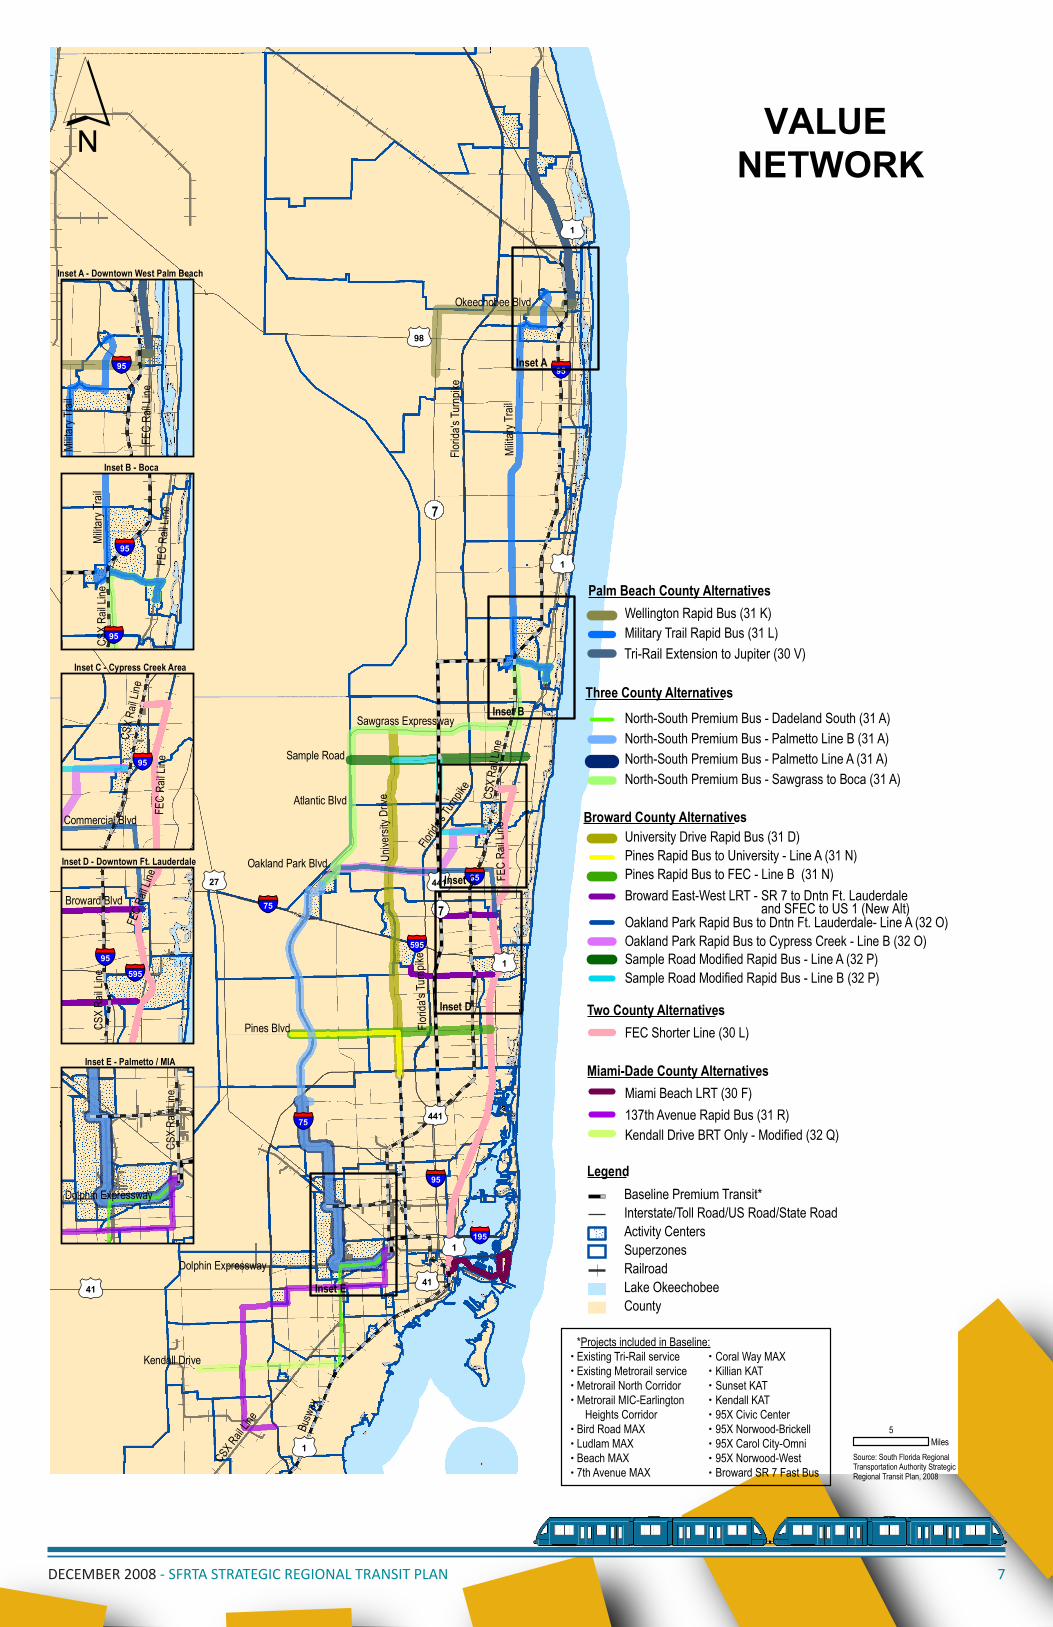
Value NetworkWhat system balances use with costs?
Alternati ves included in the preliminary Value Network may not perform the best in terms of how many riders are esti mated, but instead focus on:
The initi al costs required to build the system,•
The annual costs of each trip on the system, and•
The amount of funding that will be required to subsidize the cost of each trip.•
This network proves to have high ridership, and presents opti ons that provide good service at a reasonable price. This may be the best way to get things started in certain corridors unti l demand expands. Of the 21 alternati ves tested in Screen Two, 13 alternati ves were eligible for the Value Network, shown in Figure 4.
DECEMBER 2008 - SFRTA STRATEGIC REGIONAL TRANSIT PLAN
27
1
441
41
98
1
41
1
1
441
1
95
595
75
195
95
95
75
Milita
ryTr
ail
Sawgrass Expressway
Dolphin Expressway
Florid
a'sTu
rnpik
e
Sample Road
Atlantic Blvd
Oakland Park Blvd
Florid
a'sTu
rnpike CS
XRa
il Line
FEC
RailL
ine
Pines Blvd
Kendall Drive
CSXRail
Line
Busw
ay
Unive
rsity
Drive
Florid
a'sTu
rnpik
e
Okeechobee Blvd
7
7
Source:
95
95
95
95
95
595
Inset A - Downtown West Palm Beach
Inset B - Boca
Inset C - Cypress Creek Area
Inset D - Downtown Ft. Lauderdale
Inset E - Palmetto / MIA
FEC
Rail L
ine
Milita
ryTr
ail
FEC
Rail L
ine
CSX
RailL
ineMi
litary
Trail
FEC
Rail L
ine
CSX
Rail L
ine
Commercial Blvd
FEC
Rail L
ine
CSX
RailL
ine
Broward Blvd
Dolphin Expressway
CSX
RailL
ine
Inset A
Inset B
Inset C
Inset D
Inset E
Legend
Source: South Florida RegionalTransportation Authority StrategicRegional Transit Plan, 2008
Activity Centers
Baseline Premium Transit *Interstate/Toll Road/US Road/State Road
SuperzonesRailroadLake OkeechobeeCounty
Palm Beach County Alternatives
Three County Alternatives
Broward County Alternatives
Miami-Dade County Alternatives
Wellington Rapid Bus (31 K)Military Trail Rapid Bus (31 L)Tri-Rail Extension to the VA Hospital (31 U)
North-South Premium Bus - Palmetto Line B (31 A)North-South Premium Bus - Palmetto Line A (31 A)North-South Premium Bus - Sawgrass to Boca (31 A)FEC Complete (30 K)
North-South Premium Bus - Dadeland South (31 A)
University Drive Rapid Bus (31 D)Pines Rapid Bus to University - Line A (31 N)Pines Rapid Bus to FEC - Line B (31 N)Oakland Park Rapid Bus to Dntn Ft. Lauderdale- Line A (32 O)Oakland Park Rapid Bus to Cypress Creek - Line B (32 O)Broward East-West LRT (30 G)
Miami Beach LRT (30 F)Tri-Rail Split to Miami CBD (30 J)Kendall Hybrid BRT-DELRT SW 137th Ave - Line A (32 G)Kendall Hybrid BRT-DELRT SW 137th Ave - Line B (32 G)Metrorail East-West Extension with 137th Avenue Rapid Bus - Line A (31 T)Metrorail East-West Extension with 137th Avenue Rapid Bus - Line B (31 T)
*Projects included in Baseline:Existing Tri-Rail serviceExisting Metrorail serviceMetrorail North CorridorMetrorail MIC-Earlington Heights CorridorBird Road MAXLudlam MAXBeach MAX7th Avenue MAX
Coral Way MAXKillian KATSunset KATKendall KAT95X Civic Center95X Norwood-Brickell95X Carol City-Omni95X Norwood-WestBroward SR 7 Fast Bus
CONNECTIVENETWORK
5Miles
5DECEMBER 2008 - SFRTA STRATEGIC REGIONAL TRANSIT PLAN
27
1
441
41
98
1
41
1
1
441
1
95
595
75
195
95
95
75
Milita
ryTr
ail
Sawgrass Expressway
Dolphin Expressway
Florid
a'sTu
rnpik
e
Sample Road
Atlantic Blvd
Oakland Park Blvd
Florid
a'sTu
rnpike CS
XRa
il Line
FEC
RailL
ine
Pines Blvd
Kendall Drive
CSXRail
Line
Busw
ay
Unive
rsity
Drive
Florid
a'sTu
rnpik
e
Okeechobee Blvd
7
7
Source:
95
95
95
95
95
595
Inset A - Downtown West Palm Beach
Inset B - Boca
Inset C - Cypress Creek Area
Inset D - Downtown Ft. Lauderdale
Inset E - Palmetto / MIA
FEC
Rail L
ine
Milita
ryTr
ail
FEC
Rail L
ine
CSX
RailL
ineMi
litary
Trail
FEC
Rail L
ine
CSX
Rail L
ine
Commercial Blvd
FEC
Rail L
ine
CSX
RailL
ine
Broward Blvd
Dolphin Expressway
CSX
RailL
ine
Inset A
Inset B
Inset C
Inset D
Inset E
Legend
Palm Beach County Alternatives
Three County Alternatives
Broward County Alternatives
Miami-Dade County Alternatives
Source: South Florida RegionalTransportation Authority StrategicRegional Transit Plan, 2008
Activity Centers
Wellington Rapid Bus (31 K)Military Trail Rapid Bus (31 L)Tri-Rail Extension to Jupiter (30 V)
Douglas Road Rapid Bus (31 S)FEC West Palm Beach to Miami (32 A)
Pines Rapid Bus to University - Line A (31 N)Pines Rapid Bus to FEC - Line B (31 N)Oakland Park Rapid Bus to Dntn Ft. Lauderdale- Line A (32 O)Oakland Park Rapid Bus to Cypress Creek - Line B (32 O)Broward East-West LRT (30 G)
East-West Metrorail Extension to Kendall (30 D)Miami Beach LRT (30 F)
Kendall Hybrid BRT-DELRT SW 137th Ave - Line A (32 G)Kendall Hybrid BRT-DELRT SW 137th Ave - Line B (32 G)
Tri-Rail Extension to Dadeland (32 K)
Baseline Premium Transit *Interstate/Toll Road/US Road/State Road
SuperzonesRailroadLake OkeechobeeCounty
Tri-Rail Split to Miami CBD (30 J)
*Projects included in Baseline:Existing Tri-Rail serviceExisting Metrorail serviceMetrorail North CorridorMetrorail MIC-Earlington Heights CorridorBird Road MAXLudlam MAXBeach MAX7th Avenue MAX
Coral Way MAXKillian KATSunset KATKendall KAT95X Civic Center95X Norwood-Brickell95X Carol City-Omni95X Norwood-WestBroward SR 7 Fast Bus
PRODUCTIVENETWORK
5Miles
6DECEMBER 2008 - SFRTA STRATEGIC REGIONAL TRANSIT PLAN
0127
011
01441
0141
0198
011
0141
011
011
01441
011
§̈¦95
§̈¦595
§̈¦75
§̈¦195
§̈¦95
§̈¦95
§̈¦75
Milita
ryTr
ail
Sawgrass Expressway
Dolphin Expressway
Florid
a'sTu
rnpik
e
Sample Road
Atlantic Blvd
Oakland Park Blvd
Florid
a'sTu
rnpike CS
XRa
il Line
FEC
RailL
ine
Pines Blvd
Kendall Drive
CSXRail
Line
Busw
ay
Unive
rsity
Drive
Florid
a'sTu
rnpik
e
Okeechobee Blvd
7
7
Source:
§̈¦95
§̈¦95
§̈¦95
§̈¦95
§̈¦95
§̈¦595
Inset A - Downtown West Palm Beach
Inset B - Boca
Inset C - Cypress Creek Area
Inset D - Downtown Ft. Lauderdale
Inset E - Palmetto / MIA
FEC
Rail L
ine
Milita
ryTr
ail
FEC
Rail L
ine
CSX
RailL
ineMi
litary
Trail
FEC
Rail L
ine
CSX
Rail L
ine
Commercial Blvd
FEC
Rail L
ine
CSX
RailL
ine
Broward Blvd
Dolphin Expressway
CSX
RailL
ine
Inset A
Inset B
Inset C
Inset D
Inset E
´
Legend
Palm Beach County Alternatives
hree County Alternatives
Miami-Dade County Alternatives
Two County Alternatives
Source: South Florida RegionalTransportation Authority StrategicRegional Transit Plan, 2008
Activity Centers
Wellington Rapid Bus (31 K)Military Trail Rapid Bus (31 L)
North-South Premium Bus - Palmetto Line B (31 A)North-South Premium Bus - Palmetto Line A (31 A)North-South Premium Bus - Sawgrass to Boca (31 A)
North-South Premium Bus - Dadeland South (31 A)
University Drive Rapid Bus (31 D)Pines Rapid Bus to University - Line A (31 N)Pines Rapid Bus to FEC - Line B (31 N)Broward East-West LRT - SR 7 to Dntn Ft. Lauderdale
and SFEC to US 1 (New Alt)
FEC Shorter Line (30 L)
137th Avenue Rapid Bus (31 R)Miami Beach LRT (30 F)
Kendall Drive BRT Only - Modified (32 Q)
Baseline Premium Transit*Interstate/Toll Road/US Road/State Road
SuperzonesRailroadLake OkeechobeeCounty
5Miles
Oakland Park Rapid Bus to Cypress Creek - Line B (32 O)Oakland Park Rapid Bus to Dntn Ft. Lauderdale- Line A (32 O)
Sample Road Modified Rapid Bus - Line B (32 P)Sample Road Modified Rapid Bus - Line A (32 P)
roward County AlternativesB
T
Tri-Rail Extension to Jupiter (30 V)
*Projects included in Baseline:Existing Tri-Rail serviceExisting Metrorail serviceMetrorail North CorridorMetrorail MIC-Earlington Heights CorridorBird Road MAXLudlam MAXBeach MAX7th Avenue MAX
Coral Way MAXKillian KATSunset KATKendall KAT95X Civic Center95X Norwood-Brickell95X Carol City-Omni95X Norwood-WestBroward SR 7 Fast Bus
VALUE NETWORK
7DECEMBER 2008 - SFRTA STRATEGIC REGIONAL TRANSIT PLAN
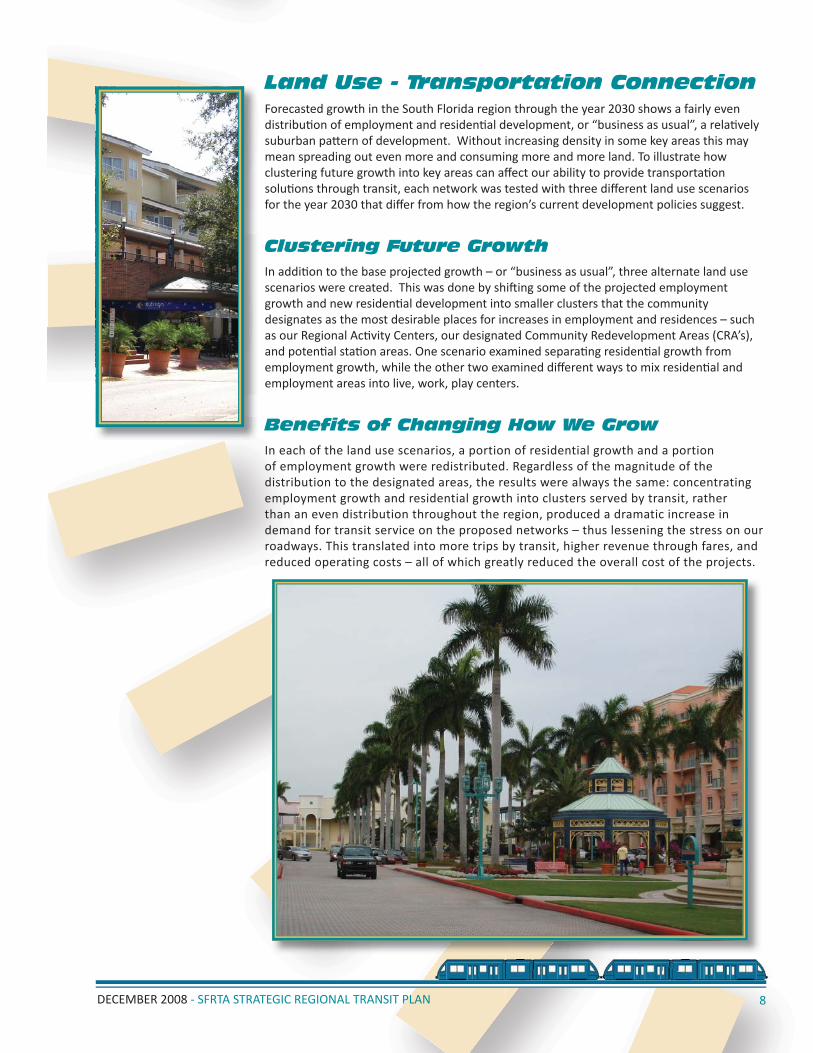
Land Use - Transportation ConnectionForecasted growth in the South Florida region through the year 2030 shows a fairly even distributi on of employment and residenti al development, or “business as usual”, a relati vely suburban patt ern of development. Without increasing density in some key areas this may mean spreading out even more and consuming more and more land. To illustrate how clustering future growth into key areas can aff ect our ability to provide transportati on soluti ons through transit, each network was tested with three diff erent land use scenarios for the year 2030 that diff er from how the region’s current development policies suggest.
Clustering Future GrowthIn additi on to the base projected growth – or “business as usual”, three alternate land use scenarios were created. This was done by shift ing some of the projected employment growth and new residenti al development into smaller clusters that the community designates as the most desirable places for increases in employment and residences – such as our Regional Acti vity Centers, our designated Community Redevelopment Areas (CRA’s), and potenti al stati on areas. One scenario examined separati ng residenti al growth from employment growth, while the other two examined diff erent ways to mix residenti al and employment areas into live, work, play centers.
Benefits of Changing How We GrowIn each of the land use scenarios, a portion of residential growth and a portion of employment growth were redistributed. Regardless of the magnitude of the distribution to the designated areas, the results were always the same: concentrating employment growth and residential growth into clusters served by transit, rather than an even distribution throughout the region, produced a dramatic increase in demand for transit service on the proposed networks – thus lessening the stress on our roadways. This translated into more trips by transit, higher revenue through fares, and reduced operating costs – all of which greatly reduced the overall cost of the projects.
8DECEMBER 2008 - SFRTA STRATEGIC REGIONAL TRANSIT PLAN
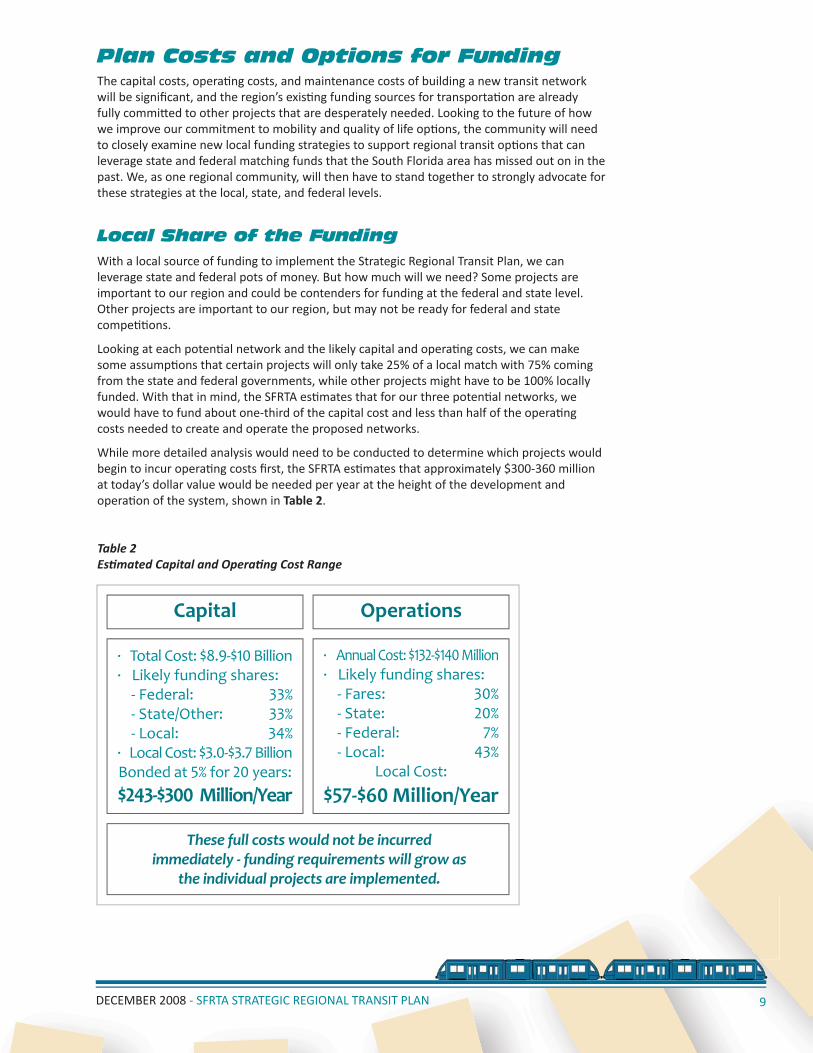
These full costs would not be incurred immediately - funding requirements will grow as
the individual projects are implemented.
Capital Operations
· Total Cost: . - Billion· Likely funding shares: - Federal: % - State/Other: % - Local: %· Local Cost: . - . BillionBonded at % for years:
- Million/Year
· Annual Cost: - Million· Likely funding shares: - Fares: % - State: % - Federal: % - Local: %
Local Cost:
- Million/Year
Plan Costs and Options for FundingThe capital costs, operati ng costs, and maintenance costs of building a new transit network will be signifi cant, and the region’s existi ng funding sources for transportati on are already fully committ ed to other projects that are desperately needed. Looking to the future of how we improve our commitment to mobility and quality of life opti ons, the community will need to closely examine new local funding strategies to support regional transit opti ons that can leverage state and federal matching funds that the South Florida area has missed out on in the past. We, as one regional community, will then have to stand together to strongly advocate for these strategies at the local, state, and federal levels.
Local Share of the FundingWith a local source of funding to implement the Strategic Regional Transit Plan, we can leverage state and federal pots of money. But how much will we need? Some projects are important to our region and could be contenders for funding at the federal and state level. Other projects are important to our region, but may not be ready for federal and state competi ti ons.
Looking at each potenti al network and the likely capital and operati ng costs, we can make some assumpti ons that certain projects will only take 25% of a local match with 75% coming from the state and federal governments, while other projects might have to be 100% locally funded. With that in mind, the SFRTA esti mates that for our three potenti al networks, we would have to fund about one-third of the capital cost and less than half of the operati ng costs needed to create and operate the proposed networks.
While more detailed analysis would need to be conducted to determine which projects would begin to incur operati ng costs fi rst, the SFRTA esti mates that approximately $300-360 million at today’s dollar value would be needed per year at the height of the development and operati on of the system, shown in Table 2.
Table 2Esti mated Capital and Operati ng Cost Range
9DECEMBER 2008 - SFRTA STRATEGIC REGIONAL TRANSIT PLAN
Option A- : Sales Tax Only
Option A- : Fuel Tax, Fees, and Tolls
. % Sales Tax
TOTAL
M
M
¢/gallon Fuel Tax
Managed Lanes
M
M
Option A- : Rental Car Fee and Tolls/day Rental Car Fee
Managed Lanes
M
M
Option A- : Sales Tax and Tolls. % Sales Tax
Managed Lanes
TOTAL
M
M
Option A- : Title and Registration Fees/year Registration Fee
Title Fee
TOTAL
M
M
/year Registration Fee M
Title Fee M
TOTAL M
TOTAL M
M
M
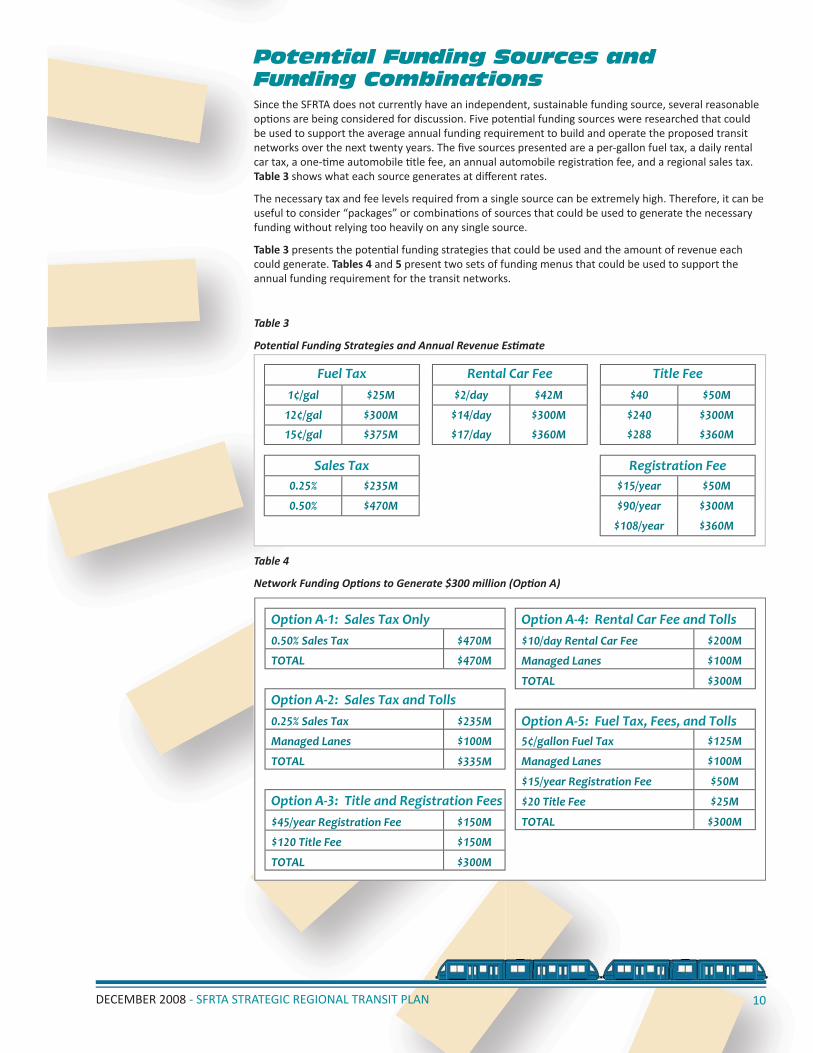
Potential Funding Sources and Funding CombinationsSince the SFRTA does not currently have an independent, sustainable funding source, several reasonable opti ons are being considered for discussion. Five potenti al funding sources were researched that could be used to support the average annual funding requirement to build and operate the proposed transit networks over the next twenty years. The fi ve sources presented are a per-gallon fuel tax, a daily rental car tax, a one-ti me automobile ti tle fee, an annual automobile registrati on fee, and a regional sales tax. Table 3 shows what each source generates at diff erent rates.
The necessary tax and fee levels required from a single source can be extremely high. Therefore, it can be useful to consider “packages” or combinati ons of sources that could be used to generate the necessary funding without relying too heavily on any single source.
Table 3 presents the potenti al funding strategies that could be used and the amount of revenue each could generate. Tables 4 and 5 present two sets of funding menus that could be used to support the annual funding requirement for the transit networks.
Table 3
Potenti al Funding Strategies and Annual Revenue Esti mate
Table 4
Network Funding Opti ons to Generate $300 million (Opti on A)
10DECEMBER 2008 - SFRTA STRATEGIC REGIONAL TRANSIT PLAN
Fuel Tax Rental Car Fee Title Fee
Registration FeeSales Tax
¢/gal
¢/gal
M
M
/day
/day
M
M
/day M
M
M
¢/gal M M
/year
/year
M
M
/year M
. %
. %
M
M
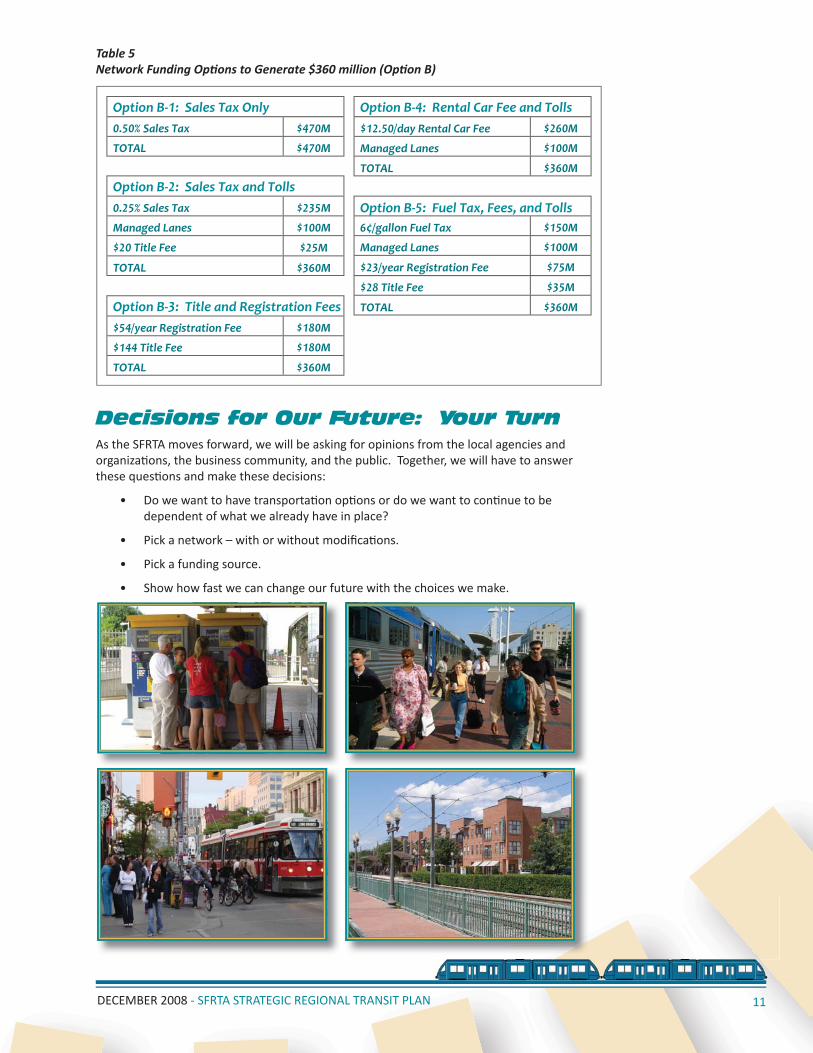
Decisions for Our Future: Your TurnAs the SFRTA moves forward, we will be asking for opinions from the local agencies and organizati ons, the business community, and the public. Together, we will have to answer these questi ons and make these decisions:
Do we want to have transportati on opti ons or do we want to conti nue to be • dependent of what we already have in place?
Pick a network – with or without modifi cati ons.•
Pick a funding source.•
Show how fast we can change our future with the choices we make.•
Option B- : Sales Tax Only
Option B- : Fuel Tax, Fees, and Tolls
. % Sales Tax
TOTAL
M
M
¢/gallon Fuel Tax
Managed Lanes
M
M
Option B- : Rental Car Fee and Tolls. /day Rental Car Fee
Managed Lanes
M
M
Option B- : Sales Tax and Tolls. % Sales Tax
Managed Lanes
Title Fee
M
M
Option B- : Title and Registration Fees/year Registration Fee
Title Fee
TOTAL
M
M
/year Registration Fee M
Title Fee M
TOTAL M
TOTAL M
M
TOTAL M
M
Table 5Network Funding Opti ons to Generate $360 million (Opti on B)
11DECEMBER 2008 - SFRTA STRATEGIC REGIONAL TRANSIT PLAN