Embed Size (px)
Citation preview
Creative Components Iowa State University Capstones, Theses and Dissertations
Fall 2019
Strategic Pricing of Used Products for e-Commerce Sites Strategic Pricing of Used Products for e-Commerce Sites
Akshay Reddy Chada
Follow this and additional works at: https://lib.dr.iastate.edu/creativecomponents
Part of the Management Information Systems Commons
Recommended Citation Recommended Citation Chada, Akshay Reddy, "Strategic Pricing of Used Products for e-Commerce Sites" (2019). Creative Components. 377. https://lib.dr.iastate.edu/creativecomponents/377
This Creative Component is brought to you for free and open access by the Iowa State University Capstones, Theses and Dissertations at Iowa State University Digital Repository. It has been accepted for inclusion in Creative Components by an authorized administrator of Iowa State University Digital Repository. For more information, please contact [email protected].

i
Strategic Pricing of Used Products for e-Commerce Sites
by
Akshay Reddy Chada
A creative component submitted to the graduate faculty
in partial fulfillment of the requirements for the degree of
MASTER OF SCIENCE
Major: Information Systems
Program of Study Committee:
Dr. Anthony M. Townsend, Major Professor
The student author, whose presentation was approved by the program of the study committee, is
solely responsible for the content of the report. The Graduate College will ensure this report is
globally accessible and will not permit alteration after a degree is conferred.
Iowa State University
Ames, Iowa
2019
ii
TABLE OF CONTENTS
Page
LIST OF FIGURES ................................................................................................... iii
NOMENCLATURE .................................................................................................. iv
ACKNOWLEDGMENTS ......................................................................................... v
ABSTRACT ……………………………….............................................................. vi
CHAPTER 1 INTRODUCTION ............................................................................... 1
CHAPTER 2 LITERATURE REVIEW .................................................................... 4
CHAPTER 3 RESALE MARKET ......................................................................... 7
CHAPTER 4 EXPLORATORY DATA ANALYSIS ............................................... 10
4.1 Price ............................................................................................................... 11
4.2 Brand Category .............................................................................................. 13
4.3 Brand Name ................................................................................................... 13
4.4 Shipping ……………………………………………………………………. 14
4.5 Item Condition ID ………………………………………………………….. 15
CHAPTER 5 METHODS .......................................................................................... 17
5.1 Feature Extraction …………………………………………………………… 17
5.2 Ridge Regression ……………………………………………………………. 20
5.3 LightGBM …………………………………………………………………… 22
5.4 Measures and Metrics ……………………………………………………….. 25
CHAPTER 6 RESULTS ............................................................................................. 26
CHAPTER 7 CONCLUSION AND FUTURE SCOPE ............................................. 28
REFERENCES ............................................................................................................ 29
APPENDIX .................................................................................................................. 31

iii
LIST OF FIGURES
Figure 1: Source: Data vis eMarketer (Statista) “ecommerce revenue over last 10 years”
Figure 2: Source: Susan Li. (Jul 23,2018).” Machine Learning for Retail Price
Recommendation with Python”. https://towardsdatascience.com/machine-
learning-for-retail-price-suggestion-with-python- 64531e64186d. “comparing two
different products based on description”
Figure 3: Source: TheredUP 2018 Fashion Resale Report. “Resale market revenue based on
category”
Figure 4: Source: TheredUP 2018 Fashion Resale Report. “Resale market revenue trend
over 2009-2019”
Figure 5: The various fields used in this project with their name, Data Type and description
Figure 6: Python code to identify the missing values in the dataset
Figure 7: Python code to change the missing or blank records with keyword missing
Figure 8: R code to apply logarithmic error to the right skewed data
Figure 9: Histogram depicting the logarithmic range of price based on the count of products
Figure 10: Python code to combine the dataset and separate the target variable
Figure 11: Python code to split the category into 3 different fields and assign "Missing"
keyword to the missing and blank records
Figure 12: Python code to apply Label binarizer to identify the unique brand names
Figure 13: Histogram indicating the most popular brands based on brand category
Figure 14: R code to build the box plot between shipping ID and the log of price
Figure 15: Box plot indicating the relationship between shipping ID and Price
Figure 16: R code to build the Box plot between Item Condition ID and Price
Figure 17: Box plot indicating the relationship between Item condition ID and Price
Figure 18: Python code to combine Item condition ID and Shipping ID to a indicator variable
Figure 19: Python code to convert all the categorical variables into panda categorical data
Figure 20: Count Vectorization
Figure 21: Tf-Idf Vectorization
Figure 22: Python code for converting all the matrices into a single sparse row
iv
Figure 23: Ridge Regression Sag Solver
Figure 24: Result Sag solver
Figure 25: Ridge Regression Lsqr solver
Figure 26: Result Lsqr solver
Figure 27: LightGBM Learning rate: 0.75
Figure 28: LightGBM1 Results
Figure 29: LightGBM Learning rate:0.85
Figure 30: LightGBM2 results
Figure 31: RSME and R Square results

v
NOMENCLATURE
EDA Exploratory data analysis
LightGBM Light Gradient Boosting Machine
Tf-Idf Inverse Document Frequency Vectorizer
B2C Business to Consumer
C2C Consumer to Consumer
RSMLE Root Mean Square Logarithmic Error

vi
ACKNOWLEDGMENTS
I would like to start with thanking Professor, Dr. Antony M Townsend. He was a constant
support and a good reference source during my project. Along with his immense knowledge in
the field of Analytics, the standout attribute of Professor Townsend is his patience levels, he
understands the student’s needs and guides them in the right direction. His creative component
training course MIS 557x has helped me in structuring my project efficiently.
I would also like to thank all my professors at Iowa state College of business, during my program
they have helped me a lot in nurturing my skills and the analytics courses provided in the MIS
program have been the major motivation for this project.
Finally, I would like to thank my friends and family for their support during my journey at Iowa
state university.
vii
ABSTRACT
In the modern world, the e-commerce market is growing rapidly. The platform for shopping is
shifting from retail stores to the online shopping applications. People are inclined towards sitting
in their homes and purchasing products ranging from electronics, clothing to even groceries
rather than going to malls or shopping centers. Along with the new products, the growth of
online shopping has given users an opportunity to buy and sell used products easily like never
before. One major issue in the used product sector compared to the new products sector is the
pricing of used products. First time sellers in online marketplaces are finding it difficult to sell
their products. The growth of online marketplaces has triggered the interest in building
algorithms for price suggestions to the sellers. Also, the growth of machine learning and big data
in predictive modeling has raised the importance of using them to improve the pricing in Used
products business. By obtaining a solution for price prediction via product features for B2C and
C2C online retailers, it will be easier for sellers to sell, and enlarge the selling-shopping
community of such user-based marketplaces. It could also be a great competitive advantage for
companies or individual sellers having highly accurate pricing decision-support. This is the
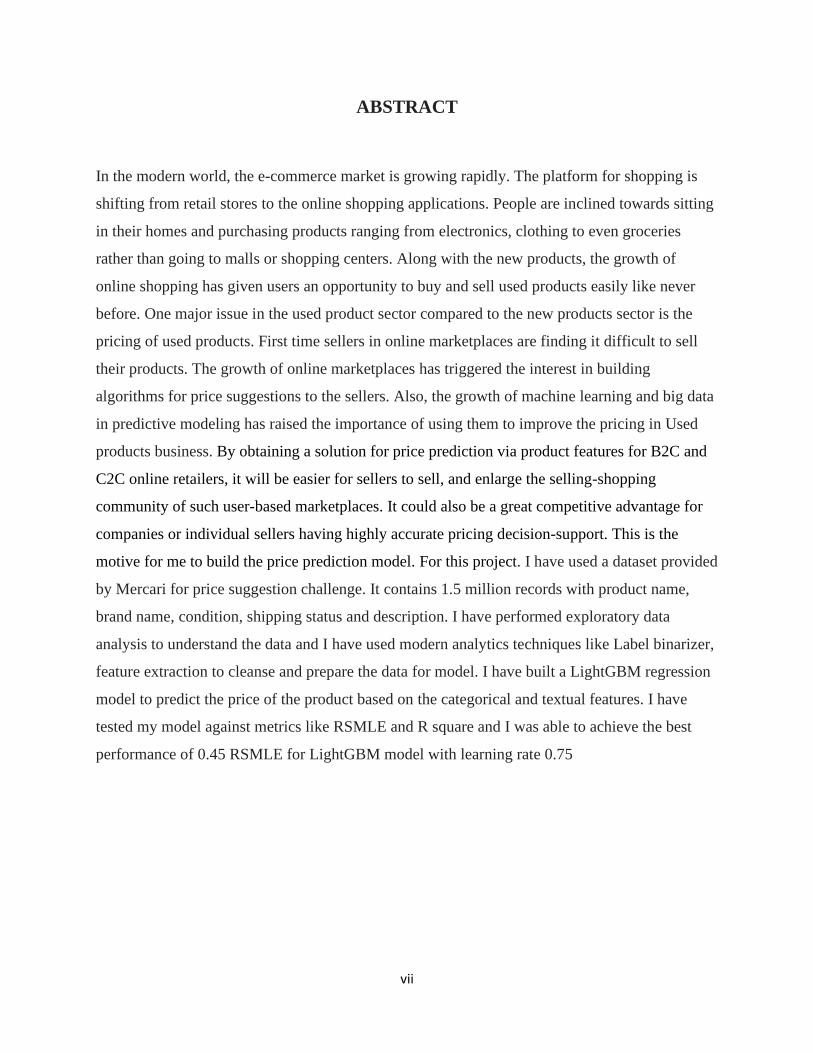
motive for me to build the price prediction model. For this project. I have used a dataset provided
by Mercari for price suggestion challenge. It contains 1.5 million records with product name,
brand name, condition, shipping status and description. I have performed exploratory data
analysis to understand the data and I have used modern analytics techniques like Label binarizer,
feature extraction to cleanse and prepare the data for model. I have built a LightGBM regression
model to predict the price of the product based on the categorical and textual features. I have
tested my model against metrics like RSMLE and R square and I was able to achieve the best
performance of 0.45 RSMLE for LightGBM model with learning rate 0.75
1
CHAPTER - 1
INTRODUCTION
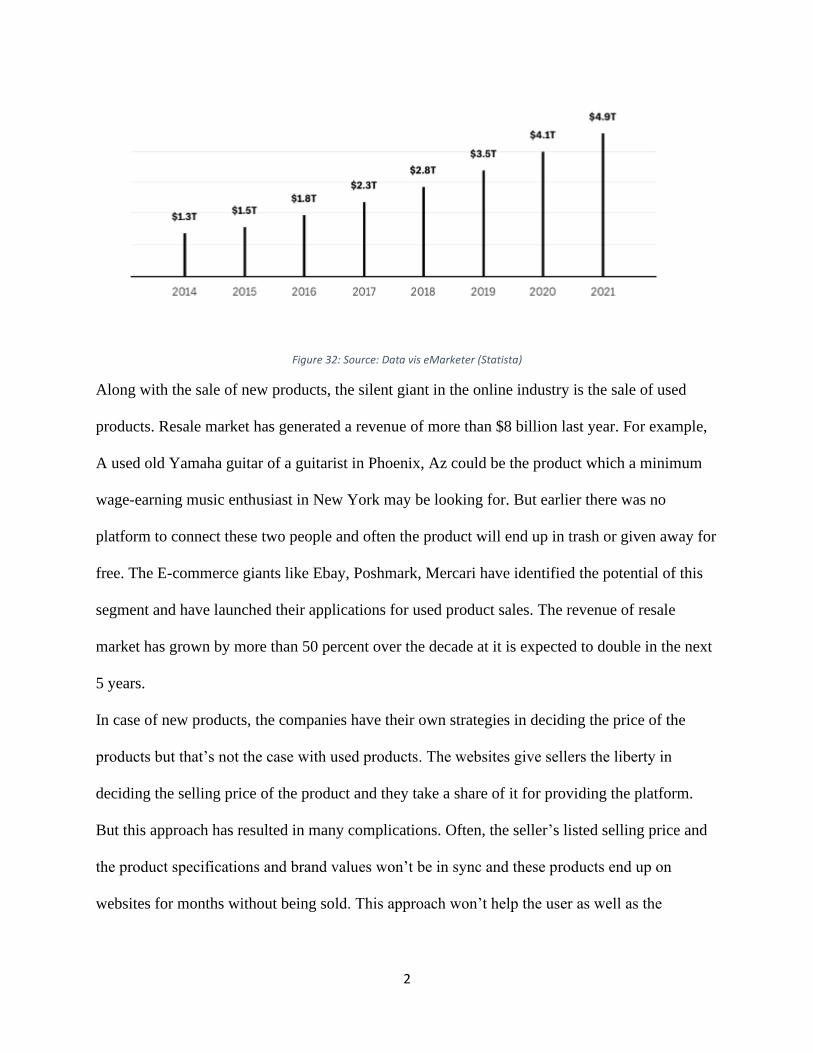
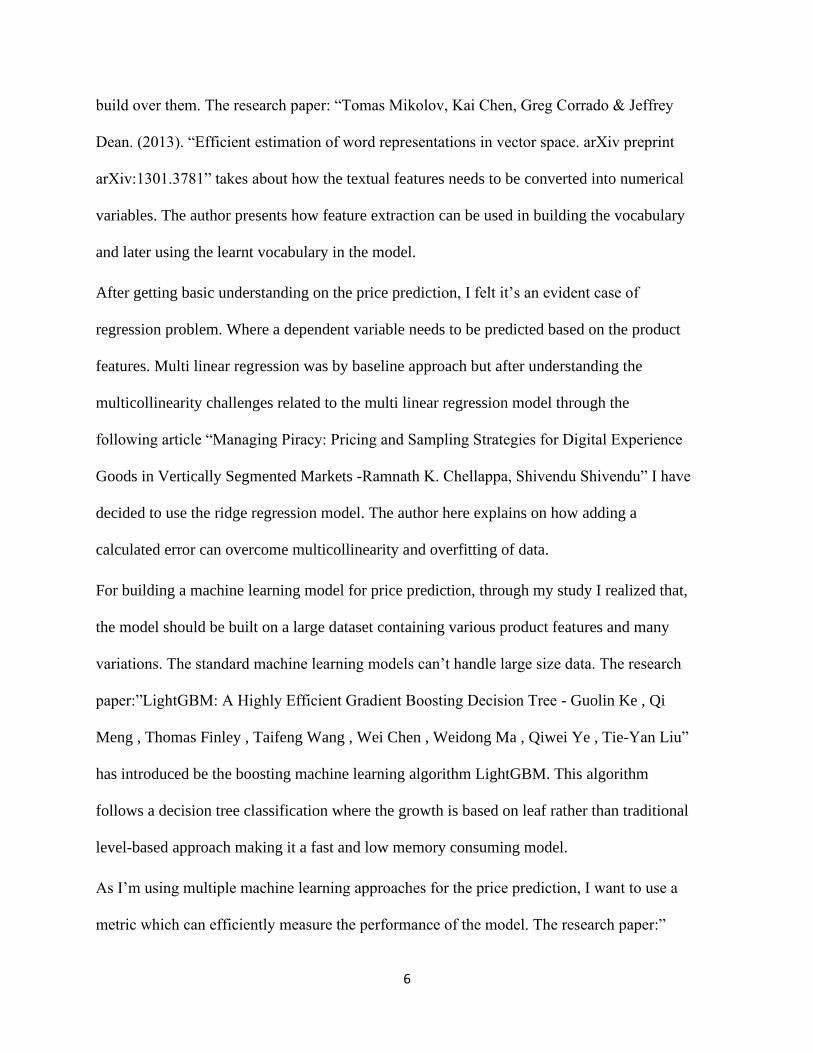
Over the past decade, the online sales market has grown exponentially. E-Commerce is
responsible for more than $2.3 Trillion in 2018 and it is expected to double by 2021. Statistics
show an average human spends more than 3 hours on phone and 35 minutes out of those in
surfing e-commerce Sites. With the availability of internet everywhere people are choosing to
purchase their necessary products online. This trend is visible especially in case of youngsters,
age group 20-30 who generate 75% of online sales. All the major players across different
industries have established their presence online and are preferring to sell products online instead
of maintaining stores. The advertising over the social media platforms is also contributing to the
increase in online sales
Apart from having their own online portal’s. The company’s also sell their products on E-
commerce sites. Over the past decade, Amazon, Ebay have emerged as the leaders in E-
commerce market and presence of their products on these platforms have become a necessity for
the companies. The major advantage of these sites is their ability to ship products across the
country and globally. So, the regions which cannot be reached through retail stores are reached
through these e- commerce sites.
2
Figure 32: Source: Data vis eMarketer (Statista)
Along with the sale of new products, the silent giant in the online industry is the sale of used
products. Resale market has generated a revenue of more than $8 billion last year. For example,
A used old Yamaha guitar of a guitarist in Phoenix, Az could be the product which a minimum
wage-earning music enthusiast in New York may be looking for. But earlier there was no
platform to connect these two people and often the product will end up in trash or given away for
free. The E-commerce giants like Ebay, Poshmark, Mercari have identified the potential of this
segment and have launched their applications for used product sales. The revenue of resale
market has grown by more than 50 percent over the decade at it is expected to double in the next
5 years.
In case of new products, the companies have their own strategies in deciding the price of the
products but that’s not the case with used products. The websites give sellers the liberty in
deciding the selling price of the product and they take a share of it for providing the platform.
But this approach has resulted in many complications. Often, the seller’s listed selling price and
the product specifications and brand values won’t be in sync and these products end up on
websites for months without being sold. This approach won’t help the user as well as the

3
website. So, almost all the used product websites have decided to have their own price prediction
models.
There are 3 main factors that decide the sale of the product. First the product title, Users
generally use keywords like brand name, product specification while searching the product.
Second is the Category, the products need to be categorized properly as the user could also use
the category to filter the products. Finally, the most important attribute is the Item description,
the users go through the description keenly before choosing the product. So, the description
needs to be specific. These factors will be the deciding elements in price prediction. The
challenge of building a predictive model on these unstructured parameters is the inspiration
behind this project.
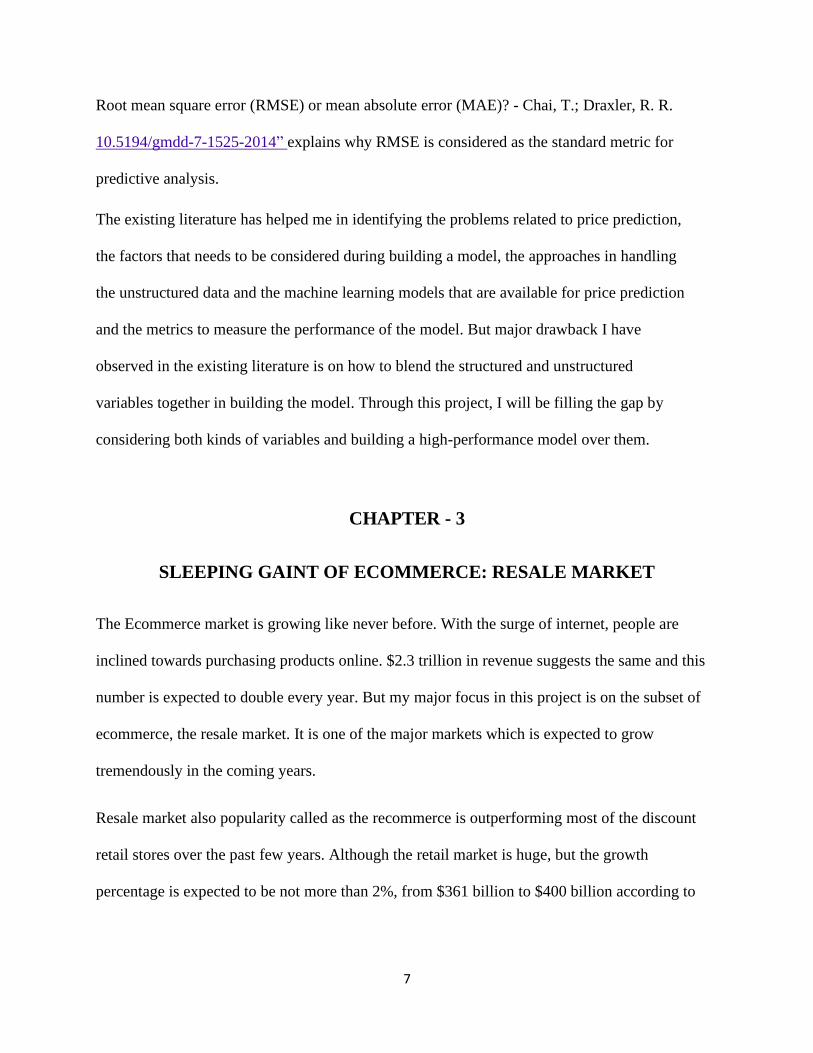
Figure 33: Source: Susan Li. (Jul 23,2018).” Machine Learning for Retail Price Recommendation with Python”. https://towardsdatascience.com/machine-learning-for-retail-price-suggestion-with-python- 64531e64186d
The major factors Product Name, Product Category and Product Description are textual
unstructured parameters. They cannot be directly fed into any unsupervised learning model. So,
all the textual features need to be converted into fixed length vectors then they can be used as
input for the machine learning models. Another issue is, while dealing with textual data it is
important to have large amount of data to avoid overfitting
For this project, to tackle these issues, I have chosen the dataset from Mercari’s price suggestion
challenge where the training dataset has over 1 million records and has a test data of 700k
records. On textual parameters I have performed feature extraction and built an unsupervised
LightBGM regression algorithm to predict the price.
4
The target audience for this model would be the E-commerce sites whose focus area is used
products. I have used description, condition and shipping features in building this model. This
model can also be used on estimating the price of new products based on their brand name and
category features.
The purpose of this quantitative study is to predict the price of the product based on the product
features like Product Name, Category, Condition, Brand Name and shipping status for E-
commerce sites and Used product markets. The data is taken from Online selling App Mercari’s
price suggestion challenge and a regression model is build using LightGBM algorithm for price
prediction
CHAPTER - 2
LITERATURE REVIEW
I have performed extensive research on predictive analysis on unstructured data and observed
that there are gaps in the existing literature. Many scholars have used either structured data or
unstructured data for analysis but not many have tried to combine both of them in a model. From
the limited literature available, I have researched on the price prediction issues, web market for
sales and the metrics used to measure the performance of the model.
In a competing world where they’re many players providing similar services, It is important
from a company to have certain strategies and processes to leverage the advantages of
modern technologies in order to survive in the market. “Case Study:Dan Hill.(20 Aug 2015)
.“The Secret of Airbnb’s Pricing Algorithm: The sharing economy needs machine
intelligence to set prices” https://spectrum.ieee.org/computing/software/the- secret-of-
airbnbs-pricing-algorithm takes about how machine learning algorithms and approaches help
in setting prices. For this study, the author has taken Airbnb’s source data and explained how
5
Airbnb provides price suggestions to the owners based on the features they have mentioned.
Chapter 3 and 4 takes about the necessity of having a pricing algorithm and the features that
needs to be considered.
Susan Li. (Jul 23,2018).” Machine Learning for Retail Price Recommendation with Python”.
https://towardsdatascience.com/machine-learning-for-retail-price-suggestion-with-python-
64531e64186d This research paper takes about the rich machine learning libraries and
approaches that can be built using Python. In this research, the retail stores are taken as the
platform and the author talks about how the reviews, product description, sales and time of
the year impacts the price of the product. The author based on these features also suggests
the amount of discount that needs to be provided to the customers.
While building a machine learning model it is important to choose the right variables. Often
the choice of variables, their collinearity and variation decides the performance of the model.
During my research, I have gone through many articles and citations to study the factors that
impact the price the most. “Duncan, A., & M. McPhail. (2013). “Price Optimization for the
U.S. Market. Techniques and Implementation Strategies.” This article talks about the
technique’s companies use to attract customers. Few of them would be, providing free
shipping service to elite customers, providing combo saving options based on the customers
prior purchases etc.
After performing researching on the necessity of price suggestion and the features that drive
the price prediction. I have identified that, price is dependent on many unstructured data
features like Product description, Product category, Brand description and reviews etc. These
variables cannot be treated in a similar way as categorical or numerical variables. They
should be grouped and converted into fixed length vectors for machine learning models to
6
build over them. The research paper: “Tomas Mikolov, Kai Chen, Greg Corrado & Jeffrey
Dean. (2013). “Efficient estimation of word representations in vector space. arXiv preprint
arXiv:1301.3781” takes about how the textual features needs to be converted into numerical
variables. The author presents how feature extraction can be used in building the vocabulary
and later using the learnt vocabulary in the model.
After getting basic understanding on the price prediction, I felt it’s an evident case of
regression problem. Where a dependent variable needs to be predicted based on the product
features. Multi linear regression was by baseline approach but after understanding the
multicollinearity challenges related to the multi linear regression model through the
following article “Managing Piracy: Pricing and Sampling Strategies for Digital Experience
Goods in Vertically Segmented Markets -Ramnath K. Chellappa, Shivendu Shivendu” I have
decided to use the ridge regression model. The author here explains on how adding a
calculated error can overcome multicollinearity and overfitting of data.
For building a machine learning model for price prediction, through my study I realized that,
the model should be built on a large dataset containing various product features and many
variations. The standard machine learning models can’t handle large size data. The research
paper:”LightGBM: A Highly Efficient Gradient Boosting Decision Tree - Guolin Ke , Qi
Meng , Thomas Finley , Taifeng Wang , Wei Chen , Weidong Ma , Qiwei Ye , Tie-Yan Liu”
has introduced be the boosting machine learning algorithm LightGBM. This algorithm
follows a decision tree classification where the growth is based on leaf rather than traditional
level-based approach making it a fast and low memory consuming model.
As I’m using multiple machine learning approaches for the price prediction, I want to use a
metric which can efficiently measure the performance of the model. The research paper:”
7
Root mean square error (RMSE) or mean absolute error (MAE)? - Chai, T.; Draxler, R. R.
10.5194/gmdd-7-1525-2014” explains why RMSE is considered as the standard metric for
predictive analysis.
The existing literature has helped me in identifying the problems related to price prediction,
the factors that needs to be considered during building a model, the approaches in handling
the unstructured data and the machine learning models that are available for price prediction
and the metrics to measure the performance of the model. But major drawback I have
observed in the existing literature is on how to blend the structured and unstructured
variables together in building the model. Through this project, I will be filling the gap by
considering both kinds of variables and building a high-performance model over them.
CHAPTER - 3
SLEEPING GAINT OF ECOMMERCE: RESALE MARKET
The Ecommerce market is growing like never before. With the surge of internet, people are
inclined towards purchasing products online. $2.3 trillion in revenue suggests the same and this
number is expected to double every year. But my major focus in this project is on the subset of
ecommerce, the resale market. It is one of the major markets which is expected to grow
tremendously in the coming years.
Resale market also popularity called as the recommerce is outperforming most of the discount
retail stores over the past few years. Although the retail market is huge, but the growth
percentage is expected to be not more than 2%, from $361 billion to $400 billion according to
8
eMarketer. On the other hand, the resale market is expected to double in the coming years from
$21 billion to $41 billion.
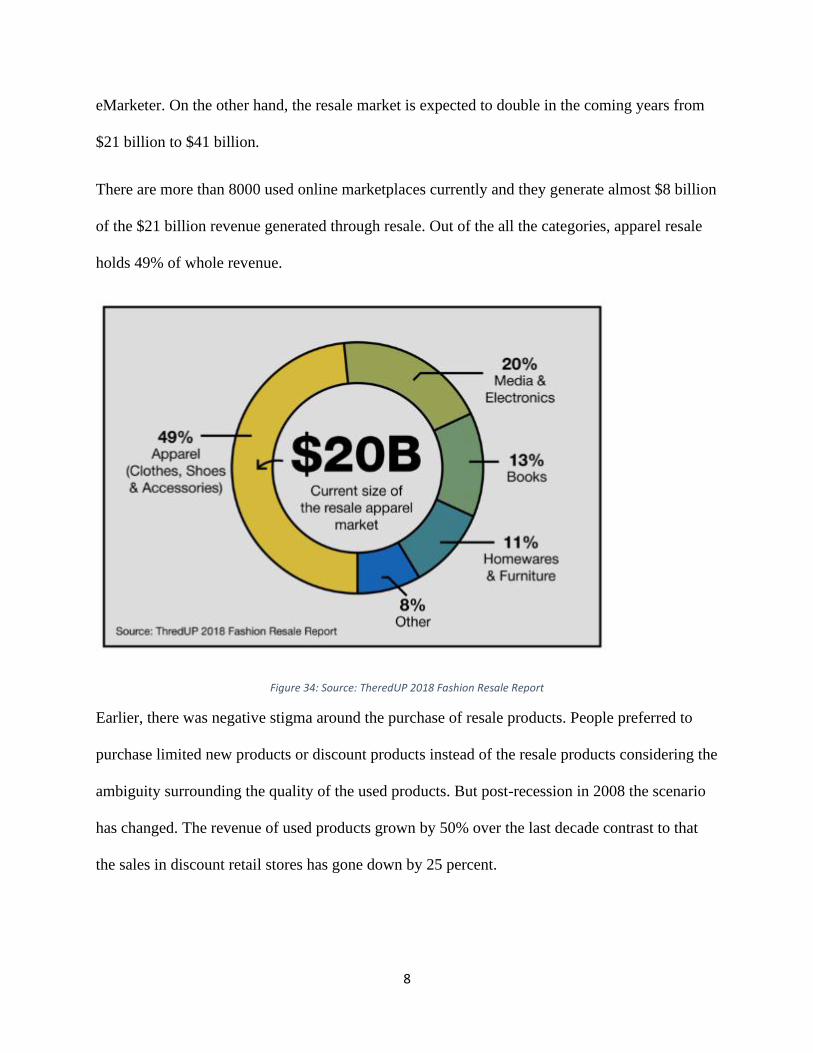
There are more than 8000 used online marketplaces currently and they generate almost $8 billion
of the $21 billion revenue generated through resale. Out of the all the categories, apparel resale
holds 49% of whole revenue.
Figure 34: Source: TheredUP 2018 Fashion Resale Report
Earlier, there was negative stigma around the purchase of resale products. People preferred to
purchase limited new products or discount products instead of the resale products considering the
ambiguity surrounding the quality of the used products. But post-recession in 2008 the scenario
has changed. The revenue of used products grown by 50% over the last decade contrast to that
the sales in discount retail stores has gone down by 25 percent.
9
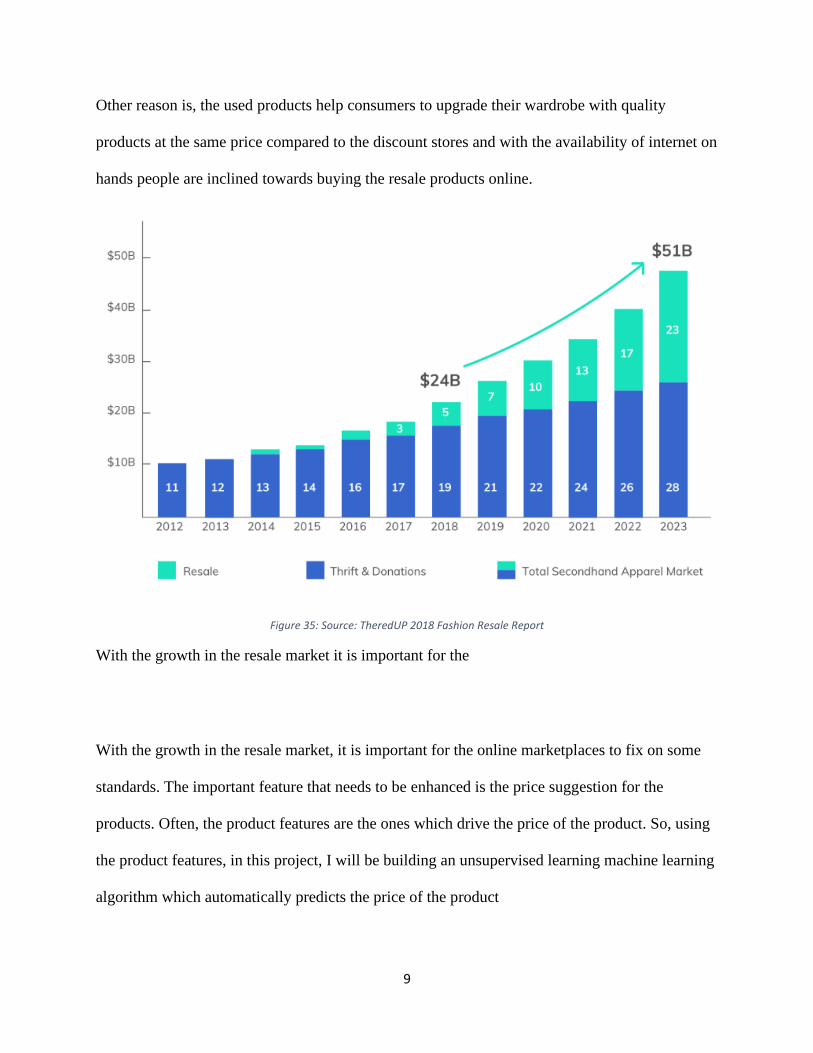
Other reason is, the used products help consumers to upgrade their wardrobe with quality
products at the same price compared to the discount stores and with the availability of internet on
hands people are inclined towards buying the resale products online.
Figure 35: Source: TheredUP 2018 Fashion Resale Report
With the growth in the resale market it is important for the
With the growth in the resale market, it is important for the online marketplaces to fix on some
standards. The important feature that needs to be enhanced is the price suggestion for the
products. Often, the product features are the ones which drive the price of the product. So, using
the product features, in this project, I will be building an unsupervised learning machine learning
algorithm which automatically predicts the price of the product

10
CHAPTER - 4
EXPLORATORY DATA ANALYSIS
I have taken the data set for a Kaggle competition “Mercari Price Suggestion Challenge. The
data set is in tsv format and the training set has approximately 1 million records
while the test set has 700k records. The data has 8 Numeric and Categorical types of variables.
For this project, I have performed extensive exploratory data analysis to understand the data and
thereby standardize it
Figure 36: The various fields used in this project with their name, Data Type and description
To start with, I want to identify the missing values in the existing data. After running the code, I
have identified Brand_name, Category_name and Item_description have the missing values out
of which for more than half of training data and 40 % of testing data brand names are missing. I
have addressed this issue by replacing the fielding with null values my “Missing”.

11
Figure 37: Python code to identify the missing values in the dataset
Figure 38: Result- Missing values in the training and testing dataset based on the variables
Figure 39: Python code to change the missing or blank records with keyword missing
Price
The average price of the data in the training set is $26.74 with values ranging from $- 0 $2009.
The Mode is $10 and the Median is $17. These values indicate that even though the price range
varies from 0 to 2009, most of the price values are not as high as $2009. Further analysis shows
that 95% of the products are priced below 75%. The price variable is heavily right skewed, so it
is transformed by applying logarithm to make it bell shaped distribution.
12
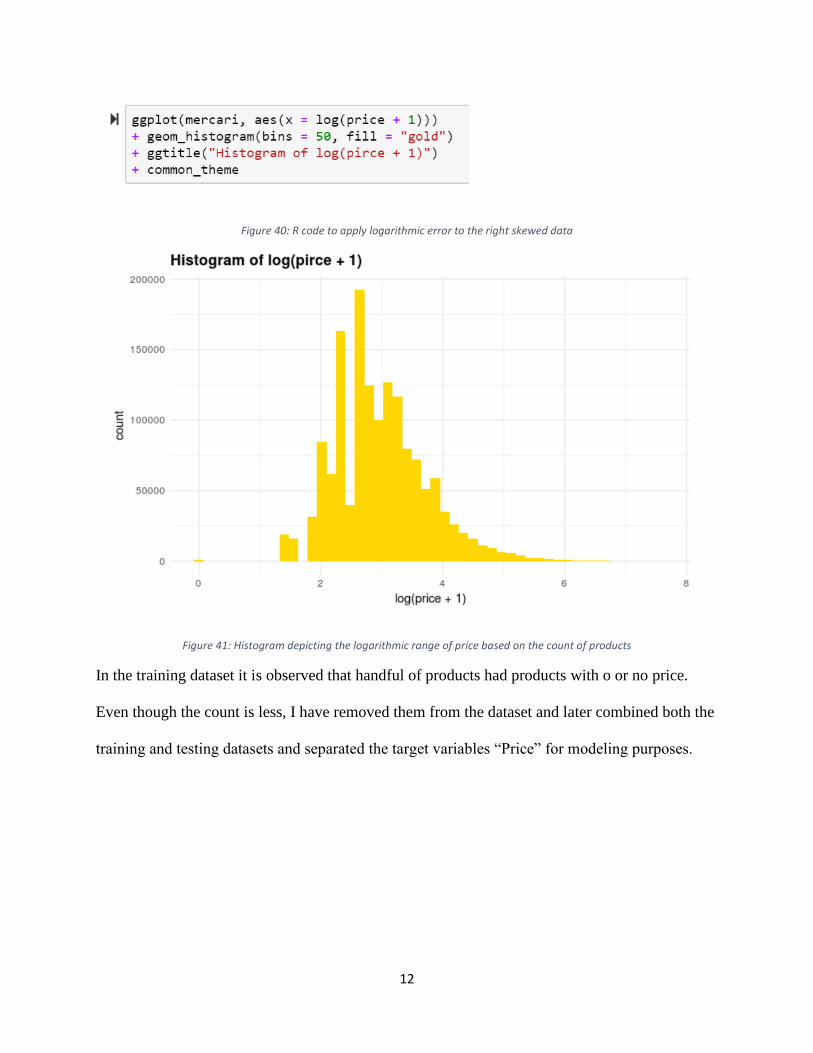
Figure 40: R code to apply logarithmic error to the right skewed data
Figure 41: Histogram depicting the logarithmic range of price based on the count of products
In the training dataset it is observed that handful of products had products with o or no price.
Even though the count is less, I have removed them from the dataset and later combined both the
training and testing datasets and separated the target variables “Price” for modeling purposes.
13
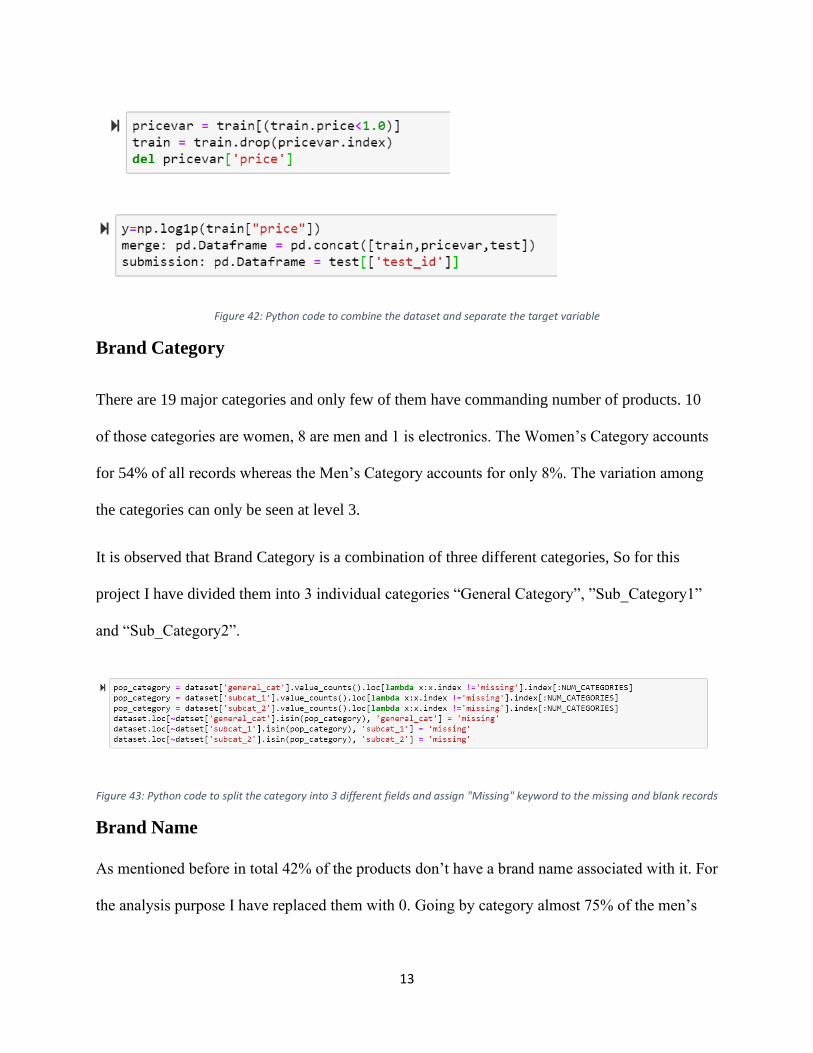
Figure 42: Python code to combine the dataset and separate the target variable
Brand Category
There are 19 major categories and only few of them have commanding number of products. 10
of those categories are women, 8 are men and 1 is electronics. The Women’s Category accounts
for 54% of all records whereas the Men’s Category accounts for only 8%. The variation among
the categories can only be seen at level 3.
It is observed that Brand Category is a combination of three different categories, So for this
project I have divided them into 3 individual categories “General Category”, ”Sub_Category1”
and “Sub_Category2”.
Figure 43: Python code to split the category into 3 different fields and assign "Missing" keyword to the missing and blank records
Brand Name
As mentioned before in total 42% of the products don’t have a brand name associated with it. For
the analysis purpose I have replaced them with 0. Going by category almost 75% of the men’s
14
category products have brand name but categories like Home goods, Sports & outdoors and
handmade have less than 25% products with brand names.
Based one the category, I have listed the top brand names by category. It is observed that PINK,
Nike, Victoria secret, LuLa Roe and Apple are the top products.
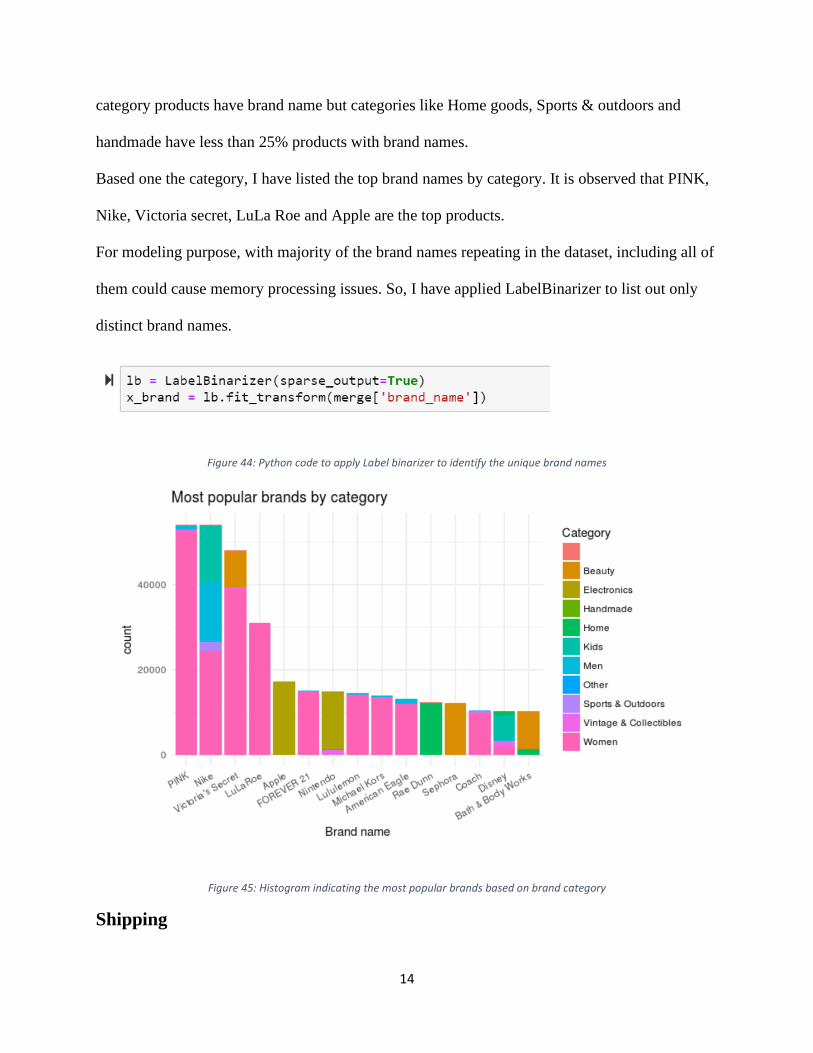
For modeling purpose, with majority of the brand names repeating in the dataset, including all of
them could cause memory processing issues. So, I have applied LabelBinarizer to list out only
distinct brand names.
Figure 44: Python code to apply Label binarizer to identify the unique brand names
Figure 45: Histogram indicating the most popular brands based on brand category
Shipping
15
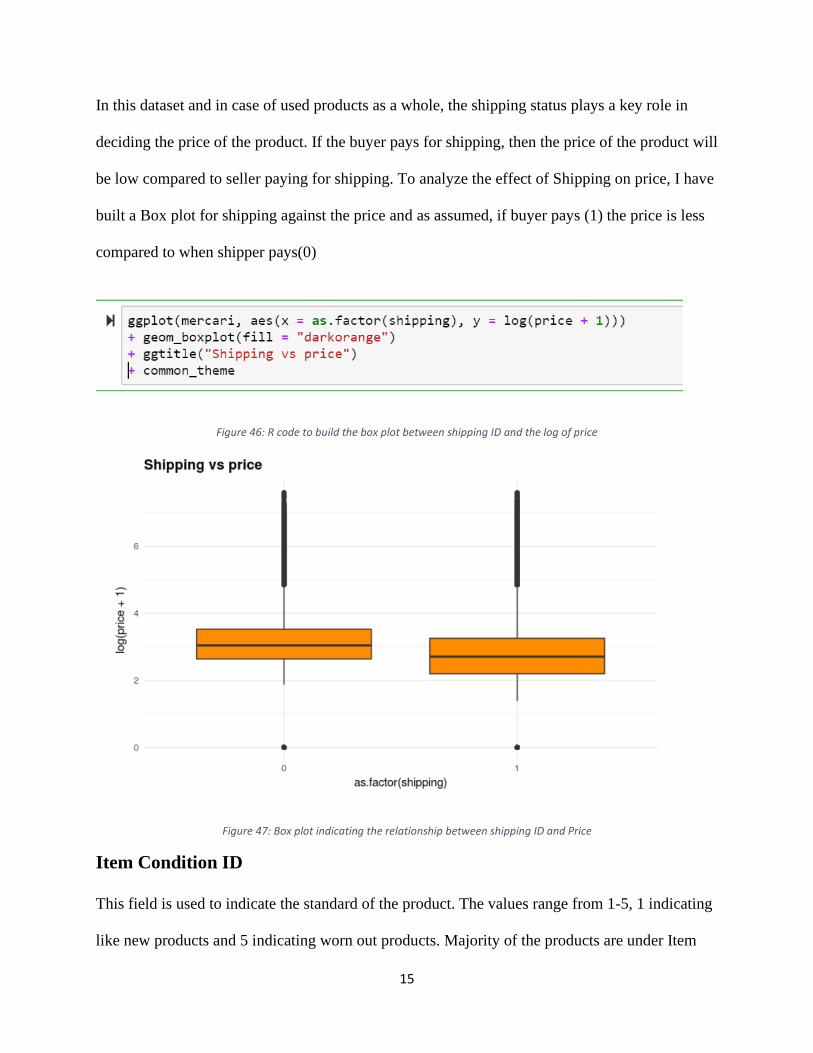
In this dataset and in case of used products as a whole, the shipping status plays a key role in
deciding the price of the product. If the buyer pays for shipping, then the price of the product will
be low compared to seller paying for shipping. To analyze the effect of Shipping on price, I have
built a Box plot for shipping against the price and as assumed, if buyer pays (1) the price is less
compared to when shipper pays(0)
Figure 46: R code to build the box plot between shipping ID and the log of price
Figure 47: Box plot indicating the relationship between shipping ID and Price
Item Condition ID
This field is used to indicate the standard of the product. The values range from 1-5, 1 indicating
like new products and 5 indicating worn out products. Majority of the products are under Item

16
condition ID ranging from 1-3. I have built the box plot for condition ID against price to identify
the variance in price based on the condition of the product but I have identified that there is no
visible trend between them as almost all the ID’s have equal median of price
Figure 48: R code to build the Box plot between Item Condition ID and Price
Figure 49: Box plot indicating the relationship between Item condition ID and Price
Figure 50: Python code to combine Item condition ID and Shipping ID to a indicator variable

17
As both shipping status and Item condition ID are categorical and have less impact on the price
prediction, I have combined them into a indicator variable thereby decreasing there memory
usage.
All the categorical variables are now converted into panda categorical variables for effect
modeling purpose.
Figure 51: Python code to convert all the categorical variables into panda categorical data type
CHAPTER – 5
METHODS
Feature extraction
The Categorical variables like Item Condition ID, Shipping have been converted into Panda
categorical variables and combined to form a matrix. Another Categorical variable
Brand_Name’s features are extracted using the label Vectorizer. The other variables that can
impact the price suggestion are Name of the product, Product Category and product description.
All these are textual features and their value can be extracted using the feature extraction
method.

18
The machine learning model won’t take textual features as input. In predictive analysis, the
textual information needs to be treated in a different way because the predictive model can take
only numbers as input. So, all the textual features need to be converted into a fixed vector of
number to extract their impact on price prediction.
The key words present in the record are identified using tokenization and later they are converted
into numerical values using feature extraction. The approach I used for building this model is the
“Bag of Words”. This is a simple model, where each record is taken as input and each word in
the record is given a unique ID and the degree at which a particular word is repeated in the
record is calculated. The order of the words is not considered. The output will be a fixed length
vector of numbers and each number indicates the number of times a word is repeated.
There are multiple ways in which feature extraction can be performed. In this model, I’m using
Count vectorization for Product name and Product category features and Tf-Idf vectorization for
Item description
Count Vectorizer
The count vectorization is a process in which vocabulary is built out of known words by
performing tokenization on all the records used in the model. This process involves two main
steps, Fit () and Transform (). Fit () function is used to build the vocabulary and the transform ()
function called on the records to transform them into vectors. This approach will be used in
transforming “Name” and “Category” textual data into numbers.
For example, the sentence “Jupiter is the biggest planet in the universe” is tokenized as { Jupiter:
1, is: 2, the: 3,biggest: 4, Planet: 5, in: 6, Universe :7}. This is a vector of 7 unique words, and it
is encoded as [[1 1 2 1 1 1 1]] as the word “The” repeats twice. Now if we apply transform

19
function on the sentence “Adidas Universe T-shirt” it will be encoded as [[0 0 0 0 0 0 1]] as it is
picking only the word Jupiter from the vocabulary. Unimpactful words like The, of, is, on etc can
be eliminated but as “Name” and “Category” won’t have these words that step can be skipped.
Figure 52: Count Vectorization
TF-IDF Vectorizer
The Count vectorizer is a basic approach as it just count the words in the vector and the in many
scenarios the high count of less meaningful words won’t help in building an efficient algorithm.
Words like “The, of, is, on” will have high weightage but it has very less impact. So, the count
vectorizer becomes ineffective in case of records with large textual data. As the feature we are
trying to extract “Item Description” has lot of less impactful words this approach cannot be used.
The other efficient alterative is Term frequency- Inverse document frequency vectorization. This
process follows a similar approach of Fit() and Transform() but the inverse document frequency
makes it more effective. The Term frequency gives the count of words and the Inverse document
frequency reads the vectors and gives low score to the words which repeat across all the records.
20
For example the model learn from these sentences “A lion is roaring”,. ” A dog is barking”. In
this scenario the words “A and is” get low score. Basically, this approach gives importance to the
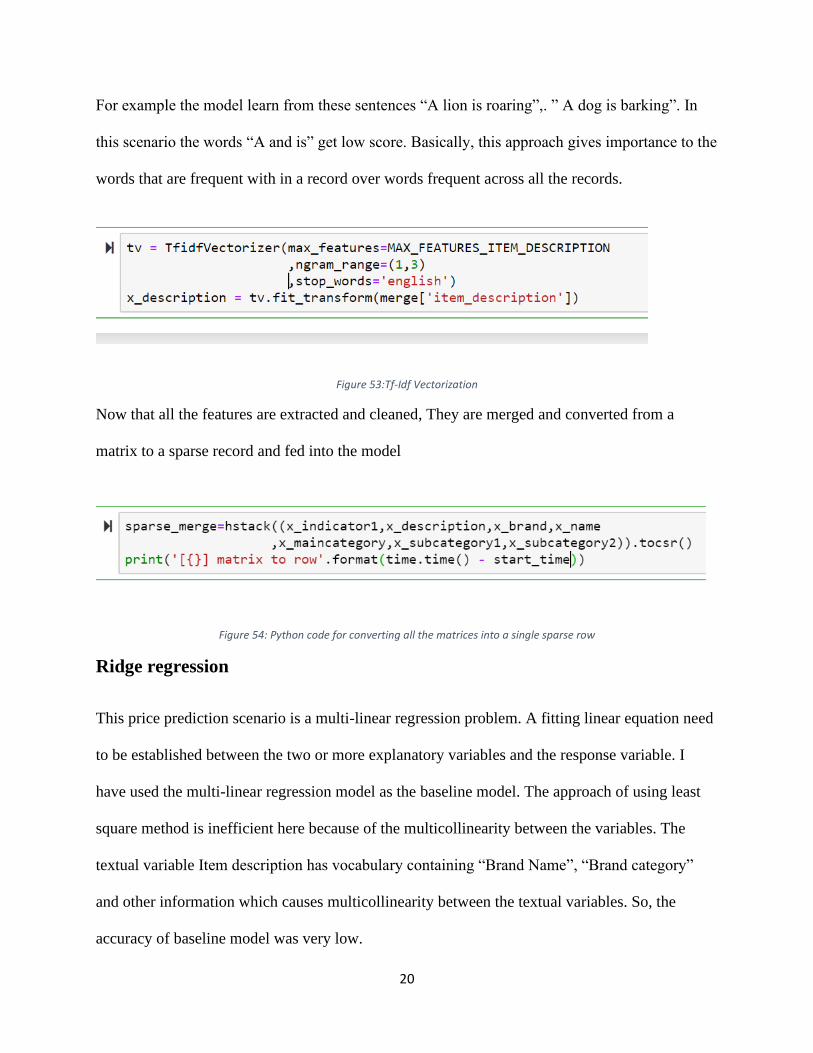
words that are frequent with in a record over words frequent across all the records.
Figure 53:Tf-Idf Vectorization
Now that all the features are extracted and cleaned, They are merged and converted from a
matrix to a sparse record and fed into the model
Figure 54: Python code for converting all the matrices into a single sparse row
Ridge regression
This price prediction scenario is a multi-linear regression problem. A fitting linear equation need
to be established between the two or more explanatory variables and the response variable. I
have used the multi-linear regression model as the baseline model. The approach of using least
square method is inefficient here because of the multicollinearity between the variables. The
textual variable Item description has vocabulary containing “Brand Name”, “Brand category”
and other information which causes multicollinearity between the textual variables. So, the
accuracy of baseline model was very low.
21
Ridge Regression is a technique to analyze multiple regression data that has a problem of
multicollinearity. When multicollinearity occurs, least squares estimates are unbiased, but their
variances are large, so they may be far from the true value. By adding a degree of bias to the
regression estimates, ridge regression help reducing the standard errors.
Two variants of Ridge Regression algorithm were used for the analysis with some tweaks in the
number of features used and type of Ridge solver used. For this model, I have used two variants
of ridge solver namely “Sag” and “LSQR” to analyze on how the dataset performs on different
dimension.
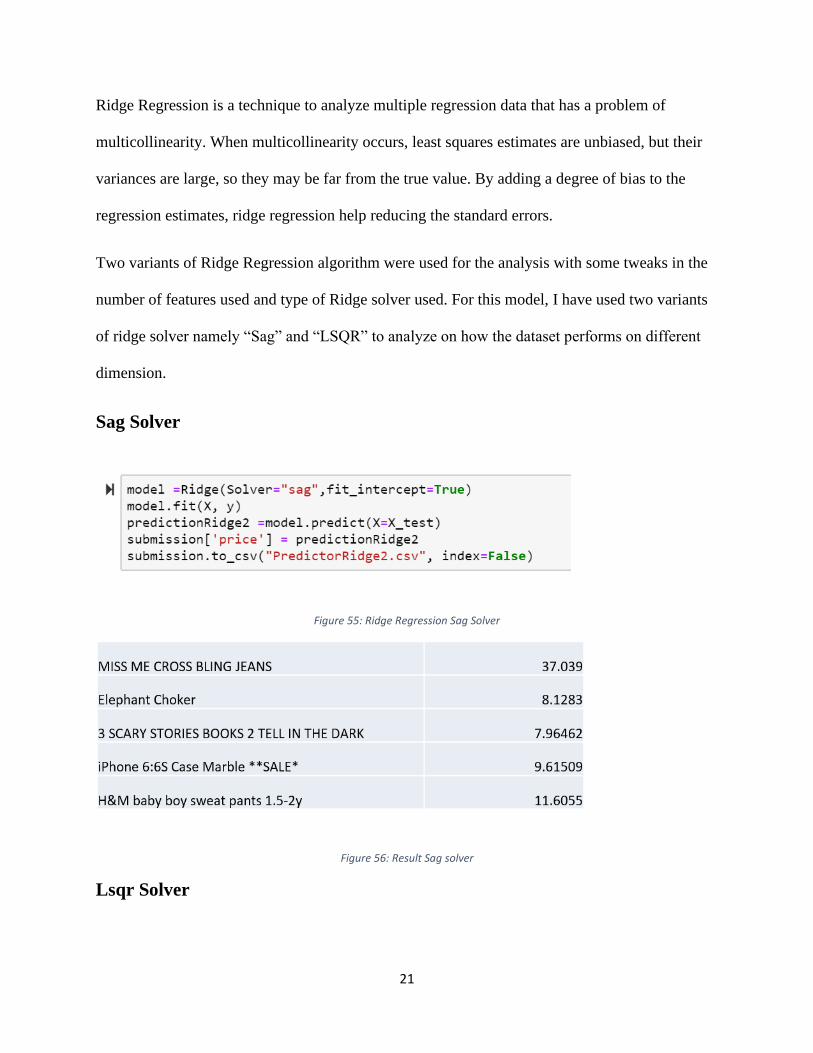
Sag Solver
Figure 55: Ridge Regression Sag Solver
Figure 56: Result Sag solver
Lsqr Solver
22
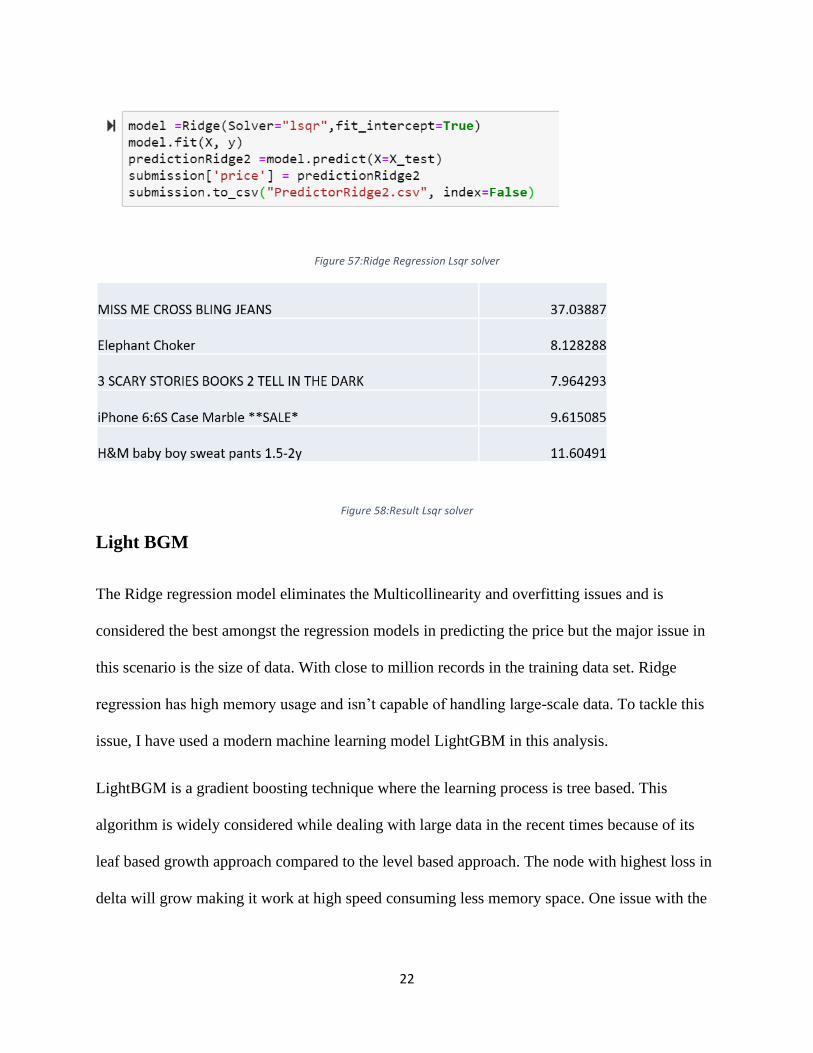
Figure 57:Ridge Regression Lsqr solver
Figure 58:Result Lsqr solver
Light BGM
The Ridge regression model eliminates the Multicollinearity and overfitting issues and is
considered the best amongst the regression models in predicting the price but the major issue in
this scenario is the size of data. With close to million records in the training data set. Ridge
regression has high memory usage and isn’t capable of handling large-scale data. To tackle this
issue, I have used a modern machine learning model LightGBM in this analysis.
LightBGM is a gradient boosting technique where the learning process is tree based. This
algorithm is widely considered while dealing with large data in the recent times because of its
leaf based growth approach compared to the level based approach. The node with highest loss in
delta will grow making it work at high speed consuming less memory space. One issue with the

23
LightGBM algorithm is, it can cause overfitting with small dataset. But considering the size of
data in this prediction analysis it is considered as the most efficient approach.
This model has many parameters but for this scenario I have considered the only learning rate,
rate at which a single tree effects the outcome. Application, which specifies the model. No of
Leaves, the number of trees considered in the model. Metric, Used to specify the delta loss of
the model.
Gradient boosting decision tree (GBDT) is a widely used machine learning algorithm, due to its
efficiency, accuracy, and interpretability. GBDT achieves state-of-the-art performances in many
machine learning tasks, such as multi-class classification, click prediction, and learning to rank.
LightGBM is one of the recent implementations of GBDT. Light GBM is a gradient boosting
framework that uses tree-based learning algorithm. LightGBM speeds up the training process of
conventional GBDT by up to over 20 times while achieving almost the same accuracy. Two
variants of LightGBM algorithm were used for the analysis with some tweaks in parameters such
as number of features used, learning rate, number of leaves, number of boost round etc which
help to analyze on how the dataset performs on different dimension.
LightGBM1: Learning Rate:0.75
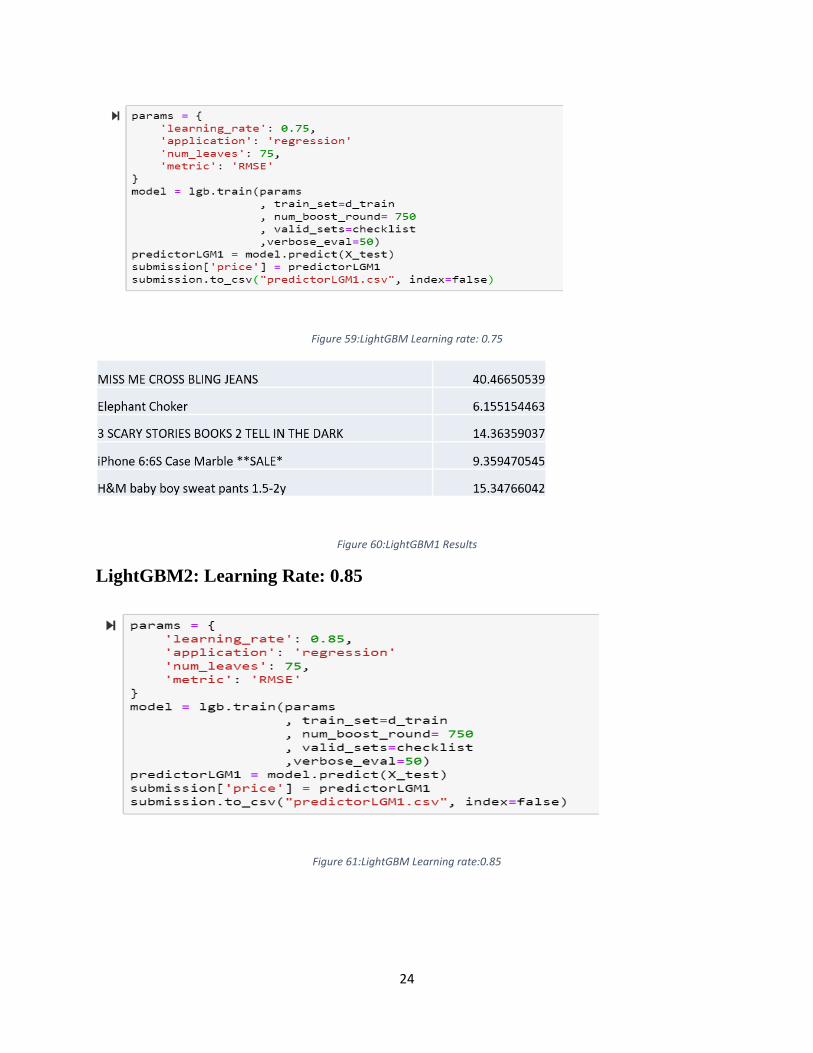
24
Figure 59:LightGBM Learning rate: 0.75
Figure 60:LightGBM1 Results
LightGBM2: Learning Rate: 0.85
Figure 61:LightGBM Learning rate:0.85

25
Figure 62:LightGBM2 results
Measures and Metrics
To measure the accuracy and performance of both the models, I have used the metrics RSME
and R square. These are the standard methods to check whether the prediction made by the
algorithm on the test data aligns with the predictions made on the training data. For an Ideal
model, these metrics will be same for both Training and Testing data. If one of those is more
then the model must have badly overfit the data
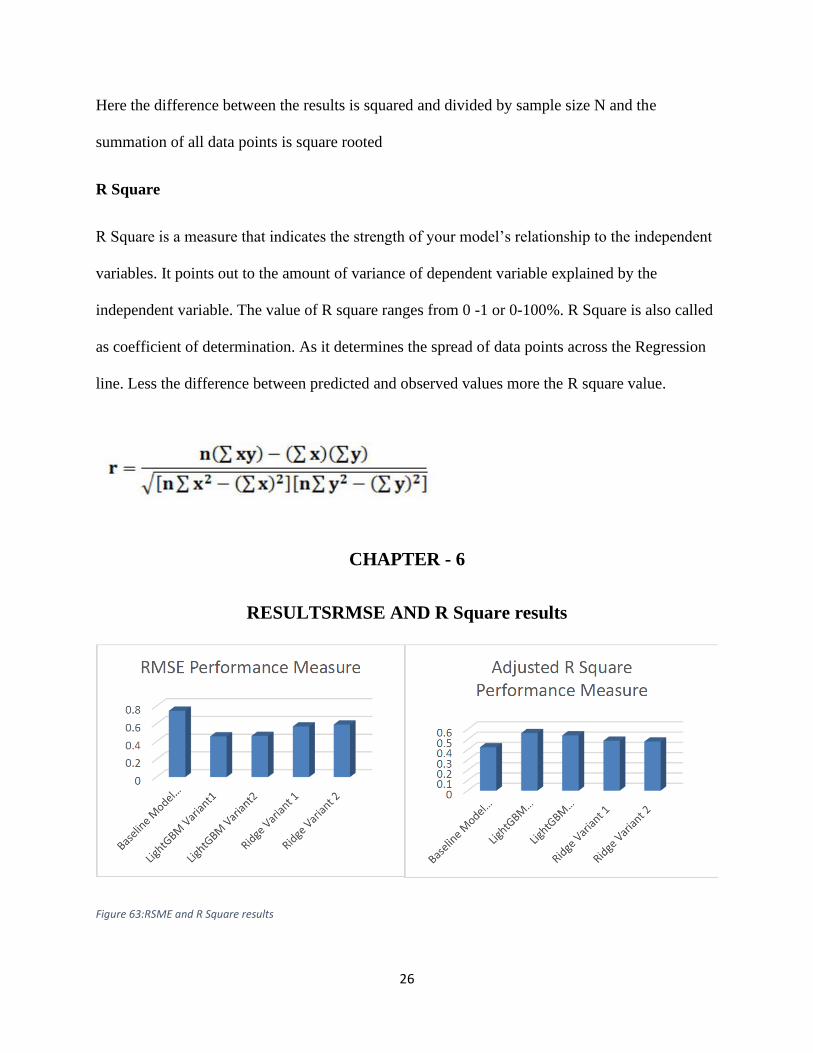
RSME
RSME is used to measure the performance of regression analysis model. It basically points the
Standard deviation between the results predicted by the model and the results observed. The
standard deviation between observed results and predicted results is called residual. The residual
is defined as distance of data points from the Regression line. Closer the data points to the
regression line better the performance of the model. The RSME value can be measured in as
follows,
26
Here the difference between the results is squared and divided by sample size N and the
summation of all data points is square rooted
R Square
R Square is a measure that indicates the strength of your model’s relationship to the independent
variables. It points out to the amount of variance of dependent variable explained by the
independent variable. The value of R square ranges from 0 -1 or 0-100%. R Square is also called
as coefficient of determination. As it determines the spread of data points across the Regression
line. Less the difference between predicted and observed values more the R square value.
CHAPTER - 6
RESULTSRMSE AND R Square results
Figure 63:RSME and R Square results

27
The motive of this project is to predict the price of a product using its own features. So, the
major objective is to find the data related to the products and design a model which efficiently
predicts the price of the products.
I have chosen a very reliable dataset from one of the top 5 online shopping marketplaces Mercari
and performed extensive exploratory data analysis and cleansing tasks like handling missing
values, splitting categories, converting categorical variables to numerical variables and
combining similar features. I have presented these steps in the exploratory data analysis chapter.
After preparing the standardized data, I have built Multi – linear regression model as the baseline
model. Considering the inability in handling multi collinearity and high RSME measure of 0.71.
I have discarded this model for my approach.
The other model that I have built are Ridge regression and LightGBM model. Both of them are
efficient models and capable of handling multicollinearity and overfitting of data. I have tried
couple of approaches for both the models, Lsqr and sag solvers for Ridge regression and
Learning rate’s of 0.75 and 0.85 for LightGBM and I have observed that the LightGBM variant 1
with learning rate 0.75 stand out model amongst the variations I have tried with a low RSME
score of 0.458476 and high R square value of 0.5310.
Considering the ability of handling large datasets and unstructured data along with high model
performance. Through this project, I have observed that LightGBM is the most efficient model
for Price prediction.
28
CHAPTER - 7
CONCLUSION AND FUTURE SCOPE
Price prediction has been a challenge for the online marketplaces. Sellers often are optimistic and
label products with selling price way higher than what it’s meant to be. The approach is to
automatically generate a price for the product based on the product features which helps as a
baseline for buyer and seller to negotiate on. With the exponential growth of big data and
machine learning, everyone in the market wants to leverage the potential of it and built a model
which predicts the price accurately.
Through this project, I successfully built a machine learning model using LightGBM regression-
based algorithm. This model performs unsupervised learning on the testing data and
automatically predicts the price on a given product. I have used the modern data preprocessing
techniques using Python the cleanse and standardize the data. The feature extraction approach
has helped me to indulge unstructured features into the model. The major takeaway from this
project is the effective usage of the boosting algorithm LightGBM, it is fast and consumes very
less memory making it an efficient machine learning model on big data platform.
For this project, I have used just the textual features and the structured data for the analysis. The
future scope for price prediction would be inclined towards using visual features for the
prediction. For every product, in majority of the marketplaces, the seller has to post at least 3
pictures of the product. These pictures can be analyzed, and the visual parameters can be used in
building the model. Right now, it is difficult to perform this analysis at academic level
considering the amount of size each image takes. Also, an effective machine learning model
requires large amount of data for prediction. But considering the boon of Big data in coming
future visual parameters along with the textual features can be used for price prediction.
29
REFERENCES
REFERENCES
1) Kathleen Carley. (1993). “Coding Choices for Textual Analysis: A Comparison of
Content Analysis and Map Analysis”. Vol. 23. https://www.jstor.org/stable/271007
2) Hsiu-Fang Hsieh & Sarah E. Shannon. (Nov 1, 2005) . “Three Approaches to Qualitative
Content Analysis”. https://doi.org/10.1177/1049732305276687
3) Dan Hill. (20 Aug 2015). “The Secret of Airbnb’s Pricing Algorithm: The sharing economy
needs machine intelligence to set prices”.
https://spectrum.ieee.org/computing/software/the- secret-of-airbnbs-pricingalgorithm
4) Susan Li. (Jul 23,2018).” Machine Learning for Retail Price Recommendation with Python”.
https://towardsdatascience.com/machine-learning-for-retail-price-suggestionwith-
python- 64531e64186d
5) Chen F, Federgruen A & Zheng YS. (2001). “Near-optimal pricing and replenishment
strategies for a retail/distribution system.Oper”. Res. 49(6):839–853
6) Gallego G & Van Ryzin G. (1997). “A multi-product dynamic pricing problem and its
application to network yield management.Oper”. Res. 45:24–41
7) Giorgio Alfredo Spedicato, Christophe Dutang, & Leonardo Petrini. (2015) “Machine
Learning Methods to Perform Pricing Optimization. A Comparison with Standard
GLMs”
8) Baribeau, A.G. (2015). “Price Optimization and the Descending Confusion.” Actuarial
Review.
9) Cortes, C., & V. Vapnik. (1995). “Support-Vector Networks.” Machine Learning 20 (3).
Springer: 273–97.
30
10) Duncan, A., & M. McPhail. (2013). “Price Optimization for the U.S. Market. Techniques
and Implementation Strategies.”
11) Vartak & Manasi. (2018). “Infrastructure for model management and model diagnosis”.
http://hdl.handle.net/1721.1/118091
12) J.N.Tsitsiklis & B. van Roy. (1999). “Optimal stopping of Markov processes: Hilbert space
theory, approximation algorithms, and an application to pricing high-dimensional
financial derivatives”
13) Su and Beichen. (2018). “An Application of Recurrent Neural Network: Prediction of
Items Price by Description”. https://escholarship.org/uc/item/7jj0d5ts
14) Tomas Mikolov, Kai Chen, Greg Corrado & Jeffrey Dean. (2013). “Efficient estimation
of word representations in vector space. arXiv preprint arXiv:1301.3781”.
15) Han F, Ling Q-H & Huang D-S. (2010). “An improved approximation approach
incorporating particle swarm optimization and a priori information into neural
networks”. Neural Comput Appl 19:255–261
16) Liang NY, , Huang GB, Saratchandran P & Sundararajan N .(2006). “A fast and accurate
online sequential learning algorithm for feedforward networks”. IEEE Trans Neural
Netw 17:1411–1423
31
APPENDIX
Source Data: For this project, I have used the Mercari’s: Price suggestion challenge dataset.
This dataset is available in Kaggle. Kaggle is a google owned online platform providing
Dataset for machine learning users. Mercari has provided both training and testing data
separately for this challenge and for this challenge RMSE is used as performance metric
SOFTWARE: For this project, I have used Qliksense for data analysis and few
visualizations and for building the price prediction model, I have used Python 3.5 on Jupyter
notebook. I have also used R for statistical visualizations
PACKAGES: For this project I have used I have used multiple python and R libraries.
1) NumPy: Numercial Python, helps with quick computation of matrices
2) Pandas: Is used for the extensive data analysis and building structures
3) Ggplot2: This is an R package used for statistical visualizations
4) Scipy: Scientific python, used for integration of data and equation solving
5) Sklearn: This is a machine learning package used for building regression models
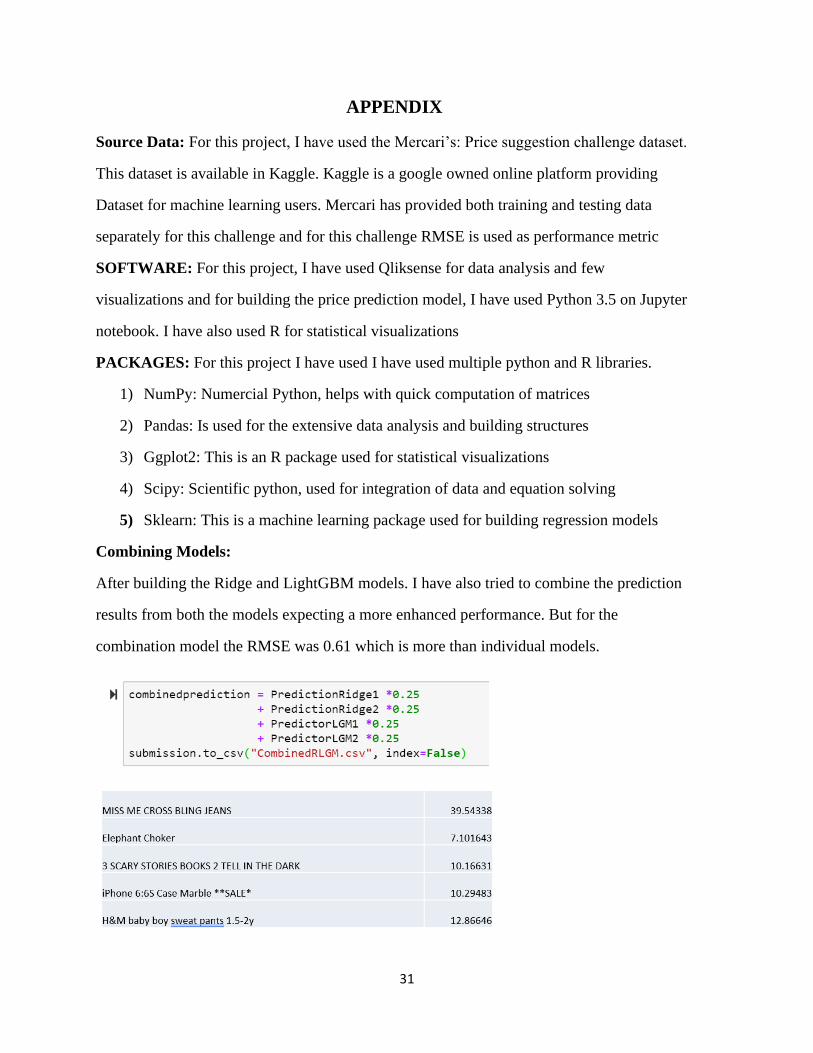
Combining Models:
After building the Ridge and LightGBM models. I have also tried to combine the prediction
results from both the models expecting a more enhanced performance. But for the
combination model the RMSE was 0.61 which is more than individual models.


![[5]Dynamic Pricing in the Presence of Strategic Consumers ...heuristic.kaist.ac.kr/cylee/xpolicy/TermProject/09/[5]Dynamic Pricing... · Dynamic Pricing in the Presence of Strategic](https://img.pdfslide.us/doc/110x75/5e69e77f03649e388952ac9f/5dynamic-pricing-in-the-presence-of-strategic-consumers-5dynamic-pricing.jpg)