Embed Size (px)
Citation preview
STRATEGIC PLANNING 2019-2023 TRANSCOLLINES
Summary version, November 2018
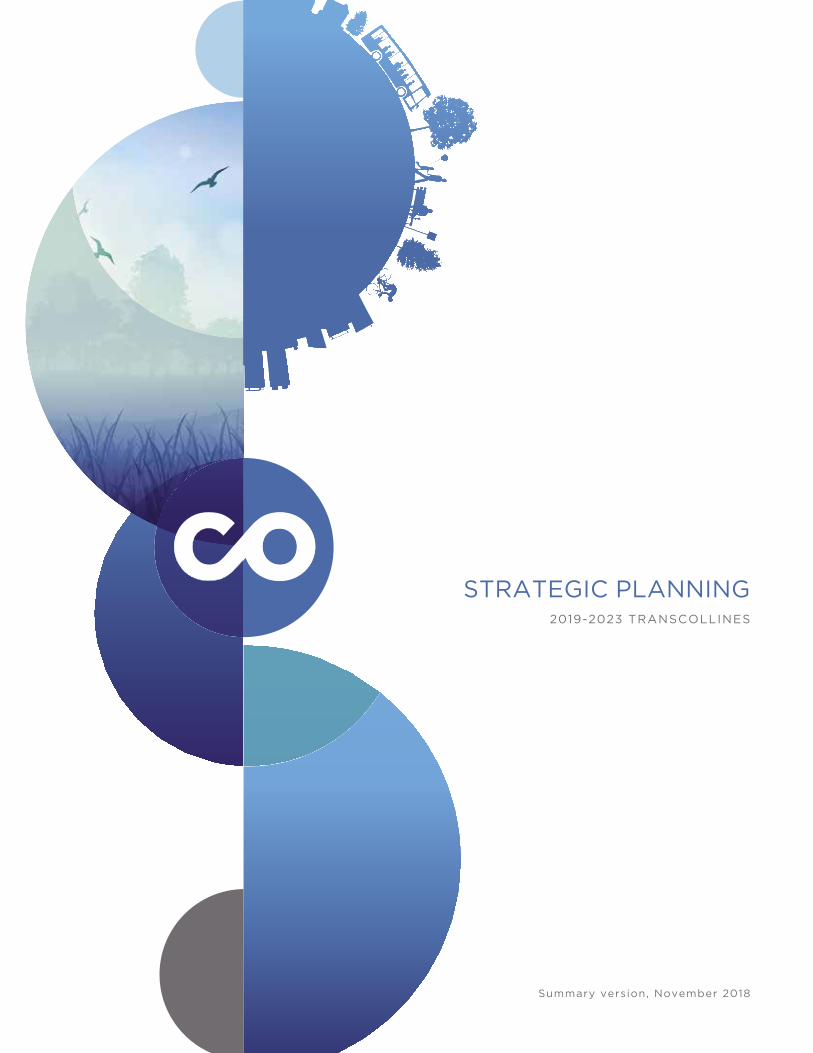
Socioeconomic Disparities
Transcollines created a regional profile using the Ministère des Affaires Municipales’ development index, combining 7 socioeconomic variables. The basis for comparison includes all the municipalities of the Outaouais region as well as municipalities in Ontario that interact with the region. Finally, for the Collines-de-l’Outaouais MRC, a customized zoning was created to reflect the village centres and their areas of influence.
The results are very convincing. The socioeconomic vitality of the Outaouais region is heavily concentrated in the City of Gatineau and the territory of the Collines-de-l’Outaouais MRC, while the Pontiac and Vallée-de-la-Gatineau MRCs show signs of development comparable to the most devitalized resource regions of Quebec. If we fine-tune the level of analysis, even the region’s so-called “rich” areas show significant internal disparities. This is true of the Collines-de-l’Outaouais MRC, which contains communities experiencing serious socioeconomic difficulties.
TRANSCOLLINES IS PAYING SPECIAL ATTENTION TO THE SERVICE THEY PROVIDE TO THESE SOCIOECONOMICALLY DISADVANTAGED SECTORS with the goal of providing these communities with a development tool that will meet the needs of their residents. The aim is to help bring people out of their isolation, provide access to various resources, education and health care and to facilitate employability and consumption of goods and services.
ESTABLISHMENT OF THE PROCESS AND PRELIMINARY INTERNAL ANALYSIS
FIRST STEP: CONSULTATION AND FORMAL ANALYSIS OF THE CURRENT SITUATION AND DEVELOPMENT OF THE PRELIMINARY STRATEGIC AREAS OF FOCUS
VALIDATION OF OBJECTIVES AND SECOND ONLINE CONSULTATION
1
2
3
DRAFTING OF THE STRATEGIC PLANNING DOCUMENT AND SUMMARY OF KNOWLEDGE MOBILIZED
PUBLIC CONSULTATIONS
4
5
OCTOBER TO DECEMBER 2017
DECEMBER 2017 TO FEBRUARY 2018
MARCH TO JUNE 2018
JULY TO AUGUST 2018
SEPTEMBER TO OCTOBER 2018
STEPS IN THE STRATEGIC PLANNING PROCESS
STRATEGIC PLANNING 2019-2023 TRANSCOLLINES 2
30 et plus
de 10 à 30
de -10 à 10
de -30 à -10
de -60 à -30
moins de -60
Indice régional
routes principales
LÉGENDE
Simon Ouellet - août 2018
Source : Statistique Canada
41
35
45
36
42
32
4044
47
37
46
27
39
29
43
34
26
25
33
31
30
38
28
35
41
42
43
29
31
26
2747
33
32
34
30
25
37 38
28
36
39
45
4440
46
0 105 Km
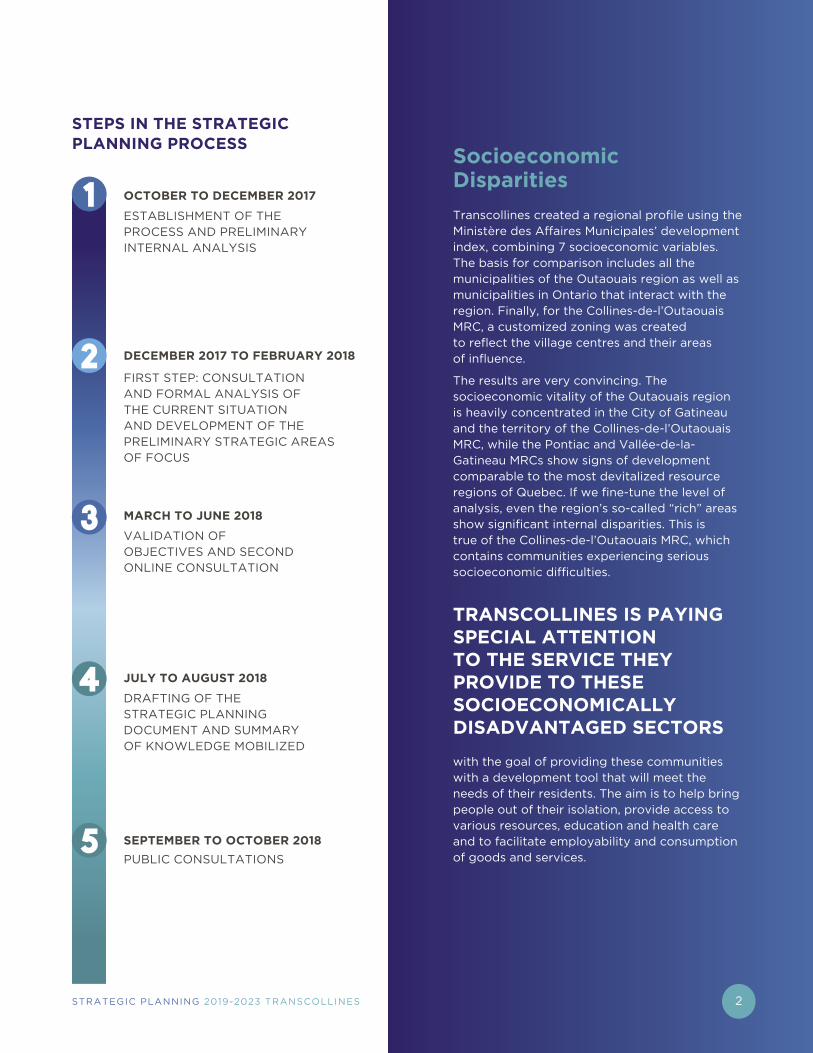
DEVELOPMENT INDEX COLLINES-DE-L’OUTAOUAIS MRC
Population Density
LOW POPULATION DENSITY IS A SERIOUS CHALLENGE WHEN ORGANIZING A PASSENGER TRANSPORTATION SERVICE. The density and size of the population pools are variables that Transcollines took into consideration when establishing its service.
Pontiac MRC 14,062 -5% 4,008 4.3% 3.6% 3.6 31%
Vallée-de-la-Gatineau MRC 20,607 -2% 3,360 6.1% 6.1% 6.1 26%
Papineau MRC 23,356 6% 2,961 6.4% 6% 7.7 23%
Collines-de-l’Outaouais MRC 49,722 15% 2,088 12.3% 12.8% 21.8 16%
City of Gatineau 281,392 13% 314 70.9% 72.3% 830.6 2%
Outaouais Region 389,139 11% 12,731 100% 100% 11.1 100%
Source: Institut de la Statistique du Québec.
POPULATION, GROWTH AND DENSITY IN THE OUTAOUAIS REGION
AREA
, UNO
RGANIZ
ED T
ERRITO
RIES
NO
T INCLU
DED
(SQ
. KM
)
DEM
OGRA
PHIC W
EIGHT
2006
2016 D
ENSIT
Y 2016
(INHA
BITANTS P
ER SQ
. KM
.)
TERRITO
RIAL
WEIG
HT
2016
PO
PULATIO
N
TERRITO
RIES
GRO
WTH R
ATE 2
006-2016
moins de 10
entre 10 et 20
entre 20 et 50
entre 50 et 100
plus de 100
Habitants par km2
routes principales
LÉGENDE
35
41
42
43
29
31
26
2747
33
32
34
30
25
37 38
28
36
39
45
4440
46
POPULATION DENSITY COLLINES-DE-L’OUTAOUAIS MRC
30 or more
10 to 30
-10 to 10
-30 to -10
-60 to -30
Less than -60
Regional index
Major roads/highways
LEGEND
Simon Ouellet – August 2018
Source : Statistique Canada
41
35
45
36
42
32
4044
47
37
46
27
39
29
43
34
26
25
33
31
30
38
28
35
41
42
43
29
31
26
2747
33
32
34
30
25
37 38
28
36
39
45
4440
46
0 105 Km
Fewer than 10
10 to 20
20 to 50
50 to 100
More than 100
Inhabitants per km2
Major roads/highways
LEGEND
35
41
42
43
29
31
26
2747
33
32
34
30
25
37 38
28
36
39
45
4440
46
STRATEGIC PLANNING 2019-2023 TRANSCOLLINES 3
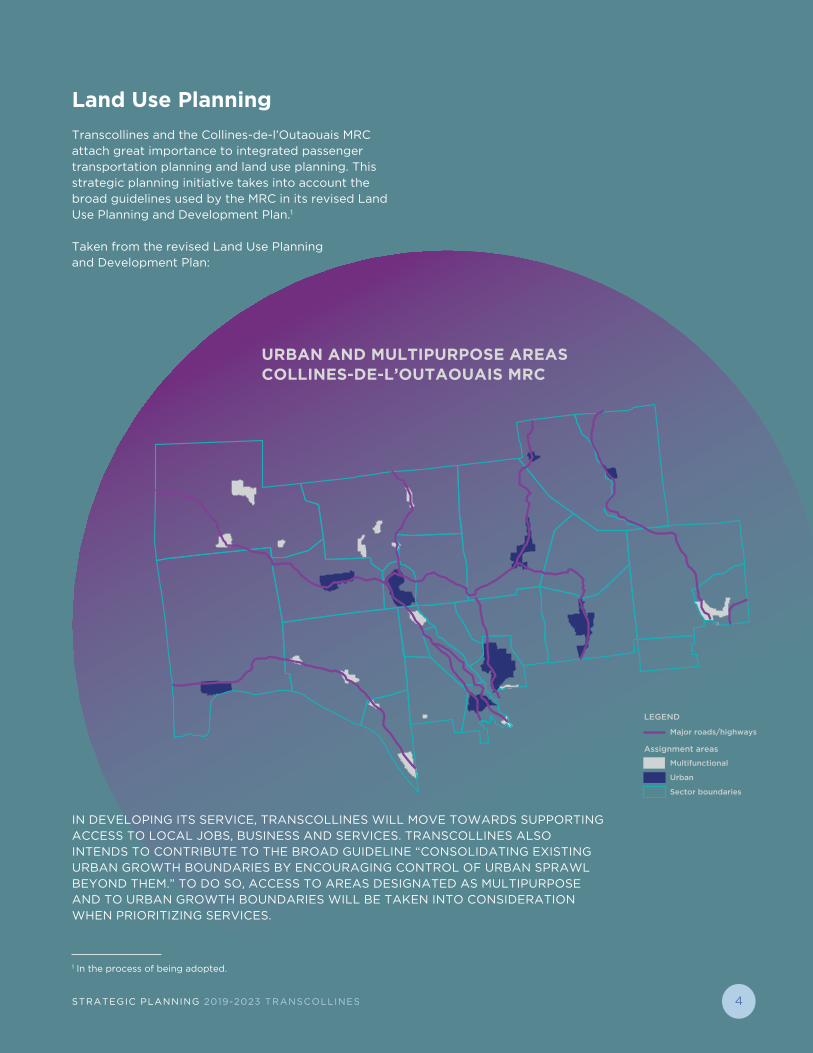
IN DEVELOPING ITS SERVICE, TRANSCOLLINES WILL MOVE TOWARDS SUPPORTING ACCESS TO LOCAL JOBS, BUSINESS AND SERVICES. TRANSCOLLINES ALSO INTENDS TO CONTRIBUTE TO THE BROAD GUIDELINE “CONSOLIDATING EXISTING URBAN GROWTH BOUNDARIES BY ENCOURAGING CONTROL OF URBAN SPRAWL BEYOND THEM.” TO DO SO, ACCESS TO AREAS DESIGNATED AS MULTIPURPOSE AND TO URBAN GROWTH BOUNDARIES WILL BE TAKEN INTO CONSIDERATION WHEN PRIORITIZING SERVICES.
Multifunctional
Urban
Sector boundaries
Assignment areas
Major roads/highways
LEGEND
URBAN AND MULTIPURPOSE AREAS COLLINES-DE-L’OUTAOUAIS MRC
Land Use Planning
Transcollines and the Collines-de-l’Outaouais MRC attach great importance to integrated passenger transportation planning and land use planning. This strategic planning initiative takes into account the broad guidelines used by the MRC in its revised Land Use Planning and Development Plan.1
Taken from the revised Land Use Planning and Development Plan:
1 In the process of being adopted.
STRATEGIC PLANNING 2019-2023 TRANSCOLLINES 4
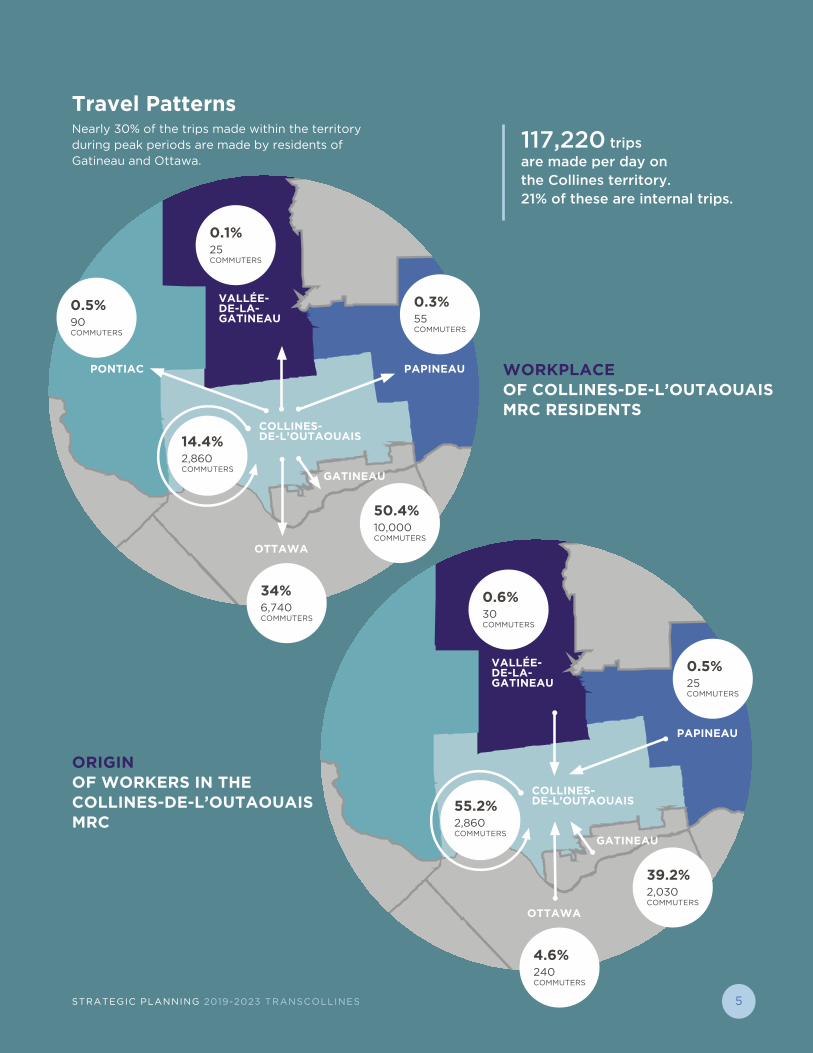
Travel PatternsNearly 30% of the trips made within the territory during peak periods are made by residents of Gatineau and Ottawa.
117,220 trips are made per day on the Collines territory. 21% of these are internal trips.
WORKPLACE OF COLLINES-DE-L’OUTAOUAIS MRC RESIDENTS
VALLÉE-DE-LA-GATINEAU
GATINEAU
OTTAWA
PONTIAC PAPINEAU
COLLINES- DE-L’OUTAOUAIS
50.4%10,000COMMUTERS
0.3%55COMMUTERS
0.1%25COMMUTERS
0.5%90COMMUTERS
34%6,740COMMUTERS
14.4%2,860COMMUTERS
VALLÉE-DE-LA-GATINEAU
GATINEAU
OTTAWA
PAPINEAU
COLLINES- DE-L’OUTAOUAIS
39.2%2,030COMMUTERS
0.5%25COMMUTERS
0.6%30COMMUTERS
4.6%240COMMUTERS
55.2%2,860COMMUTERS
ORIGIN OF WORKERS IN THE COLLINES-DE-L’OUTAOUAIS MRC
STRATEGIC PLANNING 2019-2023 TRANSCOLLINES 5
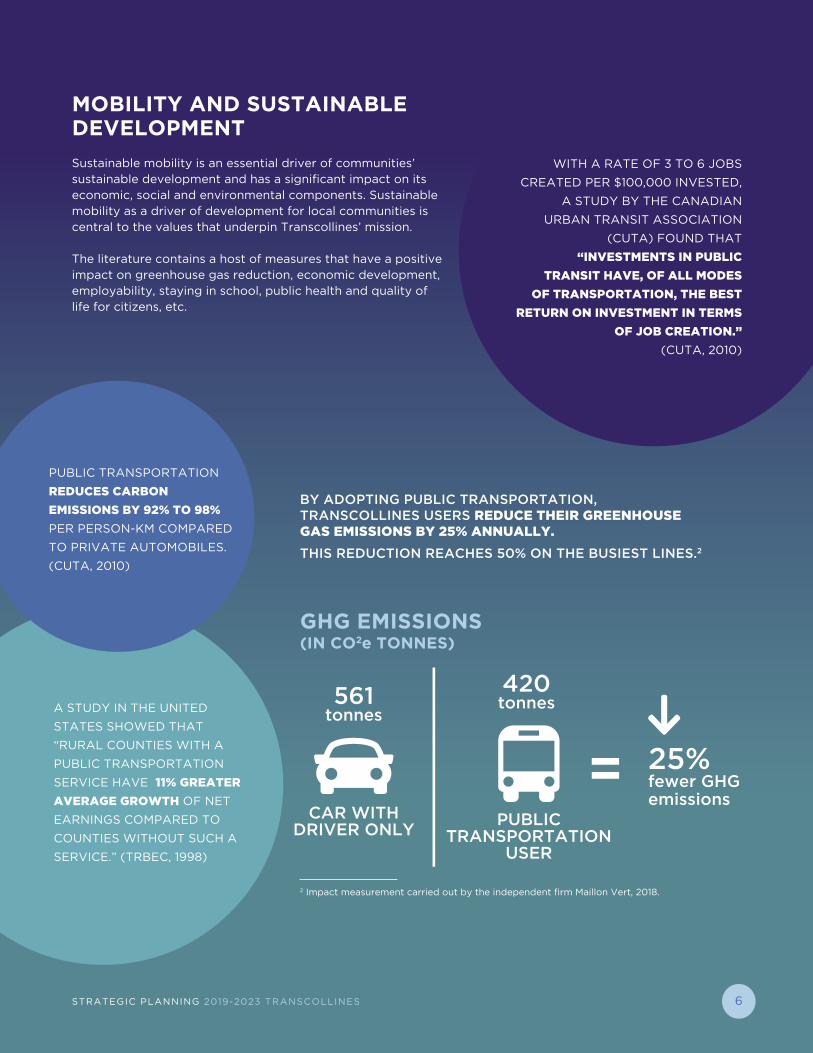
MOBILITY AND SUSTAINABLE DEVELOPMENT
Sustainable mobility is an essential driver of communities’ sustainable development and has a significant impact on its economic, social and environmental components. Sustainable mobility as a driver of development for local communities is central to the values that underpin Transcollines’ mission.
The literature contains a host of measures that have a positive impact on greenhouse gas reduction, economic development, employability, staying in school, public health and quality of life for citizens, etc.
BY ADOPTING PUBLIC TRANSPORTATION, TRANSCOLLINES USERS REDUCE THEIR GREENHOUSE GAS EMISSIONS BY 25% ANNUALLY.
THIS REDUCTION REACHES 50% ON THE BUSIEST LINES.2
2 Impact measurement carried out by the independent firm Maillon Vert, 2018.
PUBLIC TRANSPORTATION
USER
CAR WITH DRIVER ONLY
561 tonnes
GHG EMISSIONS (IN CO2e TONNES)
420 tonnes
25% fewer GHG emissions
WITH A RATE OF 3 TO 6 JOBS
CREATED PER $100,000 INVESTED,
A STUDY BY THE CANADIAN
URBAN TRANSIT ASSOCIATION
(CUTA) FOUND THAT
“INVESTMENTS IN PUBLIC
TRANSIT HAVE, OF ALL MODES
OF TRANSPORTATION, THE BEST
RETURN ON INVESTMENT IN TERMS
OF JOB CREATION.”
(CUTA, 2010)
A STUDY IN THE UNITED
STATES SHOWED THAT
“RURAL COUNTIES WITH A
PUBLIC TRANSPORTATION
SERVICE HAVE 11% GREATER
AVERAGE GROWTH OF NET
EARNINGS COMPARED TO
COUNTIES WITHOUT SUCH A
SERVICE.” (TRBEC, 1998)
PUBLIC TRANSPORTATION
REDUCES CARBON
EMISSIONS BY 92% TO 98%
PER PERSON-KM COMPARED
TO PRIVATE AUTOMOBILES.
(CUTA, 2010)
STRATEGIC PLANNING 2019-2023 TRANSCOLLINES 6
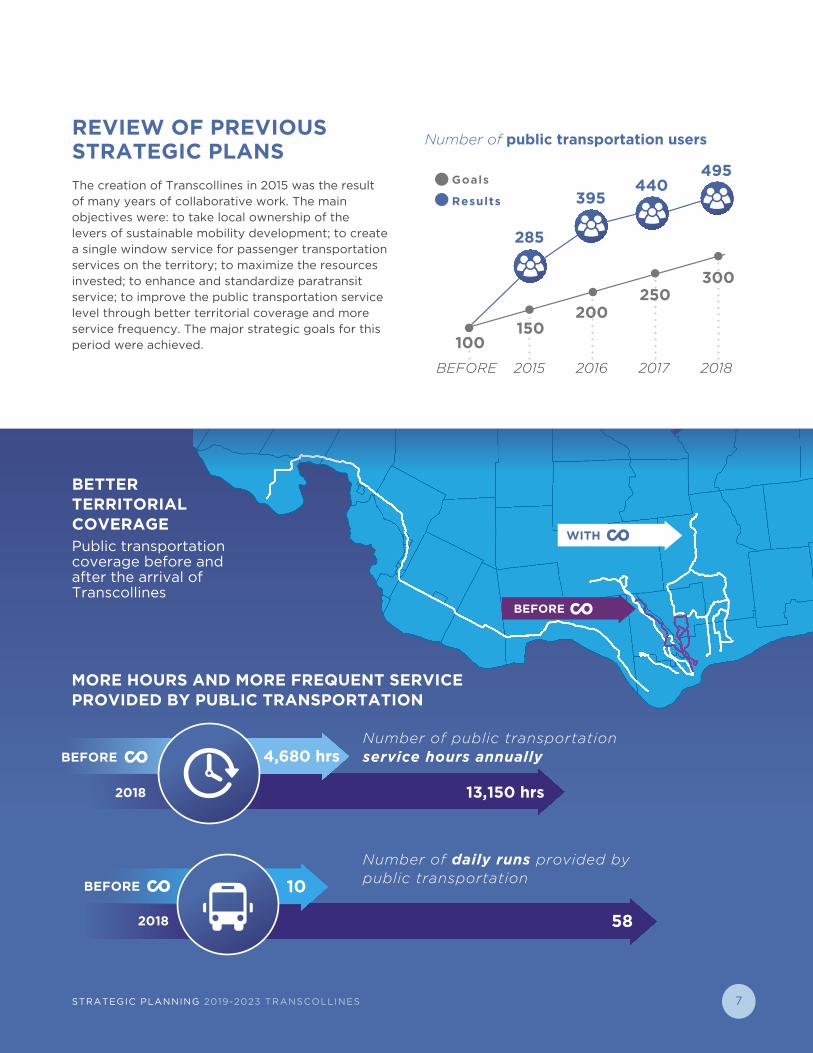
REVIEW OF PREVIOUS STRATEGIC PLANS
WITH
BEFORE
BETTERTERRITORIALCOVERAGEPublic transportation coverage before and after the arrival of Transcollines
MORE HOURS AND MORE FREQUENT SERVICEPROVIDED BY PUBLIC TRANSPORTATION
Number of public transportation service hours annually
13,150 hrs2018
4,680 hrsBEFORE
Number of daily runs provided by public transportation
58
10BEFORE
2018
285
395440
495
2015
150
BEFORE
100
2016
200
2017
250
2018
300
Number of public transportation users
The creation of Transcollines in 2015 was the result of many years of collaborative work. The main objectives were: to take local ownership of the levers of sustainable mobility development; to create a single window service for passenger transportation services on the territory; to maximize the resources invested; to enhance and standardize paratransit service; to improve the public transportation service level through better territorial coverage and more service frequency. The major strategic goals for this period were achieved.
Goals
Results
STRATEGIC PLANNING 2019-2023 TRANSCOLLINES 7
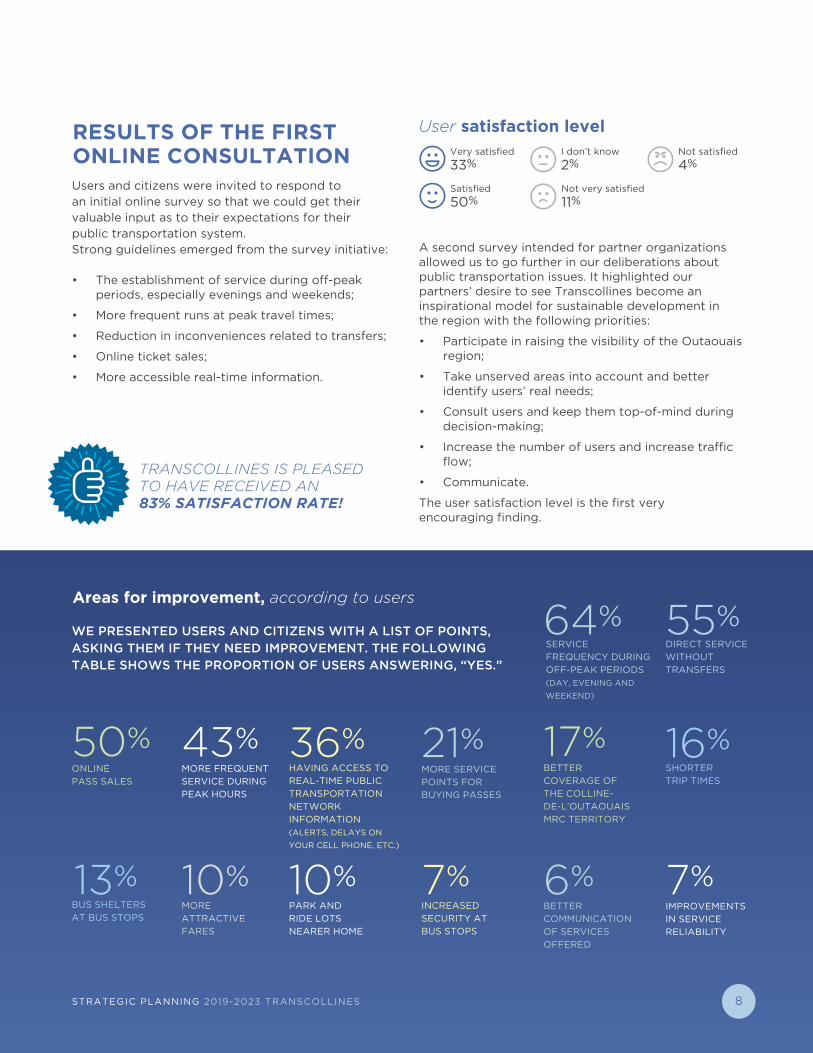
Users and citizens were invited to respond to an initial online survey so that we could get their valuable input as to their expectations for their public transportation system. Strong guidelines emerged from the survey initiative:
• The establishment of service during off-peak periods, especially evenings and weekends;
• More frequent runs at peak travel times;
• Reduction in inconveniences related to transfers;
• Online ticket sales;
• More accessible real-time information.
A second survey intended for partner organizations allowed us to go further in our deliberations about public transportation issues. It highlighted our partners’ desire to see Transcollines become an inspirational model for sustainable development in the region with the following priorities:
• Participate in raising the visibility of the Outaouais region;
• Take unserved areas into account and better identify users’ real needs;
• Consult users and keep them top-of-mind during decision-making;
• Increase the number of users and increase traffic flow;
• Communicate.
The user satisfaction level is the first very encouraging finding.
User satisfaction levelVery satisfied
33%
Satisfied
50%
I don’t know
2%
Not very satisfied
11%
Not satisfied
4%
Areas for improvement, according to users
SERVICE
FREQUENCY DURING
OFF-PEAK PERIODS (DAY, EVENING AND
WEEKEND)
64%DIRECT SERVICE
WITHOUT
TRANSFERS
55%
ONLINE
PASS SALES
50%SHORTER
TRIP TIMES
16%MORE FREQUENT
SERVICE DURING
PEAK HOURS
43%HAVING ACCESS TO
REAL-TIME PUBLIC
TRANSPORTATION
NETWORK
INFORMATION (ALERTS, DELAYS ON
YOUR CELL PHONE, ETC.)
36%BETTER
COVERAGE OF
THE COLLINE-
DE-L’OUTAOUAIS
MRC TERRITORY
17%MORE SERVICE
POINTS FOR
BUYING PASSES
21%
WE PRESENTED USERS AND CITIZENS WITH A LIST OF POINTS, ASKING THEM IF THEY NEED IMPROVEMENT. THE FOLLOWING TABLE SHOWS THE PROPORTION OF USERS ANSWERING, “YES.”
RESULTS OF THE FIRST ONLINE CONSULTATION
PARK AND
RIDE LOTS
NEARER HOME
10%INCREASED
SECURITY AT
BUS STOPS
7%IMPROVEMENTS
IN SERVICE
RELIABILITY
7%BETTER
COMMUNICATION
OF SERVICES
OFFERED
6%MORE
ATTRACTIVE
FARES
10%BUS SHELTERS
AT BUS STOPS
13%
TRANSCOLLINES IS PLEASED TO HAVE RECEIVED AN 83% SATISFACTION RATE!
STRATEGIC PLANNING 2019-2023 TRANSCOLLINES 8
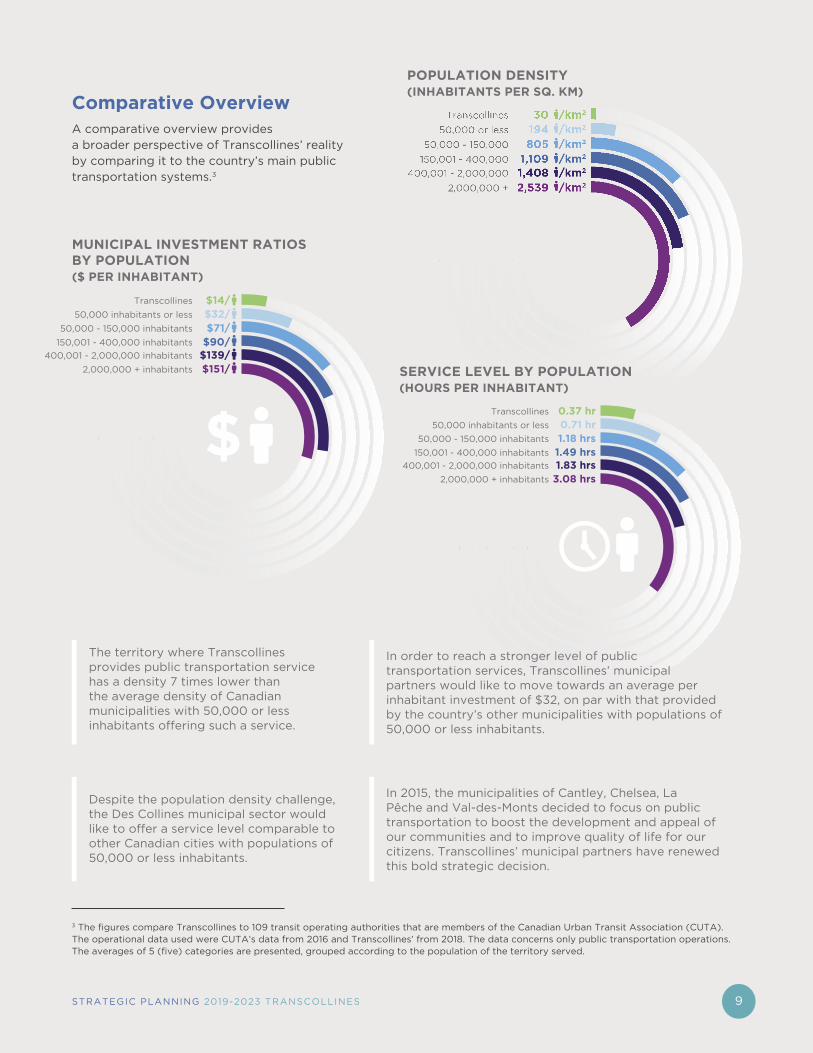
30 /km2
194 /km2
805 /km2
1,109 /km2
1,408 /km2
2,539 /km2
Transcollines
50,000 or less
50,000 - 150,000
150,001 - 400,000
400,001 - 2,000,000
2,000,000 +
$14/ $32/ $71/
$90/ $139/ $151/
Transcollines
50,000 inhabitants or less
50,000 - 150,000 inhabitants
150,001 - 400,000 inhabitants
400,001 - 2,000,000 inhabitants
2,000,000 + inhabitants
$0.37 hr0.71 hr1.18 hrs1.49 hrs1.83 hrs
3.08 hrs
Transcollines
50,000 inhabitants or less
50,000 - 150,000 inhabitants
150,001 - 400,000 inhabitants
400,001 - 2,000,000 inhabitants
2,000,000 + inhabitants
Comparative OverviewA comparative overview providesa broader perspective of Transcollines’ reality by comparing it to the country’s main public transportation systems.3
In order to reach a stronger level of public transportation services, Transcollines’ municipal partners would like to move towards an average per inhabitant investment of $32, on par with that provided by the country’s other municipalities with populations of 50,000 or less inhabitants.
3 The figures compare Transcollines to 109 transit operating authorities that are members of the Canadian Urban Transit Association (CUTA). The operational data used were CUTA’s data from 2016 and Transcollines’ from 2018. The data concerns only public transportation operations. The averages of 5 (five) categories are presented, grouped according to the population of the territory served.
POPULATION DENSITY(INHABITANTS PER SQ. KM)
The territory where Transcollines provides public transportation service has a density 7 times lower than the average density of Canadian municipalities with 50,000 or less inhabitants offering such a service.
MUNICIPAL INVESTMENT RATIOSBY POPULATION ($ PER INHABITANT)
Despite the population density challenge, the Des Collines municipal sector would like to offer a service level comparable to other Canadian cities with populations of 50,000 or less inhabitants.
SERVICE LEVEL BY POPULATION(HOURS PER INHABITANT)
In 2015, the municipalities of Cantley, Chelsea, La Pêche and Val-des-Monts decided to focus on public transportation to boost the development and appeal of our communities and to improve quality of life for our citizens. Transcollines’ municipal partners have renewed this bold strategic decision.
STRATEGIC PLANNING 2019-2023 TRANSCOLLINES 9
MISSION, VALUES AND VISION STATEMENT
MISSIONTRANSCOLLINES’ MISSION IS TO PROVIDE SUSTAINABLE MOBILITY SOLUTIONS FOR PEOPLE
LIVING IN THE TERRITORY OF THE COLLINES-DE-L’OUTAOUAIS MRC AND TO CONTRIBUTE TO
ITS DEVELOPMENT IN THE RURAL OUTAOUAIS AREA.
VALUES
OUR MISSION IS UNDERPINNED BY TWO KEY VALUES:
VISION By 2023, Transcollines will have developed a quality public transportation service meeting its users’
needs and expectations while significantly promoting other forms of sustainable mobility. This will
have been done throughout its territory, by keeping users top-of-mind in all its decisions, mobilizing
its partners and strengthening its organizational capacity. In doing so, Transcollines will have
contributed to improve the quality of life and development of the region’s communities.
1 mobility as a lever for the sustainable development of local communities.
quality local service, near users and rooted in its community. 2
STRATEGIC PLANNING 2019-2023 TRANSCOLLINES 10
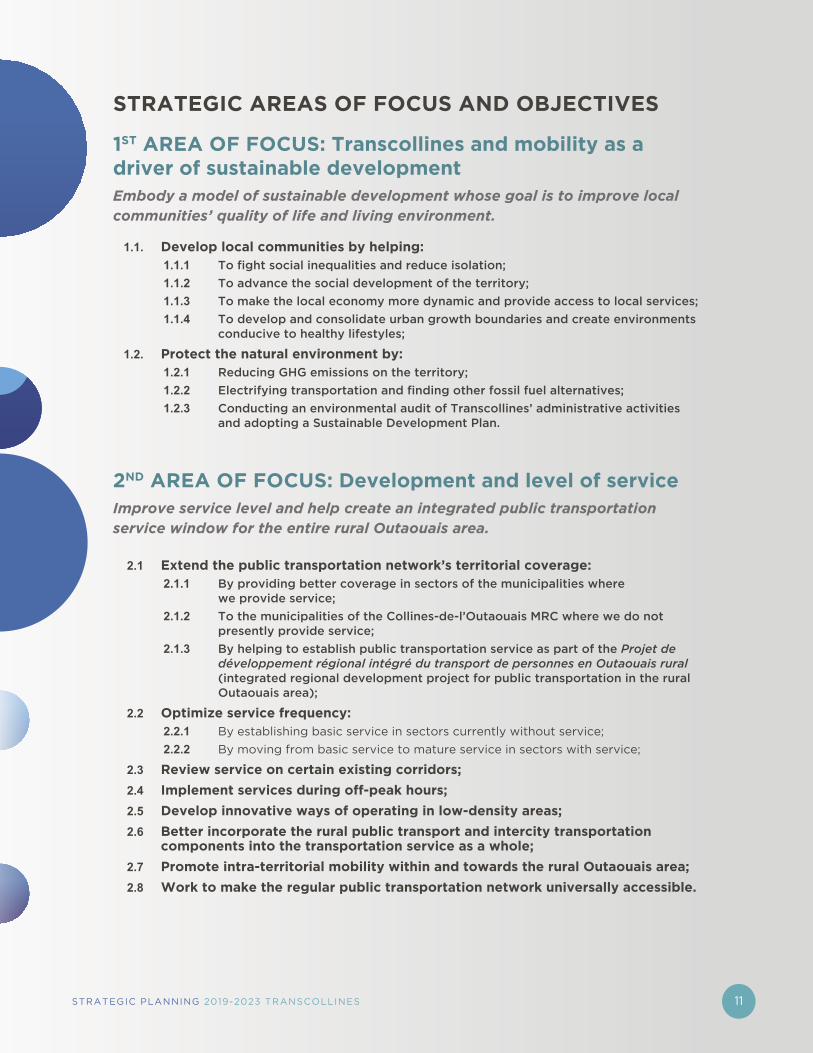
2ND AREA OF FOCUS: Development and level of serviceImprove service level and help create an integrated public transportation service window for the entire rural Outaouais area.
2.1 Extend the public transportation network’s territorial coverage:2.1.1 By providing better coverage in sectors of the municipalities where
we provide service;
2.1.2 To the municipalities of the Collines-de-l’Outaouais MRC where we do not presently provide service;
2.1.3 By helping to establish public transportation service as part of the Projet de développement régional intégré du transport de personnes en Outaouais rural (integrated regional development project for public transportation in the rural Outaouais area);
2.2 Optimize service frequency:2.2.1 By establishing basic service in sectors currently without service;
2.2.2 By moving from basic service to mature service in sectors with service;
2.3 Review service on certain existing corridors;
2.4 Implement services during off-peak hours;
2.5 Develop innovative ways of operating in low-density areas;
2.6 Better incorporate the rural public transport and intercity transportation components into the transportation service as a whole;
2.7 Promote intra-territorial mobility within and towards the rural Outaouais area;
2.8 Work to make the regular public transportation network universally accessible.
STRATEGIC AREAS OF FOCUS AND OBJECTIVES
1ST AREA OF FOCUS: Transcollines and mobility as a driver of sustainable development Embody a model of sustainable development whose goal is to improve local communities’ quality of life and living environment.
1.1. Develop local communities by helping:1.1.1 To fight social inequalities and reduce isolation;
1.1.2 To advance the social development of the territory;
1.1.3 To make the local economy more dynamic and provide access to local services;
1.1.4 To develop and consolidate urban growth boundaries and create environments conducive to healthy lifestyles;
1.2. Protect the natural environment by:1.2.1 Reducing GHG emissions on the territory;
1.2.2 Electrifying transportation and finding other fossil fuel alternatives;
1.2.3 Conducting an environmental audit of Transcollines’ administrative activities and adopting a Sustainable Development Plan.
STRATEGIC PLANNING 2019-2023 TRANSCOLLINES 11
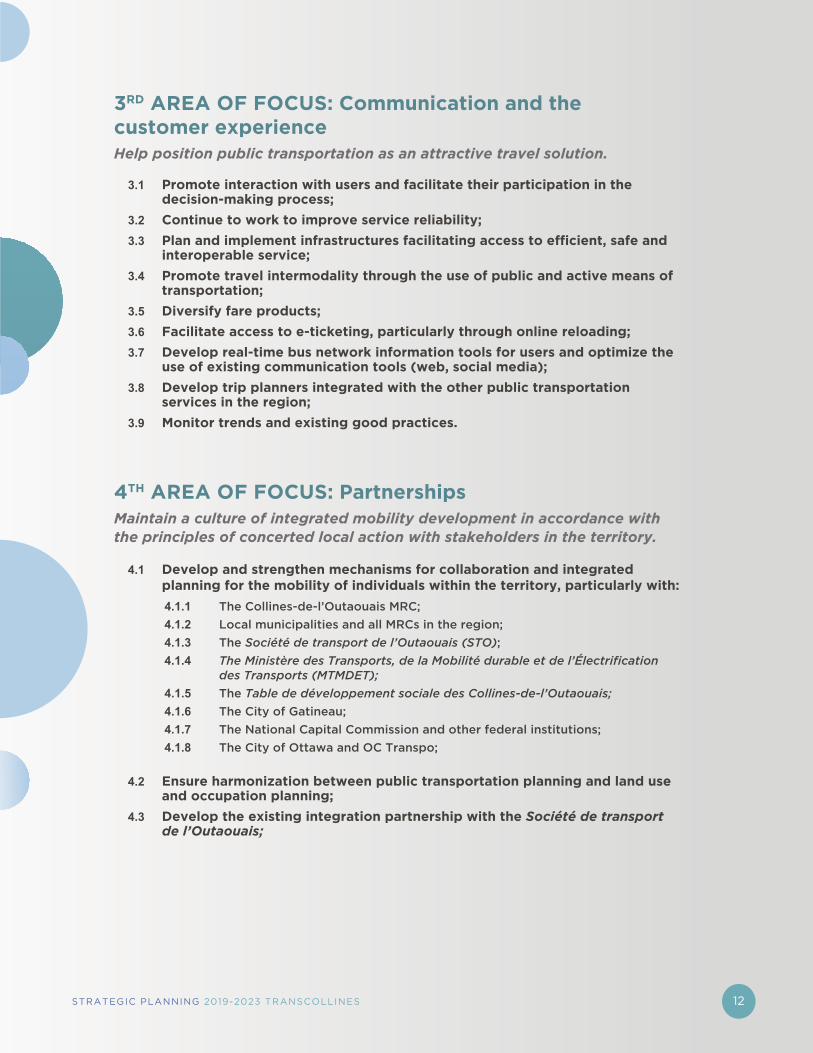
3RD AREA OF FOCUS: Communication and the customer experienceHelp position public transportation as an attractive travel solution.
3.1 Promote interaction with users and facilitate their participation in the decision-making process;
3.2 Continue to work to improve service reliability;
3.3 Plan and implement infrastructures facilitating access to efficient, safe and interoperable service;
3.4 Promote travel intermodality through the use of public and active means of transportation;
3.5 Diversify fare products;
3.6 Facilitate access to e-ticketing, particularly through online reloading;
3.7 Develop real-time bus network information tools for users and optimize the use of existing communication tools (web, social media);
3.8 Develop trip planners integrated with the other public transportation services in the region;
3.9 Monitor trends and existing good practices.
4TH AREA OF FOCUS: PartnershipsMaintain a culture of integrated mobility development in accordance with the principles of concerted local action with stakeholders in the territory.
4.1 Develop and strengthen mechanisms for collaboration and integrated planning for the mobility of individuals within the territory, particularly with:
4.1.1 The Collines-de-l’Outaouais MRC;
4.1.2 Local municipalities and all MRCs in the region;
4.1.3 The Société de transport de l’Outaouais (STO);
4.1.4 The Ministère des Transports, de la Mobilité durable et de l’Électrification des Transports (MTMDET);
4.1.5 The Table de développement sociale des Collines-de-l’Outaouais;
4.1.6 The City of Gatineau;
4.1.7 The National Capital Commission and other federal institutions;
4.1.8 The City of Ottawa and OC Transpo;
4.2 Ensure harmonization between public transportation planning and land use and occupation planning;
4.3 Develop the existing integration partnership with the Société de transport de l’Outaouais;
STRATEGIC PLANNING 2019-2023 TRANSCOLLINES 12
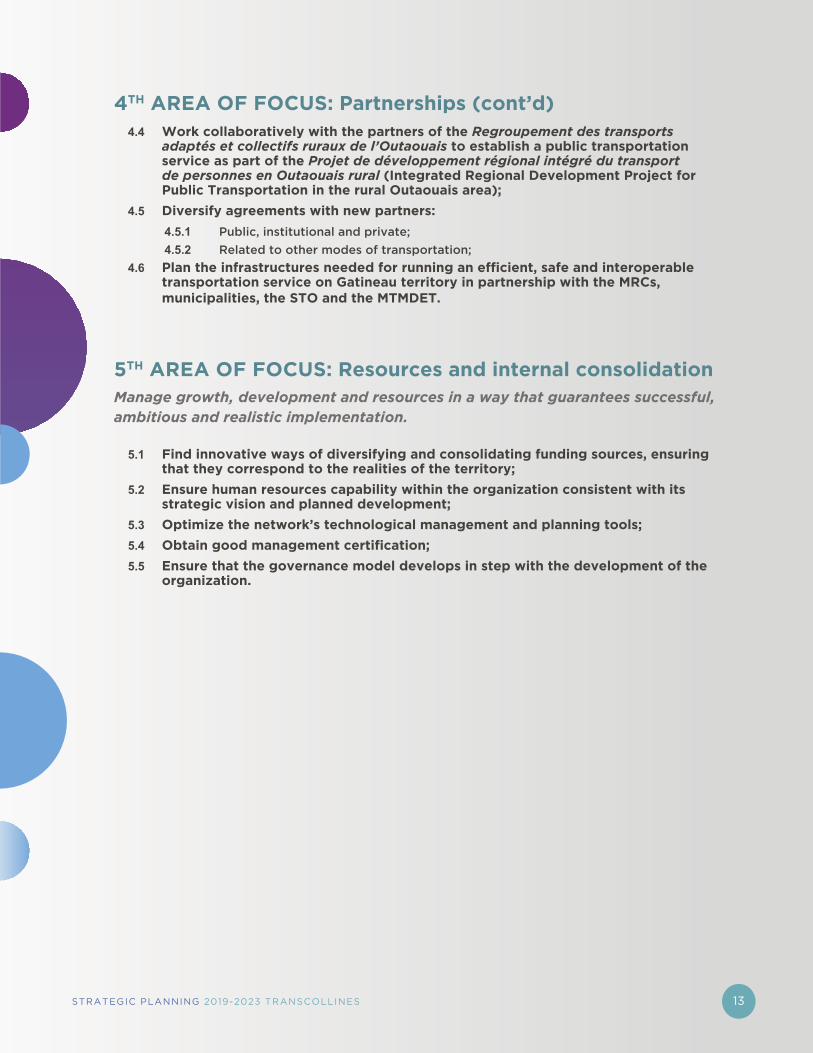
5TH AREA OF FOCUS: Resources and internal consolidationManage growth, development and resources in a way that guarantees successful, ambitious and realistic implementation.
5.1 Find innovative ways of diversifying and consolidating funding sources, ensuring that they correspond to the realities of the territory;
5.2 Ensure human resources capability within the organization consistent with its strategic vision and planned development;
5.3 Optimize the network’s technological management and planning tools;
5.4 Obtain good management certification;
5.5 Ensure that the governance model develops in step with the development of the organization.
4.4 Work collaboratively with the partners of the Regroupement des transports adaptés et collectifs ruraux de l’Outaouais to establish a public transportation service as part of the Projet de développement régional intégré du transport de personnes en Outaouais rural (Integrated Regional Development Project for Public Transportation in the rural Outaouais area);
4.5 Diversify agreements with new partners:
4.5.1 Public, institutional and private;
4.5.2 Related to other modes of transportation;
4.6 Plan the infrastructures needed for running an efficient, safe and interoperable transportation service on Gatineau territory in partnership with the MRCs, municipalities, the STO and the MTMDET.
4TH AREA OF FOCUS: Partnerships (cont’d)
STRATEGIC PLANNING 2019-2023 TRANSCOLLINES 13
CORRIDORS AND SERVICE LEVEL
SERVICE LEVEL
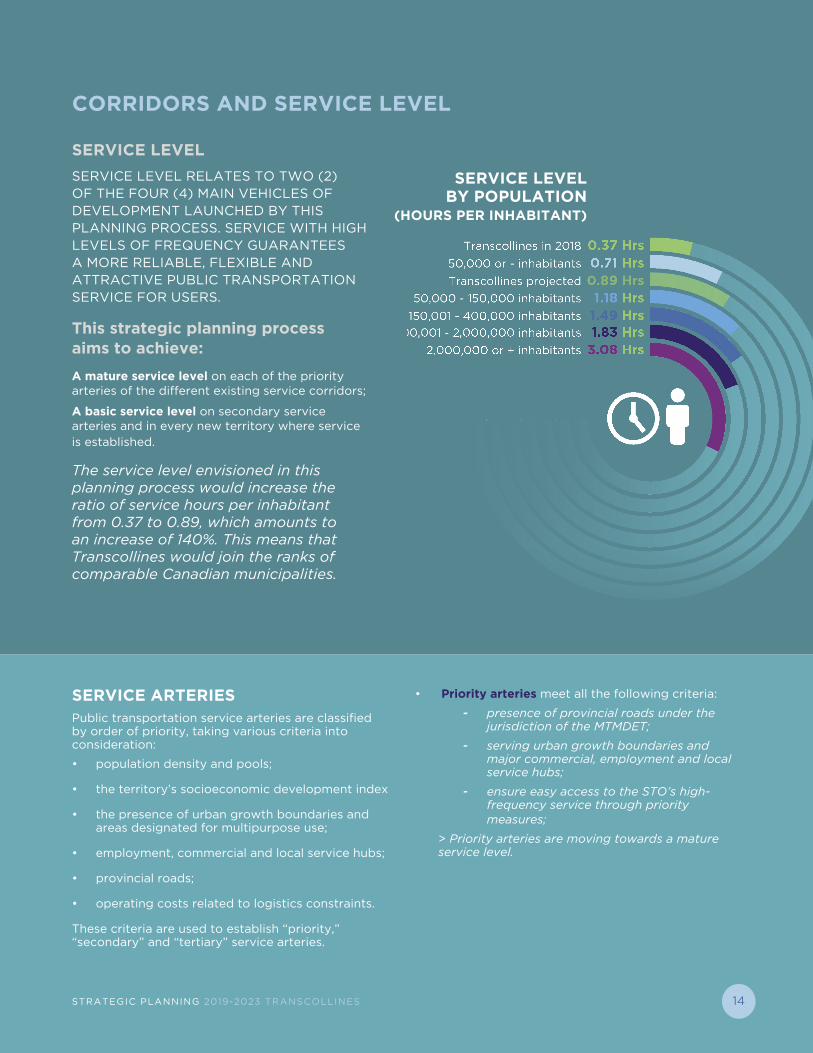
SERVICE LEVEL RELATES TO TWO (2) OF THE FOUR (4) MAIN VEHICLES OF DEVELOPMENT LAUNCHED BY THIS PLANNING PROCESS. SERVICE WITH HIGH LEVELS OF FREQUENCY GUARANTEES A MORE RELIABLE, FLEXIBLE AND ATTRACTIVE PUBLIC TRANSPORTATION SERVICE FOR USERS.
This strategic planning process aims to achieve:
A mature service level on each of the priority arteries of the different existing service corridors;
A basic service level on secondary service arteries and in every new territory where service is established.
The service level envisioned in this planning process would increase the ratio of service hours per inhabitant from 0.37 to 0.89, which amounts to an increase of 140%. This means that Transcollines would join the ranks of comparable Canadian municipalities.
0.37 Hrs0.71 Hrs
1.18 Hrs1.49 Hrs1.83 Hrs
3.08 Hrs
Transcollines in 2018
50,000 or - inhabitants
50,000 - 150,000 inhabitants
0.89 HrsTranscollines projected
150,001 - 400,000 inhabitants
400,001 - 2,000,000 inhabitants
2,000,000 or + inhabitants
SERVICE LEVEL BY POPULATION
(HOURS PER INHABITANT)
SERVICE ARTERIESPublic transportation service arteries are classified by order of priority, taking various criteria into consideration:
• population density and pools;
• the territory’s socioeconomic development index
• the presence of urban growth boundaries and areas designated for multipurpose use;
• employment, commercial and local service hubs;
• provincial roads;
• operating costs related to logistics constraints.
These criteria are used to establish “priority,” “secondary” and “tertiary” service arteries.
• Priority arteries meet all the following criteria:
- presence of provincial roads under the jurisdiction of the MTMDET;
- serving urban growth boundaries and major commercial, employment and local service hubs;
- ensure easy access to the STO’s high-frequency service through priority measures;
> Priority arteries are moving towards a mature service level.
STRATEGIC PLANNING 2019-2023 TRANSCOLLINES 14
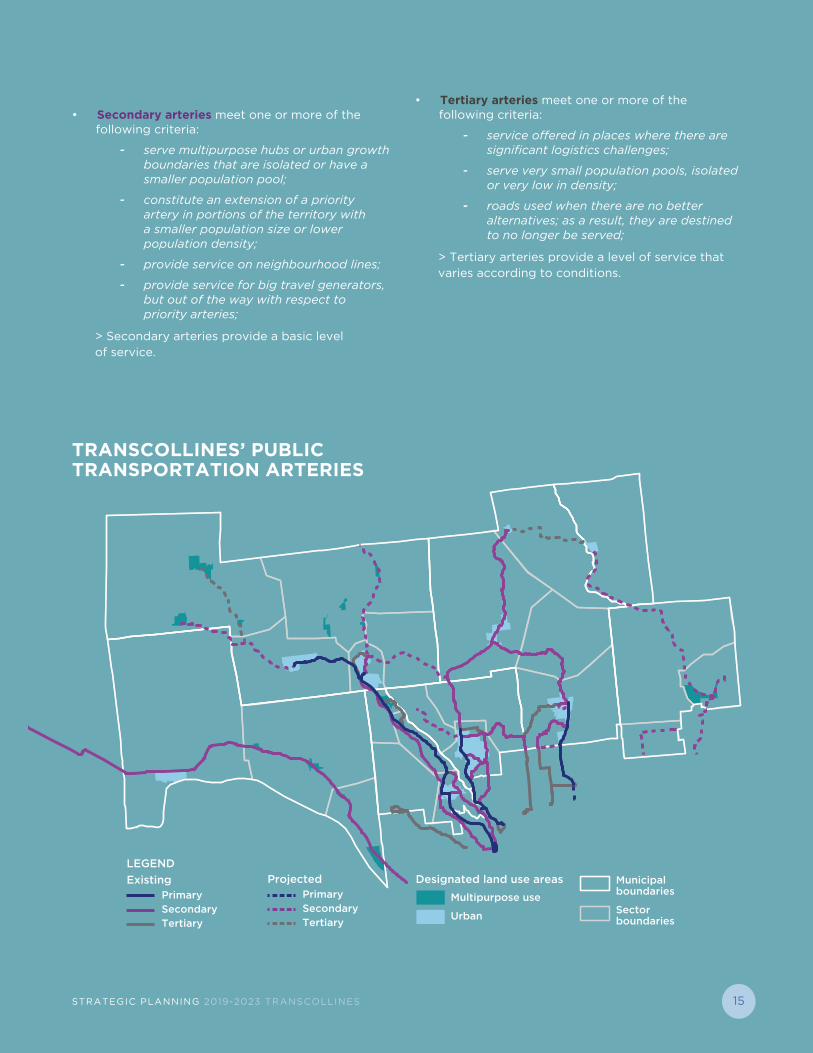
Municipal boundaries
ExistingPrimary
LEGEND
SecondaryTertiary
ProjectedPrimarySecondaryTertiary
Designated land use areas
Multipurpose use
UrbanSector boundaries
• Secondary arteries meet one or more of the following criteria:
- serve multipurpose hubs or urban growth boundaries that are isolated or have a smaller population pool;
- constitute an extension of a priority artery in portions of the territory with a smaller population size or lower population density;
- provide service on neighbourhood lines;
- provide service for big travel generators, but out of the way with respect to priority arteries;
> Secondary arteries provide a basic level of service.
• Tertiary arteries meet one or more of the following criteria:
- service offered in places where there are significant logistics challenges;
- serve very small population pools, isolated or very low in density;
- roads used when there are no better alternatives; as a result, they are destined to no longer be served;
> Tertiary arteries provide a level of service that varies according to conditions.
TRANSCOLLINES’ PUBLIC TRANSPORTATION ARTERIES
STRATEGIC PLANNING 2019-2023 TRANSCOLLINES 15
5, Principale Ouest, La Pêche, QUÉBEC J0X 2W0 | 819.456.1114 | 1.866.310.1114 (Toll Free)
© 2018 Transcollines. All rights reserved.
This plan was completed with the assistance of the Government of Canada and the Canadian Federation of Municipalities. Despite this support, the opinions expressed are those of its authors and the Canadian Federation of Municipalities and the Government of Canada
accept no responsibility in this regard.


![Group Ethics Portion Pediatric Asthma And Socioeconomic Disparities[1]](https://img.pdfslide.us/doc/110x75/55b3902bbb61eb793a8b45b1/group-ethics-portion-pediatric-asthma-and-socioeconomic-disparities1.jpg)