Embed Size (px)
Citation preview
1
Strategic Planning for Admission and Recruitment Committee Report
1/31/2015
DRAFT
Executive Summary
From 2004-2012, total headcount enrollment at UH Mānoa had hovered around 20,000, with the highest enrollment in 2004 at 20,549. The University slipped below 20,000 in 2014 (19,507) and declined another 3.3% in 2015, with a total enrollment of 18,865. Since the highest enrollment in 2004 (20,549), enrollment has declined 8.2% (1,684 students). This decline has occurred during a period where state funding has declined, and a dependence on tuition revenue has increased. This combination mandates that UH Mānoa think even more strategically in terms of enrollment (recruitment, admission and retention).
In an effort to address the enrollment declines at the University of Hawai‘i Mānoa, the Strategic Planning for Admission and Recruitment Committee (SPARC) was charged in spring 2015 to develop a plan that ensures the University meets and maintains optimal undergraduate and graduate enrollment through strategic and data driven recruitment and admission practices. The committee has representation from across the campus including deans, faculty, staff, administrators and students (see attachment 1). The committee has three co-chairs, the Dean of Graduate Education, the Interim Vice Chancellor for Student Affairs and the Assistant Vice Chancellor for Enrollment Management and Director of Admissions.
The committee members identified a number of key challenges that UH Mānoa faces, as the University works to stabilize and increase enrollment. These included Hawai‘i’s unique student migration patterns, negative/perceptions/image, declining high school graduation and college going rates, affordability, a decreasing yield rate, and static retention rates. Additionally the committee addressed graduate school enrollment challenges facing the university. Specifically non-enrolling graduate students indicated the lack of assistantships/fellowships and affordability as reasons that they did not attend (Eduventures 2015 Graduate Survey of Admitted Students).
In order to address these challenges, the committee decided on five major categories in which to build the plan: enrollment projections, branding, image and marketing, recruitment, affordability, and infrastructure. The committee developed objectives and specific strategies. The action plan (attachment 2) lists specific strategies, outcomes, assessment measures and resources needed for the objectives listed on page 2.
Finally, with this plan fully or partially implemented, we can expect incremental changes in enrollment. We must first, stabilize our enrollment by reversing the declines, and then rebuilt our enrollment with both undergraduate and graduate students. It will take time to realize fully many of the changes that need to take place, such as reputation building, cultural changes and increased scholarships that are key elements to increase enrollment. This will take meticulous and consistent strategies over time to yield results.
2
Enrollment Projections
• Develop 5 year enrollment projections
Branding
• Maintain a presence in O‘ahu and neighboring island publications and key U.S. continent markets by creating a strategic media plan for print and digital markets
• Improve reputational image of the university to the local community • Promote recognition of the Mānoa campus as the center of the Mānoa Ahupua‘a • Create a physical and virtual front door to the University • Create a cohesive look for Mānoa in undergraduate and graduate recruitment and admissions
publications • Update the admissions and graduate program websites
Recruitment
• Increase local constituencies campus engagement • Increase local student enrollment • Increase Native Hawaiian, Filipino, Samoan/Pacific Islander enrollment • Increase/maintain U.S. non-resident and WUE enrollment • Increase transfer student enrollment • Increase graduate student enrollment • Increase active duty military, veteran and dependent enrollment • Increase international student enrollment • Increase yield rates • Increase faculty and departmental involvement in recruitment initiatives • Further refine the prospective student database
Affordability
• Leverage limited financial aid dollars to meet enrollment goals and lower student loan indebtedness
Infrastructure
• To look and act like a selective, research I, flagship institution • Improve enrollment processes for efficiency and effectiveness
3
Challenges and Assumptions
The University of Hawai‘i at Mānoa is facing enrollment challenges that the institution must address strategically. The committee members identified a number of key challenges, including Hawai‘i’s student migration, negative perceptions/image, high school graduation and college going rates, affordability, decreasing yield rate, and static retention rates. Increasing enrollment at UH Mānoa requires a multi-faceted approach to include recruitment and admission and retention strategies (as developed by the Student Engagement, Retention and Graduation strategic committee - SERG). In order to stabilize and grow Mānoa’s enrollment, the University must take a holistic approach to enrollment to increase the number of new students and to improve retention and attrition rates.
As an institution, UH Mānoa has had an attrition of 1,616 first-time freshmen since 2011, an average of 404 each year. The fall 2015 retention rate (fall 2014 cohort) decreased by 1% (from 78.9 to 77.9) which translated into 395 new first-time freshmen who did not return for the fall 2015. Using a conservative estimate, and assuming that all fall 2014 first-time freshmen who did not enroll for fall 2015 were full-time resident students, we have lost, at a minimum, $4.4 million in tuition revenues. Hypothetically, if 100% of our fall 2014 first-time freshmen had returned for fall 2015, we would have seen a smaller enrollment decline from 3.3% to 1.3%. Of course, we cannot expect to have 100% retention; however any improvement in retention, could contribute to increased enrollment.
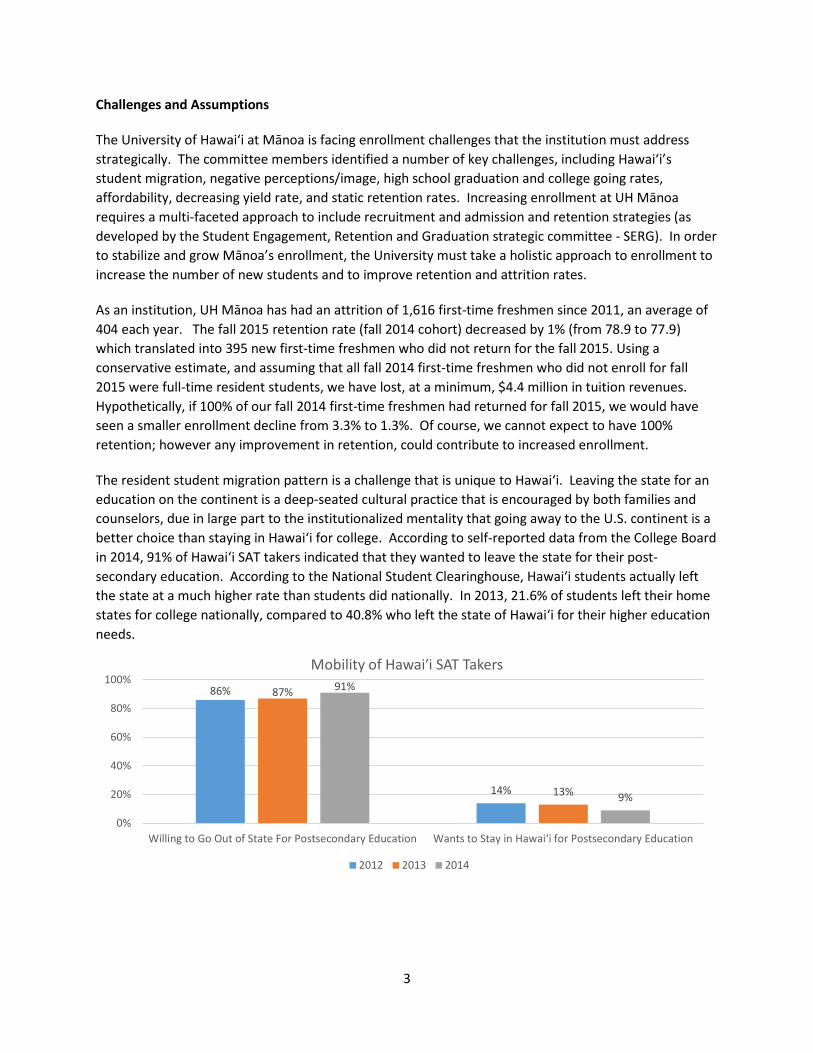
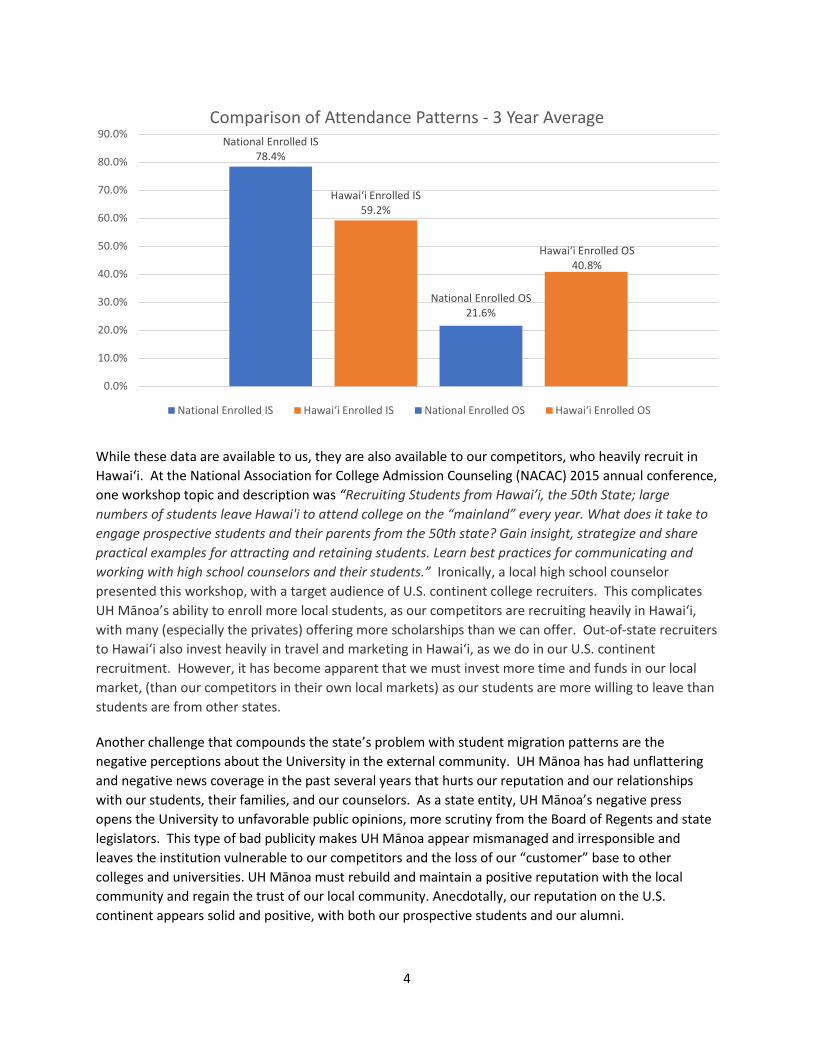
The resident student migration pattern is a challenge that is unique to Hawai‘i. Leaving the state for an education on the continent is a deep-seated cultural practice that is encouraged by both families and counselors, due in large part to the institutionalized mentality that going away to the U.S. continent is a better choice than staying in Hawai‘i for college. According to self-reported data from the College Board in 2014, 91% of Hawai‘i SAT takers indicated that they wanted to leave the state for their post-secondary education. According to the National Student Clearinghouse, Hawai‘i students actually left the state at a much higher rate than students did nationally. In 2013, 21.6% of students left their home states for college nationally, compared to 40.8% who left the state of Hawai‘i for their higher education needs.
86%
14%
87%
13%
91%
9%
0%
20%
40%
60%
80%
100%
Willing to Go Out of State For Postsecondary Education Wants to Stay in Hawai‘i for Postsecondary Education
Mobility of Hawai′i SAT Takers
2012 2013 2014
4
While these data are available to us, they are also available to our competitors, who heavily recruit in Hawai‘i. At the National Association for College Admission Counseling (NACAC) 2015 annual conference, one workshop topic and description was “Recruiting Students from Hawai’i, the 50th State; large numbers of students leave Hawai'i to attend college on the “mainland” every year. What does it take to engage prospective students and their parents from the 50th state? Gain insight, strategize and share practical examples for attracting and retaining students. Learn best practices for communicating and working with high school counselors and their students.” Ironically, a local high school counselor presented this workshop, with a target audience of U.S. continent college recruiters. This complicates UH Mānoa’s ability to enroll more local students, as our competitors are recruiting heavily in Hawai‘i, with many (especially the privates) offering more scholarships than we can offer. Out-of-state recruiters to Hawai‘i also invest heavily in travel and marketing in Hawai‘i, as we do in our U.S. continent recruitment. However, it has become apparent that we must invest more time and funds in our local market, (than our competitors in their own local markets) as our students are more willing to leave than students are from other states.
Another challenge that compounds the state’s problem with student migration patterns are the negative perceptions about the University in the external community. UH Mānoa has had unflattering and negative news coverage in the past several years that hurts our reputation and our relationships with our students, their families, and our counselors. As a state entity, UH Mānoa’s negative press opens the University to unfavorable public opinions, more scrutiny from the Board of Regents and state legislators. This type of bad publicity makes UH Mānoa appear mismanaged and irresponsible and leaves the institution vulnerable to our competitors and the loss of our “customer” base to other colleges and universities. UH Mānoa must rebuild and maintain a positive reputation with the local community and regain the trust of our local community. Anecdotally, our reputation on the U.S. continent appears solid and positive, with both our prospective students and our alumni.
National Enrolled IS 78.4%
Hawai‘i Enrolled IS 59.2%
National Enrolled OS 21.6%
Hawai‘i Enrolled OS 40.8%
0.0%
10.0%
20.0%
30.0%
40.0%
50.0%
60.0%
70.0%
80.0%
90.0%Comparison of Attendance Patterns - 3 Year Average
National Enrolled IS Hawai‘i Enrolled IS National Enrolled OS Hawai‘i Enrolled OS
5
High school graduation rates and college going rates (CGR) are also declining. The UH system had the lowest Hawai‘i student-going rate since 2007 for fall 2015 according to the Institutional Research and Analysis Office (UH IRAO). The State of Hawai‘i Databook indicates that the total number of graduates declined in 2014 by 1.2%. The 2015 Databook was not available at the time of this report but according to UH IRAO, the number of high school graduates in Hawai‘i totaled 13,476 for 2015, which is a 4.6% decrease from last year. Nationally, the US Census indicated that half a million fewer students attended a post-secondary institution from 2012 to 2013, which included significant drops in two-year college enrollments. Finally, the CGR for Hawai‘i students was at 63.8% in 2012 according to Mānoa’s IRO. According to the National Center for Education Statistics (NCES), the national CGR in 2012 was 66.2% and 65.9% in 2013. This makes it difficult for Mānoa in both of our key markets, local student enrollment and WUE enrollment, as the state CGR rate is lower than the national rate, and the national rate is declining.
In the fall 2014 Eduventures Survey of Admitted Students, students who were extremely close to enrolling indicated that overall cost was one of the reasons they did not enroll. In the fall 2015 Eduventures admitted survey, non-enrolling students indicated they received significantly more financial assistance from the institution that they would most likely attend, compared to what UH Mānoa offered. Even in the highest income band of $160K or more, 69% of non-enrolling in state and 68% of non-enrolling out-of-state said offers of additional financial aid could have influenced them to attend (Eduventures, 2015 Survey of Admitted Students). In the lowest income band of $60,000 or less, the influence of financial aid is more critical to enrolling. 91% of non-residents and 86% of resident students said offers of additional aid could have influenced them to attend.
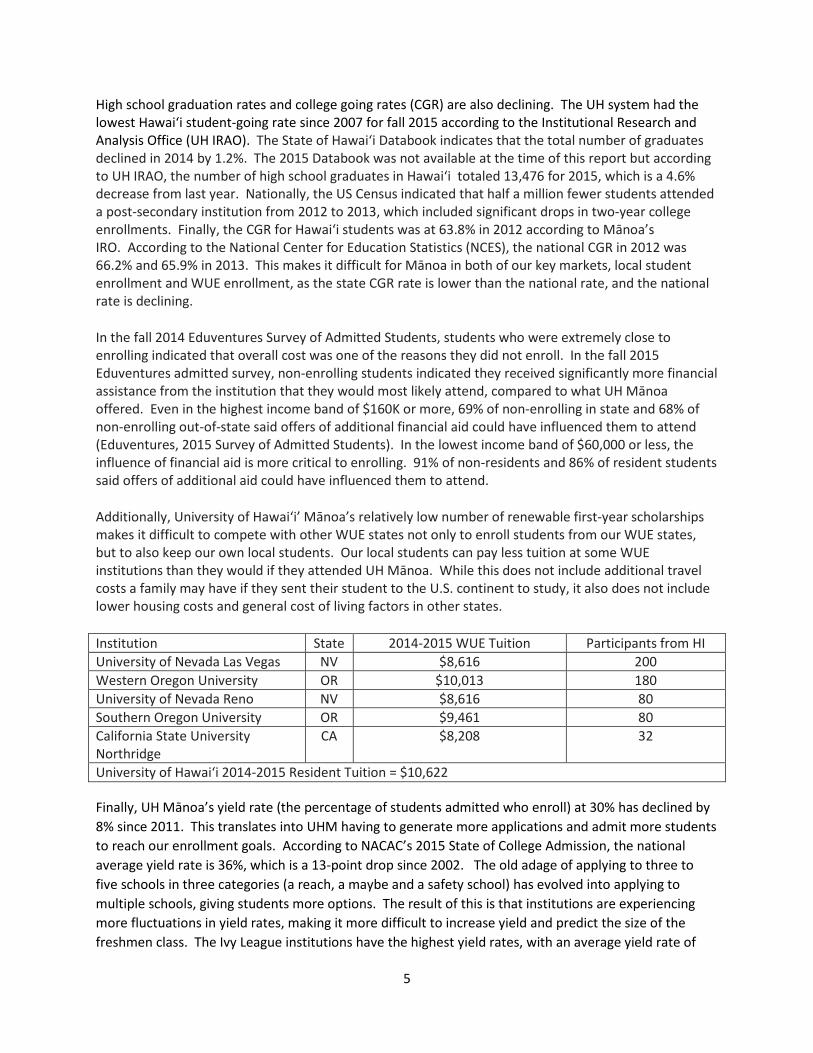
Additionally, University of Hawai‘i’ Mānoa’s relatively low number of renewable first-year scholarships makes it difficult to compete with other WUE states not only to enroll students from our WUE states, but to also keep our own local students. Our local students can pay less tuition at some WUE institutions than they would if they attended UH Mānoa. While this does not include additional travel costs a family may have if they sent their student to the U.S. continent to study, it also does not include lower housing costs and general cost of living factors in other states.
Institution State 2014-2015 WUE Tuition Participants from HI University of Nevada Las Vegas NV $8,616 200 Western Oregon University OR $10,013 180 University of Nevada Reno NV $8,616 80 Southern Oregon University OR $9,461 80 California State University Northridge
CA $8,208 32
University of Hawai‘i 2014-2015 Resident Tuition = $10,622
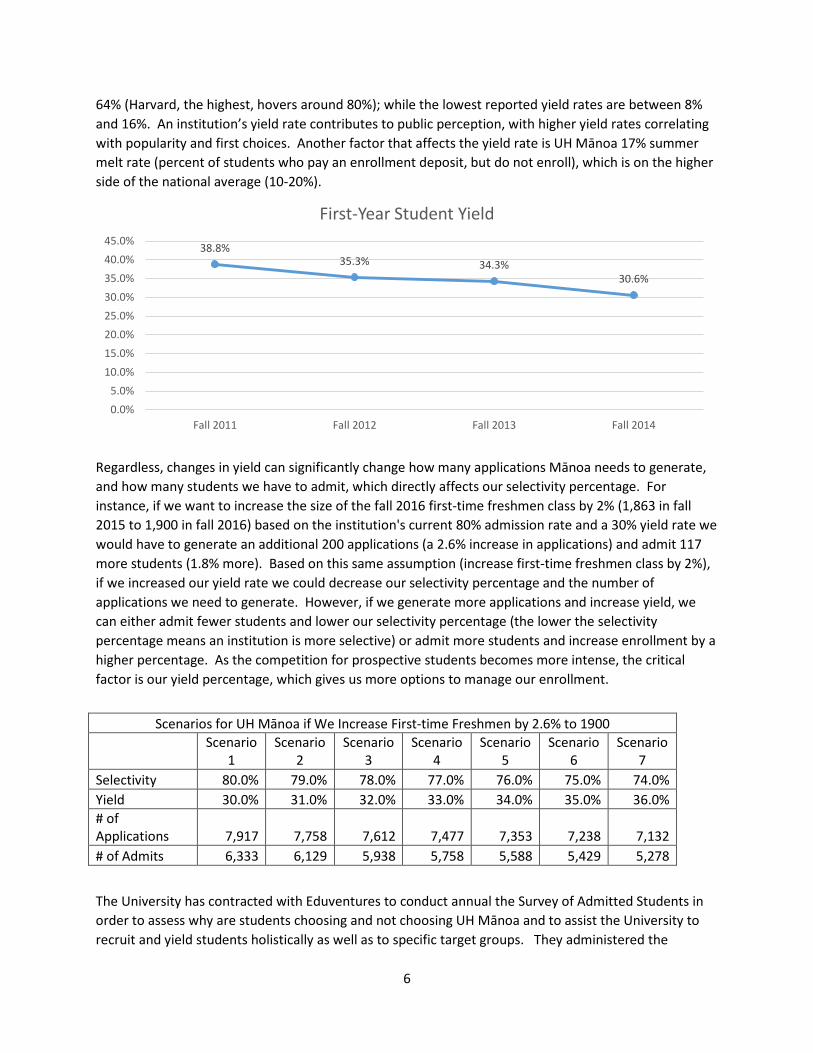
Finally, UH Mānoa’s yield rate (the percentage of students admitted who enroll) at 30% has declined by 8% since 2011. This translates into UHM having to generate more applications and admit more students to reach our enrollment goals. According to NACAC’s 2015 State of College Admission, the national average yield rate is 36%, which is a 13-point drop since 2002. The old adage of applying to three to five schools in three categories (a reach, a maybe and a safety school) has evolved into applying to multiple schools, giving students more options. The result of this is that institutions are experiencing more fluctuations in yield rates, making it more difficult to increase yield and predict the size of the freshmen class. The Ivy League institutions have the highest yield rates, with an average yield rate of
6
64% (Harvard, the highest, hovers around 80%); while the lowest reported yield rates are between 8% and 16%. An institution’s yield rate contributes to public perception, with higher yield rates correlating with popularity and first choices. Another factor that affects the yield rate is UH Mānoa 17% summer melt rate (percent of students who pay an enrollment deposit, but do not enroll), which is on the higher side of the national average (10-20%).
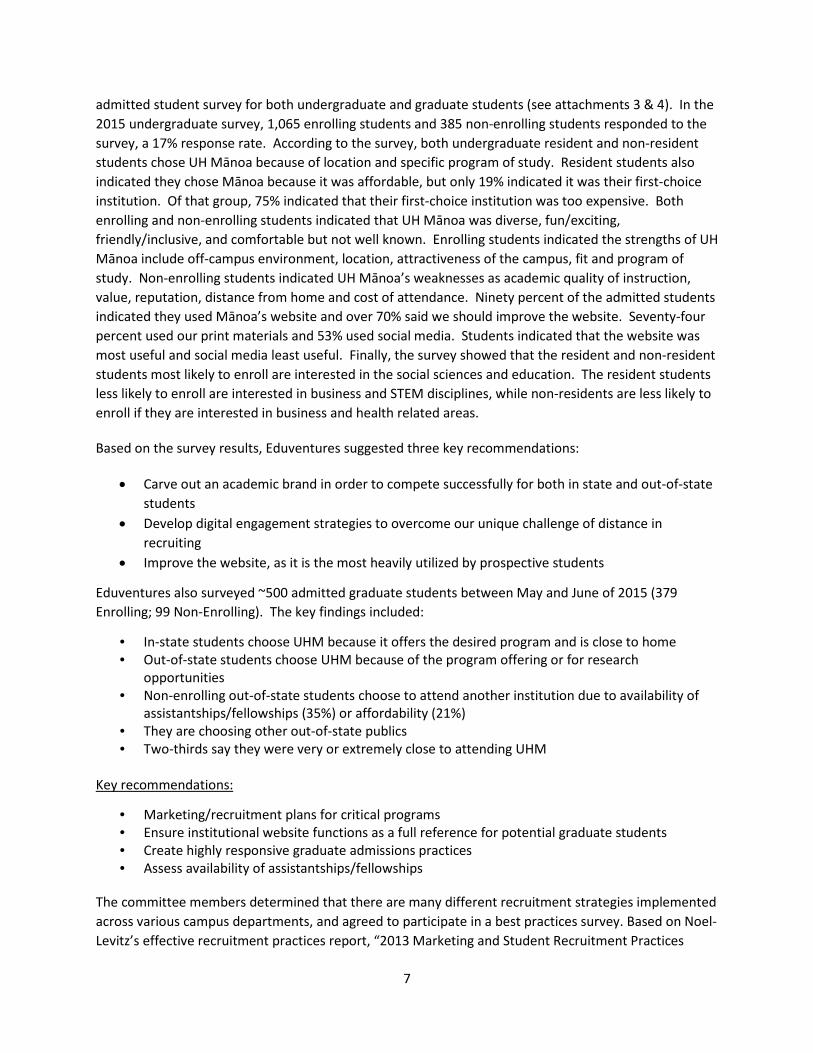
Regardless, changes in yield can significantly change how many applications Mānoa needs to generate, and how many students we have to admit, which directly affects our selectivity percentage. For instance, if we want to increase the size of the fall 2016 first-time freshmen class by 2% (1,863 in fall 2015 to 1,900 in fall 2016) based on the institution's current 80% admission rate and a 30% yield rate we would have to generate an additional 200 applications (a 2.6% increase in applications) and admit 117 more students (1.8% more). Based on this same assumption (increase first-time freshmen class by 2%), if we increased our yield rate we could decrease our selectivity percentage and the number of applications we need to generate. However, if we generate more applications and increase yield, we can either admit fewer students and lower our selectivity percentage (the lower the selectivity percentage means an institution is more selective) or admit more students and increase enrollment by a higher percentage. As the competition for prospective students becomes more intense, the critical factor is our yield percentage, which gives us more options to manage our enrollment.
The University has contracted with Eduventures to conduct annual the Survey of Admitted Students in order to assess why are students choosing and not choosing UH Mānoa and to assist the University to recruit and yield students holistically as well as to specific target groups. They administered the
38.8% 35.3% 34.3%
30.6%
0.0%5.0%
10.0%15.0%20.0%25.0%30.0%35.0%40.0%45.0%
Fall 2011 Fall 2012 Fall 2013 Fall 2014
First-Year Student Yield
Scenarios for UH Mānoa if We Increase First-time Freshmen by 2.6% to 1900
Scenario
1 Scenario
2 Scenario
3 Scenario
4 Scenario
5 Scenario
6 Scenario
7 Selectivity 80.0% 79.0% 78.0% 77.0% 76.0% 75.0% 74.0% Yield 30.0% 31.0% 32.0% 33.0% 34.0% 35.0% 36.0% # of Applications 7,917 7,758 7,612 7,477 7,353 7,238 7,132 # of Admits 6,333 6,129 5,938 5,758 5,588 5,429 5,278
7
admitted student survey for both undergraduate and graduate students (see attachments 3 & 4). In the 2015 undergraduate survey, 1,065 enrolling students and 385 non-enrolling students responded to the survey, a 17% response rate. According to the survey, both undergraduate resident and non-resident students chose UH Mānoa because of location and specific program of study. Resident students also indicated they chose Mānoa because it was affordable, but only 19% indicated it was their first-choice institution. Of that group, 75% indicated that their first-choice institution was too expensive. Both enrolling and non-enrolling students indicated that UH Mānoa was diverse, fun/exciting, friendly/inclusive, and comfortable but not well known. Enrolling students indicated the strengths of UH Mānoa include off-campus environment, location, attractiveness of the campus, fit and program of study. Non-enrolling students indicated UH Mānoa’s weaknesses as academic quality of instruction, value, reputation, distance from home and cost of attendance. Ninety percent of the admitted students indicated they used Mānoa’s website and over 70% said we should improve the website. Seventy-four percent used our print materials and 53% used social media. Students indicated that the website was most useful and social media least useful. Finally, the survey showed that the resident and non-resident students most likely to enroll are interested in the social sciences and education. The resident students less likely to enroll are interested in business and STEM disciplines, while non-residents are less likely to enroll if they are interested in business and health related areas.
Based on the survey results, Eduventures suggested three key recommendations:
• Carve out an academic brand in order to compete successfully for both in state and out-of-state students
• Develop digital engagement strategies to overcome our unique challenge of distance in recruiting
• Improve the website, as it is the most heavily utilized by prospective students
Eduventures also surveyed ~500 admitted graduate students between May and June of 2015 (379 Enrolling; 99 Non-Enrolling). The key findings included:
• In-state students choose UHM because it offers the desired program and is close to home • Out-of-state students choose UHM because of the program offering or for research
opportunities • Non-enrolling out-of-state students choose to attend another institution due to availability of
assistantships/fellowships (35%) or affordability (21%) • They are choosing other out-of-state publics • Two-thirds say they were very or extremely close to attending UHM
Key recommendations:
• Marketing/recruitment plans for critical programs • Ensure institutional website functions as a full reference for potential graduate students • Create highly responsive graduate admissions practices • Assess availability of assistantships/fellowships
The committee members determined that there are many different recruitment strategies implemented across various campus departments, and agreed to participate in a best practices survey. Based on Noel-Levitz’s effective recruitment practices report, “2013 Marketing and Student Recruitment Practices
8
Benchmark Report of Four-Year and Two-Year Institutions” (see attachment 5 for the full report); we sent a survey to the committee members in spring 2015. Departments that participated include the Office of Admissions, Associated Students of UH Mānoa, International Student Services, Outreach College/Come Back to Mānoa, School of Ocean & Earth Science and Technology, Graduate Education, School of Architecture, College of Tropical Agriculture and Human Resources, Myron B. Thompson School of Social Work, the Law School and Shidler College of Business. The survey results show that UH Mānoa, in some capacity, is engaged in 81% of the 53 effective strategies for recruitment. Strategies currently not used by UH Mānoa include:
• Weekend visits for high school students (first overnight visit will occur spring 2016 for scholar students)
• College paid trips to campus for prospective students (not viable for UH Mānoa because of our location, although we could partner with tour groups to develop college visitation trips in Hawai‘i paid for by participants)
• Regularly scheduled telemarketing campaigns (in planning stages for fall 2016) • Academic programs within high schools for students to earn college credits at UH Mānoa • Pay-per-click ads on social media • Loans directly from UH Mānoa • Cookie driven ‘retargeting” ads that target users that have used our site • Virtual tours (new website will include a virtual tour) • Recruiting through business and industry • Mailing course schedules to local residents (a two-year college strategy)
In order to address these challenges, the committee decided on five major categories in which to build the plan: enrollment projections, branding, image and marketing, recruitment, affordability, and infrastructure.
9
Statistical Overview
Total Enrollment Overview
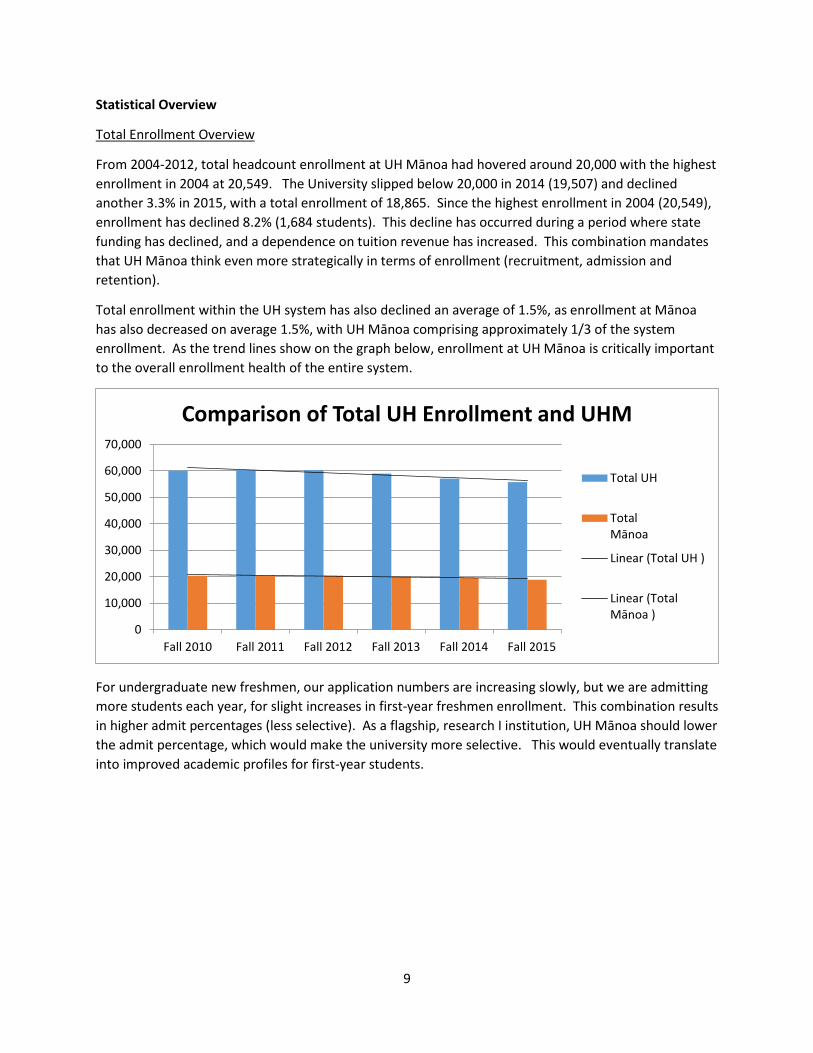
From 2004-2012, total headcount enrollment at UH Mānoa had hovered around 20,000 with the highest enrollment in 2004 at 20,549. The University slipped below 20,000 in 2014 (19,507) and declined another 3.3% in 2015, with a total enrollment of 18,865. Since the highest enrollment in 2004 (20,549), enrollment has declined 8.2% (1,684 students). This decline has occurred during a period where state funding has declined, and a dependence on tuition revenue has increased. This combination mandates that UH Mānoa think even more strategically in terms of enrollment (recruitment, admission and retention).
Total enrollment within the UH system has also declined an average of 1.5%, as enrollment at Mānoa has also decreased on average 1.5%, with UH Mānoa comprising approximately 1/3 of the system enrollment. As the trend lines show on the graph below, enrollment at UH Mānoa is critically important to the overall enrollment health of the entire system.
For undergraduate new freshmen, our application numbers are increasing slowly, but we are admitting more students each year, for slight increases in first-year freshmen enrollment. This combination results in higher admit percentages (less selective). As a flagship, research I institution, UH Mānoa should lower the admit percentage, which would make the university more selective. This would eventually translate into improved academic profiles for first-year students.
0
10,000
20,000
30,000
40,000
50,000
60,000
70,000
Fall 2010 Fall 2011 Fall 2012 Fall 2013 Fall 2014 Fall 2015
Comparison of Total UH Enrollment and UHM
Total UH
TotalMānoa
Linear (Total UH )
Linear (TotalMānoa )
10
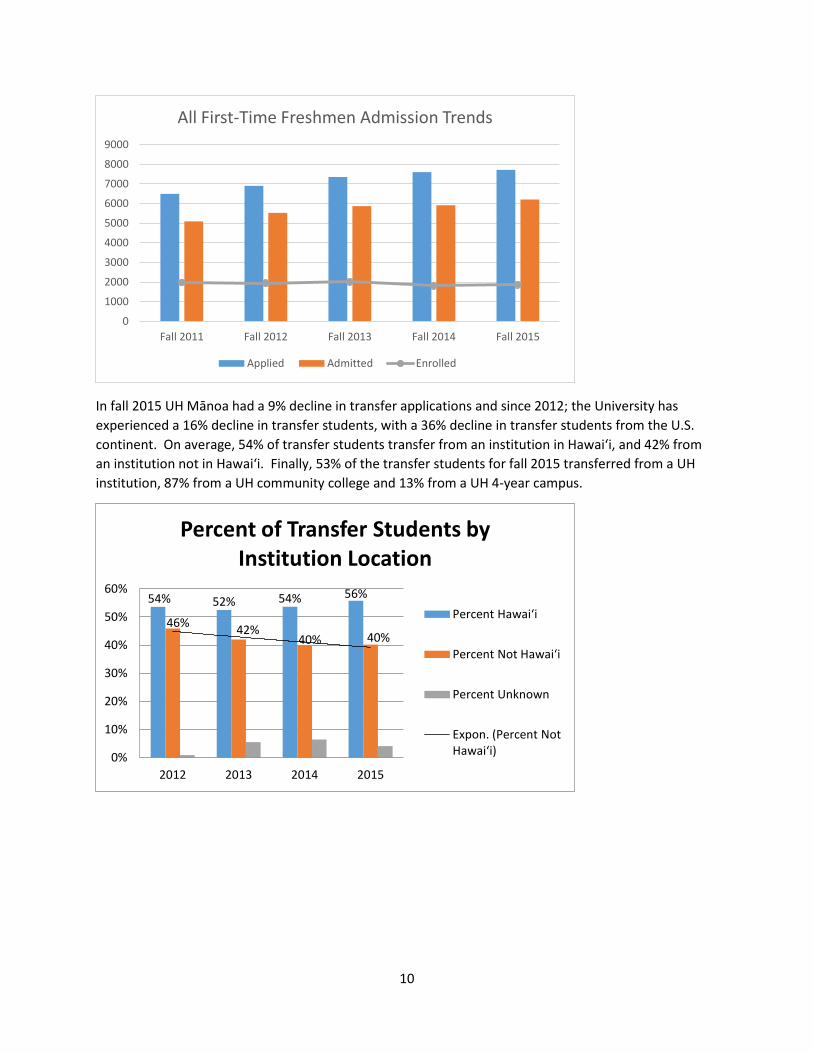
In fall 2015 UH Mānoa had a 9% decline in transfer applications and since 2012; the University has experienced a 16% decline in transfer students, with a 36% decline in transfer students from the U.S. continent. On average, 54% of transfer students transfer from an institution in Hawai‘i, and 42% from an institution not in Hawai‘i. Finally, 53% of the transfer students for fall 2015 transferred from a UH institution, 87% from a UH community college and 13% from a UH 4-year campus.
0
1000
2000
3000
4000
5000
6000
7000
8000
9000
Fall 2011 Fall 2012 Fall 2013 Fall 2014 Fall 2015
All First-Time Freshmen Admission Trends
Applied Admitted Enrolled
54% 52% 54% 56%
46% 42% 40% 40%
0%
10%
20%
30%
40%
50%
60%
2012 2013 2014 2015
Percent of Transfer Students by Institution Location
Percent Hawai‘i
Percent Not Hawai‘i
Percent Unknown
Expon. (Percent Not Hawai‘i)
11
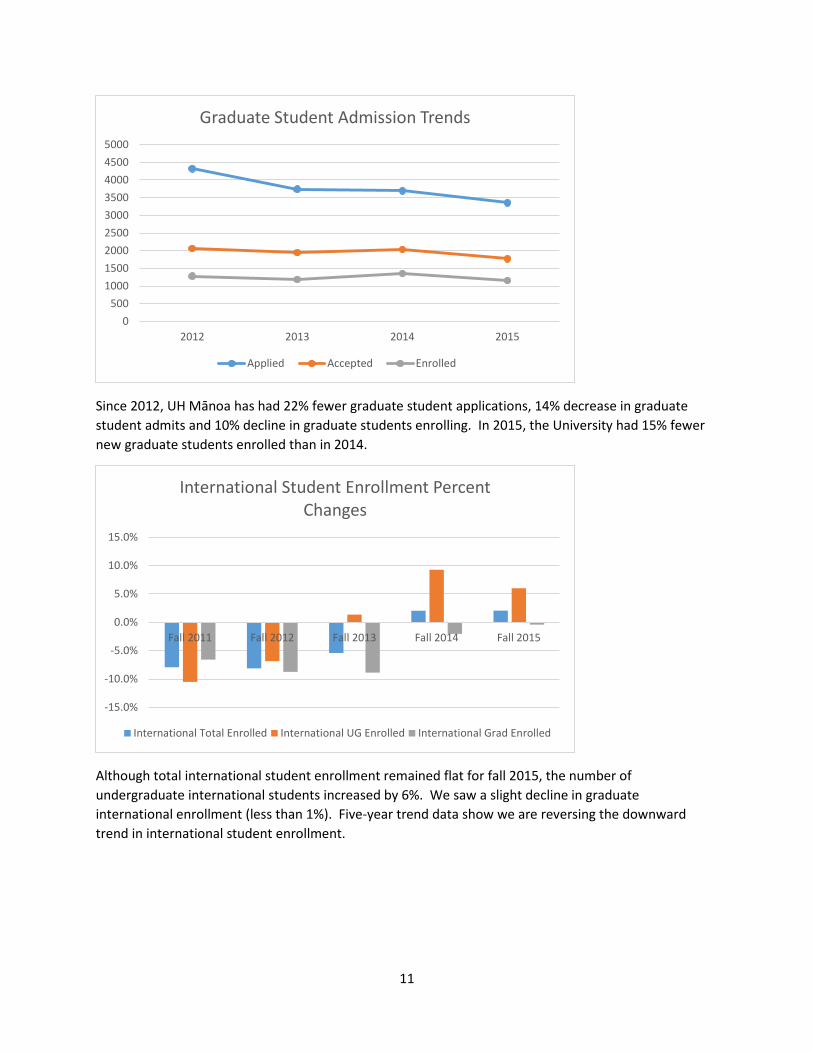
Since 2012, UH Mānoa has had 22% fewer graduate student applications, 14% decrease in graduate student admits and 10% decline in graduate students enrolling. In 2015, the University had 15% fewer new graduate students enrolled than in 2014.
Although total international student enrollment remained flat for fall 2015, the number of undergraduate international students increased by 6%. We saw a slight decline in graduate international enrollment (less than 1%). Five-year trend data show we are reversing the downward trend in international student enrollment.
0500
100015002000250030003500400045005000
2012 2013 2014 2015
Graduate Student Admission Trends
Applied Accepted Enrolled
-15.0%
-10.0%
-5.0%
0.0%
5.0%
10.0%
15.0%
Fall 2011 Fall 2012 Fall 2013 Fall 2014 Fall 2015
International Student Enrollment Percent Changes
International Total Enrolled International UG Enrolled International Grad Enrolled
12
Demographics Overview
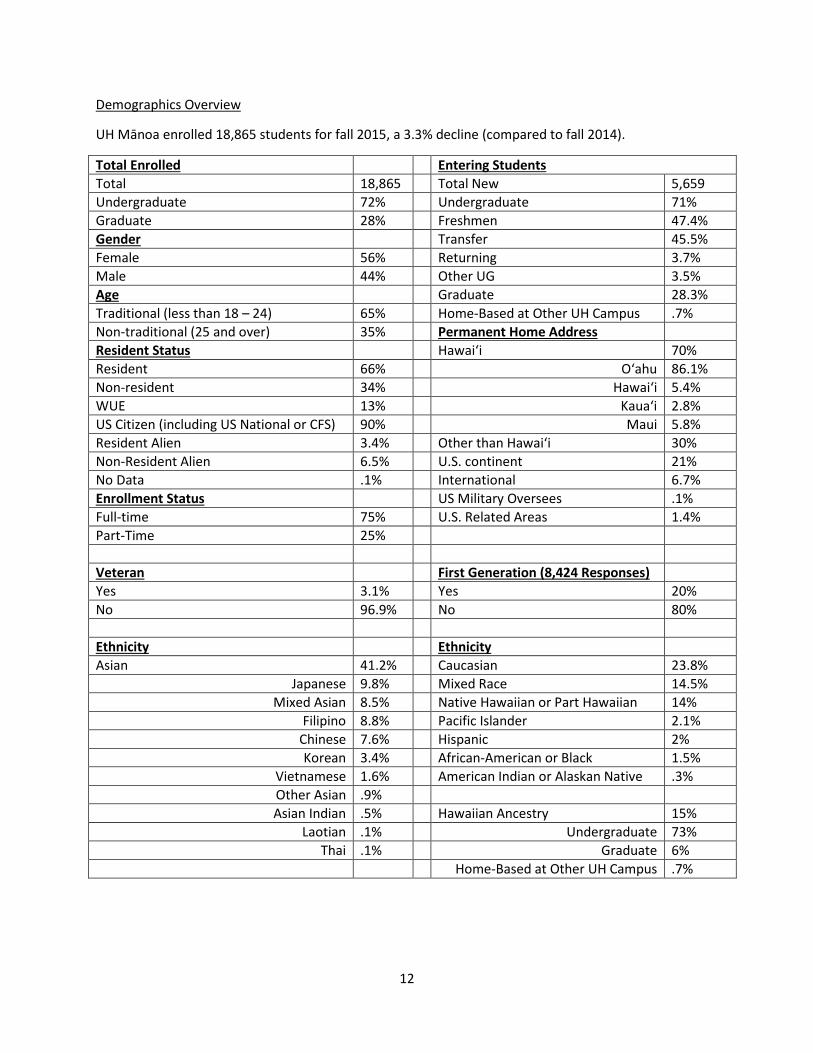
UH Mānoa enrolled 18,865 students for fall 2015, a 3.3% decline (compared to fall 2014).
Total Enrolled Entering Students Total 18,865 Total New 5,659 Undergraduate 72% Undergraduate 71% Graduate 28% Freshmen 47.4% Gender Transfer 45.5% Female 56% Returning 3.7% Male 44% Other UG 3.5% Age Graduate 28.3% Traditional (less than 18 – 24) 65% Home-Based at Other UH Campus .7% Non-traditional (25 and over) 35% Permanent Home Address Resident Status Hawai‘i 70% Resident 66% O‘ahu 86.1% Non-resident 34% Hawai‘i 5.4% WUE 13% Kaua‘i 2.8% US Citizen (including US National or CFS) 90% Maui 5.8% Resident Alien 3.4% Other than Hawai‘i 30% Non-Resident Alien 6.5% U.S. continent 21% No Data .1% International 6.7% Enrollment Status US Military Oversees .1% Full-time 75% U.S. Related Areas 1.4% Part-Time 25% Veteran First Generation (8,424 Responses) Yes 3.1% Yes 20% No 96.9% No 80% Ethnicity Ethnicity Asian 41.2% Caucasian 23.8%
Japanese 9.8% Mixed Race 14.5% Mixed Asian 8.5% Native Hawaiian or Part Hawaiian 14%
Filipino 8.8% Pacific Islander 2.1% Chinese 7.6% Hispanic 2% Korean 3.4% African-American or Black 1.5%
Vietnamese 1.6% American Indian or Alaskan Native .3% Other Asian .9% Asian Indian .5% Hawaiian Ancestry 15%
Laotian .1% Undergraduate 73% Thai .1% Graduate 6%
Home-Based at Other UH Campus .7%
13
Outcomes and Strategies
ENROLLMENT PROJECTIONS
The University must make data driven decisions on what Mānoa’s optimal enrollment should be over the next 10 years. Enrollment models often begin with the basic premise of predicting future student enrollment based on past student enrollment behavior, however a complete analysis must include both objective data and trends and subjective “human” factors.
1. Complete five-year enrollment projections
Strategies
• Complete an environmental scan to provide information everyone can use to make informed decisions concerning UH Mānoa’s capacity, to verify and/or contradict anecdotal data and stories, test our assumptions against market trends and benchmarks and to set a Mānoa standard that strategic enrollment decision making will be informed by data and information.
BRANDING, IMAGING AND MARKETING
Over a decade ago, the University of Hawai‘i system went through an extensive process of developing a branding logo and identity that was inclusive of many voices from faculty, students and the community. In re-assessing the image and branding of UH Mānoa, it would be equally important to consider a similar, inclusive process that reflects our stated values, mission and goals. Thus, we feel the development of branding images and the identity of UH Mānoa must be a shared process based upon uniting principles and values of this institution. Foundationally, the environment, which we create and develop at UH Mānoa, can help to establish our brand and image as a Native Hawaiian Place of Learning & Indigenous-Serving Institution.
1. Create and implement a strategic media plan for print and digital markets (scholarship ads, Best
of, Honolulu College Guide, Google Ad words etc.) in order to ensure we have a presence in key O’ahu and neighboring island publications and in key U.S. continent markets Strategies • Create and implement a social media and content marketing strategic plan to increase social
engagement. • Establish partnerships with both internal and external units for strategic communication.
Partnerships would include advancement (branding campaign, advertising opportunities), athletics (create a Mānoa presence at all games, targeted messaging on the megatron), alumni (outcomes pieces) and UH Student Media (Ka Leo, KTUH and UH Productions)
• Identify key opportunities on campus and within our community to market and promote UH Mānoa, such as community events, fairs, games, high school games (partner with Hawai‘i High School Athletics Association – HHSAA), Homecoming week and first game of the season (UH Mānoa Counselor Tailgate)
• Improve campus grounds and facilities
14
2. Improve reputational image of the university to the local community As a University, we must make a concerted effort to improve our image and reputation in the local community. The University of Hawai‘i Mānoa must advertise in our local media markets, that will also create positive University images and create positive press. Strategies • Design and implement a media blitz with positive news stories, advertising and marketing.
This type of proactive media blitz must be consistent and sustaining for at least 12 months to begin to change public perceptions. At least 50% of this blitz will be in paid advertising and marketing (celebratory ads, info ads etc.)
3. Promote recognition of the Mānoa campus as a part of Mānoa Valley with the ahupa‘a of
Waikīkī, extending from Lyon Arboretum to Waikīkī Aquarium. It is important to develop and promote educational materials and tours of Welina Mānoa that put the focus on UH properties at Lyon Arboretum, Magoon, Kānewai, and the Waikīkī Aquarium, as well as other places as future partnerships between UH and the community develop. Expanding and sharing this knowledge and providing for greater opportunities for learning outside of the classroom can help UH Mānoa move towards being a Hawaiian Place of Learning (HPL). Strategies • Create informational resources about Mānoa, the ‘ili, ahupa‘a, and moku • Increase awareness and connection by students and faculty with Mānoa and UHM as a HPL
4. Create a “Front Door” to Mānoa The University needs a first class visitor’s center, on par with a flagship, research I institution that will highlight the beauty of Hawai‘i and the UH Mānoa campus. This visitor’s center will be a one-stop shop for any visitor to campus, for any reason. It must have adequate parking and be in a prominent location. Additionally, because of our unique location, making it difficult for U.S. continent students to visit, we must create a virtual Welcome Center. Strategies • Coordinate efforts to create this space • Within the new webpage, create a UH Mānoa Welcome Center Portal, to showcase the
campus and our students and ease the enrollment process from application to enrolled student. Some of the items the portal would include are a virtual tour, student videos, webcasts (pre-tour talk, financial aid workshops etc.)
5. Create a cohesive look for Mānoa in undergraduate and graduate recruitment and admissions
publications In order to “brand” Mānoa, the University must begin the process of a cohesive and recognizable experience that we want our constituencies to experience through publications, websites, and social media.
15
Strategies • Further develop and implement the Office of Admissions’ brand campaign (Make Mānoa
Yours) • Continued redesign of publications to appeal to target audiences (high school students and
young adults) with a younger and fresher look • Include graduate education in branding campaign or create one for graduate education • Create graduate publications to appeal to their target audiences consistent with the
undergraduate brand • Create an iconic symbol for UH Mānoa, perhaps a Native Hawaiian symbol • Identify and/or create Mānoa traditions • Create an interactive campus map
6. Update the admissions and graduate program websites
The current admissions website is uninviting and primarily serves as an informational site. Many graduate program websites also need updates in a more user-friendly design. In order to initially attract prospective students to UH Mānoa, we must update and modernize our current admissions’ site, with a marketing look (versus informational only). Strategies • Develop graduate and undergraduate admissions website redesigns that encompasses both
informational processes and marketing strategies • Form a University task-force to begin the process of a university-wide website redesign
RECRUITMENT
1. Increase Local Constituencies Campus Engagement As a University, we must make a concerted effort to improve our image and reputation with our local constituencies to improve the perceptions that our counselors, students and families have about the University and studying in Hawai‘i. The University must “wine and dine” our local constituencies and bring the story of Mānoa to them. Strategies • Expand the campus visitation program to include extended hours, holidays and weekends • Secure campus visitation software • Bi-annual school counselor informational programs • Hosting professional development workshops for local high school teachers and counselors • Develop an annual community college day at UH Mānoa • Revise and improve local Open House programs • Invite local high school students to appropriate UH events • Host more high school nights at sports functions
16
2. Increase Local Student Enrollment Hawai‘i students are more likely to leave the state than are students from any other state. This is a result of the island culture, which pushes students to attend schools on the U.S. continent. Changing a cultural norm is difficult, and in some cases impossible: however, there are strategies we should employ that could result in more local students enrolling into UH Mānoa. This is critical, as we cannot continue to backfill our enrollment with WUE and non-resident U.S. students. For 2015-2016 year, our resident/non-resident percentage for new students was 60/40. If we continue to increase the percentage of new non-resident students, we could misalign our overall enrollment resident/non-resident student balance. Finally we must compete better for our own students as U.S. continent schools are aggressively recruiting in Hawai‘i, because they know (like us) that local students are indicating that they are mobile. Strategies • Improve our brand and image (see Branding, Imaging and Marketing) • Implement strategies that will appeal to parents to include outcome pieces, rankings and
opportunities for U.S. continent experiences • Develop and market the message that you can come to Mānoa and have a still have an U.S.
continent educational experience by aggressively marketing our Study Abroad, Student Exchange and Internship opportunities.
o Develop a program for first-year student cohort groups, that require a student exchange or study abroad experience
o Expand our Student Exchange opportunities for students o Expand the number of internships we offer o Create publications (paper and online) that feature and highlight Study Abroad,
Student Exchange and internships (to include outcomes pieces for internships) o Conduct island-wide informational/promotional tours on Study Abroad, Student
Exchange and Internships • Build stronger relationships with local counselors to break down UH Mānoa negativity and
myths o Hire “Road Warriors” who will be recent grads who will recruit on O‘ahu and the
neighbor islands o The Assistant Vice Chancellor for Enrollment Management will visit all local high
schools and/or hold school counselor breakfast meetings within the next year to “talk story” with local counselors and to develop stronger relationships between our local high schools and the Office of Admissions
• Compete better for our local students by holding events of the same caliber as we do on the U.S. continent and implementing more high touch strategies
• Increase the number of scholarships for local students o Reinstate the Centennial Scholarships - give automatic scholarships to local students
who meet grade point average and test scores criteria determined by the Office of Admissions.
o Work with advancement to generate more funding for first-year local scholarships to keep our students here
17
o Create and offer a tuition remission program, for a limited number of local students, where they work in exchange for tuition or work for the State of Hawai‘i after graduation for an established number of years
3. Increase Native Hawaiian, Filipino, Samoan/Pacific Islander Student Enrollment Diversity in higher education is critical, as we prepare the future workforce for an environment where there will be no clear racial or ethnic majority (http://www.americanprogress.org). As a Hawaiian place of learning and as a Hawaiian serving institution, we are further obligated to increase the enrollment of Native Hawaiian students, as well as other underrepresented groups to UH Mānoa. We have implemented collaborative partnerships between UHM Admissions, SEED Offices and Native Hawaiian Student Services, which include sharing a half-time position and creating the MAI initiative. Strategies • Expand the Mānoa Access Initiative (MAI), a conditional admission program for incoming
freshmen that belong to historically underserved/underrepresented ethnic groups who are required to participate in student services programs that will increase the likelihood of retention and persistence
• Ensure cultural sensitivity in all university publications • UH Maui and UH Mānoa Transfer Pipeline • Develop and hire a diversity recruitment team within the UH Mānoa Office of Admissions • Increase the number of 2+2 programs specifically targeted to underrepresented groups • Develop college experience camps for rising seniors, held at UH Mānoa (SAT prep, study
skills, applying to colleges, financial aid etc.) • Expand college application days at underrepresented schools • Develop and hold Parent Workshops on the College Admission and Financial Aid process for
parents of underrepresented students to demystify the process
4. Increase/maintain U.S. non-resident and WUE enrollment We must at a minimum maintain U.S. non-resident and WUE enrollment, which is currently declining. In order to reach an optimal enrollment for UH Mānoa we must stop the 2013, 2014 and 2015 declining trend and balance our enrollment of resident and U.S. non-resident students. This will become more difficult, as our primary feeder state, California announced in fall 2015 a funded initiative to keep 10,000 California students in state. Strategies • Expand our markets beyond the WUE states based on the College Board’s Enrollment
Planning Service data • Hire a regional coordinator for California (and possibly other areas) • Establish a recognized Alumni Recruitment Program for UH Mānoa • Establish a California Parent Recruitment Program • Show the WUE discount as a scholarship
18
• Increase scholarship funding for WUE and U.S. non-resident students and if necessary provide unfunded tuition discounts
5. Increase transfer student enrollment Since 2012, UH Mānoa has had a 16% decline in transfer students. For fall 2015, the University had 9% fewer transfer students who enrolled, one of its largest single year declines. These declines coincide with enrollment trends at Hawai‘i’ community colleges, the largest feeder into UH Mānoa. Strategies • Establish a transfer student task force • With Eduventures, conduct a Survey of Admitted Students for transfer students • Review current transfer student services and programs for effectiveness • Develop specialized transfer publications • Expand articulation and dual enrollment programs both in Hawai‘i and with schools
internationally and on the U.S. continent • Expand our community college visits • Develop a unified transfer student website • Increase scholarship dollars for transfer students
6. Increase graduate student enrollment Strategies • Increase resources for graduate recruitment and admission • Auto-admit current UH Mānoa undergraduates who qualify for Mānoa graduate programs • Develop graduate recruitment plan • Develop a high touch communication plan for graduate prospective students • Join the Association for Graduate Enrollment Management NAGAP, a national organization
that provides resources on the best practices in graduate enrollment management • Develop graduate recruitment materials with a consistent look and message • Develop and increase the number of 3+2 agreements to increase international student
enrollment • Review the admission and enrollment processes for graduate students • Increase graduate student financial assistance
7. Increase active duty military, veteran and dependent enrollment Congress enacted the Serviceman’s Readjustment Act, known as the GI Bill in 1944. Since that time, millions of veterans and/or their dependents have used the GI Bill to finance a higher education degree. According to the United States Census Bureau, Quick Facts update, there are over 100,000 veterans living in Hawai‘i. Additionally, Hawai‘i, has 11 military bases across the islands (this includes Tripler and the Coast Guard) with 50,000+ active duty military (although this number could decline if the military downsizes in Hawai‘i). In fall 2015, Mānoa had 741 students using military benefits. Of that group, 471 are active-duty military or veterans and 270
19
are dependents. These numbers are low compared to the number of veterans, dependents and active-duty military personnel who currently live and/or serve in Hawai‘i. Strategies • Assess and meet (where we can) the higher education needs of the military community • Develop innovative delivery systems to provide offerings that respond to specialized
schedules and calendars of military personnel – i.e., Outreach College • Improve enrollment policies, processes and procedures for military personnel • Conduct military student needs assessment to determine interest in military related career
fields (i.e., intelligence studies, cybersecurity, military studies, project management, logistics/supply)
• Feasibility study on accepted prior military experience for credit (using ACE’s equivalencies) • Explore the feasibility of a UH Mānoa presence on bases in Hawai‘i • Expand graduate program offerings for military officers
8. Increase international student enrollment
International student enrollment at the University of Hawai‘i Mānoa has declined 11% since 2011, with graduate enrollment at 18% down since 2011. Undergraduate enrollment has been trending down since 2011, with increases beginning again in 2013 and 2014. For fall 2015, the University is currently seeing an increase in new undergraduate international students. Strategies • Assess UH Mānoa’s ability and capacity for an increased international student presence • Charge international students the WUE rate and increase scholarship support • Identify new recruitment territories/segments based on data, trends and country specific
characteristics like economic status/stability, student sponsorship, mobility etc. • Continue to develop and expand the 3+2 program in the Office of Graduate Education • Explore non-traditional international regions to diversify our international student body
(Northern Europe, Canada, Brazil, Turkey etc.) • Establish a physical presence in our key feeder international areas (setting up recruitment
offices, teaching courses etc.) • Hire UH Mānoa exclusive agents in China, Japan, Korea, Vietnam and Indonesia • Expand international recruitment travel by extending international trips by faculty and
administrators to include a recruitment component • “Grow our own” International Alumni Recruiters and hire an international alumni
coordinator • Create a sponsored student coordinator who can build/maintain relationships with foreign
government embassies and organizations to meet the needs of sponsored students and sponsoring organizations
• Review admission standards, SAT requirement for international students and course transfer issues for possible obstacles
• Implement E-Recruitment strategies – Web and Social Media – must be mobile compatible and culturally accurate (i.e., translations, measurements etc.), should include “How To
20
Videos”, FAQ, customized pages based on location, and remain current on worldwide social networking sites
• Invest in Collegeweek Live - https://www.collegeweeklive.com/college-reps/solutions/international-recruiting - will allow us to contact international students via live chat and Virtual Fairs
• Develop high touch communication plans for international students with our CRM • Targeted Advertising/publications– essential to develop brand and advertising strategies
targeted to international students (do not simply use publications designed for domestic recruitment)
• Target and recruit international students who are already living in the United States • Recruit international students in Hawai‘i – host visitation days for international students • Work with local community colleges to recruit international students (campus visits,
articulation agreements etc.) 2+2 agreement with Kapi’olani Community College – guaranteed admission to UH Mānoa to international students who are admitted to and enroll into KCC
• Invite international students who are attending schools on the West Coast to U.S. continent recruitment programs
• Develop guaranteed admission agreements to UH Mānoa with local international students – i.e., Maui Prep Agreement
• Collaborate with the Department of Business, Economic Development, and Tourism (DBEDT) and Study Hawai‘i to recruit and utilize office space
9. Faculty and Department Involvement According to Eduventures undergraduate Survey of Admitted Students, UH Mānoa is known for our location and community, but not our academic quality. The graduate Survey of Admitted Students indicated they make decisions to attend based on program- specific choices and conversations with faculty. In order to build our academic brand, it is critical that faculty and departments are involved in both graduate and undergraduate recruitment efforts. The University also must consistently update, improve and value the academic reputation and quality of instruction at Mānoa. Strategies • Develop publications that focus on faculty achievements and research • Develop departmental marketing materials with a look consistent with the UH Mānoa Office
of Admissions for undergraduate and graduate programs • Increase participation in recruitment and admissions activities for undergraduate and
graduate programs • Engage students who express interest in specific academic areas – contact prospective and
admitted students, availability for visits and calls, allow prospective and admitted students into the classroom
• Coordinate and collaborate with admissions on recruitment activities o Create a calendar of college/school/departmental recruitment activities o Invite departments to attend admitted student receptions on the U.S. continent
• Visit community colleges
21
• Provide training for recruitment staff • Provide annual feedback to AVC for Enrollment Management who have children going
through the current admission cycle at UH Mānoa and other institutions for feedback and ideas
10. Prospective Student Database
UH Mānoa must build a more robust prospective student database and must commit to communicating with prospective students in a strategic and consistent manner. Strategies • Further develop our prospective student database using Banner and selected CRM • Create profiles of those who will likely enroll and buy the names of students who fit our
profile • Utilize recruitment tools such as EPS and College Board Student Search to generate a
targeted inquiry pool • Develop a communication plan with multiple levels of contact • Increase the use of technology in recruitment (e-newsletters, website, texting, social media
etc.)
11. Increase Yield The current yield rate at UH Mānoa has been declining, which means we have to generate more applications and admit more students to maintain and/or increase new student enrollment. Strategies • Improve our brand and image (see Branding, Imaging and Marketing) • Improve the enrollment process and eliminate confusing communications and unintentional
administrative hurdles • Engage parents both resident and non-resident • Develop outcomes publications and information – how UH Mānoa will ensure their
students’ success • Evaluate the success of our accepted student receptions – how can we improve • Expand our alumni events for admitted students • Meaningful engagement and communication with accepted students • Develop an enrollment portal for both parents and students • Departmental contact with students who expressed an interest • Marketing blitz to admitted students – continue intensive marketing
22
AFFORDABILITY
1. Strategic Use of Financial Aid for Optimal Enrollment Our financial aid strategies can affect our marketability and enrollment either to our advantage or to our disadvantage. As an institution, we must determine how we should leverage our limited funds to meet our enrollment goals, better assist students and lower loan indebtedness. Strategies • Reduce the amount of departmental scholarship dollars left not awarded • Increase funding to WUE students beyond Pell and Loans • Reinstate the Centennial Scholarship to give local students who meet grade point averages
and test score criteria determined by the office of admissions • Work with advancement to increase the number of scholarships for new first-time students • Create a tuition remission program for a limited number of local students, where they will
work in exchange for tuition or work for the State of Hawai‘i after graduation for an established number of years
• Increase the number of merit-based scholarships • Require the FAFSA for all students who are receiving scholarships • Develop a common application portal for all scholarships • Apply WUE tuition rate to meritorious international students With the increasing non-
resident tuition rates • Make the International Undergraduate Student Scholarship automatically awarded via the
Admission Office to meritorious new international undergraduate students to increase yield of new international students
• Further develop educational programs to raise student awareness about financial aid, scholarships, loan indebtedness and financial management
• Improve student service at the ground level o Implement a customer service survey
• Develop a task force to explore the feasibility of consolidating all scholarship management under the Office of Financial Aid Services in order to best leverage our limited scholarship funds
• A predictable and set tuition schedule that does not change within the established timeline
INFRASTRUCTURE
1. We must look and act like a selective, research I, flagship institution As part of our efforts to improve public perceptions of Mānoa, we must present ourselves on our website and in our admission policies and process as a selective, research I, flagship institution. Strategies • Implement Deadline Dates and Notification Dates • Ask for extracurricular activities • Require a personal statement
23
• Regionalize the admission and recruitment functions • Change the tone of recruitment and admission correspondence • Create a true Welcome Center
2. Improve enrollment processes for efficiency and effectiveness
Enrolling into UH Mānoa for new students in its current form is overly bureaucratic, disjointed and confusing. The process can leave prospective first-time students and their parents frustrated which can lead them to choose another school, driving our enrollment down. Mānoa’s current summer melt (number of students who send an enrollment deposit but do not enroll) is 17%, which is on the higher end of the national average melt rate of 10-20%. We must improve this process by eliminating unnecessary steps, open more channels of communication not only to student but also to parents and improve coordination, messaging and timelines between offices involved in the process. Strategies • Move the end of summer session back one week to campus housing, financial aid etc., more
time to prepare for the start of the semester • Improve the registration process for new students • Review health forms, make them clearer • Send electronic bills and/or notices of payment due dates to parents and guardians as well
as students • Create parent communication plan to inform them of key/essential processes and deadlines
(housing, registration, tuition etc.) o Create a Parent Portal on admission website
• Create a one-stop center (easily accessible with parking) • Online tuition deposit • Move STAR registration into Banner earlier, or create a tuition bill in STAR • Create an integrated online application for graduate students (for supplemental materials)
3. Improve Physical Plant & Landscaping
Unkempt buildings and grounds diminish efforts to enhance UHM’s image in the local community and does not provide a welcoming, polished look/feel/impression to visiting high school counselors, prospective students and their parents Strategies: • Renovate and/or paint buildings and maintain grass and shrubs (particularly fronting busy
streets like University Avenue, Dole Street, East West Road, Maile Way and Correa Rd) • Repave parking lots • Routinely clean stairwells and floors
24
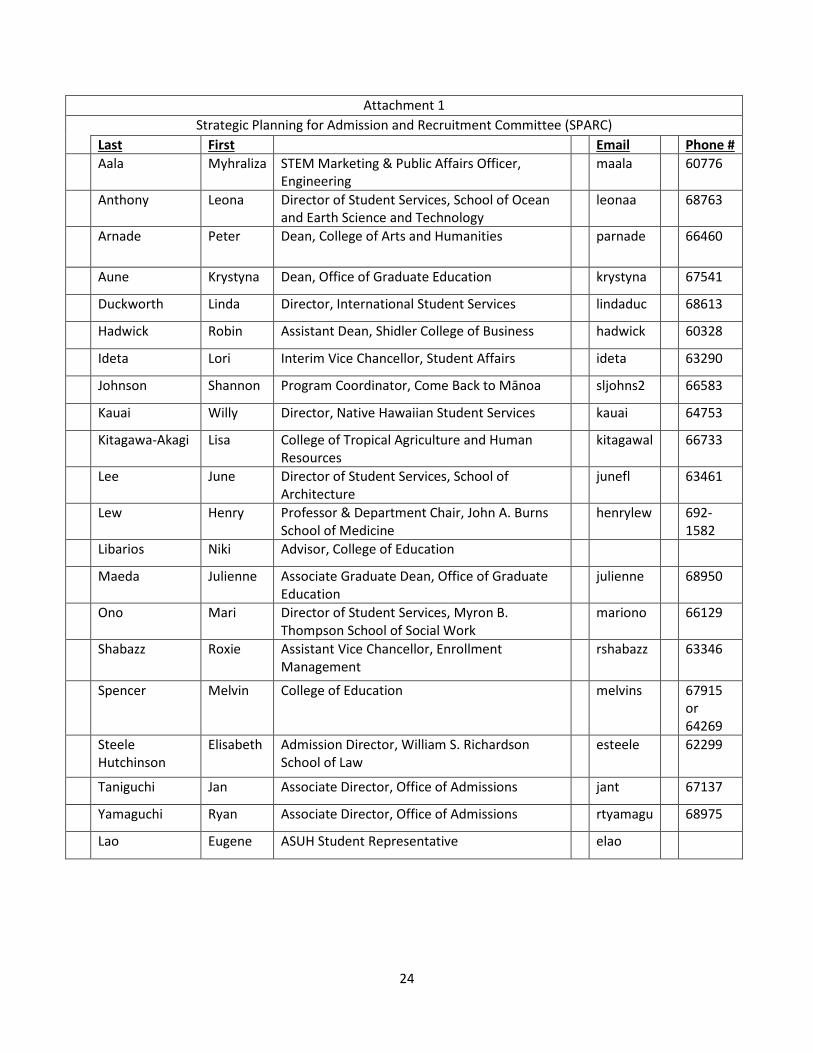
Attachment 1 Strategic Planning for Admission and Recruitment Committee (SPARC)
Last First Email Phone # Aala Myhraliza STEM Marketing & Public Affairs Officer,
Engineering maala 60776
Anthony Leona Director of Student Services, School of Ocean and Earth Science and Technology
leonaa 68763
Arnade Peter Dean, College of Arts and Humanities parnade 66460
Aune Krystyna Dean, Office of Graduate Education krystyna 67541
Duckworth Linda Director, International Student Services lindaduc 68613
Hadwick Robin Assistant Dean, Shidler College of Business hadwick 60328
Ideta Lori Interim Vice Chancellor, Student Affairs ideta 63290
Johnson Shannon Program Coordinator, Come Back to Mānoa sljohns2 66583
Kauai Willy Director, Native Hawaiian Student Services kauai 64753
Kitagawa-Akagi Lisa College of Tropical Agriculture and Human Resources
kitagawal 66733
Lee June Director of Student Services, School of Architecture
junefl 63461
Lew Henry Professor & Department Chair, John A. Burns School of Medicine
henrylew 692-1582
Libarios Niki Advisor, College of Education
Maeda Julienne Associate Graduate Dean, Office of Graduate Education
julienne 68950
Ono Mari Director of Student Services, Myron B. Thompson School of Social Work
mariono 66129
Shabazz Roxie Assistant Vice Chancellor, Enrollment Management
rshabazz 63346
Spencer Melvin College of Education melvins 67915 or 64269
Steele Hutchinson
Elisabeth Admission Director, William S. Richardson School of Law
esteele 62299
Taniguchi Jan Associate Director, Office of Admissions jant 67137
Yamaguchi Ryan Associate Director, Office of Admissions rtyamagu 68975
Lao Eugene ASUH Student Representative elao
25
Attachment 2 – Spreadsheet of objectives and strategies with costs, barriers and responsible person(s) and/or offices
Attachment 3 – Eduventures Undergraduate Admitted Student Survey
Attachment 4 – Eduventures Graduate Admitted Student Survey
Attachment 5 – Noel-Levitz 2013 Marketing and Student Recruitment Practices Benchmark Report of Four-Year and Two-Year Institutions