Embed Size (px)
Citation preview
STRATEGIC PLANNING COMMITTEE
OF THE BOARD OF DIRECTORS
June 8, 2016
10:00 AM
Boardroom
125 Worth Street, Room 532
AGENDA
I. Call to Order Gordon J. Campbell
II. Adoption of March 30, 2016
Strategic Planning Committee Meeting Minutes Gordon J. Campbell
III. Action Item
a. FY’16 IRS Mandated Community Health Needs Assessment Update Report
Adopting in the name of the New York City Health and Hospitals Corporation (“NYC Health + Hospitals”) Board of Directors the twelve Community Health Needs Assessments (“CHNA”) prepared for each of NYC Health + Hospitals’ eleven acute care hospitals and for the Henry J. Carter Specialty Hospital and Rehabilitation Center (“HJC”).
Steven Fass, Assistant Vice President, Corporate Planning Services
Christopher Philippou, Assistant Director, Corporate Planning Services
IV. Information Items
a. NYC Health + Hospitals’ System Scorecard FY’16 First Quarter Report
Udai Tambar, Chief Transformation Officer
b. Patient Experience Review
Raven C. Carter, MBA, FACHE, Director, Patient and Family Experience
Gwen A. Faust, R.N., M.S., Advisor, Press Ganey Associates
V. Old Business
VI. New Business
VII. Adjournment Gordon J. Campbell
MMIINNUUTTEESS
SSTTRRAATTEEGGIICC PPLLAANNNNIINNGG CCOOMMMMIITTTTEEEE MMEEEETTIINNGG OOFF TTHHEE BBOOAARRDD OOFF DDIIRREECCTTOORRSS
MARCH 30, 2016
The meeting of the Strategic Planning Committee of the Board of Directors was held on March 30, 2016 in NYC Health + Hospitals’ Boardroom, which is located at 125 Worth Street with Mr. Gordon Campbell, presiding as Chairperson. ATTENDEES COMMITTEE MEMBERS Gordon Campbell, Chairperson of the Committee Ram Raju, M.D. Josephine Bolus, NP-BC Lilliam Barrios-Paoli, Ph.D., Chairman of the Board Bernard Rosen OTHER ATTENDEES J. DeGeorge, Analyst, New York State Comptroller T. Derubio, Analyst, Office of Management and Budget M. Dolan, Senior Assistant Director, DC 37 E. Kelly, Analyst, New York City Independent Budget Office A. Shermansong, Civic Consulting J. Wessler, Guest S. Wheeler, Budget Analyst, Office of Management and Budget NYC HEALTH + HOSPITALS’ STAFF M. Belizaire, Assistant Director of Community Affairs, Office of Intergovernmental Relations and Planning C. Barrow, Senior Associate Director, Lincoln Medical and Mental Health Center J. Bender, Assistant Director, Media, Communications and Marketing M. Beverly, Assistant Vice President, Finance R. Carter, Director, Patient Experience M. Campese, Interim Assistant Vice President, Labor Relations
MINUTES OF THE MARCH 30, 2016, STRATEGIC PLANNING COMMITTEE MEETING PAGE 2 R. Dixon, Associate Director, Harlem Hospital Center S. Fass, Assistant Vice President, Corporate Planning Services J. Goldstein, Assistant Director, Corporate Planning Services G. Guilford, Assistant Vice President, Finance L. Guttman, Assistant Vice President, Office of Intergovernmental Relations and Planning C. Hercules, Chief of Staff, Office of the Chairman of the Board of Directors J. Jurenko, Senior Assistant Vice President, Office of Intergovernmental Relations and Planning L. Lombardi, Chief Strategy Officer, Bellevue Hospital Center P. Lockhart, Secretary to the Corporation, Office of the Chairman of the Board of Directors A. Marengo, Senior Vice President, Communications and Marketing A. Martin, Executive Vice President and Chief Operating Officer, Office of the President I. Michaels, Senior Director, Media Relations, Communications and Marketing T. Miles, Executive Director, World Trade Center Environmental Health Center S. Penn, Deputy Director, World Trade Center Environmental Health Center C. Philippou, Assistant Director, Corporate Planning Services S. Ritzel, Associate Director, Kings County Hospital Center R. Rowell, Director of Community Affairs, Intergovernmental Relations and Planning S. Russo, Senior Vice President, Office of Legal Affairs U. Tambar, Assistant Vice President, Transformation W. Wang, Chief Operating Officer, Metropolitan Hospital Center K. Whyte, Senior Director, Intergovernmental Relations and Planning R. Wilson, M.D., Senior Vice President, Corporate Chief Medical Officer, Medical and Professional Affairs A. Young, Director of Community Affairs, Intergovernmental Relations and Planning
MINUTES OF THE MARCH 30, 2016 STRATEGIC PLANNING COMMITTEE MEETING PAGE 3 CALL TO ORDER Mr. Gordon Campbell introduced himself as the newly appointed Chair of the Strategic Planning Committee. He called the March 30th meeting of the Strategic Planning Committee (SPC) to order at 10:05 A.M. The minutes of the December 1, 2015 SPC meeting were adopted. INFORMATION ITEM
NYC Health + Hospitals’ Vision 2020 Plan & System Scorecard Raven Carter, MBA/FACHE, Director, Patient & Family Experience
Udai Tambar, Chief Transformation Officer Mr. Campbell introduced Mr. Udai Tambar, Chief Transformation Officer, and Raven Carter, Director, Patient & Family Experience and invited them to lay out Dr. Raju’s daring and ambitious Vision 2020 Plan. He informed the Committee that, for the first time in the history of NYC Health + Hospitals a dashboard has been developed with built in metrics that the Board could use to evaluate the President. The dashboard will also be useful for senior management and the facilities. Mr. Campbell explained that the idea is to identify not every single metric, but only the ones that rise to the top. The dashboard will not only track NYC Health + Hospitals’ progress, but would also include targets so that facilities and staff will know if they are on track, if they are falling short and what needs to be done to achieve their goals. Mr. Campbell stated that every single one of the 2020 Vision goals is to help us get to where we really want to be in terms of making sure that the system is strong and vibrant, not only today, but going forward. Mr. Tambar informed the Committee that scorecards are fairly common in healthcare and in City management. It is used by the Centers for Medicaid and Medicare Services (CMS) and for the Mayor’s Management Report. The scorecard will also be used to coordinate the Vision 2020 strategy. The idea is to flag issues and opportunities early in order to learn from them and to create some transparency for all stakeholders. Mr. Tambar also informed the Committee that the Vision 20/20 Plan & System Scorecard will be presented in two parts. Ms. Carter will first present the 20/20 Plan, its framework, initiatives and the development of the scorecard, and he would describe the current scorecard and the plans going forward. Ms. Carter began her presentation first by stating that the Vision 20/20 Plan is an outcome of Dr. Raju’s HHC for Tomorrow’s speech that was delivered last April. In that speech, Dr. Raju identified improving the patient experience as his number one priority across the entire system. That call to action led to questions such as: how to achieve these aggressive goals, what are the steps to be taken and how to involve patients and staff to achieve these goals. Ms. Carter described the strategic and creative process of the Vision 20/20 Plan as the following: Created by the 20/20 Visionaries (a multi-disciplinary team of 400+ formal and informal
leaders from across the health system) Three interactive retreats over a 7 month period in 2015 that resulted in 22 initiatives to be
implemented by year 2020 Includes evidence-based best practices from around the country
MINUTES OF THE MARCH 30, 2016 STRATEGIC PLANNING COMMITTEE MEETING PAGE 4
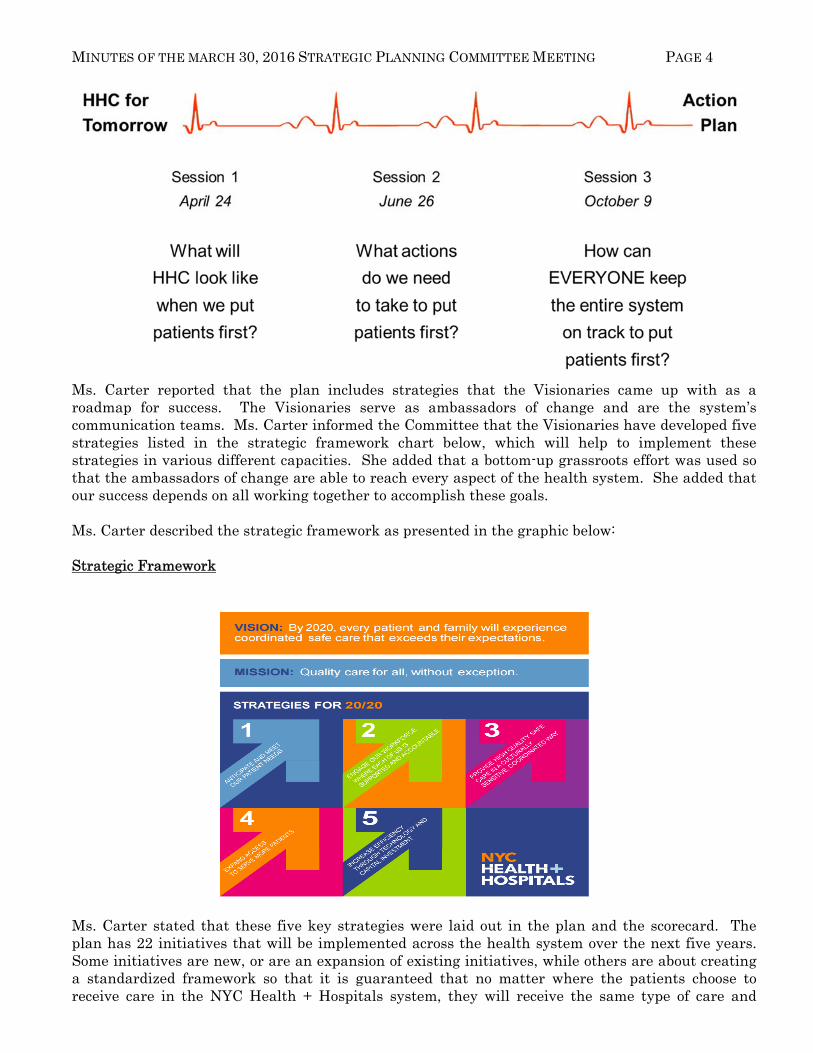
Ms. Carter reported that the plan includes strategies that the Visionaries came up with as a roadmap for success. The Visionaries serve as ambassadors of change and are the system’s communication teams. Ms. Carter informed the Committee that the Visionaries have developed five strategies listed in the strategic framework chart below, which will help to implement these strategies in various different capacities. She added that a bottom-up grassroots effort was used so that the ambassadors of change are able to reach every aspect of the health system. She added that our success depends on all working together to accomplish these goals. Ms. Carter described the strategic framework as presented in the graphic below: Strategic Framework
Ms. Carter stated that these five key strategies were laid out in the plan and the scorecard. The plan has 22 initiatives that will be implemented across the health system over the next five years. Some initiatives are new, or are an expansion of existing initiatives, while others are about creating a standardized framework so that it is guaranteed that no matter where the patients choose to receive care in the NYC Health + Hospitals system, they will receive the same type of care and
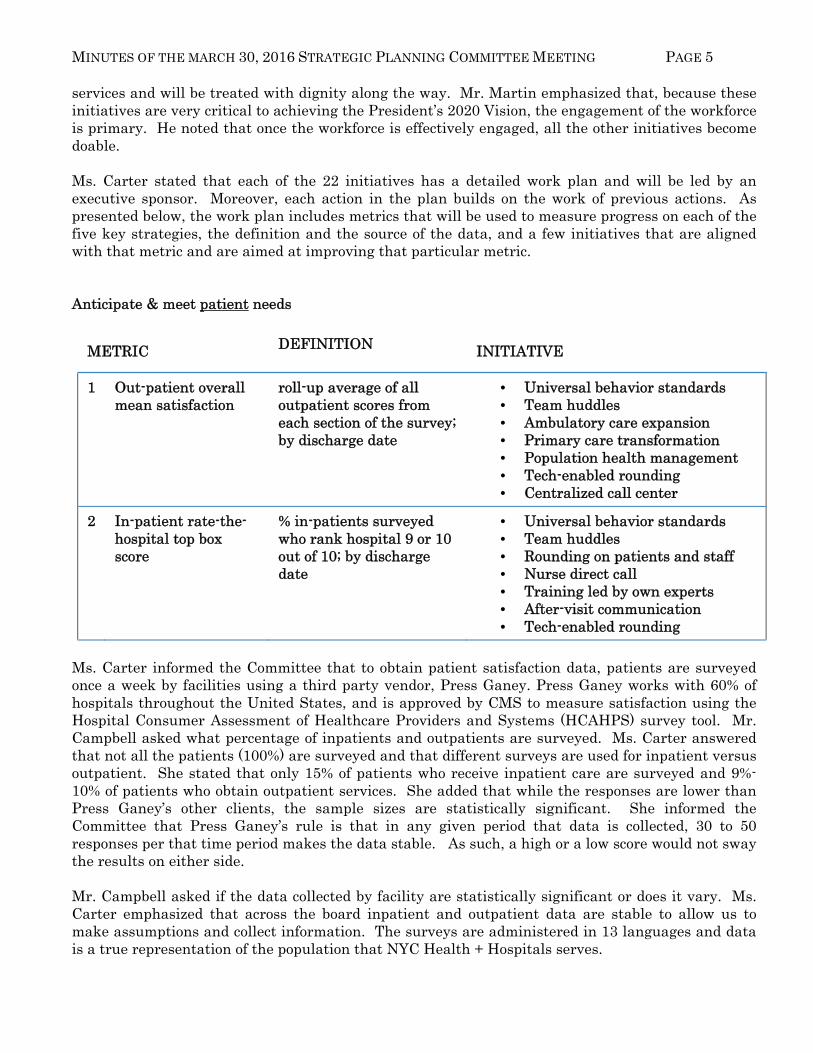
MINUTES OF THE MARCH 30, 2016 STRATEGIC PLANNING COMMITTEE MEETING PAGE 5 services and will be treated with dignity along the way. Mr. Martin emphasized that, because these initiatives are very critical to achieving the President’s 2020 Vision, the engagement of the workforce is primary. He noted that once the workforce is effectively engaged, all the other initiatives become doable. Ms. Carter stated that each of the 22 initiatives has a detailed work plan and will be led by an executive sponsor. Moreover, each action in the plan builds on the work of previous actions. As presented below, the work plan includes metrics that will be used to measure progress on each of the five key strategies, the definition and the source of the data, and a few initiatives that are aligned with that metric and are aimed at improving that particular metric. Anticipate & meet patient needs
METRIC DEFINITION INITIATIVE
1 Out-patient overall mean satisfaction
roll-up average of all outpatient scores from each section of the survey; by discharge date
• Universal behavior standards • Team huddles • Ambulatory care expansion • Primary care transformation • Population health management • Tech-enabled rounding • Centralized call center
2 In-patient rate-the-hospital top box score
% in-patients surveyed who rank hospital 9 or 10 out of 10; by discharge date
• Universal behavior standards • Team huddles • Rounding on patients and staff • Nurse direct call • Training led by own experts • After-visit communication • Tech-enabled rounding
Ms. Carter informed the Committee that to obtain patient satisfaction data, patients are surveyed once a week by facilities using a third party vendor, Press Ganey. Press Ganey works with 60% of hospitals throughout the United States, and is approved by CMS to measure satisfaction using the Hospital Consumer Assessment of Healthcare Providers and Systems (HCAHPS) survey tool. Mr. Campbell asked what percentage of inpatients and outpatients are surveyed. Ms. Carter answered that not all the patients (100%) are surveyed and that different surveys are used for inpatient versus outpatient. She stated that only 15% of patients who receive inpatient care are surveyed and 9%-10% of patients who obtain outpatient services. She added that while the responses are lower than Press Ganey’s other clients, the sample sizes are statistically significant. She informed the Committee that Press Ganey’s rule is that in any given period that data is collected, 30 to 50 responses per that time period makes the data stable. As such, a high or a low score would not sway the results on either side. Mr. Campbell asked if the data collected by facility are statistically significant or does it vary. Ms. Carter emphasized that across the board inpatient and outpatient data are stable to allow us to make assumptions and collect information. The surveys are administered in 13 languages and data is a true representation of the population that NYC Health + Hospitals serves.
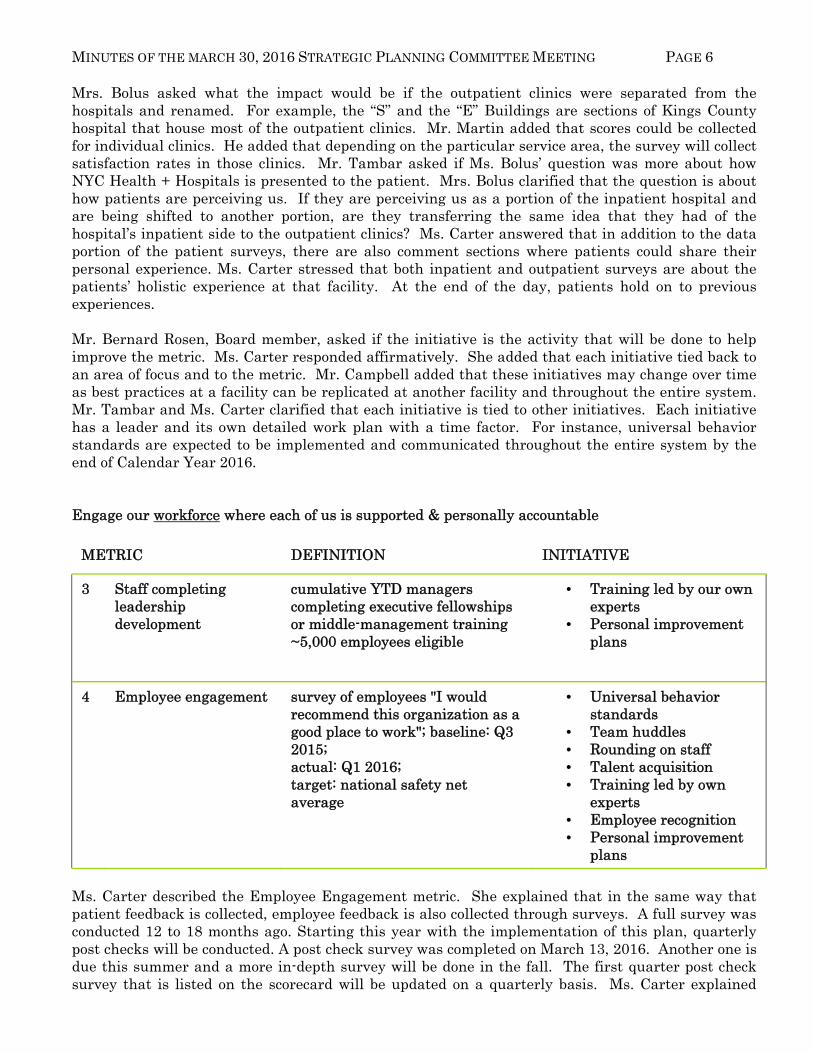
MINUTES OF THE MARCH 30, 2016 STRATEGIC PLANNING COMMITTEE MEETING PAGE 6 Mrs. Bolus asked what the impact would be if the outpatient clinics were separated from the hospitals and renamed. For example, the “S” and the “E” Buildings are sections of Kings County hospital that house most of the outpatient clinics. Mr. Martin added that scores could be collected for individual clinics. He added that depending on the particular service area, the survey will collect satisfaction rates in those clinics. Mr. Tambar asked if Ms. Bolus’ question was more about how NYC Health + Hospitals is presented to the patient. Mrs. Bolus clarified that the question is about how patients are perceiving us. If they are perceiving us as a portion of the inpatient hospital and are being shifted to another portion, are they transferring the same idea that they had of the hospital’s inpatient side to the outpatient clinics? Ms. Carter answered that in addition to the data portion of the patient surveys, there are also comment sections where patients could share their personal experience. Ms. Carter stressed that both inpatient and outpatient surveys are about the patients’ holistic experience at that facility. At the end of the day, patients hold on to previous experiences. Mr. Bernard Rosen, Board member, asked if the initiative is the activity that will be done to help improve the metric. Ms. Carter responded affirmatively. She added that each initiative tied back to an area of focus and to the metric. Mr. Campbell added that these initiatives may change over time as best practices at a facility can be replicated at another facility and throughout the entire system. Mr. Tambar and Ms. Carter clarified that each initiative is tied to other initiatives. Each initiative has a leader and its own detailed work plan with a time factor. For instance, universal behavior standards are expected to be implemented and communicated throughout the entire system by the end of Calendar Year 2016. Engage our workforce where each of us is supported & personally accountable
METRIC DEFINITION INITIATIVE
3 Staff completing leadership development
cumulative YTD managers completing executive fellowships or middle-management training ~5,000 employees eligible
• Training led by our own experts
• Personal improvement plans
4 Employee engagement survey of employees "I would recommend this organization as a good place to work"; baseline: Q3 2015; actual: Q1 2016; target: national safety net average
• Universal behavior standards
• Team huddles • Rounding on staff • Talent acquisition • Training led by own
experts • Employee recognition • Personal improvement
plans
Ms. Carter described the Employee Engagement metric. She explained that in the same way that patient feedback is collected, employee feedback is also collected through surveys. A full survey was conducted 12 to 18 months ago. Starting this year with the implementation of this plan, quarterly post checks will be conducted. A post check survey was completed on March 13, 2016. Another one is due this summer and a more in-depth survey will be done in the fall. The first quarter post check survey that is listed on the scorecard will be updated on a quarterly basis. Ms. Carter explained
MINUTES OF THE MARCH 30, 2016 STRATEGIC PLANNING COMMITTEE MEETING PAGE 7 that, unlike the full survey, the post check survey only consists of seven questions. Both surveys focus on whether employees would recommend the organization as a good place to work. She commented that talking positively about one’s place of work in the community is a good indicator of employee engagement. Mr. Campbell added that retention is also a measure of employee engagement since the better the employees feel about the organization, the more likely that they will stay in that organization. Mrs. Bolus made a recommendation to poll the Board members as well. She explained that while decisions are being made about what is happening in the clinics and the hospitals, not even one Board member has shared the experience of standing in those long lines, waiting for four to five hours to be seen. Ms. Carter informed the Committee that one of the 2016 initiative is leader rounding on staff. Each facility is working on a plan of having a set schedule and a plan for the leaders to be out and interacting with the staff and patients to get a sense of what is truly happening at their facility. She agreed with Mrs. Bolus that until leaders start interacting with people and walking in their shoes, they will not be able to have a true vision of what is happening. She added that, while one can wait for an annual evaluation, it is the day-to-day interaction, the day-to-day “thank you,” and the day-to-day problem solving that happen in the field is really where we see employee engagement. Mr. Campbell asked Mr. Martin to talk about Dr. Raju’s and Dr. Wilson’s plan of using teleconferencing meetings at some sites. Mr. Martin responded that video conferencing technology is being used for a number of meetings so leaders can stay at their facilities. The idea is to hold all the meetings in one day, Wednesday, for example. He emphasized that it is very important for executives to be visible at their facilities and to interact with their staff. Provide high quality safe care in a culturally sensitive coordinated way
METRIC DEFINITION INITIATIVE
5 Hospital-acquired infections – CLABSI SIR
observed / expected Central Line Associated Blood Stream Infection - Standardized Infection Rate; data not finalized for 5 months after the reporting period
• Purposeful rounding on patients
6 DSRIP on track funding vs. max available
total PPS $ awarded / total potential (up to $1.2 B over five years); cumulative since April 2015; reported January & July
• Ambulatory care transformation
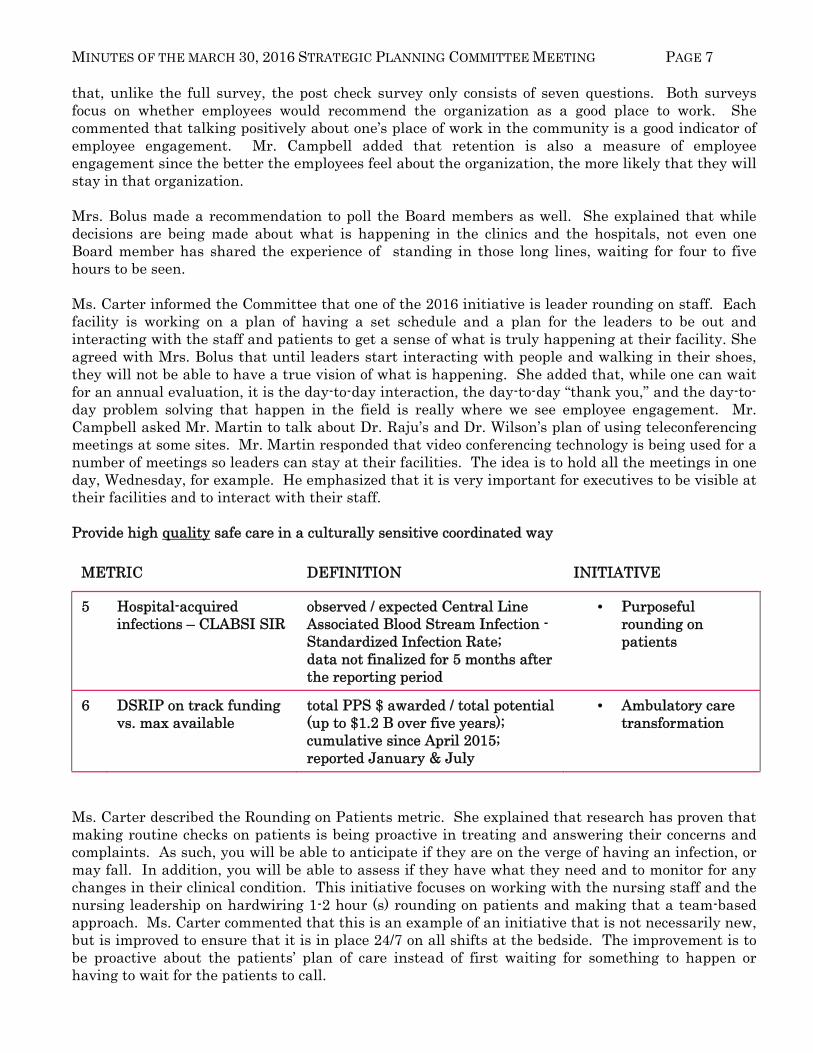
Ms. Carter described the Rounding on Patients metric. She explained that research has proven that making routine checks on patients is being proactive in treating and answering their concerns and complaints. As such, you will be able to anticipate if they are on the verge of having an infection, or may fall. In addition, you will be able to assess if they have what they need and to monitor for any changes in their clinical condition. This initiative focuses on working with the nursing staff and the nursing leadership on hardwiring 1-2 hour (s) rounding on patients and making that a team-based approach. Ms. Carter commented that this is an example of an initiative that is not necessarily new, but is improved to ensure that it is in place 24/7 on all shifts at the bedside. The improvement is to be proactive about the patients’ plan of care instead of first waiting for something to happen or having to wait for the patients to call.
MINUTES OF THE MARCH 30, 2016 STRATEGIC PLANNING COMMITTEE MEETING PAGE 8
Expand access to serve more patients (market share)
METRIC DEFINITION INITIATIVE
7 Access to appointments new adult patient TNAA days
average days to third next available appointment for new adult patients (primary care only)
• Ambulatory care expansion • Primary care
transformation • MetroPlus membership
growth • Centralized call center • Urgent care pilot
8 Unique patients thousand
12-month cumulative unique patients across entire system, not double counting those visiting many sites; high estimate
• Ambulatory care expansion • Primary care
transformation • MetroPlus membership
growth
9 MetroPlus members thousand
active MetroPlus members across all categories at the end of the quarter
• Ambulatory care expansion • MetroPlus membership
growth
10 Patient revenue (proportion of expenditure)
patient-generated revenue / operating expense (cash receipts & disbursements YTD)
• Primary care transformation
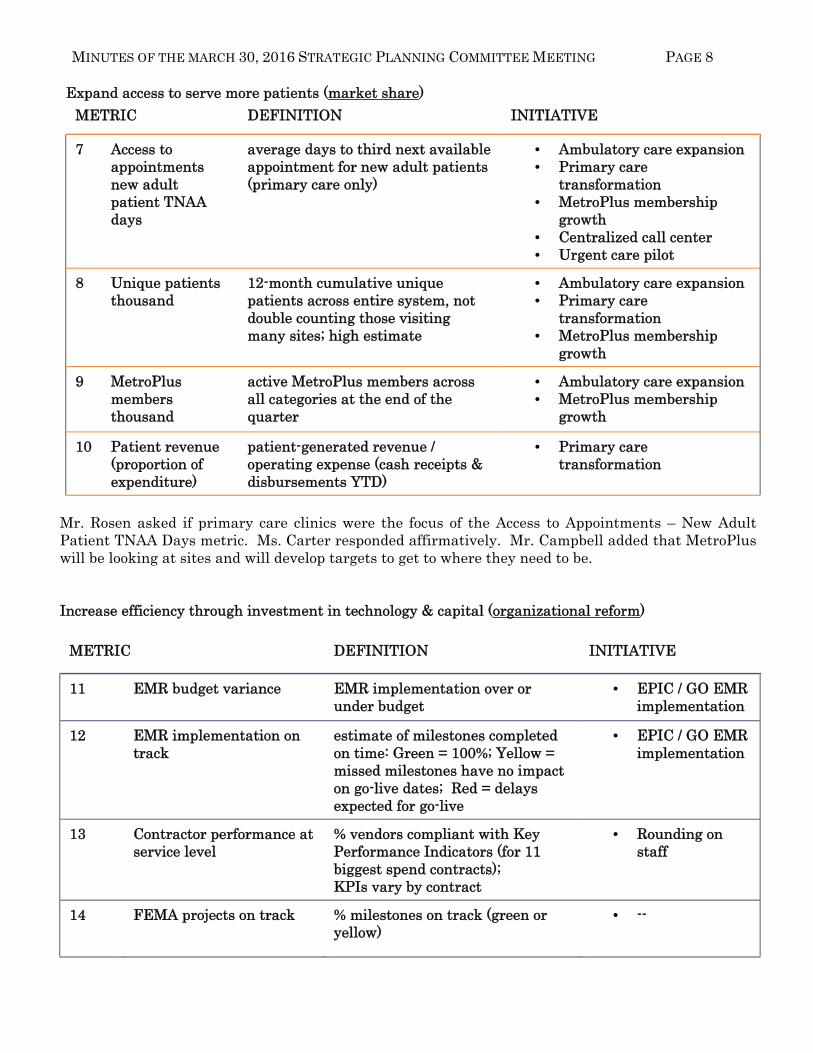
Mr. Rosen asked if primary care clinics were the focus of the Access to Appointments – New Adult Patient TNAA Days metric. Ms. Carter responded affirmatively. Mr. Campbell added that MetroPlus will be looking at sites and will develop targets to get to where they need to be.
Increase efficiency through investment in technology & capital (organizational reform)
METRIC DEFINITION INITIATIVE
11 EMR budget variance EMR implementation over or under budget
• EPIC / GO EMR implementation
12 EMR implementation on track
estimate of milestones completed on time: Green = 100%; Yellow = missed milestones have no impact on go-live dates; Red = delays expected for go-live
• EPIC / GO EMR implementation
13 Contractor performance at service level
% vendors compliant with Key Performance Indicators (for 11 biggest spend contracts); KPIs vary by contract
• Rounding on staff
14 FEMA projects on track % milestones on track (green or yellow)
• --
MINUTES OF THE MARCH 30, 2016 STRATEGIC PLANNING COMMITTEE MEETING PAGE 9
Mr. Martin referred to the Contractor Performance at Service Level metric and stated that Mrs. Bolus would like this metric because she has consistently inquired about how well the vendors are performing. Ms. Carter clarified that the top 11 contracts represent the system’s biggest spend (i.e., 75% of the total spend). Mr. Rosen also asked if rounding on staff means that they will be meeting on these issues. Ms. Carter answered that rounding on staff or patients essentially means that an individual goes to that particular area, a unit or a department. In most cases, they have a strict set of standard questions that they ask. The questions provide a framework for a conversation but it is meant to be an informal conversation to gather information on what is happening in and how we can help at the end. Mr. Martin added that, not only a report, but also a follow-up is done at the end of that conversation.
Mrs. Bolus stated that she had noticed at some facilities that employees were being recognized as “Employee of the Month.” She asked if the employee recognition program is system-wide. Mr. Martin answered that employee recognition is part of staff engagement. There are many things that can be done to make sure that employees are engaged and to demonstrate that they are valued. He emphasized that the rounding is very important because it involves the leadership walking around and interacting with different employees in an effort to identify what can be done to make their jobs better instead of having leaders sitting in their offices assuming that everything is ok.
Ms. Carter concluded by stating that employee recognition is one initiative that is part of the Vision 2020 plan to really look at how employees and physicians are being rewarded. This initiative is expected to be in place by Calendar Year 2017, after the implementation of the universal behavior standards.
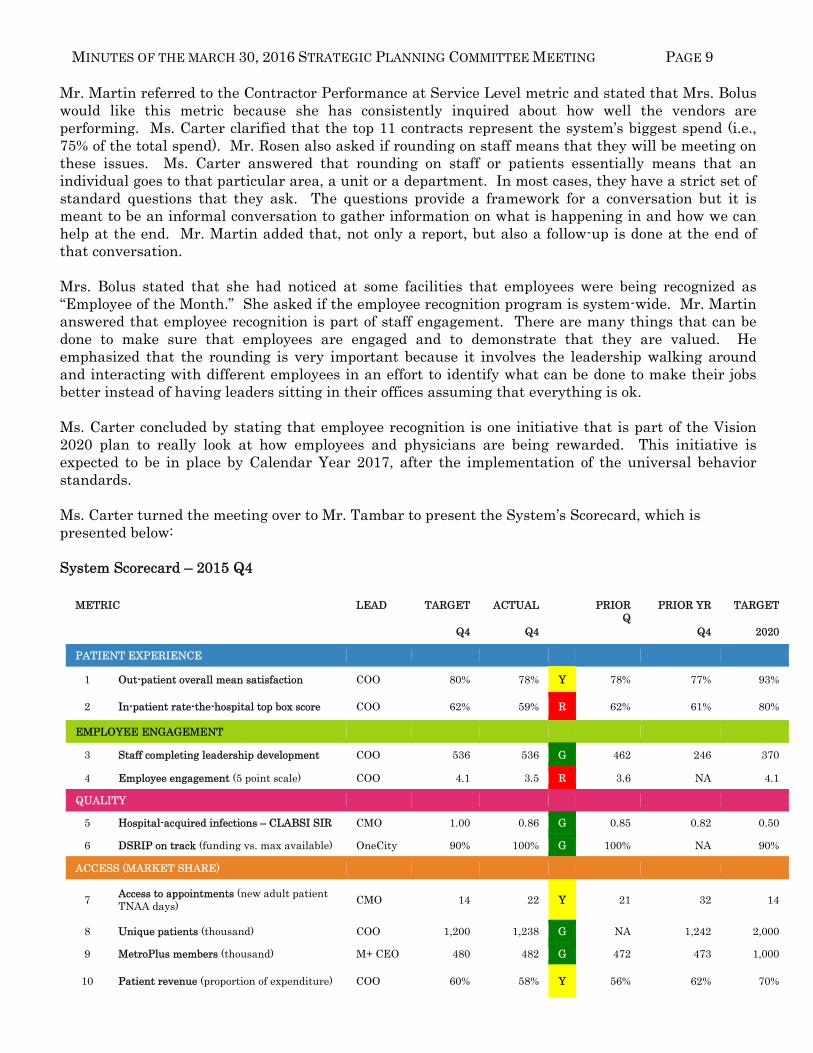
Ms. Carter turned the meeting over to Mr. Tambar to present the System’s Scorecard, which is presented below: System Scorecard – 2015 Q4
METRIC LEAD TARGET ACTUAL PRIOR
Q PRIOR YR TARGET
Q4 Q4 Q4 2020
PATIENT EXPERIENCE
1 Out-patient overall mean satisfaction COO 80% 78% Y 78% 77% 93%
2 In-patient rate-the-hospital top box score COO 62% 59% R 62% 61% 80%
EMPLOYEE ENGAGEMENT
3 Staff completing leadership development COO 536 536 G 462 246 370
4 Employee engagement (5 point scale) COO 4.1 3.5 R 3.6 NA 4.1
QUALITY
5 Hospital-acquired infections – CLABSI SIR CMO 1.00 0.86 G 0.85 0.82 0.50
6 DSRIP on track (funding vs. max available) OneCity 90% 100% G 100% NA 90%
ACCESS (MARKET SHARE)
7 Access to appointments (new adult patient TNAA days)
CMO 14 22 Y 21 32 14
8 Unique patients (thousand) COO 1,200 1,238 G NA 1,242 2,000
9 MetroPlus members (thousand) M+ CEO 480 482 G 472 473 1,000
10 Patient revenue (proportion of expenditure) COO 60% 58% Y 56% 62% 70%
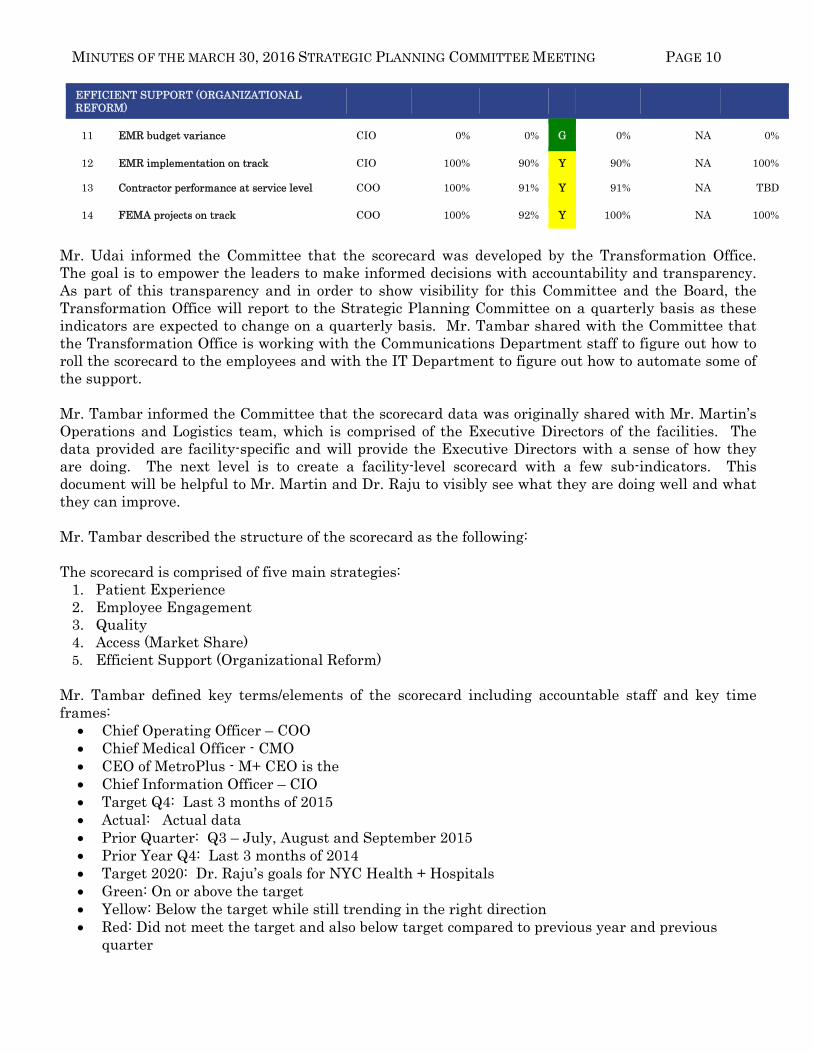
MINUTES OF THE MARCH 30, 2016 STRATEGIC PLANNING COMMITTEE MEETING PAGE 10 EFFICIENT SUPPORT (ORGANIZATIONAL REFORM)
11 EMR budget variance CIO 0% 0% G 0% NA 0%
12 EMR implementation on track CIO 100% 90% Y 90% NA 100%
13 Contractor performance at service level COO 100% 91% Y 91% NA TBD
14 FEMA projects on track COO 100% 92% Y 100% NA 100%
Mr. Udai informed the Committee that the scorecard was developed by the Transformation Office. The goal is to empower the leaders to make informed decisions with accountability and transparency. As part of this transparency and in order to show visibility for this Committee and the Board, the Transformation Office will report to the Strategic Planning Committee on a quarterly basis as these indicators are expected to change on a quarterly basis. Mr. Tambar shared with the Committee that the Transformation Office is working with the Communications Department staff to figure out how to roll the scorecard to the employees and with the IT Department to figure out how to automate some of the support.
Mr. Tambar informed the Committee that the scorecard data was originally shared with Mr. Martin’s Operations and Logistics team, which is comprised of the Executive Directors of the facilities. The data provided are facility-specific and will provide the Executive Directors with a sense of how they are doing. The next level is to create a facility-level scorecard with a few sub-indicators. This document will be helpful to Mr. Martin and Dr. Raju to visibly see what they are doing well and what they can improve.
Mr. Tambar described the structure of the scorecard as the following:
The scorecard is comprised of five main strategies:
1. Patient Experience 2. Employee Engagement 3. Quality 4. Access (Market Share) 5. Efficient Support (Organizational Reform)
Mr. Tambar defined key terms/elements of the scorecard including accountable staff and key time frames:
Chief Operating Officer – COO Chief Medical Officer - CMO CEO of MetroPlus - M+ CEO is the Chief Information Officer – CIO Target Q4: Last 3 months of 2015 Actual: Actual data Prior Quarter: Q3 – July, August and September 2015 Prior Year Q4: Last 3 months of 2014 Target 2020: Dr. Raju’s goals for NYC Health + Hospitals Green: On or above the target Yellow: Below the target while still trending in the right direction Red: Did not meet the target and also below target compared to previous year and previous
quarter
MINUTES OF THE MARCH 30, 2016 STRATEGIC PLANNING COMMITTEE MEETING PAGE 11 Mrs. Bolus made a recommendation to also include the lead’s title at the bottom of the scorecard. Mr. Tambar stated that the goal of the scorecard is not to be punitive but to figure out how to get better overall as a system, acknowledge where there is excellence in the system and identify areas that could be improved in a very transparent and collaborative way. Mr. Rosen asked how the numbers were obtained for the outpatient overall mean satisfaction. He asked if they were obtained through written or oral surveys. Mr. Martin answered that they were collected through Press Ganey, an independent contractor that partnered with NYC Health + Hospitals to do the surveys. Mr. Martin agreed with Mr. Rosen that the scores were not bad at all; however, he pointed out that they are still below Dr. Raju’s overarching goal of 93% by year 2020. While 78% is a lift, yearly incremental progress is needed to reach the 2020 goal especially as we expand access with MetroPlus. Mr. Rosen asked how the 80% target compared to other hospitals. Ms. Carter responded that looking at Press Ganey’s National database, the patient experience target equates to the 90th percentile. Therefore, NYC Health + Hospitals’ ambitious goal is to be better than 90% of the hospitals in the US. Mr. Tambar noted that these scores reflect aggregate data for the entire system. However, he stressed that for real change to occur, it should happen facility by facility, department by department and the data needs to cascade on that level. He added that the goal is to create the tools to get to that next level. Mr. Martin added that the idea is to also hold leadership accountable. As the expectations are very clear, if certain metrics are not being met, the leaders would be expected to have a very critical conversation with the Chief Operating Officer. Mr. Rosen questioned the 59% rate for inpatient hospital top box score compared to the 80% target rate. He recalled that it was said in another meeting that it is tough to survey patients who have had an inpatient stay. Mr. Martin answered that it is multifactorial particularly if a patient’s admission begins with the ED and they were there for a long period of time. Mr. Martin acknowledged that the ED is not the best place to be admitted; however, since a number of inpatient stays begin in the ED, the unpleasant ED experience overshadows the rest of the patient’s experience on the floors. Mr. Rosen asked about the statistics on the inpatient satisfaction survey for the voluntary sector. Ms. Carter answered that most hospitals used the same independent contractor used by NYC Health + Hospitals and that the 80% target is based on the current statistics within Press Ganey’s national database. Mrs. Bolus observed that for prior quarters, inpatient rate was 61% and 62% while the 2020 target is set at 80%. Mr. Tambar explained that looking at October-November-December (Q4), the score was 59%; (last year Q4) it was 61% and the previous three months of last year (Prior Q), it was 62%. Ms. Carter added that a rapid improvement is not expected for this metric. The 59% score is lower than the prior quarter and prior year as this quarter is the one being used to start implementing the plan. It will take several quarters of improved data with a steady approach to reach the 2020 target. Mr. Tambar noted that the targets will also change as data are updated by the facilities. Mr. Tambar shared with the Committee that the plan is to report the data to this Committee on a quarterly basis and to focus on a particular strategy and to go deeper into the metric and the initiatives. He added that today’s focus was centered on the Patient Experience metric.
MINUTES OF THE MARCH 30, 2016 STRATEGIC PLANNING COMMITTEE MEETING PAGE 12 Mr. Campbell made a recommendation to have a Press Ganey representative at the next meeting to talk about how the survey is administered and to provide answers to a lot of Mr. Rosen’s questions. Mr. Tambar accepted Mr. Campbell’s recommendation and promised to show a survey sample or template as well. Mr. Rosen asked if the 0.50% target for Hospital Acquired Infections – CLABSI SIR was also set at the 90th percentile. Mr. Tambar answered that it was benchmarked but he was unsure about the percentile. Mr. Campbell commended Dr. Raju and the team for a great presentation. ADJOURNMENT There being no further business, the meeting was adjourned at 10:57 AM.
RESOLUTION
Adopting in the name of the New York City Health and Hospitals Corporation (“NYC Health + Hospitals”) Board of Directors the twelve Community Health Needs Assessments (“CHNA”) prepared for each of NYC Health + Hospitals’ eleven acute care hospitals and for the Henry J. Carter Specialty Hospital and Rehabilitation Center (“HJC”).
WHEREAS, NYC Health + Hospitals operates eleven acute care hospitals and HJC, a long term acute care hospital; and
WHEREAS, NYC Health + Hospitals has 501(c)(3) tax exempt status under the Internal Revenue Code; and
WHEREAS, The Patient Protection and Affordable Care Act, signed into law in 2010 (the “Affordable Care Act”), added to the Internal Revenue Code Section 501(r)(3) which requires that hospitals with 501(c)(3) tax status conduct a CHNA at least once every three years; and
WHEREAS, regulations adopted under the Affordable Care Act specify that a CHNA be prepared for each licensed facility operated by hospital organizations enjoying 501(c)(3) status; and
WHEREAS, on May 30, 2013 the NYC Health + Hospital’s Board of Directors approved the Implementation Strategies that are responsive to the findings of the CHNAs conducted by for the eleven acute care hospitals and HJC; and
WHEREAS, NYC Health + Hospitals has conducted CHNAs summaries of which are attached as Exhibit A; and
WHEREAS, under the Affordable Care Act, a hospital organization’s governing body or a committee authorized by the governing body must adopt the CHNA.
NOW, THEREFORE, BE IT
RESOLVED, that the New York City Health and Hospitals Corporation’s Board of Directors hereby adopts the twelve Community Health Needs Assessments prepared for each of NYC Health + Hospitals’ eleven acute care hospitals and for the Henry J. Carter Specialty Hospital and Rehabilitation Center

1
COMMUNITY HEALTH NEEDS ASSESSMENT - 2016 UPDATE
EXECUTIVE SUMMARY
Purpose of the Community Health Needs Assessment This 2016 Community Health Needs Assessment (CHNA) updates the CHNA completed in 2013 to meet the requirements of Section 9007 of the 2010 federal law, The Affordable Care Act (“ACA”). The ACA requires that any tax-exempt, IRS-designated 501(c) (3) hospital complete or update a publicly-available, comprehensive CHNA every three years in order to document the extent to which it understands the unique characteristics and needs of the local communities it serves, and responds to these needs by delivering meaningful and effective community benefit through clinical services and other programming. Required Components A CHNA report has five required components:
1) Definition of community served 2) A prioritized description of the significant health needs of the community 3) Transparency in the process and methods used to conduct the CHNA,
including how it took into account input from the community served and prioritized community health needs
4) A description of the resources potentially available to address the identified significant prioritized community health needs
5) An evaluation of the impact of actions taken to address the significant health needs identified in the previous CHNA report (June 2013).
A CHNA report is considered complete when it is adopted by a governing body of the facility and made widely available to the public. Community Served NYC Health + Hospitals serve all New Yorkers in every neighborhood in New York City regardless of their ability to pay. Addressing disparity throughout New York City, NYC Health + Hospitals is the safety-net for the uninsured and underserved in New York City. As a share of its total volume, NYC Health + Hospitals provides three times greater share of ambulatory care to the uninsured than other New York City hospitals (27%
2
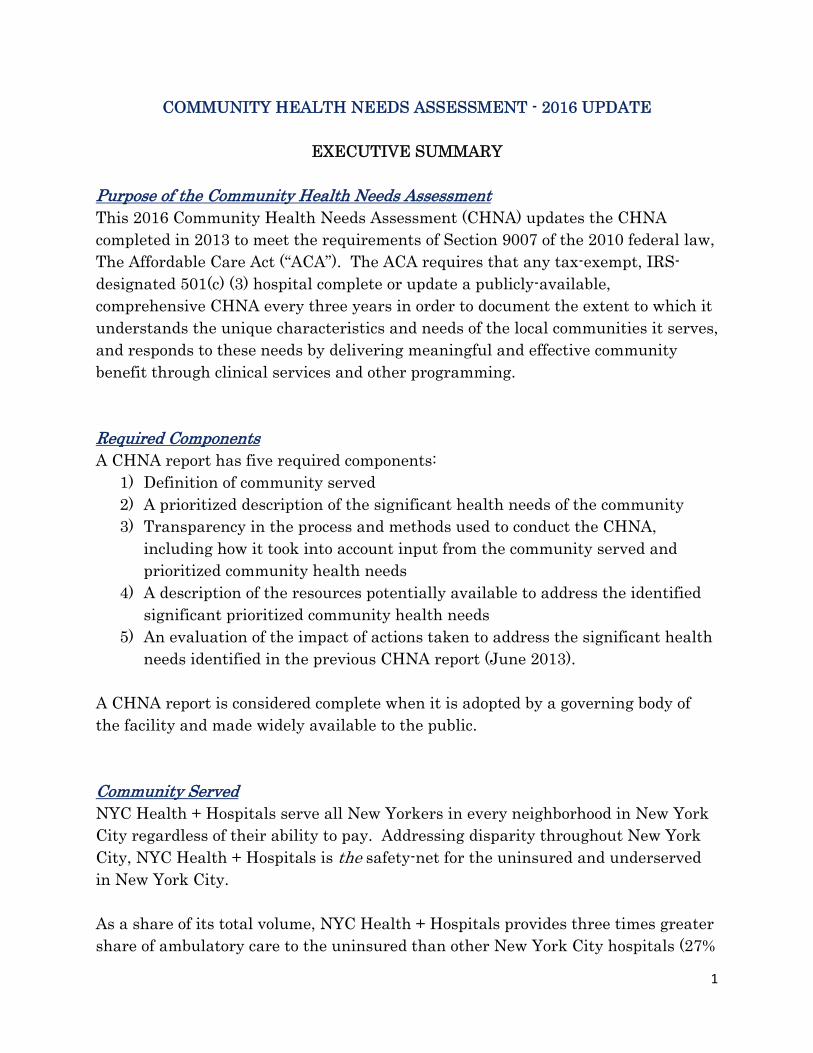
and 8%, respectively) and twice as many ED visits (29% and 13%, respectively). Medicaid and uninsured patients together account for nearly twice as many hospital stays compared to other New York City hospitals (66% and 37%, respectively) (chart 1). Chart 1: NYC Health + Hospitals Payer Mix by Service
Sources and notes: 2014 Hospital Institutional Cost Report, 2014 DTC Cost Report for HHC using internal data, and 2013 Health Center Cost Report for all other DTCs. Includes all NYC acute, general care hospitals and related wholly owned or controlled community health centers, including HHC DTCs. Discharges exclude normal newborns. ED visits include treat and release, and visits that result in admission. Clinic visits include comprehensive care and primary care visits only.
The service area of individual hospitals in the NYC Health + Hospitals System are identified in Appendix 1. A description of these communities, including demographic characteristics identifying vulnerable populations such as disabled and residency status; and health status such as chronic disease prevalence and the rate of potentially avoidable emergency health care use, is in Appendix 2. Process and Methods The process and methods was designed collaboratively by a work group of facility planning directors and other representatives. The community served by each acute care facility is defined as the geographic area in which 75% of its ambulatory care patients reside. An initial list of over 40 health
3
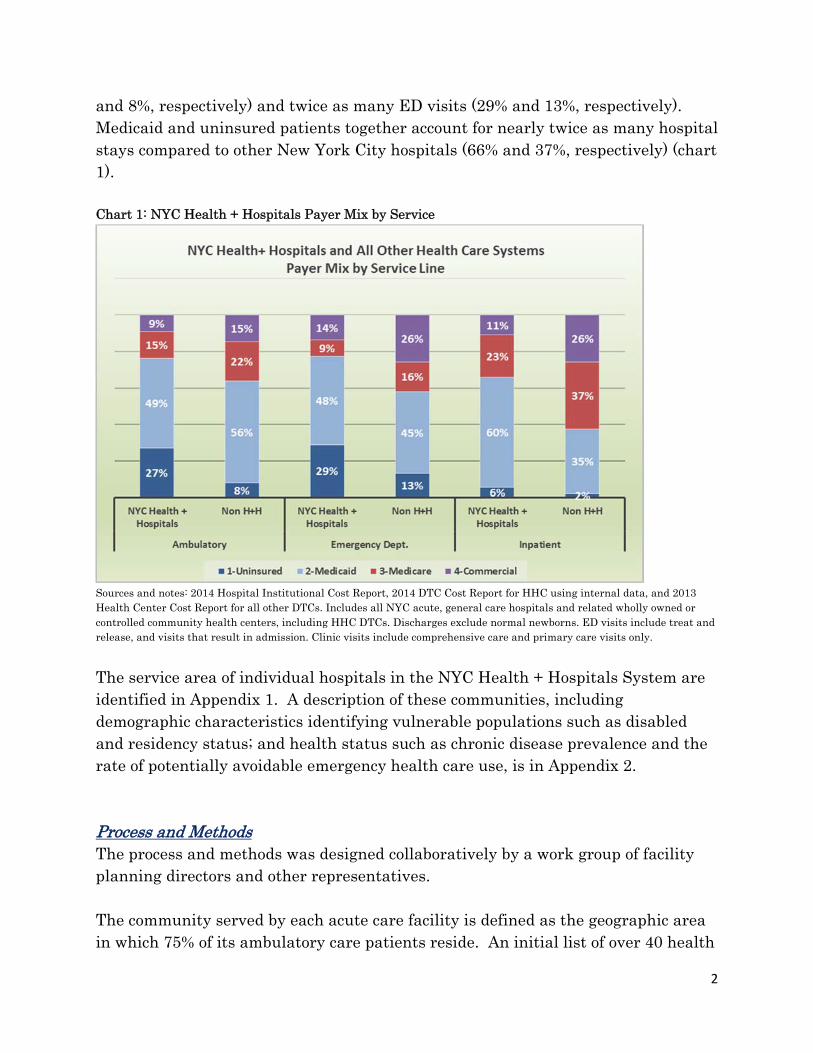
needs were identified based on a review of published literature and internal analyses that have been made publically available including the 2013 CHNA and the DSRIP Community Needs Assessment. Incorporating input from other facility representatives and pilot tested with hospital users, this list was refined to 13 community health needs. Input from facility users (approximately 150 per facility were surveyed), Community Advisory Boards, facility leadership, and the prevalence of these health needs within the community were blended together to prioritize the health needs. The five highest priority community needs were considered significant. Prioritized Significant Community Health Needs All 13 identified community health needs were identified as important within the hospitals’ communities according to community input. Those considered most significant and their priority order in accordance with regulatory requirements are indicated in blue in the table below. Hypertension/high blood pressure and diabetes are significant community health needs at all hospitals; obesity and heart disease are significant at the majority of hospitals (Chart 2).
Chart 2: Community Health Need by Hospital
Bellevue Carter Coney Island
Elmhurst Harlem Jacobi
Kings County Lincoln
Metro-politan NCB Queens Woodhull
Hypertension/ High Blood Pressure
1 1 (tie) 4 2 1 1 2 1 2 2 (tie) 2 1
Diabetes 5 1 (tie) 1 1 2 (tie) 3 1 3 1 2 (tie) 1 3 (tie)
Obesity 2 (tie) 4 (tie) 6 4 (tie) 9 4 6 6 3 4 5 3 (tie)Heart Disease, High Cholesterol, Stroke
2 (tie) 3 2 (tie) 4 (tie) 8 5 (tie) 4 4 (tie) 5 6 10 (tie) 5
Mental Illness 4 6 (tie) 8 (tie) 4 (tie) 6 5 (tie) 3 10 (tie) 9 5 3 (tie) 6
Alcohol and/or Drug Use
6 9 10 7 5 9 7 (tie) 2 7 9 6 (tie) 2
Asthma and Other Breathing Issues
8 6 (tie) 8 (tie) 12 2 (tie) 2 9 4 (tie) 4 1 13 7 (tie)
Cancer 7 10 2 (tie) 3 11 8 5 9 8 7 8 (tie) 11
Smoking 11 6 (tie) 5 8 4 7 12 7 12 8 3 (tie) 10
Violence 10 12 (tie) 11 9 10 10 10 8 6 10 6 (tie) 7 (tie)
HIV/AIDS, Hepatitis, STDs
9 11 13 10 7 11 7 (tie) 10 (tie) 10 11 12 7 (tie)
Dementia 12 4 (tie) 7 11 12 (tie) 12 13 12 11 12 10 (tie) 12 (tie)Premature Births, Low Birth Weight
13 12 (tie) 12 13 12 (tie) 13 11 13 13 13 8 (tie) 12 (tie)
4
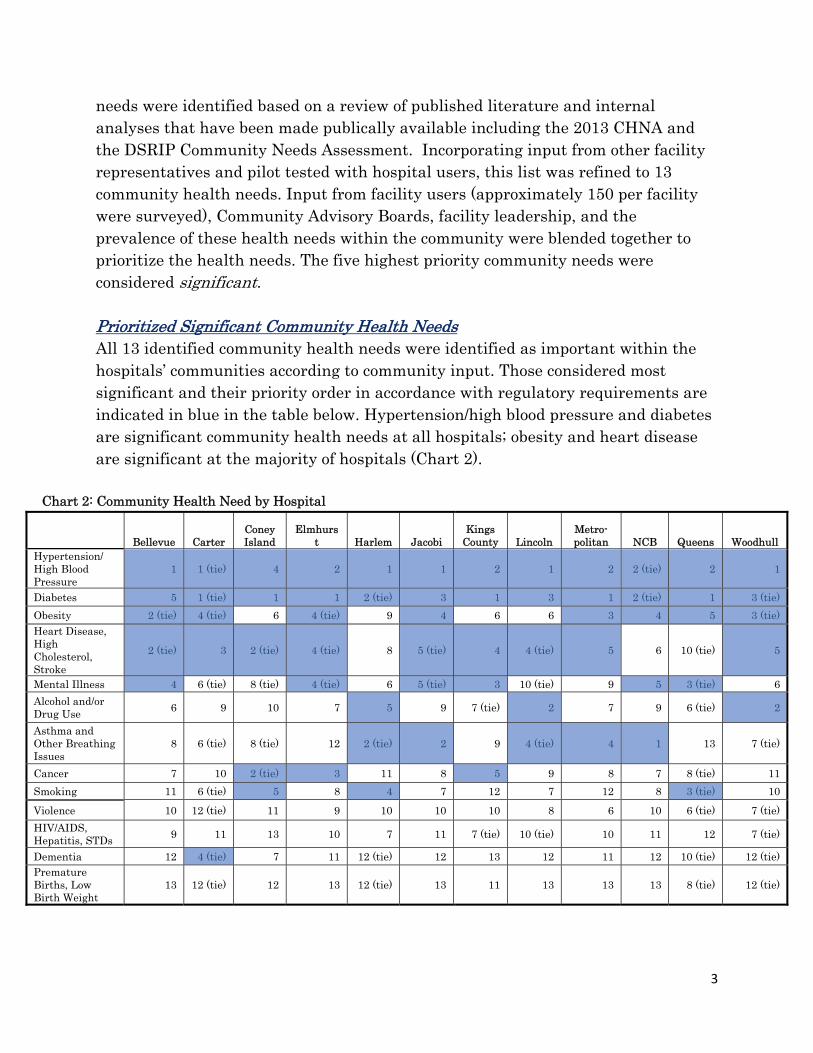
Comparison of 2013 and 2016 Significant Community Health Needs Most of the significant community health needs identified in 2013 were again identified in 2016. In both 2013 and 2016, a large number of hospitals identified diabetes, hypertension/high blood pressure, heart disease, obesity, mental illness and asthma as a significant community health need. HIV/AIDS and other infectious diseases were considered a significant community health need at five hospitals in 2013, but none considered it among their most significant in 2016. A decrease in importance is consistent with the continued progress in reducing HIV/AIDS diagnoses and deaths in NYC. Other changes in health needs between 2013 and 2016 are partly attributable to changes in federal requirements regarding methodology (see Process and Methods). Significant Community Health Needs Identified in 2016 and 2013 Significant Community Health Needs Number of
Hospitals Identified in 2016
Number of Hospitals
Identified in 2013 Diabetes 12 12 Hypertension / High Blood Pressure 12 10 Heart Disease, High Cholesterol, Stroke
9 10
Obesity 8 8 Mental illness 6 10 Asthma and other Breathing Issues 5 5 Alcohol and/or Drug Use 3 9 Cancer 3 6 Smoking 3 1 Dementia 1 1 HIV/AIDS, Hepatitis, STDs 0 5 Violence 0 2 Premature Births, Low Birth Weight 0 1
Resources Potentially Available Appendix 4 is a listing of health and social service organizations available to members of low-income, medically underserved, and other minority populations in the neighborhoods included in the primary service area of NYC Health + Hospitals, by borough and sorted by neighborhood. These populations may experience health disparity or are at risk of not receiving medical care as a result of being uninsured
5
or underinsured or due to geographic, language, financial, immigration status, or other barriers. Organization services provided are arranged accordingly into the following categories: Dental, Vision, Adult Day Health, Health center, Insurance enrollment, Home Health, Hospital, Nursing Home, Prescription Drug, Immigration Support, Mental Health-Inpatient, Mental Health-Ambulatory, Substance Use, Social Services, Financial Assistance, and Wellness/Prevention. Evaluation of 2013 Implementation Plan NYC Health + Hospitals evaluated each hospital's 2013 Implementation Plan and the impact of specific interventions that addressed identified health care needs (Appendix 3). Included in the evaluation is a list of the significant health needs identified in 2013, a description of the planned activities that addressed each of the health needs, an indication whether the planned activity was implemented, the target population and goal of the activity, and the impact or outcome of the activity. 2016 Implementation Strategy The 2016 CHNA Implementation Strategy due in November 2016 will be designed to address the prioritized significant community health needs identified in the 2016 CHNA and must be adopted by the hospital’s governing body. The NYC Health + Hospitals Board of Directors’ approval of the twelve hospitals’ Community Health Needs Assessment at its June 2016 meeting will enable the hospitals in the NYC Health + Hospitals system be in compliance with the mandated deadline of June 30, 2016.

NYC Health + Hospitals’Community Health Needs Assessments
Update 2016
Strategic Planning Committee
Corporate PlanningJune 8, 2016
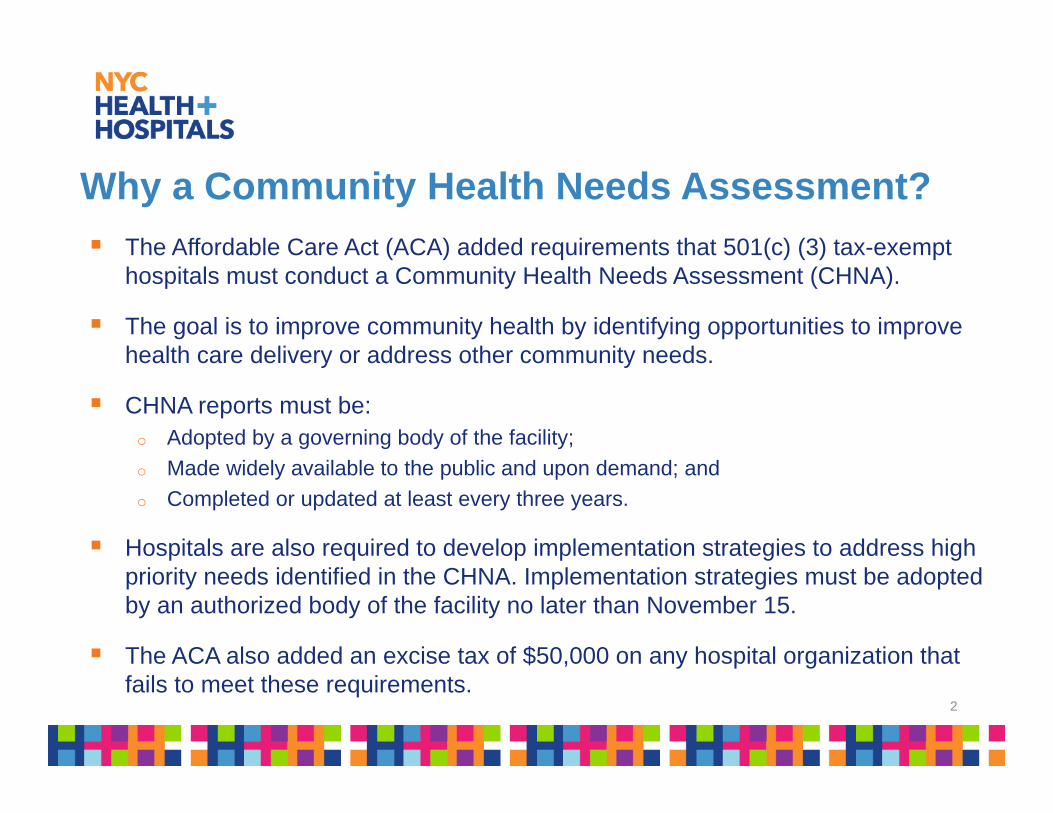
Why a Community Health Needs Assessment?
The Affordable Care Act (ACA) added requirements that 501(c) (3) tax-exempt hospitals must conduct a Community Health Needs Assessment (CHNA).
The goal is to improve community health by identifying opportunities to improve health care delivery or address other community needs.
CHNA reports must be: o Adopted by a governing body of the facility;
o Made widely available to the public and upon demand; and
o Completed or updated at least every three years.
Hospitals are also required to develop implementation strategies to address high priority needs identified in the CHNA. Implementation strategies must be adopted by an authorized body of the facility no later than November 15.
The ACA also added an excise tax of $50,000 on any hospital organization that fails to meet these requirements.
2
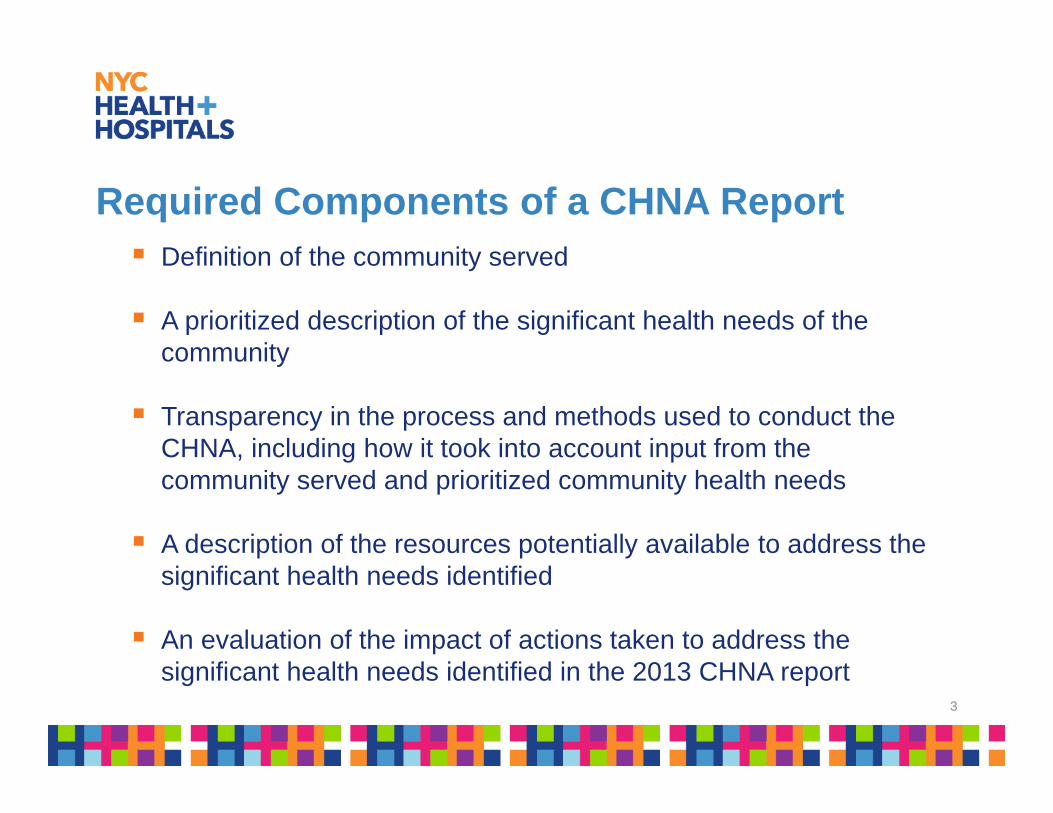
Required Components of a CHNA Report Definition of the community served
A prioritized description of the significant health needs of the community
Transparency in the process and methods used to conduct the CHNA, including how it took into account input from the community served and prioritized community health needs
A description of the resources potentially available to address the significant health needs identified
An evaluation of the impact of actions taken to address the significant health needs identified in the 2013 CHNA report
3
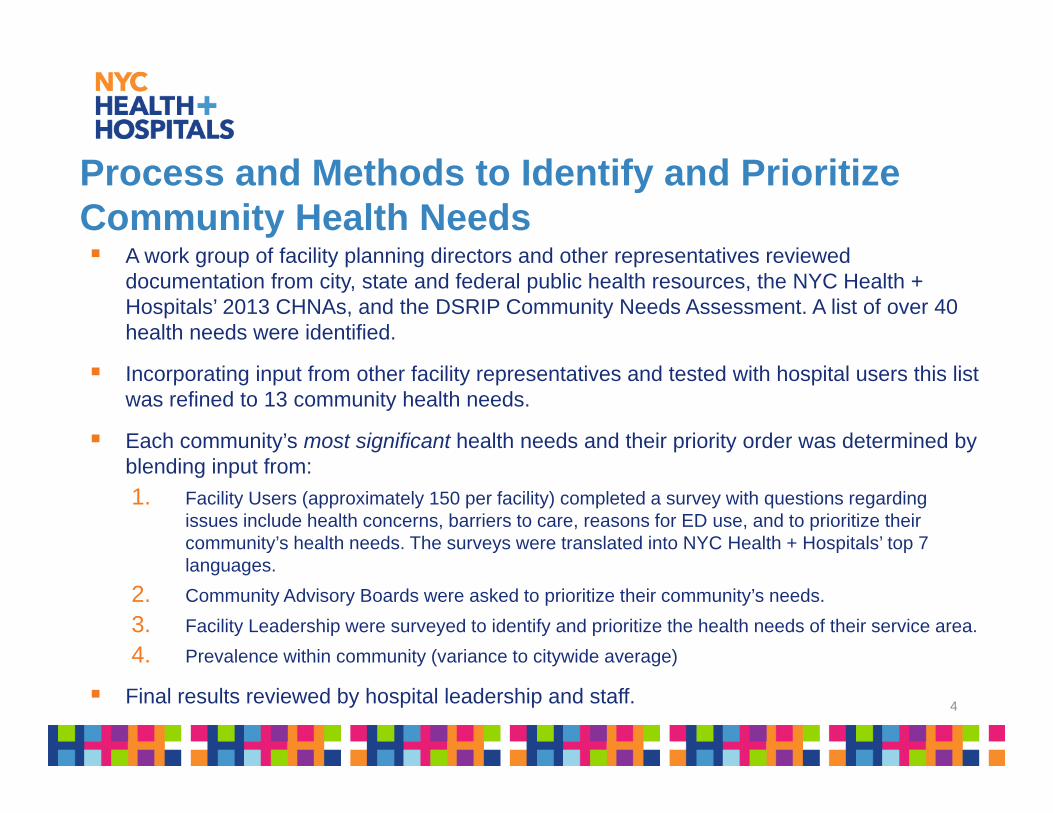
Process and Methods to Identify and Prioritize Community Health Needs A work group of facility planning directors and other representatives reviewed
documentation from city, state and federal public health resources, the NYC Health + Hospitals’ 2013 CHNAs, and the DSRIP Community Needs Assessment. A list of over 40 health needs were identified.
Incorporating input from other facility representatives and tested with hospital users this list was refined to 13 community health needs.
Each community’s most significant health needs and their priority order was determined by blending input from:
1. Facility Users (approximately 150 per facility) completed a survey with questions regarding issues include health concerns, barriers to care, reasons for ED use, and to prioritize their community’s health needs. The surveys were translated into NYC Health + Hospitals’ top 7 languages.
2. Community Advisory Boards were asked to prioritize their community’s needs.
3. Facility Leadership were surveyed to identify and prioritize the health needs of their service area.
4. Prevalence within community (variance to citywide average)
Final results reviewed by hospital leadership and staff. 4
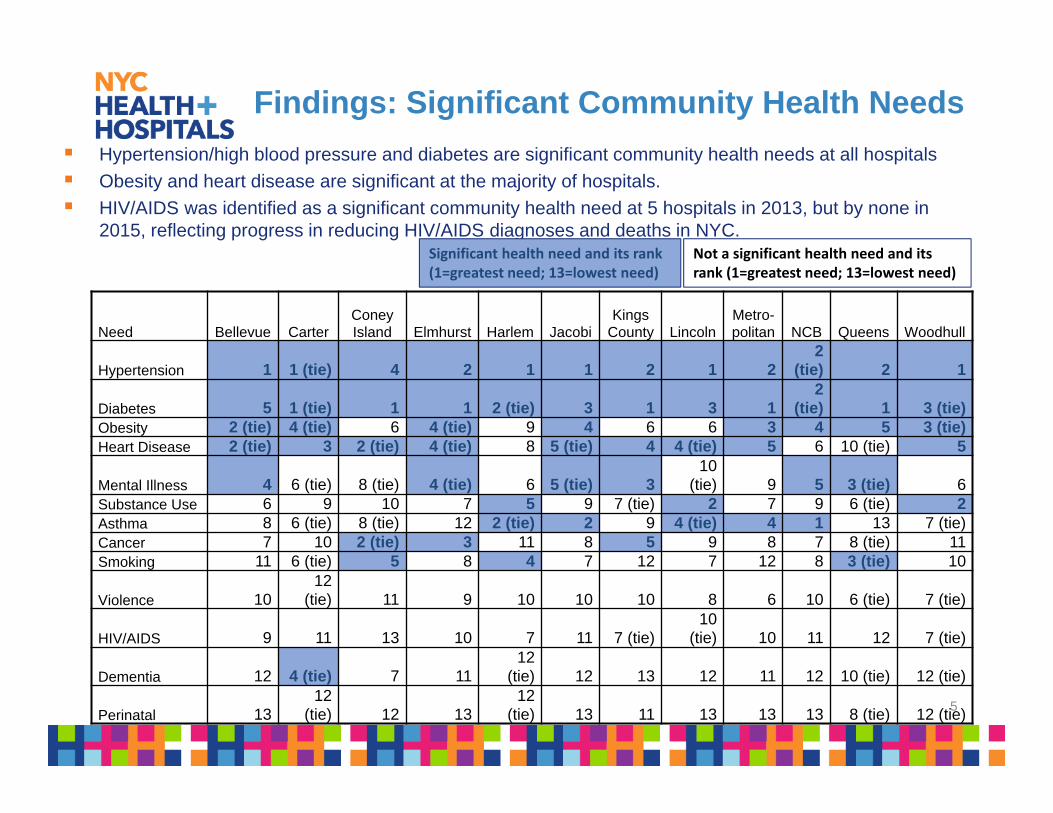
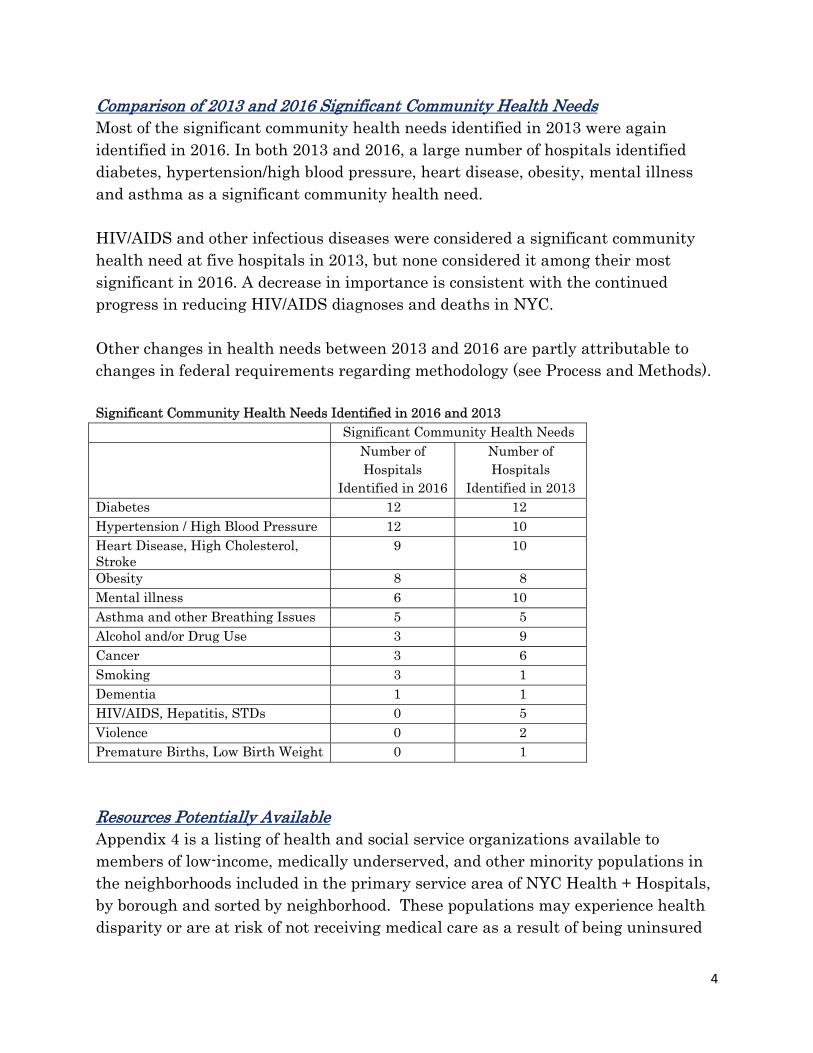
Findings: Significant Community Health Needs
Hypertension/high blood pressure and diabetes are significant community health needs at all hospitals
Obesity and heart disease are significant at the majority of hospitals.
HIV/AIDS was identified as a significant community health need at 5 hospitals in 2013, but by none in 2015, reflecting progress in reducing HIV/AIDS diagnoses and deaths in NYC.
Significant health need and its rank (1=greatest need; 13=lowest need)
Not a significant health need and its rank (1=greatest need; 13=lowest need)
5
Need Bellevue CarterConey Island Elmhurst Harlem Jacobi
Kings County Lincoln
Metro-politan NCB Queens Woodhull
Hypertension 1 1 (tie) 4 2 1 1 2 1 22
(tie) 2 1
Diabetes 5 1 (tie) 1 1 2 (tie) 3 1 3 12
(tie) 1 3 (tie)Obesity 2 (tie) 4 (tie) 6 4 (tie) 9 4 6 6 3 4 5 3 (tie)Heart Disease 2 (tie) 3 2 (tie) 4 (tie) 8 5 (tie) 4 4 (tie) 5 6 10 (tie) 5
Mental Illness 4 6 (tie) 8 (tie) 4 (tie) 6 5 (tie) 310
(tie) 9 5 3 (tie) 6Substance Use 6 9 10 7 5 9 7 (tie) 2 7 9 6 (tie) 2Asthma 8 6 (tie) 8 (tie) 12 2 (tie) 2 9 4 (tie) 4 1 13 7 (tie)Cancer 7 10 2 (tie) 3 11 8 5 9 8 7 8 (tie) 11Smoking 11 6 (tie) 5 8 4 7 12 7 12 8 3 (tie) 10
Violence 1012
(tie) 11 9 10 10 10 8 6 10 6 (tie) 7 (tie)
HIV/AIDS 9 11 13 10 7 11 7 (tie)10
(tie) 10 11 12 7 (tie)
Dementia 12 4 (tie) 7 1112
(tie) 12 13 12 11 12 10 (tie) 12 (tie)
Perinatal 1312
(tie) 12 1312
(tie) 13 11 13 13 13 8 (tie) 12 (tie)
Implementation Strategy (due 11/15/2016)
A description how the hospital plans to address the high priority community needs identified in the community health needs assessment.
The implementation strategy must include:
o The anticipated impact of these actions and a plan to evaluate the impact;
o Identified programs and resources the hospital plans to commit to address each high priority health need; and
o Description of any planned collaborations with hospitals or other organizations.
The implementation strategy must be adopted by a governing body of the facility.
6
System Scorecard
Strategic Planning Committee
Board of Directors
June 8, 2016
Udai Tambar Chief Transformation Officer
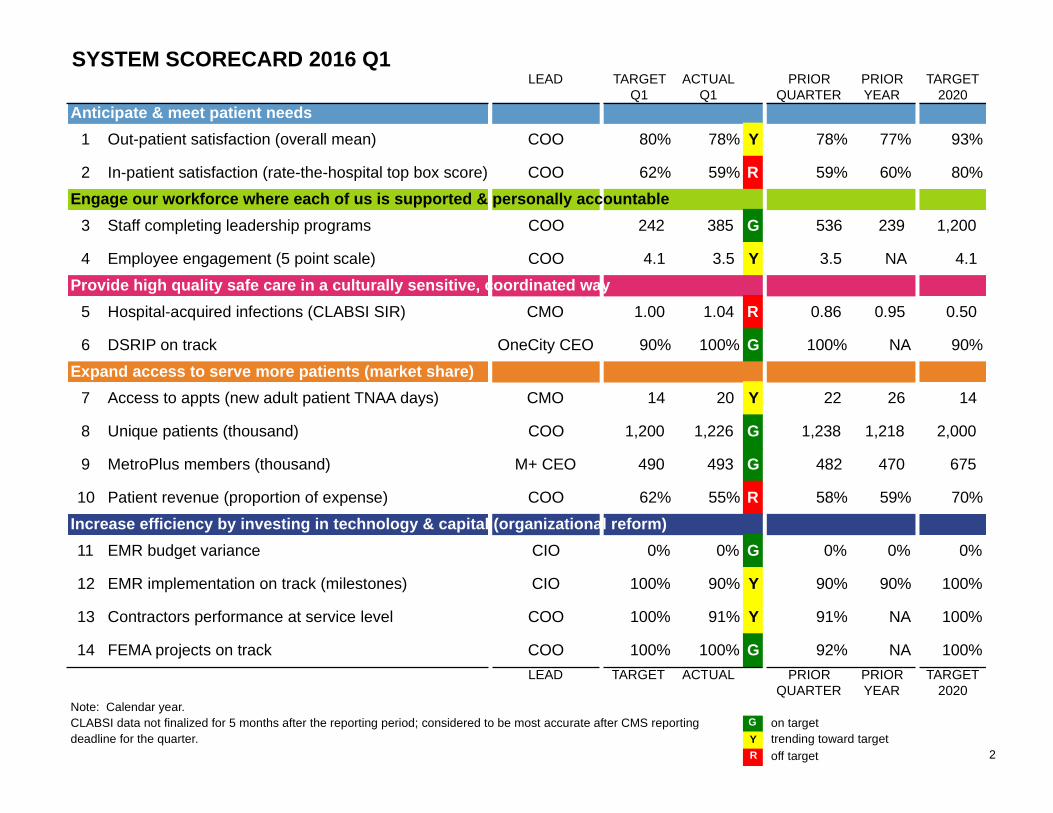
SYSTEM SCORECARD 2016 Q1LEAD TARGET
Q1ACTUAL
Q1PRIOR
QUARTERPRIORYEAR
TARGET2020
Anticipate & meet patient needs
1 Out-patient satisfaction (overall mean) COO 80% 78% Y 78% 77% 93%
2 In-patient satisfaction (rate-the-hospital top box score) COO 62% 59% R 59% 60% 80%
Engage our workforce where each of us is supported & personally accountable
3 Staff completing leadership programs COO 242 385 G 536 239 1,200
4 Employee engagement (5 point scale) COO 4.1 3.5 Y 3.5 NA 4.1
Provide high quality safe care in a culturally sensitive, coordinated way
5 Hospital-acquired infections (CLABSI SIR) CMO 1.00 1.04 R 0.86 0.95 0.50
6 DSRIP on track OneCity CEO 90% 100% G 100% NA 90%
Expand access to serve more patients (market share)
7 Access to appts (new adult patient TNAA days) CMO 14 20 Y 22 26 14
8 Unique patients (thousand) COO 1,200 1,226 G 1,238 1,218 2,000
9 MetroPlus members (thousand) M+ CEO 490 493 G 482 470 675
10 Patient revenue (proportion of expense) COO 62% 55% R 58% 59% 70%
Increase efficiency by investing in technology & capital (organizational reform)
11 EMR budget variance CIO 0% 0% G 0% 0% 0%
12 EMR implementation on track (milestones) CIO 100% 90% Y 90% 90% 100%
13 Contractors performance at service level COO 100% 91% Y 91% NA 100%
14 FEMA projects on track COO 100% 100% G 92% NA 100%
LEAD TARGET ACTUAL PRIORQUARTER
PRIORYEAR
TARGET2020
Note: Calendar year.CLABSI data not finalized for 5 months after the reporting period; considered to be most accurate after CMS reporting G on targetdeadline for the quarter. Y trending toward target
R off target 2
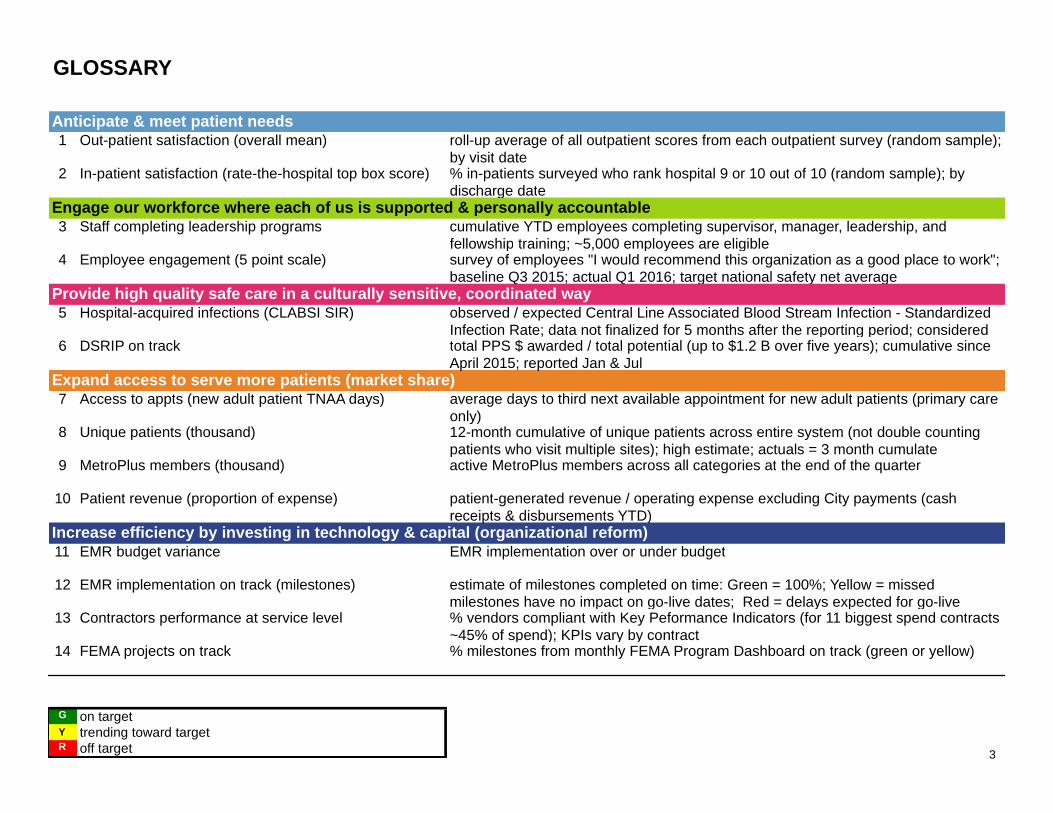
GLOSSARY
Anticipate & meet patient needs1 Out-patient satisfaction (overall mean) roll-up average of all outpatient scores from each outpatient survey (random sample);
by visit date2 In-patient satisfaction (rate-the-hospital top box score) % in-patients surveyed who rank hospital 9 or 10 out of 10 (random sample); by
discharge dateEngage our workforce where each of us is supported & personally accountable3 Staff completing leadership programs cumulative YTD employees completing supervisor, manager, leadership, and
fellowship training; ~5,000 employees are eligible4 Employee engagement (5 point scale) survey of employees "I would recommend this organization as a good place to work";
baseline Q3 2015; actual Q1 2016; target national safety net averageProvide high quality safe care in a culturally sensitive, coordinated way5 Hospital-acquired infections (CLABSI SIR) observed / expected Central Line Associated Blood Stream Infection - Standardized
Infection Rate; data not finalized for 5 months after the reporting period; considered 6 DSRIP on track total PPS $ awarded / total potential (up to $1.2 B over five years); cumulative since
April 2015; reported Jan & JulExpand access to serve more patients (market share)7 Access to appts (new adult patient TNAA days) average days to third next available appointment for new adult patients (primary care
only)8 Unique patients (thousand) 12-month cumulative of unique patients across entire system (not double counting
patients who visit multiple sites); high estimate; actuals = 3 month cumulate9 MetroPlus members (thousand) active MetroPlus members across all categories at the end of the quarter
10 Patient revenue (proportion of expense) patient-generated revenue / operating expense excluding City payments (cashreceipts & disbursements YTD)
Increase efficiency by investing in technology & capital (organizational reform)11 EMR budget variance EMR implementation over or under budget
12 EMR implementation on track (milestones) estimate of milestones completed on time: Green = 100%; Yellow = missedmilestones have no impact on go-live dates; Red = delays expected for go-live
13 Contractors performance at service level % vendors compliant with Key Peformance Indicators (for 11 biggest spend contracts ~45% of spend); KPIs vary by contract
14 FEMA projects on track % milestones from monthly FEMA Program Dashboard on track (green or yellow)
G on targetY trending toward targetR off target 3
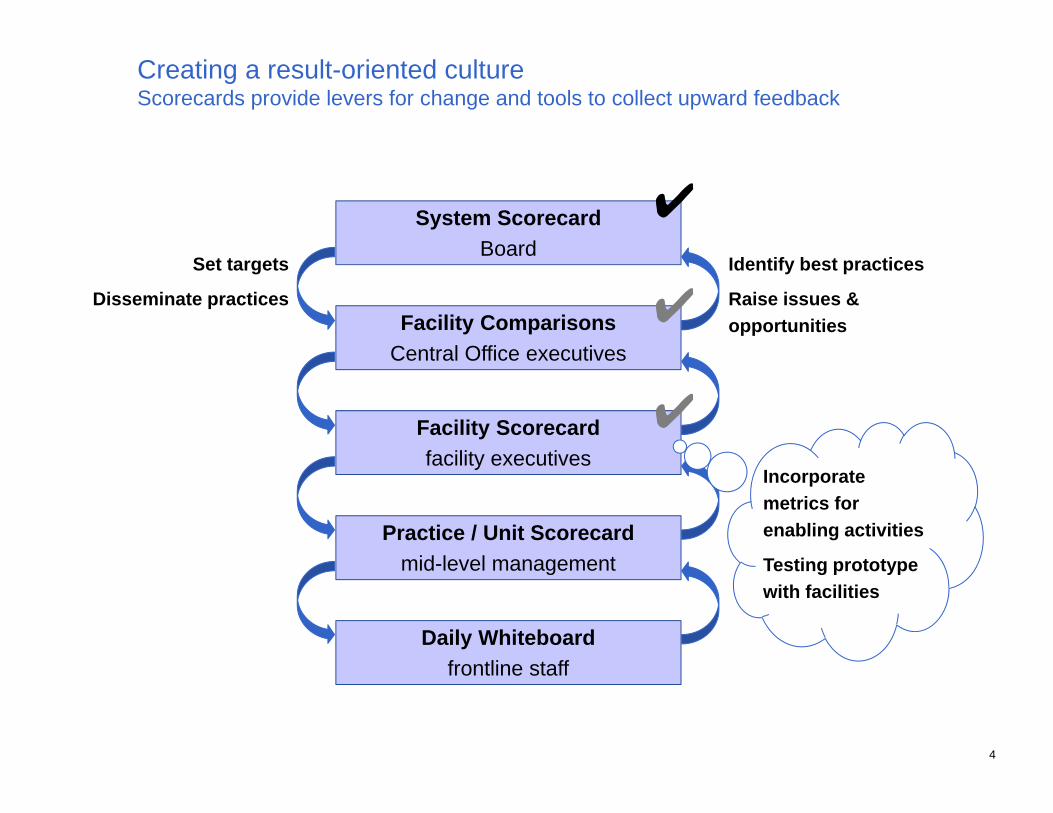
Creating a result-oriented cultureScorecards provide levers for change and tools to collect upward feedback
System Scorecard
Board
Facility Comparisons
Central Office executives
Facility Scorecard
facility executives
Practice / Unit Scorecard
mid-level management
Daily Whiteboard
frontline staff
Set targets
Disseminate practices
Identify best practices
Raise issues &
opportunities
✔
✔
✔Incorporate
metrics for
enabling activities
Testing prototype
with facilities
4
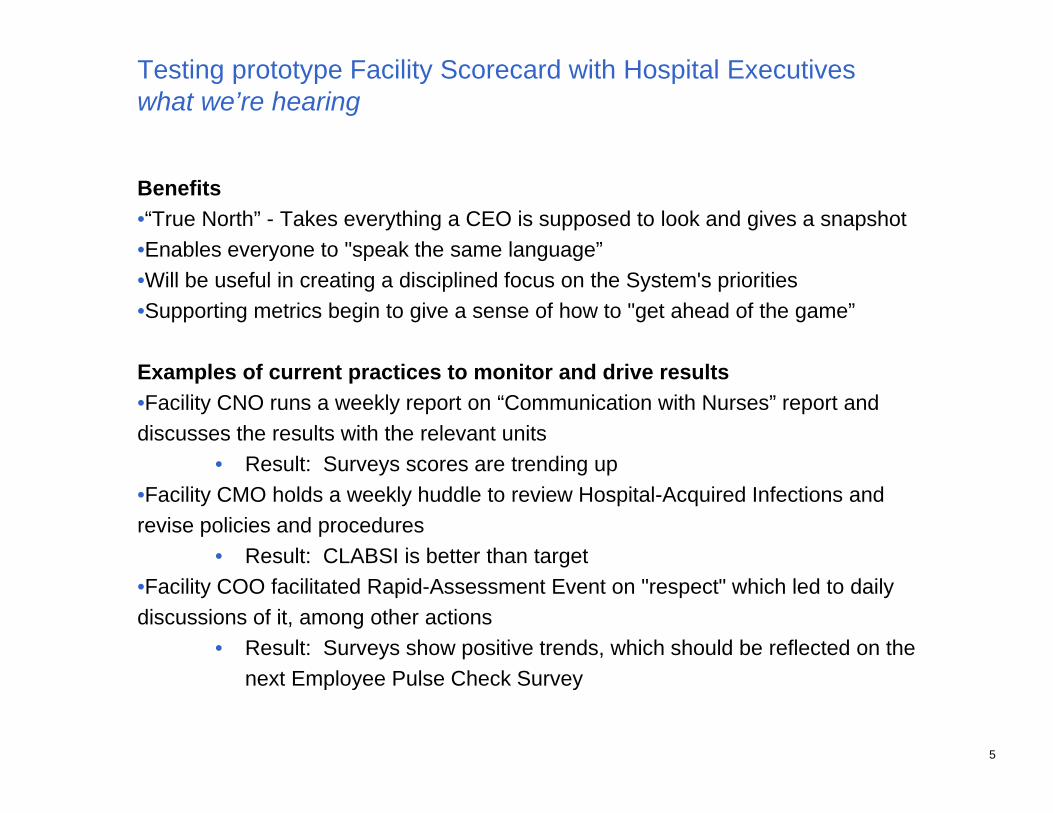
Testing prototype Facility Scorecard with Hospital Executiveswhat we’re hearing
Benefits
•“True North” - Takes everything a CEO is supposed to look and gives a snapshot
•Enables everyone to "speak the same language”
•Will be useful in creating a disciplined focus on the System's priorities
•Supporting metrics begin to give a sense of how to "get ahead of the game”
Examples of current practices to monitor and drive results
•Facility CNO runs a weekly report on “Communication with Nurses” report and
discusses the results with the relevant units
• Result: Surveys scores are trending up
•Facility CMO holds a weekly huddle to review Hospital-Acquired Infections and
revise policies and procedures
• Result: CLABSI is better than target
•Facility COO facilitated Rapid-Assessment Event on "respect" which led to daily
discussions of it, among other actions
• Result: Surveys show positive trends, which should be reflected on the
next Employee Pulse Check Survey
5
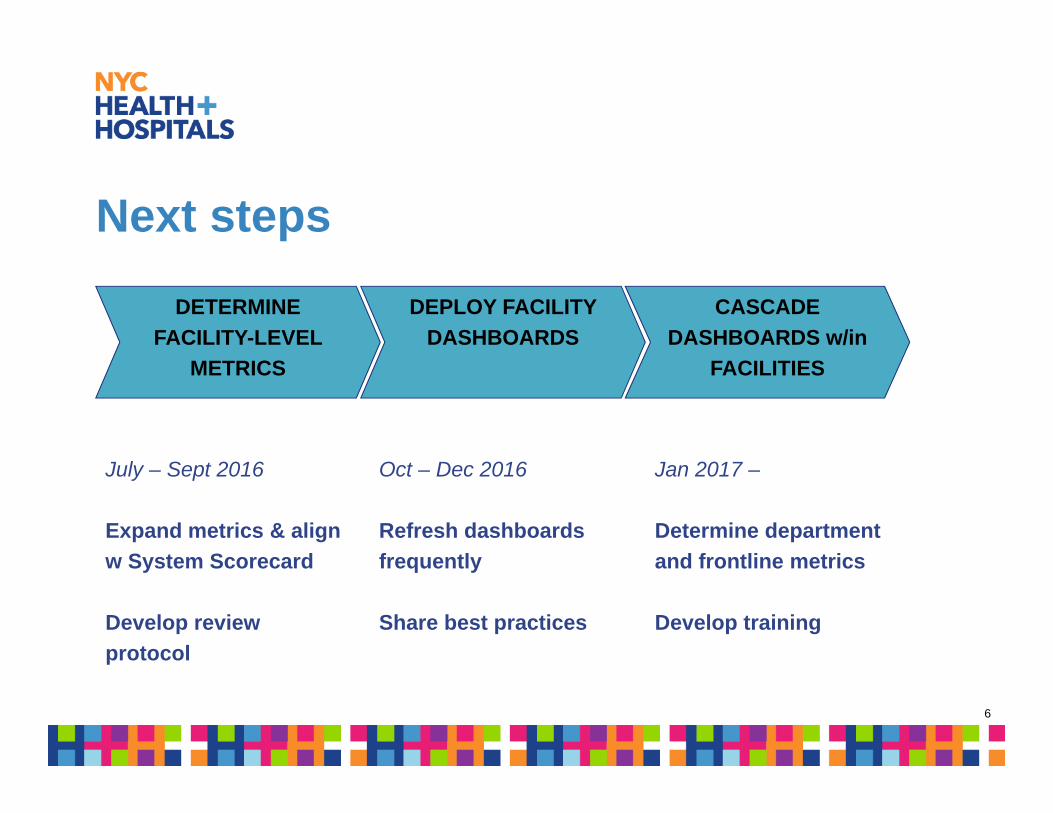
Next steps
DETERMINE
FACILITY-LEVEL
METRICS
CASCADE
DASHBOARDS w/in
FACILITIES
DEPLOY FACILITY
DASHBOARDS
July – Sept 2016
Expand metrics & align
w System Scorecard
Develop review
protocol
Oct – Dec 2016
Refresh dashboards
frequently
Share best practices
Jan 2017 –
Determine department
and frontline metrics
Develop training
6
Patient Experience Review STRATEGIC PLANNING COMMITTEE
JUNE 8, 2016
Raven C. Carter, MBA, FACHEDirector, Patient & Family Experience
Gwen A. Faust, R.N., M.S.Advisor, Press Ganey Associates
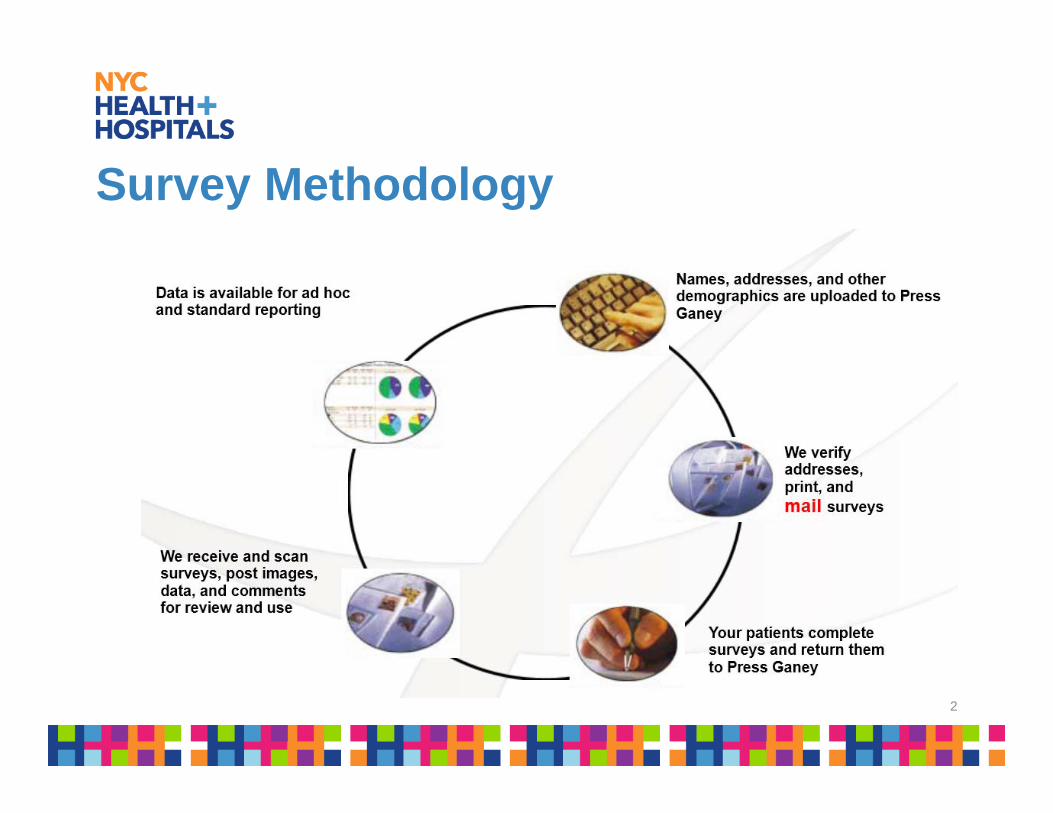
Survey Methodology
2
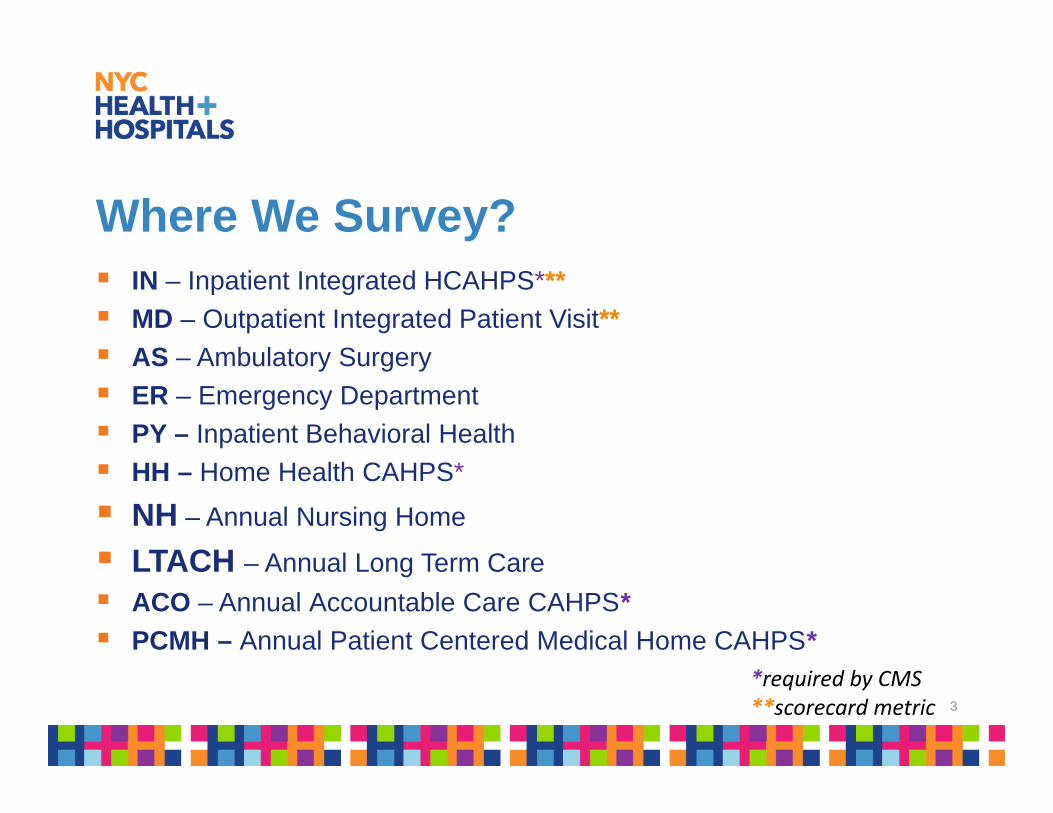
Where We Survey? IN – Inpatient Integrated HCAHPS***
MD – Outpatient Integrated Patient Visit**
AS – Ambulatory Surgery
ER – Emergency Department
PY – Inpatient Behavioral Health
HH – Home Health CAHPS*
NH – Annual Nursing Home
LTACH – Annual Long Term Care
ACO – Annual Accountable Care CAHPS* PCMH – Annual Patient Centered Medical Home CAHPS*
*required by CMS**scorecard metric 3
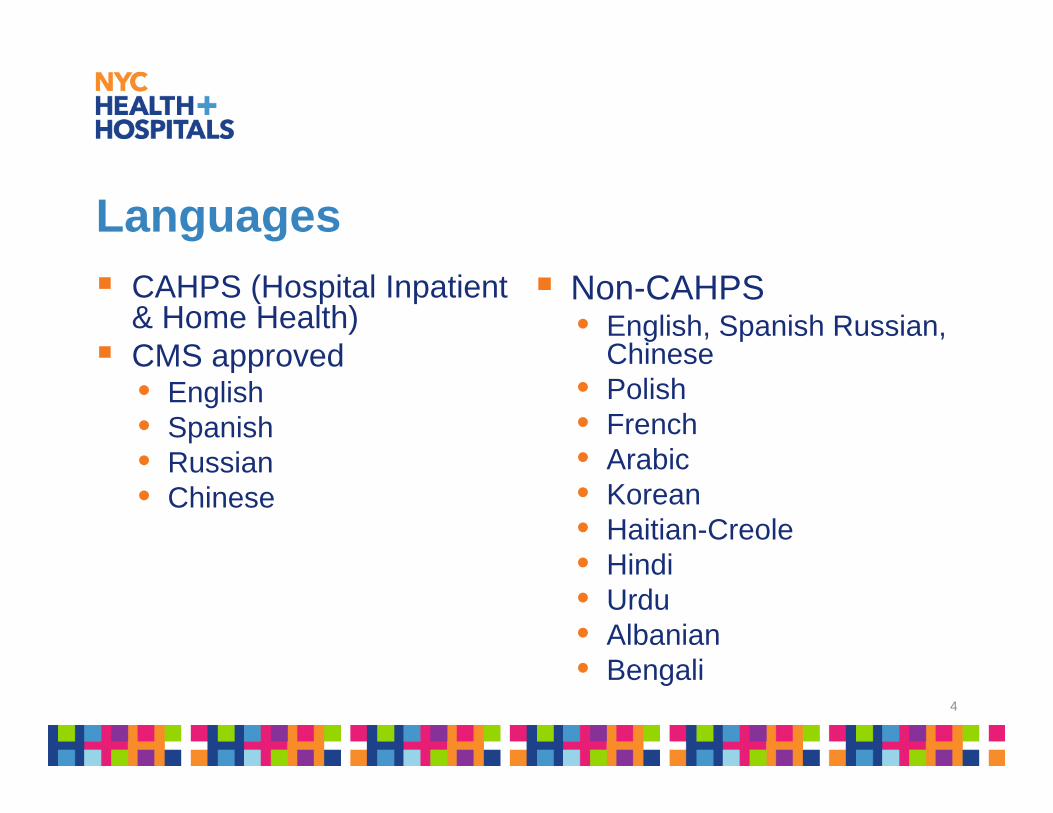
Languages
CAHPS (Hospital Inpatient& Home Health)
CMS approved • English• Spanish• Russian • Chinese
Non-CAHPS• English, Spanish Russian,
Chinese• Polish• French• Arabic• Korean• Haitian-Creole • Hindi • Urdu • Albanian• Bengali
4
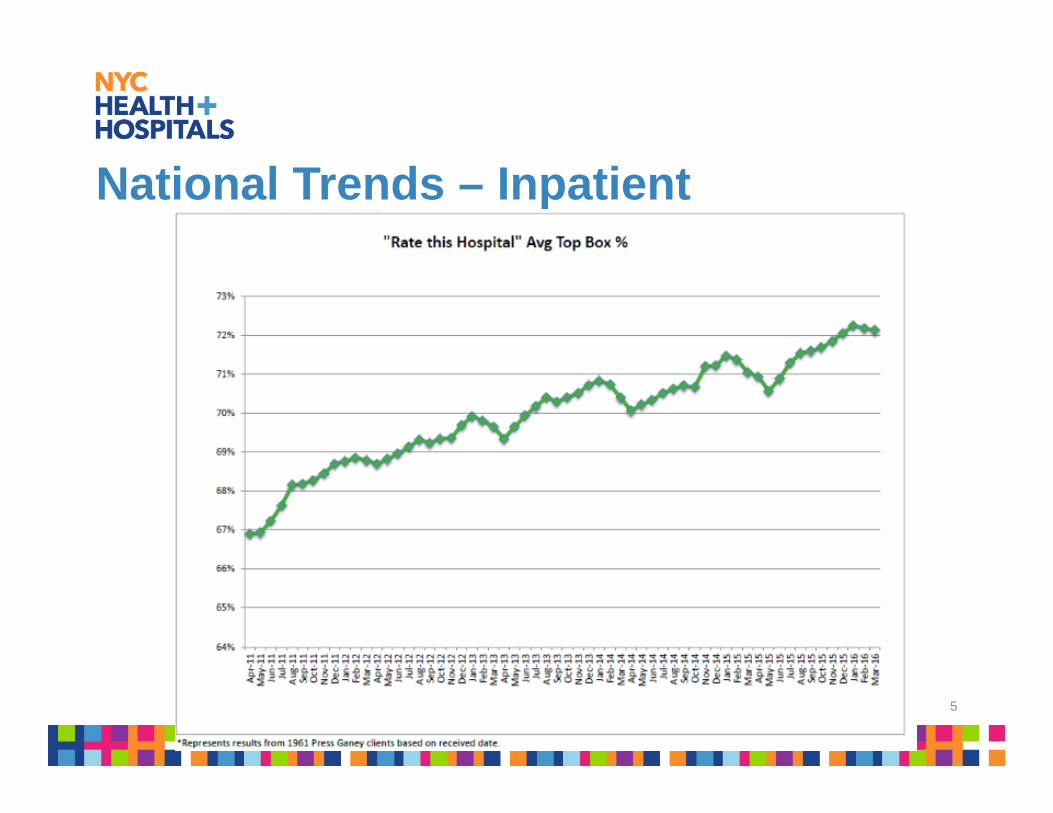
National Trends – Inpatient
5
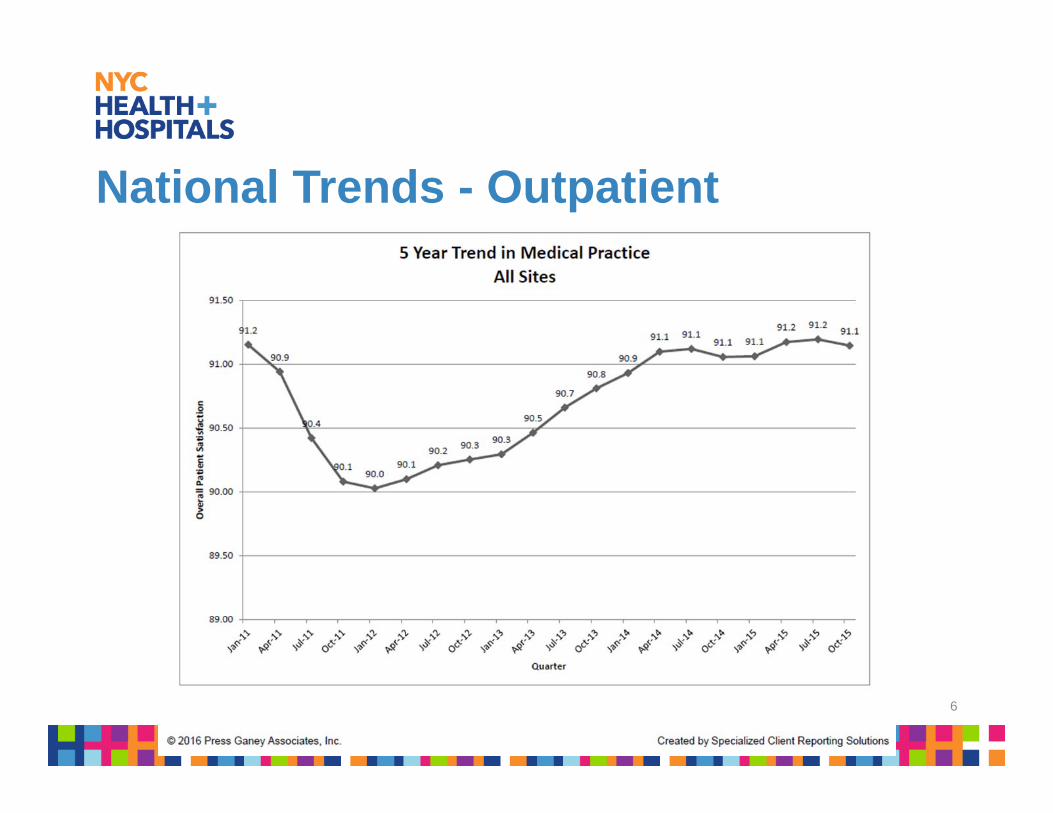
National Trends - Outpatient
6