Embed Size (px)
Citation preview
1
STRATEGIC PLAN
FOR
DEPARTMENT OF HEAVY INDUSTRY
MINISTRY OF HEAVY
INDUSTRIES AND PUBLIC
ENTERPRISES
2
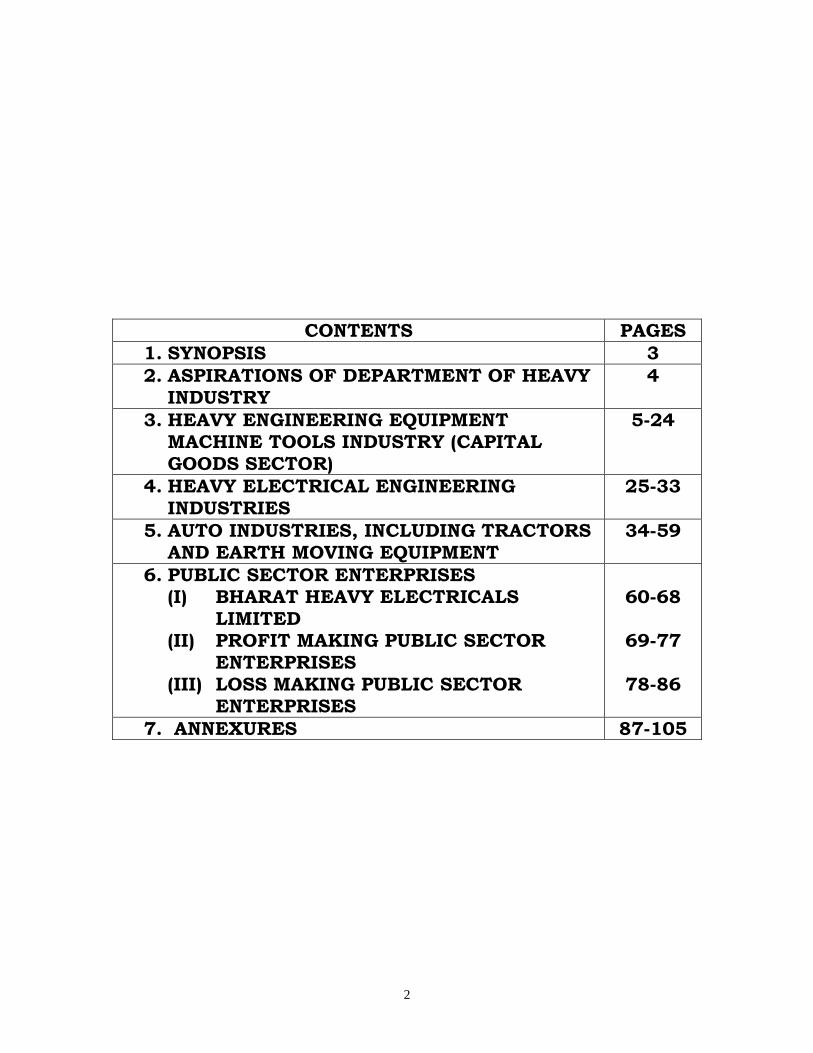
CONTENTS PAGES
1. SYNOPSIS 3
2. ASPIRATIONS OF DEPARTMENT OF HEAVY INDUSTRY
4
3. HEAVY ENGINEERING EQUIPMENT MACHINE TOOLS INDUSTRY (CAPITAL GOODS SECTOR)
5-24
4. HEAVY ELECTRICAL ENGINEERING INDUSTRIES
25-33
5. AUTO INDUSTRIES, INCLUDING TRACTORS AND EARTH MOVING EQUIPMENT
34-59
6. PUBLIC SECTOR ENTERPRISES (I) BHARAT HEAVY ELECTRICALS
LIMITED (II) PROFIT MAKING PUBLIC SECTOR
ENTERPRISES (III) LOSS MAKING PUBLIC SECTOR
ENTERPRISES
60-68
69-77
78-86
7. ANNEXURES 87-105
3
Strategic Plan For Department of Heavy Industry Synopsis 1. In connection with Results Framework Document, Performance Management Division, Cabinet Secretariat advised all Ministries and Departments to formulate Strategic Plan for each Ministry / Department, for a span of five years, vide its letter dated 9.2.2010. Cabinet Secretariat was informed of the Action Plan for developing the Strategic Plan of Department of Heavy Industry vide letter dated 26.2.2010. 2. As far as Department of Heavy Industry is concerned, it looks after the
following Industry Sectors:-
i) Heavy Engineering Equipment and Machine Tools Industry ii) Heavy Electrical Engineering Industries iii) Auto Industries, including Tractors and Earth Moving Equipment
3. In addition, DHI is administratively concerned with 32 PSEs. Taking into account the size, operations and business, all the 32 companies under DHI have been put into three sub groups, viz. Category 1: BHEL being only one of its own genre. Category 2: Profit- making PSEs, and Category 3: Loss- making PSEs. 4. BHEL accounts for 85% of total Turnover and 55% of total manpower of all PSEs under DHI. Accordingly, separate Strategy for healthy growth of three subgroups as mentioned above has been formulated. Wide consultation with different stakeholders for three Sectors and PSEs, administered by DHI, have been carried out for formulating the Strategic Plan for steady growth of each constituent in accordance with the guidelines suggested by Performance Management Division, Cabinet Secretariat. 5. In gist, the Strategic Plan of DHI aims at ensuring steady growth of all the three sectors and sub sectors of the Industry, growth in PSEs in terms of
Turnover and profits of existing profit making companies; achieving the status of Miniratna company for a few CPSEs and turning of existing loss making companies into profit making companies. 6. The document was worked out though wide consultations with the stakeholders, which included Industry Associations, industry specific Development Councils Managements of PSEs under DHI. The suggestions in Annex-V given by Shri Pawan Chopra, Member, Ad- hoc Task Force regarding our document were again deliberated in the meeting of all the senior officers of DHI held on 2.2.2011, and suitably taken note of in the final document.
4
ASPIRATIONS OF DEPARTMENT OF HEAVY INDUSTRY The Department of Heavy Industry strives:
i) To have a modern, healthy and robust domestic heavy engineering industry viz. Machine Tool Industry, Heavy Electrical Industry, Industrial machinery, Auto Industry and all sub sectors of Capital Goods Industry.
ii) To position India prominently on the global automotive map
and to drive India into the future of global automotive excellence; and
iii) To enable all its CPSEs to become self-reliant and register steady growth in turnover and profits.
5
In respect of Machine Tools Industry I VISION/ ASPIRATION: Develop machine tool industry and raise production to reduce import dependence, counter technology denials, provide sustained manufacturing competitiveness and strengthen national security. II. MISSION:
(i) Secure a domestic market share of 50% in five years and 67% by 2020; 9 The present level market share being 30% only)
(ii) Become one among the top 10 machine too producing nations of the world. ( The present machine tool production ranking is 19)
(iii) Raise export to a significant level of at least 205 ( Present export is insignificant)
III. The political, economic, socio-cultural, technological, environmental
and legal factors impacting the Machine Tool Sector and CPSEs being looked after by DHI.
The Planning Commission has projected GDP growth rate at 8% to 9% during the 11th Plan. The capital goods industry, including machine tools contributes 12% to the total manufacturing activity and provides critical input, i.e. machinery and equipment to the remaining sectors covered under the manufacturing activity. As such, the growth of capital goods industry has an important bearing on the growth of the user industries. Manufacturing sector is contributing about 16% to the GDP and has been stagnating at this level for the last few years.
The machine tool industry is a strategic industry determines the manufacturing competitiveness in important sectors such as automobiles, heavy electrical equipments, defence, aerospace and consumer goods and other sectors. Machine tools play a vital role in countering technology denial in strategic sectors such as defence production, nuclear, etc. A strong machine tool industry is essential to achieve sustained growth and competitiveness in
manufacturing sector. The Machine Tools industry has the capability to manufacture all types of machine tools required for general purpose. However advanced CNC machine tools, multi-spindle, multi-axis (more than 3 axes) and other specialized machine tools are not made in the country. Details of production, export and import of Machine Tools Industry in the last four years is in Table 1 in annex-I Current import duty on machine tools is 7.5%. This is much lower than bound duties prescribed under WTO guidelines, as existing installed capacity in the country is not adequate to meet the demand.
6
IV. Identification of key stakeholders, their strengths, capabilities, influence and methodology of working with them.
The following are the key stakeholders:
i) Major manufacturers of machine tools:
M/s. Ace Designers Ltd., Bangalore M/s. Ace Manufacturing Systems Ltd., Bangalore
M/s. Bharat Fritz Werner Ltd., Bangalore M/s. Electronica Machine Tools Ltd., Hyderabad M/s. HMT Machine Tools Ltd., Bangalore M/s. ISGEC, Yamuna Nagar M/s. Jyoti CNC Automation Pvt. Ltd., Rajkot M/s. Kennametal India Ltd., Pune M/s. Lakshmi Machine Works Ltd., Coimbatore M/s. Lokesh Machines Ltd., Hyderabad M/s. TAL Manufacturing Solutions Ltd., Pune M/s. Askar Micron M/s. Champkraft Machine Tools M/s. Batliboi Ltd. M/s. Electropneumatics & Hydraulics (India) Ltd. M/s. Galaxy Machine M/s. Gedee Weiler Pvt. Ltd. M/s. Hind Hydraulics & Engineers Ltd M/s. Hindustan Hydraulics Pvt. Ltd. M/s. Macpower Machine Tools M/s. Marshal Machine Tools M/s. Micromatic Grinding Technologies Ltd. M/s. Motor Industries Company Ltd. M/s. Parishudh Machines Pvt. Ltd. M/s. PMT Machine Tool Automatics Ltd. M/s. Singhal Power Presses M/s. Premier Ltd.
ii. Strengths-
(a) Represent about 25 mid-size large units, 250 units manufacture
complete machine tools and 200 units make accessories / components of machine tools out of 450 manufacturers of machine tools.
(b) Has good coordination with Govt. Departments.
iii. Weaknesses-
1. Following areas have technology gaps in machine tools industry:
A) Metal cutting machine tools:
Multi-axes, Multi-tasking machines High precision machines
7
Large machines (boring-milling, turning) Gear cutting and finishing machines Grinding technology and machines Electrical and micro-machining
B) Metal forming machines:
Higher press automation and transfer systems, Servo presses, Sheet working machines (including laser, waterjet) Hydroforming Fine blanking Forging machines Flow forming
C) Special technologies:
Explosive forming, Electro‐magnetic forming etc.
Cutting tool technologies Robotics and automation Alternative materials (epoxy granite etc.) Thermally stable welded structures Hydrostatic spindles, guideways Motorised and high frequency spindles Smart machines with embedded sensors
D) Critical components development:
Anti-friction linear guideways Ball screws Precision spindle and ball screw support bearings CNC controls Spindle and axes servo motors with drive controllers Feedback measurement systems
2. Most of the players do not qualify the tender terms of Railways, DGOF, BHEL, and other PSUs for the supply of machine tools due to condition of prior supplies.
3. They do not get finance from financial institutions.
4. They do not have financial support from Government like corpus fund
for modernization, capacity expansion and for green field projects.
5. Industry lacks R&D institutions except CMTI and also do not have research activity at the manufacturer’s premises.
8
6. Denial of CNC systems / machine tools for machining complicated profiled components as dual use equipment from manufacturers from Germany & Japan as per the guidelines of IAEA.
7. There is no machine tools infrastructures cluster parks and common facility centres to accelerate the development of machine tools industry.
8. Shortage of skilled manpower.
9. Order booking position is shrinking due to import of cheap second hand machine tools.
10. Absence of large domestic investment from bigger business houses in India.
11. Absence of FDI in machine tools industry .
12. Underperformance of PSUs like HMT Machine Tools Ltd., etc.
iv. Methodology of interaction-
i) As per the Allocation of Business Rules, a Development Council for
Machine Tools Industry (DCMTI) is constituted in the DHI. Council has representatives of manufactures of machine tools, users of machine tools, concerned Govt. Departments and industry associations, etc. The council meets regularly, identifies the problems faced by the industry and tries to find the solution to those problems.
ii) Regular meetings are held with Indian Machine Tools Manufacturers Association (IMTMA) to ascertain the developments taking place in the industry.
V. Assessment of Department’s Strengths and Weaknesses
Strengths –
(i) The meetings of Development Council of machine tools industry take place regularly in DHI
(ii) The Department has a Technical Wing to provide technical inputs in decision making of the Department. Sanctioned strength of the technical wing is two in numbers of Industrial Advisers, two nos. of Additional Industrial Advisers, three nos. of Sr. Development Officers, three nos. of Development Officers and one no. of Assistant Development Officer.
(iii) Technical Officers are capable to render advice on all technical matters which DHI requires on Automobiles, Heavy Electrical Equipments, Heavy Engineering and Machine Tools sectors.
Weaknesses-
9
i) The Department does not have any Scheme for the growth of the
machine tools industry. Though, the scheme for ‘Enhancement of Competitiveness in the Capital Goods Sector’ is under active consideration in DHI.
VI. Development of ‘Learning Grid’ arising out of the assessment of strengths and weaknesses of Machine Tools Sector taking into account the need and criticality.
a. Manufacturing of critical components- Critical components as
detailed below required for machine tools are not manufactured indigenously. There is a need to establish manufacturing facility of these items and import should be allowed under ‘NIL’ duty till self sufficiency in production is achieved.
i. Anti‐friction linear guideways
ii. Ball screws iii. Precision spindle and ball screw support bearings iv. CNC controls v. Spindle/axes servo motors with controllers vi. Feedback measurement systems
b. Lack of standardization – Due to lack of standardization of the
equipment requirement in the domestic market, it is not possible for the domestic manufacturers to build inventories of input materials, components as well as finished products which can be sold off the shelf with minimum delivery schedule.
c. Availability of testing facility – Facilities of testing of machine tools and components/ parts are not adequate presently. PSUs like HMT, which have large infrastructure, would create additional testing facility.
d. While other Departments like M/o Textiles, M/o MSME, DIPP etc. has targeted Schemes for development of the sectors looked after by them, DHI does not have any such Scheme for industry. Though the manufacturing activity of machine tools industry is opened up to 100% FDI but not much FDI has been attracted.
e. The Department has no production data base in respect of the sub sectors of capital goods sector as well as other machine tools, textile machinery, mining machinery, rubber machinery, cement machinery, oilfield equipment, etc. for which the Department has mandate. Lack of such data hampers DHI to conceive appropriate schemes & framing policy decisions.
f. Absence of latest well meaning research reports on capital goods sector as well as individual industrial machinery is very much felt. In the past, CII and IL&FS prepared the reports on capital goods sector on the insistence of DHI which were quite useful.
10
VII. DEVELOPMENT OF STRATEGY
Identify the range of possible strategies and the optimal path.
The following could be possible strategies: i) Provide total protection to the domestic industry by regulating the
import. ii) To restrict import of second hand machinery. iii) To enhance custom duty to the level of bound tariff as per WTO
guidelines. iv) Government to provide support to the industry from time to time
for a minimum period of 5 years and considered longer period for R&D.
v) Instead of allowing 100% FDI, JV route would be thought of. vi) R&D support may be given by the Government vii) Assistance in acquisition of strategic foreign companies for
technology transfer. Develop a detailed plan to engage key stakeholders.
i) To have regular meetings of Development Council. ii) To interact with IMTMA frequently. iii) To support the efforts of IMTMA and other Associations in their efforts
in the development of the industry. iv) To organize work-shops/seminars/conferences on the issues related
to the industry.
Develop a Learning Plan based on Gap Analysis and identify Knowledge Partners.
i) To recommend to Department of Commerce for restriction on import
of second hand machine tools. ii) To recommend to Ministry of Finance for imposition of custom duty to
the level of bound tariff as per WTO guidelines. iii) To recommend to Ministry of Finance for reduction of excise duty to
the minimum. . iv) To take steps for development of critical component required by the
industry. v) To recommend to Ministry of Finance for lowering the local taxes and
exemption of custom duty on critical components of machine tools. v) To hire the suitable agency for continuous flow of production
statistics of the machineries and equipments looked after by DHI vi) To hire the consultant for preparation of up-to date report on various
machinery industries covered under capital goods sector. vii) To prepare a Scheme for enhancement of the global competitiveness
of the industry. viii) To take up the issue of technology denial in Bilateral Joint Working
Groups
11
ix) A forum to be made for identification of technology gaps, source of technology and facilitating its transfer
Knowledge Partners
i) Confederation of Indian Industries (CII) ii) IL&FS
VIII. Priorities strategies/initiatives/actions taking into considerations suitability, feasibility and acceptability with a view to achieving aspirations.
Short term counter measures to support the industry
a. Policy measures- DHI may take up the following issues with concerned organizations:
(i) For modification of tender terms of Railways, DGOF, BHEL, other
PSUs to the extent to include payment by LC /progressive payment and Exchange rate variation to machine tool companies and also relax conditions of “previous supply”.
(ii) To exclude machine tools in FTAs; (iii) To impose technology transfer condition on imports: (iv) To introduce an Offset trade condition on foreign suppliers of
machine tools above Rs.10 crore value. (v) To support for acquisition of strategic companies abroad. (vi) To take up the issue of technology denial in the Bilateral Cooperation
Agreements
b. Fiscal measures to reduce the cost of machine tools: DHI may take up the following issues with concerned organizations:
(i) To reduce customs duty to zero percent on all critical
elements/components of machine tools (ii) To reduce excise duty on machine tools from the present 10% to 8%
or even less,
(iii) Machine tools ancillaries/ vendors may be given loans on easy interest rates
(iv) To exempt or reimburse excise duty to machine tools ancillaries/ vendors
(v) To allow higher rate of depreciation (vi) To treat machine tools as “priority sector” for financing; (vii) Foreign manufacturers offer deferred LC payments of 1-2 years
placing Indian machine tool companies at a major disadvantage. (viii) Foreign companies can raise working capital loans at 2-4 % interest
on LCs, Indian companies do not get such LCs from buyers, and raising finance even at 14-16% is difficult.
(ix) Interest rates to be lowered down (compared with foreign manufacturers):
i. Interest rate in India: 14-16%
12
ii. Interest rate abroad: 2-4% (x) To forward above recommendations to Ministry of finance on duties
and taxes at least two months before presentation of the budget.
c. Long term support measures (a) DHI may take the following action plan for technology development
(i) A Capital Goods Technology Mission (CGTM) may be formed. (ii) A Capital Goods Skill Development Council (CGSDC) may also be
formed for skill upgradation as per the need of Capital Goods sector. (iii) Detailed R&D projects, considering not only the development phase
but also the marketing phase to take the commercial development, may be drawn up as per the following: o Develop PC based systems with motion control cards and the
software to realize the CNC capabilities. Servo drives and motors have to be sourced from independent manufacturers of which there are many internationally.
o Development of high technology multi-axes machine tools may be pursued under the R&D/Technology Development program.
o Critical mechanical elements like ball screws, anti-friction linear guideways, high precision spindle and ball screw support bearings and measuring systems to be developed through R&D.
(iv) Government, machine tool industry and R&D/Technology sources may form PPP companies to address special areas like critical components for machine tools and CNC/machine tool electronics. These companies will develop and commercialize the technologies;
(v) Strengthen CMTI and establish R&D institutes in other regions; (vi) A report to be prepared for enhancement of competitiveness of capital
goods sector including machine tools sector, which will be used for preparation of scheme for XII 5 Year Plan period.
(vii) Imports of machinery with phased indeginisation of manucaturing of machinery will be encouraged with a view to encourage domestic research facilities
(viii) Joint collaboration with foreign labs and companies for setting up
research facilities in India will be encouraged
IX. PLAN IMPLEMENTATION
Develop a detailed implementations plan and identify points for coordination and milestones and review points.
i) Short term support measures could be completed by March,
2011 ii) Initial initiatives on long term support measures could be
completed by March, 2012
13
iii) Scheme for enhancement of competitiveness in the capital goods sector including machine tools to be prepared by the Department by 30th October, 2011
iv) Reconstitution of Development Council for Machine Tools Industry - 30th July, 2011
v) 1st meeting of the reconstituted Development Council for Machine Tools Industry- August,2011
Assess the nature and quantum of resources required to implement
the plan.
The Scheme will be proposed for the total Government Support of about Rs. 1000 crore for the various sub-sectors of capital goods industry.
Delineate a plan to observe and measure progress through regular
review. Also identify possibilities for corrective actions if and when required.
i) Regular meetings of industry associations, CII, FICCI etc. ii) Regular meetings of Development Council for Machine Tools
Industry iii) Regular follow up of the minutes of the meeting of Development
Council for Machine Tools Industry
14
In respect of Textile Machinery Industry
I. A I. ASPIRATION
To develop textile machinery industry and raise production to reduce import dependence, provide sustained manufacturing competitiveness and strengthen national textile industry.
II. ASSESSMENT OF SITUATION
B.1. The political, economic, socio-cultural, technological, environmental and legal factors impacting the sectors and CPSEs looked after by DHI would be analyzed and assessed.
As per estimates of the Planning Commission, GDP growth rates of 8%-9% have been projected during the 11th Plan. The capital goods industry, in which textile machinery is a part of the capital goods contributes 12% to the total manufacturing activity and provides machinery and equipment to the Indian textile industry. As such, the growth of capital goods industry has an important bearing on the growth of the textile industry. Manufacturing sector is contributing app. 16% to the GDP and has been stagnating at this level for last few years. Textile Machinery industry is an important part of the capital goods industry. It supplied over 70% of the requirements of the textile industry from the 1960s to the 1990s and it has an annual estimated capacity of Rs. 8048 crore of complete machinery and other equipment, right from opening up of the fibres to the production of finished fabrics. Details of production, export and import of textile machinery industry in the last three years is in Table 2 in annex-I
Current import duty on Textile Machinery is in the range of 7.5%. This
is much lower than bound duties prescribed under WTO guidelines, as existing installed capacity in the country is not adequate to meet the demand and numbers of textile machineries, both new as well as second hand, are being imported.
88
B.2. Identification of key stakeholders, their strengths, capabilities and influence and methodology of working with them. There are about 1446 manufacturing units out of which 598 units manufacturing complete machinery and 848 units making parts and accessories, the total investment being Rs. 6900 crores. It provides direct/indirect employment to over 250,000 people.
15
1. Status of the Different Categories of Textile Machinery The production of the different categories of Textile Machinery for the last few years is as in Table 3 in annex-I
The production of textile machinery has been steadily increasing over the last few years. However, the acute demand recession during 2008-2009 & 2009-2010, has adversely affected the growth of the industry. There are large number of SMEs (above 80%) manufacturing complete machinery as well as all types of components/parts and accessories, testing and monitoring equipments and auxiliaries.
2. Spinning Machinery
Key Stakeholders: The name of the major manufacturers, production capacity and range of products manufactured are indicated in Table 1 in annex-II There are other small manufacturers located in Ahmedabad, Coimbatore as well as in Panipat, Ludhiana and Amritsar producing spinning machines for woollen industry. Strength: The entire range of spinning machinery is manufactured including blow room machinery, cards, draw frame, combers, speed frame, ring frame, ancillary machinery, open-end spinning, two for one twisting and auto-cone winding machines and parts and accessories. About 60% of the domestic demand is met by the domestic manufacturers. The total capacity in spinning machinery is Rs. 4,561 crores. Weakness: Balance requirement of 40%is met through import of second hand machines. The requirements of hi-tech machinery viz. auto coner and rotor spinning machine with complete automation is met through imports. 3. Weaving Machinery (a) Key Stakeholders of preparatory weaving machinery as in Table 2 in annex-II. b) Key Stakeholders of major weaving machinery manufacturers as in Table 3 in
annex-II Strength: The total capacity of weaving preparatory and weaving machinery is Rs.702.87 crores. In the case of weaving preparatory more than 70% of demand is fulfilled by the domestic industry. Some ranges of Weaving Machineries such as high speed sectional warping, direct warping and sizing machines are made in the country. The machines produced in the pre-weaving segments such as winding, twisting, rewinding, warping and sizing are exported. The industry has developed shuttleless rapier looms - with crank beat-up and cam beat-up technology – running at 200 to 400 rpm, with weft insertion rates ranging from 450 to 800 mpm, airjet loom running at 800 rpm, and waterjet looms running at 800 rpm. About 30% of requirement of weaving machinery, in terms of volume, is met by the domestic manufacturers.
16
Weakness: There is large gap between the demand and supply of weaving machinery. However, the demand for low technology machines is totally fulfilled by the local machinery industry. The shuttleless loom category has witnessed large scale import of second hand machinery. The local industry is facing tough challenge from imported and cheaper second hand looms. It is reported that to the extent of 60000 to 70000 power looms of old technology are installed per annum. Import Content: The import content for shuttleless looms:
(i) Low cost low speed Rapier looms—20% to 30%
(ii) High speed Rapier looms—30% to 40%
(iii) Water Jet loom - 30% to 40%
(iv) Air Jet loom - 35% to 45%
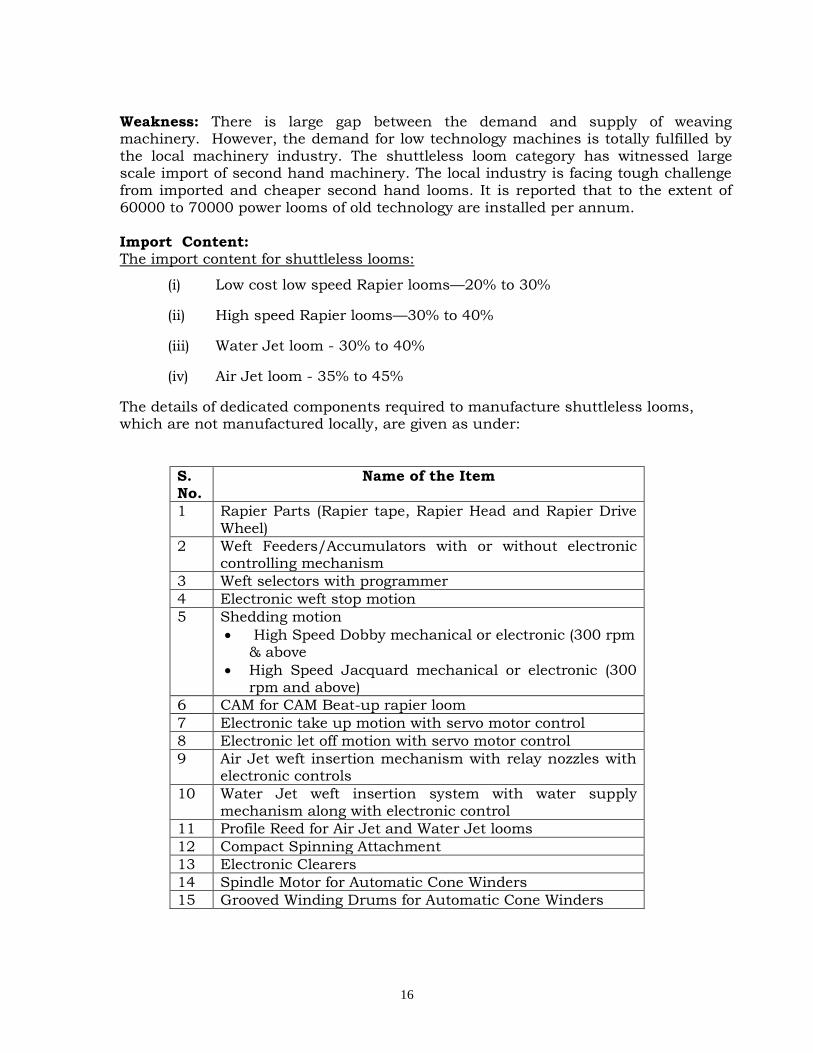
The details of dedicated components required to manufacture shuttleless looms, which are not manufactured locally, are given as under:
S. No.
Name of the Item
1 Rapier Parts (Rapier tape, Rapier Head and Rapier Drive Wheel)
2 Weft Feeders/Accumulators with or without electronic controlling mechanism
3 Weft selectors with programmer
4 Electronic weft stop motion
5 Shedding motion
High Speed Dobby mechanical or electronic (300 rpm & above
High Speed Jacquard mechanical or electronic (300 rpm and above)
6 CAM for CAM Beat-up rapier loom
7 Electronic take up motion with servo motor control
8 Electronic let off motion with servo motor control
9 Air Jet weft insertion mechanism with relay nozzles with electronic controls
10 Water Jet weft insertion system with water supply mechanism along with electronic control
11 Profile Reed for Air Jet and Water Jet looms
12 Compact Spinning Attachment
13 Electronic Clearers
14 Spindle Motor for Automatic Cone Winders
15 Grooved Winding Drums for Automatic Cone Winders
17
The industry has requested to exempt the customs duty on import of above critical components from the present level of 7.5%. 4. Processing Machinery Key stakeholders of processing machinery as in Table 4 in annex-II Strength: There are over 50 units manufacturing Processing and Finishing machinery with a total capacity of Rs.886.18 crores. The domestic production is Rs. 500-600 crore Processing machinery with continuous scouring, bleaching, mercerising, washing, dyeing plants, preshrinking ranges are being produced by domestic manufacturers. Weakness: However wider width processing machines and special purpose finishing machines are imported.
5. Testing & Monitoring Equipments/Instruments Key Stakeholders of Testing Monitory Equipment/Instrument is as in Table
5 in annex-II. Strength: The Indian textile engineering industry started developing testing and monitoring equipment in the 60s and today a wide range of high quality latest generation testing and monitoring equipment/instruments is being manufactured in the country. Almost 80% of the requirement is met by the domestic manufacturers. Weakness: About 20% of the requirement is met through imports.
6. Synthetic Yarn Machinery
Key Stakeholders of Synthetic Machinery is as in Table 6 in annex-II. Strength: There are about 50 nos. of SMEs manufacturing synthetic machinery. These are mainly located in Surat, Ahmedabad, Vadodara and Rajkot. The total
capacity of synthetic machinery is Rs. 885.36 crores. The 90% of demand is met indigenously. Weakness: About 10% of the requirement is met through imports.
7. Jute Machinery
Key Stakeholders of Jute Machinery is as in Table 7 in annex-II. Strength: The total capacity is about Rs. 70 crores. Weakness: The technology of Jute machinery is comparatively older. Import of jute machinery is to the level of app. Rs. 10 Cr.
18
8. Parts & Accessories
Key Stakeholders of Parts & Accessories is as in Table 8 in annex-II. Strength: Many important attachments and accessories developed indigenously compare favourably with international technology standards; these include weft straightners, cloth guides and other sophisticated instruments and attachments. About 80% of the requirement is met from domestic sources. The total capacity is Rs. 730 crore and approx 40-50% parts are supplied to OEMs. Weakness: Except some critical items of parts and accessories like compact spinning attachment, automatic yarn splicer, PLC controls, dedicated components for Shuttleless looms, electronic controls for high speed shuttleless looms, electronic dobby, electronic jacquards (there is a recent development), microprocessor and PLC controls for warping and sizing machines, hi-tech temperature indicator and controller and few other components and accessories are being imported. It is estimated that parts/components/ spares and accessories worth Rs. 1500 cr. are imported out of the total import of Rs. 6500 Cr. (textile machineries & parts) 9. Machineries not manufactured in India a. Garment making machinery and knitting machinery The capacity of domestic hosiery and garment making machinery is approx. Rs.70 crores. However, high-tech garment making machinery and knitting machinery are not made in the country. b. Technical textiles machinery
Non-woven and Technical Textiles machinery are also not made in the country. STRENGTH OF THE TEXTILE MACHINERY INDUSTRY – to summarise
(i) There is a large production base.
(ii) Entire range of machinery is produced in the country. Adequate
capacity was created over the years.
(iii) Spinning machinery is of up-to-date technology.
(iv) Weaving preparatory machinery is also of latest technology.
(v) 1st and 2nd generation shuttleless looms have been developed.
(vi) Many of the dyeing and processing machines are of latest
technology.
(vii) Continuous dyeing range, bleaching range, mercerizing range,
preshrinking ranges of international standard are being
19
manufactured and complete plant with continuous machines is
available.
(viii) There is large number of spares & accessories manufacturers.
There are well trained and highly skilled technical personnel
available.
(ix) Textile machinery industry can set up turnkey and semi-turnkey
projects.
(x) It exports over 10% of its annual production.
WEAKNESS OF THE TEXTILE MACHINERY INDUSTRY – to summarise
(i) Textile machinery industry lived on borrowed technology. There has been no or insufficient in-house R&D.
(ii) The manufacturing units are located at different parts of the country.
(iii) There has been lack of sustained demand for machinery from the domestic textile industry.
(iv) The R&D Centre set up by the Industry at IIT, Pawai is yet to come of age and to contribute substantially for the development of the technology for the industry.
(v) The weaving & knitting machinery produced in the country, in general, are of old and outdated technology.
(vi) In Processing & finishing sector, the latest technology is not available for all categories of machines. Complete range of latest processing machinery is not available.
(vii) There is lack of adequate fiscal support from the Government for the development of the TEI.
(viii) There is no level playing field for Textile machinery industry to compete with the imported new as well as second hand machinery due to lopsided duty structure.
(ix) The technological obsolescence in the large decentralised sectors of Textile Industry also has adversely affected the industry.
(x) Lack of infrastructure, common facility centers etc (xi) Absence of large foreign/domestic players in weaving, processing,
knitting and garmenting (xii) Technology gaps in processing and weaving machineries (xiii) No support from Government like corpus fund for modernization,
capacity expansion and for greenfield projects (xiv) no research activity at the manufacturer’s premises (xv) Shortage of skilled manpower (xvi) Reduction in order booking position due to import of cheap second
hand looms and other textile machinery. (xvii) Absence of large domestic investment (xviii) Absence of FDI in Textile machinery industry
20
Methodology of interaction-
i) As per the Allocation of Business Rules, a Development Council for
Textile Machinery Industry is constituted in the DHI. Council has representatives of manufactures of textile machinery, users of textile machinery, concerned Govt. Departments and industry associations, etc. The council meets regularly identifies the problems faced by the industry and tries to find the solution to those problems.
iii) Regular meetings are held with Textile Machinery Manufacturers Association (TMMA) and Indian Textile Accessories & Machinery Manufacturers Association (ITAMMA) to ascertain the developments taking place in the industry.
B.3 Assessment of Department’s Strengths and Weaknesses
Strength –
(iv) The meetings of Development Council of Textile Machinery Industry take place regularly in DHI
(v) The Department has a Technical Wing to provide technical inputs in decision making of the Department. Sanctioned strength of the technical wing is two numbers of Industrial Advisers, two nos. of Additional Industrial Advisers, three nos. of Sr. Development Officers, three nos. of Development Officers and one no. of Assistant Development Officer.
(vi) Technical Officers are capable to render advice on all technical matters which DHI requires on Automobiles, Heavy Electrical Equipments, Heavy Engineering, Machine Tools and Textile Machinery.
Weakness-
The Department does not have any Scheme for the growth of the textile machinery industry. Though, the scheme for ‘Enhancement of Competitiveness in the Capital Goods Sector’ is under consideration in DHI.
B.4. Development of learning grid arising out of the assessment of strengths and weaknesses taking into account the need and criticality.
a Lack of standardization – Due to lack of standardization of the equipment requirement in the domestic market, it is not possible for the domestic manufacturers to build inventories of input materials, components as well as finished products which can be sold of the shelf with minimum delivery schedule.
c. Non-availability of testing facility – Facilities of testing of textile machinery and components/ parts are not adequate presently. While
21
other Departments like M/o Textiles, M/o MSME, DIPP etc. has targeted Schemes for development of the sectors looked after by them, DHI does not have any such Scheme for industry looked after by it
d. Though the manufacturing activity of textile machinery industry is opened upto 100% FDI but not much FDI was attracted.
e. The Department has no production data base in respect of the sub sectors of capital goods sector as well as other machine tools, textile machinery, mining machinery, rubber machinery, cement machinery, oilfield equipment, etc. which the Department has mandated for. These data assumes importance for making schemes & framing policy issues.
f. Absence of latest Report on capital goods sector as well as individual industrial machinery including textile machinery is very much felt. In the past, CII and IL&FS prepared the reports on capital goods sector on the insistence of DHI.
g. Absence of Development Fund for R&D, modernization, capacity expansion and green field projects.
III. DEVELOPMENT OF STRATEGY B.1. Identify the range of possible strategies and the optimal path.
The following could be possible strategies: i. Provide total protection to the domestic industry by regulating the
import. ii) To restrict import of second hand textile machinery under TUFS. iii) To enhance custom duty to the level of bound tariff as per WTO
guidelines. iv) Government to provide support to the industry from time to time
for a minimum period of 5 years and considered longer period for R&D.
V )Instead of allowing 100% FDI, JV route would be thought of. vi) Assist in acquisition of strategic foreign companies for technology
transfer
B.2. Develop a detailed plan to engage key stakeholders. i) To have regular meetings of Development Council. ii) To interact with TMMA and ITAMMA frequently.
iii)To support the efforts of TMMA and ITAMMA and other Associations in their efforts in the development of the industry.
iv) To organize work-shops/seminars/conferences on the issues related to the industry.
B.3 Develop a Learning Plan based on Gap Analysis and identify
Knowledge Partners. i) To recommend to Department of Commerce for restriction on import
of second hand textile machinery.
22
ii) To recommend to Ministry of Finance for imposition of custom duty to the level of bound tariff as per WTO guidelines.
iii) To recommend to Ministry of Finance for reduction of excise duty to the minimum. .
iv) To take steps for development of critical component required by the industry.
v) To recommend to Ministry of Finance for lowering the local taxes and exemption of custom duty on critical components of.
vi) To hire the suitable agency for continuous flow of production statistics of the machineries and equipments looked after by DHI
vii) To hire the consultant for preparation of upto date report on various machinery industries covered under capital goods sector.
viii) To prepare a Scheme for enhancement of the global competitiveness of the industry.
ix) A forum to be made for identification of technology gaps, source of technology and facilitating its transfer
Knowledge Partners
i) Confederation of Indian Industries (CII) ii) IL&FS
B.4 Priorities strategies/initiatives/actions taking into considerations suitability, feasibility and acceptability with a view to achieving aspirations.
Short term counter measures to support the industry Policy measures-
a. To reduce financial cost both for working capital and term finance, special reduction in interest rates should be offered to textile engineering units.
b. Manpower training and rationalization of labour should be encouraged
through policy support.
c. Power tariffs at lower rates and continuous, uninterrupted supply
should be offered to textile engineering units.
i) To exclude textile machinery in FTAs; ii) To support for acquisition of strategic companies abroad
b. Fiscal measures to reduce the cost of textile machines:
Rate of excise duty on textile machines be brought down to uniform rate of 8% to enable the user industry to modernise at a faster pace.
i) Excise duty Recommendations :
8%+2% Education Cess for complete machinery.
23
4%+2% for raw materials, parts, components, accessories & spares
subject to actual user condition.
Exemption in excise duty/CVD should be given to dedicated
components required to manufacture specified textile machinery.
ii) Customs Tariff :-
7.5%+8%(CVD)+2% Education Cess for all items of complete textile
machinery
5%+4%(CVD)+2% Education Cess for raw materials, parts,
components, accessories & spares subject to actual user condition.
To reduce customs duty to zero percent on all critical and identified
elements/components of textile machinery
Corpus fund for R&D, modernisation, capacity expansion,
Greenfield projects, etc. with the provision of soft loans
Tax breaks be allowed on know-how fees and royalty payments for
foreign collaborations and joint ventures.
iii) No subsidy on import of second hand textile machinery
6. Long terms support measures (a) DHI may take the following action plan for technology development I I Government, textile machinery industry and R&D/Technology sources may form PPP companies to address special areas like critical components for textile machinery. These companies will develop and commercialize the technologies;
ii) Strengthen IIT Bombay and establish R&D institutes in other regions; iii) A report to be prepared for enhancement of competitiveness of capital
goods sector including machine tools sector, which will be used for preparation of scheme for XII 5 Year Plan period.
iv) Import of Machinery with technology transfer and phased indigenisation of manufacturing facilities in India will be encouraged which will boost the research in India.
v) Joint collaboration with foreign labs and companies for research base in India will be encouraged
IV. PLAN IMPLEMENTATION
B.1 Develop a detailed implementations plan and identify points for
coordination and milestones and review points.
24
v) Short term support measures could be completed by the next 4 months i.e. March, 2011
vi) Initial initiatives on long term support measures could be completed by the next 6 months i.e. March,2012
vii) Scheme for enhancement of competitiveness in the capital goods sector including Textile Machinery will be prepared by the Department by 30th October, 2011
viii) Reconstitution of Development Council for Textile Machinery Industry - 30th July, 2011
iii) 1st meeting of the reconstituted Development Council for Textile Machinery Industry - August, 2011
B.2. Assess the nature and quantum of resources required to implement the plan.
The Scheme of Enhancement of Competitiveness of Capital Goods Industry has provision of grants of Rs.180 crore.
B.3 Delineate a plan to observe and measure progress through regular
review. Also identify possibilities for corrective actions if and when required.
iv) Regular meetings of SPV v) Regular meetings of Development Council for Textile Machinery
Industry vi) Regular follow up of the minutes of the meeting of Development
Council for Textile Machinery Industry
25
In respect of Heavy Electrical Industry
I. ASSESSMENT OF SITUATION B.1. The political, economic, socio-cultural, technological, environmental and
legal factors impacting the sectors and CPSEs looked after by DHI would be analyzed and assessed.
As per estimates of the Planning Commission, GDP growth rates of 8%-
9% have been projected during the 11th Plan. Assuming a higher growth rate of 9% and assuming the higher elasticity projected by the Integrated Energy Policy (IEP) of around 1.0, electrical energy generation would be required to grow at 9%p.a. during the 11th plan period. Also generation has to be collectively met by utilities, captive plants and Non-conventional energy sources.
During the 12th Plan period, assuming a GDP growth rate of 9% per
annum and elasticity 0.8 as compared to 1.0 during 11th plan mainly due to adoption of energy efficient technologies & other Energy Conservation and Demand Side Management measures being taken up during 11th Plan, electricity demand is likely to grow @ 7.2% p.a.t
tion R The per capita consumption of electricity in India was 704 kWh in FY
08 and the target is to increase it to 1000 kWh by 2012, while world average was 2752 kWh in FY07. The installed generation capacity in India has grown from 1, 32,329 MW in FY07 i.e. the end of 10th Five Year Plan to 1, 55,859 MW in November 2009. India is presently facing a shortage of over 12% in terms of the peek demand of power and 8% in terms of energy demand. The capacity addition envisaged during the 11th and 12th Plan period is of 78,700 MW and 1 lakh MW respectively. Generation capacity aggregating to 80,610 MW is under execution during the 11th Plan. Capacity 18,235 MW has already been commissioned till October 2009 and additional capacity of 44,139 MW is likely to be commissioned over the remaining Plan period.
(BU) Demand of the power generation and transmission equipments is closely linked to the power generation capacity addition program of the country. There is a strong manufacturing base for main plant and equipment in the
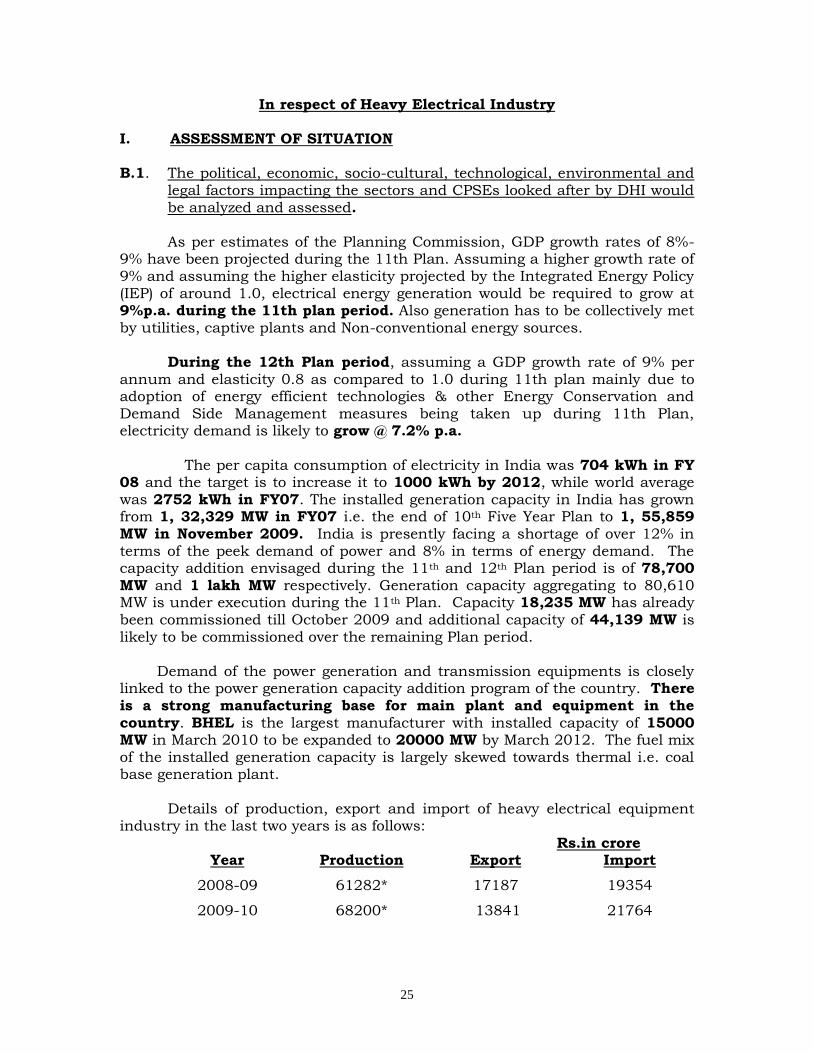
country. BHEL is the largest manufacturer with installed capacity of 15000 MW in March 2010 to be expanded to 20000 MW by March 2012. The fuel mix of the installed generation capacity is largely skewed towards thermal i.e. coal base generation plant. Details of production, export and import of heavy electrical equipment industry in the last two years is as follows:
Rs.in crore Year Production Export Import
2008-09 61282* 17187 19354
2009-10 68200* 13841 21764
***88
26
*888888* includes data for motors, cables and lighting industry looked after by DIPP.
Current import duty on power plants is in the range of 5-7.5% and equipments for ultra mega power projects can be imported even at 0% duty. These are much lower than bound duties prescribed under WTO guidelines, as existing installed capacity in the country is not adequate to meet the demand and numbers of projects are being implemented with the help of imported equipment.
B.2. Identification of key stakeholders, their strengths, capabilities and
influence and methodology of working with them.
The following are the key stakeholders: i) Domestic manufacturers of power plant equipment
Status of domestic manufacturers in major sub-sectors of heavy electrical equipments is as follows:
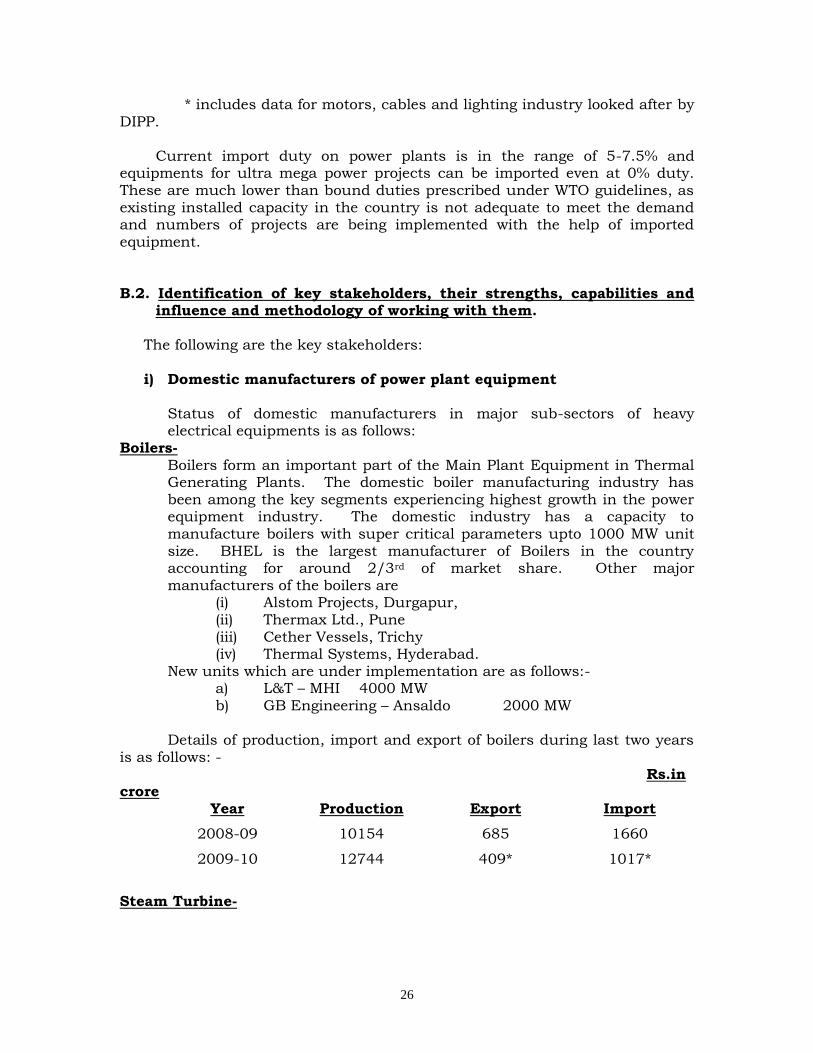
Boilers- Boilers form an important part of the Main Plant Equipment in Thermal Generating Plants. The domestic boiler manufacturing industry has been among the key segments experiencing highest growth in the power equipment industry. The domestic industry has a capacity to manufacture boilers with super critical parameters upto 1000 MW unit size. BHEL is the largest manufacturer of Boilers in the country accounting for around 2/3rd of market share. Other major manufacturers of the boilers are
(i) Alstom Projects, Durgapur, (ii) Thermax Ltd., Pune (iii) Cether Vessels, Trichy (iv) Thermal Systems, Hyderabad.
New units which are under implementation are as follows:- a) L&T – MHI 4000 MW b) GB Engineering – Ansaldo 2000 MW
Details of production, import and export of boilers during last two years
is as follows: - Rs.in
crore Year Production Export Import
2008-09 10154 685 1660
2009-10 12744 409* 1017*
Steam Turbine-
27
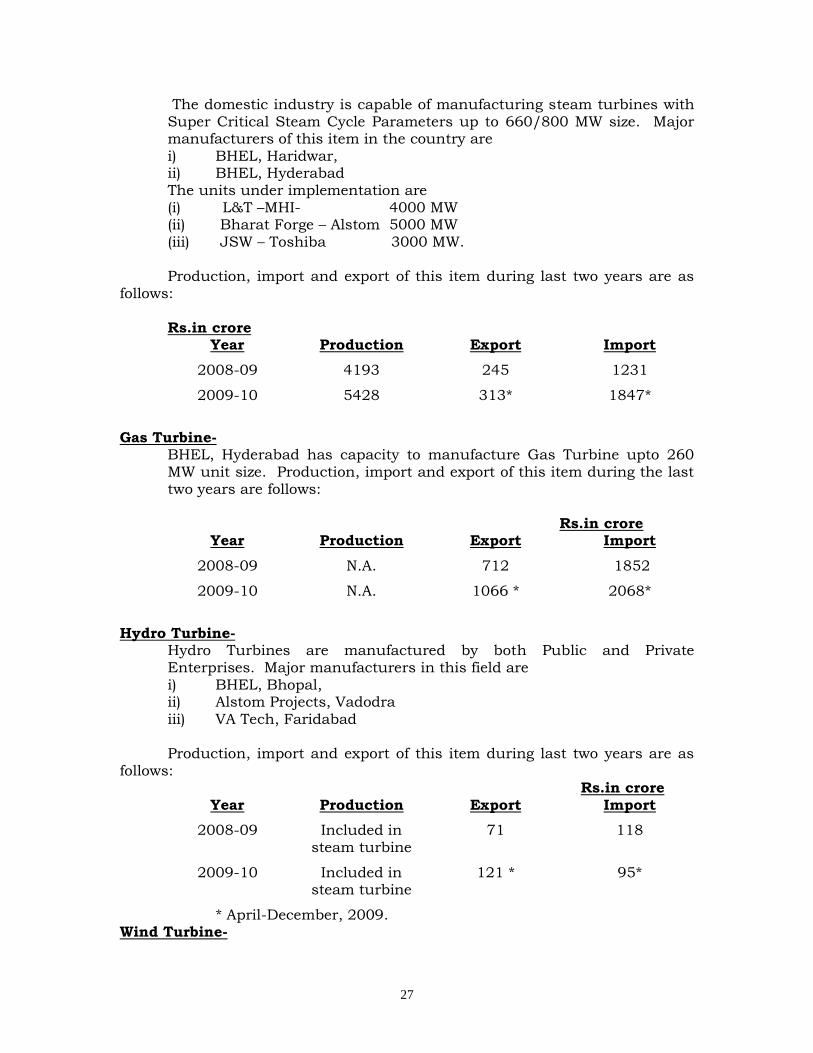
The domestic industry is capable of manufacturing steam turbines with Super Critical Steam Cycle Parameters up to 660/800 MW size. Major manufacturers of this item in the country are i) BHEL, Haridwar, ii) BHEL, Hyderabad The units under implementation are (i) L&T –MHI- 4000 MW (ii) Bharat Forge – Alstom 5000 MW (iii) JSW – Toshiba 3000 MW. Production, import and export of this item during last two years are as
follows:
Rs.in crore Year Production Export Import
2008-09 4193 245 1231
2009-10 5428 313* 1847*
Gas Turbine-
BHEL, Hyderabad has capacity to manufacture Gas Turbine upto 260 MW unit size. Production, import and export of this item during the last two years are follows:
Rs.in crore
Year Production Export Import
2008-09 N.A. 712 1852
2009-10 N.A. 1066 * 2068*
Hydro Turbine-
Hydro Turbines are manufactured by both Public and Private Enterprises. Major manufacturers in this field are i) BHEL, Bhopal, ii) Alstom Projects, Vadodra
iii) VA Tech, Faridabad
Production, import and export of this item during last two years are as follows:
Rs.in crore Year Production Export Import
2008-09 Included in steam turbine
71 118
2009-10 Included in steam turbine
121 * 95*
* April-December, 2009. Wind Turbine-
28
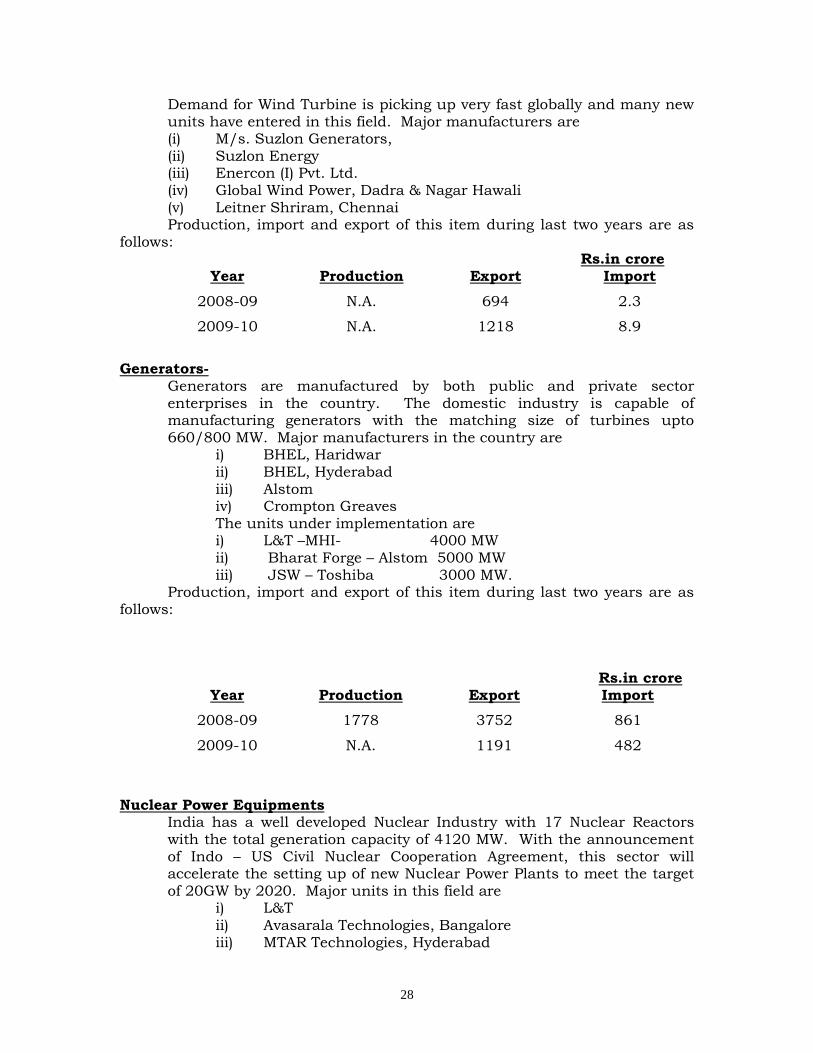
Demand for Wind Turbine is picking up very fast globally and many new units have entered in this field. Major manufacturers are (i) M/s. Suzlon Generators, (ii) Suzlon Energy (iii) Enercon (I) Pvt. Ltd. (iv) Global Wind Power, Dadra & Nagar Hawali (v) Leitner Shriram, Chennai Production, import and export of this item during last two years are as
follows: Rs.in crore
Year Production Export Import
2008-09 N.A. 694 2.3
2009-10 N.A. 1218 8.9
Generators-
Generators are manufactured by both public and private sector enterprises in the country. The domestic industry is capable of manufacturing generators with the matching size of turbines upto 660/800 MW. Major manufacturers in the country are
i) BHEL, Haridwar ii) BHEL, Hyderabad iii) Alstom iv) Crompton Greaves The units under implementation are i) L&T –MHI- 4000 MW ii) Bharat Forge – Alstom 5000 MW iii) JSW – Toshiba 3000 MW.
Production, import and export of this item during last two years are as follows:
Rs.in crore
Year Production Export Import
2008-09 1778 3752 861
2009-10 N.A. 1191 482
Nuclear Power Equipments
India has a well developed Nuclear Industry with 17 Nuclear Reactors with the total generation capacity of 4120 MW. With the announcement of Indo – US Civil Nuclear Cooperation Agreement, this sector will accelerate the setting up of new Nuclear Power Plants to meet the target of 20GW by 2020. Major units in this field are
i) L&T ii) Avasarala Technologies, Bangalore iii) MTAR Technologies, Hyderabad
29
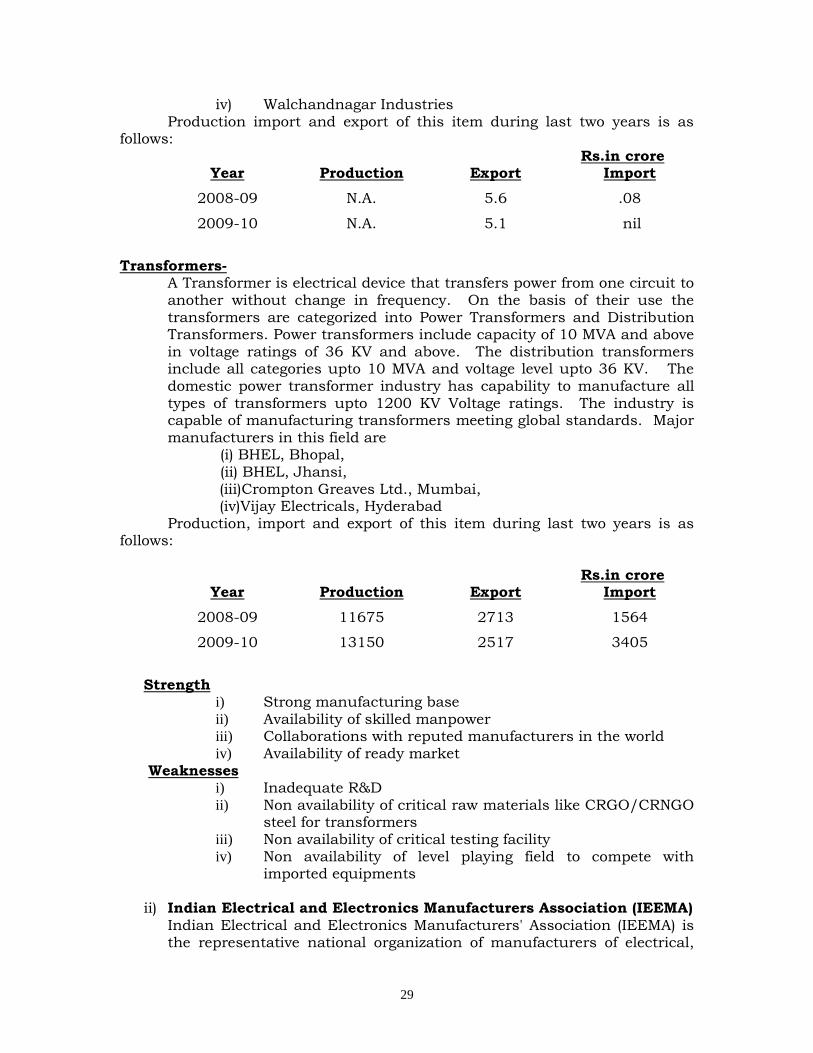
iv) Walchandnagar Industries Production import and export of this item during last two years is as
follows: Rs.in crore
Year Production Export Import
2008-09 N.A. 5.6 .08
2009-10 N.A. 5.1 nil
Transformers-
A Transformer is electrical device that transfers power from one circuit to another without change in frequency. On the basis of their use the
transformers are categorized into Power Transformers and Distribution Transformers. Power transformers include capacity of 10 MVA and above in voltage ratings of 36 KV and above. The distribution transformers include all categories upto 10 MVA and voltage level upto 36 KV. The domestic power transformer industry has capability to manufacture all types of transformers upto 1200 KV Voltage ratings. The industry is capable of manufacturing transformers meeting global standards. Major manufacturers in this field are
(i) BHEL, Bhopal, (ii) BHEL, Jhansi, (iii)Crompton Greaves Ltd., Mumbai, (iv)Vijay Electricals, Hyderabad
Production, import and export of this item during last two years is as follows:
Rs.in crore
Year Production Export Import
2008-09 11675 2713 1564
2009-10 13150 2517 3405
Strength
i) Strong manufacturing base
ii) Availability of skilled manpower iii) Collaborations with reputed manufacturers in the world iv) Availability of ready market
Weaknesses i) Inadequate R&D ii) Non availability of critical raw materials like CRGO/CRNGO
steel for transformers iii) Non availability of critical testing facility iv) Non availability of level playing field to compete with
imported equipments
ii) Indian Electrical and Electronics Manufacturers Association (IEEMA)
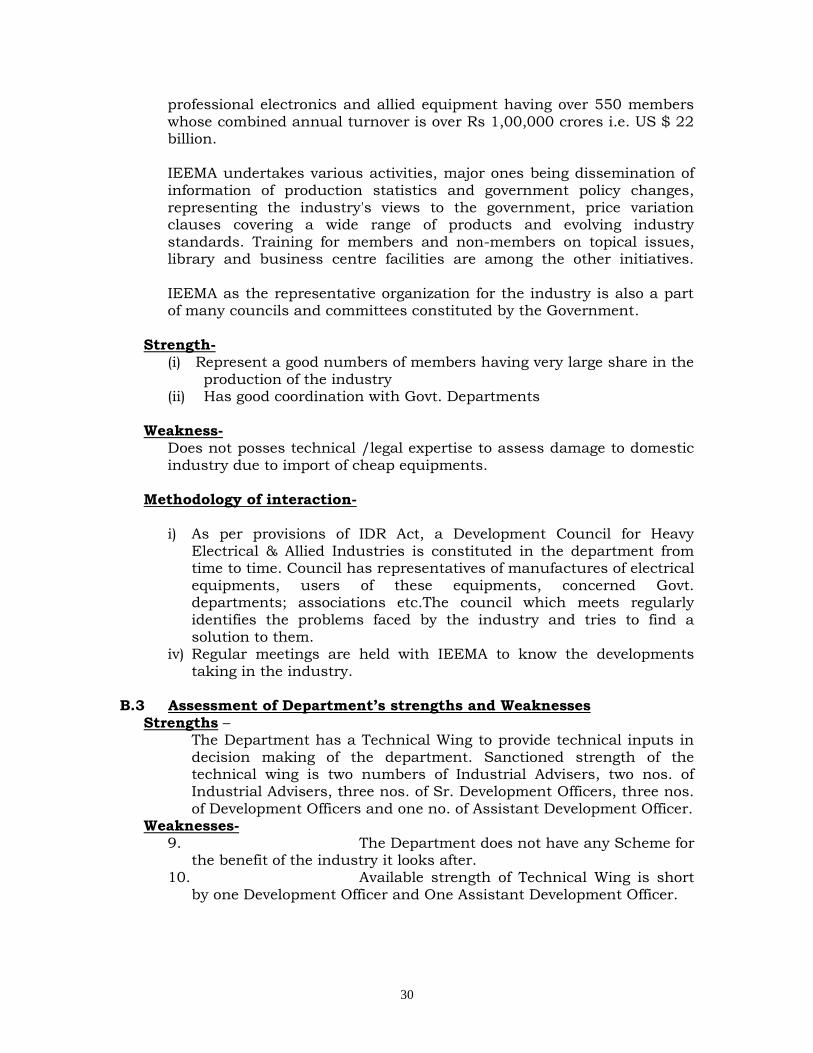
Indian Electrical and Electronics Manufacturers' Association (IEEMA) is the representative national organization of manufacturers of electrical,
30
professional electronics and allied equipment having over 550 members whose combined annual turnover is over Rs 1,00,000 crores i.e. US $ 22 billion. IEEMA undertakes various activities, major ones being dissemination of information of production statistics and government policy changes, representing the industry's views to the government, price variation clauses covering a wide range of products and evolving industry standards. Training for members and non-members on topical issues, library and business centre facilities are among the other initiatives. IEEMA as the representative organization for the industry is also a part of many councils and committees constituted by the Government.
Strength-
(i) Represent a good numbers of members having very large share in the production of the industry
(ii) Has good coordination with Govt. Departments
Weakness- Does not posses technical /legal expertise to assess damage to domestic industry due to import of cheap equipments.
Methodology of interaction-
i) As per provisions of IDR Act, a Development Council for Heavy
Electrical & Allied Industries is constituted in the department from time to time. Council has representatives of manufactures of electrical equipments, users of these equipments, concerned Govt. departments; associations etc.The council which meets regularly identifies the problems faced by the industry and tries to find a solution to them.
iv) Regular meetings are held with IEEMA to know the developments taking in the industry.
B.3 Assessment of Department’s strengths and Weaknesses
Strengths – The Department has a Technical Wing to provide technical inputs in decision making of the department. Sanctioned strength of the technical wing is two numbers of Industrial Advisers, two nos. of Industrial Advisers, three nos. of Sr. Development Officers, three nos. of Development Officers and one no. of Assistant Development Officer.
Weaknesses- 9. The Department does not have any Scheme for
the benefit of the industry it looks after. 10. Available strength of Technical Wing is short
by one Development Officer and One Assistant Development Officer.
31
B.4. Development of learning grid arising out of the assessment of strengths and weaknesses taking into account the need and criticality. a. Price preference to domestic industry – indigenous industry is not
able to compete with imported equipments particularly from China. China provides number of incentives to their units to reduce the cost. Indigenous industry needs government
support in terms of price preference clauses in all cases of bids for domestically funded ICB procurements.
b. Applicability of service tax – benefits of service tax exemption is not available to power sector as in the case of other infrastructure projects.
c. Manufacture of CRGO steel – CRGO steel required in the manufacture of transformers is not manufactured indigenously. There is need to establish manufacturing facility of this item and import should be allowed under nil duty till self sufficiency in production is achieved.
d. Lack of standardization – Due to lack of standardization of the equipment requirement is the domestic market, it is not possible for the domestic manufacturers to build inventories of input materials, components as well as finished products which can be sold of the shelf with minimum delivery schedule.
e. Availability of testing facility – Facilities of testing of power equipments are not adequate presently and there is need to augment CPRI test facility as well as encourage power sectors PSUs to create additional testing facility.
f. While other departments like Textiles, DIPP etc. has targeted Schemes for development of the sectors looked after by them, DHI does not have any such Scheme for industry looked after by it
II. DEVELOPMENT OF STRATEGY B.1. Identify the range of possible strategies and the optimal path.
The following can be possible strategies: ix) Provide total protection to the domestic industry by banning the
import. x) To allow liberal imports and domestic industry to face open
competition. xi) To restrict import of second hand plant and equipment. xii) To enhance custom duty to the level of bound tariff as per WTO
guidelines. xiii) The industry to operate and grow of its own without any
Government intervention. xiv) Government provides support to the industry from time to time.
B.2. Develop a detailed plan to engage key stakeholders.
a. To have regular meetings of Development Council. b. To interact with IEEMA frequently.
32
c. To support the efforts of IEEMA and other Associations in their efforts in the development of the industry.
d. To organize work-shops/seminars/conferences on the issues related to the industry.
B.3 Develop a Learning Plan based on Gap Analysis and identify
Knowledge Partners. i) To recommend to Department of Commerce for restriction on import
of second hand power plant and equipment. ii) To recommend to Ministry of Finance for imposition of custom duty
to the level of bound tariff as per WTO guidelines.
iii) To take steps for development of raw material/component required by the industry.
iv) To recommend to Ministry of Finance for lowering the local taxes and duties on finished products and raw material of domestic manufacturers.
e. To prepare a Scheme for enhancement of the competitiveness of the industry.
Knowledge Partners
iii) Confederation of Indian Industries (CII) iv) IL&FS
B.4 Priorities strategies/initiatives/actions taking into considerations suitability, feasibility and acceptability with a view to achieving aspirations.
i) To prepare a scheme of enhancement of competitiveness of domestic industry.
ii) To forward recommendations to Ministry of finance on duties and taxes at least two months before presentation of the budget.
III. PLAN IMPLEMENTATION
B.1 Develop a detailed implementations plan and identify points for coordination and milestones and review points.
ix) Scheme for enhancement of competitiveness in the capital
goods sector including heavy electrical equipment is under preparation by the department. The following can be the milestones for implementation of this scheme – - Finalization of Note for EFC -30th October, 2010 - Approval of the scheme -30thNovember, 2010
- Formation of SPV - 8th February, 2011
x) Constitution of Development Council for Heavy Electrical & Allied Industry -1st October, 2010
33
iii) Ist meeting of the Development Council for Heavy Electrical & Allied Industry - 31st.January 2011
B.2. Assess the nature and quantum of resources required to implement
the plan.
The Scheme of Enhancement of Competitiveness of Capital Goods Industry has provision of grants of Rs.300 crores.
B.3 Delineate a plan to observe and measure progress through regular
review. Also identify possibilities for corrective actions if and when required.
vii) Regular meetings of SPV viii) Regular meetings of Development Council for Heavy Electrical &
Allied Industry
34
In respect of Auto Sector
I. Assessment of Situation B.1. The political, economic, socio-cultural, technological,
environmental and legal factors impacting the Auto Sector. The automobile sector in India has been aptly described as the next sun rise sector of the Indian economy. This sector has been growing at a CAGR, in excess of 15% over the last 5-7 years. Despite the down turn witnessed due to economic slowdown, the Indian automotive industry was amongst the first few manufacturing sectors to recover and has been recording tremendous growth figures in the recent past. In fact India was the second fastest growing automotive market in 2009-10. ii. Since automobile products are the second most discretionary purchase made by a consumer; after house purchase; the fortunes of the automobile industry are closely linked with that of the general growth of the economy, disposable incomes and consumer confidence. It is, therefore, expected that the high growth rates witnessed in the Indian automobile industry for the past few years have coincided with similar high GDP growth rates recorded by the country along with growth in incomes. The continued growth and ever increasing purchasing power of rural India, fast development of roads, highways and infrastructure are all factors that will help fuel further demand for mobility and vehicles. In addition, the demand for automobiles is also dependent upon various other factors such as ease of availability of finance, cost of finance, vehicle density, demographic profile of the market and the earning capacity. At present, India has amongst the lowest vehicle densities globally at 11 cars per thousand persons and 32 two-wheelers per thousand persons. This is much lower as compared to other comparable economies. As a result there is a huge potential market for automobiles that is yet to be tapped. The majority of the population of the country is young with high aspirations and with rising income levels due to economic growth and readily availability of finance, the demand for automobiles in the foreseeable future is expected to remain buoyant.
iii. In 2009, India became the 7th largest vehicle manufacturer globally, second largest manufacturer of two wheelers (10512889), largest manufacturer of tractors (433207), 5th largest manufacturer of commercial vehicles (566608) and the 4th largest passenger car market in Asia (1526787 in 2009-10). During 2009, India exported vehicles to more than 40 countries which comprised of 446146 passenger cars, 1140184 two wheelers, and 45007 commercial vehicles. The main challenges that will be faced by the Indian automobile industry will include efforts needed to manage the challenges associated with a very high level of growth, strategic foresight and planning for meeting the fast changing and evolving competitive paradigms of the industry and for finding new competitive spaces where the Indian industry can excel. The challenges associated with sustaining high growth trajectory include:
35
a. Augmenting capacities of the entire value chain especially that of small tier III & IV suppliers and accessing huge financial resources required for this; b. Upgradation of technology, better and efficient manufacturing processes with greater emphasis on quality, cost reduction, cultures of innovation and the knowledge management in the entire value chain; c. To muster and voluntarily manage the huge financial resources required for capacity building and technological upgradation of the sector. d. Meeting the challenges of sustainable mobility with ever increasing focus on more fuel efficient vehicles, alternative drives and alternative fuels especially electric vehicles. e. Bridging the human resource gap, both in terms of quality and quantity, not only to meet the current requirement but also to cater to the sharp increase in demand for human skill sets in the near future. f. Greater focus in investment in R&D and sustainable transportation through developing or acquiring newer and better technology including introduction of alternate drives and fuels especially electric mobility to mitigate the impact of vehicles on the environment and climate change. g. To meet the challenges posed by enhanced global competition and pressure for greater market access b other major automobile nations through various FTAs being negotiated, as also through various mechanisms undertaken in the multilateral forums like WTO. h. Continuously upgrade the vehicle regulations in line with international regulations. i. To ensure greater safety and minimize emissions through ensuring well-maintained on road/in house fleet of vehicles through a comprehensive inspection and maintenance regime coupled with end of life policy. j. To optimize the use of non-renewable resources through encouraging
recycling. k. To leverage the vast pool of scientists and technical manpower available in India at much lower cost through facilitating development of India as the out-sourcing hub for automotive Research & Development, Design and testing. B2. Identification of key stakeholders, their strengths, capabilities and influence and methodology of working with them. The following are the key Stakeholders: 1. Domestic Manufacturers of Automobiles: The status of domestic
manufactures in the major sub-segments of automobiles is as follows: a. Passenger Cars:
36
i. Brief introduction: Today almost all leading global car manufacturers are located in India. In 2009-10, India manufactured almost 2 million cars with Maruti becoming the first Indian car manufacture to manufacture 1 million cars in a financial year. In 2009-10 India became the 4th largest car market in Asia.
ii. Major Players & their performance in 2009-10: This is given in Table 1 in annex-III
Although all major global OEMs except for two are located and based out of India, Maruti Suzuki India Ltd, Hyundai Motor India Ltd and Tata Motors Ltd are the three biggest car manufactures in India together accounting for 88% of all cars manufactured in India and 99% of the cars exported from India. In 2009 Maruti achieved the distinction of being the first Indian car company to manufacture 1 million passenger vehicles in a financial year.
iii. Overall production of passenger cars for last five years: This is given in Table 2 in annex_III
b. Utility Vehicles: i. Brief introduction: The utility vehicles in India are mainly used as a means of public transportation in semi-urban and rural areas and therefore are also a source of livelihood for many. The total volume of UV segment is under 3,00,000 units.
ii. Major Players & their performance in 2009-10: This is given in Table 3 in annex-III
iii. Overall production of Utility Vehicles for last five years: This is given in Table 4 in annex-III
c. Commercial vehicles (Both Passenger & Freight):
i. Brief introduction: The Indian Commercial vehicle market
consists of passenger and goods vehicles in the light category (LCV) and also in the Medium & Heavy range (M&HCV). While the LCV are used mainly for the transportation needs with in the cities, the M&HCV caters to inter-city transportation needs. The composition of LCV and M&HCV is more of less the same with domestic market share of LCVs at 54% and M&HCVs at 46%. The goods category is predominant both in LCV and M&HCV with 88% and 82% of the domestic market sales.
Major Players In Light Commercial Vehicles (LCV) & their performance in 2009-10: This is given in Table 5 in
As per this the major players in the LCV segment of the automotive sector are Tata Motors, Mahindra & Mahindra and Force motors. This segment is also growing fast on account of
37
smaller LCV like the ACE and Magic; that are eating into the traditional three wheeler markets. As per the Ernst & Young study this segment will continue to witness very high growth rates in the next 10 years.
ii. Major Players in Medium & Heavy Commercial Vehicles (M&HCV) & their performance in 2009-10: This is given in Table 6 in annex-III
iii. Overall production of Commercial Vehicles for last five years: This is given in Table 7 in annex-III
d. Three Wheelers (Both Passenger & Freight).
i. Brief introduction: The three wheeler segment consists of both passenger and freight applications with approx. 89% belonging to the passenger category. Within this category 99% of passenger three wheelers are of the smaller size (A1 – with seating capacity of maximum 4 passengers and with maximum mass of less then 1 Tonne.
ii. Major Players & their performance in 2009-10: This is given
in Table 8 in annex-III:
iii. Overall production of three wheelers for last five years:
This is given in Table 9 in annex-III
As can be seen from the data the three wheelers production declined in 2007-08 and registered no growth in 2008-09. This was the period of decline/no growth for the entire Indian automobile industry. However, since 2009-10 this segment has also been growing very strongly, with growth upto August, 10 being approximately 40% on year to year basis. e. Two Wheelers:
i. Brief introduction: The two wheeler segment is the largest segment in the automobile industry accounting for approx 75% of all vehicles manufactured. India is the second largest manufacture of two wheelers in the world. This segment also accounts for the bulk of exports by India in volume terms. This segment consists of scooters, bikes, mopeds and electric two wheelers. The Motorbike sub-segment is the largest sub-segment with 80% of all two wheelers manufactured. The scooters sub-segment accounts for approx. 15% two wheelers manufactured. The two wheeler segment has been registering high levels of growth in the recent past, much of which is also from the rural markets. In 2010-11, (upto August, 2010) the two wheelers segment registered a growth of approximately 30% on year to year basis.
38
ii. Major Players of Scooters & their performance in 2009-10: This is given in Table 10 in annex-III
iii. Major Players of Motorcycles and Mopeds & their
performance in 2009-10: This is given in Table 11 in annex-III
iv. Major Players of Electric two wheelers & their performance
in 2009-10: This is given in Table 12in annex-III
v. Overall production of two wheelers for last five years: This is given in table 13 below:
2. SWOT analysis of the Indian Automobile industry: A brief SWOT analysis of the Indian automobile industry indicates the following:
a. Strengths: i. Strong growth of the Indian Economy – High GDP growth. ii. India’s huge geographical spread necessitates large
transportation requirements both for goods and passengers. iii. Huge middle class that is growing - according to a McKinsey
study, the middle class in India will grow from 50 million to 550 million by 2025.
iv. Increasing disposable incomes especially with the growth of the service sector.
v. Ease of availability of Finance at reasonable rates of Interest. vi. Availability of technically qualified manpower at very low costs. vii. Presence of a strong and vibrant supply chain (auto component
manufactures) which can supply best quality parts at most competitive prices.
viii. Strong support of the government to the industry - by way of setting up of State of the art R&D and testing facilities– NATRiP and ARAI-FID and conducive policies.
ix. Almost all major automobile players present in India with large investments planned for the future. (18 manufacturers of passenger vehicles, 13 manufacturers of CVs, 16 of two/three
wheelers, 12 of tractors besides 5 manufactures of engines in India)
x. Indian automobile industry is the second fastest growing industry in the world and India is now the seventh largest manufacture of vehicles in the world.
xi. India has fast emerged as the global hub for the manufacture of small cars.
xii. Vehicles made in India are being exported globally xiii. Indian companies provide the quality of Japan at very
competitive costs. xiv. In 2009-10, India was the 7th largest vehicle manufacturer,
2nd largest manufacturer of two wheelers (10512889) and 5th largest manufacturer of CVs (566608)
39
xv. Further, in 2009-10 India was also the largest Manufacturer of tractors (433207) in the world and the 4th largest passenger car market in Asia (Approx. 1526787 in 2009-10).
xvi. In 2009-10 India exported to more than 40 countries (exported 446146 passenger cars, 1140184 two wheelers and 45007 commercial vehicles in 2009-10).
b. Weaknesses: i. Poor Infrastructure – power, roads, ports etc. ii. Higher transaction costs of doing business in India. iii. Non liberalization of labour laws. iv. Presence of multitude of taxes and variation of road taxes in
various states. v. Large gap in skilled manpower and huge expected demand for
skilled, technically qualified and trained manpower in the entire value chain of automotive industry.
vi. Lower level of investments made by the Indian OEMs in Research and Development in frontier areas of vehicle technology.
vii. Lack of design capabilities and lack of availability of skilled manpower and engineers for automotive R&D and designing etc.
c. Threats: i. The focus and emphasis of major automobile manufacturing
countries on India as a potential export market for their vehicles and consequently their pressure for lowering the tariffs on automobile tariff lines in FTAs etc.
ii. Strategy of major automobile manufacturing countries to gain greater access to the Indian auto market for their vehicles through initiating issue of trade in Remanufactured goods, technical barriers to trade in automobiles and the issue of environmental goods in multilateral forums like WTO.
iii. Fast changing paradigms of the industry with greater focus and investments globally on alternate fuels and drives especially for shifting to electric mobility.
d. Opportunities: i. Huge investments by the government especially in the
infrastructure development. ii. Increasing middle class with disposable income, including in
the rural agriculture sector. iii. Low Penetration of vehicles in India: The current vehicle
penetration for the major cities in India is very low. The penetration levels of cars, two wheelers in India and other countries are indicated as under:
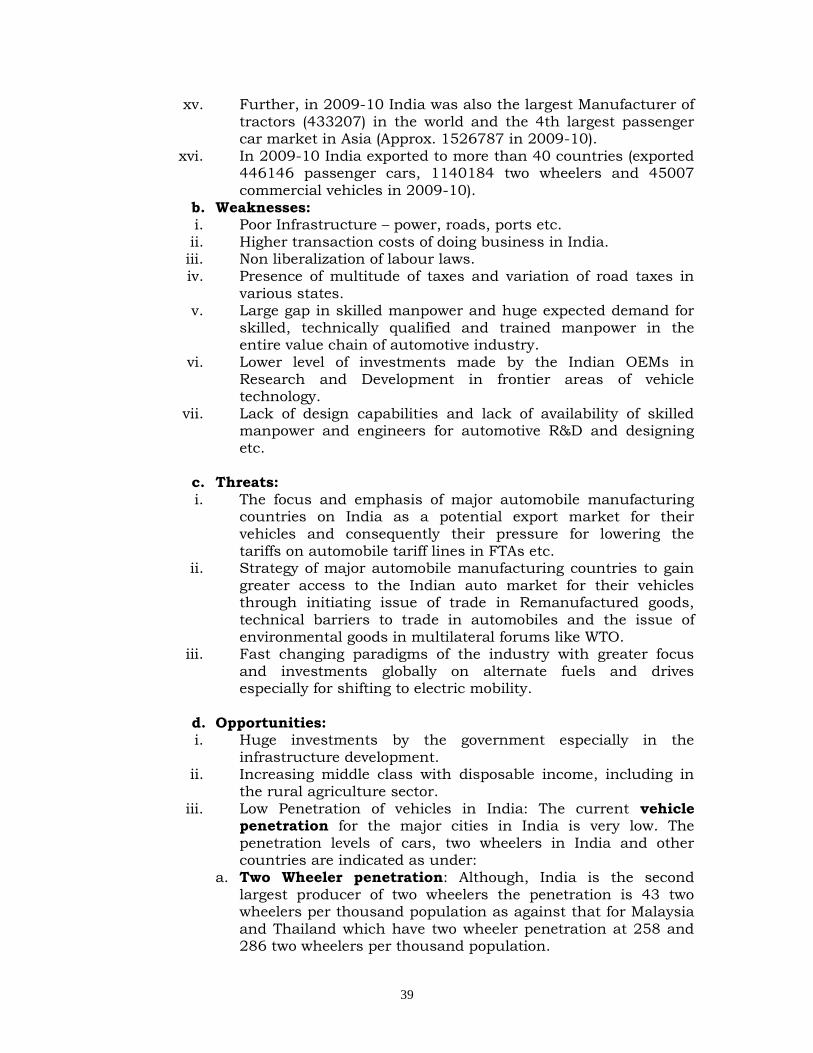
a. Two Wheeler penetration: Although, India is the second largest producer of two wheelers the penetration is 43 two wheelers per thousand population as against that for Malaysia and Thailand which have two wheeler penetration at 258 and 286 two wheelers per thousand population.
40
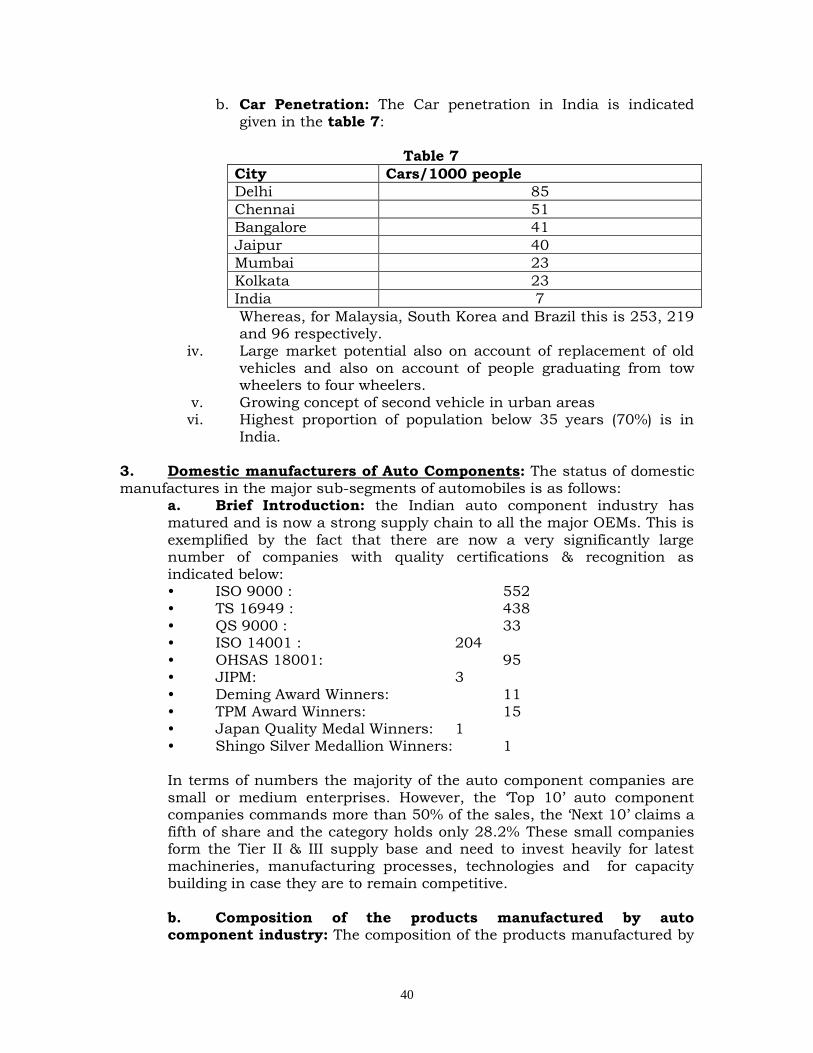
b. Car Penetration: The Car penetration in India is indicated given in the table 7:
Table 7
City Cars/1000 people
Delhi 85
Chennai 51
Bangalore 41
Jaipur 40
Mumbai 23
Kolkata 23
India 7
Whereas, for Malaysia, South Korea and Brazil this is 253, 219 and 96 respectively.
iv. Large market potential also on account of replacement of old vehicles and also on account of people graduating from tow wheelers to four wheelers.
v. Growing concept of second vehicle in urban areas vi. Highest proportion of population below 35 years (70%) is in
India. 3. Domestic manufacturers of Auto Components: The status of domestic manufactures in the major sub-segments of automobiles is as follows:
a. Brief Introduction: the Indian auto component industry has matured and is now a strong supply chain to all the major OEMs. This is exemplified by the fact that there are now a very significantly large number of companies with quality certifications & recognition as indicated below: • ISO 9000 : 552 • TS 16949 : 438 • QS 9000 : 33 • ISO 14001 : 204 • OHSAS 18001: 95 • JIPM: 3 • Deming Award Winners: 11 • TPM Award Winners: 15 • Japan Quality Medal Winners: 1 • Shingo Silver Medallion Winners: 1 In terms of numbers the majority of the auto component companies are small or medium enterprises. However, the ‘Top 10’ auto component companies commands more than 50% of the sales, the ‘Next 10’ claims a fifth of share and the category holds only 28.2% These small companies form the Tier II & III supply base and need to invest heavily for latest machineries, manufacturing processes, technologies and for capacity building in case they are to remain competitive. b. Composition of the products manufactured by auto component industry: The composition of the products manufactured by
41
the auto component industry is given in the Table 14 and Graph 2 in annex._III
c. Major Players in the auto component sector: The major players in the auto component are listed as under:
i. Bosch Ltd.
ii. Amtek Auto Ltd.
iii. Bharat Forge Ltd.
iv. Brakes India Ltd
v. Sundram Fasteners Ltd.
vi. Endurance Systems (India) Pvt. Ltd. (A subsidiary of Endurance Technologies Pvt. Ltd.),
vii. Rico Auto Industries Ltd.
viii. Motherson Sumi Systems Ltd.
ix. Varroc Engineering Pvt. Ltd.
x. Sunbeam Auto Ltd.
xi. Asahi India Glass Ltd.
xii. Lucas-TVS Ltd.
xiii. Munjal Showa Ltd.
xiv. Wheels India Ltd.
xv. Subros Ltd.
xvi. Lumax Industries Ltd.
xvii. Sona Koyo Steering Systems Ltd. d. Performance of the auto component sector for last five years: The turnover of the auto component sector, exports, imports and investments along with the percentage growth is given in Table 15 in annex-III
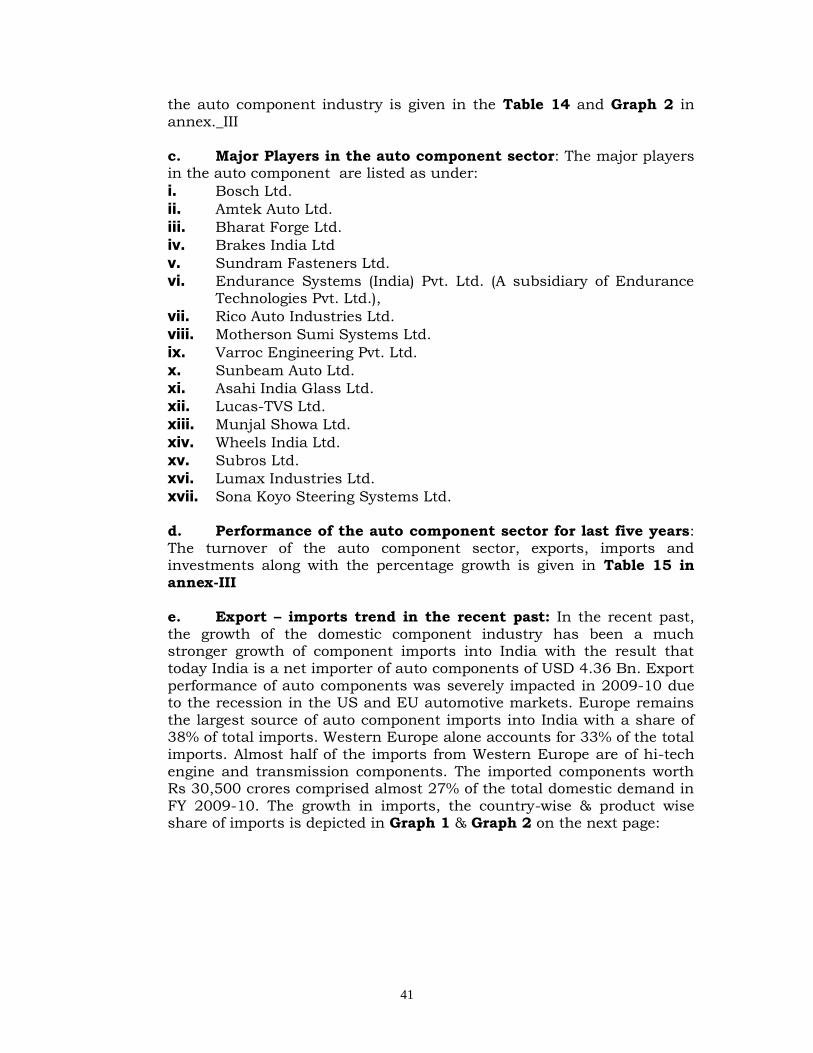
e. Export – imports trend in the recent past: In the recent past, the growth of the domestic component industry has been a much stronger growth of component imports into India with the result that today India is a net importer of auto components of USD 4.36 Bn. Export performance of auto components was severely impacted in 2009-10 due to the recession in the US and EU automotive markets. Europe remains
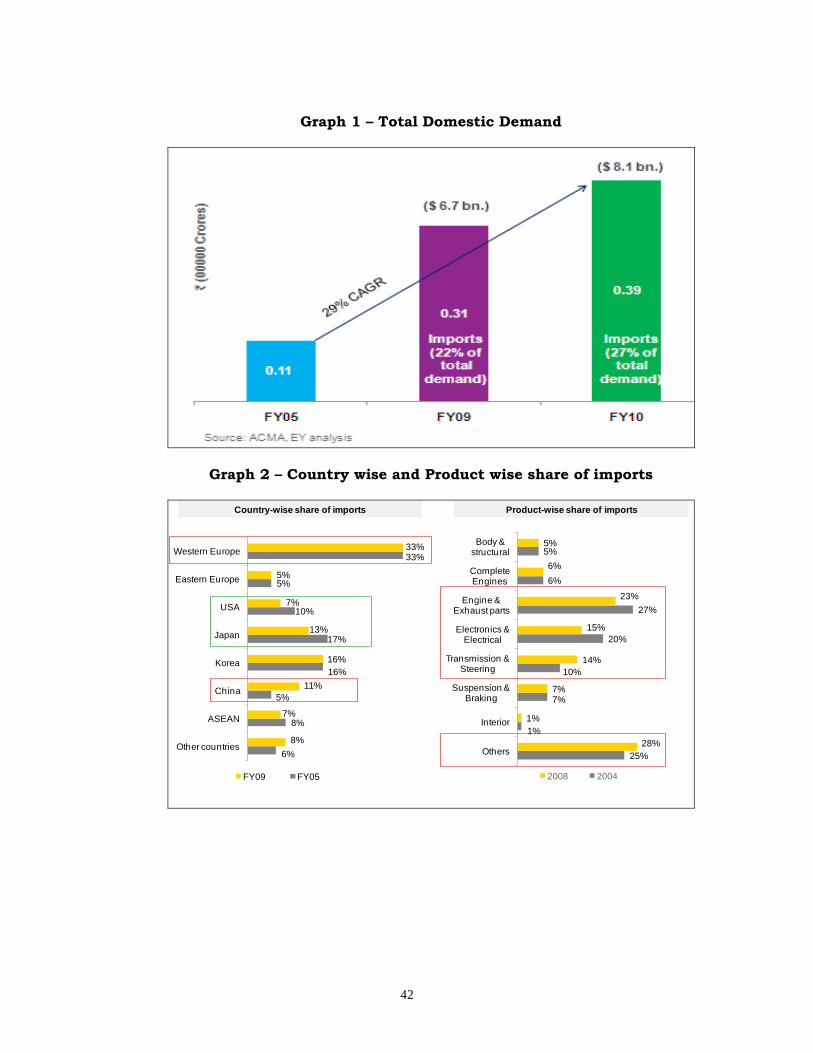
the largest source of auto component imports into India with a share of 38% of total imports. Western Europe alone accounts for 33% of the total imports. Almost half of the imports from Western Europe are of hi-tech engine and transmission components. The imported components worth Rs 30,500 crores comprised almost 27% of the total domestic demand in FY 2009-10. The growth in imports, the country-wise & product wise share of imports is depicted in Graph 1 & Graph 2 on the next page:
42
Graph 1 – Total Domestic Demand
Graph 2 – Country wise and Product wise share of imports
6%
8%
5%
16%
17%
10%
5%
33%
8%
7%
11%
16%
13%
7%
5%
33%
Other countries
ASEAN
China
Korea
Japan
USA
Eastern Europe
Western Europe
FY09 FY05
Country-wise share of imports Product-wise share of imports
25%
1%
7%
10%
20%
27%
6%
5%
28%
1%
7%
14%
15%
23%
6%
5%
Others
Interior
Suspension & Braking
Transmission & Steering
Electronics & Electrical
Engine & Exhaust parts
Complete Engines
Body & structural
2008 2004
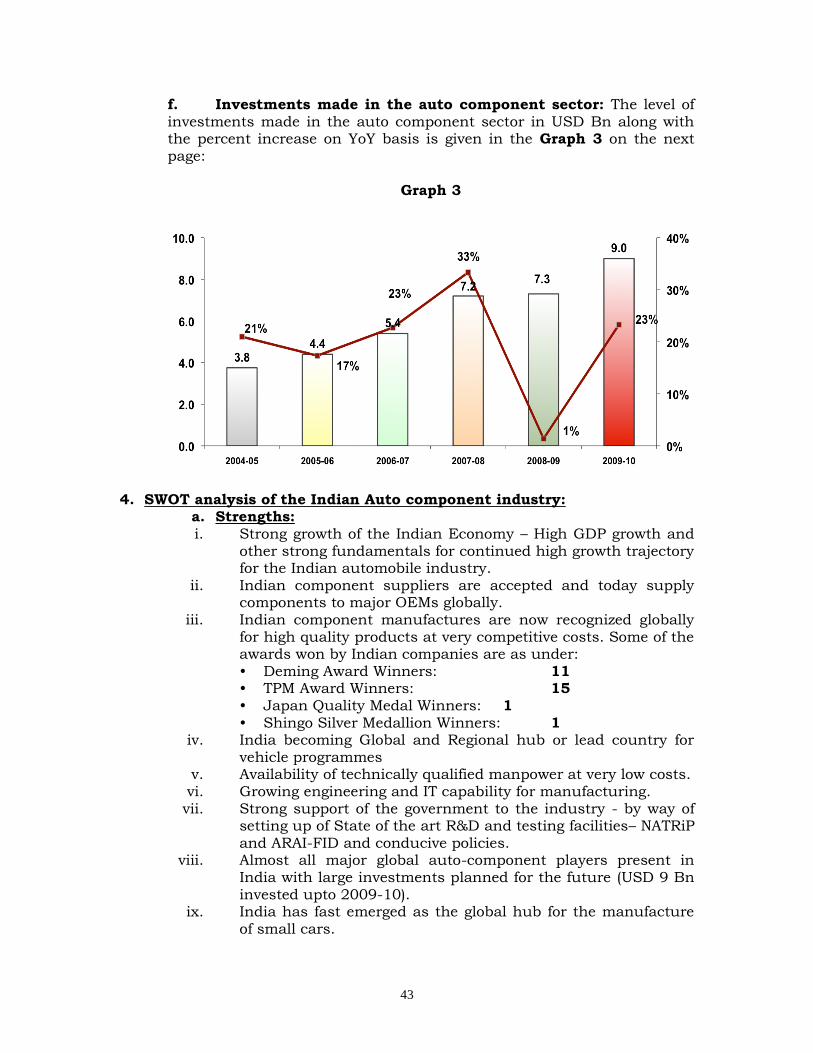
43
f. Investments made in the auto component sector: The level of investments made in the auto component sector in USD Bn along with the percent increase on YoY basis is given in the Graph 3 on the next page:
Graph 3
a. Imports Table 1
4. SWOT analysis of the Indian Auto component industry:
a. Strengths: i. Strong growth of the Indian Economy – High GDP growth and
other strong fundamentals for continued high growth trajectory for the Indian automobile industry.
ii. Indian component suppliers are accepted and today supply components to major OEMs globally.
iii. Indian component manufactures are now recognized globally for high quality products at very competitive costs. Some of the awards won by Indian companies are as under: • Deming Award Winners: 11 • TPM Award Winners: 15 • Japan Quality Medal Winners: 1
• Shingo Silver Medallion Winners: 1 iv. India becoming Global and Regional hub or lead country for
vehicle programmes v. Availability of technically qualified manpower at very low costs. vi. Growing engineering and IT capability for manufacturing. vii. Strong support of the government to the industry - by way of
setting up of State of the art R&D and testing facilities– NATRiP and ARAI-FID and conducive policies.
viii. Almost all major global auto-component players present in India with large investments planned for the future (USD 9 Bn invested upto 2009-10).
ix. India has fast emerged as the global hub for the manufacture of small cars.
44
b. Weaknesses: i. Poor Infrastructure – power, roads, ports etc. ii. Higher transaction costs of doing business in India. iii. Presence of multitude of taxes and variation of road taxes in
various states. iv. Scaling-Up the industry is required along with infusion of
latest manufacturing processes, latest plant and machinery especially for the Tier II & III companies.
v. Lack of access to World-class Technology and Quality Practices vi. Access to and availability of cost-effective capital vii. Non liberalization of labour laws. viii. Large gap in skilled manpower and huge expected demand for
skilled, technically qualified and trained manpower in the entire value chain of automotive industry.
ix. Lower level of investments made by the Indian OEMs in Research and Development in frontier areas of vehicle technology.
x. Lack of design capabilities and lack of availability of skilled manpower and engineers for automotive R&D and designing etc.
c. Threats: i. Increasing competition from other Low Cost Countries. ii. Fast erosion of competitiveness arising out of low cost of labor. iii. Sharp increase in imports of auto components. iv. Stagnation of exports leading to India being a net importer of
auto components to the tune of USD 5 Bn approximately in 2009-10.
v. Continued slow down in global auto industry leading to consolidation of manufacturing facilities by global majors.
vi. The focus and emphasis of major automobile manufacturing countries on India as a potential export market for their vehicles and consequently their pressure for lowering the tariffs on automobile tariff lines in FTAs etc.
vii. Strategy of major automobile manufacturing countries to gain greater access to the Indian auto market through initiating
issue of trade in Remanufactured goods, technical barriers to trade in automobiles and the issue of environmental goods in multilateral forums like WTO.
viii. Fast changing paradigms of the industry with greater focus and investments globally on alternate fuels and drives especially for shifting to electric mobility.
d. Opportunities: i. Strong domestic demand to continue. ii. Many auto component manufacturers diversifying to other
areas like Aerospace, Railways etc. iii. Strong opportunities for Indian companies to establish
Partners/JV in India for - Engine & Exhaust parts
45
- Auto Electronics & Electrical - Transmission & Steering - Informatics & Telematics - New Material - Simulation Technology
iv. Collaboration for Manufacturing Excellence and Process Design
v. Production Sharing in India & Europe for a Holistic Service Capability
vi. Partnering for Global Requirements
5 Automobile Industry associations and their assessment: There are three main associations related to the automobile sector. These are:
a. SIAM: Society of Indian Automobile Manufacturers (SIAM) is the apex Industry body representing 44 leading vehicle and vehicular engine manufacturers in India. It is an important channel of communication for the automobile industry with the Government, National and International organizations. The Society works closely with all the concerned stake holders and actively participates in formulation of rules, regulations and policies related to the Automobile Industry. SIAM also interacts with worldwide experts to assess the global trends and developments shaping the Automotive Industry. It has been actively pursuing issues like Frontier Technologies viz. Telematics, Promotion of Alternative Fuels including Hydrogen Energy for automotive use through cell vehicles and harmonization of Safety and Emission Standards etc. The biennial Auto Expo series of trade fairs are organized by SIAM in co-operation with Confederation of Indian Industry (CII) and Automotive Component Manufacturers Association of India (ACMA). b. ACMA: The Automotive Component Manufacturers Association of India (ACMA) is the nodal agency for the Indian Auto Component Industry. It represents over 592 companies, whose production forms a majority of the total auto component output in the organized sector. Till now 564 ACMA members have been certified to ISO 9001/9002, 186 companies awarded to ISO 14001, 397 companies have been certified
with TS 16949. ACMA is actively involved in trade promotion, technology up-gradation, quality enhancement and collection and dissemination of information to the industry and is a vital catalyst for this industry's development. ACMA is represented on a number of panels, committees and councils of the Government of India through which it helps in the formulation of policies pertaining to the Indian automotive industry. It also participates in international trade fairs, sends trade delegations overseas and brings out publications on various subjects related to the automotive industry. For exchange of information and especially for co-operation in trade matters, ACMA has signed Memoranda of Understanding with its counterparts in Australia, Brazil, Canada, Egypt, France, Germany, Iran, Italy, Japan, Malaysia, Pakistan, South Africa, South Korea, Spain, Sweden, Thailand, Tunisia, Turkey, UK, USA and Uzbekistan.
46
c. TMA: India is the largest manufacturer of tractors in the world. The Tractor Manufacturers Association is the body that represents the tractor manufactures of India.
6. Other Key stake holder Ministries and international bodies and
their assessment : The other key stakeholder Ministries/ Departments related to the automobile sector are listed as under:
a. DRT: The department of Road transport is the regulator for the automobile industry and makes regulations for vehicle safety and emissions. There are two standing committees the Standing Committee on Emissions (SCOE) and the Central Motor Vehicles Regulations – Technical Sub Committee (CMVR-TSC) that dwell into and make recommendations relating to the regulations for emissions and safety respectively. The key stakeholder Ministries like DHI, testing agencies like ARAI and NATRiP, industry associations are members of theses two committees. DRT itself does not have the requisite technical expertise or the facilities for the development and updation of the automotive regulations. The technical and secretarial support to the DRT for this purpose is provided by ARAI, an autonomous automotive testing and R&D institute under the department of heavy industry. This is a stop gap arrangement that needs to be replaced by formal regular structure. b. MoPNG: The Ministry of Petroleum and natural gas is the nodal Ministry for framing the Auto Fuel Policy and the administrative ministry for the oil companies that supply the fuel. c. MoEF: The Ministry of Environment and Forests is the nodal Ministry for the environment related matters and also administers the issues relating to the impact of transport and vehicles on the environment, climate change and the strategies to mitigate this impact.
d. DST: The department of Science & Technology is the nodal Ministry for promoting research and development. CAR under TIFAC, DST is a body created specifically for promoting collaborative R&D in the
automotive sector. DST is one the key partner Ministries in the effort of DHI for promoting electric mobility and the manufacture of electric vehicles in the country.
e. WP-29: The “World Forum for Harmonization of Vehicle Regulation” also commonly known as Working Party 29 (WP 29), functions under the aegis of UNO/ECE. WP 29 was established in 1953 by the UNO as a subsidiary body of Economic Commission for Europe [ECE] to facilitate a dialogue between the technical experts competent in the field of technical requirement for vehicles. After the agreement was concluded by several European countries, WP 29 was appointed as the administrative body of the UN/ECE, 1958 Agreement, intended to develop uniform vehicle technical regulations and implement mutual recognition within Europe which has now been extended to the entire World subsequently. The
47
participation in the forum has grown over the years. India joined the forum in October, 2002 initially as an observer with a decision regarding joining one or more of agreement currently administered by WP 29 to be taken in the future. India has now also joined the 1998 Agreement under the aegis of WP 29 in November, 2005. While deciding to join this forum, the Government also approved setting up of a Standing Committee to deal with matters related to WP 29 under the Ministry of Road Transport and Highways. The department of Heavy Industry is also a member of the same. The WP-29 secretariat is housed in ARAI, an autonomous agency under DHI.
B.3. The Department of Heavy Industry: The Department of Heavy Industry is the nodal department for the Automotive Sector in India. While key policies impacting the sector like the fiscal policy, trade policy, fuel policy, emission and safety elated policies are framed by other departments of the government, DHI is actively involved in framing of these policies related to the auto sector through participation in the various committees and by making the recommendations for the fiscal policy, trade policy, emission and safety related policy. The department is also the nodal department for the automobile testing, R&D and homologation infrastructure in the country. It is at present implementing the largest government investment in automotive testing, R&D and homologation infrastructure through NATRiP project at a cost of RS 1718 crores. The department has laid down the vision for the sector through the Automotive Mission Plan 2006-16 that was launched by the Hon’ble PM in 2007. This was prepared in consultation with all the stakeholders.
a. Assessment of the Department’s strengths and weaknesses:
i. Strengths: 1. The automotive testing, R&D and homologation institutes/
organizations are also under the administrative control of DHI. 2. DHI is executing the largest state of the art automotive
infrastructure project at the cost of Rs 1718 cores to create the various centers of excellence in automotive testing and R&D through NATRiP.
3. The department has created a highly specialized and technical pool of experts in NATRiP implementation body who can assist the department in technical matters.
4. NATRiP execution has also given the department expertise and technical knowledge about the sector.
5. The department has a very active and fruitful collaborative functioning with the industry associations and the other key stakeholder ministries through the Development Council for Automotive & Allied Industries (DCAAI) and other inter ministerial forums created by DHI.
6. The department has created a strong international collaboration with the important automobile manufacturing countries like Germany and Japan.
7. The department of Heavy Industries is actively involved in all the global forums relating to the auto sector like the WP-29 and its
48
sub committees and the WTO. In fact JS (S), in-charge of auto sector is also the Chairman of the Informal group on Environmentally Friendly Vehicles under GRPE of WP-29.
ii. Weaknesses: 1. Although, DHI is the nodal department for the automotive sector
however it does not have the final word in some of the key government policies relating to this sector.
2. The department also does not currently have a scheme for the upgradation of technology for the industry it looks after.
3. Presence of multitude of agencies looking after various aspects of automobile sector.
4. Non existence of a central coordination, planning and monitoring agency for the various automotive testing, R&D and homologation centers set up under DHI. One central coordinating technical agency is essential for helping in capacity building for the new centers; establishing healthy competition amongst the various centers under DHI, maintaining required quality of service being offered, benchmarking of facilities and also synergizing their functioning to ensure optimum returns on the investments made by the government. This agency will also help in coordinating, regulating, monitoring and future planning the various automotive testing and homologation work the testing centres under DHI
5. An empowered mechanism for introduction and greater adoption of electric mobility and for encouraging electric manufacturing in the country is currently not in place.
6. Although the department has expertise and technical knowledge about the sector, especially through NATRiP technical experts. However, with the winding up of NATRiP upon completion of the project, it is essential that a central agency that acts as a repository of technical data, domain knowledge and expertise for providing expert advice, technical inputs and secretariat assistance for key future initiatives of DHI for the automotive sector and also for assisting other stakeholder ministries like MoRTH, MoEF in their activities is put in pace.
7. Non existence of a central agency for facilitating and catalyzing
collaborative R&D activities leveraging the state of the art facilities at the centers set up by DHI in partnership and with active involvement of the industry and the academia.
B.4. Development of the learning Grid arising out of the assessment of strengths and weaknesses taking into account the need and criticality: The Department of Heavy Industry is the nodal department for the Automotive Sector in India. In order to accelerate and sustain growth in the automotive sector, the Department in consultation with all stakeholders, the industry, the planners, the academia, and all the concerned central and state authorities. This analysis also dwelt into the strengths, weaknesses, the opportunities and the action required for realizing the vision for the Indian auto Industry. This comprehensive document titled as the “Automotive Mission Plan 2006-16” envisages India to emerge as the destination of choice in the world for the
49
design and manufacture of automobiles and auto components with output reaching a level of US$ 145 Bn accounting for more than 10% of the GDP and providing additional employment to 25 Mn people by 2016. The AMP 2006-16 also made some important recommendations to achieve this vision; these include the following: 1. Manufacture and export of small cars, MUVs, two & three wheelers,
tractors, components to be promoted. 2. Negative list of items and rules of origin for FTAs/RTAs to be followed. 3. Appropriate Tariff Policy will be followed to attract investment. 4. Specific measures will be taken for expansion of domestic market. 5. Incremental Investment of US$ 35-40 Billion in the Automotive Industry
during the next ten years to be encouraged. 6. Exports to be encouraged. 7. Policy initiatives for competitiveness and development of technology
would be taken. 8. National “Road Safety Board” to act as the coordinating body for
promoting safety 9. Inspection and Certification system to be strengthened by
encouraging public private partnership. 10. Fleet Modernization to be encouraged. 11. Implementation of GST should be time bound. 12. National level Automotive Institute for training on automobiles at ITIs
and ATIs to be set up. 13. Centres for automotive manufacturing excellence to be created. 14. Adoption of ITIs and ATIs by OEMs, Tier I component manufacturers to
be encouraged. 15. An Auto Design Centre to be established at NID, Ahmedabad. 16. NATRIP to act as Centre of Excellence for Technical Design Data. 17. Integration of IT in manufacturing and in automotive Infotronics to be
promoted. 18. Infrastructure development around identified automotive clusters to be
undertaken. 19. Closer partnership between Industry, research institution and
academia for innovation and IPR to be encouraged. 20. R&D for product, processes and technology to be incentivized. 21. Continuous investment in road, port, railways and power to be
encouraged. 22. Strive for Labour reforms. 23. Road Map for Auto Fuel Policy beyond 2010 would be drawn. 24. Rationalization of motor vehicle regulations to be undertaken. 25. Setting up of virtual SEZ and Auto Parks for auto component industry
would be considered. ii. The recommendations of the AMP arrived at through extensive stakeholder consultations represent the key areas that need to be addressed and action points for the department and also the various stakeholders. The most significant amongst these are enumerated below: 1. There is a need to bridge the infrastructure gap for the industry to fully
realize its full potential. This include the direct automotive R&D, testing and homologation infrastructure and the general infrastructure required
50
for industrial growth like availability of uninterrupted quality power, roads, ports, rail connectivity etc. Most of this is also outlined in the AMP 2006-16.
2. Facilitate the development of auto clusters and their common facilities. 3. Bridging the Sill Gap. 4. Facilitating collaborative R&D in the automotive sector. Set up the
facilitating structure for this purpose. 5. Facilitate the growth of the various automotive testing and R&D
institutes set up by DHI through setting up a central, coordinating and monitoring agency for these centres.
6. Fund pre-competitive automotive R&D projects in the country. 7. Facilitating adoption of newer more efficient manufacturing
processes, modern plant and machines and greater adoption of latest technology, especially for the auto component sector.
8. Encourage the greater adoption of electric vehicles (Including the full range of hybrids) and manufacturing of electric vehicles in the country. Set up an empowered structure for bringing all stakeholders on one common platform and for ensuring high level ownership by all stakeholders.
9. Creation of a central agency which will be the repository of technical data, domain knowledge and expertise for providing expert advice, technical inputs and secretariat assistance for key future initiatives of DHI for the automotive sector and also for assisting other stakeholder ministries like MoRTH, MoEF in their activities is put in pace.
10. Facilitating automobile design capabilities in the country. 11. Introduction of a vibrant Inspection and Maintenance (Certification)
system for the on the road vehicles in the country. 12. Introduction of end of life standards and processes in the country for
the on the road vehicles. 13. Protect the interest of the Indian automobile sector during various bi-
lateral trade negotiations (FTAs, CEPA, RTAs etc) and also in multilateral forums like WTO.
14. Facilitate International Cooperation between the industry, R&D institutes and the Governments of major automobile manufacturing countries.
15. Further the interest of the domestic Industry in international
automotive bodies like WP-29. 16. Reflect, articulate, propound and recommend the legitimate aspirations
of the Indian automobile Industry in all aspects of government policy formulation including those relating to the fiscal policy, industrial policy, trade policy, safety and emission regulations, fuel policy, energy efficiency standards etc.
17. Facilitate the roll out of Intelligent Transport related systems & projects.
III. Development of Strategy: B.1. Identify the range of possible strategies and the optimal path: The following can be the range of strategies that can be adopted.
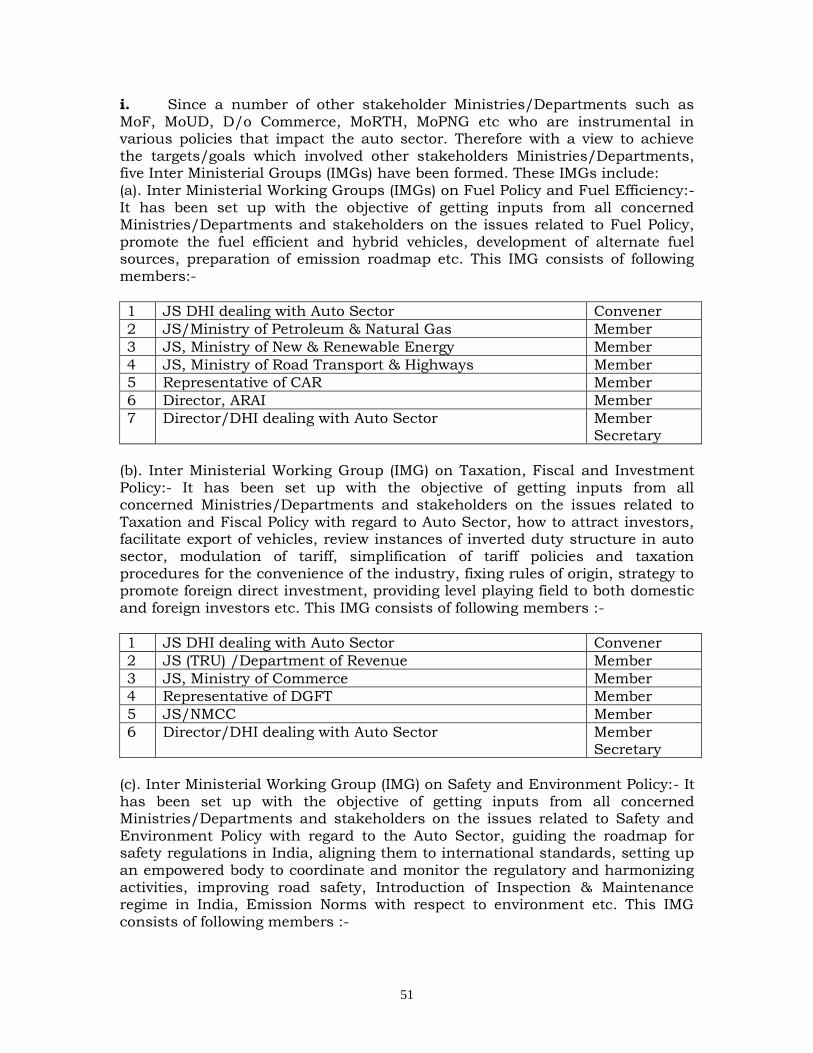
51
i. Since a number of other stakeholder Ministries/Departments such as MoF, MoUD, D/o Commerce, MoRTH, MoPNG etc who are instrumental in various policies that impact the auto sector. Therefore with a view to achieve the targets/goals which involved other stakeholders Ministries/Departments, five Inter Ministerial Groups (IMGs) have been formed. These IMGs include: (a). Inter Ministerial Working Groups (IMGs) on Fuel Policy and Fuel Efficiency:- It has been set up with the objective of getting inputs from all concerned Ministries/Departments and stakeholders on the issues related to Fuel Policy, promote the fuel efficient and hybrid vehicles, development of alternate fuel sources, preparation of emission roadmap etc. This IMG consists of following members:-
1 JS DHI dealing with Auto Sector Convener
2 JS/Ministry of Petroleum & Natural Gas Member
3 JS, Ministry of New & Renewable Energy Member
4 JS, Ministry of Road Transport & Highways Member
5 Representative of CAR Member
6 Director, ARAI Member
7 Director/DHI dealing with Auto Sector Member Secretary
(b). Inter Ministerial Working Group (IMG) on Taxation, Fiscal and Investment Policy:- It has been set up with the objective of getting inputs from all concerned Ministries/Departments and stakeholders on the issues related to Taxation and Fiscal Policy with regard to Auto Sector, how to attract investors, facilitate export of vehicles, review instances of inverted duty structure in auto sector, modulation of tariff, simplification of tariff policies and taxation procedures for the convenience of the industry, fixing rules of origin, strategy to promote foreign direct investment, providing level playing field to both domestic and foreign investors etc. This IMG consists of following members :-
1 JS DHI dealing with Auto Sector Convener
2 JS (TRU) /Department of Revenue Member
3 JS, Ministry of Commerce Member
4 Representative of DGFT Member
5 JS/NMCC Member
6 Director/DHI dealing with Auto Sector Member Secretary
(c). Inter Ministerial Working Group (IMG) on Safety and Environment Policy:- It has been set up with the objective of getting inputs from all concerned Ministries/Departments and stakeholders on the issues related to Safety and Environment Policy with regard to the Auto Sector, guiding the roadmap for safety regulations in India, aligning them to international standards, setting up an empowered body to coordinate and monitor the regulatory and harmonizing activities, improving road safety, Introduction of Inspection & Maintenance regime in India, Emission Norms with respect to environment etc. This IMG consists of following members :-
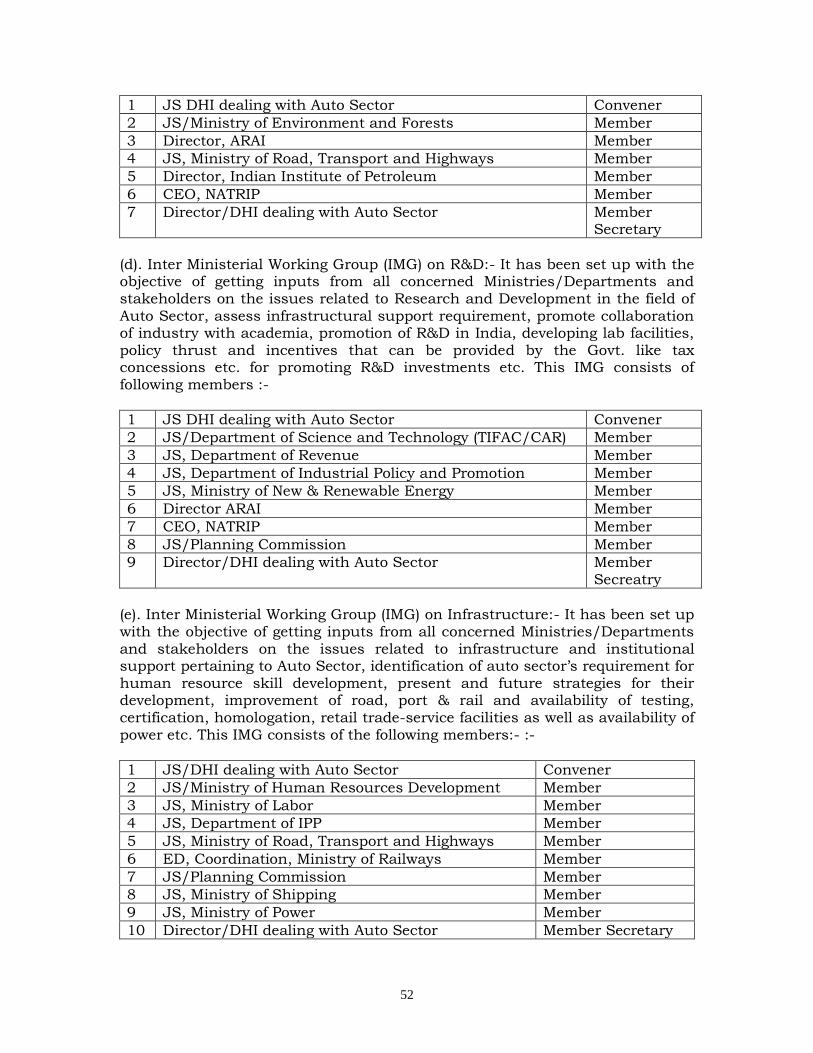
52
1 JS DHI dealing with Auto Sector Convener
2 JS/Ministry of Environment and Forests Member
3 Director, ARAI Member
4 JS, Ministry of Road, Transport and Highways Member
5 Director, Indian Institute of Petroleum Member
6 CEO, NATRIP Member
7 Director/DHI dealing with Auto Sector Member Secretary
(d). Inter Ministerial Working Group (IMG) on R&D:- It has been set up with the objective of getting inputs from all concerned Ministries/Departments and stakeholders on the issues related to Research and Development in the field of
Auto Sector, assess infrastructural support requirement, promote collaboration of industry with academia, promotion of R&D in India, developing lab facilities, policy thrust and incentives that can be provided by the Govt. like tax concessions etc. for promoting R&D investments etc. This IMG consists of following members :-
1 JS DHI dealing with Auto Sector Convener
2 JS/Department of Science and Technology (TIFAC/CAR) Member
3 JS, Department of Revenue Member
4 JS, Department of Industrial Policy and Promotion Member
5 JS, Ministry of New & Renewable Energy Member
6 Director ARAI Member
7 CEO, NATRIP Member
8 JS/Planning Commission Member
9 Director/DHI dealing with Auto Sector Member Secreatry
(e). Inter Ministerial Working Group (IMG) on Infrastructure:- It has been set up with the objective of getting inputs from all concerned Ministries/Departments and stakeholders on the issues related to infrastructure and institutional support pertaining to Auto Sector, identification of auto sector’s requirement for human resource skill development, present and future strategies for their development, improvement of road, port & rail and availability of testing,
certification, homologation, retail trade-service facilities as well as availability of power etc. This IMG consists of the following members:- :-
1 JS/DHI dealing with Auto Sector Convener
2 JS/Ministry of Human Resources Development Member
3 JS, Ministry of Labor Member
4 JS, Department of IPP Member
5 JS, Ministry of Road, Transport and Highways Member
6 ED, Coordination, Ministry of Railways Member
7 JS/Planning Commission Member
8 JS, Ministry of Shipping Member
9 JS, Ministry of Power Member
10 Director/DHI dealing with Auto Sector Member Secretary
53
In addition, the Development Council of Automobile and Allied Industries (DCAAI) has also constituted three Joint Working Groups under the DCAAI to carry ahead and deliberate upon the issues taken up during the DCAAI meeting as well as various recommendations of the AMP 2006-16. These details pertaining to theses JWGs are given as under:
Joint Working Group on Taxation, Fiscal Policy and Trade
Joint Working Group on Emissions, Fuel Policy and Auto Testing
Joint Working Group on Infrastructure, HRD, Auto Designing and AMP related issues
These multi stakeholder forums including foreign companieswill be used for faster resolution of issues and for expediting the implementation of the key initiatives for the sector ii. Facilitate bridging of the infrastructure gaps. iii. To facilitate the adoption of latest technology, manufacturing processes and investments for upgradation of plant and machinery and new facilities in the sector. iv. To facilitate bridging of the skill gaps in the automobile sector. v. Set up of a central coordinating, planning and monitoring agency for the various automotive testing, R&D and homologation facilities which can also facilitate collaborative automotive R&D involving with the industry and the academia. This agency will also be positioned as the repository of technical data, domain knowledge and expertise for providing expert advice, technical inputs and secretariat assistance. vi. Set up of an empowered mechanism for encouraging the greater adoption of electric vehicles (Including the full range of hybrids) and manufacturing of electric vehicles in the country. vii. Explore the possibility of bridging the gaps in automobile design capabilities in the country.In setting up manufacuring facilities in India indigenization in phases will be insisted upon which will ultimately create
base for research in India and promote technology development. viii. Protect the interest of the Indian automobile sector during various bi-lateral trade negotiations (FTAs, CEPA, RTAs etc) and also in multilateral forums like WTO and to facilitate international cooperation in the sector. ix. Reflect, articulate, propound and recommend the legitimate aspirations of the Indian automobile Industry in all aspects of government policy formulation including those relating to the fiscal policy, industrial policy, trade policy, safety and emission regulations, fuel policy, energy efficiency standards etc. x. Facilitate the roll out of Intelligent Transport System and “End of Life” standards in the country.
54
B.2. Develop a detailed Plan to engage the key stakeholders: i. To have regular meetings of the DCAAI and take action on its recommendations. ii. To have the regular meetings of the various Inter Ministerial Groups IMGs and the Joint Working Groups (under DCAAI) set up by the department for implementation of the AMP-2006-16 recommendations. iii. To set up National Automotive Board (NAB) for involving all the stakeholders to gain maximum advantage from the huge investments made by the government for the automobile testing and R&D infrastructure. iv. To set up the National Council for Electric Mobility (NCEM) and the National Board for Electric Mobility (NBEM) to bring on common platform al the stakeholders for encouraging the adoption and manufacturing of electric mobility in the country. v. To interact and closely coordinate with the automobile sector associations viz. SIAM, ACMA and TMA. This includes the pre-budget consultations with the industry for firming up the department’s pre-budget recommendations. vi. To support the efforts and espouse the legitimate aspirations of the automobile industry associations. vii. To organize and also support he industry in organizing workshops/conferences/seminars on issues relating to the industry. B.3. Develop a learning Plan based on the Gap Analysis and Identify Knowledge Partners: i. To facilitate the bridging of the infrastructure gap for the industry including the automotive R&D, testing and homologation infrastructure. ii. To facilitate measures and schemes aimed at Bridging the Sill Gap.
iii. To set up a central automotive agency under DHI for coordinating, planning and monitoring of the automotive test centres under DHI, facilitating
collaborative R&D in the automotive sector and to be the repository of technical data, domain knowledge and expertise for providing expert advice, technical inputs and secretariat assistance for key future initiatives of DHI and also for assisting other stakeholder ministries like MoRTH, MoEF in their activities is put in pace. iv. To facilitate strategies and schemes aimed at promoting adoption by the industry of newer more efficient manufacturing processes, modern plant and machines and latest technology, especially for the auto component sector. v. To set up a high level empowered mechanism with all stakeholders on board for encouraging the greater adoption and manufacturing of electric
vehicles (Including the full range of hybrids) in the country.
55
vi. To take up with the Department of Road Transport (DRT) and Ministry of Petroleum and Natural Gas (MoPNG) the issues of Introduction of a vibrant Inspection and Maintenance (Certification) system for the on the road vehicles in the country and for finalizing the Auto Fuel Policy for the future, beyond 2010.
vii. To protect the interest of the Indian automobile sector during various bi-lateral trade negotiations (FTAs, CEPA, RTAs etc), in multilateral forums like WTO and also in international automotive regulation setting bodies like WP-29.
viii. To facilitate International Cooperation between the industry, R&D institutes and the Governments of major automobile manufacturing countries.
ix. To reflect, articulate, propound and recommend the legitimate aspirations of the Indian automobile Industry in all aspects of government policy formulation including those relating to the fiscal policy, industrial policy, trade policy, safety and emission regulations, fuel policy, energy efficiency standards etc. x. To facilitate the introduction of new initiatives in the area of introduction of end of life standards, roll out of Intelligent Transport Systems and for facilitating creation of automobile design capabilities in the country. B.4. Prioritize the strategies/initiatives/actions taking into account considerations suitability, feasibility and acceptability with the view to achieving aspirations: The following are the range of strategies/initiatives/strategies that are proposed to be adopted. i. Timely competition of the NATRiP project for providing the automobile testing and homologation facilities to the industry. ii. To further facilitate the creation of common facilities for the auto clusters with the central government help through the existing IIUS scheme of the DIPP. Six automobile clusters have already benefitted from this scheme. iii. Support the creation of the Auto Skill Development Council (ASDC) for
bridging the existing and anticipated future skill gaps in the sector: The task of identifying the skill gaps in the automobile industry was undertaken through the specialized group formed during the framing of AMP 2006-16, as per which the industry is expected to require an additional 25 million workforce by 2016. Based on the deliberations held in the Department on various occasions, the Society of Indian Automobile Manufacturers (SIAM) has prepared a Detailed Project Report (DPR). As per this DPR, an Automotive Skill Development Council (ASDC) is envisaged to be set up jointly by SIAM, ACMA and FADA with the help of the DHI. The proposal of ASDC has been approved in principle by NSDC and an initial sum of Rs. 75 lakhs has also been made available for the initial pilot project for the 1st year. iv. Set up of National Council for Electric Mobility (NCEM) and National Board for Electric Mobility (NBEM), empowered mechanisms for encouraging
56
the greater adoption of electric vehicles (Including the full range of hybrids) and manufacturing of electric vehicles in the country: In terms of the recommendations of the Prime Minister’s Group on Technology and on the initiatives taken by National Manufacturing Competitive Council (NMCC), the Department of Heavy industry has been entrusted with the task of finalizing policy recommendations for moving ahead in the field of electric mobility in the country. Based on the various discussions held at NMCC, and inputs obtained from all stakeholders the Department is in the process of obtaining the approval of GoI for setting up of the fully empowered National Council for Electric Mobility (NCEM) and National Board for Electric Mobility (NBEM) at a very senior level with members from all stakeholders and for expeditious implementation of this initiative which will encompass all policy related matters on various issues on a mission mode basis. v. Set up the National Automotive Board (NAB) as the coordinating, planning and monitoring agency for the NATRiP centres under DHI. NAB will facilitate and be the catalyst for fulfilling the important recommendations as envisaged in the AMP. In addition, NAB will also play a pivotal role in the other key future initiatives of the department for the automotive sector. The key functions of NAB are broadly categorized as (i) to help capacity building for the new centres, establish healthy competition amongst the various centres under DHI, maintaining required quality of service being offered, benchmarking of facilities and also synergizing their functioning to ensure optimum returns on the investments made by the government. (ii) For coordinating, regulating, monitoring and future planning the various automotive testing and homologation work the testing centres under DHI. (iii) To be the repository of technical data, domain knowledge and expertise for providing expert advice, technical inputs and secretariat assistance for key future initiatives of DHI for the automotive sector and also for assisting other stakeholder ministries like MoRTH, MoEF in their activities. (iv) Facilitate collaborative R&D activities leveraging the state of the art facilities at these centers in partnership and with active involvement of the industry and the academia. Accordingly, the list of core and other functions sought to be carried out by this body are given in Table – 1 in annex-IV
vi. Explore the possibility of setting up a scheme for the auto component
sector for facilitating adoption of newer more efficient manufacturing processes, modern plant and machines and greater adoption of latest technology. vii. Extend support to the continuation of the UNIDO-ACMA auto component cluster program for developing the skills, processes and managerial capacity of the Indian auto component companies. viii. Set up a central agency which will be the repository of technical data, domain knowledge and expertise for providing expert advice, technical inputs and secretariat assistance for key future initiatives of DHI for the automotive sector and also for assisting other stakeholder ministries like MoRTH, MoEF in their activities is put in pace.
57
ix. Explore the feasibility of setting up the National Automotive Design Institute for developing the automobile design capabilities in the country. x. To expedite the pilot project on “end of Life” and adopt the learning for creation and introduction of end of life standards and processes in the country for the on the road vehicles. xi. Protect the interest of the Indian automobile sector during various bi-lateral trade negotiations (FTAs, CEPA, RTAs etc) and also in multilateral forums like WTO. xii. Facilitate International Cooperation between the industry, R&D institutes and the Governments of major automobile manufacturing countries. xiii. Further the interest of the domestic Industry in international automotive bodies like WP-29. xiv. Reflect, articulate, propound and recommend the legitimate aspirations of the Indian automobile Industry in all aspects of government policy formulation including those relating to the fiscal policy, industrial policy, trade policy, safety and emission regulations, fuel policy, energy efficiency standards etc. xv. Facilitate the roll out of Intelligent Transport related systems & projects. IV. Plan Implementation: B.1. Develop a detailed implementation plan and identify points of coordination and milestones and review points. A. Timely Completion of NATRiP: The various facilities of NATRiP will be completed and will be made available to the industry for use as per the time lines given in Table 2 in annex-IV
B. Constitution of National Automotive Board: The following are the milestones for implementation of this scheme: i. Finalisation and circulation of the Note for the EFC: 30.11.2010
ii. Approval by the EFC: 31.01.2011 iii. Approval of the Cabinet Note: 31.03.2011 iv. Notification of NAB: April, 2011 C. Constitution of National Council for Electric Mobility & National Board for Electric Mobility: The following are the milestones for implementation of this scheme: ii. Internal Approval of the Draft Cabinet Note: 30.11.2010 iii. Approval of the Cabinet Note: 28.02.2011 iv. Notification of the NCEM and NBEM: 15.03.2011 v. Holding of the first meetings of the NCEM and NBEM: 30.06.2011 D. Constitution of the Automobile Skill Development Council: The following are the milestones for implementation of this scheme:
58
i. Finalization of the DPR: September,2010 ii. Approval by the NSDC: October, 2010 iii. Formation of the ASDC Society: January, 2011 iv. Release of DHI portion of funds for ASDC: 2nd Qtr 2011 E. Holding Meetings of the DCAAI, IMGs and JWG of DCCAI: Regular meetings of the DCAAI, IMGs and JWG of DCAAI will be held as under. i. DCAAI - At least twice in a Financial Year. ii. IMGs - At Least five meetings in a financial year. iii. JWG (DCAAI) - At least two meetings in a Financial Year. F. To protect the interest of the Indian automobile sector during various bi-lateral trade negotiations (FTAs, CEPA, RTAs etc), in multilateral forums like WTO and also in international automotive regulation setting bodies like WP-29. i. WP-29 - All meetings – three times in a Financial Year. ii. Informal Gr. on EFV - All meetings – at least three times in a year. iii. WTO - All meetings – at least three times in a year. iv. FTAs/CEPA - Make recommendations from time to time. G. International Cooperation: The third meeting of the Indo-German Joint Working Group (JWG) on automotive sector and its three working sub-groups were constituted on (i) Technology (ii) Commercialization & Framework Development (iii) Institutional Cooperation, Training & Skill Development will be held towards the end of 2010 and beginning 2011. Efforts will be made to sign the Letter of Intent for cooperation between the Netherlands and the Government of India by March 2011. Further, efforts will be made to sign the Letter of Intent (LoI) for cooperation between the governments of India and the Netherlands. H. Extend support to the continuation of the UNIDO-ACMA auto component cluster program: Release of funds within three months of approval of the scheme by the department. I. To reflect, articulate, propound and recommend the legitimate
aspirations of the Indian automobile Industry in all aspects of government policy formulation including those relating to the fiscal policy, industrial policy, trade policy, safety and emission regulations, fuel policy, energy efficiency standards etc. – To articulate the views and make recommendations as and when required. B.2. Assess the nature and quantum of resources required to implement the plan: A. Timely Completion of NATRiP: Approved cost of the project is Rs 1718 crores and an escalation of the Rs 570.06 crores is under consideration of the government. B. Constitution of National Automotive Board: The cost of setting up of the Board is Rs 2.02 crores to be met out of automobile Cess.
59
C. Constitution of National Council for Electric Mobility & National Board for Electric Mobility: There is no financial implications in setting up of the D. Constitution of the Automobile Skill Development Council: The department of heavy industry is required to support the body to the tune of Rs 3.3 crores through the Automobile Cess. E. Holding Meetings of the DCAAI, IMGs and JWG of DCCAI: There are no financial implications. F. To protect the interest of the Indian automobile sector during various bi-lateral trade negotiations (FTAs, CEPA, RTAs etc), in multilateral forums like WTO and also in international automotive regulation setting bodies like WP-29: The financial implications for the visits etc is approx 30 lakhs for the participating in WP-29, informal group on EFV and WTO meetings. G. International Cooperation: The financial implication for the visits etc is approx 20. H. Extend support to the continuation of the UNIDO-ACMA auto component cluster program: The department of heavy industry is required to support this initiative to the tune of Rs 3.1 crores per year for three years starting 2010 through the Automobile Cess. I. To reflect, articulate, propound and recommend the legitimate aspirations of the Indian automobile Industry in all aspects of government policy formulation including those relating to the fiscal policy, industrial policy, trade policy, safety and emission regulations, fuel policy, energy efficiency standards etc. – There are no direct financial implications. B.3. Delineate a plan to observe and measure progress through regular review: 1. Regular review meetings in the department against the set target
timelines. 2. Regular meetings of the DCAAI and its sub groups. 3. Regular meetings of the five IMGs. Thrust on niche products India has comparative advantage in two wheeler and small car segment
in automotive. Therefore focus will be enhancing the advantage and exploiting it to the best use for the automotive sector in India
60
In respect of Bharat Heavy Electricals Limited
I ASSESSMENT OF SITUATION B.1. The political, economic, socio-cultural, technological, environment
and legal factors impacting the sectors and CPSEs looked after by DHI would be analyzed and assessed.
Global Business Environment
Then*:
The International Monetary Fund (IMF) projects the world economic growth to accelerate from 4.9 percent in 2005 to 5.1 percent in 2006. The growth is projected to decelerate marginally to 4.9 percent in
2007, but still be above long run average.
Sustained high rates of global growth have absorbed spare capacity and led to some emerging signs of inflationary pressures in a number of advanced economies.
Oil & metal prices have hit new highs. In the backdrop of buoyant GDP growth & rising geo-political tensions in the Middle East, oil prices will remain elevated for the foreseeable future.
Growth in emerging markets and developing countries would remain very strong at 7.3 percent in 2006 and slow only marginally to 7.2 percent in 2007. China would sustain growth around 10 percent, while India and Russia would also continue to grow rapidly.
Now:
Deepening recession since mid-2008 with multiple downwards revisions of growth. Contagion from the developed to emerging and less developed economies.
Global recovery proceeding better than expected. Among emerging and developing economies, emerging Asia leading recovery.
Domestic Economic Environment
Then:
The Indian economy continued to exhibit strong growth in 2006-07. As per CSO, the growth in GDP during 2006-07 is estimated at 9.2 percent as compared to the growth rate of 9.0 per cent during 2005-06. The growth rate of 9.2 percent in 2006-07 has mainly been due to growth rates of over 5 per cent in the sectors of manufacturing, electricity, gas & water supply, construction, trade, hotels, transport & communication etc.
The upswing in the growth observed in the recent years is reflected in the XI plan target of an average annual growth of 9.0 percent. This implies that :
o Industry could grow at 10.5 % while Services grow at 9.9 %
o Implicit growth in Manufacturing Sector is expected around 12 %
Now:
61
Broad-based economic recovery due to rebound in industrial output and resilience of the services sector.
Under the assumption of a normal monsoon and sustained good performance of the industry and services sectors, the Reserve Bank of India has projected real GDP growth for 2010-11 at 8.0 per cent with an upside bias.
As per CMIE, the industrial production in fiscal 2010-11 is expected to rise by 9.2% on the top of 10.4% percent growth registered during 2009-10. The growth is expected to be driven largely by improvement in availability of basic inputs and huge capacity additions.
Investment in infrastructure during the 11th Five Year Plan (2007-12)
is expected to be $514 bn as compared to $226 bn during the 10th Plan. Share of private investment to rise from $50 bn (25%) in the 10th Plan to $165 bn (36%) in the 11th Plan.
Tentative indications for 12th Five Year Plan (2012-17) place the investment in infrastructure at around US $ 1025 billion.
Global Power Generation Scenario
Then:
As per an estimate (by World Energy Outlook 2006), average annual capacity addition globally during the period 2006-15 is expected to be 146 GW (Gas/Oil-40%, Coal-24%, Hydro-17%, Renewables-14% & Nuclear-5%). Thus the demand outlook will remain robust and growth will be driven by a mix.
Internationally, the largest markets for power plant equipment continue to be in the Asia-Pacific Region, North America and Europe.
Increasing environmental concerns and resulting regulations are forcing equipment manufacturers worldwide to focus more on Clean Power with least or zero emissions. Coal with clean technologies will be the preferred choice for new power plant equipment
Now:
The global economic recession that began in 2007 and continued into 2009 has had an unforeseen impact on global energy markets in the near term. As per International Energy Outlook (IEO) 2010, total world marketed energy consumption reduced by 1.2 percent in 2008 and by an estimated 2.2 percent in 2009, due to contraction in economic activities.
Global electricity consumption to rise by 3.2% annually in the period 2010-14 and 3.8% annually in the period 2015-19
Renewables will account for 17% of the generating mix and 12% of the power equipment market for 2010-2014
Nuclear will account for 4% of the generating mix and 5% of the power equipment market for 2010-2014
Gas will account for 37% of the generating mix and 15% of the power equipment market for 2010-2014
62
Transmission will account for 50% of the power equipment market for 2010-2014
Domestic Power Generation Scenario
Then:
A GDP growth of 8-10% in the coming years, would call for a power capacity increase of 10-12% per annum and accordingly, a power capacity addition of 1,50,000 MW has been planned in the next 10 years.
The emergence of Services sector, both in Generation and T&D areas, would provide a number of opportunities in EPC, R&M, O&M,
overhauling, Power Plant Improvement services etc.
The Transmission & Distribution sector is also receiving a greater focus than ever before and is likely to attract investments similar to those in Power Generation. This is parallely being driven by the Distribution Reforms, New Electricity Act, Un-bundling of SEBs etc.
The Industrial growth rate has been on the upswing for the last couple of years, which is reflected in the buoyancy in the economy, triggering growth in captive power business.
Now:
The power sector is poised to remain in a growth trajectory even during XII and XIII Plan periods as the government shifts gears on infrastructure. As a part of the plan to shift to energy-saving technology and lower emissions, the share of thermal projects based on supercritical technology will rise, going forward. Robust demand in the domestic market for power plant equipment will drive intense competition where BHEL intends to retain its leadership position.
Current Installed Capacity is 164,509 MW (31.08.10) with Coal contributing 53.41%.
Capacity Additions Planned include 11th Plan (2007-12): 78,700 MW. Tentative indications for 12th Plan (2012-17):~100,000 MW and 13th Plan (2017-22):~100,000 MW. Share of Nuclear, Hydro & Solar to rise substantially in future
To congregate with the Country’s target of power generation capacity addition of more than 1,75,000 MW by 2017, orders for XI Plan have already been placed with 55% share of BHEL. It is expected that the share of private sector projects and the share of supercritical thermal power projects would be much higher in the XII & XIII Plan periods.
Considering the growing power demand, many domestic companies have announced their intent to tie-up with leading international players from China, Japan, Europe etc. to set up manufacturing bases in the country.
B.2. Identification of key stakeholders, their strengths, capabilities and
influence and methodology of working with them Key stakeholders that the company deals with are: Shareholders,
63
Customers, Suppliers, Employees, and Society. BHEL’s intent is to engage with these stakeholders to such an extent that every stake-holder prefers BHEL to be his preferred destination. EXTERNAL:
Power Sector Business customers
Technology absorption/ establishment of manufacture of supercritical thermal sets.
Technology tie-up for large size hydro and introduction of advance class GTs
Tie-up with project developers & equity participation to leverage
equipment sales to Ultra-Mega/ Large projects
Strategic alliance/ tech. collaboration for higher size nuclear sets
Captive Power Plants customers
Target industrial Boiler segment through a dedicated facility
Strengthen EPC capability
Standardization and weight reduction for cost optimization to remain competitive
Transmission Systems & Products customers
Conventional Substation Business : Tie up for CR Panels and Substation Automation System (SAS).
765 kV substations/ Switchyards : Entering into a Strategic tie up and establish manufacturing/ test facilities for transformers and shunt reactors
HVDC : Joint bidding with an established player to address high power capacity +/- 800 kV line projects.
Transportation Business customers
Electric / DE Loco / EMU/ DEMU Electrics : Tie-up with Railways for
electric locomotive orders considering that CLW can manufacture only 1100 nos. after their capacity expansion.
3 - Phase IGBT Drives for Locos, EMUs & Metros : IGBT drives for D.E. loco and EMU/DEMU through in-house solution with support from established outside agency and for 6000 HP & higher HP electric locos to be attempted with established OEMs
Urban Transportation Rolling Stock (Coaches): Technology tie-up for stainless steel coaches.
Industrial Products & NCES customers
Electrical machines : Expand capacity for meeting market needs and bridge design capability gaps in inverter fed mill motors
64
Compressors : Technology tie-up for enhancing range and tie-up for dual-shaft gas turbines for pipeline compressor needs
Industrial Systems : Develop ISG into a centre for coal & ash handling systems for Power & Steel sectors.
Wind Power Business : Pursue JV approach with target markets as India & a few neighboring countries
Solar Power Business : Marketing arrangements for accessing global market and establish long term linkage of wafers supply
International Business customers
Position BHEL as an effective EPC contractor in international markets
Attempt large projects (coal plants, gas plants, hydro plants, sub-stations) through project partnerships and for product sales (Transformers, Insulators, Valves, Motors, Compressors etc.) adopt distribution networks.
Leverage business through Government of India line of credit
Suitable consortiums for leveraging partner’s strengths in packages like desalination, transmission lines, water intake/outflow systems etc.
Increase international visibility through marketing offices in : Libya, Oman, UAE, Saudi Arabia, Sudan, Egypt, South Africa, Kazakhstan. Further, expand global presence and increase market access through manufacturing JVs/ subsidiaries and M&As.
Spares & Services Business customers
Strengthen existing business group with systems capability in R&M jobs.
Capacity expansion at HERP – centre for spares and revitalize spares set-ups at units and capacity expansions as necessary
INTERNAL:
Human Resources
Reconstitution of Joint Committee
Assessment of ‘Motivational levels’ through appropriate tools and suitable follow up action in areas requiring improvement.
Enhance manpower from 42,800 (as of 01/04/07) to 50,100 (as of 01/04/12) net of retirements/wastages and inductions
Review of HR systems & procedures to meet HRM challenges
Finance
Focus areas for bringing about improvements: Working Capital management; Policies & Procedures; Tax Management; Financial risk management; Audit and Management information process; Budgeting
65
& Monitoring; Accounts and Annual Report
Quality
Enhance maturity level of quality management across all divisions through QMER Maturity Level 4
Adopt CII-EFQM model for business excellence – atleast 3 divisions of BHEL should get the Business Excellence award and all other divisions to reach a minimum score of 500.
METHEDOLOGY OF INTERACTION:
Customer meets and perception surveys
Joint Committee meetings for engaging workers and unions
Investor conferences and meetings for shareholders
Vendor meets for suppliers
Internal communication and review meetings.
B.3. Assessment of Company’s Strengths and Weaknesses
Strength
Experience
o Installed base of more than 100 GW; 2/3 share in India’s total installed base
Manufacturing Prowess
o 15 Manufacturing Units; capability to deliver 15,000 MW p.a. as of Mar’2010; State-of-art mfg facilities for supercritical equipments
Technology Edge
o 70 TCAs till date; 7 ongoing TCAs with global technology leaders; technology absorption & adaption capability to suit local needs e.g. High ash coal
Human Capital
o 46,274 highly committed engineering, technical & managerial human capital base; negligible attrition
Diversified Product Mix
o 180 products under 30 major product groups across power value chain, single source for multiple solutions
Diversified Business Portfolio
o 21-27% business from Industry sector viz. Transportation, Oil & Gas, NCES, Transmission; slated to rise further
Geographical Spread
o Reference in 71 countries
Service & Spares
o Country wide efficient after sales service network & understanding
66
of Indian conditions
Sustained Financial Performance
o Making profits since 1971-72; above industry average profitability; negligible debt; strong reserves
International Accreditations
o International quality accreditations (ISO-9000:2000, ISO-14001, OHSAS-18001, ISO-27001 for ISMS, API, ASME, Lloyds etc.)
Weakness
PSU Structure
o Limited autonomy, multiple audits, CVC, RTI etc deterrent for effective managerial decision-making
Intensive Working Capital Requirements
High levels of Debtors & Inventory
Low Employee Productivity
Poor record of Projects Management and Project Deliveries
Large quantum of experienced personnel retiring
B.4. Development of learning grid arising out of the assessment of Strengths and Weaknesses taking into account the need and criticality
Following are five critical areas identified out of assessment of Strengths and Weaknesses 1. Timely Project Delivery
2. Capacity Expansion to 20,000 MW
3. Product Cost Competitiveness and Quality
4. Diversification
5. Engineering and Technology
II. DEVELOPMENT OF STRATEGY B1. Identify the range of possible strategies and the optimal path
The following can be possible strategies
Have suitable product capabilities including manufacturing capacities and technologies
Prepare the organization for competition through quality, low cost operations and efficiencies
Enhance manufacturing capacity to 15,000 MW p.a. by Mar’10 and to 20,000 MW p.a. by Mar’12.
Assess and build enabling HRM & Financial Management
Technology absorption/ establishment of manufacture of supercritical thermal sets.
Technology tie-up for large size hydro and introduction of advance class GTs
Adopting measures for reducing cycle times and bringing down costs – integrated operations improvement programme
67
Tie-up with project developers & equity participation to leverage equipment sales to Ultra-Mega/ Large projects
Strategic alliance/ tech. collaboration for higher size nuclear sets
Strengthen EPC capability in Domestic as well as International markets
Increase international visibility through expanding marketing offices, exporting new products in existing markets or existing products in new markets.
A judicious mix of acquisition of technologies and leveraging capability to develop product variants
Becoming technologically self reliant in identified products by substantially enhancing R&D efforts. Further, attain technology leadership in selected products.
B2. Develop a detailed plan to engage key stakeholders
Customer satisfaction is one of the most important aspects. Make all efforts for continuous improvement through constant interaction with customers and by capturing their perception.
Carry formal customer satisfaction survey to measure their satisfaction, requirements and loyalty.
To have regular meetings of Management committee to review both sort term and long term aspects related to the company
Cascading of 5 year milestones to yearly MoU & company level BSC
Plan vendor meets and engage investors through specific conferences and meetings.
Engage workers and unions through the aegis of Joint Committee meetings.
Engage the society through CSR targeted interventions.
B3. Develop a learning Plan based on Gap Analysis and identify Knowledge partners
Reviewing of Training & development system
Gap analysis between the desired state and current practices in all remaining Units
Regular review of systems for Education, Housing, Medical etc
Reviewing the systems for Communication & participation
B4. Priorities strategies/initiatives/actions taking into consideration suitability, feasibility and acceptability with a view to achieving aspirations
Pursue strategic alliance/ tech. collaboration
Augment Manufacturing capacity in phases
Business Mix: Power Sector = 70%, Industry Sector = 30%.
Market Mix : 73% from existing businesses and 27% from new businesses
Assimilate & master manufacturing technology for higher rating power generating sets with supercritical parameters.
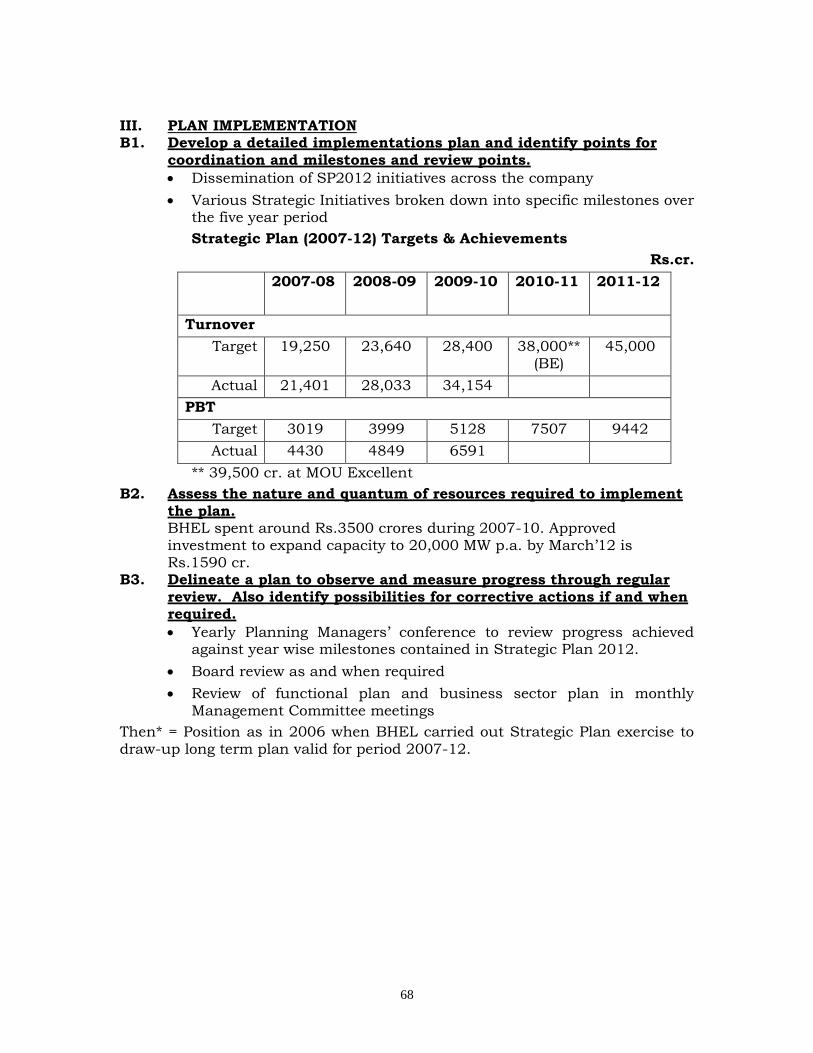
68
III. PLAN IMPLEMENTATION B1. Develop a detailed implementations plan and identify points for
coordination and milestones and review points.
Dissemination of SP2012 initiatives across the company
Various Strategic Initiatives broken down into specific milestones over the five year period
Strategic Plan (2007-12) Targets & Achievements
Rs.cr.
2007-08 2008-09 2009-10 2010-11
2011-12
Turnover
Target 19,250 23,640 28,400 38,000** (BE)
45,000
Actual 21,401 28,033 34,154
PBT
Target 3019 3999 5128 7507 9442
Actual 4430 4849 6591
** 39,500 cr. at MOU Excellent
B2. Assess the nature and quantum of resources required to implement
the plan. BHEL spent around Rs.3500 crores during 2007-10. Approved
investment to expand capacity to 20,000 MW p.a. by March’12 is Rs.1590 cr.
B3. Delineate a plan to observe and measure progress through regular review. Also identify possibilities for corrective actions if and when required.
Yearly Planning Managers’ conference to review progress achieved against year wise milestones contained in Strategic Plan 2012.
Board review as and when required
Review of functional plan and business sector plan in monthly Management Committee meetings
Then* = Position as in 2006 when BHEL carried out Strategic Plan exercise to draw-up long term plan valid for period 2007-12.
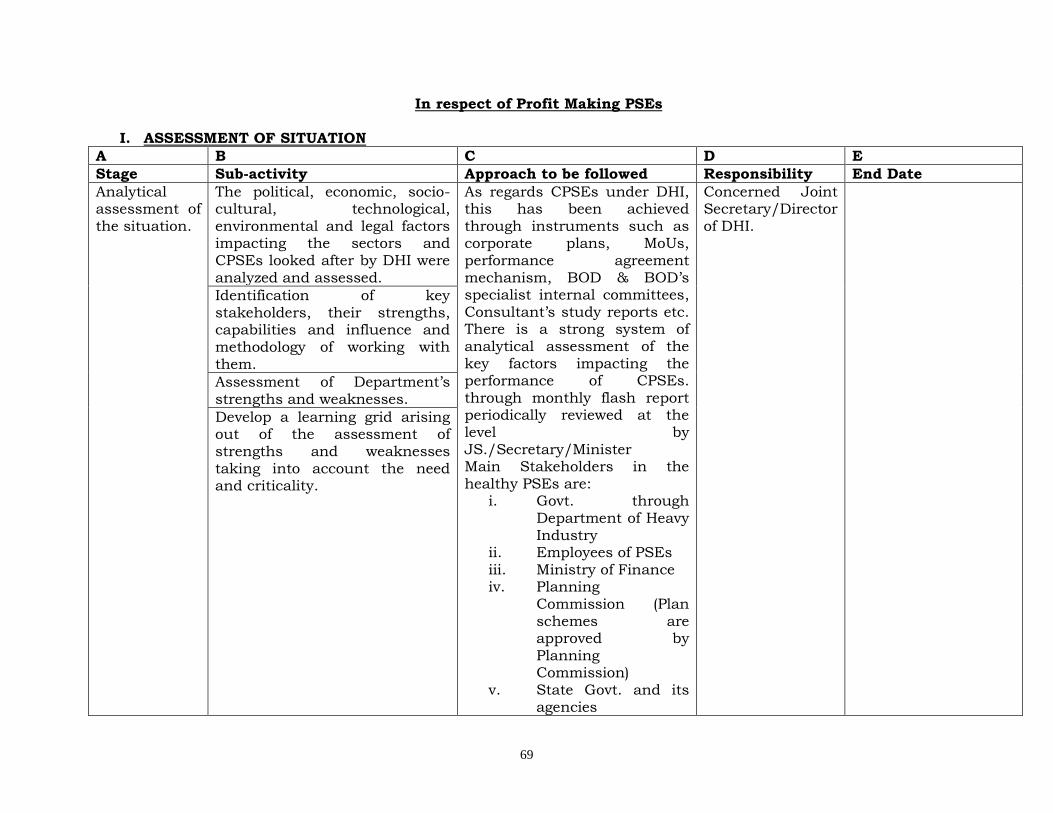
69
In respect of Profit Making PSEs
I. ASSESSMENT OF SITUATION
A B C D E
Stage Sub-activity Approach to be followed Responsibility End Date
Analytical assessment of the situation.
The political, economic, socio-cultural, technological, environmental and legal factors impacting the sectors and CPSEs looked after by DHI were analyzed and assessed.
As regards CPSEs under DHI, this has been achieved through instruments such as corporate plans, MoUs, performance agreement mechanism, BOD & BOD’s specialist internal committees, Consultant’s study reports etc. There is a strong system of analytical assessment of the key factors impacting the performance of CPSEs. through monthly flash report periodically reviewed at the level by JS./Secretary/Minister Main Stakeholders in the healthy PSEs are:
i. Govt. through Department of Heavy Industry
ii. Employees of PSEs iii. Ministry of Finance iv. Planning
Commission (Plan schemes are approved by Planning Commission)
v. State Govt. and its agencies
Concerned Joint Secretary/Director of DHI.
Identification of key stakeholders, their strengths, capabilities and influence and methodology of working with them.
Assessment of Department’s strengths and weaknesses.
Develop a learning grid arising out of the assessment of strengths and weaknesses taking into account the need and criticality.
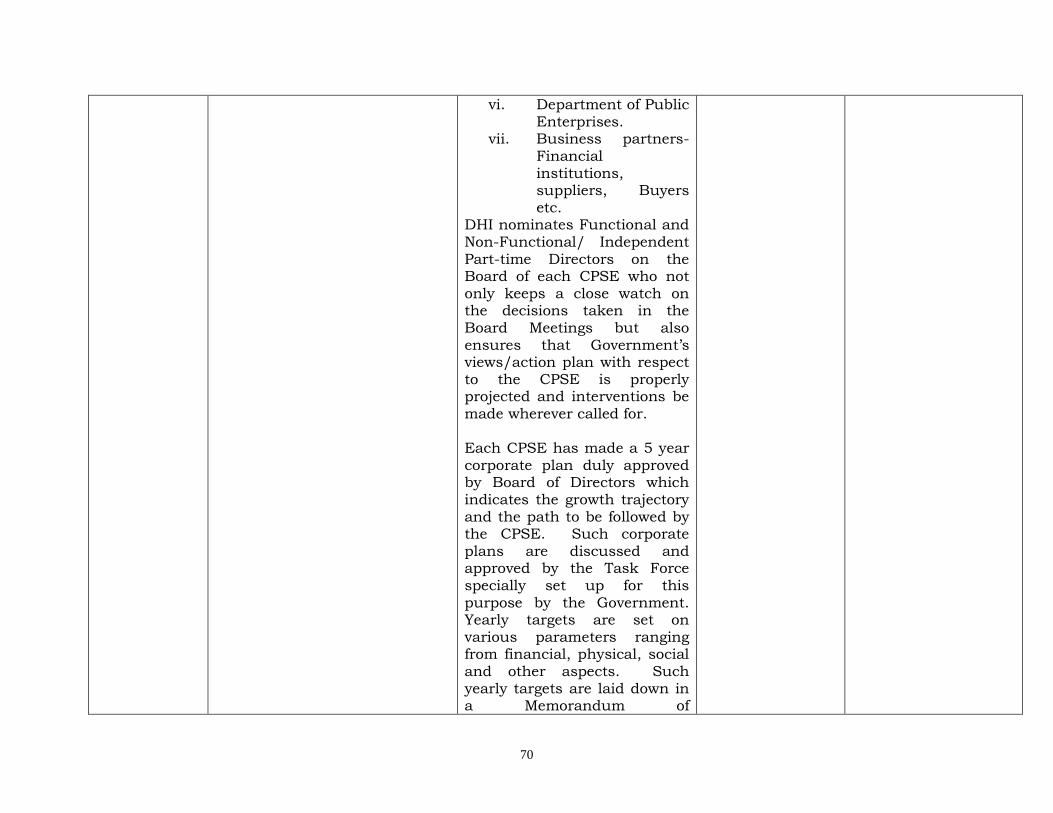
70
vi. Department of Public Enterprises.
vii. Business partners-Financial institutions, suppliers, Buyers etc.
DHI nominates Functional and Non-Functional/ Independent
Part-time Directors on the Board of each CPSE who not only keeps a close watch on the decisions taken in the Board Meetings but also ensures that Government’s views/action plan with respect to the CPSE is properly projected and interventions be made wherever called for. Each CPSE has made a 5 year corporate plan duly approved by Board of Directors which indicates the growth trajectory and the path to be followed by the CPSE. Such corporate plans are discussed and approved by the Task Force
specially set up for this purpose by the Government. Yearly targets are set on various parameters ranging from financial, physical, social and other aspects. Such yearly targets are laid down in a Memorandum of
71
Understanding (MoU) entered into by the CPSE with the DHI. There are 11 CPSEs excluding BHEL which is flagship company of its own genre, which are making profits. As per the MoU targets, these CPSEs have targeted to achieve a top line (turnover) of
Rs. 5400 crores with a bottom line (profit after tax) of Rs. 155 crores in 2009-10. As per the corporate plan, these 11 CPSEs have targeted to achieve a top line of Rs. 12,500 crores and a bottom line of Rs. 1200 crores in the year 2014-15. Actual performance of the CPSE to be compared with such MoU targets in Board Meetings of the company and corrective actions taken wherever required. DHI, at various levels i.e. Director/ Joint Secretary/
Secretary/ MOS/ Minister review performance of each CPSE periodically through extensive discussions so as to keep a close tab on the results of the CPSEs. Assessment of factors
72
impacting the performance of CPSEs is a continuous process. The business dynamics keep on changing, sometimes very fast requiring the CPSE to rise to the occasion and address the challenges suitably and adequately.
DHI continuously gives its support for addressing such issues. DHI to make interventions for technological upgradations of the manufacturing processes, intervening at political level wherever required and spearheading campaigns like energy efficiency and corporate social responsibility. DHI helps in addressing HR issues of the CPSEs. Such issues range from problem of surplus manpower to inadequacy of suitable personnel. DHI provides
financial assistance to the CPSEs to offer VRS to the surplus manpower. The organograms of the CPSEs are discussed and revised in the Board Meetings and DHI to support creation of new posts at the higher level, wherever
73
called for. ` DHI assesses its role and powers continuously and takes up at appropriate level for seeking remedies wherever required. For example grant of Mini Ratna/Navratna/Maharatna
status for devolving greater functional autonomy & decision making powers etc.
74
II. DEVELOPMENT OF STRATEGY
A B C D E
Stage Sub-activity Approach to be followed Responsibility End Date
Strategy to be adopted
Identify the range of possible strategies and the optimal path.
Using the SWOT analysis and the learning grid, delineate all possible strategies in consultation with stakeholders. SWOT ANALYSIS Strength: These PSEs have expertise, strong qualified manpower, unique land resources. Govt. as owner, public finance resource base. Weakness: Technologically poor equipment, High cost of production, overstaffing, marketing problem Opportunity: With the improved economic growth a strong middle income group has emerged which constitute a big market opportunity; Large Scale Govt. spending in infrastructure. Threat: Private players with latest technology and advantages of cost of production
with better marketing strategy pose fierce competition, lowering import duty structure; Threat from, low cost economies. Merger of like PSEs and synergy based support from one PSE to other PSE is key to increase the
Concerned Joint Secretary/Director of DHI.
Develop a detailed plan to engage key stakeholders.
Develop a Learning Plan based on Gap Analysis and identify Knowledge Partners.
Prioritize strategies/initiatives/actions taking into consideration suitability, feasibility and acceptability with a view to achieving aspirations.
75
operations of PSEs. Strategy adopted by DHI ranges from infusion of funds, helping in technological tie ups, taking up the issue of CPSE with various other Departments / State Governments, discussing and approving the expansion plans, processing for
appointment of senior level functionaries, dealing with the vigilance cases of Directors of the CPSEs. DHI supports exploiting inter/intra CPSE Synergy, modernization activities of the CPSEs by providing them funds required for this purpose.
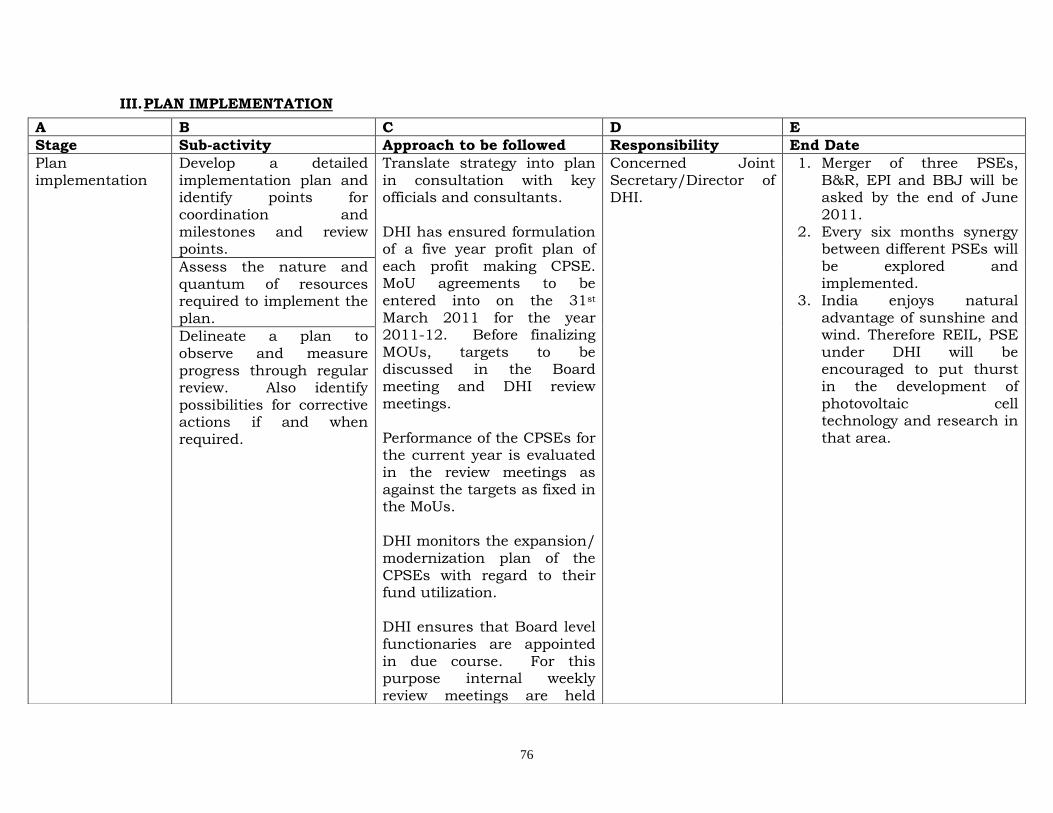
76
III. PLAN IMPLEMENTATION
A B C D E
Stage Sub-activity Approach to be followed Responsibility End Date
Plan implementation
Develop a detailed implementation plan and identify points for coordination and milestones and review points.
Translate strategy into plan in consultation with key officials and consultants. DHI has ensured formulation of a five year profit plan of each profit making CPSE. MoU agreements to be entered into on the 31st March 2011 for the year 2011-12. Before finalizing MOUs, targets to be discussed in the Board meeting and DHI review meetings. Performance of the CPSEs for the current year is evaluated in the review meetings as against the targets as fixed in the MoUs. DHI monitors the expansion/ modernization plan of the
CPSEs with regard to their fund utilization. DHI ensures that Board level functionaries are appointed in due course. For this purpose internal weekly review meetings are held
Concerned Joint Secretary/Director of DHI.
1. Merger of three PSEs, B&R, EPI and BBJ will be asked by the end of June 2011.
2. Every six months synergy between different PSEs will be explored and implemented.
3. India enjoys natural advantage of sunshine and wind. Therefore REIL, PSE under DHI will be encouraged to put thurst in the development of photovoltaic cell technology and research in that area.
Assess the nature and quantum of resources required to implement the plan.
Delineate a plan to observe and measure progress through regular review. Also identify possibilities for corrective actions if and when required.
77
under the chairmanship of SHI. DHI undertakes exercise to have legislative changes pertaining to CPSEs wherever required.
DHI grants autonomy to the CPSEs whenever they achieve a certain level of performance as laid down in the guidelines issued by the DPE. DHI to implement Govt. guidelines on disinvestment, merger or re-organization etc. based on in depth, critical analysis in a case to case basis.
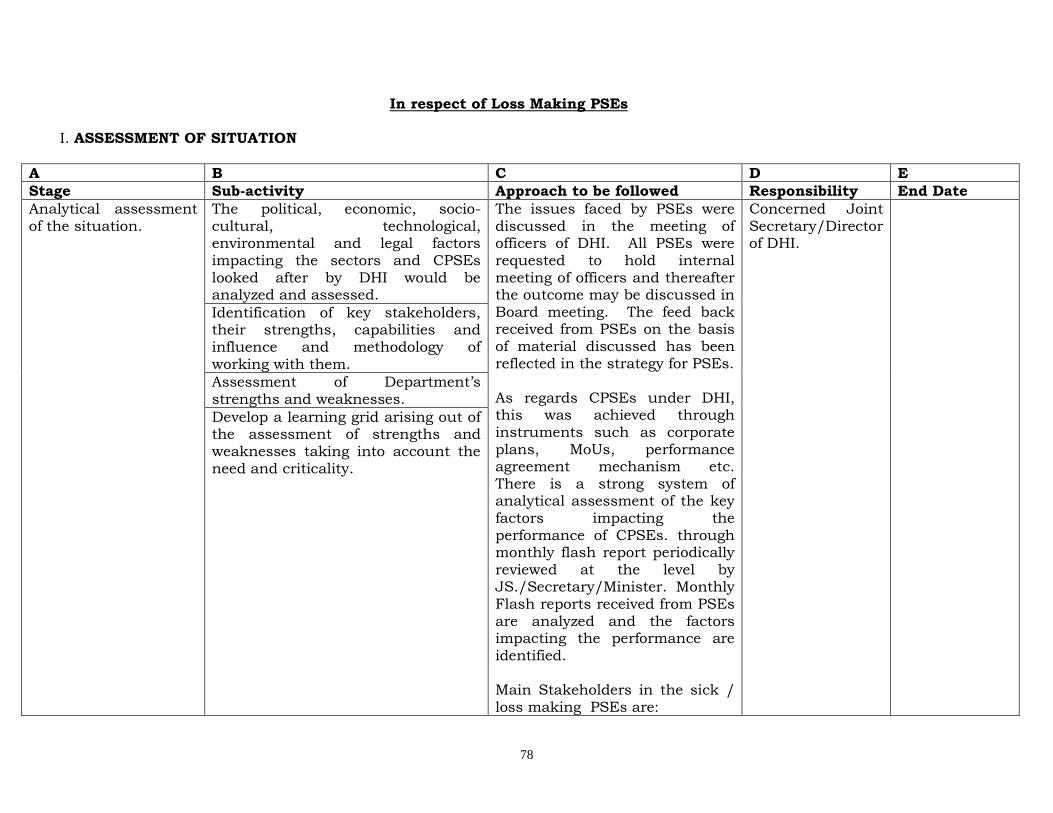
78
In respect of Loss Making PSEs I. ASSESSMENT OF SITUATION
A B C D E
Stage Sub-activity Approach to be followed Responsibility End Date
Analytical assessment of the situation.
The political, economic, socio-cultural, technological, environmental and legal factors impacting the sectors and CPSEs looked after by DHI would be analyzed and assessed.
The issues faced by PSEs were discussed in the meeting of officers of DHI. All PSEs were requested to hold internal meeting of officers and thereafter the outcome may be discussed in Board meeting. The feed back received from PSEs on the basis of material discussed has been reflected in the strategy for PSEs. As regards CPSEs under DHI, this was achieved through instruments such as corporate plans, MoUs, performance agreement mechanism etc. There is a strong system of analytical assessment of the key factors impacting the performance of CPSEs. through monthly flash report periodically reviewed at the level by JS./Secretary/Minister. Monthly Flash reports received from PSEs are analyzed and the factors impacting the performance are identified. Main Stakeholders in the sick / loss making PSEs are:
Concerned Joint Secretary/Director of DHI.
Identification of key stakeholders, their strengths, capabilities and influence and methodology of working with them.
Assessment of Department’s strengths and weaknesses.
Develop a learning grid arising out of the assessment of strengths and weaknesses taking into account the need and criticality.
79
viii. Govt. through Department of Heavy Industry
ix. Employees of PSEs x. Ministry of Finance xi. Planning Commission
(Plan schemes are approved by Planning Commission)
xii. State Govt. and its agencies
xiii. Department of Public Enterprises.
xiv. Board for Industrial and Financial Reconstruction
xv. Board for Reconstruction of Public Sector Enterprises
xvi. Bankers xvii. Financial institutions xviii. Consultants
DHI nominate Part-time Director on the Board of each CPSE who not only keeps a close watch on the decisions taken in the Board
Meetings but also ensures that Government’s views/action plan with respect to the CPSE is properly projected and interventions be made wherever called for. Each CPSE would make a 5 year
80
corporate plan duly approved by Board of Directors which indicates the growth trajectory and the path to be followed by the CPSE. Such corporate plans to be discussed and approved by the Task Force specially set up for this purpose by the Government. Yearly targets to
be set on various parameters ranging from financial, physical, social and other aspects. Such yearly targets to be laid down in a Memorandum of Understanding (MoU) entered into by the CPSE with the DHI. Actual performance of the CPSE to be compared with such MoU targets in Board Meetings of the company and corrective actions be taken wherever required. There are 17 CPSEs, which are incurring losses. The approach in such cases is to restructure/ revive these PSEs to reduce the sick and loss making PSEs as also their aggregate losses.
Renowned consultants are appointed through competitive bidding for formulation of appropriate revival plan / strategy to be adopted in re-structuring these PSEs so as to enable them to reduce their losses and become profit making
81
organizations. Out of 15 PSEs which were revived/restructured, 8 PSEs have started making profit. DHI, at various levels i.e. Director/ Joint Secretary/ Secretary/ MOS/ Minister to review performance of each CPSE periodically through
extensive discussions so as to keep a close tab on the results of the CPSEs. Assessment of factors impacting the performance of CPSEs is a continuous process. The business dynamics keep on changing, sometimes very fast requiring the CPSE to rise to the occasion and address the challenges suitably and adequately. DHI to continuously give budgetary support for addressing such issues. DHI approved financial investment plans for technological upgradation of the
manufacturing processes, intervening at political level wherever required and spearheading campaigns Knowledge sharing through Seminars and Workshops. Workshop on Energy Efficiency were held in February 2010 and
82
October 2010 to adopt better practices. DHI to help in addressing HR issues of the CPSEs. Such issues range from problem of surplus manpower to inadequacy of suitable personnel. DHI to provide financial assistance to the CPSEs to offer VRS to the
surplus manpower. The organograms of the CPSEs are discussed and revised in the Board Meetings and DHI to support creation of new posts at the higher level, wherever called for. DHI to assess its role and powers continuously and to take up at appropriate level for seeking remedies wherever required. For example DHI supports by releasing salary and wages to the sick CPSEs and every time it has to go to the Cabinet for re-appropriation of funds already allotted to DHI. To cut down on period involved in seeking such approvals, DHI to take up with
the appropriate authority to devolving powers for such re-appropriation to it.
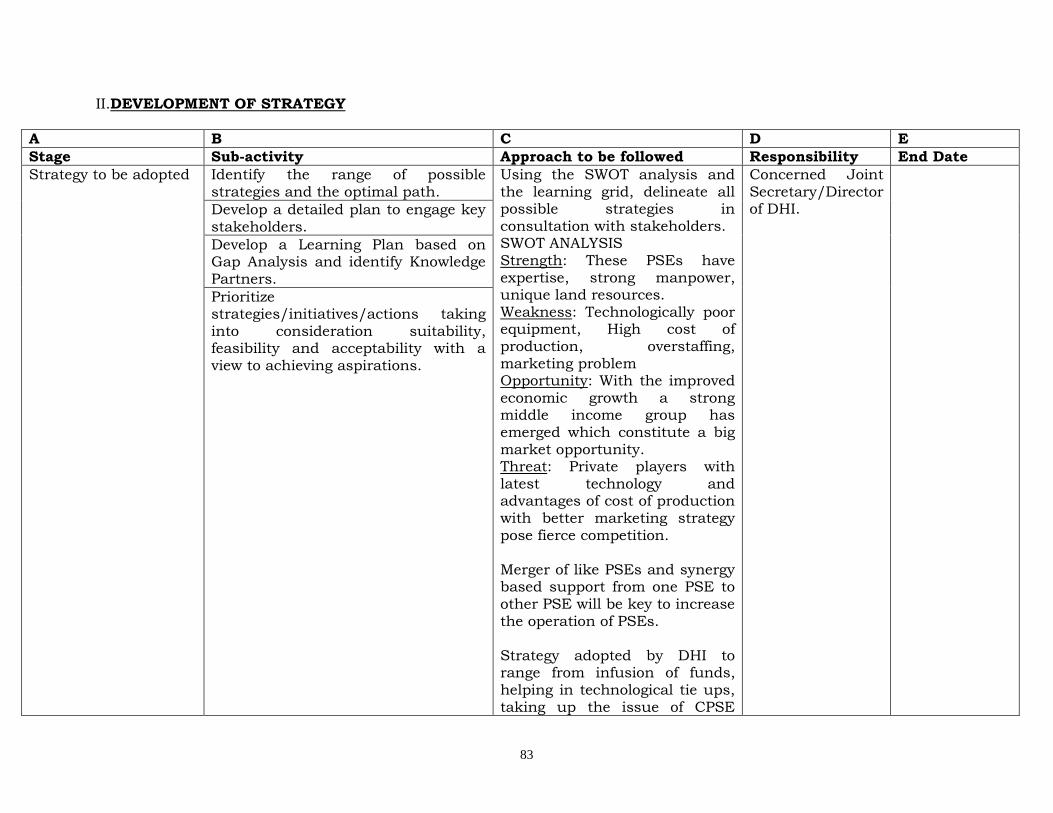
83
III. II.DEVELOPMENT OF STRATEGY
A B C D E
Stage Sub-activity Approach to be followed Responsibility End Date
Strategy to be adopted Identify the range of possible strategies and the optimal path.
Using the SWOT analysis and the learning grid, delineate all possible strategies in consultation with stakeholders. SWOT ANALYSIS Strength: These PSEs have expertise, strong manpower, unique land resources. Weakness: Technologically poor equipment, High cost of production, overstaffing, marketing problem Opportunity: With the improved economic growth a strong middle income group has emerged which constitute a big market opportunity. Threat: Private players with latest technology and advantages of cost of production with better marketing strategy pose fierce competition. Merger of like PSEs and synergy based support from one PSE to other PSE will be key to increase the operation of PSEs. Strategy adopted by DHI to range from infusion of funds, helping in technological tie ups, taking up the issue of CPSE
Concerned Joint Secretary/Director of DHI.
Develop a detailed plan to engage key stakeholders.
Develop a Learning Plan based on Gap Analysis and identify Knowledge Partners.
Prioritize strategies/initiatives/actions taking into consideration suitability, feasibility and acceptability with a view to achieving aspirations.
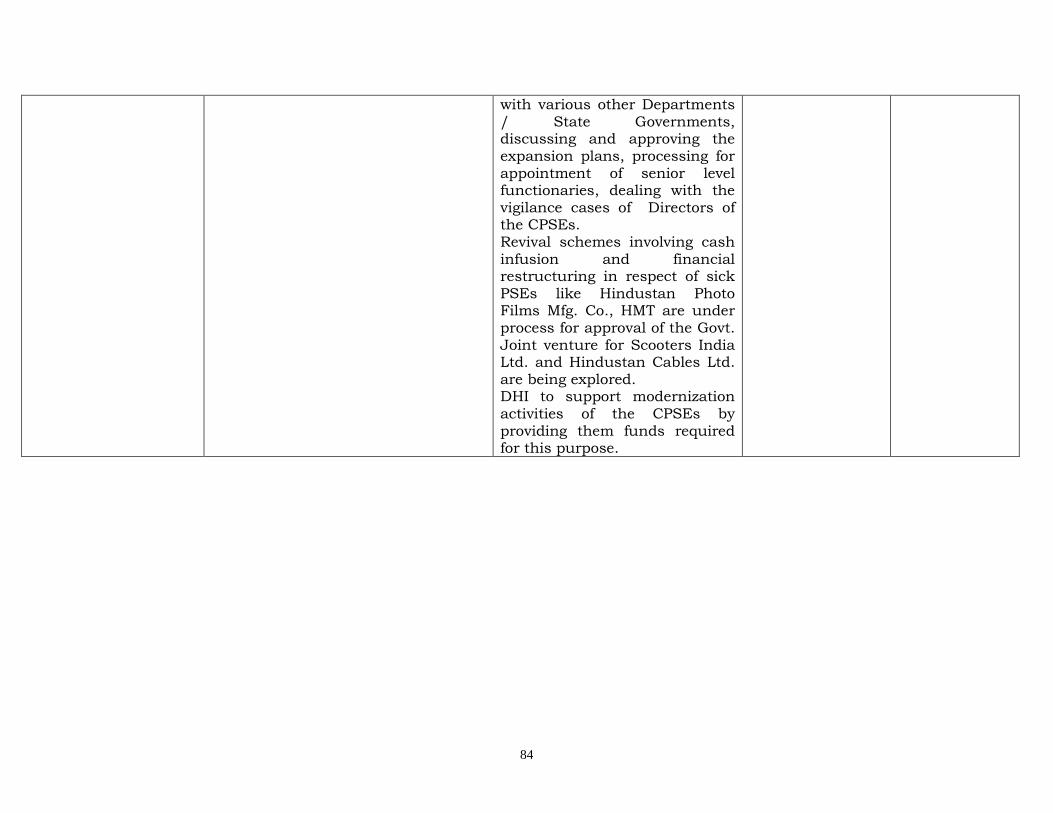
84
with various other Departments / State Governments, discussing and approving the expansion plans, processing for appointment of senior level functionaries, dealing with the vigilance cases of Directors of the CPSEs. Revival schemes involving cash
infusion and financial restructuring in respect of sick PSEs like Hindustan Photo Films Mfg. Co., HMT are under process for approval of the Govt. Joint venture for Scooters India Ltd. and Hindustan Cables Ltd. are being explored. DHI to support modernization activities of the CPSEs by providing them funds required for this purpose.
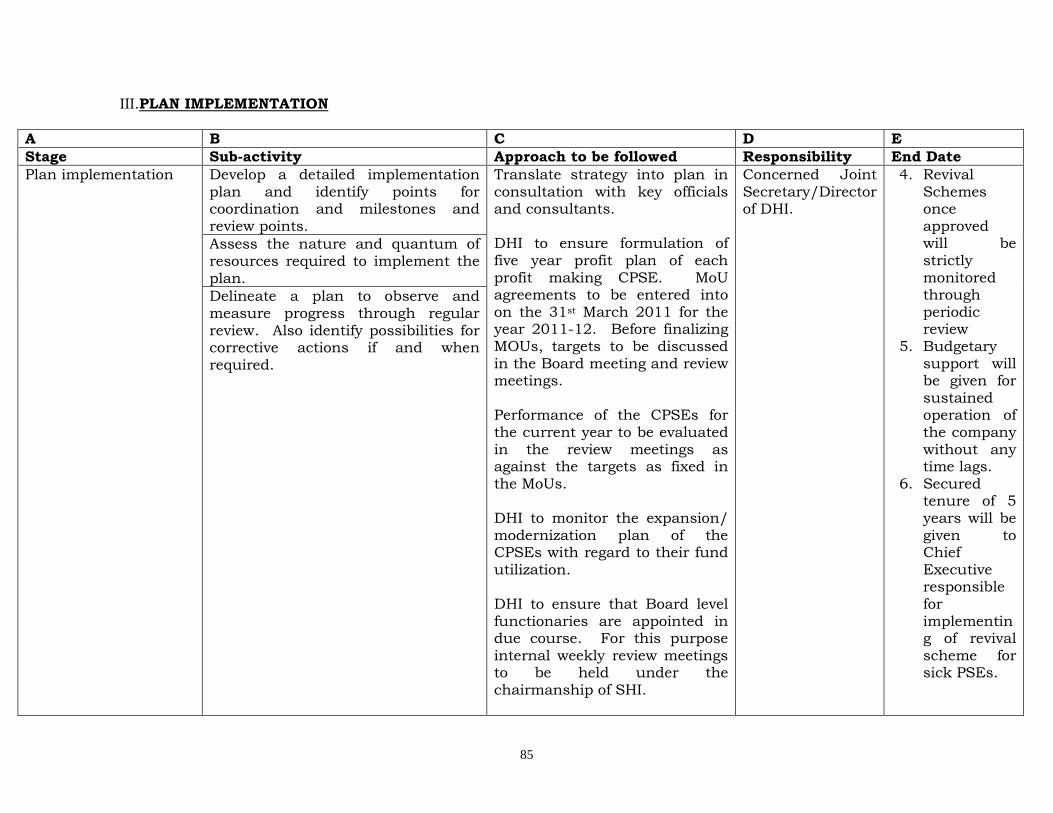
85
III.PLAN IMPLEMENTATION
A B C D E
Stage Sub-activity Approach to be followed Responsibility End Date
Plan implementation Develop a detailed implementation plan and identify points for coordination and milestones and review points.
Translate strategy into plan in consultation with key officials and consultants. DHI to ensure formulation of five year profit plan of each profit making CPSE. MoU agreements to be entered into on the 31st March 2011 for the year 2011-12. Before finalizing MOUs, targets to be discussed in the Board meeting and review meetings. Performance of the CPSEs for the current year to be evaluated in the review meetings as against the targets as fixed in the MoUs. DHI to monitor the expansion/ modernization plan of the CPSEs with regard to their fund utilization. DHI to ensure that Board level functionaries are appointed in due course. For this purpose internal weekly review meetings to be held under the chairmanship of SHI.
Concerned Joint Secretary/Director of DHI.
4. Revival Schemes once approved will be strictly monitored through periodic review
5. Budgetary support will be given for sustained operation of the company without any time lags.
6. Secured tenure of 5 years will be given to Chief Executive responsible for implementing of revival scheme for sick PSEs.
Assess the nature and quantum of resources required to implement the plan.
Delineate a plan to observe and measure progress through regular review. Also identify possibilities for corrective actions if and when required.
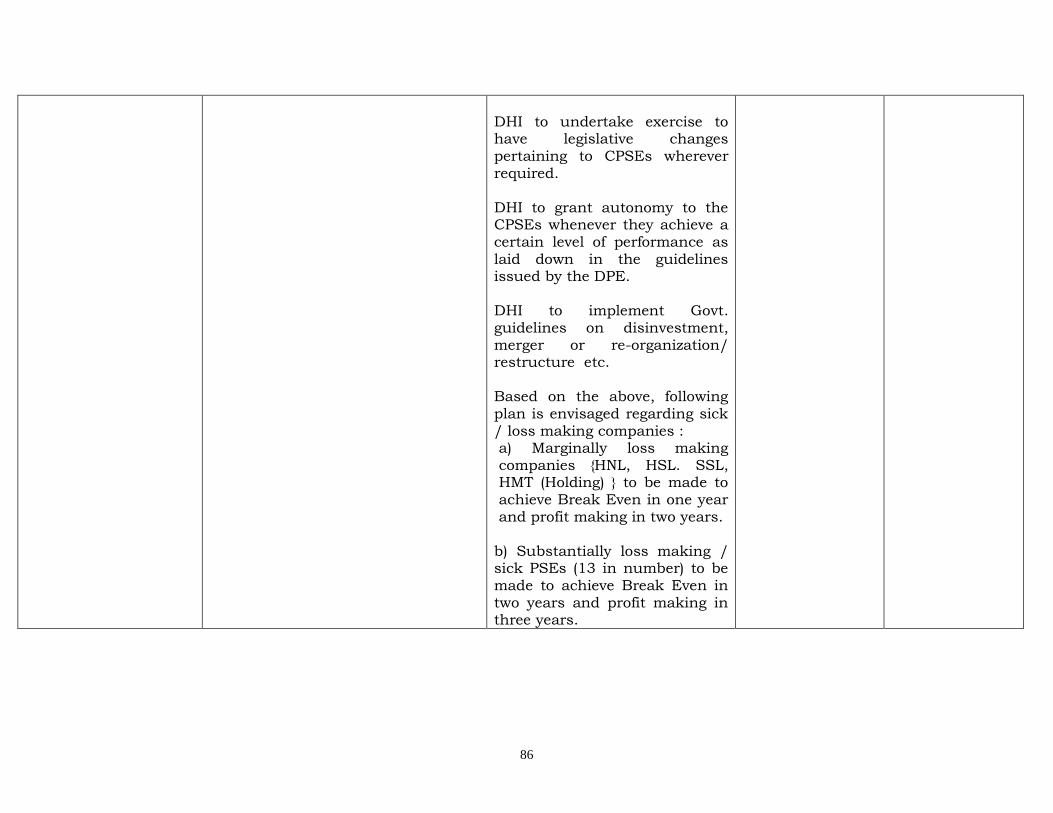
86
DHI to undertake exercise to have legislative changes pertaining to CPSEs wherever required. DHI to grant autonomy to the CPSEs whenever they achieve a certain level of performance as
laid down in the guidelines issued by the DPE. DHI to implement Govt. guidelines on disinvestment, merger or re-organization/ restructure etc. Based on the above, following plan is envisaged regarding sick / loss making companies : a) Marginally loss making companies {HNL, HSL. SSL, HMT (Holding) } to be made to achieve Break Even in one year and profit making in two years.
b) Substantially loss making / sick PSEs (13 in number) to be
made to achieve Break Even in two years and profit making in three years.
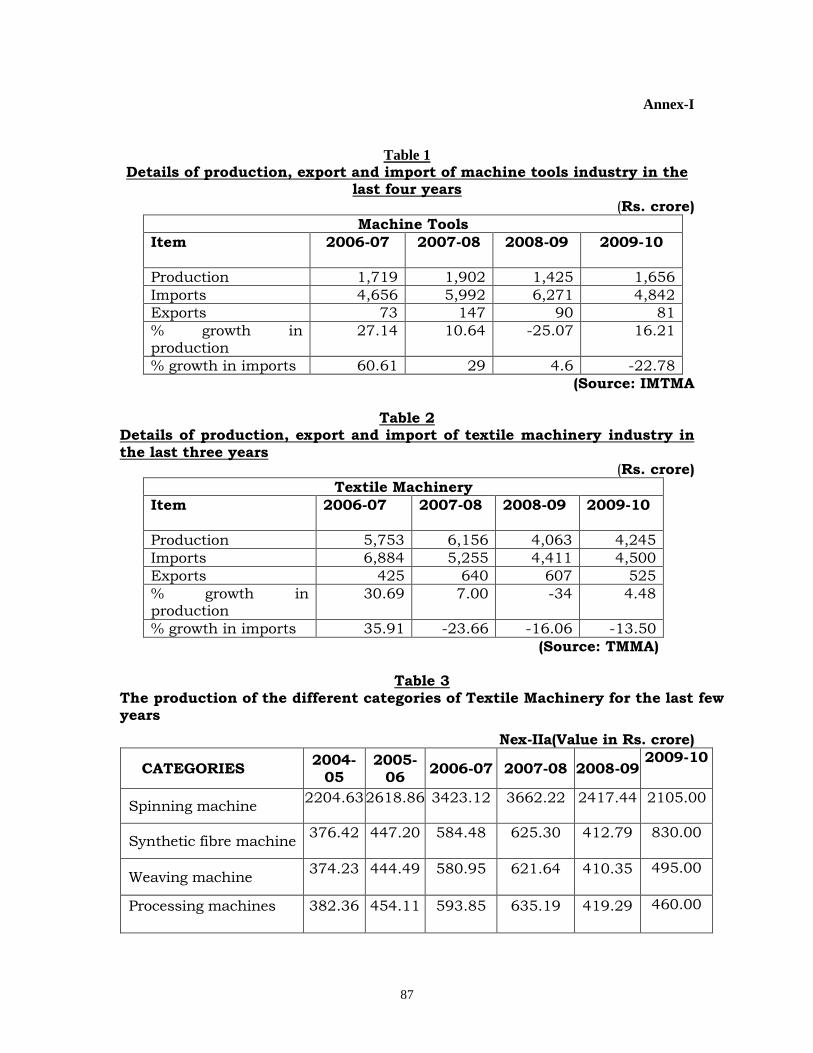
87
Annex-I
Table 1
Details of production, export and import of machine tools industry in the last four years
(Rs. crore)
Machine Tools
Item 2006-07 2007-08 2008-09
2009-10
Production 1,719 1,902 1,425 1,656
Imports 4,656 5,992 6,271 4,842
Exports 73 147 90 81
% growth in production
27.14 10.64 -25.07 16.21
% growth in imports 60.61 29 4.6 -22.78
(Source: IMTMA
Table 2 Details of production, export and import of textile machinery industry in the last three years
(Rs. crore)
Textile Machinery
Item 2006-07 2007-08 2008-09
2009-10
Production 5,753 6,156 4,063 4,245
Imports 6,884 5,255 4,411 4,500
Exports 425 640 607 525
% growth in production
30.69 7.00 -34 4.48
% growth in imports 35.91 -23.66 -16.06 -13.50
(Source: TMMA)
Table 3 The production of the different categories of Textile Machinery for the last few years
Nex-IIa(Value in Rs. crore)
CATEGORIES 2004-
05 2005-
06 2006-07 2007-08 2008-09
2009-10
Spinning machine 2204.63
2618.86
3423.12
3662.22
2417.44
2105.00
Synthetic fibre machine 376.42
447.20
584.48
625.30
412.79
830.00
Weaving machine 374.23
444.49
580.95
621.64
410.35
495.00
Processing machines
382.36
454.11
593.85
635.19
419.29
460.00
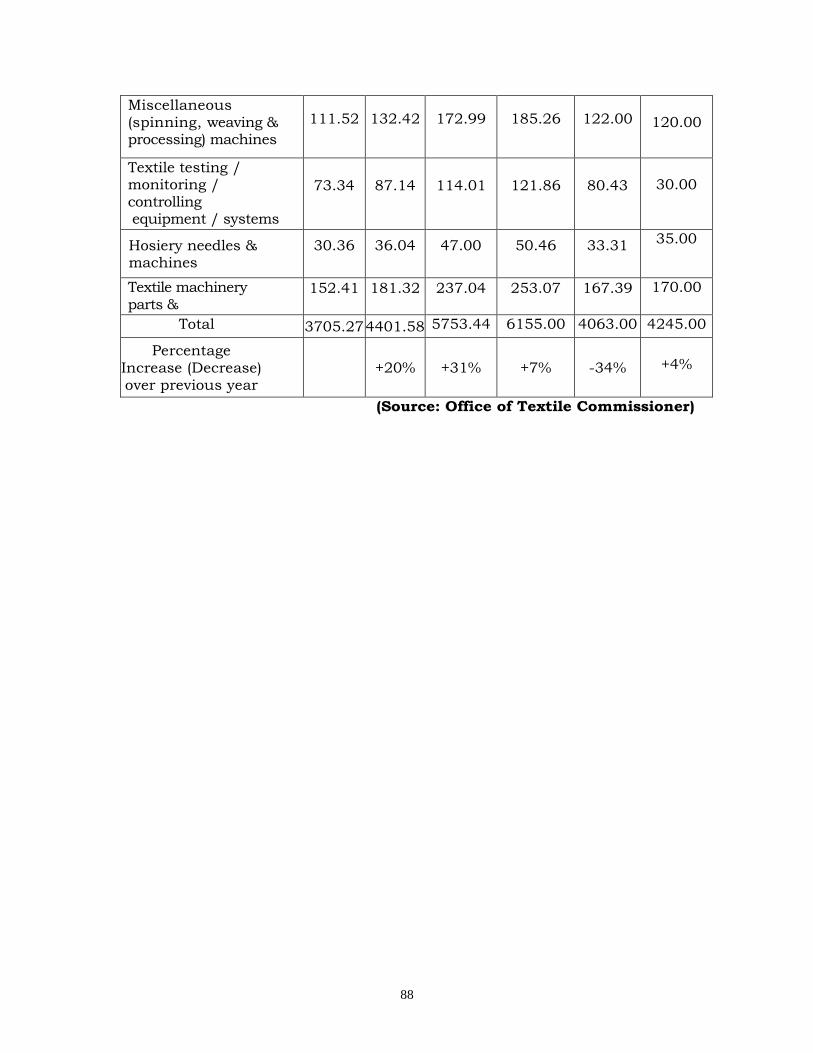
88
Miscellaneous (spinning, weaving & processing) machines
111.52
132.42
172.99
185.26
122.00
120.00
Textile testing / monitoring / controlling equipment / systems
73.34
87.14
114.01
121.86
80.43
30.00
Hosiery needles & machines
30.36
36.04
47.00
50.46
33.31
35.00
Textile machinery
parts & accessories
152.41
181.32
237.04
253.07
167.39
170.00
Total
3705.27 4401.58 5753.44
6155.00
4063.00
4245.00
Percentage Increase (Decrease) over previous year
+20% +31% +7% -34%
+4%
(Source: Office of Textile Commissioner)
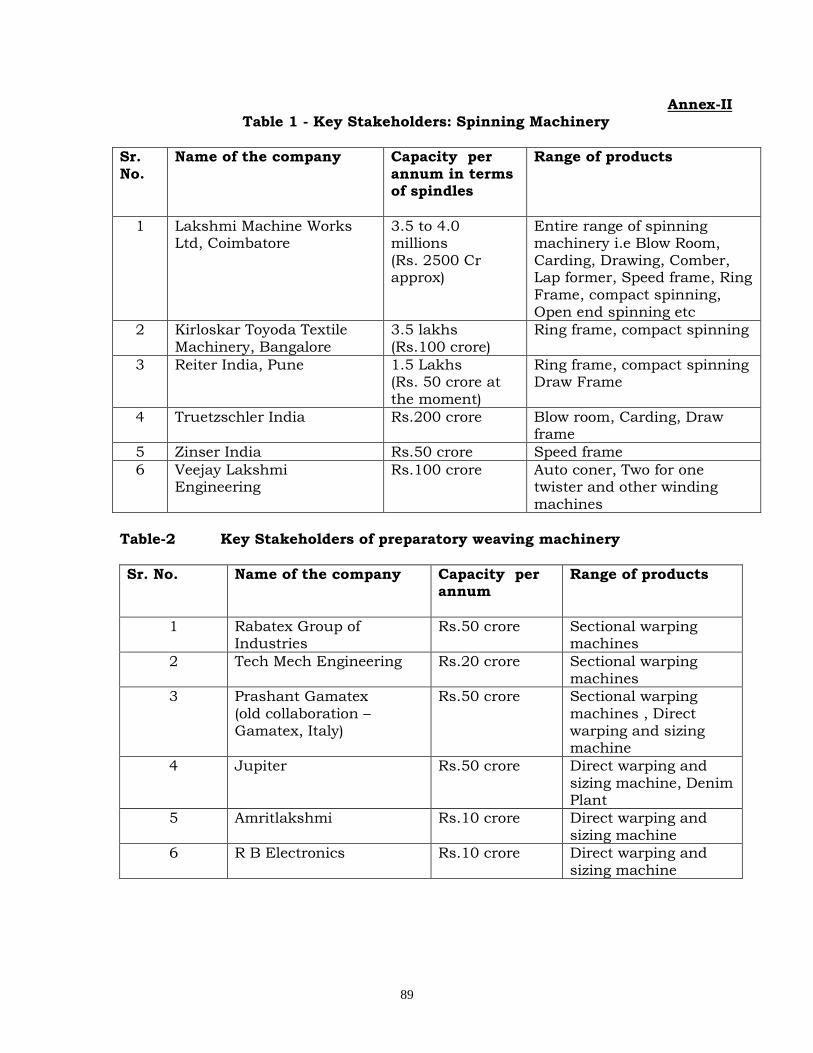
89
Annex-II Table 1 - Key Stakeholders: Spinning Machinery
Sr. No.
Name of the company Capacity per annum in terms of spindles
Range of products
1 Lakshmi Machine Works Ltd, Coimbatore
3.5 to 4.0 millions (Rs. 2500 Cr approx)
Entire range of spinning machinery i.e Blow Room, Carding, Drawing, Comber, Lap former, Speed frame, Ring Frame, compact spinning,
Open end spinning etc
2 Kirloskar Toyoda Textile Machinery, Bangalore
3.5 lakhs (Rs.100 crore)
Ring frame, compact spinning
3 Reiter India, Pune 1.5 Lakhs (Rs. 50 crore at the moment)
Ring frame, compact spinning Draw Frame
4 Truetzschler India Rs.200 crore Blow room, Carding, Draw frame
5 Zinser India Rs.50 crore Speed frame
6 Veejay Lakshmi Engineering
Rs.100 crore Auto coner, Two for one twister and other winding machines
Table-2 Key Stakeholders of preparatory weaving machinery
Sr. No. Name of the company Capacity per annum
Range of products
1 Rabatex Group of Industries
Rs.50 crore Sectional warping machines
2 Tech Mech Engineering Rs.20 crore Sectional warping machines
3 Prashant Gamatex
(old collaboration – Gamatex, Italy)
Rs.50 crore Sectional warping
machines , Direct warping and sizing machine
4 Jupiter Rs.50 crore Direct warping and sizing machine, Denim Plant
5 Amritlakshmi Rs.10 crore Direct warping and sizing machine
6 R B Electronics Rs.10 crore Direct warping and sizing machine
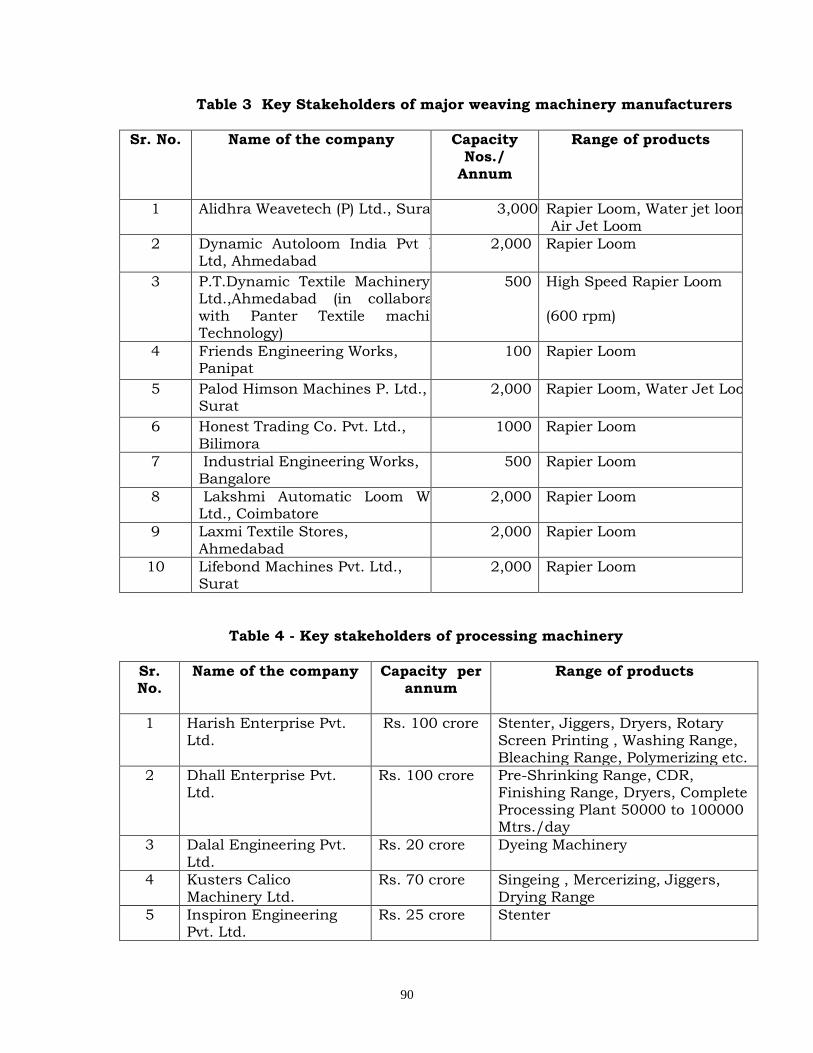
90
Table 3 Key Stakeholders of major weaving machinery manufacturers
Sr. No. Name of the company Capacity Nos./
Annum
Range of products
1 Alidhra Weavetech (P) Ltd., Surat 3,000 Rapier Loom, Water jet loom & Air Jet Loom
2 Dynamic Autoloom India Pvt Ltd., Ltd, Ahmedabad
2,000 Rapier Loom
3 P.T.Dynamic Textile Machinery Pvt Ltd.,Ahmedabad (in collaboration
with Panter Textile machinery Technology)
500 High Speed Rapier Loom
(600 rpm)
4 Friends Engineering Works, Panipat
100 Rapier Loom
5 Palod Himson Machines P. Ltd., Surat
2,000 Rapier Loom, Water Jet Loom
6 Honest Trading Co. Pvt. Ltd., Bilimora
1000 Rapier Loom
7 Industrial Engineering Works, Bangalore
500 Rapier Loom
8 Lakshmi Automatic Loom Works Ltd., Coimbatore
2,000 Rapier Loom
9 Laxmi Textile Stores, Ahmedabad
2,000 Rapier Loom
10 Lifebond Machines Pvt. Ltd., Surat
2,000 Rapier Loom
Table 4 - Key stakeholders of processing machinery
Sr. No.
Name of the company Capacity per annum
Range of products
1 Harish Enterprise Pvt. Ltd.
Rs. 100 crore Stenter, Jiggers, Dryers, Rotary Screen Printing , Washing Range, Bleaching Range, Polymerizing etc.
2 Dhall Enterprise Pvt. Ltd.
Rs. 100 crore Pre-Shrinking Range, CDR, Finishing Range, Dryers, Complete Processing Plant 50000 to 100000 Mtrs./day
3 Dalal Engineering Pvt. Ltd.
Rs. 20 crore Dyeing Machinery
4 Kusters Calico Machinery Ltd.
Rs. 70 crore Singeing , Mercerizing, Jiggers, Drying Range
5 Inspiron Engineering Pvt. Ltd.
Rs. 25 crore Stenter
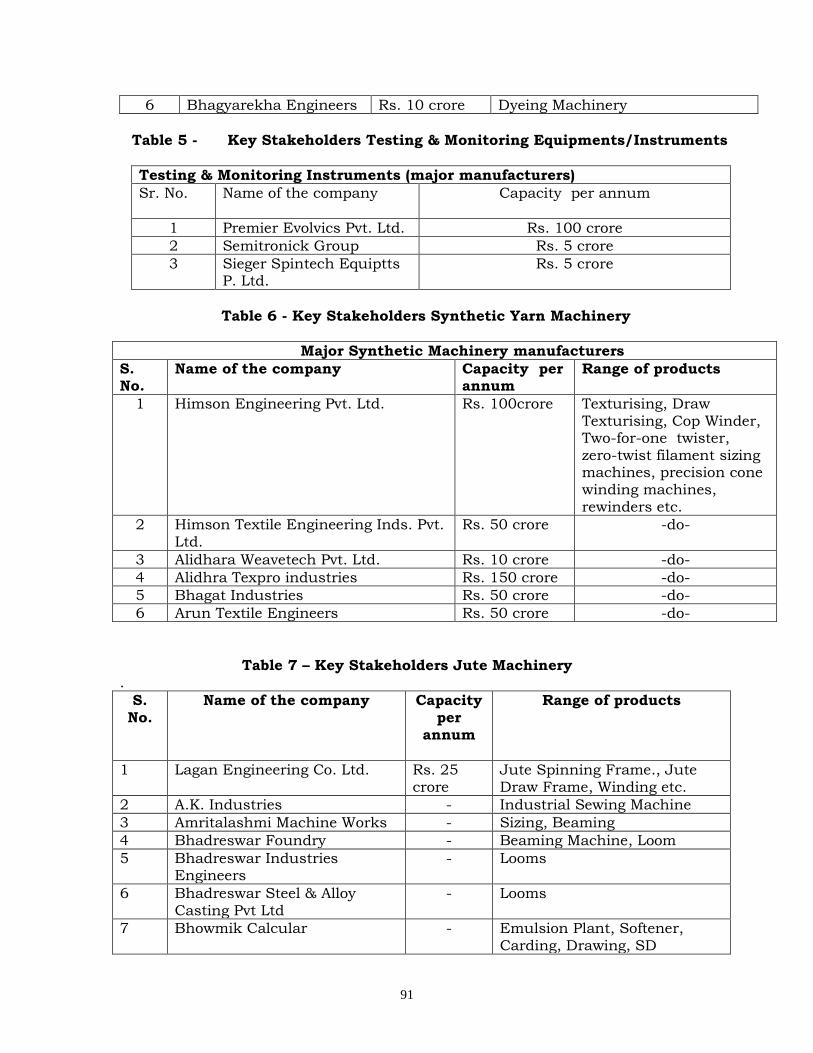
91
6 Bhagyarekha Engineers Rs. 10 crore Dyeing Machinery
Table 5 - Key Stakeholders Testing & Monitoring Equipments/Instruments
Testing & Monitoring Instruments (major manufacturers)
Sr. No.
Name of the company Capacity per annum
1 Premier Evolvics Pvt. Ltd. Rs. 100 crore
2 Semitronick Group Rs. 5 crore
3 Sieger Spintech Equiptts P. Ltd.
Rs. 5 crore
Table 6 - Key Stakeholders Synthetic Yarn Machinery
Major Synthetic Machinery manufacturers
S. No.
Name of the company Capacity per annum
Range of products
1 Himson Engineering Pvt. Ltd. Rs. 100crore Texturising, Draw Texturising, Cop Winder, Two-for-one twister, zero-twist filament sizing machines, precision cone winding machines, rewinders etc.
2 Himson Textile Engineering Inds. Pvt. Ltd.
Rs. 50 crore -do-
3 Alidhara Weavetech Pvt. Ltd. Rs. 10 crore -do-
4 Alidhra Texpro industries Rs. 150 crore -do-
5 Bhagat Industries Rs. 50 crore -do-
6 Arun Textile Engineers Rs. 50 crore -do-
Table 7 – Key Stakeholders Jute Machinery .
S.
No.
Name of the company Capacity
per annum
Range of products
1 Lagan Engineering Co. Ltd. Rs. 25 crore
Jute Spinning Frame., Jute Draw Frame, Winding etc.
2 A.K. Industries - Industrial Sewing Machine
3 Amritalashmi Machine Works - Sizing, Beaming
4 Bhadreswar Foundry - Beaming Machine, Loom
5 Bhadreswar Industries Engineers
- Looms
6 Bhadreswar Steel & Alloy Casting Pvt Ltd
- Looms
7 Bhowmik Calcular - Emulsion Plant, Softener, Carding, Drawing, SD
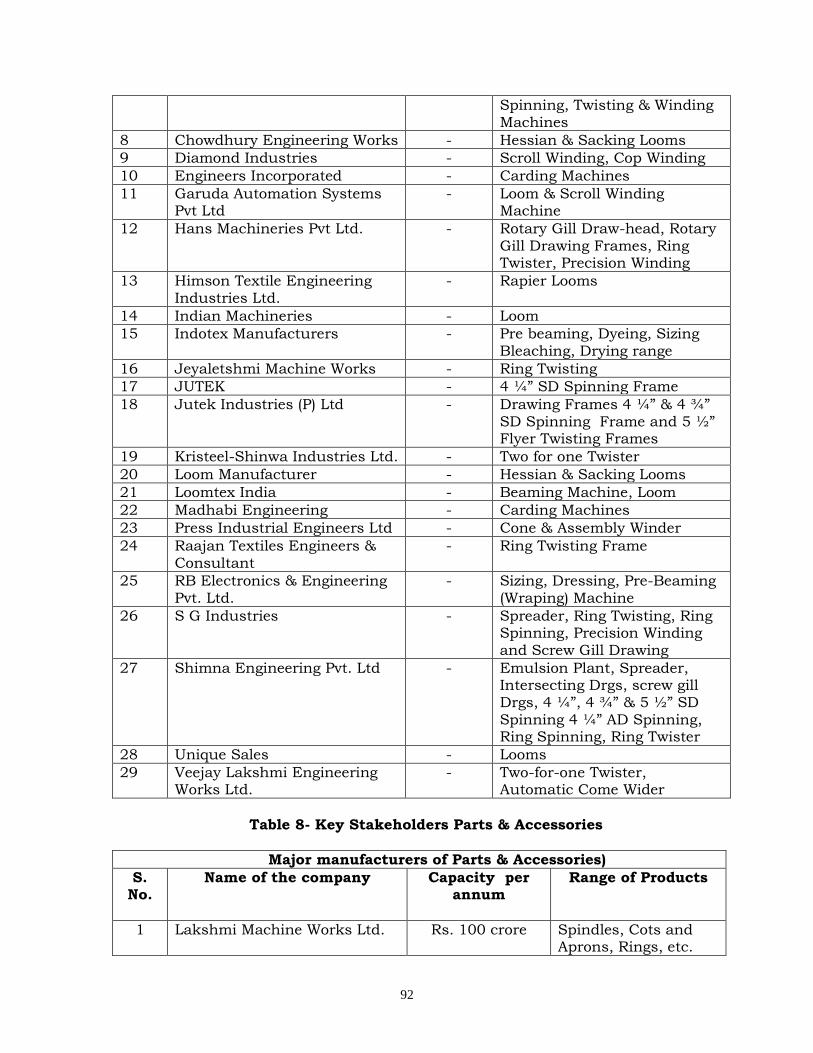
92
Spinning, Twisting & Winding Machines
8 Chowdhury Engineering Works - Hessian & Sacking Looms
9 Diamond Industries - Scroll Winding, Cop Winding
10 Engineers Incorporated - Carding Machines
11 Garuda Automation Systems Pvt Ltd
- Loom & Scroll Winding Machine
12 Hans Machineries Pvt Ltd. - Rotary Gill Draw-head, Rotary Gill Drawing Frames, Ring Twister, Precision Winding
13 Himson Textile Engineering Industries Ltd.
- Rapier Looms
14 Indian Machineries - Loom
15 Indotex Manufacturers - Pre beaming, Dyeing, Sizing Bleaching, Drying range
16 Jeyaletshmi Machine Works - Ring Twisting
17 JUTEK - 4 ¼” SD Spinning Frame
18 Jutek Industries (P) Ltd - Drawing Frames 4 ¼” & 4 ¾” SD Spinning Frame and 5 ½” Flyer Twisting Frames
19 Kristeel-Shinwa Industries Ltd. - Two for one Twister
20 Loom Manufacturer - Hessian & Sacking Looms
21 Loomtex India - Beaming Machine, Loom
22 Madhabi Engineering - Carding Machines
23 Press Industrial Engineers Ltd - Cone & Assembly Winder
24 Raajan Textiles Engineers & Consultant
- Ring Twisting Frame
25 RB Electronics & Engineering Pvt. Ltd.
- Sizing, Dressing, Pre-Beaming (Wraping) Machine
26 S G Industries - Spreader, Ring Twisting, Ring Spinning, Precision Winding and Screw Gill Drawing
27 Shimna Engineering Pvt. Ltd - Emulsion Plant, Spreader, Intersecting Drgs, screw gill Drgs, 4 ¼”, 4 ¾” & 5 ½” SD
Spinning 4 ¼” AD Spinning, Ring Spinning, Ring Twister
28 Unique Sales - Looms
29 Veejay Lakshmi Engineering Works Ltd.
- Two-for-one Twister, Automatic Come Wider
Table 8- Key Stakeholders Parts & Accessories
Major manufacturers of Parts & Accessories)
S. No.
Name of the company Capacity per annum
Range of Products
1 Lakshmi Machine Works Ltd. Rs. 100 crore Spindles, Cots and Aprons, Rings, etc.
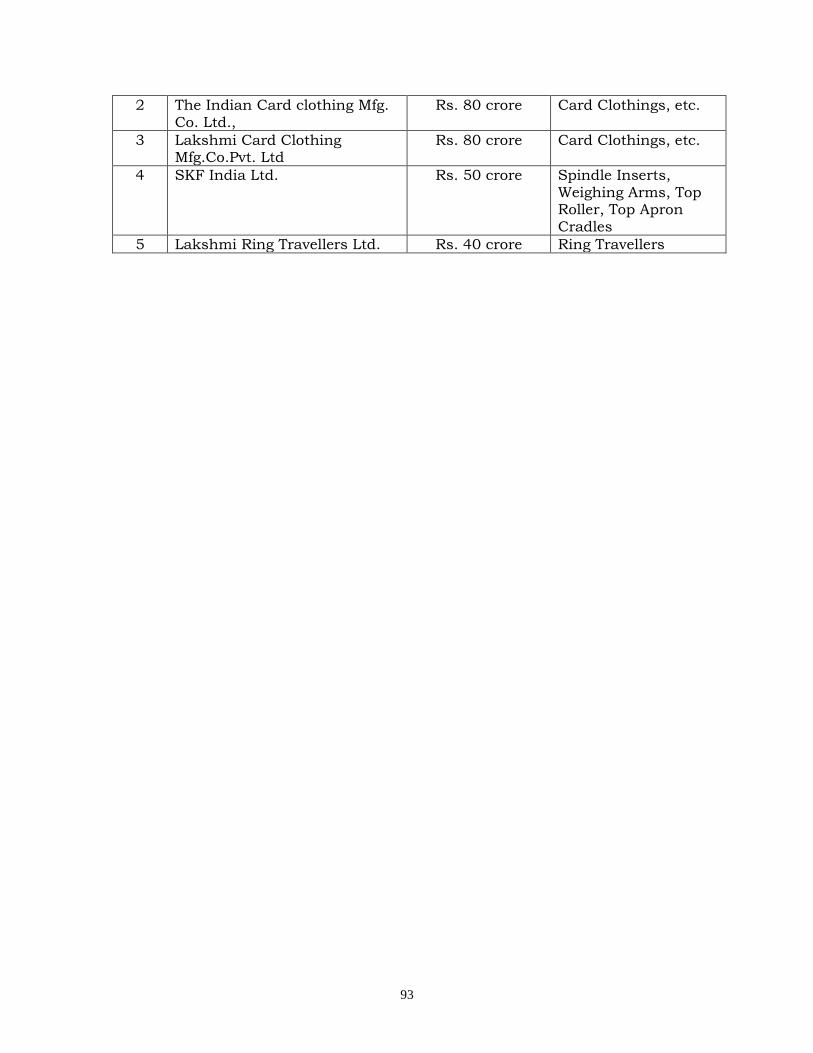
93
2 The Indian Card clothing Mfg. Co. Ltd.,
Rs. 80 crore Card Clothings, etc.
3 Lakshmi Card Clothing Mfg.Co.Pvt. Ltd
Rs. 80 crore Card Clothings, etc.
4 SKF India Ltd. Rs. 50 crore Spindle Inserts, Weighing Arms, Top Roller, Top Apron Cradles
5 Lakshmi Ring Travellers Ltd. Rs. 40 crore Ring Travellers
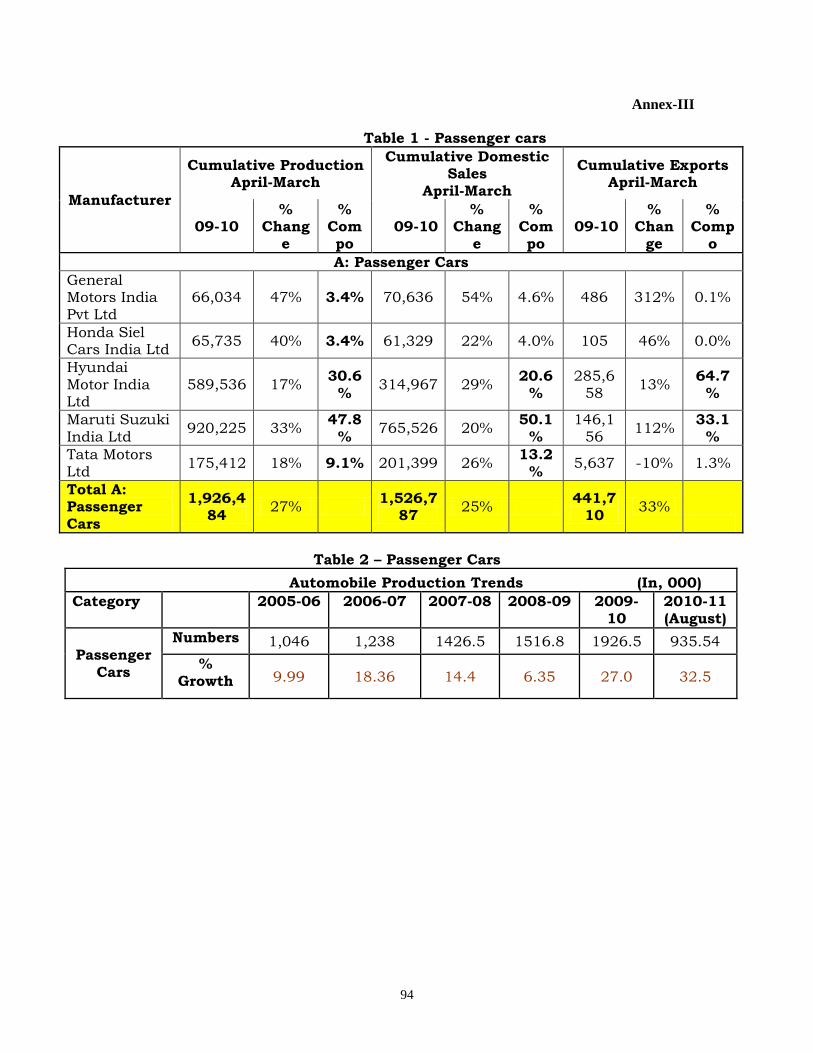
94
Annex-III
Table 1 - Passenger cars
Manufacturer
Cumulative Production April-March
Cumulative Domestic Sales
April-March
Cumulative Exports April-March
09-10 %
Change
% Compo
09-10 %
Change
% Compo
09-10 %
Change
% Comp
o
A: Passenger Cars
General Motors India
Pvt Ltd
66,034 47% 3.4% 70,636 54% 4.6% 486 312% 0.1%
Honda Siel Cars India Ltd
65,735 40% 3.4% 61,329 22% 4.0% 105 46% 0.0%
Hyundai Motor India Ltd
589,536 17% 30.6
% 314,967 29%
20.6%
285,658
13% 64.7
%
Maruti Suzuki India Ltd
920,225 33% 47.8
% 765,526 20%
50.1%
146,156
112% 33.1
%
Tata Motors Ltd
175,412 18% 9.1% 201,399 26% 13.2
% 5,637 -10% 1.3%
Total A: Passenger
Cars
1,926,484
27% 1,526,7
87 25%
441,710
33%
Table 2 – Passenger Cars
Automobile Production Trends (In, 000)
Category 2005-06 2006-07 2007-08 2008-09 2009-10
2010-11 (August)
Passenger Cars
Numbers 1,046 1,238 1426.5 1516.8 1926.5 935.54
% Growth 9.99 18.36 14.4 6.35 27.0 32.5
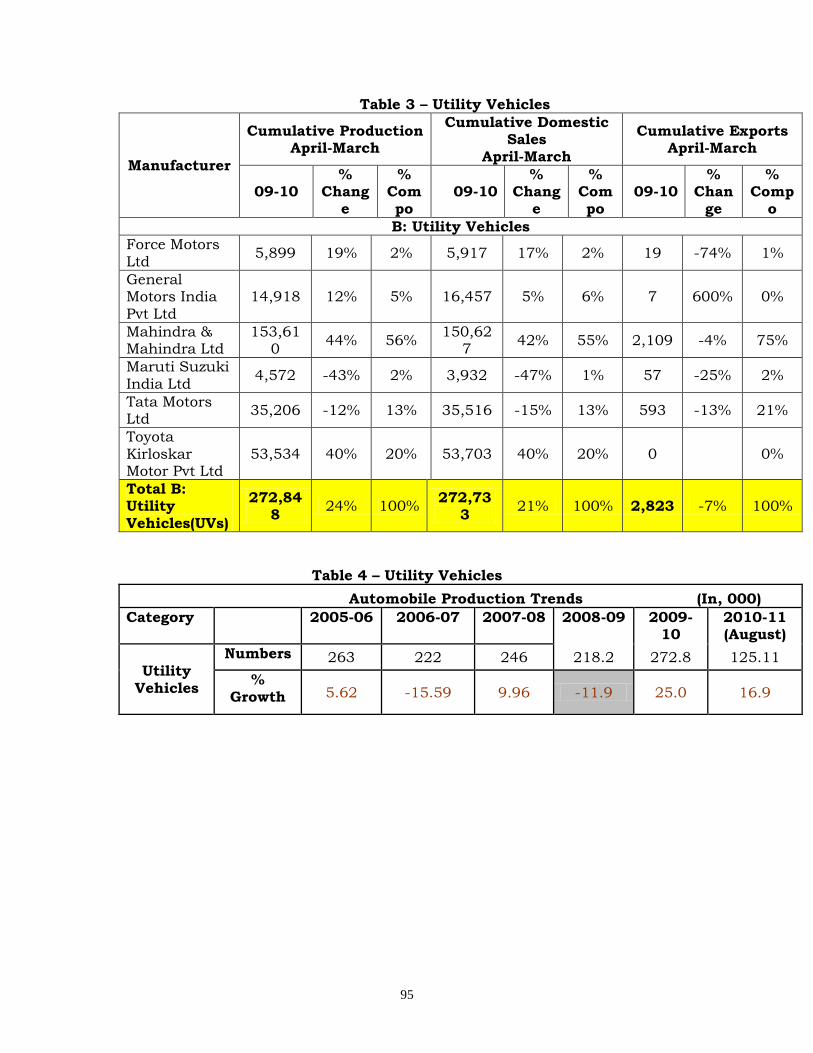
95
Table 3 – Utility Vehicles
Manufacturer
Cumulative Production April-March
Cumulative Domestic Sales
April-March
Cumulative Exports April-March
09-10 %
Change
% Compo
09-10 %
Change
% Compo
09-10 %
Change
% Comp
o
B: Utility Vehicles
Force Motors Ltd
5,899 19% 2% 5,917 17% 2% 19 -74% 1%
General Motors India
Pvt Ltd
14,918 12% 5% 16,457 5% 6% 7 600% 0%
Mahindra & Mahindra Ltd
153,610
44% 56% 150,62
7 42% 55% 2,109 -4% 75%
Maruti Suzuki India Ltd
4,572 -43% 2% 3,932 -47% 1% 57 -25% 2%
Tata Motors Ltd
35,206 -12% 13% 35,516 -15% 13% 593 -13% 21%
Toyota Kirloskar Motor Pvt Ltd
53,534 40% 20% 53,703 40% 20% 0 0%
Total B: Utility
Vehicles(UVs)
272,848
24% 100% 272,73
3 21% 100% 2,823 -7% 100%
Table 4 – Utility Vehicles
Automobile Production Trends (In, 000)
Category 2005-06 2006-07 2007-08 2008-09 2009-10
2010-11 (August)
Utility Vehicles
Numbers 263 222 246 218.2 272.8 125.11
% Growth 5.62 -15.59 9.96 -11.9 25.0 16.9
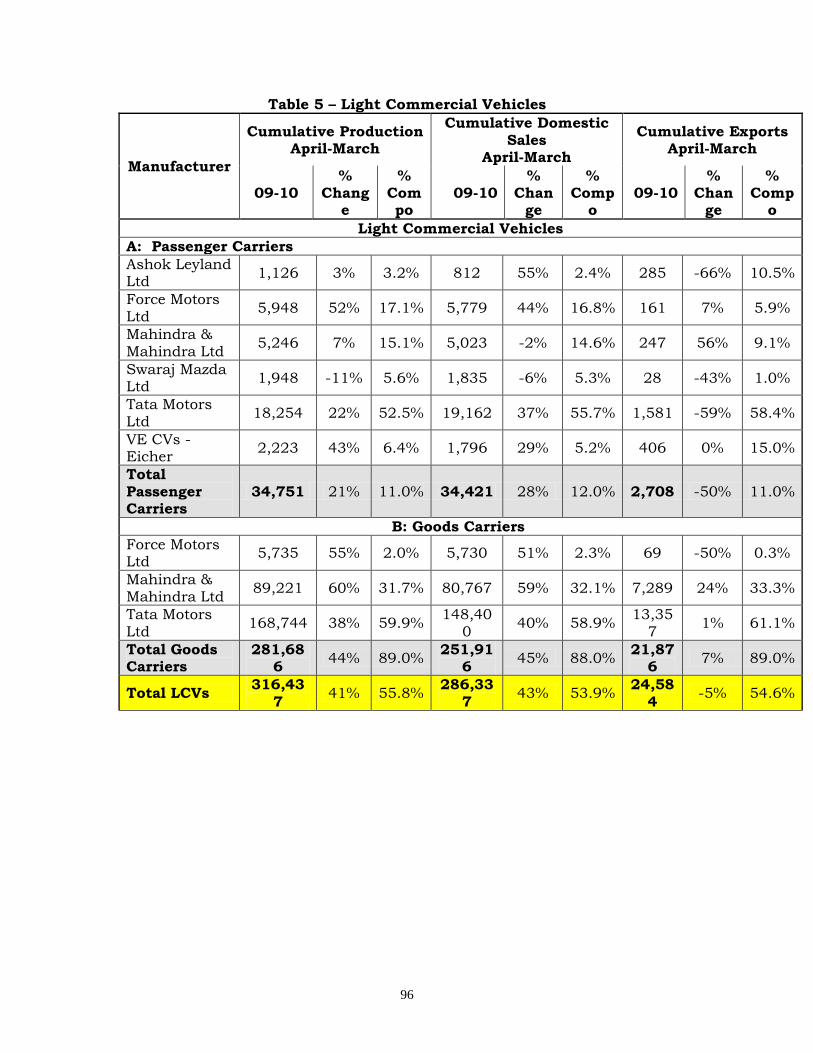
96
Table 5 – Light Commercial Vehicles
Manufacturer
Cumulative Production April-March
Cumulative Domestic Sales
April-March
Cumulative Exports April-March
09-10 %
Change
% Compo
09-10 %
Change
% Comp
o 09-10
% Chan
ge
% Comp
o
Light Commercial Vehicles
A: Passenger Carriers
Ashok Leyland Ltd
1,126 3% 3.2% 812 55% 2.4% 285 -66% 10.5%
Force Motors
Ltd 5,948 52% 17.1% 5,779 44% 16.8% 161 7% 5.9%
Mahindra & Mahindra Ltd
5,246 7% 15.1% 5,023 -2% 14.6% 247 56% 9.1%
Swaraj Mazda Ltd
1,948 -11% 5.6% 1,835 -6% 5.3% 28 -43% 1.0%
Tata Motors Ltd
18,254 22% 52.5% 19,162 37% 55.7% 1,581 -59% 58.4%
VE CVs - Eicher
2,223 43% 6.4% 1,796 29% 5.2% 406 0% 15.0%
Total Passenger Carriers
34,751 21% 11.0% 34,421 28% 12.0% 2,708 -50% 11.0%
B: Goods Carriers
Force Motors Ltd
5,735 55% 2.0% 5,730 51% 2.3% 69 -50% 0.3%
Mahindra & Mahindra Ltd
89,221 60% 31.7% 80,767 59% 32.1% 7,289 24% 33.3%
Tata Motors Ltd
168,744 38% 59.9% 148,40
0 40% 58.9%
13,357
1% 61.1%
Total Goods Carriers
281,686
44% 89.0% 251,91
6 45% 88.0%
21,876
7% 89.0%
Total LCVs 316,43
7 41% 55.8%
286,337
43% 53.9% 24,58
4 -5% 54.6%
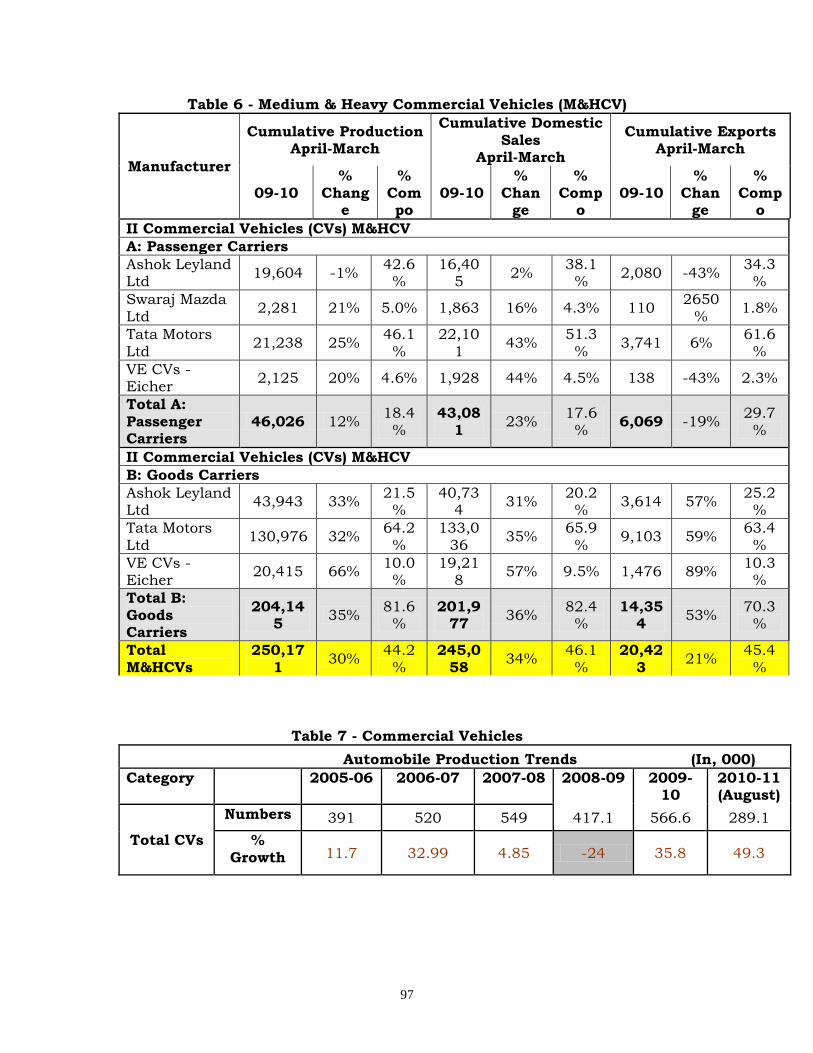
97
Table 6 - Medium & Heavy Commercial Vehicles (M&HCV)
Manufacturer
Cumulative Production April-March
Cumulative Domestic Sales
April-March
Cumulative Exports April-March
09-10 %
Change
% Compo
09-10 %
Change
% Comp
o 09-10
% Chan
ge
% Comp
o
II Commercial Vehicles (CVs) M&HCV
A: Passenger Carriers
Ashok Leyland Ltd
19,604 -1% 42.6
% 16,40
5 2%
38.1%
2,080 -43% 34.3
%
Swaraj Mazda
Ltd 2,281 21% 5.0% 1,863 16% 4.3% 110
2650
% 1.8%
Tata Motors Ltd
21,238 25% 46.1
% 22,10
1 43%
51.3%
3,741 6% 61.6
%
VE CVs - Eicher
2,125 20% 4.6% 1,928 44% 4.5% 138 -43% 2.3%
Total A: Passenger Carriers
46,026 12% 18.4
% 43,08
1 23%
17.6%
6,069 -19% 29.7
%
II Commercial Vehicles (CVs) M&HCV
B: Goods Carriers
Ashok Leyland Ltd
43,943 33% 21.5
% 40,73
4 31%
20.2%
3,614 57% 25.2
%
Tata Motors Ltd
130,976 32% 64.2
% 133,0
36 35%
65.9%
9,103 59% 63.4
%
VE CVs - Eicher
20,415 66% 10.0
% 19,21
8 57% 9.5% 1,476 89%
10.3%
Total B: Goods Carriers
204,145
35% 81.6
% 201,9
77 36%
82.4%
14,354
53% 70.3
%
Total M&HCVs
250,171
30% 44.2
% 245,0
58 34%
46.1%
20,423
21% 45.4
%
Table 7 - Commercial Vehicles
Automobile Production Trends (In, 000)
Category 2005-06 2006-07 2007-08 2008-09 2009-10
2010-11 (August)
Total CVs
Numbers 391 520 549 417.1 566.6 289.1
% Growth 11.7 32.99 4.85 -24 35.8 49.3
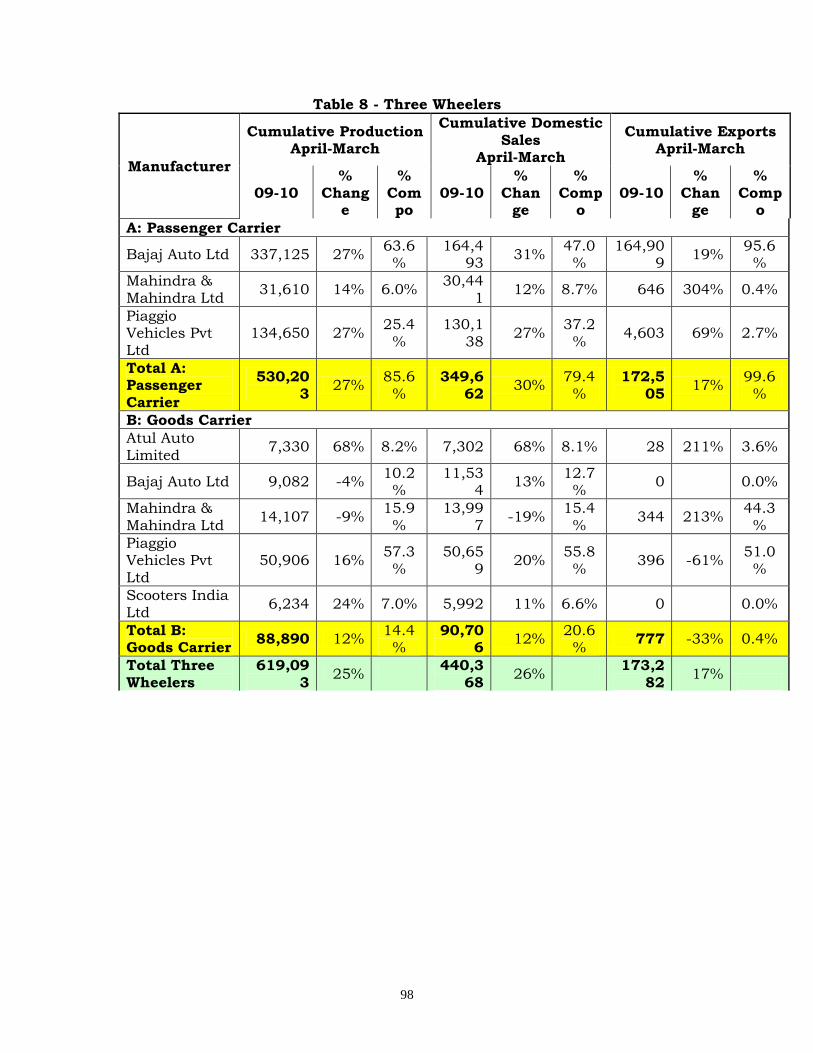
98
Table 8 - Three Wheelers
Manufacturer
Cumulative Production April-March
Cumulative Domestic Sales
April-March
Cumulative Exports April-March
09-10 %
Change
% Compo
09-10 %
Change
% Comp
o 09-10
% Chan
ge
% Comp
o
A: Passenger Carrier
Bajaj Auto Ltd 337,125 27% 63.6
% 164,4
93 31%
47.0%
164,909
19% 95.6
%
Mahindra & Mahindra Ltd
31,610 14% 6.0% 30,44
1 12% 8.7% 646 304% 0.4%
Piaggio Vehicles Pvt Ltd
134,650 27% 25.4
% 130,1
38 27%
37.2%
4,603 69% 2.7%
Total A: Passenger Carrier
530,203
27% 85.6
% 349,6
62 30%
79.4%
172,505
17% 99.6
%
B: Goods Carrier
Atul Auto Limited
7,330 68% 8.2% 7,302 68% 8.1% 28 211% 3.6%
Bajaj Auto Ltd 9,082 -4% 10.2
% 11,53
4 13%
12.7%
0 0.0%
Mahindra & Mahindra Ltd
14,107 -9% 15.9
% 13,99
7 -19%
15.4%
344 213% 44.3
%
Piaggio Vehicles Pvt Ltd
50,906 16% 57.3
% 50,65
9 20%
55.8%
396 -61% 51.0
%
Scooters India Ltd
6,234 24% 7.0% 5,992 11% 6.6% 0 0.0%
Total B: Goods Carrier
88,890 12% 14.4
% 90,70
6 12%
20.6%
777 -33% 0.4%
Total Three Wheelers
619,093
25% 440,3
68 26%
173,282
17%
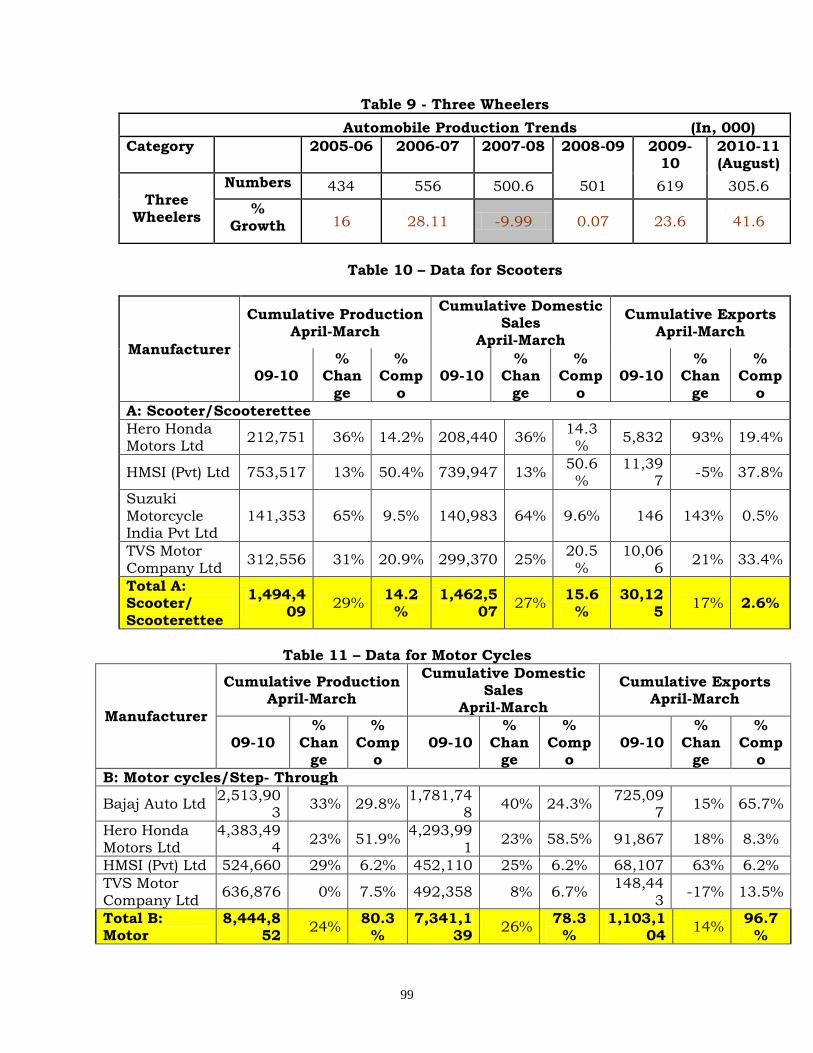
99
Table 9 - Three Wheelers
Automobile Production Trends (In, 000)
Category 2005-06 2006-07 2007-08 2008-09 2009-10
2010-11 (August)
Three Wheelers
Numbers 434 556 500.6 501 619 305.6
% Growth 16 28.11 -9.99 0.07 23.6 41.6
Table 10 – Data for Scooters
Manufacturer
Cumulative Production April-March
Cumulative Domestic Sales
April-March
Cumulative Exports April-March
09-10 %
Change
% Comp
o 09-10
% Chan
ge
% Comp
o 09-10
% Chan
ge
% Comp
o
A: Scooter/Scooterettee
Hero Honda Motors Ltd
212,751 36% 14.2% 208,440 36% 14.3
% 5,832 93% 19.4%
HMSI (Pvt) Ltd 753,517 13% 50.4% 739,947 13% 50.6
% 11,39
7 -5% 37.8%
Suzuki Motorcycle India Pvt Ltd
141,353 65% 9.5% 140,983 64% 9.6% 146 143% 0.5%
TVS Motor Company Ltd
312,556 31% 20.9% 299,370 25% 20.5
% 10,06
6 21% 33.4%
Total A: Scooter/ Scooterettee
1,494,409
29% 14.2
% 1,462,5
07 27%
15.6%
30,125
17% 2.6%
Table 11 – Data for Motor Cycles
Manufacturer
Cumulative Production April-March
Cumulative Domestic Sales
April-March
Cumulative Exports April-March
09-10 %
Change
% Comp
o 09-10
% Chan
ge
% Comp
o 09-10
% Chan
ge
% Comp
o
B: Motor cycles/Step- Through
Bajaj Auto Ltd 2,513,90
3 33% 29.8%
1,781,748
40% 24.3% 725,09
7 15% 65.7%
Hero Honda Motors Ltd
4,383,494
23% 51.9% 4,293,99
1 23% 58.5% 91,867 18% 8.3%
HMSI (Pvt) Ltd 524,660 29% 6.2% 452,110 25% 6.2% 68,107 63% 6.2%
TVS Motor Company Ltd
636,876 0% 7.5% 492,358 8% 6.7% 148,44
3 -17% 13.5%
Total B: Motor
8,444,852
24% 80.3
% 7,341,1
39 26%
78.3%
1,103,104
14% 96.7
%
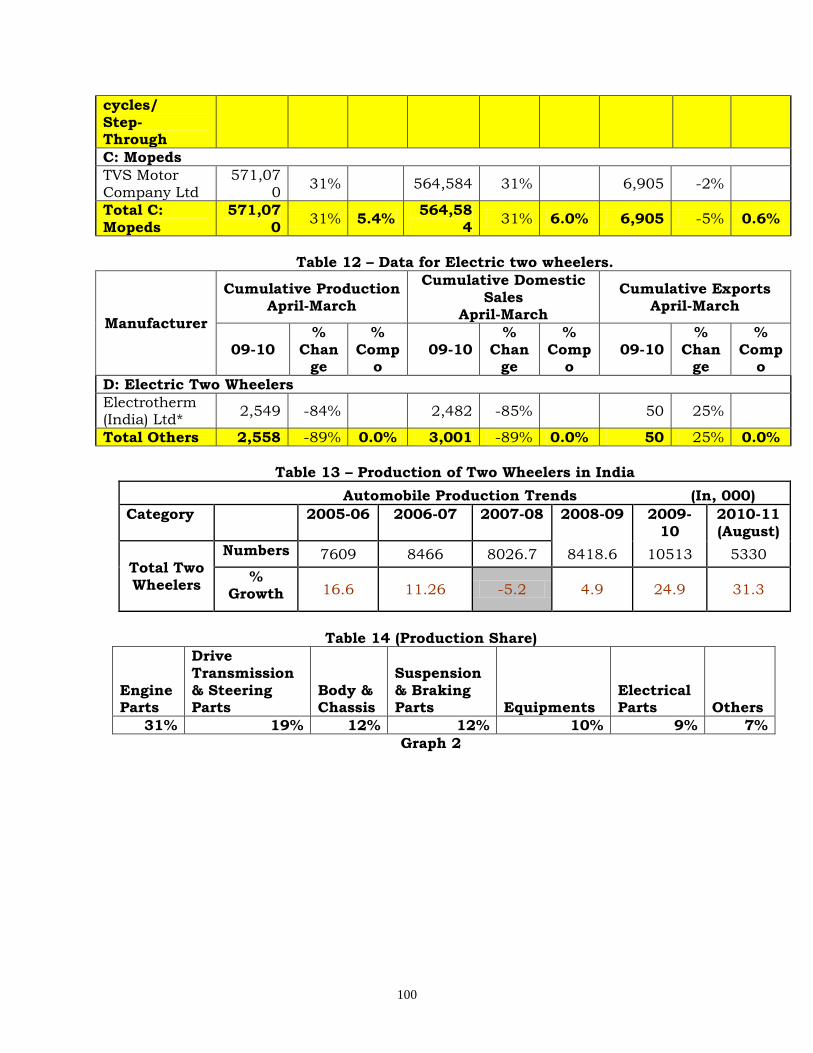
100
cycles/ Step- Through
C: Mopeds
TVS Motor Company Ltd
571,070
31% 564,584 31% 6,905 -2%
Total C: Mopeds
571,070
31% 5.4% 564,58
4 31% 6.0% 6,905 -5% 0.6%
Table 12 – Data for Electric two wheelers.
Manufacturer
Cumulative Production April-March
Cumulative Domestic Sales
April-March
Cumulative Exports April-March
09-10 %
Change
% Comp
o 09-10
% Chan
ge
% Comp
o 09-10
% Chan
ge
% Comp
o
D: Electric Two Wheelers
Electrotherm (India) Ltd*
2,549 -84% 2,482 -85% 50 25%
Total Others 2,558 -89% 0.0% 3,001 -89% 0.0% 50 25% 0.0%
Table 13 – Production of Two Wheelers in India
Automobile Production Trends (In, 000)
Category 2005-06 2006-07 2007-08 2008-09 2009-10
2010-11 (August)
Total Two Wheelers
Numbers 7609 8466 8026.7 8418.6 10513 5330
% Growth 16.6 11.26 -5.2 4.9 24.9 31.3
Table 14 (Production Share)
Engine Parts
Drive Transmission & Steering Parts
Body & Chassis
Suspension & Braking Parts Equipments
Electrical Parts Others
31% 19% 12% 12% 10% 9% 7%
Graph 2
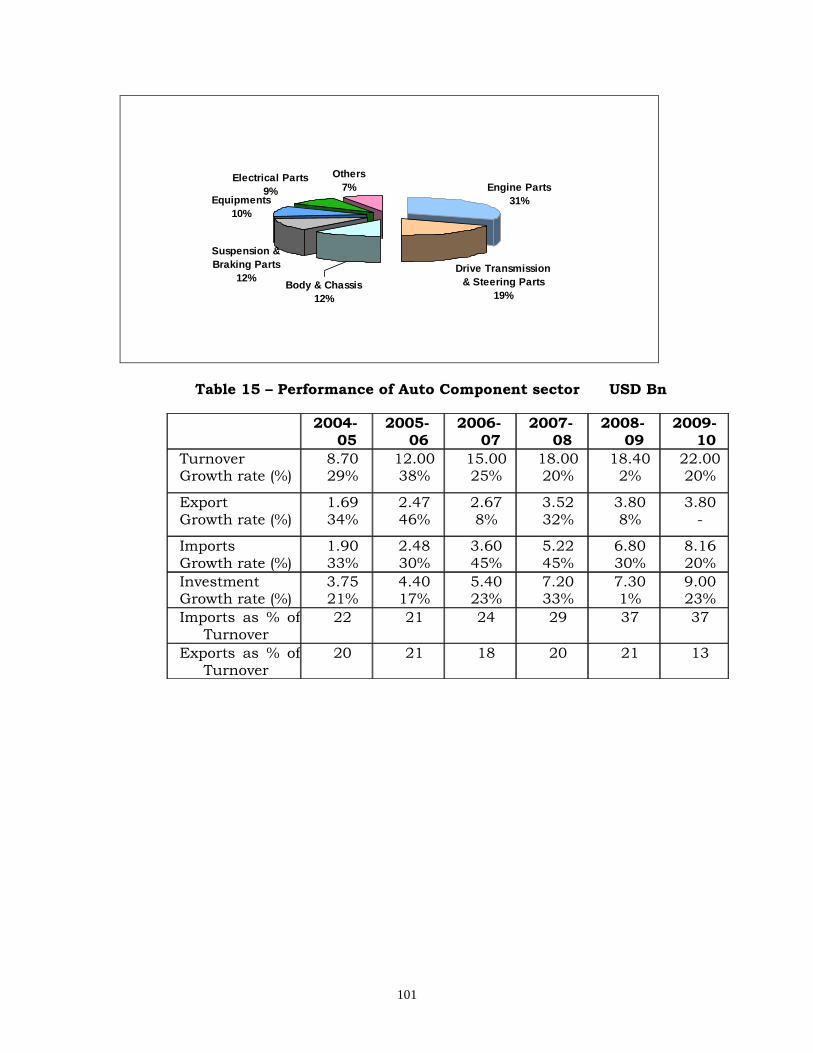
101
Engine Parts
31%
Drive Transmission
& Steering Parts
19%
Equipments
10%
Electrical Parts
9%
Others
7%
Body & Chassis
12%
Suspension &
Braking Parts
12%
Table 15 – Performance of Auto Component sector USD Bn
2004-05
2005-06
2006-07
2007-08
2008-09
2009-10
Turnover Growth rate (%)
8.70 29%
12.00 38%
15.00 25%
18.00 20%
18.40 2%
22.00 20%
Export Growth rate (%)
1.69 34%
2.47 46%
2.67 8%
3.52 32%
3.80 8%
3.80 -
Imports Growth rate (%)
1.90 33%
2.48 30%
3.60 45%
5.22 45%
6.80 30%
8.16 20%
Investment Growth rate (%)
3.75 21%
4.40 17%
5.40 23%
7.20 33%
7.30 1%
9.00 23%
Imports as % of Turnover
22 21 24 29 37 37
Exports as % of Turnover
20 21 18 20 21 13
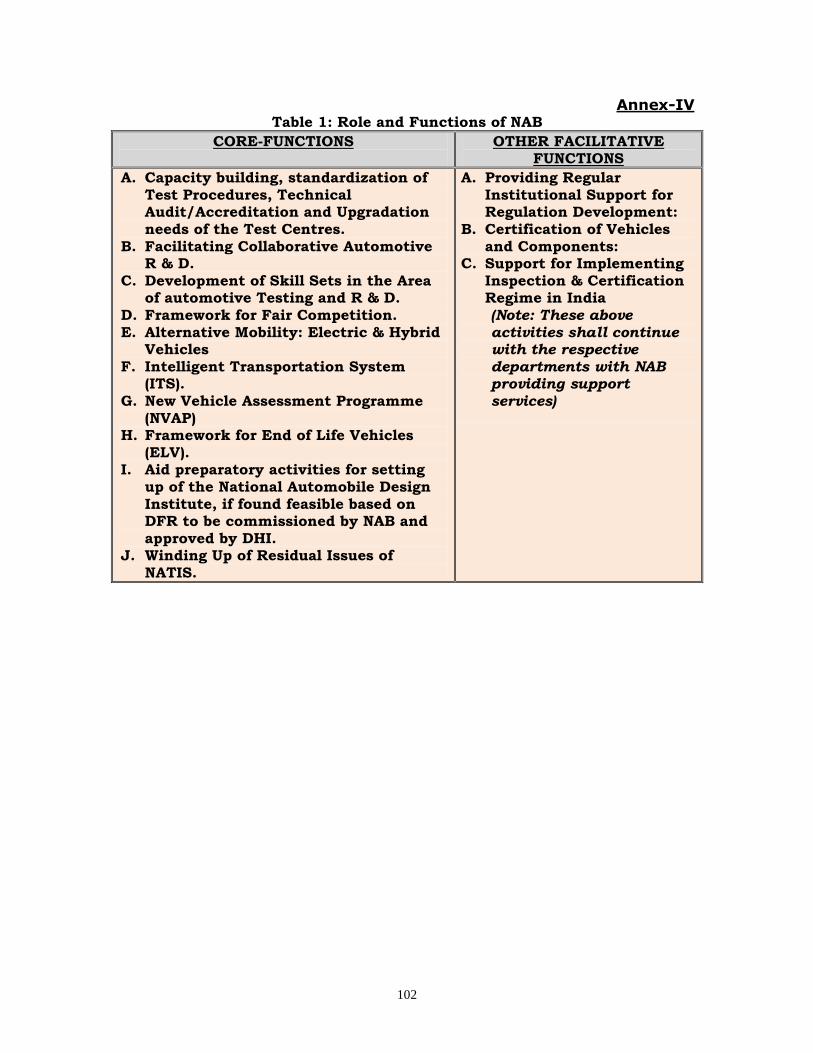
102
Annex-IV Table 1: Role and Functions of NAB
CORE-FUNCTIONS
OTHER FACILITATIVE FUNCTIONS
A. Capacity building, standardization of Test Procedures, Technical Audit/Accreditation and Upgradation needs of the Test Centres.
B. Facilitating Collaborative Automotive R & D.
C. Development of Skill Sets in the Area of automotive Testing and R & D.
D. Framework for Fair Competition. E. Alternative Mobility: Electric & Hybrid
Vehicles F. Intelligent Transportation System
(ITS). G. New Vehicle Assessment Programme
(NVAP) H. Framework for End of Life Vehicles
(ELV). I. Aid preparatory activities for setting
up of the National Automobile Design Institute, if found feasible based on DFR to be commissioned by NAB and approved by DHI.
J. Winding Up of Residual Issues of NATIS.
A. Providing Regular Institutional Support for Regulation Development:
B. Certification of Vehicles and Components:
C. Support for Implementing Inspection & Certification Regime in India
(Note: These above
activities shall continue with the respective
departments with NAB providing support
services)
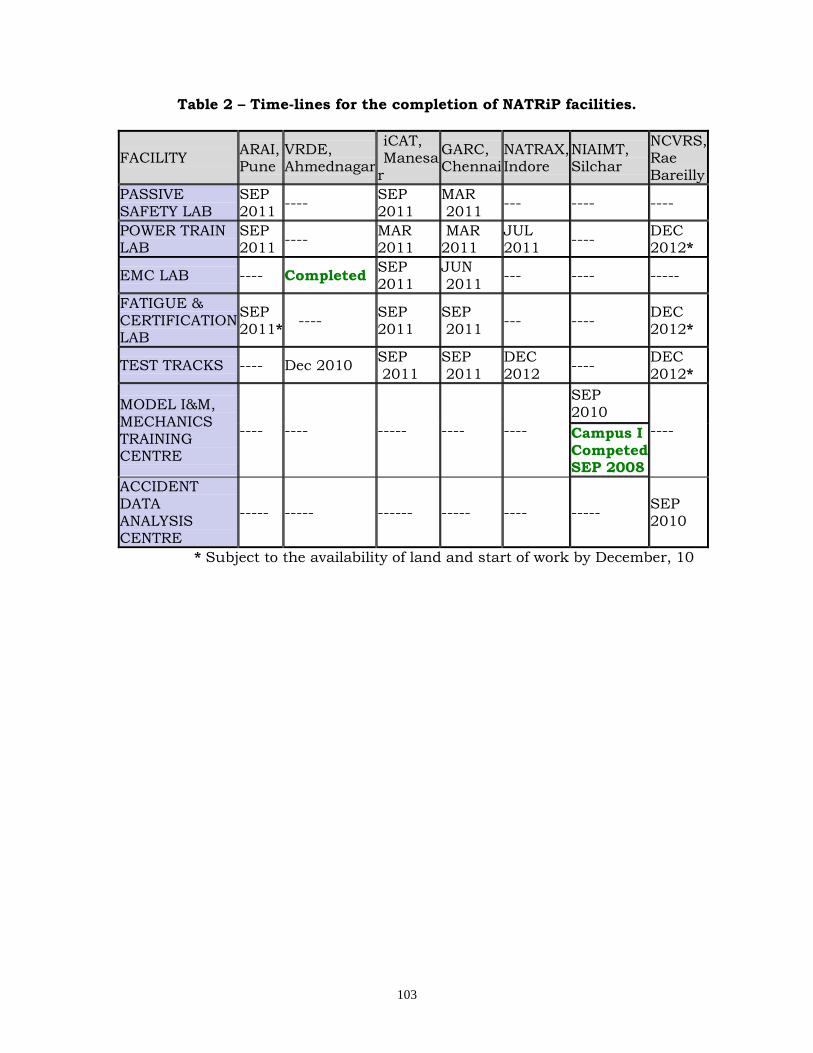
103
Table 2 – Time-lines for the completion of NATRiP facilities.
FACILITY ARAI, Pune
VRDE, Ahmednagar
iCAT, Manesa
r
GARC, Chennai
NATRAX, Indore
NIAIMT, Silchar
NCVRS, Rae Bareilly
PASSIVE SAFETY LAB
SEP 2011
---- SEP 2011
MAR 2011
--- ---- ----
POWER TRAIN LAB
SEP 2011
---- MAR 2011
MAR 2011
JUL 2011
---- DEC 2012*
EMC LAB ---- Completed SEP 2011
JUN 2011
--- ---- -----
FATIGUE & CERTIFICATION LAB
SEP 2011*
---- SEP 2011
SEP 2011
--- ---- DEC 2012*
TEST TRACKS ---- Dec 2010 SEP 2011
SEP 2011
DEC 2012
---- DEC 2012*
MODEL I&M, MECHANICS TRAINING CENTRE
---- ---- ----- ---- ----
SEP 2010
---- Campus I Competed SEP 2008
ACCIDENT DATA ANALYSIS CENTRE
----- ----- ------ ----- ---- ----- SEP 2010
* Subject to the availability of land and start of work by December, 10
104
Annex-V Preliminary Observations- Heavy Industries – draft Strategy Plan
1. While there are no hard and fast rules, a 110 page strategy document
seems too long and will give the impression that it contains unnecessary
detail. The main write up, in my opinion, should not be more than about
30 pages. Back up detail can be included in annexes where necessary.
2. The strategic plan need not cover each and every activity or service
provided by the Department. It should instead selectively identify those
services, where there is a possibility of a quantum jump in the impact
made by the Government’s intervention in a more innovative manner
than hitherto, in say 5 years and focus on those in the strategy.
3. A preliminary examination gives the impression that only the
manufacturers of machinery - whether machine tools, textile machinery,
heavy electrical equipment etc.- have been considered to be stakeholders
for purposes of consultation. The paper does not mention how user
industries are to be taken on board. Also foreign manufacturers need to
be considered as vital stakeholders – they may presently be competitors
but could under favourable conditions become partners and
collaborators. Ministries/ Departments like Atomic Energy, Civil
Aviation, Defence, Petroleum, and Power also need to be taken on board
through a process to be outlined in the strategy paper.
4. It is particularly necessary to explain why no FDI is forthcoming, under
what conditions will it come and why India in not competitive in certain
items and identify as to what are the possibilities of becoming
competitive – irrespective of the level of trade protection afforded. In
present times, it is difficult to sell the idea of increased trade protection
except on security considerations.
5. It is also necessary to highlight the reasons why users prefer for foreign
machinery items over Indian production. Is it price, or delivery schedules
and timely delivery or quality? If the answers are not known, there
should be mention of steps to find out. In the context of a liberalized
economy, there is nothing wrong in preferring cheaper or better quality
imports, except on security considerations – but we must find out in
what items we can in a few years become better or cheaper or deliver
more efficiently, not only to Indian users but the rest of the world – and
work on facilitating this. A strategy which does not consider the whole
world is India’s potential market will not fly.
6. The suggestion for offset obligations is good, but it should be for
carefully identified manufacturing or research facilities and cover
105
purchases in sectors such as atomic energy, defence, civil aviation,
petroleum and power. On across the board obligation for all types of
machinery is just likely to dilute strategic thrust and focus.
7. Similarly, the suggestion for encouraging joint ventures is good, but what
are our strengths in this regard? The future demand in India? The
availability of land with existing players in the public and private
sectors? Experience of handling the regulatory and market environment?
8. The analysis does not explain how countries like Taiwan have become
major players in this area or how Korean industry has managed to
develop R& D facilities at the cutting edge of technology. The strategy
should propose to study this if it is not known – learning from
outstanding players is the hallmark of a good strategy.
9. In identifying opportunities one needs to look at those sectors where
localization of manufacture is of the essence in order to reduce costs, for
example nuclear power. The fact that China is the biggest importer of
heavy machinery shows that it is counterproductive to think of
encouraging total self reliance, even if there is no comparative advantage
or security requirement.
10. It has been stated in one of the papers on the department’s web site that
different developed countries have developed different niche items – why
are we not attempting to do this? Have we studied why others have
adopted this strategy?
11. For the auto sector, which has been growing very rapidly, which are the
segments in which India wants to be the world’s manufacturer and
supplier and how are we going to achieve this?
12. In regard to profit making public sector enterprises, is it proposed to
identify those which must remain in the public sector and those which
could be disinvested in a phased manner?
13. In regard to loss making public sector enterprises – which are the ones
which need to be retained on account of strategic reasons or social policy
and how do we cut down on the recurring losses?
14. As regards, BHEL, what does the Government need to do to make it a
world beater? Should not that be part of strategy?