Embed Size (px)
Citation preview

1
Strategic Plan 2014 – 2017
COUNTRY PROFILES and
EDUCATION INDICATORS GUIDANCE NOTES
25 February 2016
If you have any question, please feel free to contact: Daniel Kelly ([email protected]) or Matt Brossard ([email protected])
2
Structure of the guidance
This guidance contains 2 main sections:
Section 1: “How to read Strategic Plan Education Country Profiles” providing information
on SP education indicator performance in the country as compared to the country’s
baseline, SP target, and to the regional average. Section 1 is complemented by an
example of country profile in Annex.
Section 2: “SP education indicator guidance” providing the list of Strategic Plan education
indicators and their definitions. Section 1 is complemented by an Annex addressing the
most common ‘myths’ regarding SP/SMQ indicator reporting.
3
Section 1: how to read Strategic Plan (SP)
Education Country Profiles
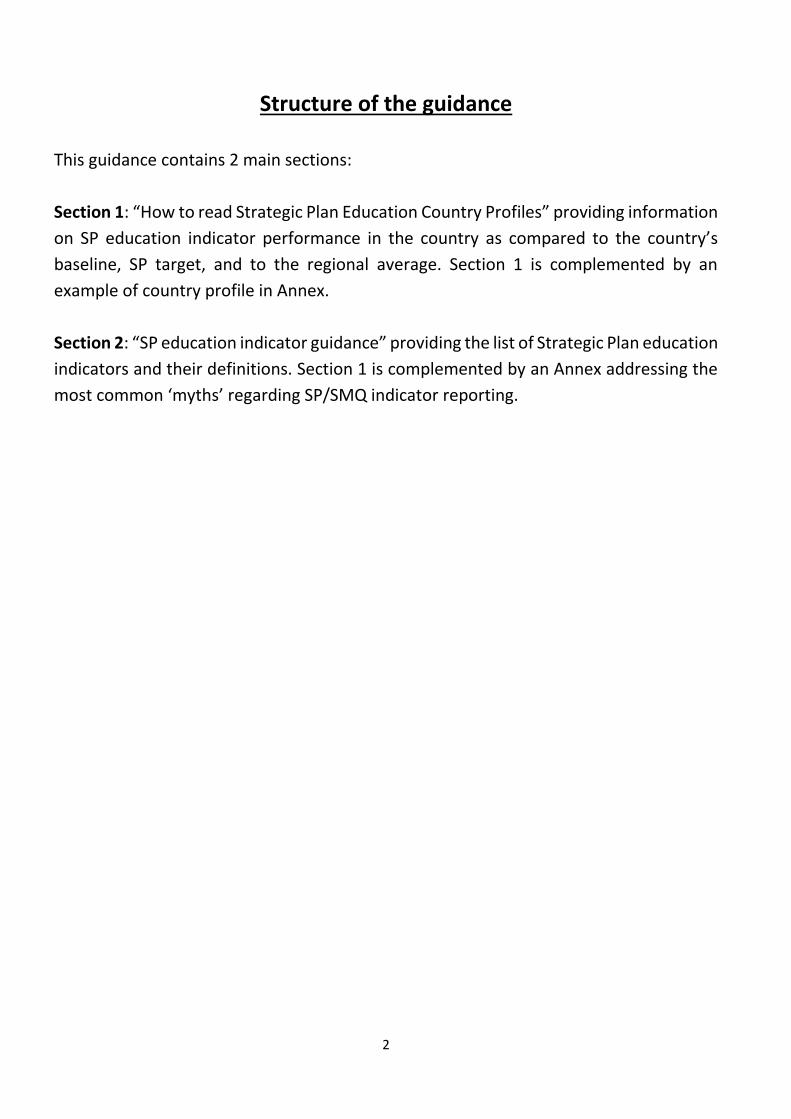
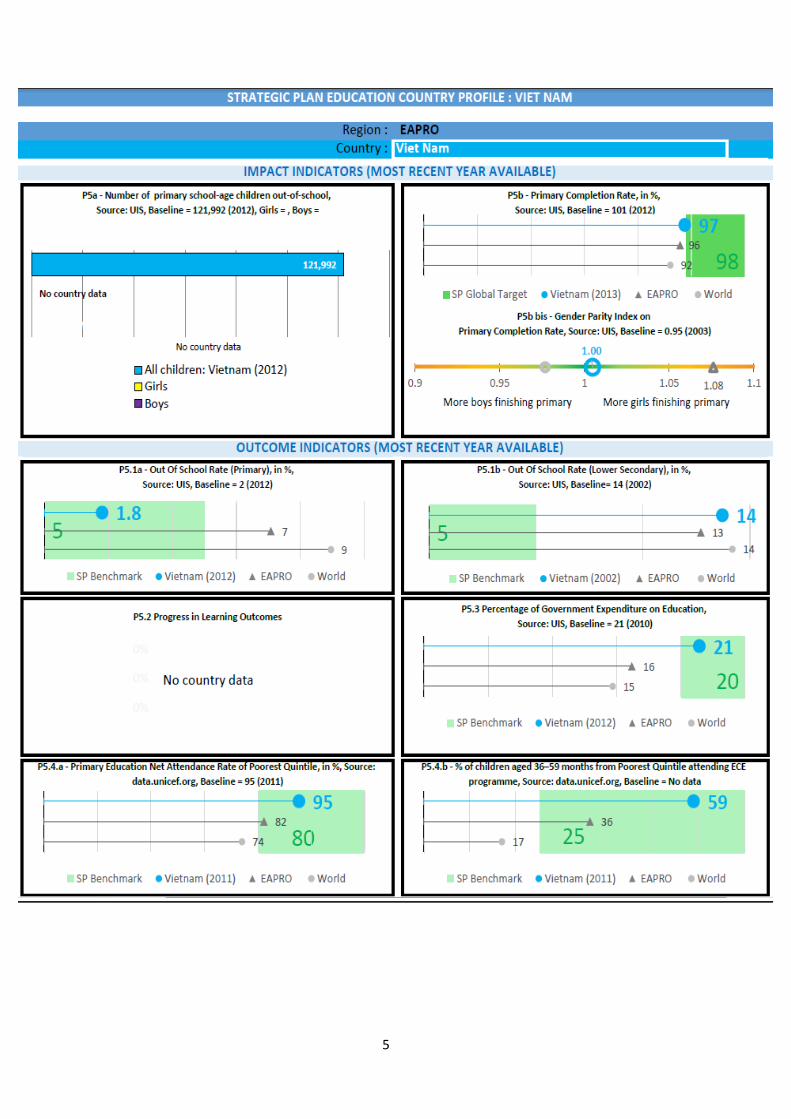
Comparison charts with Strategic Plan (SP)
Global Targets: The target area is
represented by the green rectangle on the
right of the graph. The target value is the
global target as agreed in the UNICEF
Strategic Plan Results Framework. The
country value is 75% (blue circle at the end
of the top line), the regional average is 93%
(triangle at the end of the middle line) and
the world average is 91% (light grey circle at the end of the bottom line). The SP Global Target of 98% is not yet reached
in any of the three areas.
Comparison charts with SP Benchmarks:
The benchmark area is represented by the light
green rectangle on the left of the graph. The
benchmark value is used to determine whether
a country can be counted as one of the
countries having met the SP target on the
relevant indicator. In the example to the right
the Out-Of-School Rate should be less than 5%.
As above the country value is represented by
the blue circle at the end of the top line, the
regional average is represented by the triangle at the end of the middle line and the world average is represented by
the light grey circle at the end of the bottom line.
When a larger value for the indicator is
considered positive, comparison charts with
SP Benchmarks are presented in the opposite
direction (light green rectangle on the right of
the graph). In the example to the right, the
percentage of government expenditure on
education should be at least 20%. As above the
country value is represented by the blue circle
at the end of the top line, the regional average
is represented by the triangle at the end of the middle line and the world average is represented by the light grey
circle at the end of the bottom line.
4
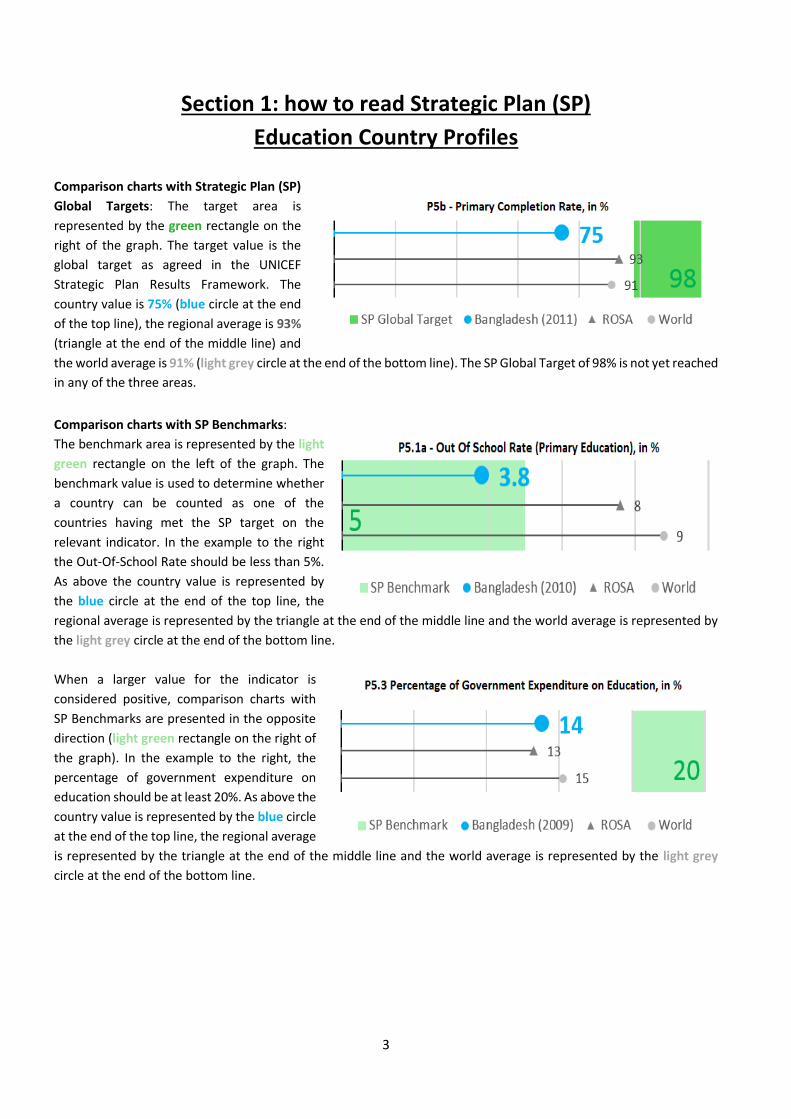
Gender Parity Index charts: The same country,
region and world symbols are also used for the
gender parity index charts. Here the country value
is 1.15 (blue circle on the right of the chart). The
regional average (triangle) is very close to the
ideal value of 1.
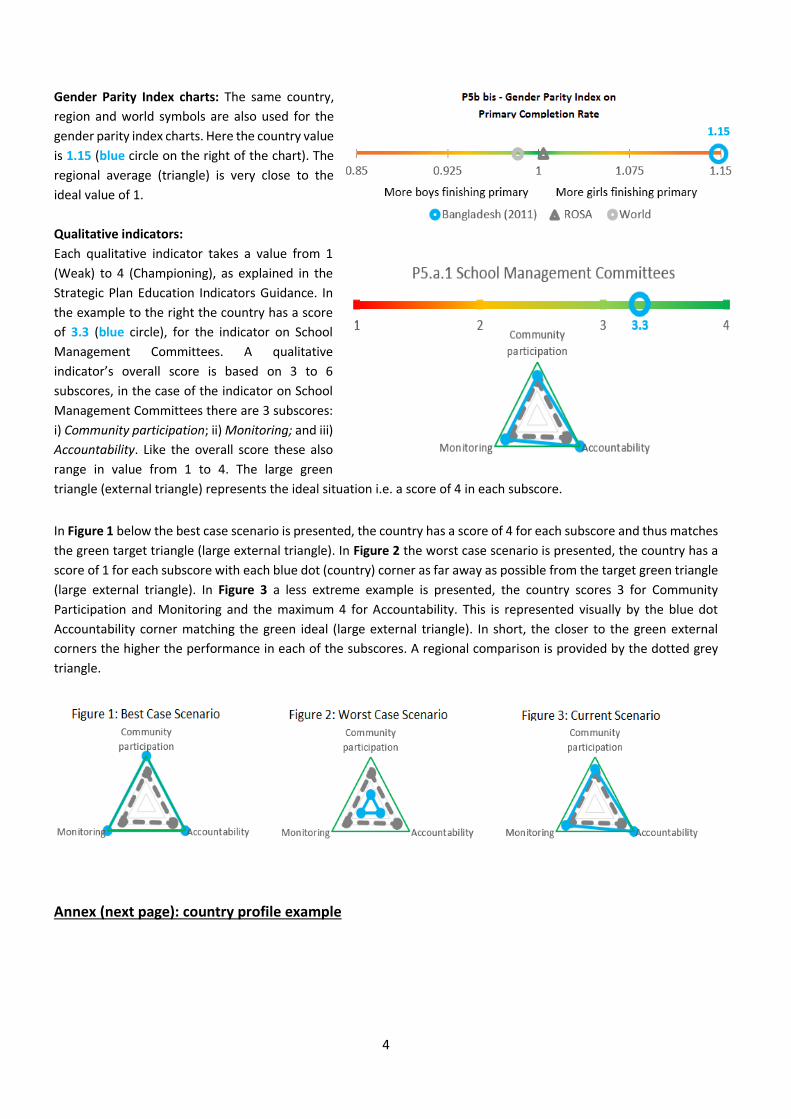
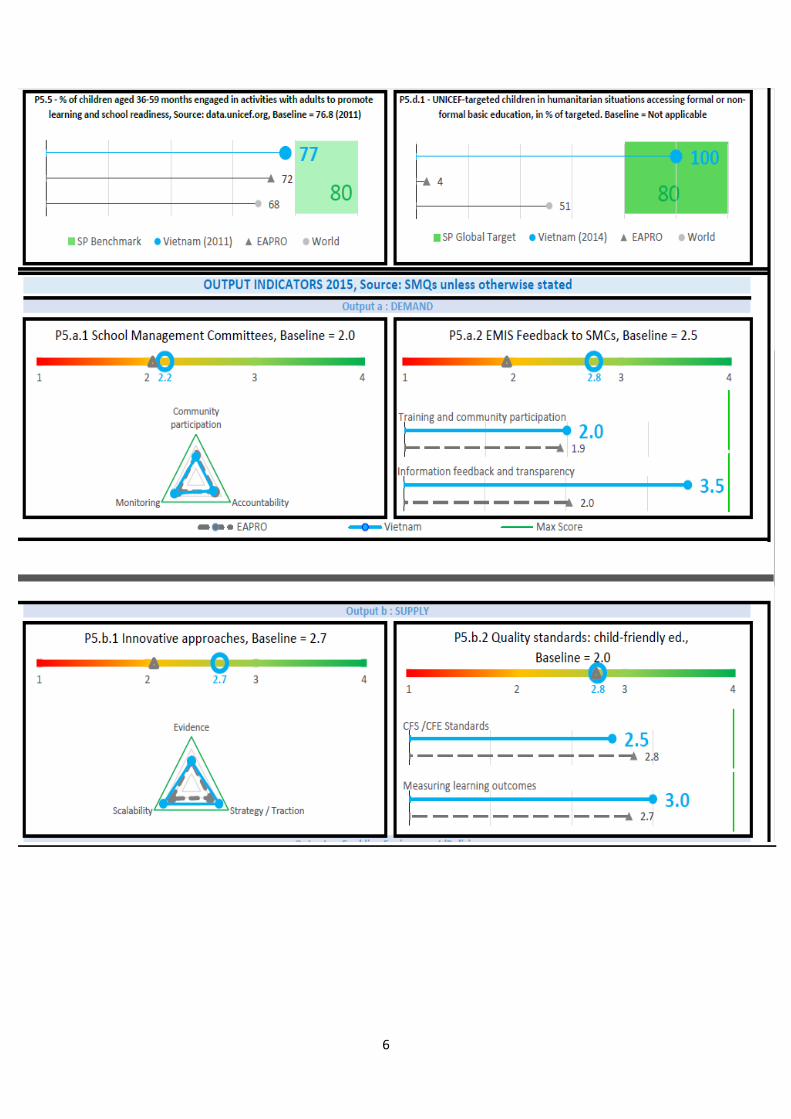
Qualitative indicators:
Each qualitative indicator takes a value from 1
(Weak) to 4 (Championing), as explained in the
Strategic Plan Education Indicators Guidance. In
the example to the right the country has a score
of 3.3 (blue circle), for the indicator on School
Management Committees. A qualitative
indicator’s overall score is based on 3 to 6
subscores, in the case of the indicator on School
Management Committees there are 3 subscores:
i) Community participation; ii) Monitoring; and iii)
Accountability. Like the overall score these also
range in value from 1 to 4. The large green
triangle (external triangle) represents the ideal situation i.e. a score of 4 in each subscore.
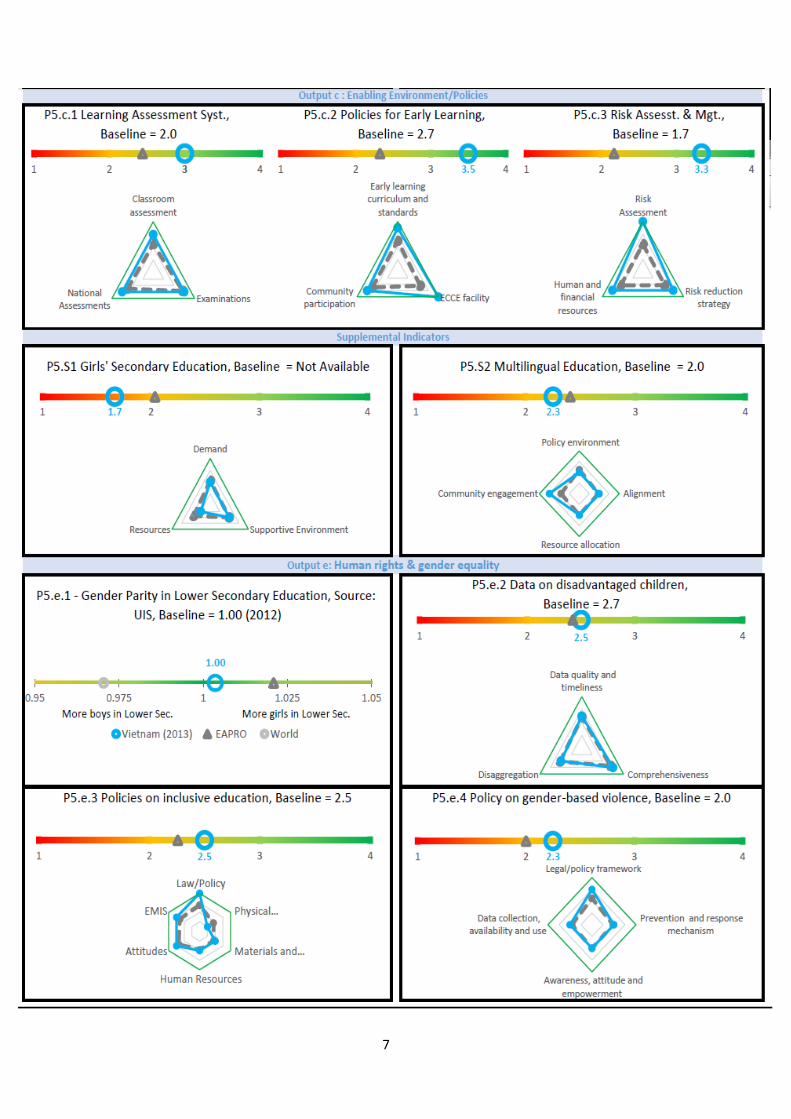
In Figure 1 below the best case scenario is presented, the country has a score of 4 for each subscore and thus matches
the green target triangle (large external triangle). In Figure 2 the worst case scenario is presented, the country has a
score of 1 for each subscore with each blue dot (country) corner as far away as possible from the target green triangle
(large external triangle). In Figure 3 a less extreme example is presented, the country scores 3 for Community
Participation and Monitoring and the maximum 4 for Accountability. This is represented visually by the blue dot
Accountability corner matching the green ideal (large external triangle). In short, the closer to the green external
corners the higher the performance in each of the subscores. A regional comparison is provided by the dotted grey
triangle.
Annex (next page): country profile example
5
6
7

8
Section 2: Education SP indicators guidance
I- INTODUCTION
OUTPUT INDICATORS
A- Introduction
B- Guidance on output indicator reporting
Output a: Enhanced support to communities with disadvantaged and excluded children
to start schooling at the right age and attend regularly
1. P5.a.1 Countries with functional school management committees (SMC) [both Primary &
Secondary]
2. P5.a.2 Countries in which the education management information system feeds findings back to
communities/school management committees
3. P5.a.3 Number of School Management Committees or Parent Teacher Associations or school
communities (or similar structure) that received training funded by UNICEF
Output b: Increased national capacity to provide access to early learning opportunities
and quality primary and secondary education
1. P5.b.1 Countries with innovative approaches at scale to improve access to education and learning
outcomes for the most disadvantaged and excluded children
2. P5.b.2 Countries with quality standards consistent with child-friendly school / education or
similar models developed or revised
3. P5.b.3 Number of children provided with individual education materials funded by UNICEF
4. P5.b.4 Number of classrooms provided with classroom education materials funded by UNICEF
Output c: Strengthened political commitment, accountability and national capacity to
legislate, plan and budget for scaling-up quality and inclusive education
1. P5.c.1 Countries with well-functioning learning assessment system, especially for early grades
2. P5.c.2 Countries with effective early learning policies and quality early learning programmes
3. P5.c.3 Countries with an education sector plan/policy that includes risk assessment and risk
management
Output d: Increased country capacity and delivery of services to ensure girls and boys
access to safe and secure forms of education and critical information for their own well-
being in humanitarian situations
1. P5.d.1 Percentage of children, targeted by UNICEF, in humanitarian situations, accessing formal
or non-formal basic education (including pre-primary schools/early childhood learning spaces)
2. P5.d.2 Countries with a country cluster coordination mechanism that meets CCC standards for
coordination
Output e: Increased capacity of governments and partners, as duty-bearers, to identify
and respond to key human rights and gender equality dimensions of school readiness
and performance
1. P5.e.1 Countries with gender parity in lower secondary education
9
2. P5.e.2 Countries with well-functioning education management information systems providing
disaggregated data that allow identification of barriers and bottlenecks that inhibit realization of
the rights of disadvantaged children
3. P5.e.3 Countries with policies on inclusive education covering children with disabilities
4. P5.e.4 Countries with an education policy/sector plan that specify prevention and response
mechanisms to address gender-based violence in and around schools (SRGBV)
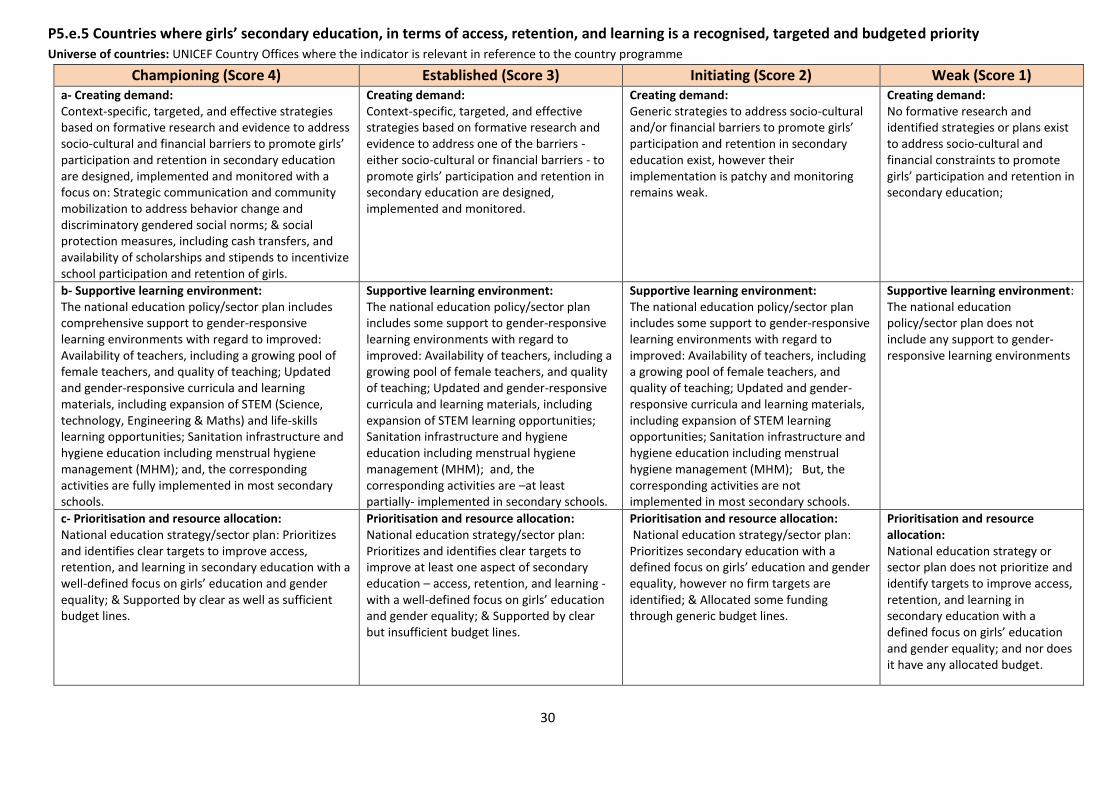
5. P5.e.5 Countries where girls’ secondary education, in terms of enrolment, retention, and
completion is a recognised, targeted and budgeted education priority
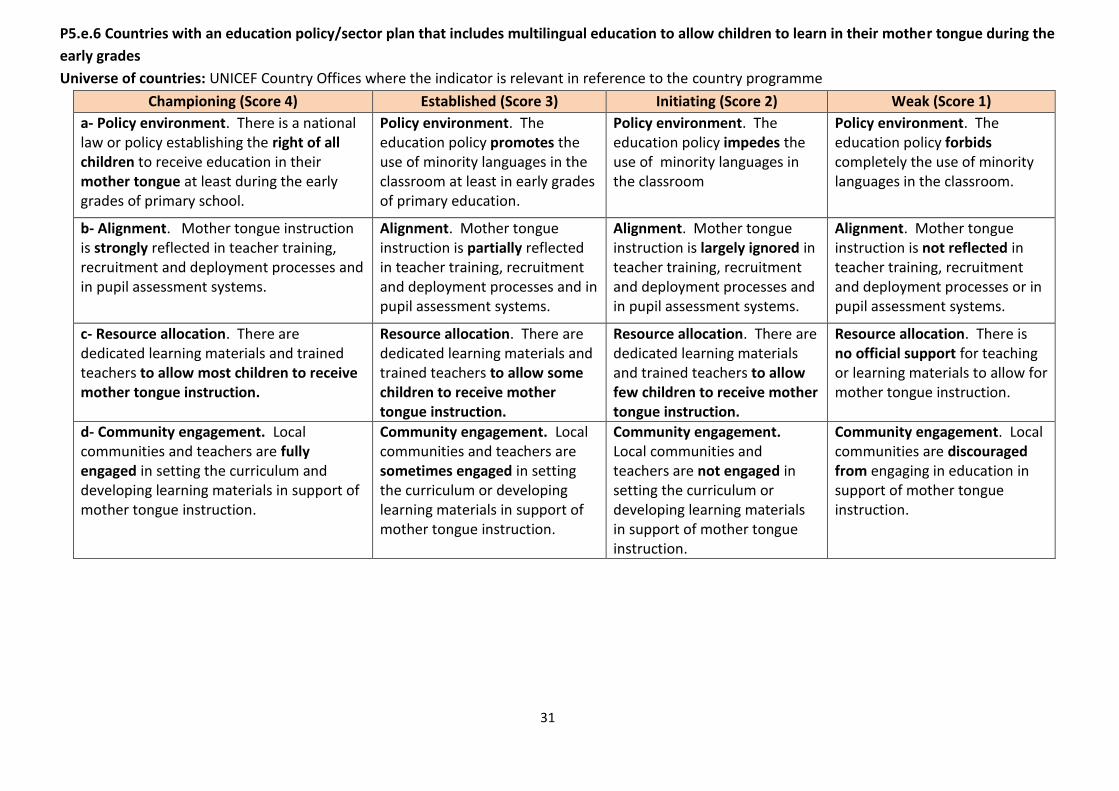
6. P5.e.6 Countries with an education policy/sector plan that includes multilingual education to
allow children to learn in their mother tongue during the early grades
Output f: Enhanced global and regional capacity to accelerate progress in education
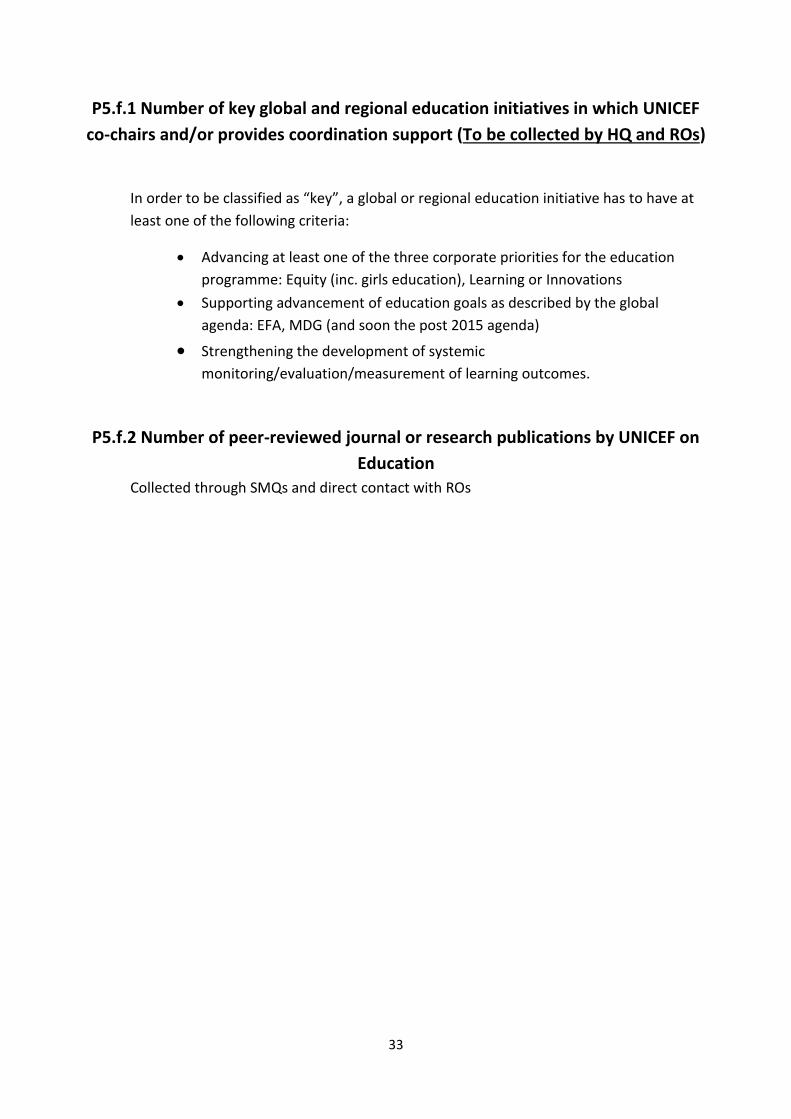
1. P5.f.1 Number of key global and regional education initiatives in which UNICEF co-chairs and/or
provides coordination support
2. P5.f.2 Number of peer-reviewed journal or research publications by UNICEF on Education
II- OUTCOME INDICATORS
Improved learning outcomes and equitable and inclusive education
1. P5.1 Programme countries with primary/lower secondary school age out-of-school rate below
5%
2. P5.2 Programme countries with increasing learning outcomes
3. P5.3 Programme countries with at least 20% of government expenditure on education
4. P5.4 Programme countries with poorest quintile net attendance rate— above 80% in primary,
above 25% in early childhood education
5. P5.5 Programme countries in which at least 80% of children aged 36-59 months have been
engaged in activities with an adult to promote learning and school readiness
6. P5.6 Percentage of children, targeted by UNICEF and partners, in humanitarian situations,
accessing formal or non-formal basic education (including pre-primary schools/early childhood
learning spaces)
7. P5.7 Percentage for education in Global Humanitarian Funding
III- IMPACT INDICATORS
1. P5a Number of primary school-age children out-of-school and gender parity index
2. P5b Gross intake ratio in the last grade of primary/ primary completion rate and gender parity
index
Annex: SP/SMQ reporting “Myth busting” slides
10
INTRODUCTION
UNICEF Strategic Plan Education, 2014-2017 includes 24 indicators that
can be disaggregated further into a total of 36 indicators.
The UNICEF Strategic Plan Education Results framework uses data
sourced from both national and international sources such as UNESCO
Institute for Statistics (UIS), UNICEF Multiple Indicators Cluster Survey
(MICS) and Demographic Household Surveys (DHS).
UNICEF country offices report on data identified to be sourced from
national sources, using the annual corporate reporting system:
Country Office Annual Report (COAR) with the Strategic Monitoring
Questions (SMQ). Therefore there is a need to have a common
understanding of the reporting framework. In addition, an effective
information flow is required between all parties (COs, ROs and HQ) to
ensure timely and accurate data collection and reporting.
Important remarks:
A country office has to report on a SMQ only if it is relevant in reference to its country programme
otherwise it indicates Not Applicable (NA). For example if the Country programme does not
support improvement of the Education Management Information System (EMIS), the answers to
the SMQs related to EMIS should be ‘Not Applicable’. Per corporate-wide recommendation, there
is no explicit mention of “with UNICEF support” at the end of indicators’ wordings but all output
indicators have to be implicitly understood as “with UNICEF support” as these indicators try to
capture, as much as possible, UNICEF attribution.
Similarly the indicators do not explicitly mention “in targeted areas”. For the same reason of trying
to capture UNICEF attribution, output indicators have to be implicitly understood as “in targeted
areas”. In the case of SMQs related to policy level action, if the country office is providing upstream
support in the domain related to a specific question, then the question should be answered. If not,
the answer should be ‘Not Applicable’.
For qualitative indicators, the reporting has to use a scale from a weak situation (score of 1) to an
aspirational/championing situation (score of 4) based on substantive criteria, that are described in
the following pages. Offices should pick a “best-fit” between the different scores, recognizing that in
most cases there will be a mixture of different levels. From 2015 the data collection allows for 0.5
ratings in case it is too difficult to make a choice. For example if the situation lies “in between” scores
1 and 2 and the choice between these scores is too difficult, a score of 1.5 can be submitted. For
reporting to the Board regarding how many countries meet the criteria of a specific indicator, scores
‘1’, ‘1.5’, and ‘2’ will be counted as a ‘No’ and scores ‘2.5’, ‘3’, ‘3.5’ and ‘4’ as a ‘Yes’.
It is recommended to discuss, when possible and applicable, each sub-domain’s score with the
Ministry of Education and Development Partners prior to submission.
See also in Annex a series of “Myth busting” slides important to keep in mind when reporting
through COAR/SMQ
Strategic Plan, 2014-2017
Education Outcome:
Improved learning outcomes and equitable
and inclusive education
11
OUTPUT INDICATORS
Output a: Enhanced support to
communities with disadvantaged and
excluded children to start schooling at the
right age and attend regularly
12
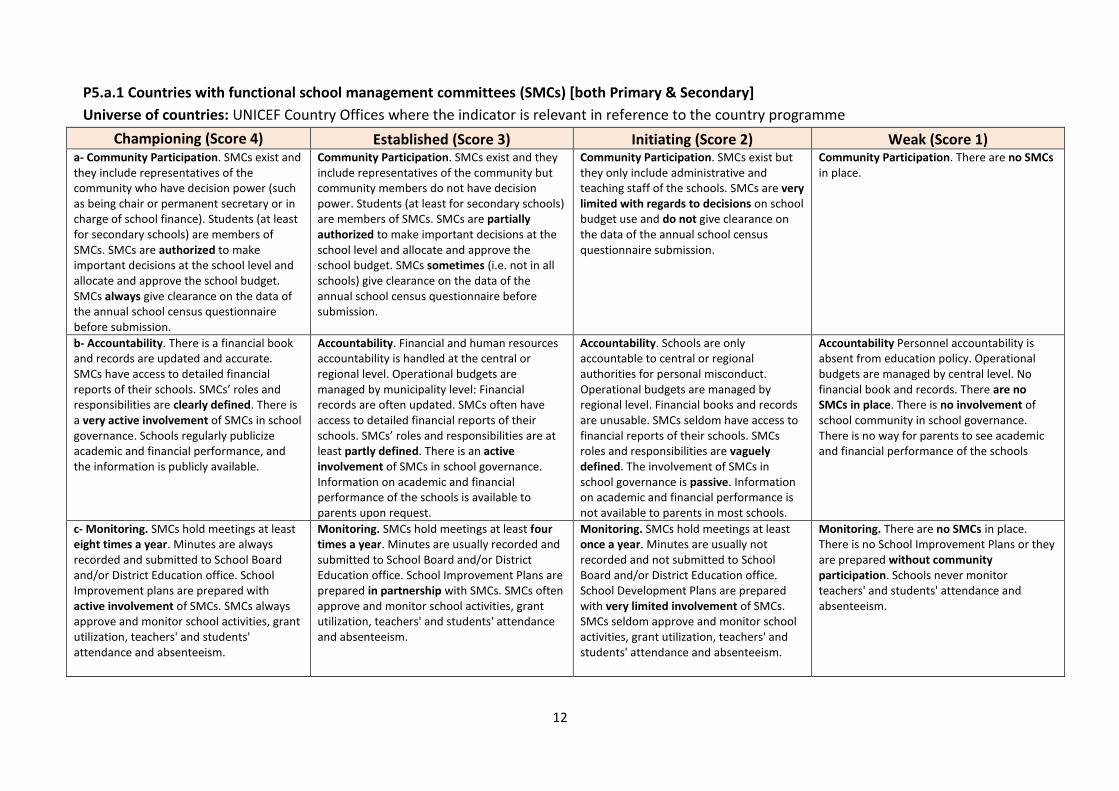
P5.a.1 Countries with functional school management committees (SMCs) [both Primary & Secondary]
Universe of countries: UNICEF Country Offices where the indicator is relevant in reference to the country programme
Championing (Score 4) Established (Score 3) Initiating (Score 2) Weak (Score 1)
a- Community Participation. SMCs exist and they include representatives of the community who have decision power (such as being chair or permanent secretary or in charge of school finance). Students (at least for secondary schools) are members of SMCs. SMCs are authorized to make important decisions at the school level and allocate and approve the school budget. SMCs always give clearance on the data of the annual school census questionnaire before submission.
Community Participation. SMCs exist and they include representatives of the community but community members do not have decision power. Students (at least for secondary schools) are members of SMCs. SMCs are partially authorized to make important decisions at the school level and allocate and approve the school budget. SMCs sometimes (i.e. not in all schools) give clearance on the data of the annual school census questionnaire before submission.
Community Participation. SMCs exist but they only include administrative and teaching staff of the schools. SMCs are very limited with regards to decisions on school budget use and do not give clearance on the data of the annual school census questionnaire submission.
Community Participation. There are no SMCs in place.
b- Accountability. There is a financial book and records are updated and accurate. SMCs have access to detailed financial reports of their schools. SMCs’ roles and responsibilities are clearly defined. There is a very active involvement of SMCs in school governance. Schools regularly publicize academic and financial performance, and the information is publicly available.
Accountability. Financial and human resources accountability is handled at the central or regional level. Operational budgets are managed by municipality level: Financial records are often updated. SMCs often have access to detailed financial reports of their schools. SMCs’ roles and responsibilities are at least partly defined. There is an active involvement of SMCs in school governance. Information on academic and financial performance of the schools is available to parents upon request.
Accountability. Schools are only accountable to central or regional authorities for personal misconduct. Operational budgets are managed by regional level. Financial books and records are unusable. SMCs seldom have access to financial reports of their schools. SMCs roles and responsibilities are vaguely defined. The involvement of SMCs in school governance is passive. Information on academic and financial performance is not available to parents in most schools.
Accountability Personnel accountability is absent from education policy. Operational budgets are managed by central level. No financial book and records. There are no SMCs in place. There is no involvement of school community in school governance. There is no way for parents to see academic and financial performance of the schools
c- Monitoring. SMCs hold meetings at least eight times a year. Minutes are always recorded and submitted to School Board and/or District Education office. School Improvement plans are prepared with active involvement of SMCs. SMCs always approve and monitor school activities, grant utilization, teachers' and students' attendance and absenteeism.
Monitoring. SMCs hold meetings at least four times a year. Minutes are usually recorded and submitted to School Board and/or District Education office. School Improvement Plans are prepared in partnership with SMCs. SMCs often approve and monitor school activities, grant utilization, teachers' and students' attendance and absenteeism.
Monitoring. SMCs hold meetings at least once a year. Minutes are usually not recorded and not submitted to School Board and/or District Education office. School Development Plans are prepared with very limited involvement of SMCs. SMCs seldom approve and monitor school activities, grant utilization, teachers' and students' attendance and absenteeism.
Monitoring. There are no SMCs in place. There is no School Improvement Plans or they are prepared without community participation. Schools never monitor teachers' and students' attendance and absenteeism.
13
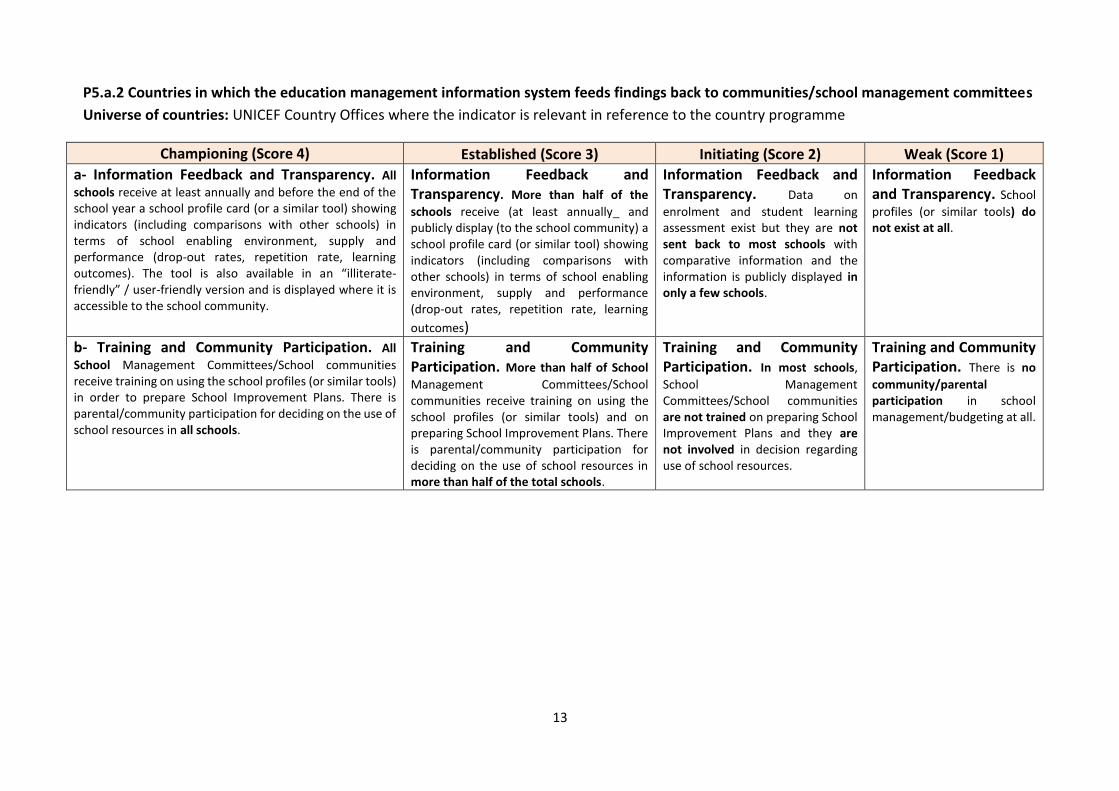
P5.a.2 Countries in which the education management information system feeds findings back to communities/school management committees
Universe of countries: UNICEF Country Offices where the indicator is relevant in reference to the country programme
Championing (Score 4) Established (Score 3) Initiating (Score 2) Weak (Score 1)
a- Information Feedback and Transparency. All
schools receive at least annually and before the end of the school year a school profile card (or a similar tool) showing indicators (including comparisons with other schools) in terms of school enabling environment, supply and performance (drop-out rates, repetition rate, learning outcomes). The tool is also available in an “illiterate-friendly” / user-friendly version and is displayed where it is accessible to the school community.
Information Feedback and Transparency. More than half of the
schools receive (at least annually_ and publicly display (to the school community) a school profile card (or similar tool) showing indicators (including comparisons with other schools) in terms of school enabling environment, supply and performance (drop-out rates, repetition rate, learning
outcomes)
Information Feedback and Transparency. Data on
enrolment and student learning assessment exist but they are not sent back to most schools with comparative information and the information is publicly displayed in only a few schools.
Information Feedback and Transparency. School
profiles (or similar tools) do not exist at all.
b- Training and Community Participation. All
School Management Committees/School communities receive training on using the school profiles (or similar tools) in order to prepare School Improvement Plans. There is parental/community participation for deciding on the use of school resources in all schools.
Training and Community Participation. More than half of School
Management Committees/School communities receive training on using the school profiles (or similar tools) and on preparing School Improvement Plans. There is parental/community participation for deciding on the use of school resources in more than half of the total schools.
Training and Community Participation. In most schools, School Management Committees/School communities are not trained on preparing School Improvement Plans and they are not involved in decision regarding use of school resources.
Training and Community Participation. There is no
community/parental participation in school management/budgeting at all.
14
P5.a.3 Number of School Management Committees or Parent Teacher
Associations or school communities (or similar structure) that received training
funded by UNICEF
School management structures should not be double counted, any individual structure should only be counted once. For example if 200 School Management Committees were trained on school planning and the same School Management Committees were trained on inclusive education, the total number of school structures reached would be 200, while if different School Management Committees were reached by the two interventions the total number would be 400. The types of training include: school management, school planning, school health/hygiene, inclusive education, financial management, etc
15
Output b: Increased national capacity to
provide access to early learning
opportunities and quality primary and
secondary education
16
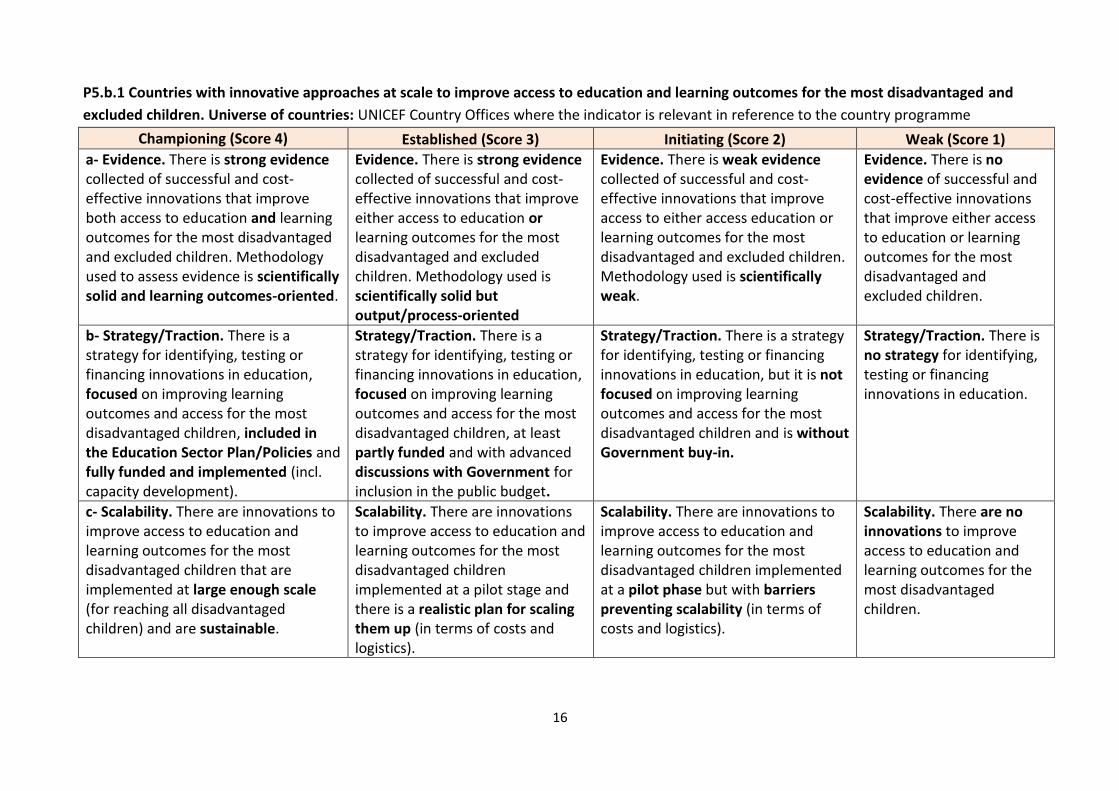
P5.b.1 Countries with innovative approaches at scale to improve access to education and learning outcomes for the most disadvantaged and
excluded children. Universe of countries: UNICEF Country Offices where the indicator is relevant in reference to the country programme
Championing (Score 4) Established (Score 3) Initiating (Score 2) Weak (Score 1)
a- Evidence. There is strong evidence collected of successful and cost-effective innovations that improve both access to education and learning outcomes for the most disadvantaged and excluded children. Methodology used to assess evidence is scientifically solid and learning outcomes-oriented.
Evidence. There is strong evidence collected of successful and cost-effective innovations that improve either access to education or learning outcomes for the most disadvantaged and excluded children. Methodology used is scientifically solid but output/process-oriented
Evidence. There is weak evidence collected of successful and cost-effective innovations that improve access to either access education or learning outcomes for the most disadvantaged and excluded children. Methodology used is scientifically weak.
Evidence. There is no evidence of successful and cost-effective innovations that improve either access to education or learning outcomes for the most disadvantaged and excluded children.
b- Strategy/Traction. There is a strategy for identifying, testing or financing innovations in education, focused on improving learning outcomes and access for the most disadvantaged children, included in the Education Sector Plan/Policies and fully funded and implemented (incl. capacity development).
Strategy/Traction. There is a strategy for identifying, testing or financing innovations in education, focused on improving learning outcomes and access for the most disadvantaged children, at least partly funded and with advanced discussions with Government for inclusion in the public budget.
Strategy/Traction. There is a strategy for identifying, testing or financing innovations in education, but it is not focused on improving learning outcomes and access for the most disadvantaged children and is without Government buy-in.
Strategy/Traction. There is no strategy for identifying, testing or financing innovations in education.
c- Scalability. There are innovations to improve access to education and learning outcomes for the most disadvantaged children that are implemented at large enough scale (for reaching all disadvantaged children) and are sustainable.
Scalability. There are innovations to improve access to education and learning outcomes for the most disadvantaged children implemented at a pilot stage and there is a realistic plan for scaling them up (in terms of costs and logistics).
Scalability. There are innovations to improve access to education and learning outcomes for the most disadvantaged children implemented at a pilot phase but with barriers preventing scalability (in terms of costs and logistics).
Scalability. There are no innovations to improve access to education and learning outcomes for the most disadvantaged children.
17
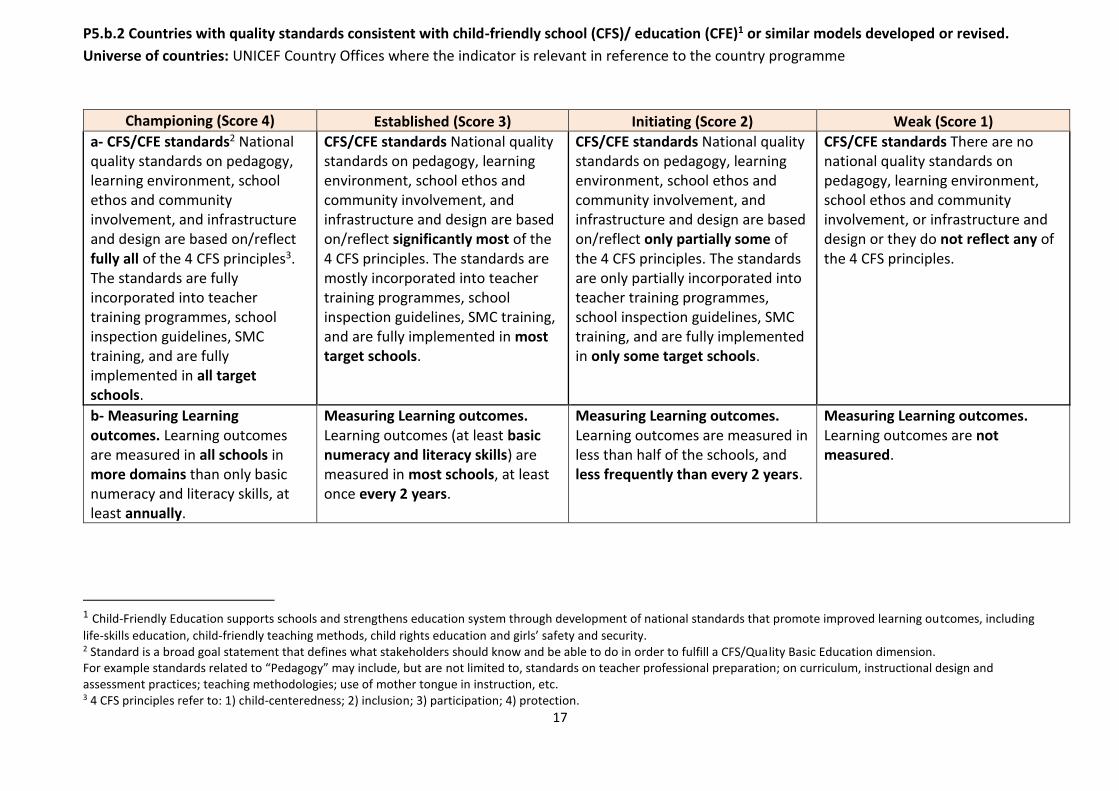
P5.b.2 Countries with quality standards consistent with child-friendly school (CFS)/ education (CFE)1 or similar models developed or revised.
Universe of countries: UNICEF Country Offices where the indicator is relevant in reference to the country programme
1 Child-Friendly Education supports schools and strengthens education system through development of national standards that promote improved learning outcomes, including
life-skills education, child-friendly teaching methods, child rights education and girls’ safety and security. 2 Standard is a broad goal statement that defines what stakeholders should know and be able to do in order to fulfill a CFS/Quality Basic Education dimension. For example standards related to “Pedagogy” may include, but are not limited to, standards on teacher professional preparation; on curriculum, instructional design and assessment practices; teaching methodologies; use of mother tongue in instruction, etc. 3 4 CFS principles refer to: 1) child-centeredness; 2) inclusion; 3) participation; 4) protection.
Championing (Score 4) Established (Score 3) Initiating (Score 2) Weak (Score 1)
a- CFS/CFE standards2 National quality standards on pedagogy, learning environment, school ethos and community involvement, and infrastructure and design are based on/reflect fully all of the 4 CFS principles3. The standards are fully incorporated into teacher training programmes, school inspection guidelines, SMC training, and are fully implemented in all target schools.
CFS/CFE standards National quality standards on pedagogy, learning environment, school ethos and community involvement, and infrastructure and design are based on/reflect significantly most of the 4 CFS principles. The standards are mostly incorporated into teacher training programmes, school inspection guidelines, SMC training, and are fully implemented in most target schools.
CFS/CFE standards National quality standards on pedagogy, learning environment, school ethos and community involvement, and infrastructure and design are based on/reflect only partially some of the 4 CFS principles. The standards are only partially incorporated into teacher training programmes, school inspection guidelines, SMC training, and are fully implemented in only some target schools.
CFS/CFE standards There are no national quality standards on pedagogy, learning environment, school ethos and community involvement, or infrastructure and design or they do not reflect any of the 4 CFS principles.
b- Measuring Learning outcomes. Learning outcomes are measured in all schools in more domains than only basic numeracy and literacy skills, at least annually.
Measuring Learning outcomes. Learning outcomes (at least basic numeracy and literacy skills) are measured in most schools, at least once every 2 years.
Measuring Learning outcomes. Learning outcomes are measured in less than half of the schools, and less frequently than every 2 years.
Measuring Learning outcomes. Learning outcomes are not measured.
18
P5.b.3 Number of children provided with individual education materials funded by
UNICEF
Children should not be double counted, any individual child should only be counted once. For example if 2,500 children were provided with one textbook each and the same children were provided with one back-to-school kit each, the total number of children reached would be 2,500, while if different children were reached by the two interventions the total number would be 5,000. The individual education materials considered are those materials that are intended to be used by one child e.g. textbooks, drawing books, back-to-school kits, notebooks, student desks and benches (to be counted per child seat), school bags, etc.
P5.b.4 Number of classrooms provided with classroom education materials funded by
UNICEF
Classrooms should not be double counted, any individual classroom should only be counted once. For example if 200 classrooms were provided with one teachers’ guide each and the same classrooms were provided with one school-in-a-box each, the total number of classrooms reached would be 200, while if different classrooms were reached by the two interventions the total number would be 400. The classroom education materials considered are those materials that benefit an entire classroom of children e.g. school-in-a-box, teachers’ guides, chalk boards, posters, maps, bookshelves etc.
19
Output c: Strengthened political commitment,
accountability and national capacity to
legislate, plan and budget for scaling-up quality
and inclusive education
20
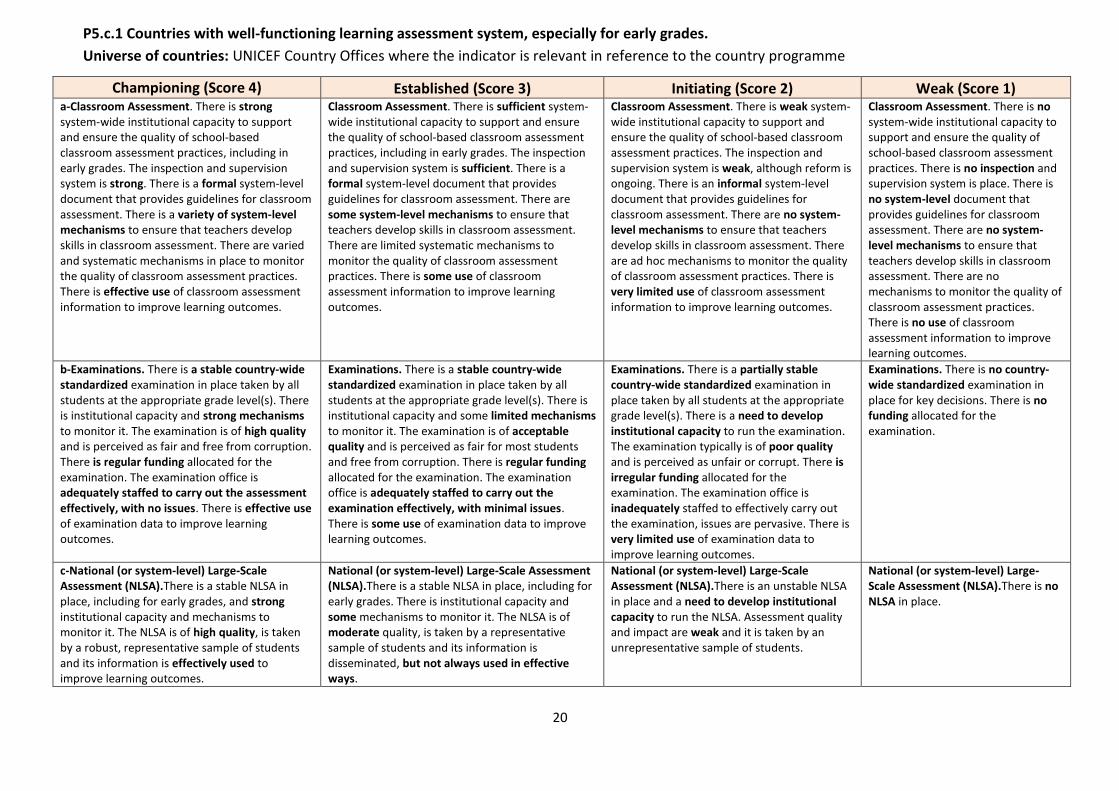
P5.c.1 Countries with well-functioning learning assessment system, especially for early grades.
Universe of countries: UNICEF Country Offices where the indicator is relevant in reference to the country programme
Championing (Score 4) Established (Score 3) Initiating (Score 2) Weak (Score 1) a-Classroom Assessment. There is strong system-wide institutional capacity to support and ensure the quality of school-based classroom assessment practices, including in early grades. The inspection and supervision system is strong. There is a formal system-level document that provides guidelines for classroom assessment. There is a variety of system-level mechanisms to ensure that teachers develop skills in classroom assessment. There are varied and systematic mechanisms in place to monitor the quality of classroom assessment practices. There is effective use of classroom assessment information to improve learning outcomes.
Classroom Assessment. There is sufficient system-wide institutional capacity to support and ensure the quality of school-based classroom assessment practices, including in early grades. The inspection and supervision system is sufficient. There is a formal system-level document that provides guidelines for classroom assessment. There are some system-level mechanisms to ensure that teachers develop skills in classroom assessment. There are limited systematic mechanisms to monitor the quality of classroom assessment practices. There is some use of classroom assessment information to improve learning outcomes.
Classroom Assessment. There is weak system-wide institutional capacity to support and ensure the quality of school-based classroom assessment practices. The inspection and supervision system is weak, although reform is ongoing. There is an informal system-level document that provides guidelines for classroom assessment. There are no system-level mechanisms to ensure that teachers develop skills in classroom assessment. There are ad hoc mechanisms to monitor the quality of classroom assessment practices. There is very limited use of classroom assessment information to improve learning outcomes.
Classroom Assessment. There is no system-wide institutional capacity to support and ensure the quality of school-based classroom assessment practices. There is no inspection and supervision system is place. There is no system-level document that provides guidelines for classroom assessment. There are no system-level mechanisms to ensure that teachers develop skills in classroom assessment. There are no mechanisms to monitor the quality of classroom assessment practices. There is no use of classroom assessment information to improve learning outcomes.
b-Examinations. There is a stable country-wide standardized examination in place taken by all students at the appropriate grade level(s). There is institutional capacity and strong mechanisms to monitor it. The examination is of high quality and is perceived as fair and free from corruption. There is regular funding allocated for the examination. The examination office is adequately staffed to carry out the assessment effectively, with no issues. There is effective use of examination data to improve learning outcomes.
Examinations. There is a stable country-wide standardized examination in place taken by all students at the appropriate grade level(s). There is institutional capacity and some limited mechanisms to monitor it. The examination is of acceptable quality and is perceived as fair for most students and free from corruption. There is regular funding allocated for the examination. The examination office is adequately staffed to carry out the examination effectively, with minimal issues. There is some use of examination data to improve learning outcomes.
Examinations. There is a partially stable country-wide standardized examination in place taken by all students at the appropriate grade level(s). There is a need to develop institutional capacity to run the examination. The examination typically is of poor quality and is perceived as unfair or corrupt. There is irregular funding allocated for the examination. The examination office is inadequately staffed to effectively carry out the examination, issues are pervasive. There is very limited use of examination data to improve learning outcomes.
Examinations. There is no country-wide standardized examination in place for key decisions. There is no funding allocated for the examination.
c-National (or system-level) Large-Scale Assessment (NLSA).There is a stable NLSA in place, including for early grades, and strong institutional capacity and mechanisms to monitor it. The NLSA is of high quality, is taken by a robust, representative sample of students and its information is effectively used to improve learning outcomes.
National (or system-level) Large-Scale Assessment (NLSA).There is a stable NLSA in place, including for early grades. There is institutional capacity and some mechanisms to monitor it. The NLSA is of moderate quality, is taken by a representative sample of students and its information is disseminated, but not always used in effective ways.
National (or system-level) Large-Scale Assessment (NLSA).There is an unstable NLSA in place and a need to develop institutional capacity to run the NLSA. Assessment quality and impact are weak and it is taken by an unrepresentative sample of students.
National (or system-level) Large-Scale Assessment (NLSA).There is no NLSA in place.
21
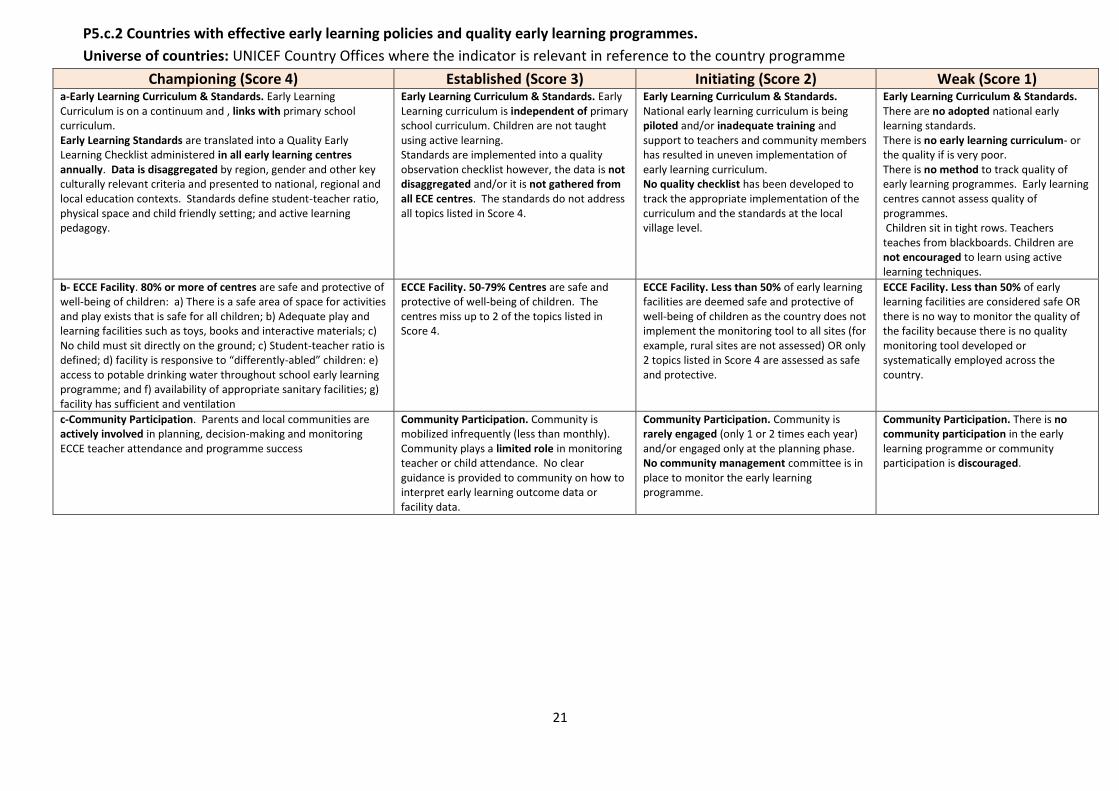
P5.c.2 Countries with effective early learning policies and quality early learning programmes.
Universe of countries: UNICEF Country Offices where the indicator is relevant in reference to the country programme
Championing (Score 4) Established (Score 3) Initiating (Score 2) Weak (Score 1)
a-Early Learning Curriculum & Standards. Early Learning Curriculum is on a continuum and , links with primary school curriculum. Early Learning Standards are translated into a Quality Early Learning Checklist administered in all early learning centres annually. Data is disaggregated by region, gender and other key culturally relevant criteria and presented to national, regional and local education contexts. Standards define student-teacher ratio, physical space and child friendly setting; and active learning pedagogy.
Early Learning Curriculum & Standards. Early Learning curriculum is independent of primary school curriculum. Children are not taught using active learning. Standards are implemented into a quality observation checklist however, the data is not disaggregated and/or it is not gathered from all ECE centres. The standards do not address all topics listed in Score 4.
Early Learning Curriculum & Standards. National early learning curriculum is being piloted and/or inadequate training and support to teachers and community members has resulted in uneven implementation of early learning curriculum. No quality checklist has been developed to track the appropriate implementation of the curriculum and the standards at the local village level.
Early Learning Curriculum & Standards. There are no adopted national early learning standards. There is no early learning curriculum- or the quality if is very poor. There is no method to track quality of early learning programmes. Early learning centres cannot assess quality of programmes. Children sit in tight rows. Teachers teaches from blackboards. Children are not encouraged to learn using active learning techniques.
b- ECCE Facility. 80% or more of centres are safe and protective of well-being of children: a) There is a safe area of space for activities and play exists that is safe for all children; b) Adequate play and learning facilities such as toys, books and interactive materials; c) No child must sit directly on the ground; c) Student-teacher ratio is defined; d) facility is responsive to “differently-abled” children: e) access to potable drinking water throughout school early learning programme; and f) availability of appropriate sanitary facilities; g) facility has sufficient and ventilation
ECCE Facility. 50-79% Centres are safe and protective of well-being of children. The centres miss up to 2 of the topics listed in Score 4.
ECCE Facility. Less than 50% of early learning facilities are deemed safe and protective of well-being of children as the country does not implement the monitoring tool to all sites (for example, rural sites are not assessed) OR only 2 topics listed in Score 4 are assessed as safe and protective.
ECCE Facility. Less than 50% of early learning facilities are considered safe OR there is no way to monitor the quality of the facility because there is no quality monitoring tool developed or systematically employed across the country.
c-Community Participation. Parents and local communities are actively involved in planning, decision-making and monitoring ECCE teacher attendance and programme success
Community Participation. Community is mobilized infrequently (less than monthly). Community plays a limited role in monitoring teacher or child attendance. No clear guidance is provided to community on how to interpret early learning outcome data or facility data.
Community Participation. Community is rarely engaged (only 1 or 2 times each year) and/or engaged only at the planning phase. No community management committee is in place to monitor the early learning programme.
Community Participation. There is no community participation in the early learning programme or community participation is discouraged.
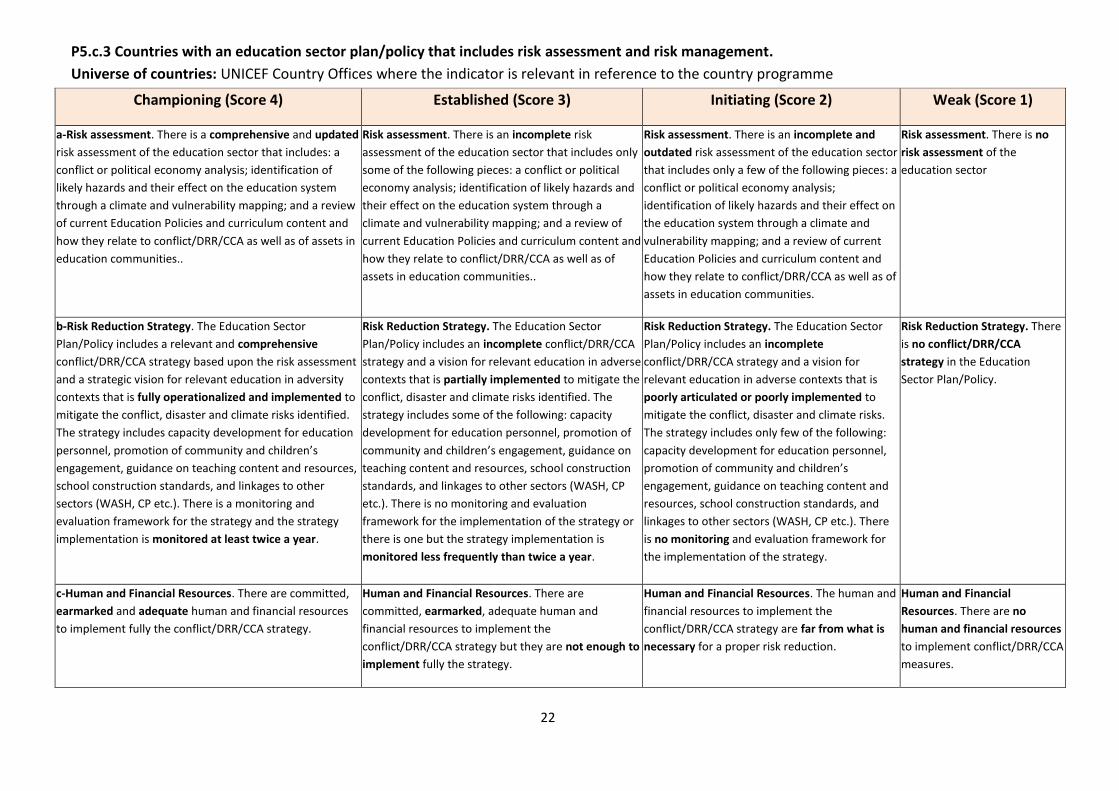
22
P5.c.3 Countries with an education sector plan/policy that includes risk assessment and risk management.
Universe of countries: UNICEF Country Offices where the indicator is relevant in reference to the country programme
Championing (Score 4) Established (Score 3) Initiating (Score 2) Weak (Score 1)
a-Risk assessment. There is a comprehensive and updated
risk assessment of the education sector that includes: a
conflict or political economy analysis; identification of
likely hazards and their effect on the education system
through a climate and vulnerability mapping; and a review
of current Education Policies and curriculum content and
how they relate to conflict/DRR/CCA as well as of assets in
education communities..
Risk assessment. There is an incomplete risk
assessment of the education sector that includes only
some of the following pieces: a conflict or political
economy analysis; identification of likely hazards and
their effect on the education system through a
climate and vulnerability mapping; and a review of
current Education Policies and curriculum content and
how they relate to conflict/DRR/CCA as well as of
assets in education communities..
Risk assessment. There is an incomplete and
outdated risk assessment of the education sector
that includes only a few of the following pieces: a
conflict or political economy analysis;
identification of likely hazards and their effect on
the education system through a climate and
vulnerability mapping; and a review of current
Education Policies and curriculum content and
how they relate to conflict/DRR/CCA as well as of
assets in education communities.
Risk assessment. There is no
risk assessment of the
education sector
b-Risk Reduction Strategy. The Education Sector
Plan/Policy includes a relevant and comprehensive
conflict/DRR/CCA strategy based upon the risk assessment
and a strategic vision for relevant education in adversity
contexts that is fully operationalized and implemented to
mitigate the conflict, disaster and climate risks identified.
The strategy includes capacity development for education
personnel, promotion of community and children’s
engagement, guidance on teaching content and resources,
school construction standards, and linkages to other
sectors (WASH, CP etc.). There is a monitoring and
evaluation framework for the strategy and the strategy
implementation is monitored at least twice a year.
Risk Reduction Strategy. The Education Sector
Plan/Policy includes an incomplete conflict/DRR/CCA
strategy and a vision for relevant education in adverse
contexts that is partially implemented to mitigate the
conflict, disaster and climate risks identified. The
strategy includes some of the following: capacity
development for education personnel, promotion of
community and children’s engagement, guidance on
teaching content and resources, school construction
standards, and linkages to other sectors (WASH, CP
etc.). There is no monitoring and evaluation
framework for the implementation of the strategy or
there is one but the strategy implementation is
monitored less frequently than twice a year.
Risk Reduction Strategy. The Education Sector
Plan/Policy includes an incomplete
conflict/DRR/CCA strategy and a vision for
relevant education in adverse contexts that is
poorly articulated or poorly implemented to
mitigate the conflict, disaster and climate risks.
The strategy includes only few of the following:
capacity development for education personnel,
promotion of community and children’s
engagement, guidance on teaching content and
resources, school construction standards, and
linkages to other sectors (WASH, CP etc.). There
is no monitoring and evaluation framework for
the implementation of the strategy.
Risk Reduction Strategy. There
is no conflict/DRR/CCA
strategy in the Education
Sector Plan/Policy.
c-Human and Financial Resources. There are committed,
earmarked and adequate human and financial resources
to implement fully the conflict/DRR/CCA strategy.
Human and Financial Resources. There are
committed, earmarked, adequate human and
financial resources to implement the
conflict/DRR/CCA strategy but they are not enough to
implement fully the strategy.
Human and Financial Resources. The human and
financial resources to implement the
conflict/DRR/CCA strategy are far from what is
necessary for a proper risk reduction.
Human and Financial
Resources. There are no
human and financial resources
to implement conflict/DRR/CCA
measures.
23
Output d: Increased country capacity and
delivery of services to ensure girls and boys
access to safe and secure forms of education
and critical information for their own well-
being in humanitarian situations
24
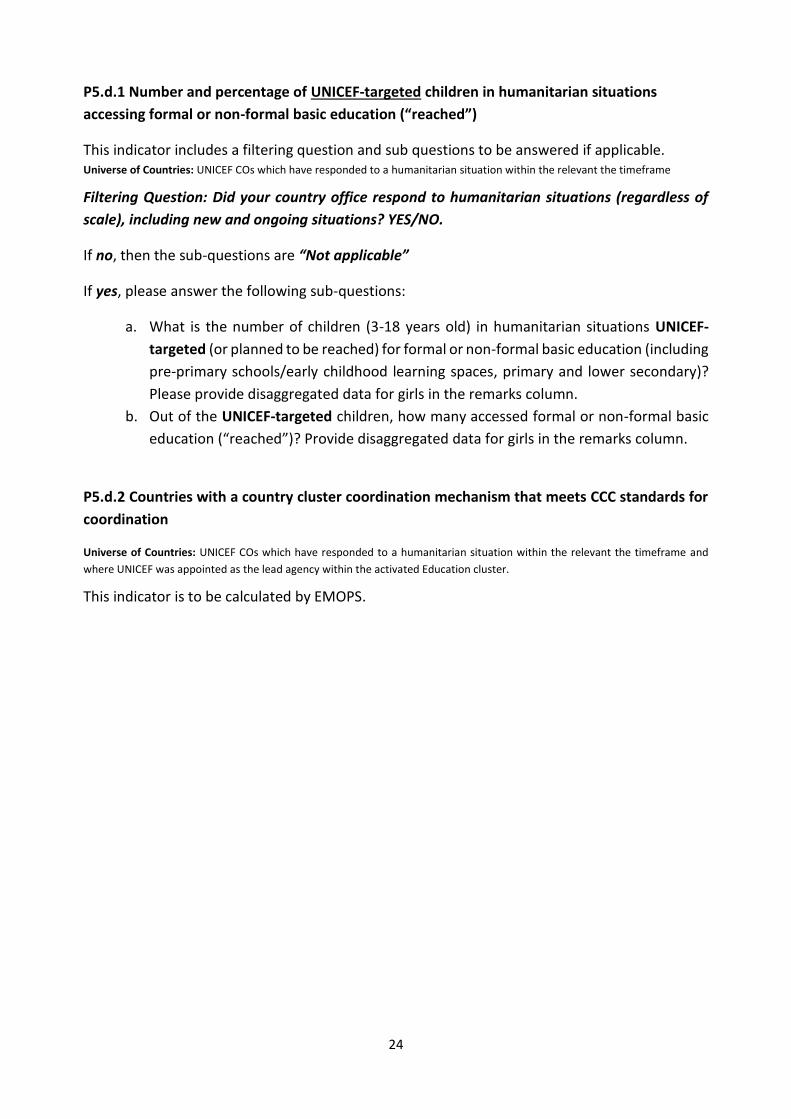
P5.d.1 Number and percentage of UNICEF-targeted children in humanitarian situations
accessing formal or non-formal basic education (“reached”)
This indicator includes a filtering question and sub questions to be answered if applicable. Universe of Countries: UNICEF COs which have responded to a humanitarian situation within the relevant the timeframe
Filtering Question: Did your country office respond to humanitarian situations (regardless of
scale), including new and ongoing situations? YES/NO.
If no, then the sub-questions are “Not applicable”
If yes, please answer the following sub-questions:
a. What is the number of children (3-18 years old) in humanitarian situations UNICEF-
targeted (or planned to be reached) for formal or non-formal basic education (including
pre-primary schools/early childhood learning spaces, primary and lower secondary)?
Please provide disaggregated data for girls in the remarks column.
b. Out of the UNICEF-targeted children, how many accessed formal or non-formal basic
education (“reached”)? Provide disaggregated data for girls in the remarks column.
P5.d.2 Countries with a country cluster coordination mechanism that meets CCC standards for
coordination
Universe of Countries: UNICEF COs which have responded to a humanitarian situation within the relevant the timeframe and
where UNICEF was appointed as the lead agency within the activated Education cluster.
This indicator is to be calculated by EMOPS.
25
Output e: Increased capacity of governments
and partners, as duty-bearers, to identify
and respond to key human rights and gender
equality dimensions of school readiness and
performance
26
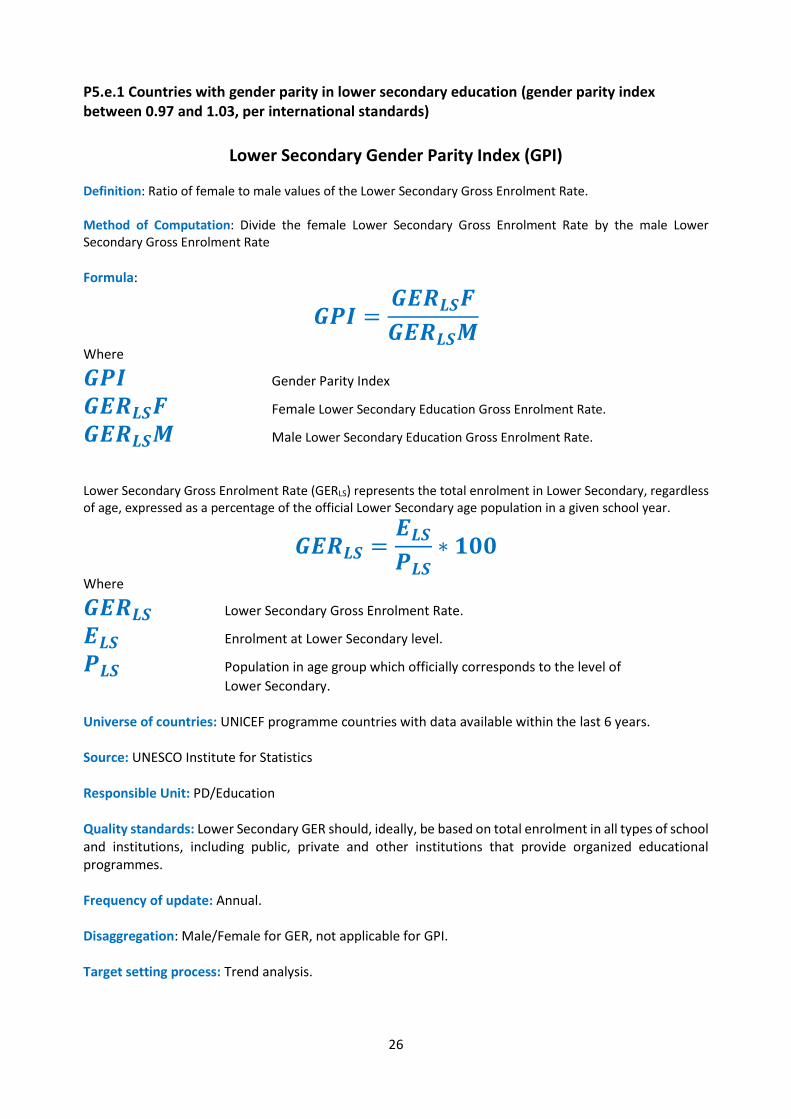
P5.e.1 Countries with gender parity in lower secondary education (gender parity index between 0.97 and 1.03, per international standards)
Lower Secondary Gender Parity Index (GPI)
Definition: Ratio of female to male values of the Lower Secondary Gross Enrolment Rate. Method of Computation: Divide the female Lower Secondary Gross Enrolment Rate by the male Lower Secondary Gross Enrolment Rate
Formula:
𝑮𝑷𝑰 =𝑮𝑬𝑹𝑳𝑺𝑭
𝑮𝑬𝑹𝑳𝑺𝑴
Where
𝑮𝑷𝑰 Gender Parity Index
𝑮𝑬𝑹𝑳𝑺𝑭 Female Lower Secondary Education Gross Enrolment Rate.
𝑮𝑬𝑹𝑳𝑺𝑴 Male Lower Secondary Education Gross Enrolment Rate.
Lower Secondary Gross Enrolment Rate (GERLS) represents the total enrolment in Lower Secondary, regardless of age, expressed as a percentage of the official Lower Secondary age population in a given school year.
𝑮𝑬𝑹𝑳𝑺 =𝑬𝑳𝑺
𝑷𝑳𝑺∗ 𝟏𝟎𝟎
Where
𝑮𝑬𝑹𝑳𝑺 Lower Secondary Gross Enrolment Rate.
𝑬𝑳𝑺 Enrolment at Lower Secondary level.
𝑷𝑳𝑺 Population in age group which officially corresponds to the level of
Lower Secondary. Universe of countries: UNICEF programme countries with data available within the last 6 years. Source: UNESCO Institute for Statistics Responsible Unit: PD/Education Quality standards: Lower Secondary GER should, ideally, be based on total enrolment in all types of school and institutions, including public, private and other institutions that provide organized educational programmes. Frequency of update: Annual. Disaggregation: Male/Female for GER, not applicable for GPI. Target setting process: Trend analysis.
27
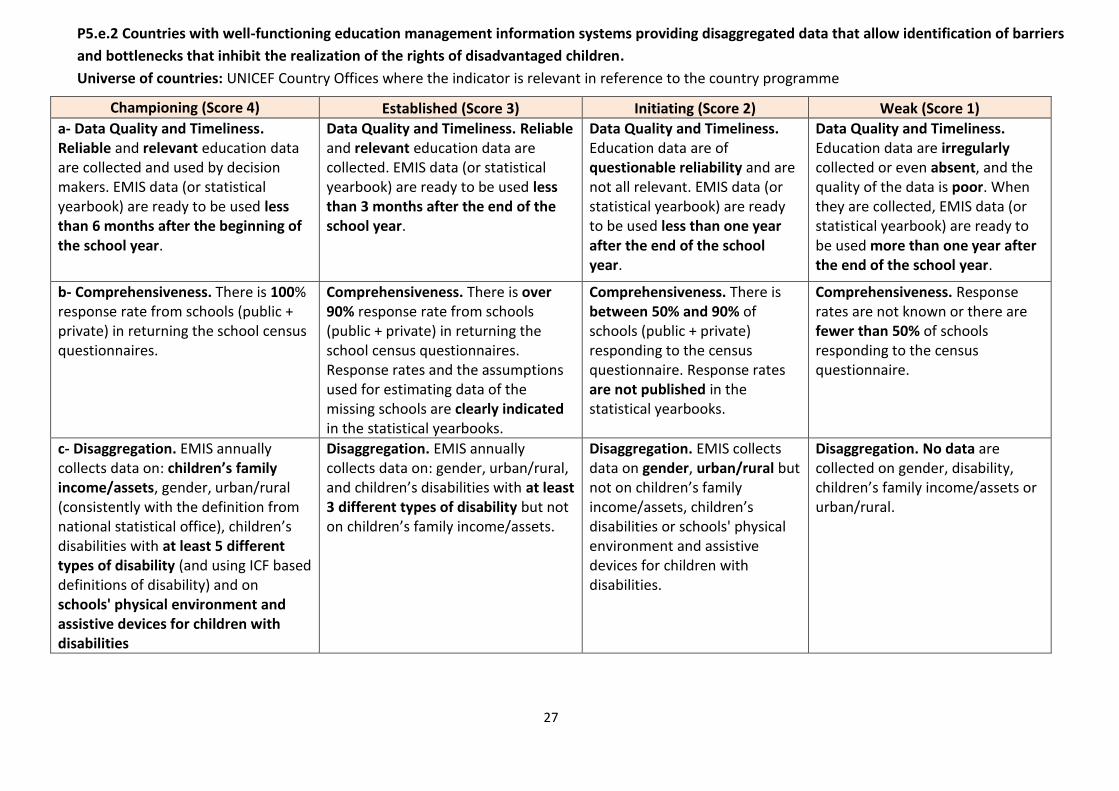
P5.e.2 Countries with well-functioning education management information systems providing disaggregated data that allow identification of barriers
and bottlenecks that inhibit the realization of the rights of disadvantaged children.
Universe of countries: UNICEF Country Offices where the indicator is relevant in reference to the country programme
Championing (Score 4) Established (Score 3) Initiating (Score 2) Weak (Score 1)
a- Data Quality and Timeliness. Reliable and relevant education data are collected and used by decision makers. EMIS data (or statistical yearbook) are ready to be used less than 6 months after the beginning of the school year.
Data Quality and Timeliness. Reliable and relevant education data are collected. EMIS data (or statistical yearbook) are ready to be used less than 3 months after the end of the school year.
Data Quality and Timeliness. Education data are of questionable reliability and are not all relevant. EMIS data (or statistical yearbook) are ready to be used less than one year after the end of the school year.
Data Quality and Timeliness. Education data are irregularly collected or even absent, and the quality of the data is poor. When they are collected, EMIS data (or statistical yearbook) are ready to be used more than one year after the end of the school year.
b- Comprehensiveness. There is 100% response rate from schools (public + private) in returning the school census questionnaires.
Comprehensiveness. There is over 90% response rate from schools (public + private) in returning the school census questionnaires. Response rates and the assumptions used for estimating data of the missing schools are clearly indicated in the statistical yearbooks.
Comprehensiveness. There is between 50% and 90% of schools (public + private) responding to the census questionnaire. Response rates are not published in the statistical yearbooks.
Comprehensiveness. Response rates are not known or there are fewer than 50% of schools responding to the census questionnaire.
c- Disaggregation. EMIS annually collects data on: children’s family income/assets, gender, urban/rural (consistently with the definition from national statistical office), children’s disabilities with at least 5 different types of disability (and using ICF based definitions of disability) and on schools' physical environment and assistive devices for children with disabilities
Disaggregation. EMIS annually collects data on: gender, urban/rural, and children’s disabilities with at least 3 different types of disability but not on children’s family income/assets.
Disaggregation. EMIS collects data on gender, urban/rural but not on children’s family income/assets, children’s disabilities or schools' physical environment and assistive devices for children with disabilities.
Disaggregation. No data are collected on gender, disability, children’s family income/assets or urban/rural.
28
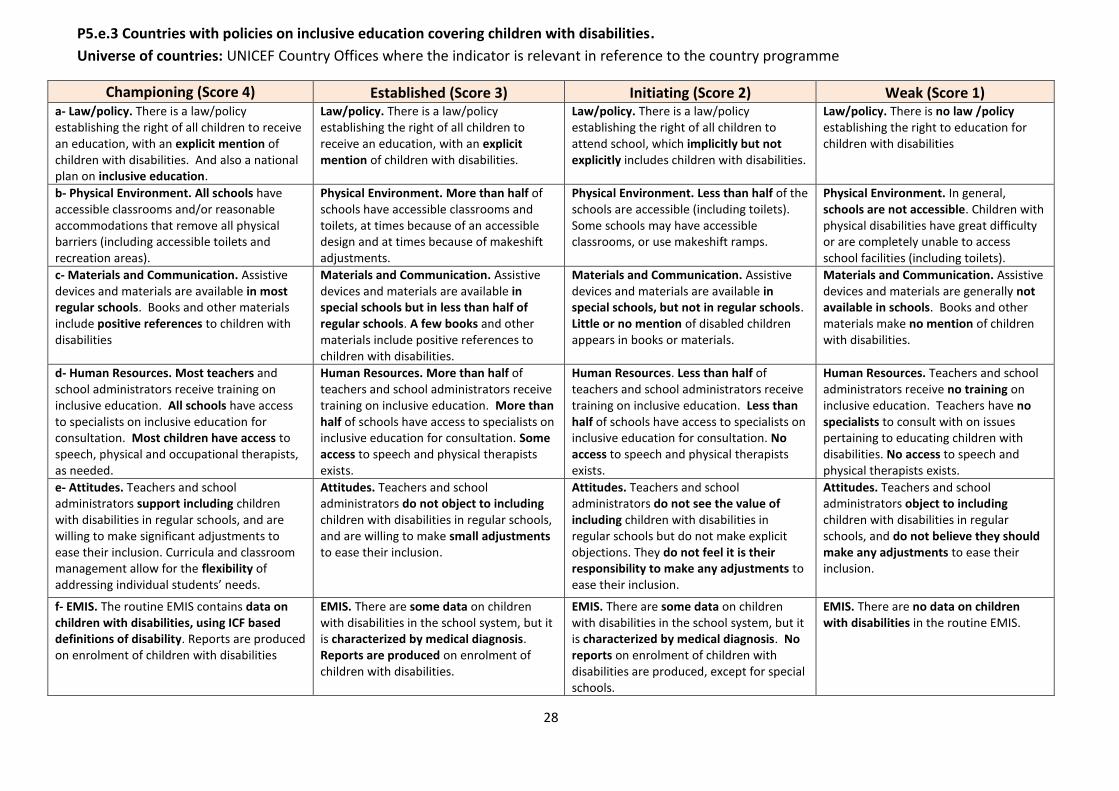
P5.e.3 Countries with policies on inclusive education covering children with disabilities.
Universe of countries: UNICEF Country Offices where the indicator is relevant in reference to the country programme
Championing (Score 4) Established (Score 3) Initiating (Score 2) Weak (Score 1)
a- Law/policy. There is a law/policy establishing the right of all children to receive an education, with an explicit mention of children with disabilities. And also a national plan on inclusive education.
Law/policy. There is a law/policy establishing the right of all children to receive an education, with an explicit mention of children with disabilities.
Law/policy. There is a law/policy establishing the right of all children to attend school, which implicitly but not explicitly includes children with disabilities.
Law/policy. There is no law /policy establishing the right to education for children with disabilities
b- Physical Environment. All schools have accessible classrooms and/or reasonable accommodations that remove all physical barriers (including accessible toilets and recreation areas).
Physical Environment. More than half of schools have accessible classrooms and toilets, at times because of an accessible design and at times because of makeshift adjustments.
Physical Environment. Less than half of the schools are accessible (including toilets). Some schools may have accessible classrooms, or use makeshift ramps.
Physical Environment. In general, schools are not accessible. Children with physical disabilities have great difficulty or are completely unable to access school facilities (including toilets).
c- Materials and Communication. Assistive devices and materials are available in most regular schools. Books and other materials include positive references to children with disabilities
Materials and Communication. Assistive devices and materials are available in special schools but in less than half of regular schools. A few books and other materials include positive references to children with disabilities.
Materials and Communication. Assistive devices and materials are available in special schools, but not in regular schools. Little or no mention of disabled children appears in books or materials.
Materials and Communication. Assistive devices and materials are generally not available in schools. Books and other materials make no mention of children with disabilities.
d- Human Resources. Most teachers and school administrators receive training on inclusive education. All schools have access to specialists on inclusive education for consultation. Most children have access to speech, physical and occupational therapists, as needed.
Human Resources. More than half of teachers and school administrators receive training on inclusive education. More than half of schools have access to specialists on inclusive education for consultation. Some access to speech and physical therapists exists.
Human Resources. Less than half of teachers and school administrators receive training on inclusive education. Less than half of schools have access to specialists on inclusive education for consultation. No access to speech and physical therapists exists.
Human Resources. Teachers and school administrators receive no training on inclusive education. Teachers have no specialists to consult with on issues pertaining to educating children with disabilities. No access to speech and physical therapists exists.
e- Attitudes. Teachers and school administrators support including children with disabilities in regular schools, and are willing to make significant adjustments to ease their inclusion. Curricula and classroom management allow for the flexibility of addressing individual students’ needs.
Attitudes. Teachers and school administrators do not object to including children with disabilities in regular schools, and are willing to make small adjustments to ease their inclusion.
Attitudes. Teachers and school administrators do not see the value of including children with disabilities in regular schools but do not make explicit objections. They do not feel it is their responsibility to make any adjustments to ease their inclusion.
Attitudes. Teachers and school administrators object to including children with disabilities in regular schools, and do not believe they should make any adjustments to ease their inclusion.
f- EMIS. The routine EMIS contains data on children with disabilities, using ICF based definitions of disability. Reports are produced on enrolment of children with disabilities
EMIS. There are some data on children with disabilities in the school system, but it is characterized by medical diagnosis. Reports are produced on enrolment of children with disabilities.
EMIS. There are some data on children with disabilities in the school system, but it is characterized by medical diagnosis. No reports on enrolment of children with disabilities are produced, except for special schools.
EMIS. There are no data on children with disabilities in the routine EMIS.
29
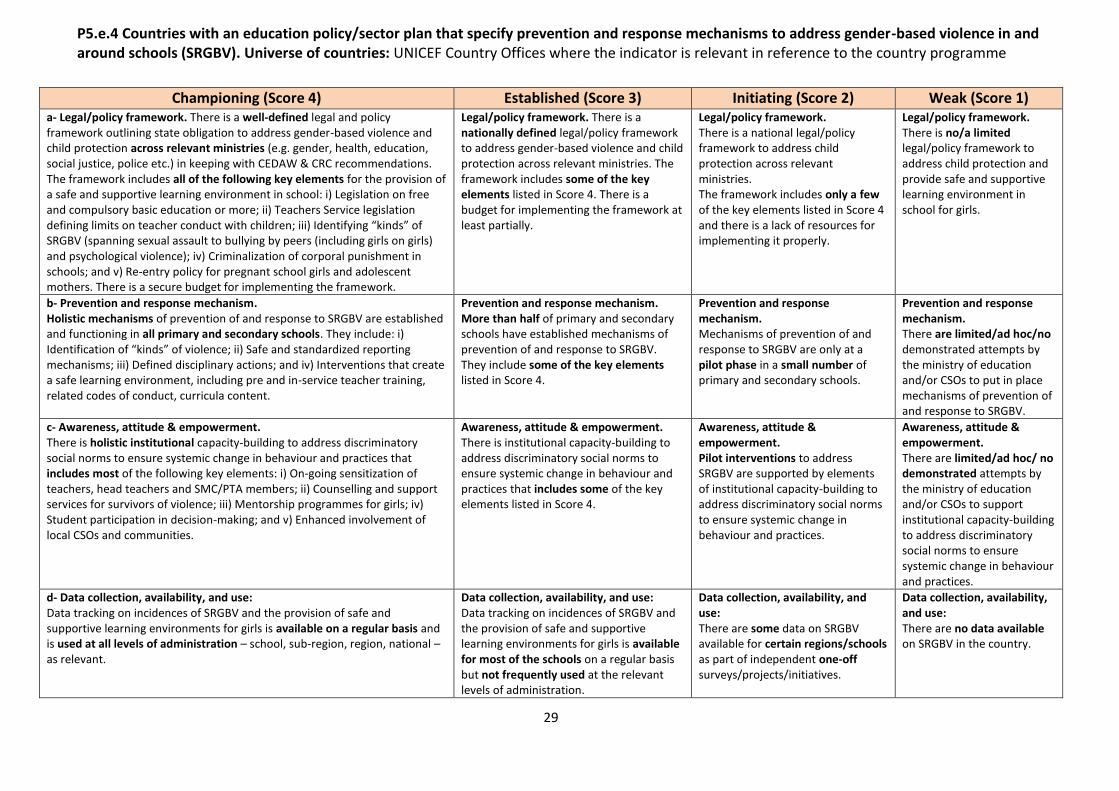
P5.e.4 Countries with an education policy/sector plan that specify prevention and response mechanisms to address gender-based violence in and around schools (SRGBV). Universe of countries: UNICEF Country Offices where the indicator is relevant in reference to the country programme
Championing (Score 4) Established (Score 3) Initiating (Score 2) Weak (Score 1)
a- Legal/policy framework. There is a well-defined legal and policy framework outlining state obligation to address gender-based violence and child protection across relevant ministries (e.g. gender, health, education, social justice, police etc.) in keeping with CEDAW & CRC recommendations. The framework includes all of the following key elements for the provision of a safe and supportive learning environment in school: i) Legislation on free and compulsory basic education or more; ii) Teachers Service legislation defining limits on teacher conduct with children; iii) Identifying “kinds” of SRGBV (spanning sexual assault to bullying by peers (including girls on girls) and psychological violence); iv) Criminalization of corporal punishment in schools; and v) Re-entry policy for pregnant school girls and adolescent mothers. There is a secure budget for implementing the framework.
Legal/policy framework. There is a nationally defined legal/policy framework to address gender-based violence and child protection across relevant ministries. The framework includes some of the key elements listed in Score 4. There is a budget for implementing the framework at least partially.
Legal/policy framework. There is a national legal/policy framework to address child protection across relevant ministries. The framework includes only a few of the key elements listed in Score 4 and there is a lack of resources for implementing it properly.
Legal/policy framework. There is no/a limited legal/policy framework to address child protection and provide safe and supportive learning environment in school for girls.
b- Prevention and response mechanism. Holistic mechanisms of prevention of and response to SRGBV are established and functioning in all primary and secondary schools. They include: i) Identification of “kinds” of violence; ii) Safe and standardized reporting mechanisms; iii) Defined disciplinary actions; and iv) Interventions that create a safe learning environment, including pre and in-service teacher training, related codes of conduct, curricula content.
Prevention and response mechanism. More than half of primary and secondary schools have established mechanisms of prevention of and response to SRGBV. They include some of the key elements listed in Score 4.
Prevention and response mechanism. Mechanisms of prevention of and response to SRGBV are only at a pilot phase in a small number of primary and secondary schools.
Prevention and response mechanism. There are limited/ad hoc/no demonstrated attempts by the ministry of education and/or CSOs to put in place mechanisms of prevention of and response to SRGBV.
c- Awareness, attitude & empowerment. There is holistic institutional capacity-building to address discriminatory social norms to ensure systemic change in behaviour and practices that includes most of the following key elements: i) On-going sensitization of teachers, head teachers and SMC/PTA members; ii) Counselling and support services for survivors of violence; iii) Mentorship programmes for girls; iv) Student participation in decision-making; and v) Enhanced involvement of local CSOs and communities.
Awareness, attitude & empowerment. There is institutional capacity-building to address discriminatory social norms to ensure systemic change in behaviour and practices that includes some of the key elements listed in Score 4.
Awareness, attitude & empowerment. Pilot interventions to address SRGBV are supported by elements of institutional capacity-building to address discriminatory social norms to ensure systemic change in behaviour and practices.
Awareness, attitude & empowerment. There are limited/ad hoc/ no demonstrated attempts by the ministry of education and/or CSOs to support institutional capacity-building to address discriminatory social norms to ensure systemic change in behaviour and practices.
d- Data collection, availability, and use: Data tracking on incidences of SRGBV and the provision of safe and supportive learning environments for girls is available on a regular basis and is used at all levels of administration – school, sub-region, region, national – as relevant.
Data collection, availability, and use: Data tracking on incidences of SRGBV and the provision of safe and supportive learning environments for girls is available for most of the schools on a regular basis but not frequently used at the relevant levels of administration.
Data collection, availability, and use: There are some data on SRGBV available for certain regions/schools as part of independent one-off surveys/projects/initiatives.
Data collection, availability, and use: There are no data available on SRGBV in the country.
30
P5.e.5 Countries where girls’ secondary education, in terms of access, retention, and learning is a recognised, targeted and budgeted priority Universe of countries: UNICEF Country Offices where the indicator is relevant in reference to the country programme
Championing (Score 4) Established (Score 3) Initiating (Score 2) Weak (Score 1) a- Creating demand: Context-specific, targeted, and effective strategies based on formative research and evidence to address socio-cultural and financial barriers to promote girls’ participation and retention in secondary education are designed, implemented and monitored with a focus on: Strategic communication and community mobilization to address behavior change and discriminatory gendered social norms; & social protection measures, including cash transfers, and availability of scholarships and stipends to incentivize school participation and retention of girls.
Creating demand: Context-specific, targeted, and effective strategies based on formative research and evidence to address one of the barriers - either socio-cultural or financial barriers - to promote girls’ participation and retention in secondary education are designed, implemented and monitored.
Creating demand: Generic strategies to address socio-cultural and/or financial barriers to promote girls’ participation and retention in secondary education exist, however their implementation is patchy and monitoring remains weak.
Creating demand: No formative research and identified strategies or plans exist to address socio-cultural and financial constraints to promote girls’ participation and retention in secondary education;
b- Supportive learning environment: The national education policy/sector plan includes comprehensive support to gender-responsive learning environments with regard to improved: Availability of teachers, including a growing pool of female teachers, and quality of teaching; Updated and gender-responsive curricula and learning materials, including expansion of STEM (Science, technology, Engineering & Maths) and life-skills learning opportunities; Sanitation infrastructure and hygiene education including menstrual hygiene management (MHM); and, the corresponding activities are fully implemented in most secondary schools.
Supportive learning environment: The national education policy/sector plan includes some support to gender-responsive learning environments with regard to improved: Availability of teachers, including a growing pool of female teachers, and quality of teaching; Updated and gender-responsive curricula and learning materials, including expansion of STEM learning opportunities; Sanitation infrastructure and hygiene education including menstrual hygiene management (MHM); and, the corresponding activities are –at least partially- implemented in secondary schools.
Supportive learning environment: The national education policy/sector plan includes some support to gender-responsive learning environments with regard to improved: Availability of teachers, including a growing pool of female teachers, and quality of teaching; Updated and gender-responsive curricula and learning materials, including expansion of STEM learning opportunities; Sanitation infrastructure and hygiene education including menstrual hygiene management (MHM); But, the corresponding activities are not implemented in most secondary schools.
Supportive learning environment: The national education policy/sector plan does not include any support to gender-responsive learning environments
c- Prioritisation and resource allocation: National education strategy/sector plan: Prioritizes and identifies clear targets to improve access, retention, and learning in secondary education with a well-defined focus on girls’ education and gender equality; & Supported by clear as well as sufficient budget lines.
Prioritisation and resource allocation: National education strategy/sector plan: Prioritizes and identifies clear targets to improve at least one aspect of secondary education – access, retention, and learning - with a well-defined focus on girls’ education and gender equality; & Supported by clear but insufficient budget lines.
Prioritisation and resource allocation: National education strategy/sector plan: Prioritizes secondary education with a defined focus on girls’ education and gender equality, however no firm targets are identified; & Allocated some funding through generic budget lines.
Prioritisation and resource allocation: National education strategy or sector plan does not prioritize and identify targets to improve access, retention, and learning in secondary education with a defined focus on girls’ education and gender equality; and nor does it have any allocated budget.
31
P5.e.6 Countries with an education policy/sector plan that includes multilingual education to allow children to learn in their mother tongue during the
early grades
Universe of countries: UNICEF Country Offices where the indicator is relevant in reference to the country programme
Championing (Score 4) Established (Score 3) Initiating (Score 2) Weak (Score 1)
a- Policy environment. There is a national law or policy establishing the right of all children to receive education in their mother tongue at least during the early grades of primary school.
Policy environment. The education policy promotes the use of minority languages in the classroom at least in early grades of primary education.
Policy environment. The education policy impedes the use of minority languages in the classroom
Policy environment. The education policy forbids completely the use of minority languages in the classroom.
b- Alignment. Mother tongue instruction is strongly reflected in teacher training, recruitment and deployment processes and in pupil assessment systems.
Alignment. Mother tongue instruction is partially reflected in teacher training, recruitment and deployment processes and in pupil assessment systems.
Alignment. Mother tongue instruction is largely ignored in teacher training, recruitment and deployment processes and in pupil assessment systems.
Alignment. Mother tongue instruction is not reflected in teacher training, recruitment and deployment processes or in pupil assessment systems.
c- Resource allocation. There are dedicated learning materials and trained teachers to allow most children to receive mother tongue instruction.
Resource allocation. There are dedicated learning materials and trained teachers to allow some children to receive mother tongue instruction.
Resource allocation. There are dedicated learning materials and trained teachers to allow few children to receive mother tongue instruction.
Resource allocation. There is no official support for teaching or learning materials to allow for mother tongue instruction.
d- Community engagement. Local communities and teachers are fully engaged in setting the curriculum and developing learning materials in support of mother tongue instruction.
Community engagement. Local communities and teachers are sometimes engaged in setting the curriculum or developing learning materials in support of mother tongue instruction.
Community engagement. Local communities and teachers are not engaged in setting the curriculum or developing learning materials in support of mother tongue instruction.
Community engagement. Local communities are discouraged from engaging in education in support of mother tongue instruction.
32
Output f: Enhanced global and regional
capacity to accelerate progress in
education
33
P5.f.1 Number of key global and regional education initiatives in which UNICEF
co-chairs and/or provides coordination support (To be collected by HQ and ROs)
In order to be classified as “key”, a global or regional education initiative has to have at
least one of the following criteria:
Advancing at least one of the three corporate priorities for the education
programme: Equity (inc. girls education), Learning or Innovations
Supporting advancement of education goals as described by the global
agenda: EFA, MDG (and soon the post 2015 agenda)
Strengthening the development of systemic
monitoring/evaluation/measurement of learning outcomes.
P5.f.2 Number of peer-reviewed journal or research publications by UNICEF on
Education
Collected through SMQs and direct contact with ROs
34
OUTCOME INDICATORS
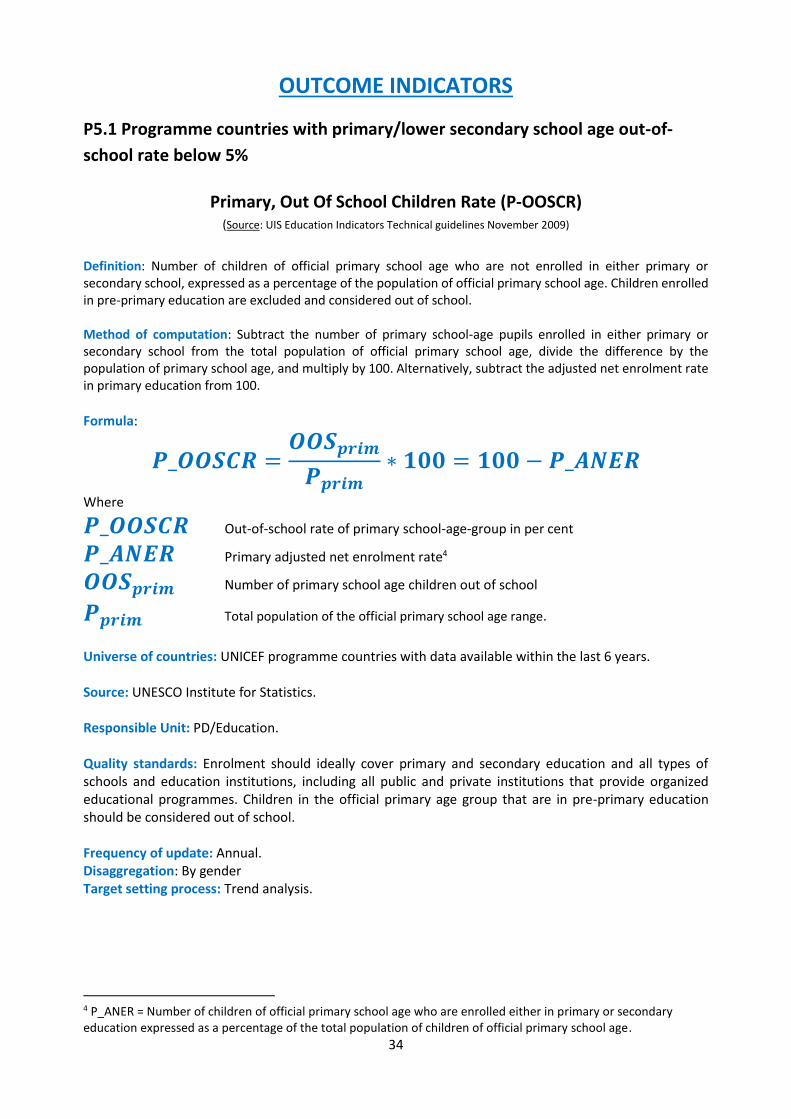
P5.1 Programme countries with primary/lower secondary school age out-of-
school rate below 5%
Primary, Out Of School Children Rate (P-OOSCR) (Source: UIS Education Indicators Technical guidelines November 2009)
Definition: Number of children of official primary school age who are not enrolled in either primary or secondary school, expressed as a percentage of the population of official primary school age. Children enrolled in pre-primary education are excluded and considered out of school. Method of computation: Subtract the number of primary school-age pupils enrolled in either primary or secondary school from the total population of official primary school age, divide the difference by the population of primary school age, and multiply by 100. Alternatively, subtract the adjusted net enrolment rate in primary education from 100.
Formula:
𝑷_𝑶𝑶𝑺𝑪𝑹 =𝑶𝑶𝑺𝒑𝒓𝒊𝒎
𝑷𝒑𝒓𝒊𝒎∗ 𝟏𝟎𝟎 = 𝟏𝟎𝟎 − 𝑷_𝑨𝑵𝑬𝑹
Where
𝑷_𝑶𝑶𝑺𝑪𝑹 Out-of-school rate of primary school-age-group in per cent
𝑷_𝑨𝑵𝑬𝑹 Primary adjusted net enrolment rate4
𝑶𝑶𝑺𝒑𝒓𝒊𝒎 Number of primary school age children out of school
𝑷𝒑𝒓𝒊𝒎 Total population of the official primary school age range.
Universe of countries: UNICEF programme countries with data available within the last 6 years. Source: UNESCO Institute for Statistics. Responsible Unit: PD/Education.
Quality standards: Enrolment should ideally cover primary and secondary education and all types of schools and education institutions, including all public and private institutions that provide organized educational programmes. Children in the official primary age group that are in pre-primary education should be considered out of school. Frequency of update: Annual. Disaggregation: By gender Target setting process: Trend analysis.
4 P_ANER = Number of children of official primary school age who are enrolled either in primary or secondary education expressed as a percentage of the total population of children of official primary school age.
35
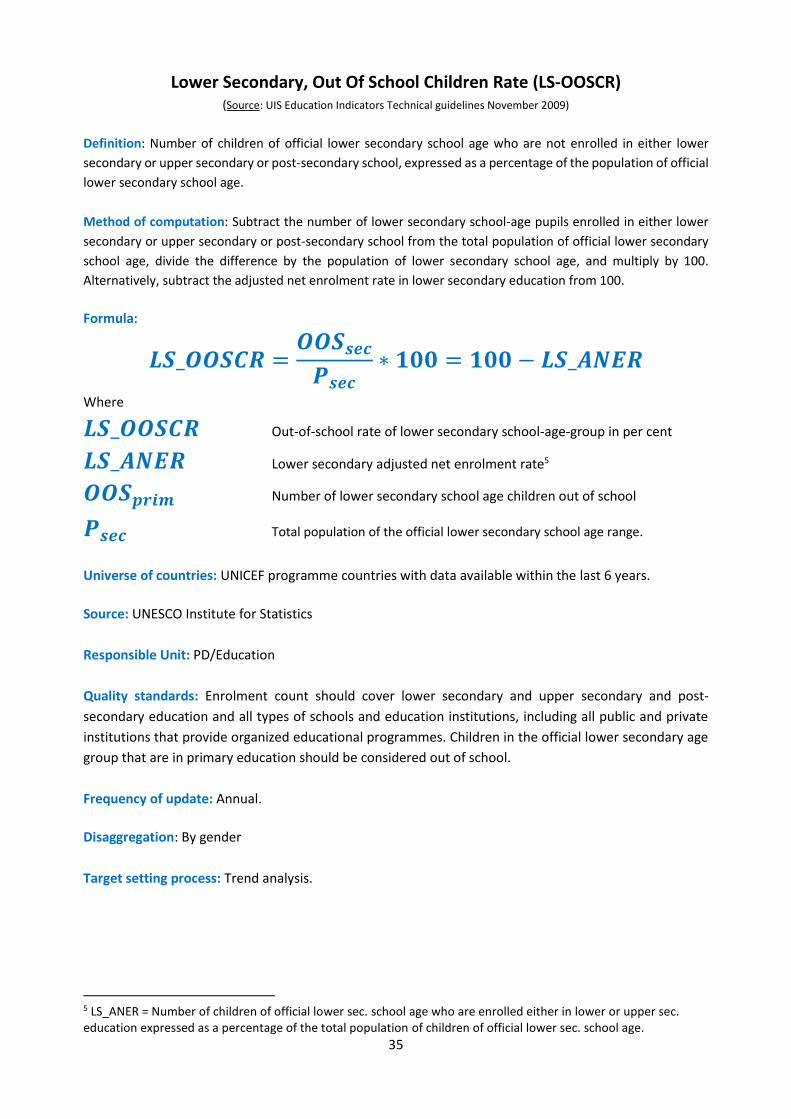
Lower Secondary, Out Of School Children Rate (LS-OOSCR) (Source: UIS Education Indicators Technical guidelines November 2009)
Definition: Number of children of official lower secondary school age who are not enrolled in either lower
secondary or upper secondary or post-secondary school, expressed as a percentage of the population of official
lower secondary school age.
Method of computation: Subtract the number of lower secondary school-age pupils enrolled in either lower
secondary or upper secondary or post-secondary school from the total population of official lower secondary
school age, divide the difference by the population of lower secondary school age, and multiply by 100.
Alternatively, subtract the adjusted net enrolment rate in lower secondary education from 100.
Formula:
𝑳𝑺_𝑶𝑶𝑺𝑪𝑹 =𝑶𝑶𝑺𝒔𝒆𝒄
𝑷𝒔𝒆𝒄∗ 𝟏𝟎𝟎 = 𝟏𝟎𝟎 − 𝑳𝑺_𝑨𝑵𝑬𝑹
Where
𝑳𝑺_𝑶𝑶𝑺𝑪𝑹 Out-of-school rate of lower secondary school-age-group in per cent
𝑳𝑺_𝑨𝑵𝑬𝑹 Lower secondary adjusted net enrolment rate5
𝑶𝑶𝑺𝒑𝒓𝒊𝒎 Number of lower secondary school age children out of school
𝑷𝒔𝒆𝒄 Total population of the official lower secondary school age range.
Universe of countries: UNICEF programme countries with data available within the last 6 years.
Source: UNESCO Institute for Statistics
Responsible Unit: PD/Education
Quality standards: Enrolment count should cover lower secondary and upper secondary and post-
secondary education and all types of schools and education institutions, including all public and private
institutions that provide organized educational programmes. Children in the official lower secondary age
group that are in primary education should be considered out of school.
Frequency of update: Annual.
Disaggregation: By gender
Target setting process: Trend analysis.
5 LS_ANER = Number of children of official lower sec. school age who are enrolled either in lower or upper sec. education expressed as a percentage of the total population of children of official lower sec. school age.

36
P5.2 Programme countries with increasing learning outcomes
Increasing learning outcomes Definition: Number of countries reporting an increase in learning outcomes, over the two most recent data
points, as measured by standardised national, regional and international learning assessment surveys as
recognized by the LMTF.6
Method of computation:
i. Select the standardised national, regional and international assessment surveys a country has
participated in during the last 9 years. Only assessments recognised by the LMTF are considered. The
selected assessment surveys should also have a prior, comparable data point in order to be used as a
baseline and measure change over time.
ii. Learning can be measured across multiple subjects and content areas, including language, literacy,
mathematics, science, technology, etc. and grades levels.
iii. Subtract previous national, regional or international learning assessment scores from most recent
regional or international assessment scores7.
iv. In the case of a given assessment having more than one subject and/or grade level, apply step (iii) for
each subject/grade available.
v. If the difference between the two data points is positive for a majority of the subjects/grades available
then we can consider this country as having increasing learning outcomes.
vi. In the case where there is more than one assessment survey, the one with the most recent data points
will be used.
Universe of countries: UNICEF programme countries with data available within the last 9 years.
Source: Standardised national, regional and international learning assessment surveys.
Responsible Unit: PD/Education
Quality standards: Care must be taken to ensure that scoring scales from different iterations of the
standardized national, regional and international learning assessment surveys are directly comparable.
Frequency of update: 4 to 5 years (As this indicator is not collected annually, data from the last 9 years
will be used with an annual rolling update).
Disaggregation: By gender.
Target setting process: Trend analysis.
6 Discussion Document #1: Multi-Country Assessments of Learning, Brookings Institution, Center for Universal Education 7 For ASER and UWEZO average scores are not used but rather the % of children reaching a “minimum” standard as defined by each learning assessment survey.
37
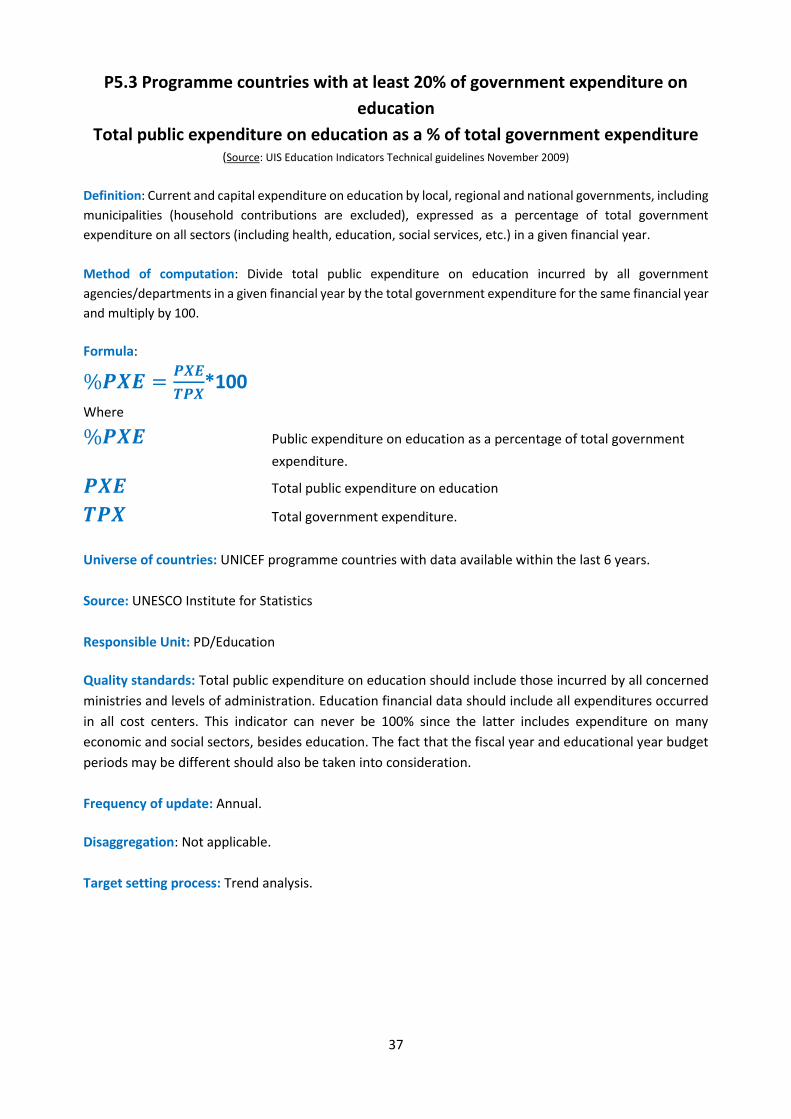
P5.3 Programme countries with at least 20% of government expenditure on
education
Total public expenditure on education as a % of total government expenditure (Source: UIS Education Indicators Technical guidelines November 2009)
Definition: Current and capital expenditure on education by local, regional and national governments, including
municipalities (household contributions are excluded), expressed as a percentage of total government
expenditure on all sectors (including health, education, social services, etc.) in a given financial year.
Method of computation: Divide total public expenditure on education incurred by all government
agencies/departments in a given financial year by the total government expenditure for the same financial year
and multiply by 100.
Formula:
%𝑷𝑿𝑬 =𝑷𝑿𝑬
𝑻𝑷𝑿*100
Where
%𝑷𝑿𝑬 Public expenditure on education as a percentage of total government
expenditure.
𝑷𝑿𝑬 Total public expenditure on education
𝑻𝑷𝑿 Total government expenditure.
Universe of countries: UNICEF programme countries with data available within the last 6 years.
Source: UNESCO Institute for Statistics
Responsible Unit: PD/Education
Quality standards: Total public expenditure on education should include those incurred by all concerned
ministries and levels of administration. Education financial data should include all expenditures occurred
in all cost centers. This indicator can never be 100% since the latter includes expenditure on many
economic and social sectors, besides education. The fact that the fiscal year and educational year budget
periods may be different should also be taken into consideration.
Frequency of update: Annual.
Disaggregation: Not applicable.
Target setting process: Trend analysis.
38
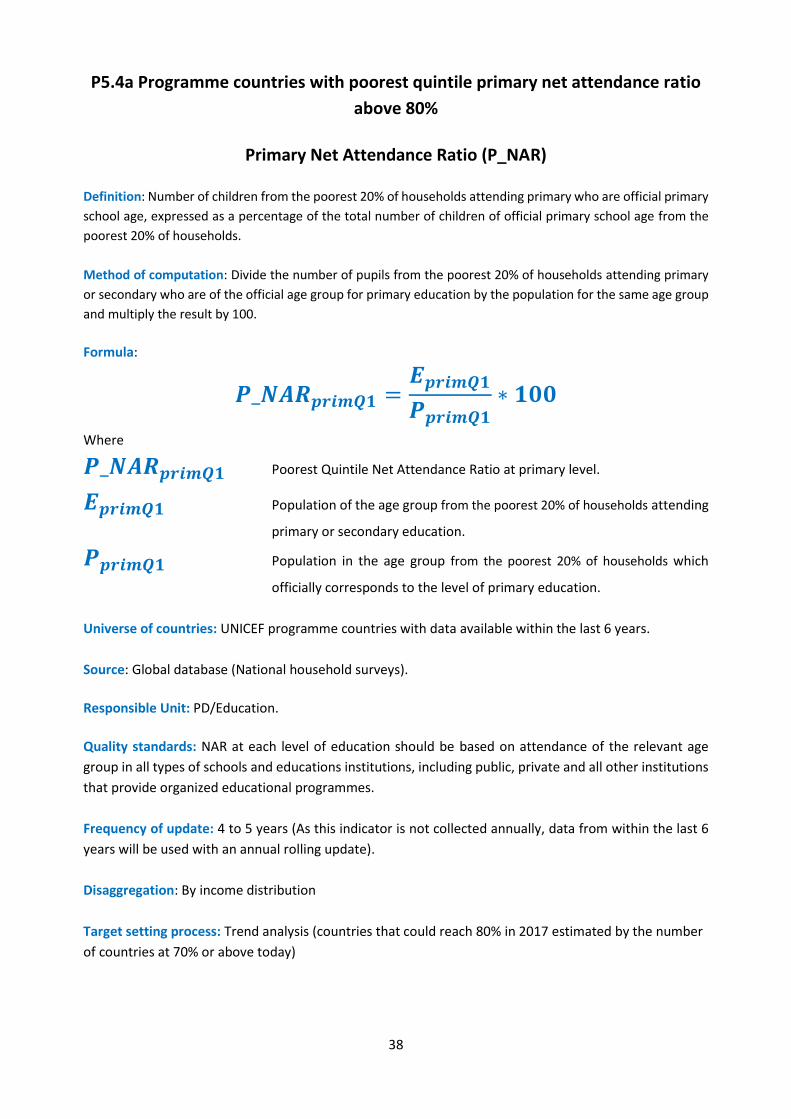
P5.4a Programme countries with poorest quintile primary net attendance ratio
above 80%
Primary Net Attendance Ratio (P_NAR)
Definition: Number of children from the poorest 20% of households attending primary who are official primary
school age, expressed as a percentage of the total number of children of official primary school age from the
poorest 20% of households.
Method of computation: Divide the number of pupils from the poorest 20% of households attending primary
or secondary who are of the official age group for primary education by the population for the same age group
and multiply the result by 100.
Formula:
𝑷_𝑵𝑨𝑹𝒑𝒓𝒊𝒎𝑸𝟏 =𝑬𝒑𝒓𝒊𝒎𝑸𝟏
𝑷𝒑𝒓𝒊𝒎𝑸𝟏∗ 𝟏𝟎𝟎
Where
𝑷_𝑵𝑨𝑹𝒑𝒓𝒊𝒎𝑸𝟏 Poorest Quintile Net Attendance Ratio at primary level.
𝑬𝒑𝒓𝒊𝒎𝑸𝟏 Population of the age group from the poorest 20% of households attending
primary or secondary education.
𝑷𝒑𝒓𝒊𝒎𝑸𝟏 Population in the age group from the poorest 20% of households which
officially corresponds to the level of primary education.
Universe of countries: UNICEF programme countries with data available within the last 6 years.
Source: Global database (National household surveys).
Responsible Unit: PD/Education.
Quality standards: NAR at each level of education should be based on attendance of the relevant age
group in all types of schools and educations institutions, including public, private and all other institutions
that provide organized educational programmes.
Frequency of update: 4 to 5 years (As this indicator is not collected annually, data from within the last 6
years will be used with an annual rolling update).
Disaggregation: By income distribution
Target setting process: Trend analysis (countries that could reach 80% in 2017 estimated by the number
of countries at 70% or above today)
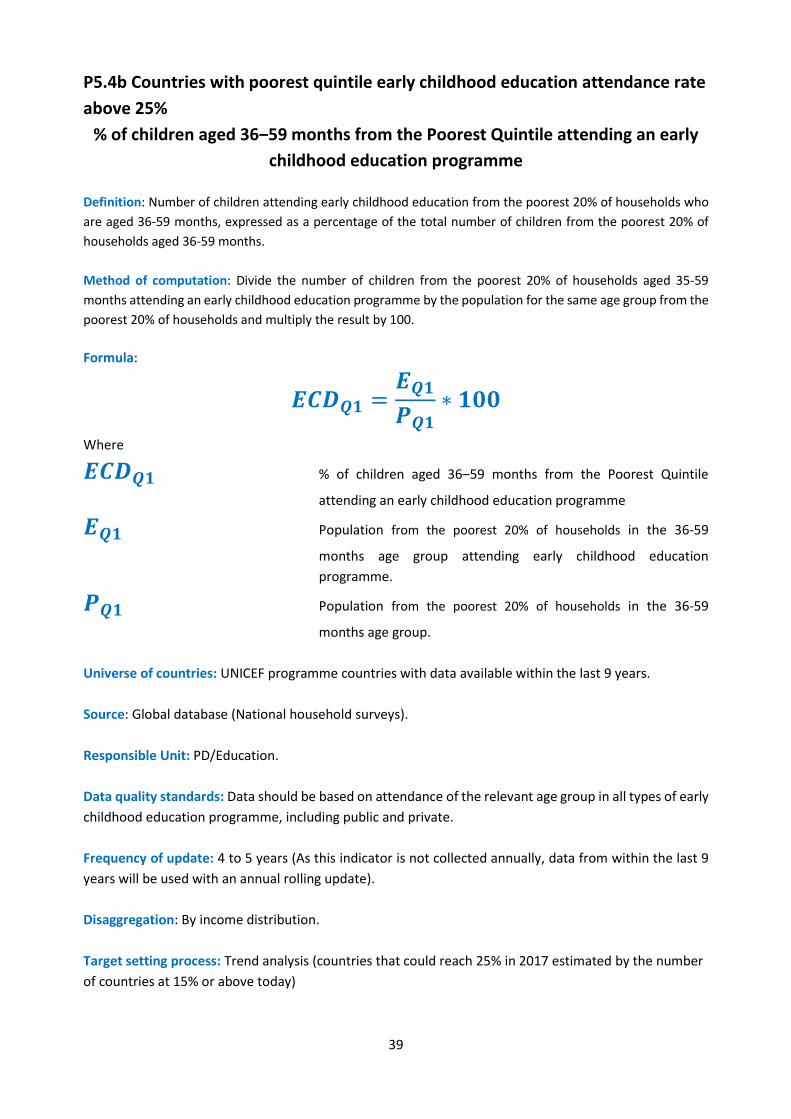
39
P5.4b Countries with poorest quintile early childhood education attendance rate
above 25%
% of children aged 36‒59 months from the Poorest Quintile attending an early
childhood education programme
Definition: Number of children attending early childhood education from the poorest 20% of households who
are aged 36-59 months, expressed as a percentage of the total number of children from the poorest 20% of
households aged 36-59 months.
Method of computation: Divide the number of children from the poorest 20% of households aged 35-59
months attending an early childhood education programme by the population for the same age group from the
poorest 20% of households and multiply the result by 100.
Formula:
𝑬𝑪𝑫𝑸𝟏 =𝑬𝑸𝟏
𝑷𝑸𝟏∗ 𝟏𝟎𝟎
Where
𝑬𝑪𝑫𝑸𝟏 % of children aged 36‒59 months from the Poorest Quintile
attending an early childhood education programme
𝑬𝑸𝟏 Population from the poorest 20% of households in the 36-59
months age group attending early childhood education
programme.
𝑷𝑸𝟏 Population from the poorest 20% of households in the 36-59
months age group.
Universe of countries: UNICEF programme countries with data available within the last 9 years.
Source: Global database (National household surveys).
Responsible Unit: PD/Education.
Data quality standards: Data should be based on attendance of the relevant age group in all types of early
childhood education programme, including public and private.
Frequency of update: 4 to 5 years (As this indicator is not collected annually, data from within the last 9
years will be used with an annual rolling update).
Disaggregation: By income distribution.
Target setting process: Trend analysis (countries that could reach 25% in 2017 estimated by the number
of countries at 15% or above today)
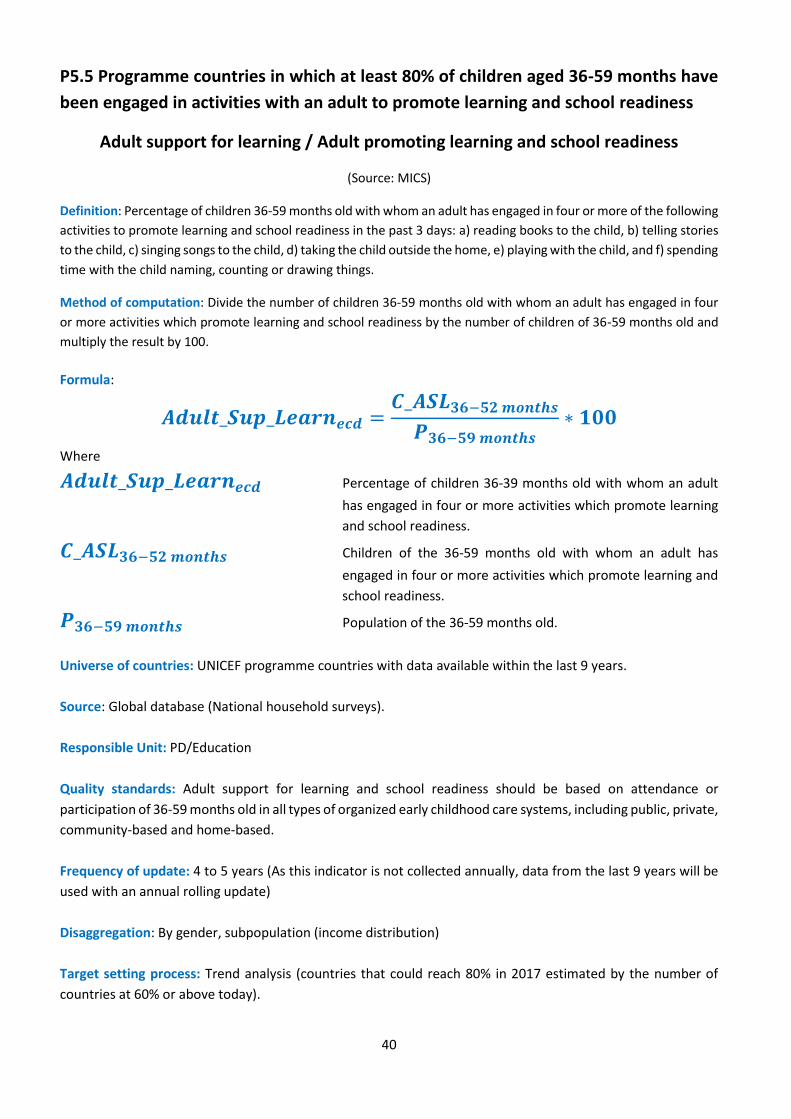
40
P5.5 Programme countries in which at least 80% of children aged 36-59 months have
been engaged in activities with an adult to promote learning and school readiness
Adult support for learning / Adult promoting learning and school readiness
(Source: MICS)
Definition: Percentage of children 36-59 months old with whom an adult has engaged in four or more of the following
activities to promote learning and school readiness in the past 3 days: a) reading books to the child, b) telling stories
to the child, c) singing songs to the child, d) taking the child outside the home, e) playing with the child, and f) spending
time with the child naming, counting or drawing things.
Method of computation: Divide the number of children 36-59 months old with whom an adult has engaged in four
or more activities which promote learning and school readiness by the number of children of 36-59 months old and
multiply the result by 100.
Formula:
𝑨𝒅𝒖𝒍𝒕_𝑺𝒖𝒑_𝑳𝒆𝒂𝒓𝒏𝒆𝒄𝒅 =𝑪_𝑨𝑺𝑳𝟑𝟔−𝟓𝟐 𝒎𝒐𝒏𝒕𝒉𝒔
𝑷𝟑𝟔−𝟓𝟗 𝒎𝒐𝒏𝒕𝒉𝒔∗ 𝟏𝟎𝟎
Where
𝑨𝒅𝒖𝒍𝒕_𝑺𝒖𝒑_𝑳𝒆𝒂𝒓𝒏𝒆𝒄𝒅 Percentage of children 36-39 months old with whom an adult
has engaged in four or more activities which promote learning
and school readiness.
𝑪_𝑨𝑺𝑳𝟑𝟔−𝟓𝟐 𝒎𝒐𝒏𝒕𝒉𝒔 Children of the 36-59 months old with whom an adult has
engaged in four or more activities which promote learning and
school readiness.
𝑷𝟑𝟔−𝟓𝟗 𝒎𝒐𝒏𝒕𝒉𝒔 Population of the 36-59 months old.
Universe of countries: UNICEF programme countries with data available within the last 9 years.
Source: Global database (National household surveys).
Responsible Unit: PD/Education
Quality standards: Adult support for learning and school readiness should be based on attendance or
participation of 36-59 months old in all types of organized early childhood care systems, including public, private,
community-based and home-based.
Frequency of update: 4 to 5 years (As this indicator is not collected annually, data from the last 9 years will be
used with an annual rolling update)
Disaggregation: By gender, subpopulation (income distribution)
Target setting process: Trend analysis (countries that could reach 80% in 2017 estimated by the number of
countries at 60% or above today).
41
P5.6 Number and percentage of all partners-targeted children in humanitarian
situations accessing formal or non-formal basic education (“reached”)
This indicator includes a filtering question and sub questions to be answered if applicable.
Universe of Countries: UNICEF COs which have responded to a humanitarian situation within the relevant timeframe
Filtering Question 1: Did your country office respond to humanitarian situations (regardless of scale),
including new and ongoing situations? YES/NO.
Filtering Question 2: Was the Education cluster activated (or remained active)? YES/NO.
If no to at least one of the Filtering Questions, then the sub-questions are “Not applicable”
If yes to both Filtering Questions, please answer the following sub-questions:
a. What is the number of children (3-18 years old) in humanitarian situations targeted (or planned
to be reached) by all partners for formal or non-formal basic education (including pre-primary
schools/early childhood learning spaces, primary and lower secondary education)? Provide
disaggregated data for girls in the remarks column.
b. Out of the children targeted by all partners, how many accessed formal or non-formal basic
education (“reached”)? Provide disaggregated data for girls in the remarks column.
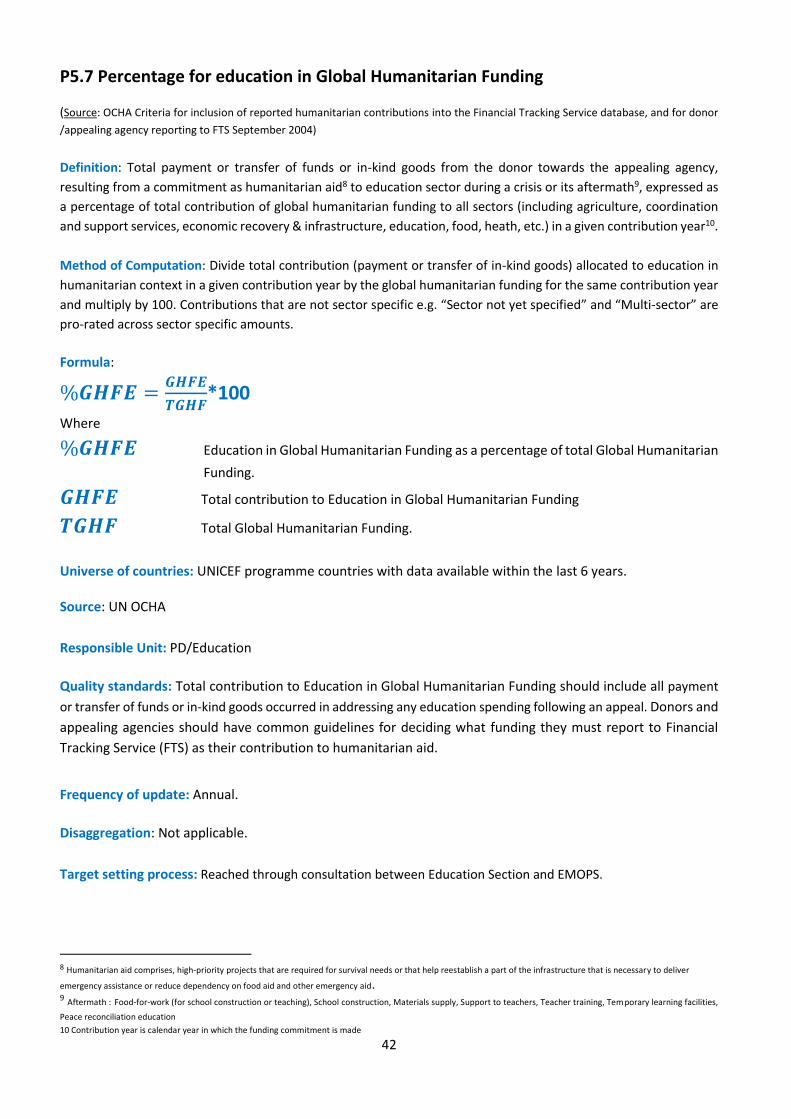
42
P5.7 Percentage for education in Global Humanitarian Funding
(Source: OCHA Criteria for inclusion of reported humanitarian contributions into the Financial Tracking Service database, and for donor
/appealing agency reporting to FTS September 2004)
Definition: Total payment or transfer of funds or in-kind goods from the donor towards the appealing agency,
resulting from a commitment as humanitarian aid8 to education sector during a crisis or its aftermath9, expressed as
a percentage of total contribution of global humanitarian funding to all sectors (including agriculture, coordination
and support services, economic recovery & infrastructure, education, food, heath, etc.) in a given contribution year10.
Method of Computation: Divide total contribution (payment or transfer of in-kind goods) allocated to education in
humanitarian context in a given contribution year by the global humanitarian funding for the same contribution year
and multiply by 100. Contributions that are not sector specific e.g. “Sector not yet specified” and “Multi-sector” are
pro-rated across sector specific amounts.
Formula:
%𝑮𝑯𝑭𝑬 =𝑮𝑯𝑭𝑬
𝑻𝑮𝑯𝑭*100
Where
%𝑮𝑯𝑭𝑬 Education in Global Humanitarian Funding as a percentage of total Global Humanitarian
Funding.
𝑮𝑯𝑭𝑬 Total contribution to Education in Global Humanitarian Funding
𝑻𝑮𝑯𝑭 Total Global Humanitarian Funding.
Universe of countries: UNICEF programme countries with data available within the last 6 years. Source: UN OCHA
Responsible Unit: PD/Education
Quality standards: Total contribution to Education in Global Humanitarian Funding should include all payment
or transfer of funds or in-kind goods occurred in addressing any education spending following an appeal. Donors and
appealing agencies should have common guidelines for deciding what funding they must report to Financial
Tracking Service (FTS) as their contribution to humanitarian aid.
Frequency of update: Annual.
Disaggregation: Not applicable.
Target setting process: Reached through consultation between Education Section and EMOPS.
8 Humanitarian aid comprises, high-priority projects that are required for survival needs or that help reestablish a part of the infrastructure that is necessary to deliver
emergency assistance or reduce dependency on food aid and other emergency aid. 9 Aftermath : Food-for-work (for school construction or teaching), School construction, Materials supply, Support to teachers, Teacher training, Temporary learning facilities,
Peace reconciliation education
10 Contribution year is calendar year in which the funding commitment is made
43
IMPACT INDICATORS
P5a Number of primary school-age children out of school (OOS) and Gender Parity
Index11 (Source: UIS Education Indicators Technical guidelines November 2009)
Definition: Number of children in the official primary school age range who are not enrolled in either primary or
secondary schools.
Method of computation: Subtract the number of primary school-age pupils enrolled in either primary or secondary
school from the total population of the official primary school age range.
Formula:
𝑶𝑶𝑺𝒑𝒓𝒊𝒎 = 𝑷𝒑𝒓𝒊𝒎 − 𝑬𝒑𝒓𝒊𝒎/𝒔𝒆𝒄𝒐𝒏𝒅
Where
𝑶𝑶𝑺𝒑𝒓𝒊𝒎 Number of primary school age children out of school.
𝑷𝒑𝒓𝒊𝒎 Total population of the official primary school age range.
𝑬𝒑𝒓𝒊𝒎/𝒔𝒆𝒄𝒐𝒏𝒅 Number of primary school age pupils enrolled in either primary or
secondary school.
Universe of countries: Global estimate.
Source: UNESCO Institute for Statistics
Responsible Unit: PD/Education
Quality standards: Enrolment count should include in all types of schools and education institutions, including public,
private and all other institutions that provide organized educational programmes.
Frequency of update: Annual.
Disaggregation: By gender.
Target setting process: Trend analysis for total Nb of out-of-school children. Full equity for gender parity index
11 For Gender Parity Index, see the indicator P5.e.1
44
P5b Gross Intake Ratio in the Last Grade of Primary (GIRLG) / Primary Completion
Rate (PCR) and Gender Parity Index12 (Source: UIS Education Indicators Technical guidelines November 2009)
Definition: Total number of new entrants in the last grade of primary education, regardless of age, expressed as a percentage of the population at the theoretical entrance age to the last grade of primary.
Method of computation: Divide the number of new entrants in last grade of primary, irrespective of age, by the population of theoretical entrance age to the last grade of primary, and multiply the result by 100.
Formula:
𝑮𝑰𝑹𝑳𝑮 =𝑵𝑬
𝑷𝒆∗ 𝟏𝟎𝟎
Where
𝑮𝑰𝑹𝑳𝑮 Gross Intake Ratio in the Last Grade of primary.
𝑵𝑬 Number of new entrants in the last grade of primary education.
𝑷𝒆 Population of theoretical entrance age in the last grade of primary.
N.B.: When data on new entrants are not separately reported, they can be derived by subtracting the number of repeaters from enrolment in the last grade. Universe of countries: Global estimate.
Source: UNESCO Institute for Statistics
Responsible Unit: PD/Education
Quality standards: Data on population used in deriving this indicator should refer strictly to the theoretical entrance age in the last grade of primary. Care should be taken not to include repeaters in the last grade, which would inflate the ratio. Frequency of update: Annual.
Disaggregation: By gender.
Target setting process: Trend analysis for primary completion rate. Full equity for gender parity index
12 For Gender Parity Index, see the indicator P5.e.1
45
Annex: SP/SMQ reporting “Myth busting” slides
46
47
48
49