Embed Size (px)
Citation preview
CARIBBEAN DEVELOPMENT BANK
STRATEGIC PLAN 2010 – 2014
(Approved at the Two Hundred and Forty-First Meeting of
the Board of Directors Held in The Bahamas on May 17, 2010)
MAY 2010
M I S S I O N S T A T E M E N T
“CDB intends to be the leading catalyst for development resources into the Region,
working in an efficient, responsive and collaborative manner
with our borrowing members, and other development partners,
towards the systematic reduction of poverty in their countries
through social and economic development”
CURRENCY EQUIVALENT
Dollars ($) throughout refer to United States dollars (USD) unless otherwise stated
ABBREVIATIONS
BMCs - Borrowing Member Countries
bn - billion
BNTF - Basic Needs Trust Fund
BOD - Board of Directors
CARICOM - Caribbean Community
CARTAC - Caribbean Regional Technical Assistance Center
CAS - Country Assistance Strategy
CCR - Climate Change Response
CDB - Caribbean Development Bank
CPAs - Country Poverty Assessments
CRNM - Caribbean Regional Negotiating Machinery
CSME - Caribbean Single Market and Economy
CTCS - Caribbean Technological Consultancy Services
DPs - Development Partners
DRM - Disaster Risk Management
DRR - Disaster Risk Reduction
EIB - European Investment Bank
EOV - Evaluation and Oversight Division
GCI - General Capital Increase
GDP - Gross Domestic Product
HIV/AIDS - Human Immuno-deficiency Virus/Acquired Immune Deficiency Syndrome
IDB - Inter-American Development Bank
IMF - International Monetary Fund
MDBs - Multilateral Development Banks
MDGs - Millennium Development Goals
MfDR - Managing for Development Results
mn - million
OCR - Ordinary Capital Resources
OECS - Organisation of Eastern Caribbean States
p.a. - per annum
PBL - Policy-Based Lending/Policy-Based Loan
PRS - Poverty Reduction Strategy
RCI - Regional Cooperation and Integration
RMF - Results Monitoring Framework
RPGs - Regional Public Goods
SDF - Special Development Fund
SFR - Special Funds Resources
SLC - Survey of Living Conditions
SPPS - Social Protection Policy and Strategy
TA - Technical Assistance
TEER - Total Equity to Exposure Ratio
UKOTs - United Kingdom Overseas Territories
UNDP - United Nations Development Programme
WB - World Bank
TABLE OF CONTENTS
EXECUTIVE SUMMARY
1. INTRODUCTION
2. THE CARIBBEAN AID ARCHITECTURE AND CDB‟s ROLE AND RELEVANCE
3. OPERATIONAL FRAMEWORK
4. THE DEVELOPMENT CHALLENGES
5. THE STRATEGY
6. DEMAND FOR ORDINARY CAPITAL RESOURCES
7. RESOURCING THE STRATEGY
8. RESULTS MONITORING FRAMEWORK
9. CONCLUSIONS AND RECOMMENDATION
APPENDICES
1. COORDINATION MATRIX OF DEVELOPMENT PARTNERS‟ PROGRAMMES OF
DEVELOPMENT COOPERATION
2. POVERTY INDICATORS FOR SELECTED CARIBBEAN COUNTRIES
3. DISTRIBUTION OF ESTABLISHMENT 2009–2011
4. ASSUMPTIONS TO FINANCIAL PROJECTIONS
5. CDB‟s RESULTS MONITORING FRAMEWORK
6. STRATEGIC PLAN 2010–2014 - IMPLEMENTATION FRAMEWORK
STRATEGIC PLAN 2010-2014
(i)
EXECUTIVE SUMMARY
1. The Strategic Plan 2010–2014 has been developed against the background of slow and variable
economic growth and the persistence of unacceptable levels of poverty, indigence and inequality in many
Borrowing Member Countries (BMCs). Economic performance in many BMCs is also constrained by
unacceptably high levels of debt and debt service. The debt service dynamics severely reduces the fiscal
space necessary to implement growth-enhancing economic and social programmes. Prospects for
sustainable economic and social development are also threatened by the extreme vulnerability of all the
Caribbean Development Bank‟s (CDB) BMCs to external economic shocks and natural hazard events.
2. The Strategic Plan addresses the concern that many of the social gains of the past decades will be
lost in the face of the current global economic and financial crisis and aims to position the Bank to play an
increasing role on the issues of economic adjustment, regional cooperation and integration (RCI), good
governance and environmental sustainability. In addition, the Plan focuses on strengthening the results
culture within the Bank through the enhancement of the Results Monitoring Framework (RMF) for
tracking progress on the implementation of the Plan and for reporting on results.
CDB’s Role and Relevance
3. The regional aid architecture consists of a large number of bilateral and multilateral agencies, and
multilateral development banks (MDBs) which provide development assistance to CDB‟s BMCs in a
wide range of sectors and thematic areas critical to their economic and social development. The Bank has
worked closely with many of these development agencies and maintains longstanding and mutually
supportive relationships with other Caribbean institutions and agencies, including those of the Caribbean
Community (CARICOM) and the Organisation of Eastern Caribbean States (OECS) Secretariat. The role
of the Bank in the aid architecture for the Region is built on the basis of all these relationships and the
capacity to convene joint regional and international partnerships for addressing critical challenges faced
by BMCs.
4. CDB has a special position in the regional development community supported by its structure,
with majority ownership held by its regional membership, its close relationship with BMCs and its
understanding of the problems and dynamics of the Region, easy access of Bank personnel to policy-
makers and administrators as well as the institutions of civil society, and its exclusive focus on the
Caribbean. CDB is recognised as an important regional development institution in the Caribbean, with a
broad development mandate, and well-placed as a focal point for dialogue, intermediation and extended
partnerships on behalf of BMCs, and for the strengthening of the regional ownership of development
programmes. A leadership role by the Bank and leveraging of its comparative advantage will be of
critical importance in assisting BMCs to meet their development challenges in the medium term.
Development Challenges
5. Erosion of trade preferences for their principal commodity exports and the global trend towards
trade liberalisation make it imperative for CDB‟s BMCs to establish alternative bases for sustainable
economic growth and reducing poverty and inequality. At the same time, they are committed to reduction
of vulnerability to natural hazard events and climate change and to better management of the associated
risks.
6. In addition to the investment requirements of structural adjustment for economic growth and
social progress, BMCs must contend with the adverse effects of the global economic crisis which has
derailed economic activity and development plans and reversed gains already made, especially putting at
STRATEGIC PLAN 2010-2014
(ii)
greater risk the 6.8 million persons currently living below national poverty lines in BMCs, including
Haiti‟s 4 million persons.
7. The capacity to pursue counter-cyclical policies in response to the global economic crisis is
severely constrained by already large fiscal deficits and high levels of public indebtedness. The financing
of these deficits has become more difficult as domestic liquidity has dried up at the same time as
international capital markets are becoming more risk averse.
8. The allocation of substantial portions of recurrent revenue to debt servicing incurs a high
opportunity cost in terms of expenditure foregone on education and training, roads and transportation,
health, housing, water, sanitation and other services that are critical to the empowerment and welfare
enhancement of the poor and vulnerable.
9. The Caribbean states belong to that group of countries that are most vulnerable to climate change,
i.e. small island states. In economies where tourism is an important sector, loss of beaches and coastal
land can result in contraction of demand and significant loss of incomes. Climate change could also
increase the costs of providing services such as sea defence and water supply, and necessitate higher
outlays on health services.
10. The small size of Caribbean economies means that RCI are important components of the
measures needed to address their development challenges. A major challenge remaining for the Region is
to accelerate the pace of implementation of the CARICOM Single Market and Economy project in order
to support the goal of more rapid and sustainable growth rates in all of the countries and a more equitable
distribution of these benefits among the participating countries and their citizens. This would entail
strengthening the administrative capacities of both BMCs and CARICOM institutions.
11. Country Poverty Assessments (CPAs) for most BMCs show that female-headed households
constitute a large percentage of the most vulnerable and deprived households in the Region. The goal of
reducing poverty cannot be effectively addressed unless consideration of gender equality issues is
integrated into poverty reduction initiatives. Such consideration would be equally important in the design
of interventions to improve access to educational opportunities and to enhance other areas of human
resource development such as health and housing.
Strategic Focus
12. During this planning period, CDB will assist BMCs to reduce poverty through sustainable
economic growth and strengthening the resilience of BMCs to external shocks. There is also a need to
promote a balanced approach to improving the welfare of BMCs‟ citizens and ensuring that growth is
inclusive, explicitly focused on income and gender disparities and on other inequities, and that it is
environmentally sustainable. In addition, measures will be adopted towards improving internal capacities
and efficiencies for the delivery of Bank services and enhancing development effectiveness.
13. To achieve its overarching goal, the Bank over the next five years will focus on the strategic
objectives of:
(a) promoting broad-based economic growth and inclusive social development;
(b) supporting environmental sustainability and disaster risk management (DRM);
(c) promoting good governance;
STRATEGIC PLAN 2010-2014
(iii)
(d) fostering RCI; and
(e) enhancing organisational efficiency and effectiveness.
14. The Bank will also treat gender equality as a theme cutting across all sector interventions, i.e. a
cross-cutting theme, for the purpose of broadening the poverty impact of its interventions.
Demand for Ordinary Capital Resources (OCR)
15. CDB‟s demand analysis has estimated that BMCs‟ total resource requirements for the 2010–2019
period would be $37.8 billion (bn) to $41.1 bn, depending on the pace of economic recovery. CDB also
estimated the demand for its OCR financing for the same period. Two scenarios were developed for the
forecasts.
16. Based on the study of the demand for OCR financial resources, it is estimated that a need exists
for OCR resources of between $3.1 bn and $3.4 bn in the period 2010–2019. Under Scenario 1, OCR
demand for disbursements during the period 2010–14 amounts to $1,500 mn, increasing to $1,595 mn in
the period 2015–19. For Scenario 2, demand is projected to decrease from $1,705 mn in the period 2010–
2014 to $1,680 mn, in the period 2015–2019.
Resourcing the Strategy
17. The critical constraints to an expansion of CDB‟s lending programme are its capital adequacy
requirements and its ability to increase borrowings. Expanding these limits requires appropriate increases
in non-borrowing members‟ investment-grade callable capital and adequate amounts of cash capital from
all shareholders and from retained earnings.
18. As at December 31, 2009, CDB had long-term borrowings of $718 mn or 98% of the operating
limit on borrowings. The remaining borrowing headroom amounts to $15 mn. The Bank‟s current
borrowing headroom status does not allow it to respond to any requirement for additional liquidity and as
a consequence can also place its Triple „A‟ credit rating at risk until this situation is rectified. The
expansion of the Bank‟s lending operations is severely restricted until additional headroom is provided
through the input of cash capital, and callable capital from investment-grade non-borrowing members.
Shareholders agreed to consider a general capital increase (GCI) as a way of resolving these issues.
19. At the Sixth Special Meeting of the Board of Directors held on April 27, 2010, the Directors
considered Paper BD 12/10 Add. 1 entitled “Proposals for a General Capital Increase” and agreed to
recommend to the Board of Governors that the subscribed capital of the Bank be increased by
approximately $985 mn as being required to provide sufficient headroom for an annual average level of
lending of $198 mn or 64% of the annual demand for Scenario 1 over the ten-year period. Importantly,
this amount of subscribed capital would also contribute additional non-borrowing members‟ investment-
grade callable capital of approximately $300 mn and hence provide a substantial proportion of the
borrowing headroom required to approach the international and regional financial market for liquidity to
support the projected new lending.
STRATEGIC PLAN 2010-2014
(iv)
Results Monitoring Framework
20. The effectiveness of the Bank‟s development assistance to BMCs will depend to a large extent on
its ability to monitor and evaluate its work in a measureable manner and to make appropriate adjustments
to the design and implementation of its initiatives based on results. A RMF has been adopted in the
context of the Special Development Fund (Seventh Cycle) (SDF 7) replenishment cycle and will be
expanded and applied across the Bank for the purpose of reporting on results during the implementation
of this Strategic Plan. The Framework is designed to measure the degree to which CDB is assisting
BMCs‟ economies to grow and reduce poverty; strengthen the focus of its activities on development
outcomes; and provide information on the effectiveness of CDB‟s interventions.
Conclusions
21. CDB‟s BMCs are challenged by their vulnerability to external shocks and natural hazard events
which, to a significant degree, is derived from their small physical and economic size. The impact of this
vulnerability together with global trends towards trade liberalisation and the erosion of trade preferences
have compelled BMCs to develop strategies for medium-term economic transformation and sustainable
growth, poverty reduction and to strengthen their resilience to shocks and natural hazard events.
22. BMCs‟ capacity to implement these plans is severely constrained by already large fiscal deficits
and high levels of public indebtedness. It is recognised that BMCs would need the assistance of CDB and
other development partners (DPs) to mobilise the significant amount of financial resources, both
concessionary and non-concessionary, that would be required to pursue their development objectives.
23. The Strategic Plan 2010–2014 sets out CDB‟s programme for assisting BMCs to confront their
major development challenges and to implement their policies and strategies for economic and social
development; positions the Bank to improve the delivery of appropriate products and services to its
clients as well as to enhance its development effectiveness and results focus.
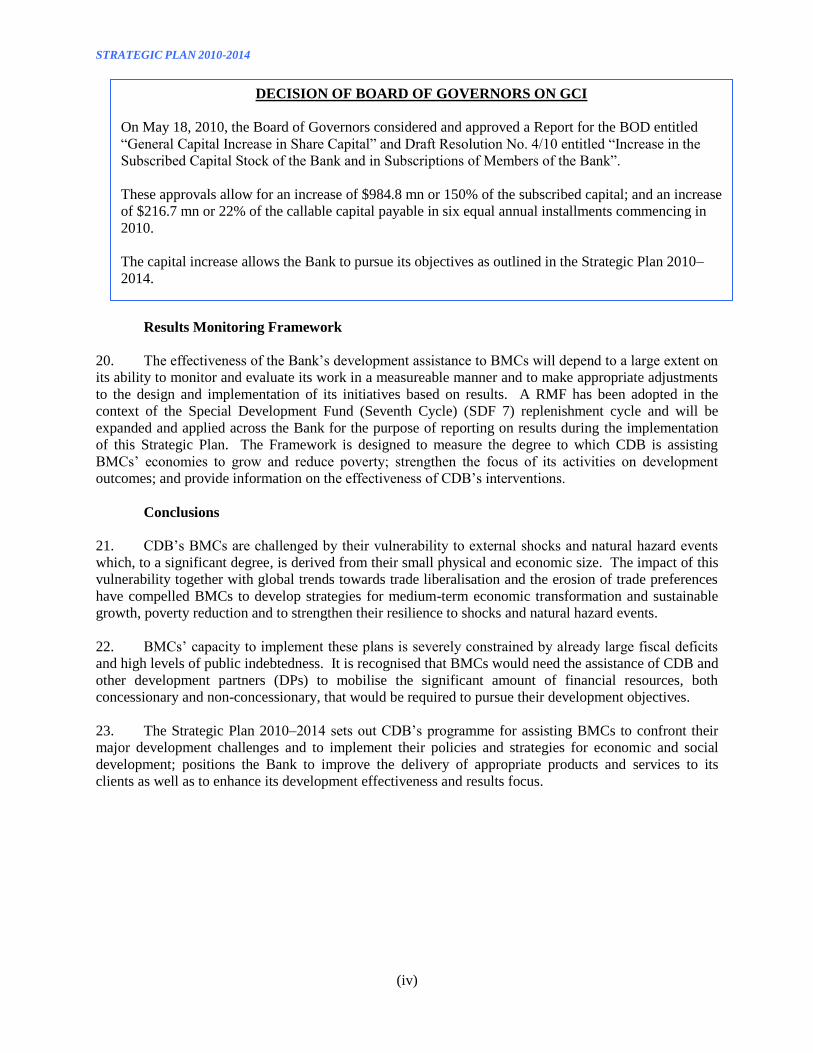
DECISION OF BOARD OF GOVERNORS ON GCI
On May 18, 2010, the Board of Governors considered and approved a Report for the BOD entitled
“General Capital Increase in Share Capital” and Draft Resolution No. 4/10 entitled “Increase in the
Subscribed Capital Stock of the Bank and in Subscriptions of Members of the Bank”.
These approvals allow for an increase of $984.8 mn or 150% of the subscribed capital; and an increase
of $216.7 mn or 22% of the callable capital payable in six equal annual installments commencing in
2010.
The capital increase allows the Bank to pursue its objectives as outlined in the Strategic Plan 2010–
2014.
STRATEGIC PLAN 2010-2014
-1-
1. INTRODUCTION
1.01 The Strategic Plan 2010–2014 together with the agreement reached with Contributors to the
Seventh Cycle of SDF, articulates the ways in which the Bank proposes to discharge its mandate to assist
BMCs to pursue their development objectives of achieving a sustainable rate of economic growth,
reducing poverty and building resilience to external shocks.
1.02 The Strategic Plan 2010–2014 has been developed against the background of slow and variable
economic growth and the persistence of unacceptable levels of poverty, indigence and inequality in many
BMCs. Economic performance is also constrained by unacceptably high levels of debt and debt service.
The debt service dynamics severely reduces the fiscal space necessary to implement growth-enhancing
economic and social programmes. Prospects for sustainable economic and social development are also
threatened by the extreme vulnerability of all CDB‟s BMCs to external economic shocks and natural
hazard events.
1.03 It is generally agreed that strong and urgent actions are required to counter the impact of the
ongoing global economic crisis on developing countries. There must be an adequate fiscal response to
support broad-based economic growth to protect the poor and vulnerable groups including strengthening
safety nets and protecting infrastructure programmes that can create jobs; provision of support for the
private sector to improve the climate for growth in private investment including strengthening financial
systems, reducing the cost of doing business and expanding access to finance; and enhancing efforts in
human development especially for education and training, and health.
1.04 The Bank has gained substantial experience over approximately 40 years of working with BMCs
on the strengthening of the operational and technical capacities of public utilities, economic and social
infrastructure projects, the design and delivery of community-based programmes targeted to the poor,
including rural development, basic housing, early childhood education, environmental planning,
strengthening of small and medium-size private business enterprises, and small-scale credit.
1.05 Considerable work has been done by the Bank on the policy and institutional elements that are
essential for strengthening economic and fiscal management, pro-poor governance, including preparation
of critically important CPAs and development of National Poverty Reduction Strategies. The Bank‟s
particular experience in working with its BMCs extends to institutional strengthening of development
finance companies.
1.06 The Strategic Plan addresses the concern that many of the social gains of the past decades will be
lost in the face of the current global economic and financial crisis and aims to position the Bank to play an
increasing role on the issues of economic adjustment, RCI, good governance and environmental
sustainability. In addition, the Plan focuses on strengthening the results culture within the Bank through
the enhancement of the RMF for tracking progress on the implementation of the Plan and for reporting on
results.
1.07 The proposals contained in the Strategic Plan are the result of substantive consultations and
deliberation with many stakeholders. It builds on the Strategic Plan 2005–2009 and other approved sector
and thematic policies and strategies, and draws on the lessons learned from the Multi-cycle Evaluation of
SDF 4 and SDF V, and the Evaluation Study of Technical Assistance (TA) Operations of the Bank.
1.08 This document is structured to provide in Section 2 an analysis of the Bank‟s comparative
advantage and its role in the regional and international aid architecture. The operating principles that
would guide the design and implementation of the Bank‟s programmes, instruments and modalities, and
through which it would deliver its development assistance and enhance its effectiveness are set out in
Section 3. Section 4 deals with the principal challenges likely to be faced by BMCs over the next five

STRATEGIC PLAN 2010-2014
-2-
years, and Section 5 describes the Bank‟s proposed strategy for assisting BMCs as well as its sectoral and
thematic focus for the period. The analysis of demand for CDB‟s OCR is outlined in Section 6 and the
proposal for resourcing the Plan is discussed in Section 7. The RMF which would be used to measure
and monitor progress in the implementation of the Strategic Plan is described in Section 8 and finally,
Section 9 sets out the conclusions and recommendation.
STRATEGIC PLAN 2010-2014
-3-
2. THE CARIBBEAN AID ARCHITECTURE AND CDB’s ROLE AND RELEVANCE
2.01 The regional aid architecture consists of a large number of bilateral and multilateral agencies, and
MDBs which provide development assistance to CDB‟s BMCs in a wide range of sectors and thematic
areas critical to their economic and social development. In support of its case for a sixth replenishment of
SDF, CDB staff prepared a discussion paper on RCI entitled “A Coordination Matrix of Development
Partners‟ Programmes of Development Cooperation” (Appendix 1) in order to better understand the
extent of the aid coverage and the process of alignment and harmonisation amongst Donor Partners.
2.02 Among the conclusions set out in the paper were:
(a) “DPs tend to cluster around a predictable small number of broad project themes, namely,
education, social development, human immuno-deficiency virus/acquired immune
deficiency syndrome (HIV/AIDS), financial management (budgetary, debt management),
and public sector management and modernisation (mostly of the financial and justice
agencies). The latter two are the densest areas of the DPs concentration;
(b) While DPs may be operating under the same broad themes, they are not necessarily
duplicating operations, as they often focus on different countries or different aspects of
the problem; and
(c) DPs seem to be increasingly inclined to outsource their development cooperation
activities to existing specialist, international or regional organisations. Certain of them
have become essentially funding sources for the activities of those organisations.”
2.03 The Bank has worked closely with many development agencies operating in the Region and
maintains longstanding and mutually supportive relationships with other Caribbean institutions and
agencies, including those of CARICOM and the OECS Secretariat. The role of the Bank in the aid
architecture for the Region is built on the basis of all these relationships and the capacity to convene joint
regional and international partnerships for addressing critical challenges faced by BMCs.
Multilateral Financing in CDB’s BMCs
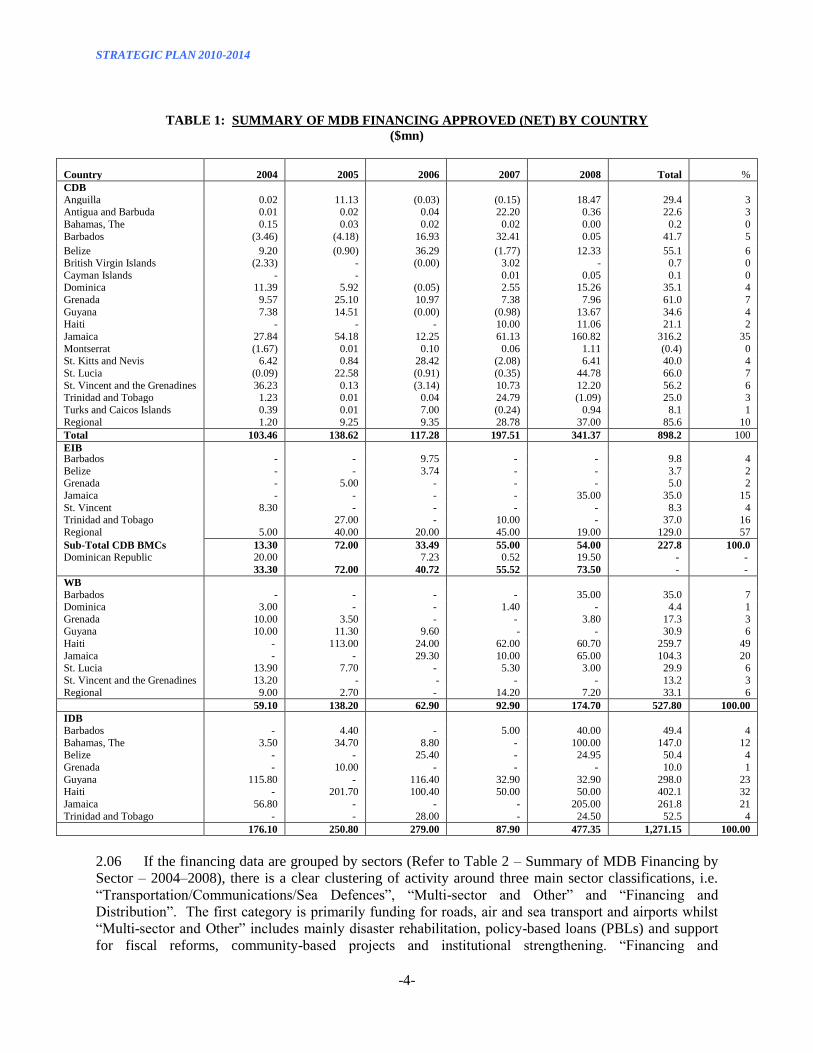
2.04 CDB is a small development institution both in relation to the size of most other development
finance institutions operating in the Region and to the scale of the challenges faced by its borrowing
membership. Nevertheless, amongst the four MDBs operating in the English-speaking Caribbean and
Haiti, it contributed the second largest share of development financing for the period 2004–2008 (Refer to
Table 1 – Summary of MDB Financing by Country - 2004–2008). CDB also ranked as the second largest
provider of loans and grant financing in most of the common member countries and provides the most
comprehensive, country coverage among MDBs operating in the Caribbean.
2.05 In the same period, CDB also accounted for the largest share of MDB financing in Belize and
Jamaica and had the second largest share of the business in Barbados, St. Lucia, and Trinidad and
Tobago. Perhaps more significantly, CDB was active in 17 countries in the Region compared with 6 for
the European Investment Bank (EIB) and 8 each for the World Bank (WB) and Inter-American
Development Bank (IDB). In respect of regional activities, CDB financing amounted to $86 million (mn)
over the four-year period and was second only to the WB which accounted for $129 mn in this category.
STRATEGIC PLAN 2010-2014
-4-
TABLE 1: SUMMARY OF MDB FINANCING APPROVED (NET) BY COUNTRY
($mn)
Country 2004 2005 2006 2007 2008 Total %
CDB
Anguilla 0.02 11.13 (0.03) (0.15) 18.47 29.4 3 Antigua and Barbuda 0.01 0.02 0.04 22.20 0.36 22.6 3
Bahamas, The 0.15 0.03 0.02 0.02 0.00 0.2 0
Barbados (3.46) (4.18) 16.93 32.41 0.05 41.7 5
Belize 9.20 (0.90) 36.29 (1.77) 12.33 55.1 6 British Virgin Islands (2.33) - (0.00) 3.02 - 0.7 0
Cayman Islands - - 0.01 0.05 0.1 0 Dominica 11.39 5.92 (0.05) 2.55 15.26 35.1 4
Grenada 9.57 25.10 10.97 7.38 7.96 61.0 7
Guyana 7.38 14.51 (0.00) (0.98) 13.67 34.6 4 Haiti - - - 10.00 11.06 21.1 2
Jamaica 27.84 54.18 12.25 61.13 160.82 316.2 35
Montserrat (1.67) 0.01 0.10 0.06 1.11 (0.4) 0 St. Kitts and Nevis 6.42 0.84 28.42 (2.08) 6.41 40.0 4
St. Lucia (0.09) 22.58 (0.91) (0.35) 44.78 66.0 7
St. Vincent and the Grenadines 36.23 0.13 (3.14) 10.73 12.20 56.2 6 Trinidad and Tobago 1.23 0.01 0.04 24.79 (1.09) 25.0 3
Turks and Caicos Islands 0.39 0.01 7.00 (0.24) 0.94 8.1 1
Regional 1.20 9.25 9.35 28.78 37.00 85.6 10
Total 103.46 138.62 117.28 197.51 341.37 898.2 100
EIB
Barbados - - 9.75 - - 9.8 4
Belize - - 3.74 - - 3.7 2 Grenada - 5.00 - - - 5.0 2
Jamaica - - - - 35.00 35.0 15
St. Vincent 8.30 - - - - 8.3 4 Trinidad and Tobago 27.00 - 10.00 - 37.0 16
Regional 5.00 40.00 20.00 45.00 19.00 129.0 57
Sub-Total CDB BMCs 13.30 72.00 33.49 55.00 54.00 227.8 100.0
Dominican Republic 20.00 7.23 0.52 19.50 - -
33.30 72.00 40.72 55.52 73.50 - -
WB
Barbados - - - - 35.00 35.0 7 Dominica 3.00 - - 1.40 - 4.4 1
Grenada 10.00 3.50 - - 3.80 17.3 3 Guyana 10.00 11.30 9.60 - - 30.9 6
Haiti - 113.00 24.00 62.00 60.70 259.7 49
Jamaica - - 29.30 10.00 65.00 104.3 20 St. Lucia 13.90 7.70 - 5.30 3.00 29.9 6
St. Vincent and the Grenadines 13.20 - - - - 13.2 3
Regional 9.00 2.70 - 14.20 7.20 33.1 6
59.10 138.20 62.90 92.90 174.70 527.80 100.00
IDB
Barbados - 4.40 - 5.00 40.00 49.4 4
Bahamas, The 3.50 34.70 8.80 - 100.00 147.0 12 Belize - - 25.40 - 24.95 50.4 4
Grenada - 10.00 - - - 10.0 1
Guyana 115.80 - 116.40 32.90 32.90 298.0 23 Haiti - 201.70 100.40 50.00 50.00 402.1 32
Jamaica 56.80 - - - 205.00 261.8 21
Trinidad and Tobago - - 28.00 - 24.50 52.5 4
176.10 250.80 279.00 87.90 477.35 1,271.15 100.00
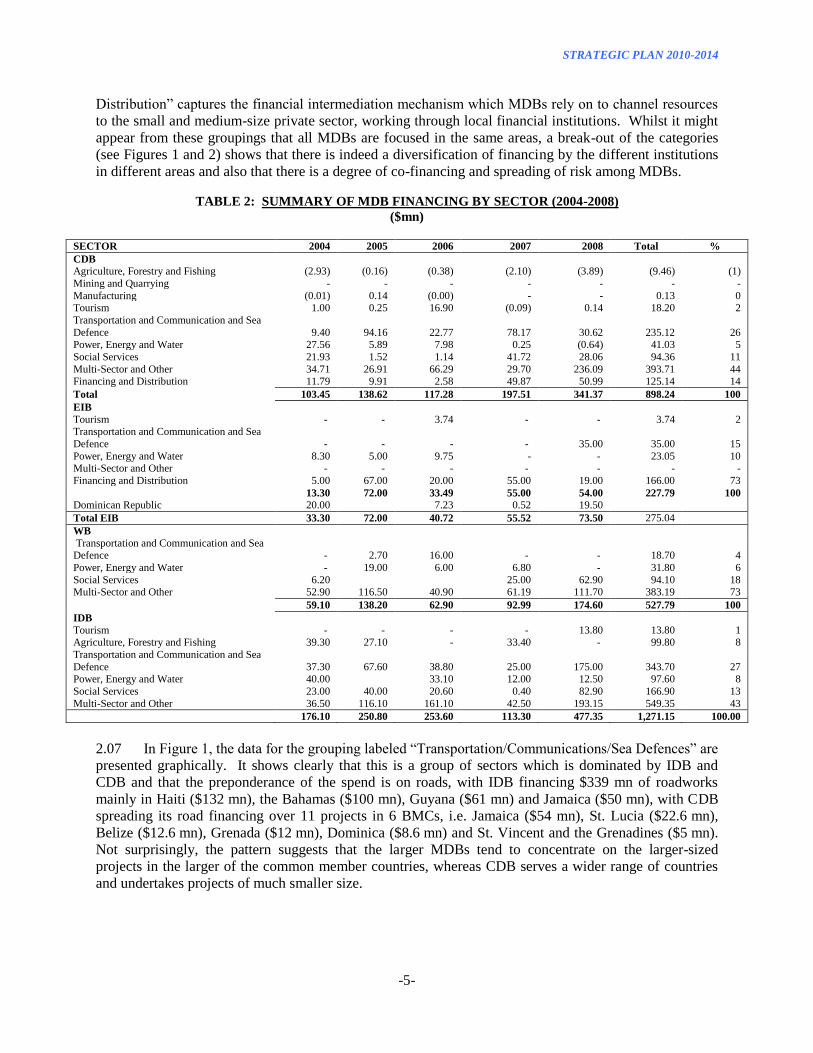
2.06 If the financing data are grouped by sectors (Refer to Table 2 – Summary of MDB Financing by
Sector – 2004–2008), there is a clear clustering of activity around three main sector classifications, i.e.
“Transportation/Communications/Sea Defences”, “Multi-sector and Other” and “Financing and
Distribution”. The first category is primarily funding for roads, air and sea transport and airports whilst
“Multi-sector and Other” includes mainly disaster rehabilitation, policy-based loans (PBLs) and support
for fiscal reforms, community-based projects and institutional strengthening. “Financing and
STRATEGIC PLAN 2010-2014
-5-
Distribution” captures the financial intermediation mechanism which MDBs rely on to channel resources
to the small and medium-size private sector, working through local financial institutions. Whilst it might
appear from these groupings that all MDBs are focused in the same areas, a break-out of the categories
(see Figures 1 and 2) shows that there is indeed a diversification of financing by the different institutions
in different areas and also that there is a degree of co-financing and spreading of risk among MDBs.
TABLE 2: SUMMARY OF MDB FINANCING BY SECTOR (2004-2008)
($mn)
SECTOR 2004 2005 2006 2007 2008 Total %
CDB
Agriculture, Forestry and Fishing (2.93) (0.16) (0.38) (2.10) (3.89) (9.46) (1)
Mining and Quarrying - - - - - - -
Manufacturing (0.01) 0.14 (0.00) - - 0.13 0 Tourism 1.00 0.25 16.90 (0.09) 0.14 18.20 2
Transportation and Communication and Sea
Defence 9.40 94.16 22.77 78.17 30.62 235.12 26 Power, Energy and Water 27.56 5.89 7.98 0.25 (0.64) 41.03 5
Social Services 21.93 1.52 1.14 41.72 28.06 94.36 11
Multi-Sector and Other 34.71 26.91 66.29 29.70 236.09 393.71 44 Financing and Distribution 11.79 9.91 2.58 49.87 50.99 125.14 14
Total 103.45 138.62 117.28 197.51 341.37 898.24 100
EIB
Tourism - - 3.74 - - 3.74 2 Transportation and Communication and Sea
Defence - - - - 35.00 35.00 15
Power, Energy and Water 8.30 5.00 9.75 - - 23.05 10 Multi-Sector and Other - - - - - - -
Financing and Distribution 5.00 67.00 20.00 55.00 19.00 166.00 73
13.30 72.00 33.49 55.00 54.00 227.79 100
Dominican Republic 20.00 7.23 0.52 19.50
Total EIB 33.30 72.00 40.72 55.52 73.50 275.04
WB
Transportation and Communication and Sea Defence - 2.70 16.00 - - 18.70 4
Power, Energy and Water - 19.00 6.00 6.80 - 31.80 6
Social Services 6.20
25.00 62.90 94.10 18 Multi-Sector and Other 52.90 116.50 40.90 61.19 111.70 383.19 73
59.10 138.20 62.90 92.99 174.60 527.79 100
IDB
Tourism - - - - 13.80 13.80 1 Agriculture, Forestry and Fishing 39.30 27.10 - 33.40 - 99.80 8
Transportation and Communication and Sea
Defence 37.30 67.60 38.80 25.00 175.00 343.70 27 Power, Energy and Water 40.00 33.10 12.00 12.50 97.60 8
Social Services 23.00 40.00 20.60 0.40 82.90 166.90 13
Multi-Sector and Other 36.50 116.10 161.10 42.50 193.15 549.35 43
176.10 250.80 253.60 113.30 477.35 1,271.15 100.00
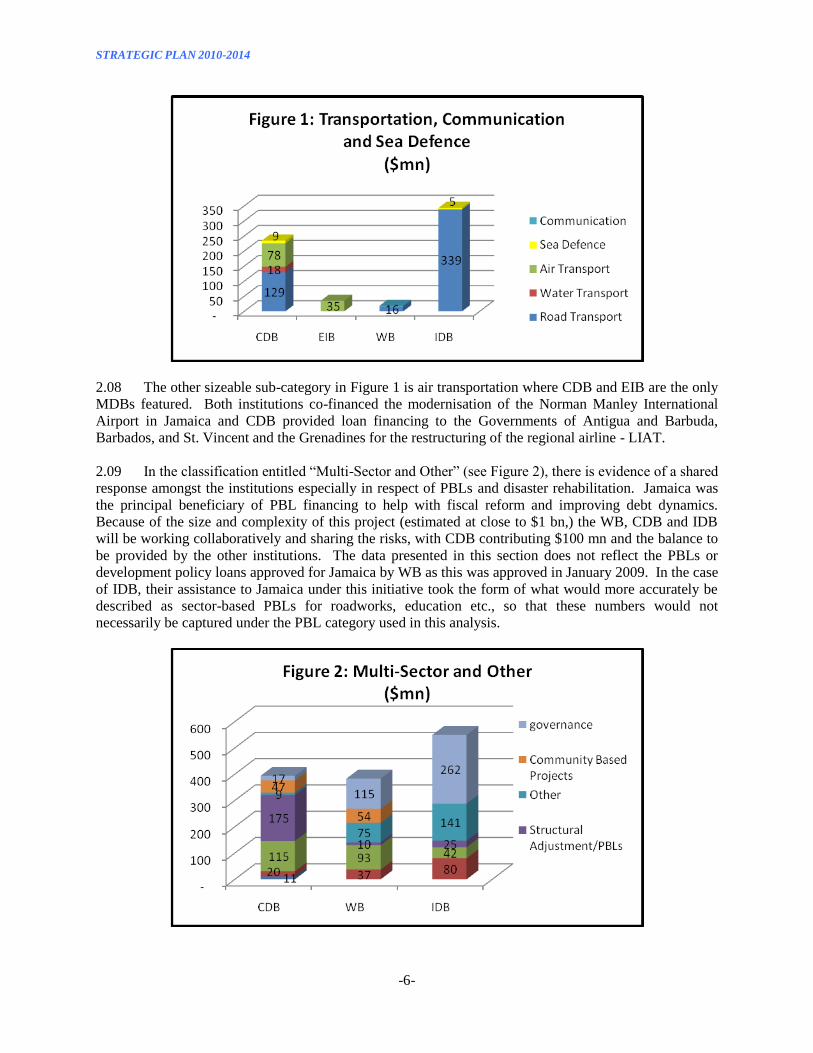
2.07 In Figure 1, the data for the grouping labeled “Transportation/Communications/Sea Defences” are
presented graphically. It shows clearly that this is a group of sectors which is dominated by IDB and
CDB and that the preponderance of the spend is on roads, with IDB financing $339 mn of roadworks
mainly in Haiti ($132 mn), the Bahamas ($100 mn), Guyana ($61 mn) and Jamaica ($50 mn), with CDB
spreading its road financing over 11 projects in 6 BMCs, i.e. Jamaica ($54 mn), St. Lucia ($22.6 mn),
Belize ($12.6 mn), Grenada ($12 mn), Dominica ($8.6 mn) and St. Vincent and the Grenadines ($5 mn).
Not surprisingly, the pattern suggests that the larger MDBs tend to concentrate on the larger-sized
projects in the larger of the common member countries, whereas CDB serves a wider range of countries
and undertakes projects of much smaller size.
STRATEGIC PLAN 2010-2014
-6-
2.08 The other sizeable sub-category in Figure 1 is air transportation where CDB and EIB are the only
MDBs featured. Both institutions co-financed the modernisation of the Norman Manley International
Airport in Jamaica and CDB provided loan financing to the Governments of Antigua and Barbuda,
Barbados, and St. Vincent and the Grenadines for the restructuring of the regional airline - LIAT.
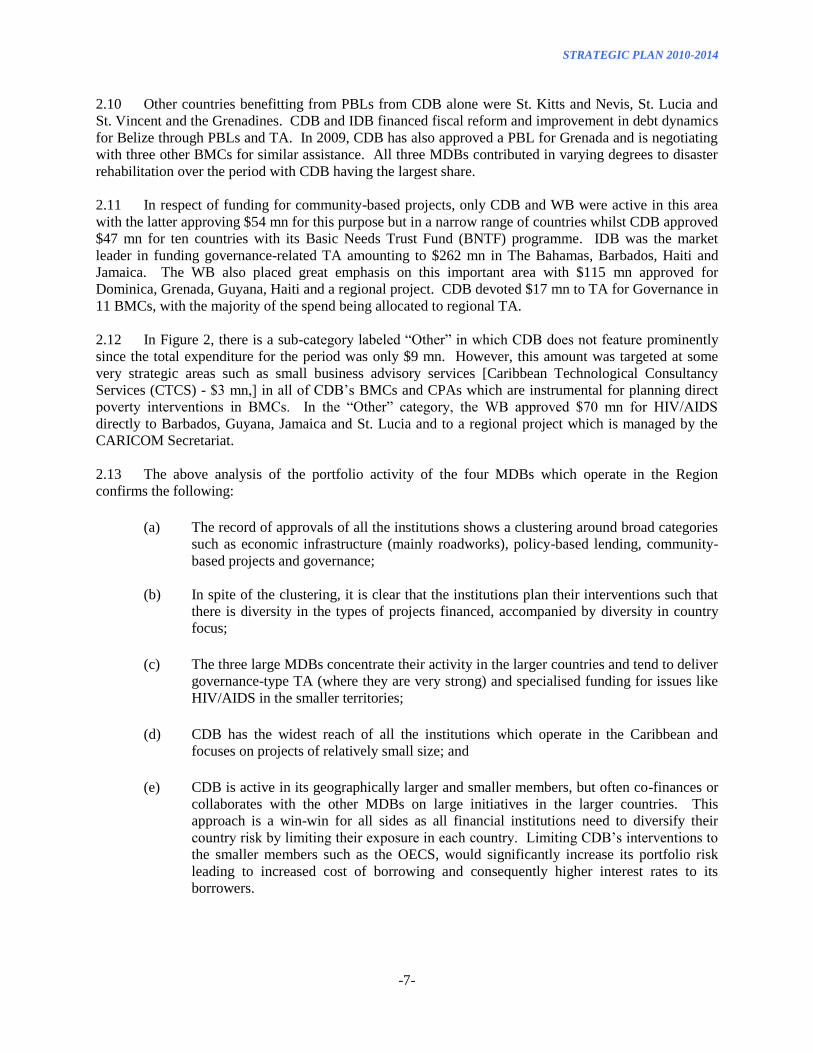
2.09 In the classification entitled “Multi-Sector and Other” (see Figure 2), there is evidence of a shared
response amongst the institutions especially in respect of PBLs and disaster rehabilitation. Jamaica was
the principal beneficiary of PBL financing to help with fiscal reform and improving debt dynamics.
Because of the size and complexity of this project (estimated at close to $1 bn,) the WB, CDB and IDB
will be working collaboratively and sharing the risks, with CDB contributing $100 mn and the balance to
be provided by the other institutions. The data presented in this section does not reflect the PBLs or
development policy loans approved for Jamaica by WB as this was approved in January 2009. In the case
of IDB, their assistance to Jamaica under this initiative took the form of what would more accurately be
described as sector-based PBLs for roadworks, education etc., so that these numbers would not
necessarily be captured under the PBL category used in this analysis.
STRATEGIC PLAN 2010-2014
-7-
2.10 Other countries benefitting from PBLs from CDB alone were St. Kitts and Nevis, St. Lucia and
St. Vincent and the Grenadines. CDB and IDB financed fiscal reform and improvement in debt dynamics
for Belize through PBLs and TA. In 2009, CDB has also approved a PBL for Grenada and is negotiating
with three other BMCs for similar assistance. All three MDBs contributed in varying degrees to disaster
rehabilitation over the period with CDB having the largest share.
2.11 In respect of funding for community-based projects, only CDB and WB were active in this area
with the latter approving $54 mn for this purpose but in a narrow range of countries whilst CDB approved
$47 mn for ten countries with its Basic Needs Trust Fund (BNTF) programme. IDB was the market
leader in funding governance-related TA amounting to $262 mn in The Bahamas, Barbados, Haiti and
Jamaica. The WB also placed great emphasis on this important area with $115 mn approved for
Dominica, Grenada, Guyana, Haiti and a regional project. CDB devoted $17 mn to TA for Governance in
11 BMCs, with the majority of the spend being allocated to regional TA.
2.12 In Figure 2, there is a sub-category labeled “Other” in which CDB does not feature prominently
since the total expenditure for the period was only $9 mn. However, this amount was targeted at some
very strategic areas such as small business advisory services [Caribbean Technological Consultancy
Services (CTCS) - $3 mn,] in all of CDB‟s BMCs and CPAs which are instrumental for planning direct
poverty interventions in BMCs. In the “Other” category, the WB approved $70 mn for HIV/AIDS
directly to Barbados, Guyana, Jamaica and St. Lucia and to a regional project which is managed by the
CARICOM Secretariat.
2.13 The above analysis of the portfolio activity of the four MDBs which operate in the Region
confirms the following:
(a) The record of approvals of all the institutions shows a clustering around broad categories
such as economic infrastructure (mainly roadworks), policy-based lending, community-
based projects and governance;
(b) In spite of the clustering, it is clear that the institutions plan their interventions such that
there is diversity in the types of projects financed, accompanied by diversity in country
focus;
(c) The three large MDBs concentrate their activity in the larger countries and tend to deliver
governance-type TA (where they are very strong) and specialised funding for issues like
HIV/AIDS in the smaller territories;
(d) CDB has the widest reach of all the institutions which operate in the Caribbean and
focuses on projects of relatively small size; and
(e) CDB is active in its geographically larger and smaller members, but often co-finances or
collaborates with the other MDBs on large initiatives in the larger countries. This
approach is a win-win for all sides as all financial institutions need to diversify their
country risk by limiting their exposure in each country. Limiting CDB‟s interventions to
the smaller members such as the OECS, would significantly increase its portfolio risk
leading to increased cost of borrowing and consequently higher interest rates to its
borrowers.

STRATEGIC PLAN 2010-2014
-8-
CDB’s Mandate and Portfolio Risk
2.14 The Agreement Establishing the Caribbean Development Bank (The Charter), mandates CDB to
“…contribute to the harmonious growth and development of the member countries in the Caribbean and
to promote economic co-operation and integration among them, having special and urgent regard to the
needs of the less developed members of the region.” Consistent with this Charter mandate, CDB has
skewed resources to the smaller and more vulnerable of its BMCs, especially the United Kingdom
Overseas Territories (UKOTs) and the small islands of the OECS sub-region. Table 3 shows, firstly, that
these countries have generally enjoyed the greatest leverage (an average of 41 times for the OECS and
UKOTs) relative to the resources which they have invested in the Bank compared to Trinidad and Tobago
at 3.5 times and Jamaica, Barbados and Guyana which range from 14 to 15 times.
TABLE 3: LEVERAGE OF BMCs CAPITAL SUBSCRIPTIONS AND CONTRIBUTIONS, 1970-2008
2.15 The OECS and UKOTs (excluding the Cayman Islands) received 60% of all loans and grants
disbursed by CDB. The remaining 40% of CDB‟s historical allocation has, therefore, been shared
amongst Jamaica, Barbados and Trinidad and Tobago. Jamaica, accounts for 21% of the total historical
share of resources despite the fact that its population is approximately 40% of the rest of the Bank‟s
membership excluding Haiti which only became a member in 2007. Significantly, Jamaica, aside from
Haiti, has the largest number of poor in the Region with almost 450,000 people living below the poverty
line.
2.16 As illustrated in the discussion above on market share and market reach, CDB has been a
significant player in Jamaica and Belize as far as the geographically larger countries are concerned and, in
terms of overall market share, it ranks second over the period 2004-2008 and third amongst the MDBs.
As is to be expected, CDB is the dominant provider of development financing in the OECS and the
UKOTs.1/ Nonetheless, CDB must strive to maintain a regionally diversified portfolio. Diversification
over the entire BMCs reduces portfolio risks that would arise from concentration on a smaller group of
1/ It should be noted that IDB does not conduct any direct operations in the OECS or UKOTs.
Total OCR Paid-in SDF TotalLoans and Sub- Contri- Contributed
Loans Grants Grants scriptions butions Capital
51.0 1.7 52.7 0.2 0.7 0.9 56.0
64.1 6.1 70.2 1.1 1.7 2.8 25.2
53.5 0.8 54.3 7.5 14.1 21.7 2.5
266.4 1.5 267.9 4.8 14.1 18.9 14.1
226.8 20.6 247.5 1.1 3.7 4.9 50.8
61.8 0.9 62.7 0.2 1.4 1.7 37.4
52.9 0.2 53.1 0.3 1.3 1.6 32.7
165.7 25.5 191.1 1.1 3.5 4.6 41.4
181.9 18.7 200.6 1.0 2.7 3.7 54.1
202.2 31.8 234.0 5.5 9.9 15.4 15.2
0 21.1 21.1 1.2 0.7 1.8 11.6
666.4 10.0 676.4 25.5 23.0 48.6 13.9
10.3 7.8 18.1 0.3 1.4 1.7 10.5
169.8 13.0 182.8 1.1 3.7 4.9 37.5
296.5 19.6 316.1 1.1 3.7 4.9 64.9
167.5 18.1 185.5 1.1 3.8 4.9 38.0
177.8 0.6 178.4 25.5 25.2 50.7 3.5
26.3 3.7 29.9 0.3 1.4 1.7 17.4
59.7 100.5 160.2 0 0 0 0
43.6 0 43.6 0 0 0 0
2,944.1 302.0 3,246.1 79.2 116.3 195.5 16.6
Approved/Contr
ibuted Capital
(Times)
Subscriptions and Contributions ($mn)
Regional
Montserrat
Anguilla
Antigua and Barbuda
The Bahamas
Barbados
Belize
Haiti
St. Kitts and Nevis
St. Lucia
St. Vincent and the Grenadines
Trinidad and Tobago
Approvals ($mn)
Private
British Virgin Islands
Cayman Islands
Dominica
Grenada
Turks and Caicos Islands
Guyana
Jamaica
STRATEGIC PLAN 2010-2014
-9-
countries with very similar economic structures, all located in an even narrower geographical space. This
would have very serious consequences for the pricing of CDB‟s debt in the international capital markets
because of the increased concentration risks and hence, the pricing of CDBs‟ loans to BMCs.
2.17 In response to some suggestions that CDB should concentrate exclusively on its smaller-sized
members, the following factors suggest otherwise:
(a) the quality of CDB‟s portfolio would, over time, deteriorate as the proportion of non-
investment grade loans from the OECS group increases, thus requiring wider spreads on
CDB‟s loans to all borrowers to cover the increased portfolio risk;
(b) the Bank‟s already high unit cost structure relative to the other MDBs because of CDB‟s
relatively small portfolio would become even higher as the fixed costs of staffing and
other overheads would now have to be spread over a diminishing portfolio, without
necessarily benefitting from significant savings from the smaller operation given the
many non-revenue earning mandates which have to be undertaken on behalf of members;
(c) the larger BMCs would also be adversely affected by CDB‟s retreat from their markets as
the other MDBs are unlikely to want to pick up the slack as they are themselves anxious
to share the risk with institutions like CDB in these countries. This, in fact, is the basis
for the current practice of large projects in these countries being parceled out amongst
more than one MDB;
(d) another risk to the larger BMCs with a reduction in CDB lending is that even the larger
Caribbean countries do not have a very strong voice in the large MDBs and, therefore,
suffer disproportionately in the allocation of resources; and
(e) even though the larger BMCs have access to the international capital markets, the size of
a typical borrowing is small and therefore expensive relative to what large issuers pay.
Furthermore, it is very likely that, in the aftermath of the current international recession,
spreads on bonds issued by emerging markets will be wider than they have been in the
past, thereby forcing up the average cost of development financing to the larger BMCs
and exacerbating already unhealthy debt dynamics.
2.18 It is, therefore, better for CDB‟s risk management and development effectiveness to maintain a
diversified portfolio of loans across its membership, whilst staying true to its mandate of paying special
attention to the needs of the least developed countries.
Resource Requirements to Respond to Vulnerability
2.19 The resources required for BMCs to meaningfully respond to the challenges outlined are in
limited supply. BMCs, therefore, need to turn to international donor assistance to supplement the
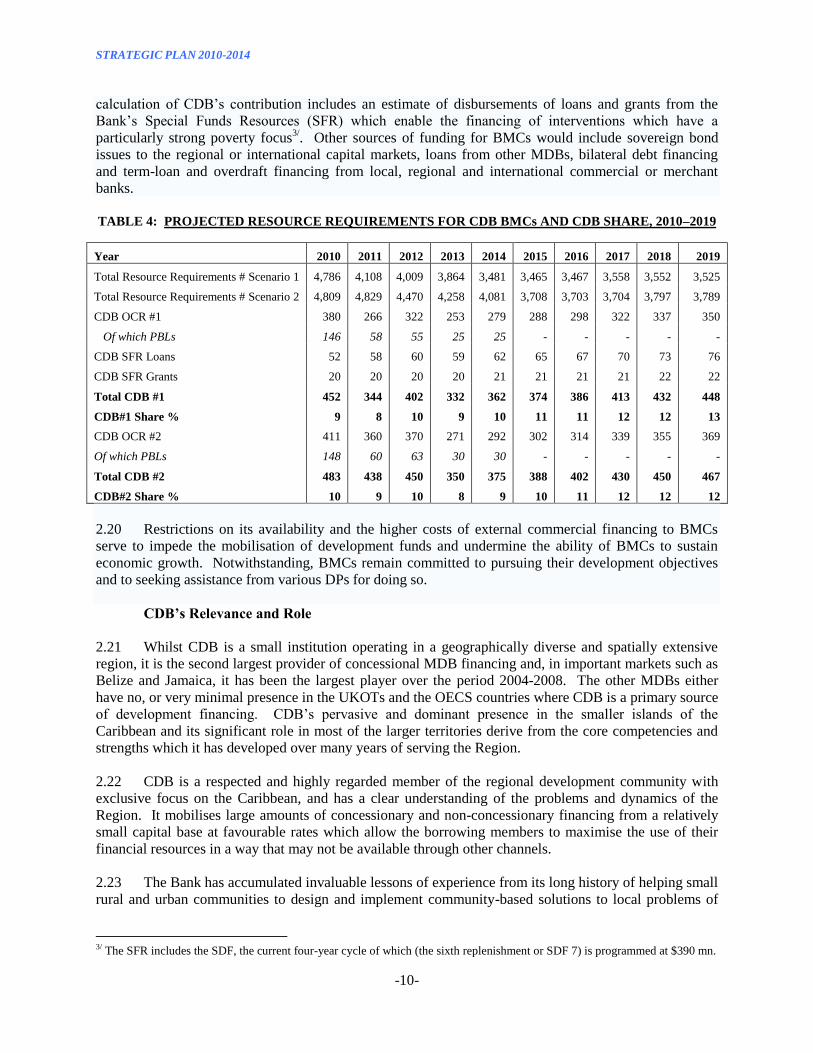
resources needed to implement these measures. Estimates of the demand by BMCs for total development
assistance over the period 2010–2019 are summarised in Table 4. These projections indicate total annual
resource requirements by BMCs ranging between $3.5 bn and $4.8 bn per annum (p.a.) over the ten-year
period. CDB‟s contribution to the total resource needs of its members is expected to remain a small
subset of the Region‟s total requirements with the annual share ranging between 8% and 13%.2/ The
2/ It should be noted, however, that CDB‟s contribution to the financing requirement of the OECS is of a much greater magnitude,
ranging from 20% to 31% over the 2004-2008 period.
STRATEGIC PLAN 2010-2014
-10-
calculation of CDB‟s contribution includes an estimate of disbursements of loans and grants from the
Bank‟s Special Funds Resources (SFR) which enable the financing of interventions which have a
particularly strong poverty focus3/. Other sources of funding for BMCs would include sovereign bond
issues to the regional or international capital markets, loans from other MDBs, bilateral debt financing
and term-loan and overdraft financing from local, regional and international commercial or merchant
banks.
TABLE 4: PROJECTED RESOURCE REQUIREMENTS FOR CDB BMCs AND CDB SHARE, 2010–2019
Year 2010 2011 2012 2013 2014 2015 2016 2017 2018 2019
Total Resource Requirements # Scenario 1 4,786 4,108 4,009 3,864 3,481 3,465 3,467 3,558 3,552 3,525
Total Resource Requirements # Scenario 2 4,809 4,829 4,470 4,258 4,081 3,708 3,703 3,704 3,797 3,789
CDB OCR #1 380 266 322 253 279 288 298 322 337 350
Of which PBLs 146 58 55 25 25 - - - - -
CDB SFR Loans 52 58 60 59 62 65 67 70 73 76
CDB SFR Grants 20 20 20 20 21 21 21 21 22 22
Total CDB #1 452 344 402 332 362 374 386 413 432 448
CDB#1 Share % 9 8 10 9 10 11 11 12 12 13
CDB OCR #2 411 360 370 271 292 302 314 339 355 369
Of which PBLs 148 60 63 30 30 - - - - -
Total CDB #2 483 438 450 350 375 388 402 430 450 467
CDB#2 Share % 10 9 10 8 9 10 11 12 12 12
2.20 Restrictions on its availability and the higher costs of external commercial financing to BMCs
serve to impede the mobilisation of development funds and undermine the ability of BMCs to sustain
economic growth. Notwithstanding, BMCs remain committed to pursuing their development objectives
and to seeking assistance from various DPs for doing so.
CDB’s Relevance and Role
2.21 Whilst CDB is a small institution operating in a geographically diverse and spatially extensive
region, it is the second largest provider of concessional MDB financing and, in important markets such as
Belize and Jamaica, it has been the largest player over the period 2004-2008. The other MDBs either
have no, or very minimal presence in the UKOTs and the OECS countries where CDB is a primary source
of development financing. CDB‟s pervasive and dominant presence in the smaller islands of the
Caribbean and its significant role in most of the larger territories derive from the core competencies and
strengths which it has developed over many years of serving the Region.
2.22 CDB is a respected and highly regarded member of the regional development community with
exclusive focus on the Caribbean, and has a clear understanding of the problems and dynamics of the
Region. It mobilises large amounts of concessionary and non-concessionary financing from a relatively
small capital base at favourable rates which allow the borrowing members to maximise the use of their
financial resources in a way that may not be available through other channels.
2.23 The Bank has accumulated invaluable lessons of experience from its long history of helping small
rural and urban communities to design and implement community-based solutions to local problems of
3/ The SFR includes the SDF, the current four-year cycle of which (the sixth replenishment or SDF 7) is programmed at $390 mn.
STRATEGIC PLAN 2010-2014
-11-
basic infrastructure, geared towards improving the quality of life of poor people. This is particularly true
of the BNTF programme which has been in existence for over 20 years and is operational in 10 countries.
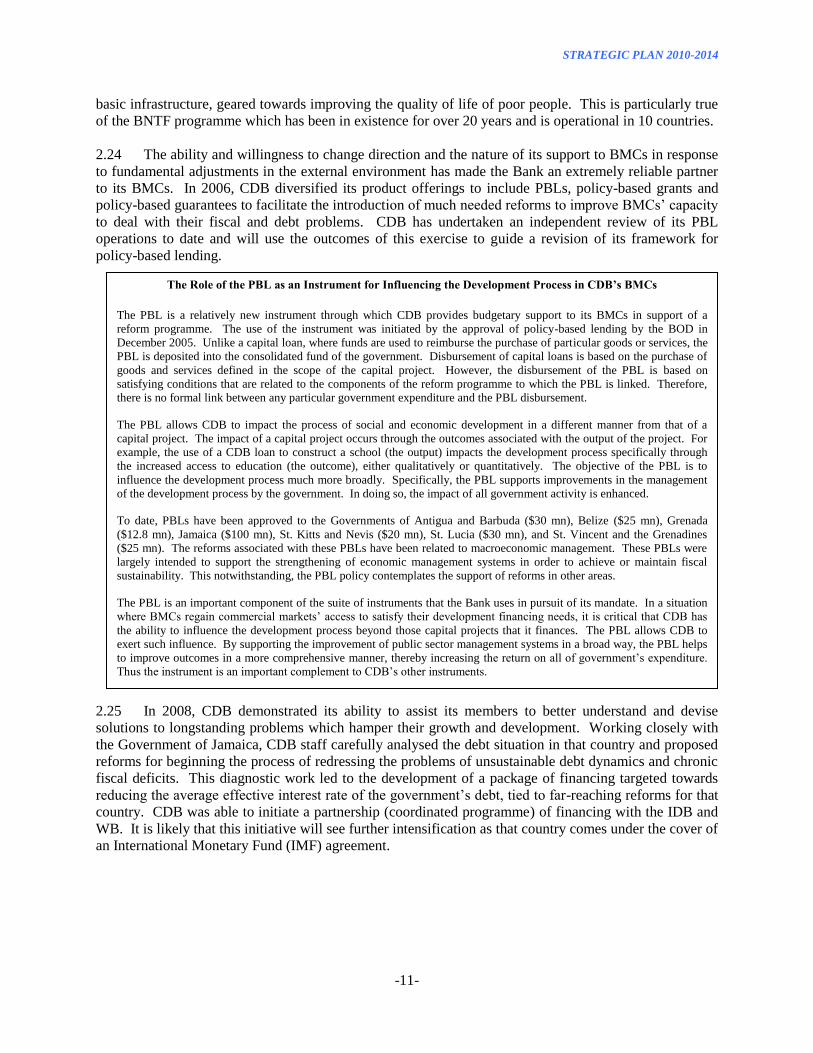
2.24 The ability and willingness to change direction and the nature of its support to BMCs in response
to fundamental adjustments in the external environment has made the Bank an extremely reliable partner
to its BMCs. In 2006, CDB diversified its product offerings to include PBLs, policy-based grants and
policy-based guarantees to facilitate the introduction of much needed reforms to improve BMCs‟ capacity
to deal with their fiscal and debt problems. CDB has undertaken an independent review of its PBL
operations to date and will use the outcomes of this exercise to guide a revision of its framework for
policy-based lending.
2.25 In 2008, CDB demonstrated its ability to assist its members to better understand and devise
solutions to longstanding problems which hamper their growth and development. Working closely with
the Government of Jamaica, CDB staff carefully analysed the debt situation in that country and proposed
reforms for beginning the process of redressing the problems of unsustainable debt dynamics and chronic
fiscal deficits. This diagnostic work led to the development of a package of financing targeted towards
reducing the average effective interest rate of the government‟s debt, tied to far-reaching reforms for that
country. CDB was able to initiate a partnership (coordinated programme) of financing with the IDB and
WB. It is likely that this initiative will see further intensification as that country comes under the cover of
an International Monetary Fund (IMF) agreement.
The Role of the PBL as an Instrument for Influencing the Development Process in CDB’s BMCs
The PBL is a relatively new instrument through which CDB provides budgetary support to its BMCs in support of a
reform programme. The use of the instrument was initiated by the approval of policy-based lending by the BOD in
December 2005. Unlike a capital loan, where funds are used to reimburse the purchase of particular goods or services, the
PBL is deposited into the consolidated fund of the government. Disbursement of capital loans is based on the purchase of
goods and services defined in the scope of the capital project. However, the disbursement of the PBL is based on
satisfying conditions that are related to the components of the reform programme to which the PBL is linked. Therefore,
there is no formal link between any particular government expenditure and the PBL disbursement.
The PBL allows CDB to impact the process of social and economic development in a different manner from that of a
capital project. The impact of a capital project occurs through the outcomes associated with the output of the project. For
example, the use of a CDB loan to construct a school (the output) impacts the development process specifically through
the increased access to education (the outcome), either qualitatively or quantitatively. The objective of the PBL is to
influence the development process much more broadly. Specifically, the PBL supports improvements in the management
of the development process by the government. In doing so, the impact of all government activity is enhanced.
To date, PBLs have been approved to the Governments of Antigua and Barbuda ($30 mn), Belize ($25 mn), Grenada
($12.8 mn), Jamaica ($100 mn), St. Kitts and Nevis ($20 mn), St. Lucia ($30 mn), and St. Vincent and the Grenadines
($25 mn). The reforms associated with these PBLs have been related to macroeconomic management. These PBLs were
largely intended to support the strengthening of economic management systems in order to achieve or maintain fiscal
sustainability. This notwithstanding, the PBL policy contemplates the support of reforms in other areas.
The PBL is an important component of the suite of instruments that the Bank uses in pursuit of its mandate. In a situation
where BMCs regain commercial markets‟ access to satisfy their development financing needs, it is critical that CDB has
the ability to influence the development process beyond those capital projects that it finances. The PBL allows CDB to
exert such influence. By supporting the improvement of public sector management systems in a broad way, the PBL helps
to improve outcomes in a more comprehensive manner, thereby increasing the return on all of government‟s expenditure.
Thus the instrument is an important complement to CDB‟s other instruments.
STRATEGIC PLAN 2010-2014
-12-
2.26 The role of the Bank in the aid architecture for the Caribbean follows from these relationships.
CDB is recognised as an important regional development institution in the Caribbean, with a broad
development mandate, and which is well-placed as a focal point for dialogue, intermediation and
extended partnerships on behalf of BMCs, and for the strengthening of regional ownership of
development programmes. The leadership role by the Bank and leveraging of its comparative advantage
will be of critical importance in assisting BMCs to meet the challenges they are currently facing.
STRATEGIC PLAN 2010-2014
-13-
3. OPERATIONAL FRAMEWORK
3.01 CDB will apply a number of operating principles to improve its operational modalities and to
guide the design and implementation of its programmes and projects. These principles are consistent with
the managing for development results (MfDR) approaches adopted by the international development
community4/ for enhancing development effectiveness and performance, as well as for achieving
sustainable improvements in country outcomes. These operating principles include:
(a) Selectivity and Focus;
(b) Country Ownership;
(c) Partnership and Harmonisation; and
(d) Managing for Results and Development Effectiveness.
3.02 All of these are central to CDB‟s understanding of its role as a development institution and its
contribution to reducing poverty in BMCs. They will assist the Bank to define which interventions it will
undertake and how it will do so. The principles will be applied as appropriate to all CDB‟s country and
regional projects and programmes.
Selectivity and Focus
3.03 The Bank is often faced with resolving the choice of being responsive to the many needs of
BMCs and the reality of its small size and limited human and financial resources. CDB cannot and will
not attempt to meet all the resource needs of its BMCs. A few sectors have been identified as CDB‟s core
operational sectors where it has retained and continues to build up a critical mass of expertise and can act
as a leading provider of assistance in collaboration with other DPs. The core operational sectors are
education and training, transportation, water and sanitation, solid waste management, energy, agriculture
and rural development and private sector development. In its interventions in BMCs, an even more
selective operational focus will be set out in the Bank‟s country assistance strategy (CAS) papers.
3.04 There is a significant demand for CDB‟s assistance in the core operational sectors and the Bank
has a strong record of performance in each of them. Each sector has also been identified as being critical
for addressing more than one strategic objective.
Country Ownership
3.05 The Bank will continue to plan and implement its development interventions in BMCs through
the principle of country ownership. CDB has been strengthening country ownership over development
by:
(a) broadening country-level policy dialogue on development;
(b) enhancing BMCs capacity to lead and manage development; and
(c) working together with other DPs to promote operational changes that make capacity
development support more effective.
4/ Marrakech (2000), Rome (2001), Paris (2004), and Accra (2008).
STRATEGIC PLAN 2010-2014
-14-
3.06 The Bank‟s programmes of assistance to each BMC are increasingly informed by that country‟s
poverty assessment, poverty reduction strategy (PRS), medium-term development plan and other
available sector/thematic plans. The process for developing CDB‟s own results-based CAS will continue
to require its alignment with each country‟s strategic priorities and strengthened country-level
collaboration with other DPs.
3.07 This country ownership process, operationalised through results-based CASs, will be enhanced
and used as the principal means of targeting and focusing of all CDB‟s country programme interventions.
It will be the basis for all country lending, TA and policy dialogue and will be conducted with increased
country-level participation by other DPs. The use of results-based CAS will also support strategic
selectivity, enable better allocation of resources to BMCs‟ priorities, and provide a framework to help
manage for results.
Partnership and Harmonisation
3.08 CDB will expand the use of partnership and harmonisation as measures for increasing its
development effectiveness and contribution to development results. CDB recognises the importance of
forging partnerships, and coordinating its activities and initiatives with other DPs. The Bank will engage
in partnerships with a wider range of international development agencies, multilateral and bilateral
institutions, the private sector, non-governmental organisations and community-based organisations. The
Bank will explore various means for deepening these partnerships including the strengthening of on-the-
ground capabilities in some BMCs.
3.09 Frequent use will be made of activities such as joint country and policy analytical works (CPAs,
PRS papers and programme reviews) and loan and TA co-financing in order to advance the partnership
and harmonisation agenda. The increased use of programme-based modalities is advocated as a way to
facilitate harmonisation. Closer collaboration with the private sector would be promoted through co-
financing and other market-based financing instruments.
3.10 CDB will continue to adopt harmonised approaches in the areas of concessionary resource
allocation, disaster risk reduction (DRR)/DRM, environmental protection, and social protection.
Substantial progress has been made in mainstreaming DRM into the planning processes of some BMCs
and harmonised criteria are used in the conduct of evaluations undertaken by CDB‟s Evaluation and
Oversight Division (EOV).
3.11 The Bank implements common arrangements at country level through the participation of Bank
staff in the IMF Article IV missions and Poverty Reduction and Growth Facility Review visits. These
joint missions, in addition to enhancing collaboration, provide for information sharing, joint consultation,
and policy dialogue between BMCs and the development agencies.
3.12 Through the establishment of a multi-agency coordinated programme - Support Poverty
Assessment and Reduction in the Caribbean - the Bank promotes the strengthening of statistical systems
for poverty monitoring and social policy formulation in the Region. The Bank also entered an agreement
with IDB for the conduct of training in the collection, analysis and dissemination of social and poverty
data by BMCs.
3.13 The Bank provides coordinated capacity development support, in collaboration with DPs, through
organisations such as the Caribbean Regional Technical Assistance Center (CARTAC), for design and
management of economic and fiscal programmes in BMCs, and the Caribbean Regional Negotiating
Machinery (CRNM), for building consensus on trade issues and training in negotiations‟ techniques.
STRATEGIC PLAN 2010-2014
-15-
Managing for Results and Development Effectiveness
3.14 The Bank‟s MfDR agenda is focused on development performance and on sustainable
improvements in country outcomes. Strengthening CDB‟s institutional effectiveness has been critical to
improving its development effectiveness. This has involved, in addition to other measures, adopting a
results orientation to the work of all departments as well as applying MfDR at different levels of the
Bank‟s internal processes and programming activities.
3.15 The Bank‟s work in these areas will be further strengthened particularly in areas identified in the
Accra Agenda for Action. These include strengthening country ownership of operational poverty
reduction and development strategies; identifying good practices and lessons learned on donor division of
labour; further strengthening of country systems; applying lessons learned in capacity development to
better align and harmonise TA; and assessing the experience of collaborative and joint assistance
strategies.
STRATEGIC PLAN 2010-2014
-16-
4. THE DEVELOPMENT CHALLENGES
4.01 CDB‟s borrowing members (BMCs) are all developing countries whose fundamental objective is
that of achieving sustainable economic and social development. Since the decade of the 1960s, the
Caribbean as a whole has sustained moderate annual growth of real per capita Gross Domestic Product
(GDP). Average growth rates for each decade did not fall below 1.9% and reached as high as 3.9%. This
sustained record of economic growth, although sometimes variable, provides the basis for the higher level
of development for Caribbean citizens than was possible four decades ago.
4.02 Prospects for further progress towards achieving sustainable economic and social development
are threatened by the one characteristic shared by all CDB BMCs, i.e. vulnerability. This phenomenon
affects all countries to a greater or lesser degree and emanates from their “smallness” or “small-size”5/
both in physical and economic terms.
4.03 Small states such as CDB‟s BMCs bring to the development process inherent weaknesses that
make them highly vulnerable to external shocks. These weaknesses include a small resource base in
terms of skills and natural resources, limited institutional capability, small domestic markets, proneness to
natural disasters, environmental fragility, high export dependence – particularly dependence on a small
number of exports (of both goods and services) and a limited number of markets, high import
dependence, including dependence on imported energy, and limited access to capital markets.
Furthermore, in a globalised economic environment, new vulnerabilities have emerged, particularly the
risk of financial crisis/contagion with greater integration into global financial markets.
4.04 These factors present challenges for BMCs in their quest for sustainable economic development
and an improved quality of life for their citizens. The vulnerability of BMCs‟ economies to economic
shocks has particular implications for the poor as well as the vulnerable, who represent a significant
proportion of the population of these countries and who can easily be pushed into poverty as a result of
economic shocks.
4.05 Most BMCs face environmental vulnerability arising from their own efforts at economic growth
and development. For example, there has been degradation of the natural environment from the pursuit of
tourism in some countries. There are fundamental inter-linkages between environmental degradation and
poverty. It is the poor, relying on natural resources for their livelihood and living in conditions with
limited access to basic amenities, who often contribute to environmental degradation.
4.06 Furthermore, BMCs also face persistent exposure to natural hazards, such as hurricanes,
earthquakes, volcanoes and flooding, which are frequent and often devastating. These natural disasters
and climate change exacerbate the difficulties of environmental sustainability. In addition, climate
change resulting from global warming and rising sea levels is impacting all BMCs, even the ones located
in Central and South America which have low-lying coastal zones.
Poverty and Inequality Remain As Leading Challenges
4.07 The level of poverty among BMCs ranges from a high of 65% (1997) in Haiti to 14% (1997)6/ in
Barbados. However, poverty levels in seven countries range between 30% and 45% and in a further five
countries, the poverty levels are between 20% and 30%.7/ CPAs, conducted over the past five years
5/ All CDB‟s BMCs, including Belize and Guyana, have been classified as “Small Island Developing States” or “Low-Lying
Coastal Countries” by the United Nations Department of Economic and Social Affairs – Division for Sustainable Development 6/ The poverty situation in Haiti has been made worse by the impact of the earthquake of January 12, 2010. 7/ Refer to Appendix 2 - Poverty Indicators for Selected Caribbean Countries.
STRATEGIC PLAN 2010-2014
-17-
confirm that, despite gains in many areas of social life, unacceptable levels of indigence, poverty,
inequality and social exclusion remain as central features of life for many in the Caribbean.
4.08 A number of interrelated factors contribute to poverty in the Caribbean. These include: poor
economic growth performance; reliance on a single crop or sector in decline; macroeconomic instability;
limited job growth; low productivity and low wages in the informal sector; inadequate access to social
services; inadequate access to private and government-provided unemployment relief and social insurance
and inadequate social safety nets. Poverty also results from the limited capacity of countries to address
citizens‟ concerns and ambitions, contributing to migration and depletion of valuable skills. In addition,
the current international financial and economic crises are likely to seriously affect growth rates and
economic performance, with consequent adverse implications for poverty levels.
4.09 The benefits of social and economic progress are not evenly distributed among and within the
countries of the Region and there are statistical indications that economic inequality is still at
unsatisfactory levels. There is a need for proactive measures to promote broad-based and sustainable
development which could reverse the disparity, and reduce the risks of social instability.
Accelerating Economic Growth is an Imperative
4.10 Rapid and sustained economic growth is the single most influential factor for strengthening
resilience and reducing poverty in vulnerable countries. However, economic growth is not a sufficient
condition for poverty reduction. While average growth performance in Caribbean economies improved
gradually during 1990–2006, it can be considered moderate at best, and was below the average for all
small states for most of the period. In addition, BMCs have exhibited a pattern of high growth volatility,
caused in part by the frequent occurrence of natural disasters, and there is significant variation in growth
performance among the countries with implications for the progress of the movement towards economic
integration.
4.11 In recent times, economic growth rates have been reduced by a slowing down of leading sectors
and industries notably tourism, agriculture and mining; loss of trade preferences; low labour productivity,
weak public finances and large public sector debt repayment obligations, which stymied public sector
investment and other growth-promoting public expenditures.
4.12 The global financial and economic crises has also worsened the prospects for high and steady
growth and exposed some of the sectors on which BMCs depend. Extreme export concentration in
tourism, extractive minerals, and sugar and other agriculture, manufacturing, and offshore financial
services make many BMCs extraordinarily vulnerable to external economic shocks. Great progress in
establishing a viable niche market for the provision of off-shore financial services is now in danger of
being derailed by renewed attention to the issue of off-shore tax havens. In some BMCs, the off-shore
sector has become a vehicle for economic diversification, a provider of high quality employment
opportunities as well as a significant proportion of government revenues. Efforts to preserve the viability
of this sector have included the ongoing implementation of internationally agreed tax standards.
4.13 Economic restructuring will be necessary to reduce reliance on the traditional productive and
export sectors and to improve economic competitiveness. Modernising Caribbean economies becomes
imperative in order to accelerate economic growth and to improve resilience to economic shock within
the Region. This can be achieved through economic diversification; creation of new productive sectors;
innovations in education and training; modernising economic infrastructure; fostering access to credit to
enhance the contribution of small and medium-sized enterprises to the overall economic growth in the
Region and being more flexible in responding to the changing economic environment.
STRATEGIC PLAN 2010-2014
-18-
Fiscal and Debt Sustainability
4.14 In most Caribbean economies, counter-cyclical fiscal policy has been pursued with the aim of
stimulating output and buoying aggregate demand. The protection of past social gains, as well as a strong
desire to build resilience to external shocks and to curb poverty has been central to this public policy
position. This notwithstanding, the policy stance has led to a significant deterioration in fiscal accounts
throughout the Region. Inefficiencies in governments‟ operations and the tax structure have also
restricted revenue growth.
4.15 Recent reduced intake of government revenues combined with larger outlays on expenditures has
given rise to larger deficits, and debt accumulation has been particularly rapid in many of CDB‟s BMCs.
These developments in the fiscal accounts point to declining and unsustainable debt dynamics. The
capacity to pursue counter-cyclical policies in response to the global economic crisis is strongly
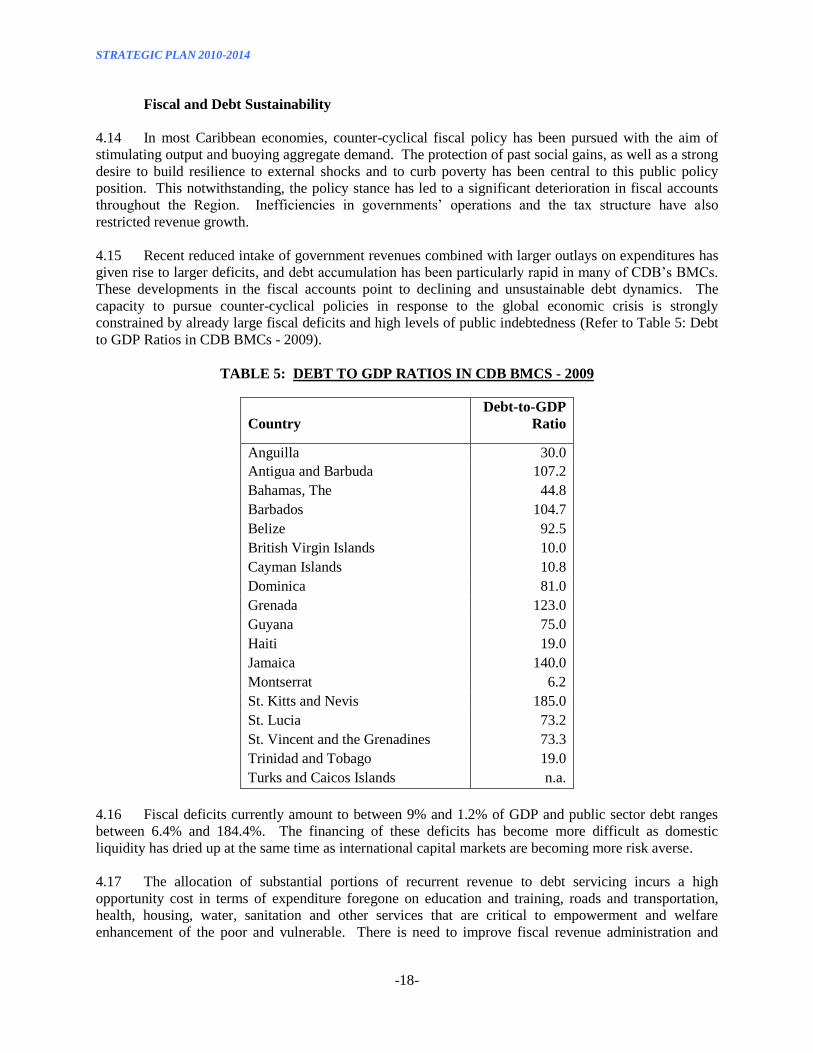
constrained by already large fiscal deficits and high levels of public indebtedness (Refer to Table 5: Debt
to GDP Ratios in CDB BMCs - 2009).
TABLE 5: DEBT TO GDP RATIOS IN CDB BMCS - 2009
Country
Debt-to-GDP
Ratio
Anguilla 30.0
Antigua and Barbuda 107.2
Bahamas, The 44.8
Barbados 104.7
Belize 92.5
British Virgin Islands 10.0
Cayman Islands 10.8
Dominica 81.0
Grenada 123.0
Guyana 75.0
Haiti 19.0
Jamaica 140.0
Montserrat 6.2
St. Kitts and Nevis 185.0
St. Lucia 73.2
St. Vincent and the Grenadines 73.3
Trinidad and Tobago 19.0
Turks and Caicos Islands n.a.
4.16 Fiscal deficits currently amount to between 9% and 1.2% of GDP and public sector debt ranges
between 6.4% and 184.4%. The financing of these deficits has become more difficult as domestic
liquidity has dried up at the same time as international capital markets are becoming more risk averse.
4.17 The allocation of substantial portions of recurrent revenue to debt servicing incurs a high
opportunity cost in terms of expenditure foregone on education and training, roads and transportation,
health, housing, water, sanitation and other services that are critical to empowerment and welfare
enhancement of the poor and vulnerable. There is need to improve fiscal revenue administration and
STRATEGIC PLAN 2010-2014
-19-
more carefully managed public expenditures and public debt. This requires investment in new and
improved systems, public sector education and training, and improved policies.
4.18 This suggests a set of policy priorities for BMC governments if they are to reduce their debt-to-
GDP ratios. First, generating sufficiently high primary balances will, in turn, require a combination of
factors. On the expenditure side, governments will have to contain expenditures. However, in containing
expenditures, efforts will have to be made to ensure that these expenditures generate optimal returns in
relation to GDP growth. On the revenue side, revenue systems will need to be fine-tuned in relation to
the main pillars of a good tax system: equity, economic efficiency, revenue sufficiency and simplicity.
Abiding by these tenets will help to optimise revenue while facilitating GDP growth. The achievement of
these objectives suggests the need to continue to reform expenditure-management and revenue systems.
4.19 Second, maximising the difference between nominal GDP growth and the nominal effective
interest rate on debt suggests a need to strengthen debt management systems. While the implementation
of a sound policy framework will influence the level of growth positively, debt management systems have
to be strong, specifically aiming at minimising the average effective interest rate on debt. Achieving that
outcome will require maximising the use of concessionary sources of finance, in addition to the efficient
use of commercial markets as necessary.
4.20 Third, for those countries with variable exchange rates in relation to the United States dollar,
exchange rate stability will be critical. The depreciation of the exchange rate has the potential to increase
the debt-to-GDP ratio by increasing the domestic currency value of the stock of debt, and the average
effective interest rate. Therefore, the maintenance exchange rate stability will be important to the
maintenance of debt sustainability.
4.21 CDB has a pivotal role to play in facilitating the implementation of policies that will lead to the
achievement and maintenance of sustainable levels of debt, including in collaboration with development
partners such as the WB and CARTAC. Part of this role relates to supporting the implementation of
reforms aimed at improving the systems through which in-country social and economic policies are
developed, implemented and evaluated. One aspect of this support is the provision of TA in developing
these reforms. Such TA would help to improve the efficiency of expenditure management systems and
revenue systems, leading to high returns on expenditure, and the progression towards optimal revenue
systems, both of which will optimise GDP growth. Furthermore, the PBL provides an effective platform
through which these reform programmes are being supported, and such support needs to be intensified.
4.22 In addition to providing support for reforms, PBLs constitute a source of development finance
that allows BMCs to benefit from the ability of CDB to mobilise resources from global capital markets at
rates below those which BMCs could access these markets on their own. By providing a low-cost source
of finance, PBLs help to contain the average effective interest rate on debt.
4.23 Furthermore, CDB must continue to provide support for priority projects with high returns in
relation to development results generally, but GDP growth specifically. Financing such projects would
supplement the impact of TAs and PBLs in supporting broad improvements in development results.
However, the pace of economic growth will not be quickened unless the debt burden is substantially
reduced and fiscal space created for supporting new and sustainable economic activity.
Environmental Sustainability, Climate Change and Natural Disasters
4.24 The Bank‟s BMCs have made progress with respect to the basic targets and indicators of Goal 7
“Environmental Sustainability” of the Millennium Development Goals (MDGs), in areas such as
coverage of the population with access to improved water and sanitation and the coverage of areas given
protected status. However, much remains to be done with respect to the effective and sustainable
STRATEGIC PLAN 2010-2014
-20-
management of these resources and the fundamental inter-linkages between poverty and environmental
degradation. High rates of soil erosion, degradation of watersheds, and loss of habitats of both precious
terrestrial and marine resources are significant environmental and natural resource management issues.
4.25 Another of the major vulnerabilities in the Caribbean is the exposure to natural disasters, which
are frequent and often devastating. They include hurricanes, floods, landslides, volcanic activity and
earthquakes. Several countries often suffer more than one such event annually and the economic effects
can last for many years. The replacement costs of infrastructure, crops and other assets are very high,
even without the inclusion of the economic output foregone, and are one of the major economic burdens
of these economies.
4.26 The Caribbean states belong to that group of countries that are most vulnerable to climate change,
i.e. small island states. The mechanisms by which climate change can affect economic development are
varied. By causing sea level rise, climate change can cause the loss of land for cultivation and residential
settlement. In economies where tourism is an important sector, loss of beaches and coastal land can result
in contraction of demand and significant loss of incomes. Marine resources can be depleted through sea
level rise which destroys inland species as well as by ocean acidification and rising ocean temperatures.
Agricultural productivity and output could be adversely affected by climate-induced outbreaks of pests
and diseases, by loss of essential species, by floods and droughts and by depleted natural water systems.
Climate change could also raise the costs of physical infrastructure services such as sea defences, the
provision of water, and necessitate higher outlays on health services.
4.27 Predictions are that the combined effects of all these factors – environmental, climate change and
natural hazards – are likely to be made worse by global warming and that the frequency and intensity of
natural disasters are likely to increase. In these circumstances, investment in DRR and DRM,
environmental protection and climate change adaptation and mitigation is an essential part of the
development agenda of BMCs.
Regional Cooperation and Integration
4.28 The small size of Caribbean economies means that RCI are important components of the
measures needed to address their development challenges. However, delays in fully implementing the
Single Market and Economy constrain the realisation of the fuller benefits of economic integration,
particularly in the face of stronger international competition and the need to create the larger market space
which would permit the development of internationally competitive regional business entities.
4.29 In the meantime, the smaller sub-region grouping of the OECS has advanced the target date for
the establishment of an Economic Union and a Single Financial and Economic Space among themselves
to June 2010. The formation of this Economic Union is consistent with the objectives of the CARICOM
Single Market and Economy (CSME) and is expected to have a positive impact on the wider CARICOM
arrangement.
4.30 The challenge remaining for the Region is to accelerate the pace of implementation of the CSME
project in order to support the goal of more rapid and sustainable growth rates in all of the countries and a
more equitable distribution of these benefits among the participating countries and their citizens. This
would entail strengthening the administrative capacities of both BMCs and CARICOM institutions in
areas such as legal drafting, and policy development on issues such as monetary and fiscal coordination.
STRATEGIC PLAN 2010-2014
-21-
Gender Equality
4.31 The evidence shows that gender inequality contributes to losses in economic efficiency and
effectiveness and adversely affects both women and men. There is a strong link between poverty and
gender. CPAs for most BMCs show that female-headed households constitute a large percentage of the
most vulnerable and deprived households in the Region. The Bank recognises that success in reducing
poverty and achieving improved living standards is closely linked to improving the role and status of
women and men in the communities and promoting their fullest participation in the social and economic
life.
4.32 The goal of reducing poverty in the Region cannot be effectively addressed unless consideration
of gender equality issues is integrated into poverty reduction initiatives. Such consideration would be
equally important in the design of interventions to improve access to educational opportunities and to
enhance other areas of human resource development such as health and housing. Although, it is accepted
that advancing these aspects of development cannot be pursued solely through specific project
interventions.
STRATEGIC PLAN 2010-2014
-22-
5. THE STRATEGY
5.01 Since vulnerability implies risk, BMCs face the possibility of frequent reversals in their efforts to
achieve sustainable economic and social development, if they do not develop or gain access to
mechanisms for mitigating the economic, environmental and climate change risks to which they are
exposed. BMCs must adopt measures to build sufficient resilience in order to cope with these inherent
vulnerabilities.
5.02 They can minimise the impact of economic risks by pursuing prudent and realistic fiscal and
economic policies which allow them to create surpluses upon which they can call when they are impacted
by adverse economic and financial shocks. They can also promote environmental sustainability by
investing in social and economic infrastructure to support sustainable management of their natural
resources and improve the living conditions of the poor.
5.03 There are many measures that could strengthen the resilience of BMCs. These include:
accelerating and sustaining economic growth; reducing poverty and inequality; improving fiscal and debt
sustainability; promoting environmental sustainability and disaster risk management; mitigating and
adapting to natural hazards and climate change; supporting RCI, and promoting gender equality.
Achieving the degree of resilience required for sustainable economic growth depends on how well BMCs
manage these challenges.
Strategic Focus
5.04 In this regard, CDB‟s overarching goal during this planning period is to assist BMCs to reduce
poverty through sustainable economic growth and strengthening the resilience of BMCs to external
shocks. There is also a need to promote a balanced approach to improving the welfare of BMCs‟ citizens
and ensuring that growth is inclusive, explicitly focused on income and gender disparities and on other
inequities, and that it is environmentally sustainable. In addition, measures will be adopted towards
improving internal capacities and efficiencies for the delivery of Bank services and enhancing
development effectiveness.
5.05 To achieve its overarching goal, the Bank over the next five years will focus on the strategic
objectives of:
(a) promoting broad-based economic growth and inclusive social development;
(b) supporting environmental sustainability and DRM;
(c) promoting good governance;
(d) fostering RCI; and
(e) enhancing organisational efficiency and effectiveness.
5.06 The Bank will also treat gender equality as a theme cutting across all sector interventions, i.e. a
cross-cutting theme, for the purpose of broadening the poverty impact of its interventions.
5.07 The Bank‟s hierarchy of objectives, priorities and cross-cutting theme is set out in Figure 3, and
provides a casual link between its priorities and the overarching goal of assisting BMCs to reduce
poverty.
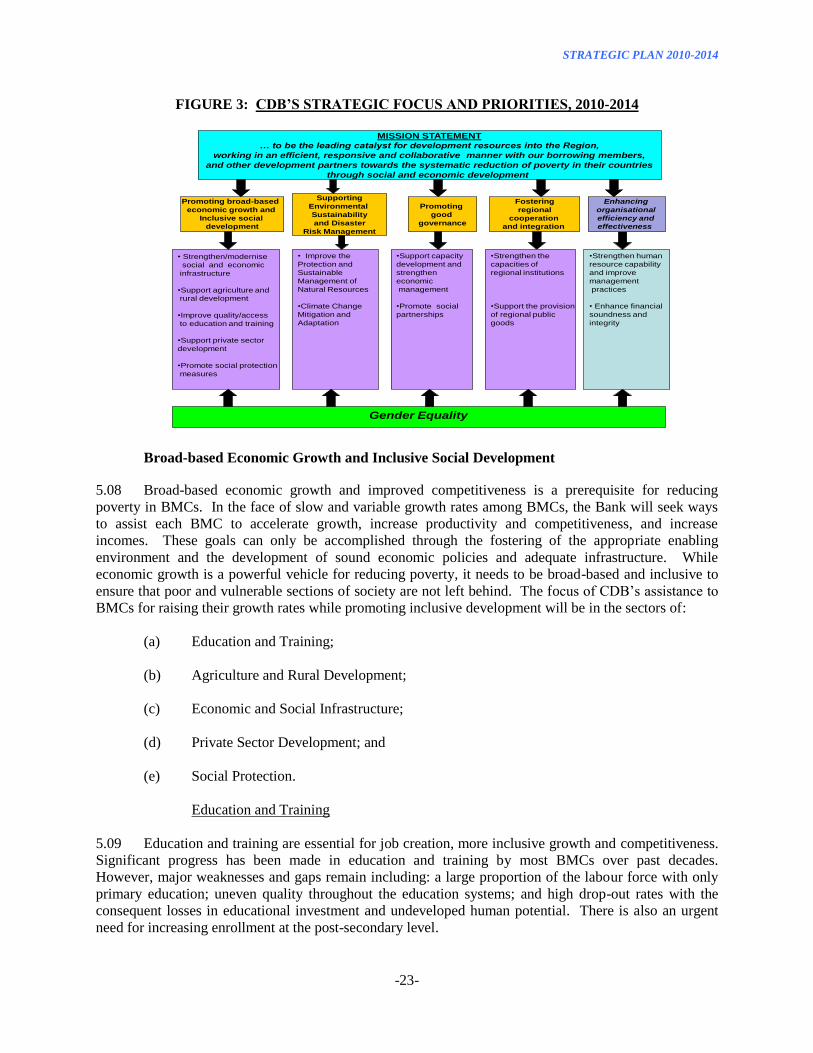
STRATEGIC PLAN 2010-2014
-23-
FIGURE 3: CDB’S STRATEGIC FOCUS AND PRIORITIES, 2010-2014
Broad-based Economic Growth and Inclusive Social Development
5.08 Broad-based economic growth and improved competitiveness is a prerequisite for reducing
poverty in BMCs. In the face of slow and variable growth rates among BMCs, the Bank will seek ways
to assist each BMC to accelerate growth, increase productivity and competitiveness, and increase
incomes. These goals can only be accomplished through the fostering of the appropriate enabling
environment and the development of sound economic policies and adequate infrastructure. While
economic growth is a powerful vehicle for reducing poverty, it needs to be broad-based and inclusive to
ensure that poor and vulnerable sections of society are not left behind. The focus of CDB‟s assistance to
BMCs for raising their growth rates while promoting inclusive development will be in the sectors of:
(a) Education and Training;
(b) Agriculture and Rural Development;
(c) Economic and Social Infrastructure;
(d) Private Sector Development; and
(e) Social Protection.
Education and Training
5.09 Education and training are essential for job creation, more inclusive growth and competitiveness.
Significant progress has been made in education and training by most BMCs over past decades.
However, major weaknesses and gaps remain including: a large proportion of the labour force with only
primary education; uneven quality throughout the education systems; and high drop-out rates with the
consequent losses in educational investment and undeveloped human potential. There is also an urgent
need for increasing enrollment at the post-secondary level.
Promoting broad-based
economic growth and
Inclusive social
development
Supporting
Environmental
Sustainability
and Disaster
Risk Management
Promoting
good
governance
Fostering
regional
cooperation
and integration
Gender Equality
MISSION STATEMENT
… to be the leading catalyst for development resources into the Region,
working in an efficient, responsive and collaborative manner with our borrowing members,
and other development partners towards the systematic reduction of poverty in their countries
through social and economic development
• Strengthen/modernise
social and economic
infrastructure
•Support agriculture and
rural development
•Improve quality/access
to education and training
•Support private sector
development
•Promote social protection
measures
• Improve the
Protection and
Sustainable
Management of
Natural Resources
•Climate Change
Mitigation and
Adaptation
•Support capacity
development and
strengthen
economic
management
•Promote social
partnerships
•Strengthen human
resource capability
and improve
management
practices
• Enhance financial
soundness and
integrity
•Strengthen the
capacities of
regional institutions
•Support the provision
of regional public
goods
Enhancing
organisational
efficiency and
effectiveness
STRATEGIC PLAN 2010-2014
-24-
5.10 CDB views education as a critical enabler of socio-economic development and for lifting large
numbers of citizens out of poverty. Its interventions in education and training will be focused on:
(a) increasing and broadening equitable access and participation in education and training;
(b) improving efficiency and effectiveness through curriculum reform and performance-
based assessment; and
(c) strengthening institutional capacity, enhancing technological capability and promoting
strategic approaches to planning and project design.
Agriculture and Rural Development
5.11 In general, major performance indicators continue to show a declining trend in the performance
of the agriculture sector in CDB‟s BMCs, as the sector continues to be impacted by:
(a) increases in the cost of production inputs;
(b) trade liberalisation including the continued erosion of preferential market access and the
loss of market share to more competitive suppliers; and
(c) the effects of weather-related shocks.
5.12 Notwithstanding, the sector still accounts for a significant percentage of exports and employment
in many BMCs, particularly in rural areas. In some BMCs, it is estimated that agricultural goods account
for as much as 50% of visible exports, and the sector employs up to 18% of the labour force. If the
Region is to achieve the MDGs and targets related to poverty reduction, it is essential that the
performance of this sector in the Caribbean is improved.
5.13 Towards this end, CDB will support its BMCs in: (a) upgrading agriculture production and
marketing infrastructure and services; and (b) strengthening agriculture and rural credit systems and
community enterprise development. In addition, CDB will expand its involvement in the sector, through
strategic linkages with regional and international agriculture research and support institutions. Efforts
will be focused on development, and training of farmers and industry stakeholders in modern production
technologies. Interventions will be geared towards improving yield potential, produce quality and
reliability of supply.
Economic and Social Infrastructure
5.14 Two factors regarding infrastructure in the development process are well documented:
(a) There is a strong positive relationship between infrastructure and economic growth,
poverty reduction and environmental sustainability; and
(b) Public investment in infrastructure is a necessary requirement for capital formation in the
private sector.
5.15 It is clear that if BMCs‟ economies are to continue to grow, the increasing demand for
infrastructure services, and the substantial investment involved, will have to be met. The significant debt
sustainability challenge facing many of the countries will limit their ability to finance improved
infrastructure services making the role of the Bank a critical element for progress in this area.
STRATEGIC PLAN 2010-2014
-25-
5.16 The policy and institutional environment also impacts on the quality of infrastructure services.
While there is considerable differential in the appropriateness of this environment among BMCs (at least
at the sub-sector level), an important ingredient for improved infrastructure services is improvement in
the policies and institutions that operate in the sub-sectors. The Bank will expand the resources directed
at improving the institutional capacity of BMCs to design and implement social and economic
infrastructure programmes and projects.
Private Sector Development
5.17 Development of a vibrant private sector is an essential component of long-term sustainable
economic growth and for private enterprises to play a key role in combating poverty. CDB‟s strategic
objective for private sector development in BMCs is to improve the global competitiveness of their
productive sectors on a sustainable basis.
5.18 CDB‟s approach to supporting private sector development in BMCs is outlined in its Private
Sector Policy and Strategy papers. Whilst the Policy Paper and Strategy are still conceived as being
relevant, it is widely held that the level of interventions over the past few years and degree of impact has
not been as significant as envisaged. In view of this, CDB will undertake a review of the implementation
of the Policy and Strategy, analyse the obstacles leading to under-achievement of set goals and most
importantly, consider recommendations in relation to the development and implementation of new
activities relating to the private sector.
Social Protection
5.19 CDB‟s interventions in the area of social protection have been principally undertaken within the
context of poverty reduction. Even though social protection is not an explicit area of intervention in its
BMCs, CDB‟s emphasis on capability enhancement, vulnerability reduction and good governance as
critical elements of its PRS are entirely consistent with a social protection framework.
5.20 The Bank is currently developing a Social Protection Policy and Strategy (SPPS) to assist BMCs
in safeguarding their development gains in the midst of structural change by addressing poverty and
vulnerability consistent with their growth and development objectives. The SPPS will support BMCs in:
(a) strengthening social protection by reducing the adverse impact of vulnerability on growth
and development;
(b) reducing vulnerability to natural hazards and improve mitigation;
(c) targeting, monitoring and evaluating social assistance programmes;
(d) strengthening evidence-based social protection;
(e) analysing, discussing and disseminating social data; and
(f) sustaining development partnerships for social protection financing.
5.21 Given that poverty is one of the important markers of vulnerability and the Bank‟s mission is
ultimately towards poverty reduction in its BMCs, this approach is entirely consistent with this social
protection framework. Ultimately, CDB will support BMCs in locating and developing social protection
as an integral part of their development strategies as it seeks to maximise its contribution to social and
economic development.
STRATEGIC PLAN 2010-2014
-26-
Environmental Sustainability and Disaster Management
5.22 The Bank will give high priority to environmental sustainability and climate change issues and to
assisting BMCs to address MDG 7 – Environmental Sustainability. The focus of the Bank‟s strategy in
this area will be to assist BMCs to design and implement interventions that:
(a) reduce BMCs‟ vulnerability to natural hazards and improve resilience, and strengthen the
capacities of regional and national institutions for improved environmental and natural
resource management;
(b) widen the options for sustaining the livelihoods of the poor and vulnerable through
improved protection and sustainable management of natural resources; and
(c) improve coverage of the population with access to improved water and sanitation
services, and to reduce pollution and improve the health and productivity of the poor.
Climate Change
5.23 Ignoring climate change will significantly contribute to retarding economic growth. Therefore,
assisting BMCs to develop and implement mitigation and adaptation measures is a pro-growth strategy
for the longer term. CDB‟s ongoing efforts to strengthen environmental sustainability, promote sound
development practices and mainstream DRM in its internal operations, as well as within BMCs, already
contribute to climate change adaptation.
5.24 The Bank‟s approach to supporting a climate change agenda for BMCs will be focused on:
(a) due diligence in the Bank‟s internal operations; and
(b) support for climate risk management in BMCs.
5.25 The objective of due diligence in internal operations will be pursued by:
(a) incorporating climate risk management into the existing loan and investment portfolio;
(b) ensuring that procedures and guidelines for new projects include climate risk
management;
(c) including climate risk management in CDB‟s analytical frameworks for strategic
planning, PRSs, CAS papers and sector policies and strategies; and
(d) developing internal capacity within CDB to take on board climate change risk
management, prepare and use climate risks tools, and develop external partnerships and
networks.
STRATEGIC PLAN 2010-2014
-27-
5.26 Support for climate risk management in BMCs will involve initiatives in four areas:
(a) renewable energy and energy efficiency;
(b) building community resilience to climate change;
(c) financial support for adaptation; and
(d) research and partnerships.
5.27 Earliest attention will be focused on developing a Climate Change Management Strategy that will
guide the Bank‟s operations, and assess current lending operations to identify opportunities for the
inclusion of climate risk management.
Good Governance
5.28 CDB‟s good governance and institutional development strategy addresses good governance in
relation to poverty reduction, private sector development, strategic repositioning of Caribbean economies,
and sets a framework for CDB‟s support in selected areas, including:
(a) public sector modernisation (improving effectiveness, accountability and transparency,
human resource development and knowledge management);
(b) building capacity for strategic policy management and coordination (integrated policy
frameworks, revenue/expenditure management, and implementation capacity);
(c) social partnership and participation;
(d) law, justice and security (legal and regulatory frameworks, judicial systems, security for
citizens‟ rights and property, and corporate governance); and
(e) regional cooperation and governance.
5.29 Capacity limitations in BMCs especially in the areas of economic management, legislative and
regulatory frameworks, and capacity development are major weaknesses and impediments to the planning
and implementation of development programmes and projects. CDB‟s TA programme will be the
principal means for providing resources to BMCs for institutional strengthening and capacity
development. It is recognised, however, that the Bank would need to be selective in these areas based on
its core competencies and ability to achieve results. A major review of CDB‟s TA modalities and
methods will be undertaken in order to develop a more strategic approach to the selection of TA
interventions.
Regional Cooperation and Integration
5.30 Supporting RCI is a key objective for the Bank and one of its charter mandates. A framework for
defining the Bank‟s role in this process and criteria for selecting interventions in support of RCI has been
established. The core priority for promoting RCI will be support for regional public goods (RPGs)
including transnational public goods, and national or sub-regional public goods.
STRATEGIC PLAN 2010-2014
-28-
5.31 Criteria for selecting interventions will include urgency, development impact, transnational
externalities, building block effect, transferability of practice, gaps in DPs‟ programmes, and potential for
follow-up investment.
5.32 Priorities will also be influenced by other considerations, including:
(a) the level of resources available, including the possibility of leveraging the Bank‟s such
resources with those of DPs;
(b) CDB‟s role as leader or supporter in promoting RCI;
(c) opportunities for outsourcing to supplement internal Bank capacities;
(d) the possibility of linking TA to investment lending;
(e) the feasibility of shifting to activity-driven, priority-based support for RCI;
(f) the need to rationalise and strengthen the financing of regional institutions; and
(g) the importance of innovative legal regimes for doing business in a single economy.
5.33 The operating framework in relation to RCI will also include the establishment of a focal point
within the Bank to develop and coordinate a programme under this theme recognising that this will
require a reliance not only on expertise within the Bank, but also on outsourcing to other institutions,
research centers, consulting firms and individual consultants. This focal point will also be critical for
identifying and promoting the required support measures for assisting the economic integration process
both in the OECS sub-region and the wider CARICOM levels.
Enhancing Organisational Efficiency and Effectiveness
5.34 CDB recognises that implementation of its strategic objectives, priorities and operational
programmes will require continuous review of the way it does business, and that critical to the success of
all reform initiatives will be a focus on the key drivers of efficiency and effectiveness, i.e. people,
processes and technology.
Institutional Reform
5.35 The process of institutional reform at CDB has been designed to improve the overall effectiveness
of the Bank as it seeks to achieve its mission of reducing poverty, as well as being the leading catalyst for
mobilising resources into BMCs. In addition, the reform measures contribute substantially towards
ensuring that CDB can implement an expanded programme in the context of recently replenished
concessional resources, initiatives set in the Strategic Plan, and projections for expanding the available
ordinary capital base. The institutional reform agenda includes a number of measures for enhancing
institutional capacity and development effectiveness:
(a) re-alignment of the organisational structure, business processes and human resources in
order to respond in a more timely and relevant manner to client requests;
(b) promoting a shift towards greater client and country-focus in operations;
STRATEGIC PLAN 2010-2014
-29-
(c) promoting greater use of information and communication technologies to drive internal
efficiency; and
(d) promoting a learning organisation and improving internal learning processes and
systematically apply lessons of experience to plan and manage programmes.
5.36 Just as importantly, in order to maintain its relevance and to remain responsive to the needs of its
clients, the Bank will continue to undertake capability-enhancing initiatives targeted at its human resource
management system, financial risk management framework, the expansion of product and service
offerings, membership expansion, and improving results reporting and the culture of results within the
institution.
Human Resources
5.37 In a drive to improve its internal efficiency, CDB has been systematically re-engineering its
business processes. This undertaking has been enabled by the introduction of new technologies which are
improving management reporting and reducing the complement of staffing required for delivering its
services to internal and external customers. As a consequence, between 2008 and 2009, several staff
positions have been eliminated and the departments affected have been re-organised. This process of
internal improvement will continue over the planning horizon, with the introduction of more cost-saving
technologies and the elimination of surplus jobs.
5.38 Simultaneously with the redundancies, the Bank has been recruiting new staff to replace retirees
and to fill positions requiring new skills. As the external environment changes and new mandates and
demands for new products emerge, it will be necessary to continuously examine the adequacy of the
number of staff deployed but also the suitability of the mix in relation to the needs of the institution.
5.39 It is estimated that the establishment ratio of MPS:SS in 2010 and 2011 will be 1.34:1 compared
with 1.29:1 in 2009, reflecting the shift which has resulted from the re-engineering exercise. It is
expected that this trend ratio will continue over the medium-term. See Appendix 3 – Distribution of
Establishment and Non-Establishment Personnel - 2009–2011 for details.
Managing Quality
5.40 For CDB to continue the improvement of its development effectiveness, it must deliver a
consistently high quality of project design, appraisal and supervision, and promote a results culture within
the organisation. A diagnostic of the Bank‟s project cycle management standards and practices has been
completed and recommendations for the enhancement of quality assurance are currently being examined.
5.41 In this regard, the Bank will design and implement a programme of work aimed at:
(a) reinforcing CDB‟s development effectiveness mandate;
(b) improving the results orientation of country strategies, project profiles and appraisal
documents;
(c) introducing upgraded quality at entry and supervision standards;
(d) restructuring the Project Performance Monitoring System; and
(e) improving support for embedding MfDR within the organisation and in BMCs.
STRATEGIC PLAN 2010-2014
-30-
Learning Organisation
5.42 CDB recognises its key strategic asset as being its people and the knowledge capital they possess.
Knowledge capital is critical to the Bank‟s development effectiveness. This capital is the combination of
institutional knowledge derived from the relationship between the Bank and its BMCs and DPs, as well as
local knowledge derived from the informal bonds between CDB staff and BMC political directorates,
senior public and corporate officials.
5.43 The Bank has accepted the challenge of improving its institutional capabilities and capacities to
produce and to manage this knowledge capital. It will retain consultants to assist in the development of a
Knowledge Management Strategy and Implementation Plan. The Strategy will support the development
of the Bank as a learning organisation and provide for knowledge creation, sharing, capturing and
retention to sustain and enhance CDB‟s relevance and overall performance.
5.44 EOV (2003) has begun to create a stronger learning culture within the Bank. Increasing emphasis
has been given to the strategic role of the evaluation function in terms of the effort to measure the
effectiveness of CDB‟s interventions and to promote learning and accountability which will assist in
planning and managing future initiatives.
5.45 During the strategic planning period, the system of independent evaluation will be strengthened in
order to increase its contribution to the quality of the Bank‟s policies and operations by providing
evidence of their relevance, efficiency and effectiveness, as well as their sustainability and long-term
impact. The Bank will increase the volume and quality of its self and independent evaluations, strengthen
mechanisms to absorb evaluation lessons and recommendations internally, and communicate lessons
more effectively to the Banks‟ stakeholders and partners. The Bank will support a policy of disclosure of
evaluation results for public education and institutional accountability. To this end, the Bank will, within
this period, develop a policy and strategy on the disclosure and sharing of information with stakeholders
and the public.
5.46 The Bank has also prioritised sector/thematic studies as a basis for conducting policy dialogue
with its various BMCs. The first of these studies on Growth and Development in the Caribbean is
scheduled for completion in 2009. Other such studies will be undertaken and published on an annual
basis in collaboration with other research entities.
Cross-cutting Theme – Gender Equality
5.47 It is widely accepted that gender inequality contributes to losses in economic efficiency and
effectiveness and affects both women and men adversely. Measures which support increased gender
equality lead to economic growth and poverty reduction. This link to poverty reduction has motivated the
Bank to urgently address issues of gender inequality in order to enhance the capability and reduce the
vulnerability of the poor. Hence, the Bank will treat gender equality as a theme cutting across all sector
interventions, i.e. a cross-cutting theme for the purpose of broadening the poverty impact of its
interventions.
5.48 The Bank is committed to becoming a leading catalyst for promoting gender equality in the
Region by working with borrowing members and other DPs in a responsive and collaborative manner to
analyse and address the economic and social causes of gender inequality, and to assist all women and men
to achieve their full potential.
5.49 In 2008, the Bank approved a Gender Policy and Operational Strategy document to guide the
process of:
STRATEGIC PLAN 2010-2014
-31-
(a) reducing economic and social vulnerability by empowering women and men to build and
protect their assets, including livelihoods and savings, as a means of building sustainable,
equitable communities;
(b) strengthening the capacity of all women and men, girls and boys, to acquire education,
skills, and self-confidence in order to access economic opportunities, increase livelihood
options and improve their quality of life in the changing global economy; and
(c) supporting governance processes in which women and men have equal access to power
and authority in society, and effectively influence policies and advocate for their rights.
5.50 Key components of the Gender Equality Operational Strategy are devoted to:
(a) building commitment/support for gender equality;
(b) allocating resources to achieve gender equality results;
(c) developing capacity and skills for CDB staff and stakeholders; and
(d) monitoring the implementation of the Operational Strategy.
5.51 Guided by the action plan and implementation framework outlined in its gender policy and
strategy, the Bank will intensify its mainstreaming of gender issues into the full range of its operational
work, including the design of programmes and projects for greater responsiveness to the development
needs of BMCs. The Bank will work with other DPs on gender research and specific areas of
programming as well as adopt global best practices and approaches in order to more fully embed gender
issues across the institution and in BMCs.
5.52 The Bank is also committed to promoting gender equality as a means to increasing organisational
efficiency and effectiveness by ensuring that internal operations and decision-making reflect the fair and
equitable treatment of women and men. To this end, the Bank will develop a policy document to guide its
approach to gender issues within the institution.
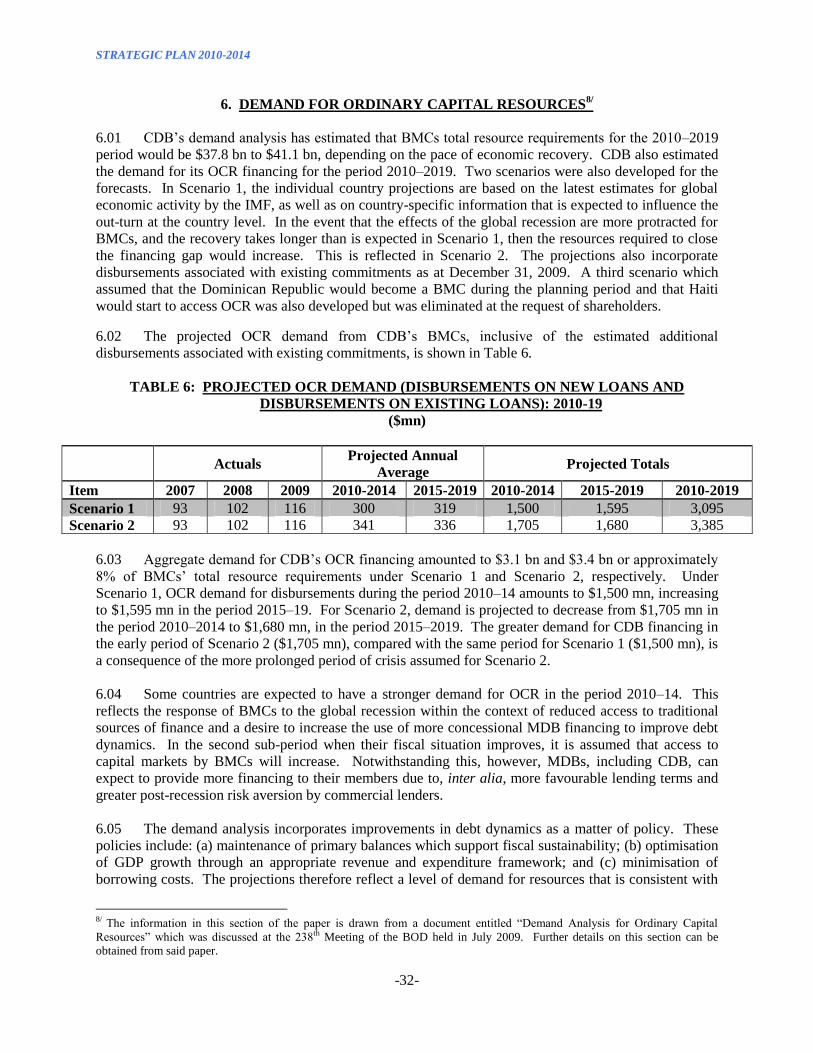
STRATEGIC PLAN 2010-2014
-32-
6. DEMAND FOR ORDINARY CAPITAL RESOURCES8/
6.01 CDB‟s demand analysis has estimated that BMCs total resource requirements for the 2010–2019
period would be $37.8 bn to $41.1 bn, depending on the pace of economic recovery. CDB also estimated
the demand for its OCR financing for the period 2010–2019. Two scenarios were also developed for the
forecasts. In Scenario 1, the individual country projections are based on the latest estimates for global
economic activity by the IMF, as well as on country-specific information that is expected to influence the
out-turn at the country level. In the event that the effects of the global recession are more protracted for
BMCs, and the recovery takes longer than is expected in Scenario 1, then the resources required to close
the financing gap would increase. This is reflected in Scenario 2. The projections also incorporate
disbursements associated with existing commitments as at December 31, 2009. A third scenario which
assumed that the Dominican Republic would become a BMC during the planning period and that Haiti
would start to access OCR was also developed but was eliminated at the request of shareholders.
6.02 The projected OCR demand from CDB‟s BMCs, inclusive of the estimated additional
disbursements associated with existing commitments, is shown in Table 6.
TABLE 6: PROJECTED OCR DEMAND (DISBURSEMENTS ON NEW LOANS AND
DISBURSEMENTS ON EXISTING LOANS): 2010-19
($mn)
Actuals Projected Annual
Average Projected Totals
Item 2007 2008 2009 2010-2014 2015-2019 2010-2014 2015-2019 2010-2019
Scenario 1 93 102 116 300 319 1,500 1,595 3,095
Scenario 2 93 102 116 341 336 1,705 1,680 3,385
6.03 Aggregate demand for CDB‟s OCR financing amounted to $3.1 bn and $3.4 bn or approximately
8% of BMCs‟ total resource requirements under Scenario 1 and Scenario 2, respectively. Under
Scenario 1, OCR demand for disbursements during the period 2010–14 amounts to $1,500 mn, increasing
to $1,595 mn in the period 2015–19. For Scenario 2, demand is projected to decrease from $1,705 mn in
the period 2010–2014 to $1,680 mn, in the period 2015–2019. The greater demand for CDB financing in
the early period of Scenario 2 ($1,705 mn), compared with the same period for Scenario 1 ($1,500 mn), is
a consequence of the more prolonged period of crisis assumed for Scenario 2.
6.04 Some countries are expected to have a stronger demand for OCR in the period 2010–14. This
reflects the response of BMCs to the global recession within the context of reduced access to traditional
sources of finance and a desire to increase the use of more concessional MDB financing to improve debt
dynamics. In the second sub-period when their fiscal situation improves, it is assumed that access to
capital markets by BMCs will increase. Notwithstanding this, however, MDBs, including CDB, can
expect to provide more financing to their members due to, inter alia, more favourable lending terms and
greater post-recession risk aversion by commercial lenders.
6.05 The demand analysis incorporates improvements in debt dynamics as a matter of policy. These
policies include: (a) maintenance of primary balances which support fiscal sustainability; (b) optimisation
of GDP growth through an appropriate revenue and expenditure framework; and (c) minimisation of
borrowing costs. The projections therefore reflect a level of demand for resources that is consistent with
8/ The information in this section of the paper is drawn from a document entitled “Demand Analysis for Ordinary Capital
Resources” which was discussed at the 238th Meeting of the BOD held in July 2009. Further details on this section can be
obtained from said paper.
STRATEGIC PLAN 2010-2014
-33-
fiscal sustainability. Within this framework of debt reduction and improved debt management, any fiscal
space created by the use of CDB resources is not expected to facilitate an increase in expenditure, but to
assist in the reduction of the debt-to-GDP-ratio.
6.06 CDB‟s approach to assisting BMCs involves broadly differentiated assistance strategies based on
each country‟s ease of access to other sources of financing and particularly their relationship with the
regional and international financial markets. The Bahamas, Barbados, Jamaica and Trinidad and Tobago
are emerging market economies with a track record of commercial borrowing, and are also members of
IDB and WB. Belize and the independent members of the Eastern Caribbean Currency Union have a
more recent history of heavy commercial borrowing, although Belize is also a member of the IDB.
Guyana has no commercial market access, and has greater access to concessional finance as a low-income
country. The UKOTs have commercial market access, within guidelines set by the UK Government.
6.07 The current restricted access to commercial market sources means that BMCs will, therefore,
need greater recourse to the financial resources of MDBs and other IFIs. Recent approaches to CDB for
additional commitments together with statements contained in recently published medium-term fiscal
strategies by some BMCs support the view that estimates of demand for OCR financing from CDB may
be understated.
STRATEGIC PLAN 2010-2014
-34-
7. RESOURCING THE STRATEGY
7.01 BMCs will require a significant amount of financial resources in order to pursue their
development objectives. Based on a study of the demand for OCR financial resources, it is estimated that
a need exists for OCR resources of between $3.1 bn and $3.4 bn in the period 2010-2019. These demand
estimates take full account of investment capital requirements being generated by programmes and plans
for economic restructuring, economic diversification, modernisation, environmental sustainability,
enhancement of social infrastructure and targeted poverty reduction; the surge in demand as a
consequence of external shocks associated with the global economic and financial crisis and the limited
fiscal capacity of BMCs; and the post-crisis behavior of governments which may need to sustain higher
levels of borrowing to return their economies to their pre-crisis growth trajectories.
7.02 The Strategic Plan envisages that CDB would continue to be a leading catalyst for development
resources into its BMCs and while the Bank does not plan to meet the full demand of its BMCs for OCR
resources, it would still need to expand its lending programme in order to even maintain the Bank‟s
current share of the overall resource requirement.
7.03 CDB operates with three principal limits on its capacity to respond to BMCs‟ demand for OCR
financing:
(a) Charter Limit on Operations – Article 14;
(b) Operating Guideline with respect to the Borrowing Limit; and
(c) The Capital Adequacy policy as defined by the “total equity to exposure ratio (TEER).”
Paper BD 12/10 Add.1 entitled “Proposals for a General Capital Increase” contains detailed definitions of
these limits and a discussion of their importance for the continuation and expansion of CDB‟s lending
operations throughout the period 2010–2019. The critical constraints to an expansion of CDB‟s lending
programme are its capital adequacy requirements and its ability to increase borrowings. Expanding these
limits requires appropriate increases in non-borrowing members‟ investment-grade callable capital and
adequate amounts of cash capital from all shareholders and from retained earnings.
7.04 As at December 31, 2009, CDB had long-term borrowings of $718 mn or 98% of the operating
limit on borrowings. The remaining borrowing headroom amounts to $15 mn. The Bank‟s current
borrowing headroom status does not allow it to respond to any requirement for additional liquidity and as
a consequence can also place its Triple „A‟ credit rating at risk until this situation is rectified. The
expansion of the Bank‟s lending operations is severely restricted until additional headroom is provided
through the input of cash capital, and callable capital from investment-grade non-borrowing members.
7.05 During earlier discussions, shareholders agreed to consider a GCI but were less enthusiastic about
the level of new capital input required for meeting the total resource requirement of $309 mn p.a. at
Scenario 1 based on concerns about affordability. As a consequence, the Bank‟s management has
evaluated a number of options that target lower levels of lending and Table 7 sets out a comparison of
these selected levels of lending and the estimates of OCR demand under both Scenarios 1 and 2. Some of
the principal assumptions used for calculating the financial projections are shown in Appendix 4 and
include assumptions about the level of transfers to be made from OCR income to SDF (U). It is proposed
that during the planning period, a rules-based model and approach for transferring resources from OCR to
SDF will be developed.
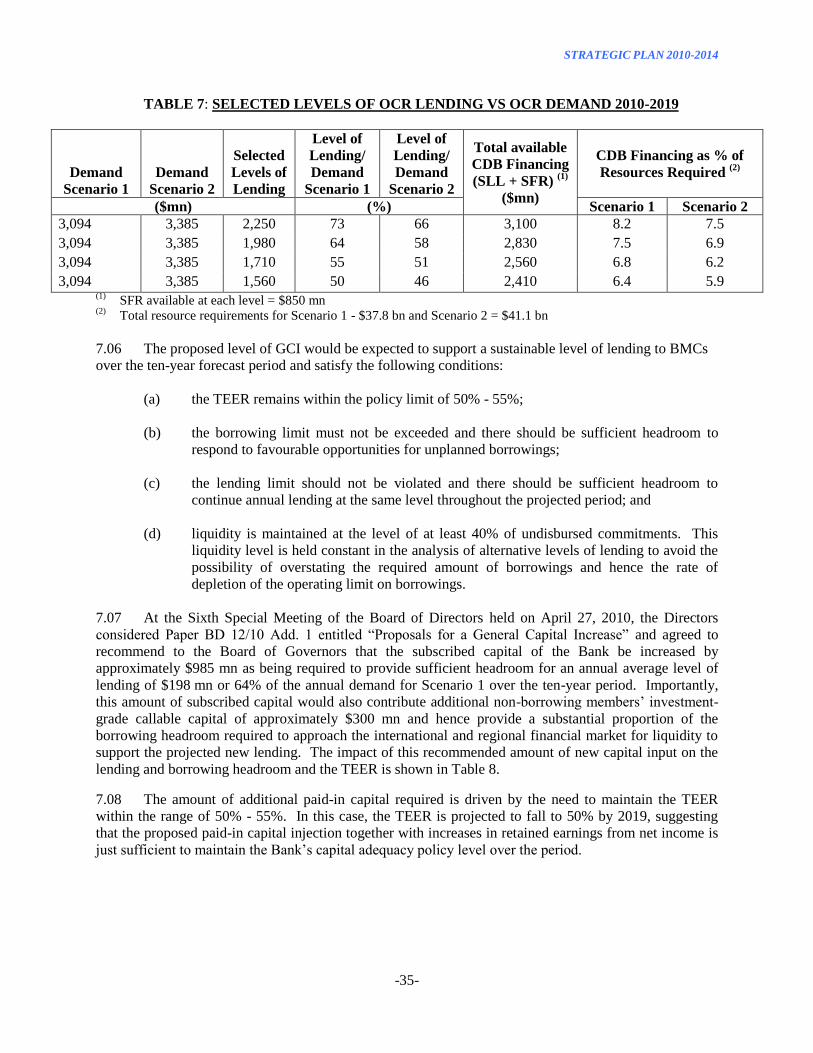
STRATEGIC PLAN 2010-2014
-35-
TABLE 7: SELECTED LEVELS OF OCR LENDING VS OCR DEMAND 2010-2019
Demand
Scenario 1
Demand
Scenario 2
Selected
Levels of
Lending
Level of
Lending/
Demand
Scenario 1
Level of
Lending/
Demand
Scenario 2
Total available
CDB Financing
(SLL + SFR) (1)
($mn)
CDB Financing as % of
Resources Required (2)
($mn) (%) Scenario 1 Scenario 2
3,094 3,385 2,250 73 66 3,100 8.2 7.5
3,094 3,385 1,980 64 58 2,830 7.5 6.9
3,094 3,385 1,710 55 51 2,560 6.8 6.2
3,094 3,385 1,560 50 46 2,410 6.4 5.9 (1)
SFR available at each level = $850 mn (2)
Total resource requirements for Scenario 1 - $37.8 bn and Scenario 2 = $41.1 bn
7.06 The proposed level of GCI would be expected to support a sustainable level of lending to BMCs
over the ten-year forecast period and satisfy the following conditions:
(a) the TEER remains within the policy limit of 50% - 55%;
(b) the borrowing limit must not be exceeded and there should be sufficient headroom to
respond to favourable opportunities for unplanned borrowings;
(c) the lending limit should not be violated and there should be sufficient headroom to
continue annual lending at the same level throughout the projected period; and
(d) liquidity is maintained at the level of at least 40% of undisbursed commitments. This
liquidity level is held constant in the analysis of alternative levels of lending to avoid the
possibility of overstating the required amount of borrowings and hence the rate of
depletion of the operating limit on borrowings.
7.07 At the Sixth Special Meeting of the Board of Directors held on April 27, 2010, the Directors
considered Paper BD 12/10 Add. 1 entitled “Proposals for a General Capital Increase” and agreed to
recommend to the Board of Governors that the subscribed capital of the Bank be increased by
approximately $985 mn as being required to provide sufficient headroom for an annual average level of
lending of $198 mn or 64% of the annual demand for Scenario 1 over the ten-year period. Importantly,
this amount of subscribed capital would also contribute additional non-borrowing members‟ investment-
grade callable capital of approximately $300 mn and hence provide a substantial proportion of the
borrowing headroom required to approach the international and regional financial market for liquidity to
support the projected new lending. The impact of this recommended amount of new capital input on the
lending and borrowing headroom and the TEER is shown in Table 8.
7.08 The amount of additional paid-in capital required is driven by the need to maintain the TEER
within the range of 50% - 55%. In this case, the TEER is projected to fall to 50% by 2019, suggesting
that the proposed paid-in capital injection together with increases in retained earnings from net income is
just sufficient to maintain the Bank‟s capital adequacy policy level over the period.
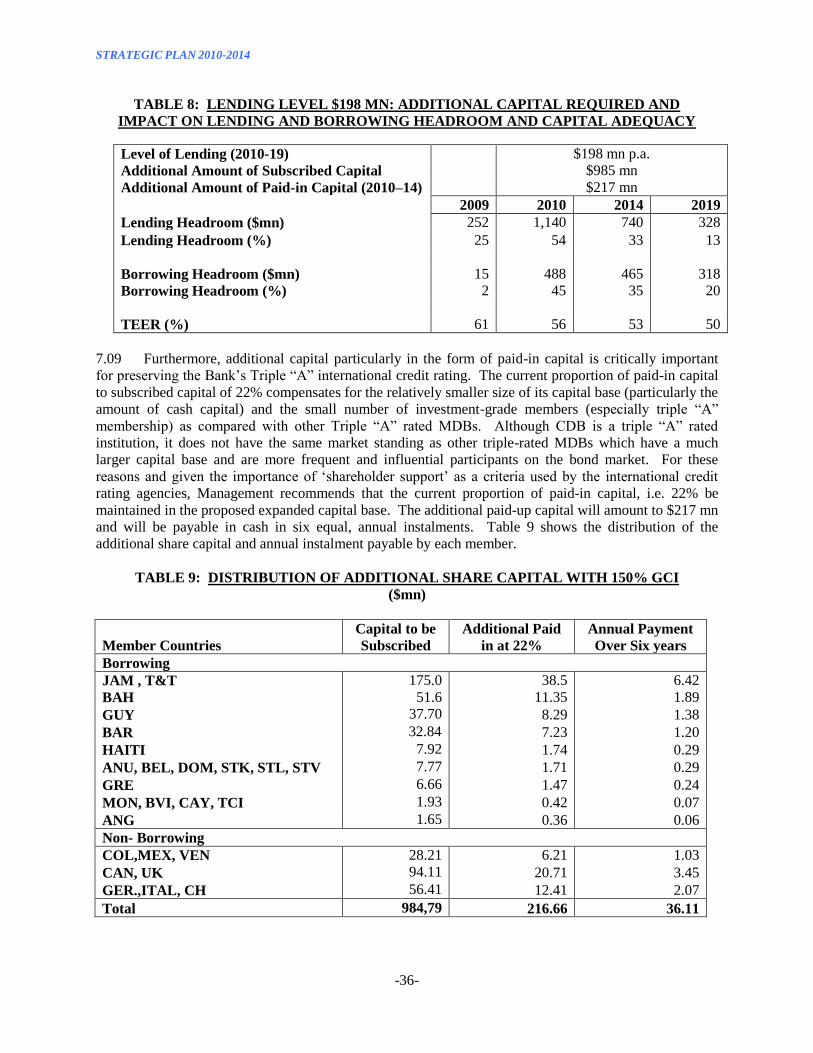
STRATEGIC PLAN 2010-2014
-36-
TABLE 8: LENDING LEVEL $198 MN: ADDITIONAL CAPITAL REQUIRED AND
IMPACT ON LENDING AND BORROWING HEADROOM AND CAPITAL ADEQUACY
Level of Lending (2010-19) $198 mn p.a.
Additional Amount of Subscribed Capital $985 mn
Additional Amount of Paid-in Capital (2010–14) $217 mn
2009 2010 2014 2019
Lending Headroom ($mn) 252 1,140 740 328
Lending Headroom (%) 25 54 33 13
Borrowing Headroom ($mn) 15 488 465 318
Borrowing Headroom (%) 2 45 35 20
TEER (%) 61 56 53 50
7.09 Furthermore, additional capital particularly in the form of paid-in capital is critically important
for preserving the Bank‟s Triple “A” international credit rating. The current proportion of paid-in capital
to subscribed capital of 22% compensates for the relatively smaller size of its capital base (particularly the
amount of cash capital) and the small number of investment-grade members (especially triple “A”
membership) as compared with other Triple “A” rated MDBs. Although CDB is a triple “A” rated
institution, it does not have the same market standing as other triple-rated MDBs which have a much
larger capital base and are more frequent and influential participants on the bond market. For these
reasons and given the importance of „shareholder support‟ as a criteria used by the international credit
rating agencies, Management recommends that the current proportion of paid-in capital, i.e. 22% be
maintained in the proposed expanded capital base. The additional paid-up capital will amount to $217 mn
and will be payable in cash in six equal, annual instalments. Table 9 shows the distribution of the
additional share capital and annual instalment payable by each member.
TABLE 9: DISTRIBUTION OF ADDITIONAL SHARE CAPITAL WITH 150% GCI
($mn)
Member Countries
Capital to be
Subscribed
Additional Paid
in at 22%
Annual Payment
Over Six years
Borrowing
JAM , T&T 175.0 38.5 6.42
BAH 51.6 11.35 1.89
GUY 37.70 8.29 1.38
BAR 32.84 7.23 1.20
HAITI 7.92 1.74 0.29
ANU, BEL, DOM, STK, STL, STV 7.77 1.71 0.29
GRE 6.66 1.47 0.24
MON, BVI, CAY, TCI 1.93 0.42 0.07
ANG 1.65 0.36 0.06
Non- Borrowing
COL,MEX, VEN 28.21 6.21 1.03
CAN, UK 94.11 20.71 3.45
GER.,ITAL, CH 56.41 12.41 2.07
Total 984,79 216.66 36.11
STRATEGIC PLAN 2010-2014
-37-
7.10 Lower levels of lending would lead to a reduction in CDB‟s contribution to BMCs development
efforts and widen the projected financing gap calculated for these countries. Already significant demand
for resources is emerging from BMCs such as The Bahamas, Barbados, Anguilla and Turks and Caicos
Islands that have not frequently approached the Bank for resources.
Other Resource Requirement
7.11 The strategy to achieve the increased lending programme will be based on a lean and flexible
workforce. This will require a greater leveraging of the Bank‟s internal resources, identifying the value
streams in all activities, implementing flexible work arrangements and applying contingent manpower
during peak lending periods. However, this does not preclude changes in the staffing levels as warranted
by the level and composition of the loans and grants operations.
7.12 The demand for CDB resources will impact more directly on the Projects, Economics, and Legal
functions. Those functions are already positioned to make incremental manpower adjustments when
necessary by “unfreezing” operational posts and leveraging fixed-term engagements.
7.13 The Bank is not attempting at this time to make finite projections for manpower to 2019 as such
projections would be unrealistic. Chief among the factors affecting such a determination would be the
size of the loans. If the Bank is called upon to increase the value of its services through the provision of a
significantly larger number of small interventions, the impact on staffing numbers will be considerably
greater than if the number of interventions increases at a more measured pace, but at a higher monetary
value per intervention. The approach of operating lean and identifying a contingent talent pool is
therefore the strategic choice.
DECISION OF BOARD OF GOVERNORS ON GCI
On May 18, 2010, the Board of Governors considered and approved a Report for the BOD entitled
“General Capital Increase in Share Capital” and Draft Resolution No. 4/10 entitled “Increase in the
Subscribed Capital Stock of the Bank and in Subscriptions of Members of the Bank”.
These approvals allow for an increase of $984.8 mn or 150% of the subscribed capital; and an
increase of $216.7 mn or 22% of the callable capital payable in six equal annual installments
commencing in 2010.
The capital increase allows the Bank to pursue its objectives as outlined in the Strategic Plan 2010–
2014.
STRATEGIC PLAN 2010-2014
-38-
8. RESULTS MONITORING FRAMEWORK
8.01 The effectiveness of the Bank‟s development assistance to BMCs will depend to a large extent on
its ability to monitor and evaluate its work in a measureable manner and to make appropriate adjustments
to the design and implementation of its initiatives based on results.
8.02 A RMF has been adopted in the context of the SDF 7 replenishment cycle and is being expanded
for the purpose of reporting on results during the implementation of this Strategic Plan. The Framework
is designed to measure the degree to which CDB is assisting BMCs‟ economies to grow and reduce
poverty; strengthen the focus of its activities on development outcomes; and provide information on the
effectiveness of CDB‟s interventions. Appendix 5 sets out details of the Bank‟s current RMF. Work on
the development of the additional indicators, new baselines and targets, appropriate for monitoring the
Strategic Plan is ongoing and a paper on these adjustments will be presented for BOD‟s consideration at
its July meeting.
8.03 The Framework will be used to assess results at the four levels:
(a) Level 1: Selected Caribbean-specific MDG targets and development outcomes. The
first level of the results framework tracks the development progress of the Region
through selected Caribbean-specific MDGs to which CDB contributes. These outcomes
cannot be attributed to CDB alone and result from collective action of DPs over the long
term. Indicators of poverty, education, gender equality, environmental sustainability, and
RCI have been selected to represent the major development outcomes CDB is seeking
and to which CDB operations aim to contribute.
(b) Level 2: CDB contributions to country and regional outcomes. CDB will assess its
contribution to country and regional outcomes by aggregating key outputs delivered to
BMCs through CDB projects in priority sectors. Output reporting in the proposed results
framework focuses on ten operational priority areas of Strategic Plan 2010–2014:
education and training, agriculture and rural development, social and economic
infrastructure, private sector development, water and sanitation, DRM, climate change
response, RPGs, economic management, and capacity development. Indicators at this
level will also link outputs to beneficiaries, providing a measure of the impact of
operations.
(c) Level 3: Operational and Organisational Effectiveness. By improving the
performance of its operational portfolio, CDB can increase its contribution to country
outcomes and overall development effectiveness. Indicators of operational effectiveness
are classified into three main categories: operational quality and portfolio performance;
resource allocation and utilisation; and strategic focus. Organisational effectiveness aims
to capture progress in increasing efficiency in the use of internal resources and
implementing reforms that are considered essential to maintain CDB's ability to remain a
relevant and results-oriented institution and contribute to improving its capacity
utilisation, use of budgetary resources, and business processes and practices.
(d) Level 4: Partnership, Harmonisation and Alignment. Level 4 indicators will monitor
key elements in the Paris Declaration and the Accra Agenda for Action. These Level 4
indicators are targeted at measures to strengthen country capacity and ownership of the
development agenda, alignment with country priorities and systems, use of common
arrangements and procedures such as programme-based approaches, sector-wide
approaches, and joint operations with other agencies.

STRATEGIC PLAN 2010-2014
-39-
8.04 CDB will utilise the RMF indicators to track and measure progress towards achieving its
expected strategic outputs and outcomes as set out in the Plan and for identifying areas requiring
adjustments, further efforts or corrective actions. There will be annual reporting to the BOD on these
indicators as part of the report on progress in implementing the new Strategic Plan.
-40-
9. CONCLUSIONS AND RECOMMENDATION
9.01 CDB‟s BMCs are challenged by their vulnerability to external shocks and natural hazard events
which, to a significant degree is derived from their small physical and economic size. The impact of this
vulnerability together with global trends towards trade liberalisation and the erosion of trade preferences
have compelled BMCs to develop strategies for medium-term economic transformation and sustainable
growth, poverty reduction and to strengthen their resilience to shocks.
9.02 As a result of their vulnerability to external shocks, both economic and environmental, BMCs are
likely to face frequent reversals in their quest to achieve sustainable economic and social development. In
this regard, BMCs must implement measures which would strengthen their resilience to these shocks.
These include: accelerating and sustaining economic growth; reducing poverty and inequality; improving
fiscal and debt sustainability; promoting environmental sustainability and DRM; mitigating and adapting
to natural hazards and climate change; supporting RCI and promoting gender equality. Achieving the
degree of resilience required for sustainable economic growth depends on how well BMCs manage the
implementation of these measures.
9.03 The Strategic Plan 2010–2014 sets out CDB‟s programme for assisting BMCs to confront their
major development challenges and to implement their policies and strategies for economic and social
development. The Plan allows for the positioning of the Bank to improve the delivery of its products and
services to clients as well as to enhance its development effectiveness and results focus. It also recognises
that BMCs would need the assistance of CDB and other DPs to mobilise the significant amount of
financial resources, both concessionary and non-concessionary, that would be required to pursue their
development objectives.
9.04 BMCs‟ capacity to implement these plans is severely constrained by already large fiscal deficits
and high levels of public indebtedness. Strategic Plan 2010–2014 envisages CDB as a leading institution
in the Caribbean Aid Architecture with access to the necessary financial and other institutional resources
for assisting BMCs to pursue their development objectives. CDB will work in partnership with other DPs
in the Region to more effectively deliver its programme of assistance over the next five years. The
implementation framework for the Strategic Plan is set out in Appendix 6.
RECOMMENDATION
9.05 The BOD is requested to consider and approve this document as the Strategic Plan 2010–2014.
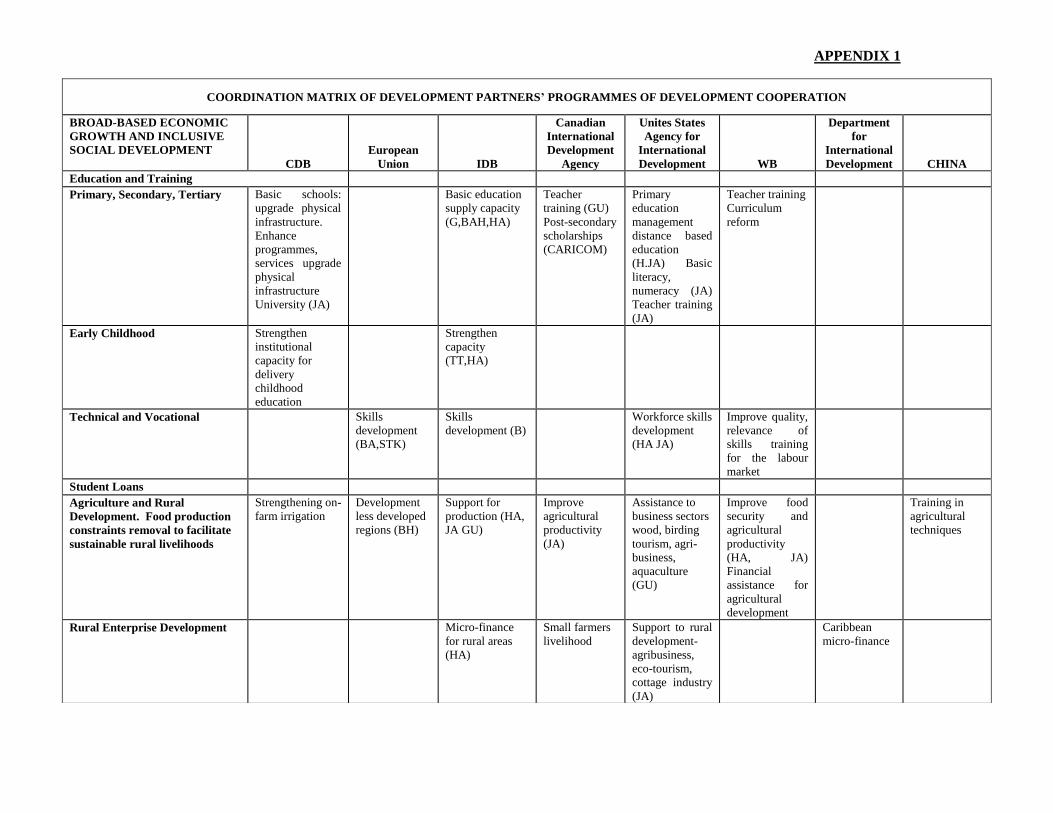
APPENDIX 1
COORDINATION MATRIX OF DEVELOPMENT PARTNERS’ PROGRAMMES OF DEVELOPMENT COOPERATION
BROAD-BASED ECONOMIC
GROWTH AND INCLUSIVE
SOCIAL DEVELOPMENT
CDB
European
Union
IDB
Canadian
International
Development
Agency
Unites States
Agency for
International
Development
WB
Department
for
International
Development
CHINA
Education and Training
Primary, Secondary, Tertiary Basic schools:
upgrade physical
infrastructure.
Enhance
programmes,
services upgrade
physical
infrastructure
University (JA)
Basic education
supply capacity
(G,BAH,HA)
Teacher
training (GU)
Post-secondary
scholarships
(CARICOM)
Primary
education
management
distance based
education
(H.JA) Basic
literacy,
numeracy (JA)
Teacher training
(JA)
Teacher training
Curriculum
reform
Early Childhood Strengthen
institutional
capacity for
delivery
childhood
education
Strengthen
capacity
(TT,HA)
Technical and Vocational Skills
development
(BA,STK)
Skills
development (B)
Workforce skills
development
(HA JA)
Improve quality,
relevance of
skills training
for the labour
market
Student Loans
Agriculture and Rural
Development. Food production
constraints removal to facilitate
sustainable rural livelihoods
Strengthening on-
farm irrigation
Development
less developed
regions (BH)
Support for
production (HA,
JA GU)
Improve
agricultural
productivity
(JA)
Assistance to
business sectors
wood, birding
tourism, agri-
business,
aquaculture
(GU)
Improve food
security and
agricultural
productivity
(HA, JA)
Financial
assistance for
agricultural
development
Training in
agricultural
techniques
Rural Enterprise Development Micro-finance
for rural areas
(HA)
Small farmers
livelihood
Support to rural
development-
agribusiness,
eco-tourism,
cottage industry
(JA)
Caribbean
micro-finance
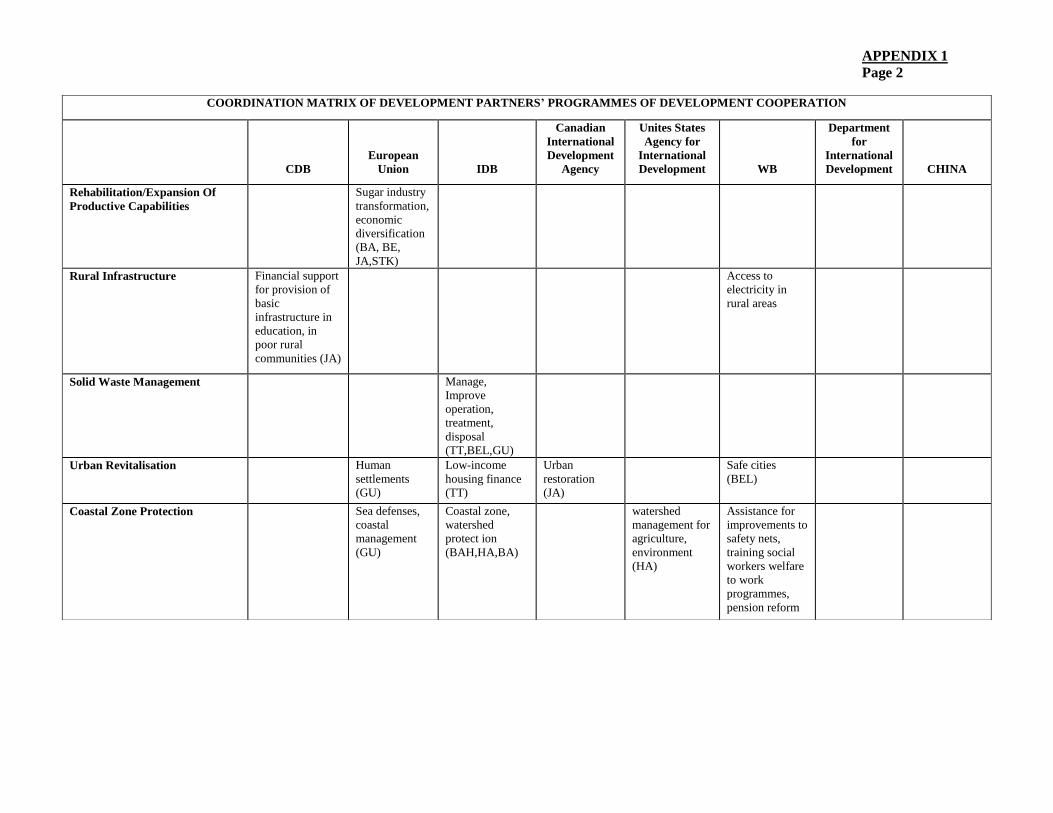
APPENDIX 1
Page 2
COORDINATION MATRIX OF DEVELOPMENT PARTNERS’ PROGRAMMES OF DEVELOPMENT COOPERATION
CDB
European
Union
IDB
Canadian
International
Development
Agency
Unites States
Agency for
International
Development
WB
Department
for
International
Development
CHINA
Rehabilitation/Expansion Of
Productive Capabilities
Sugar industry
transformation,
economic
diversification
(BA, BE,
JA,STK)
Rural Infrastructure Financial support
for provision of
basic
infrastructure in
education, in
poor rural
communities (JA)
Access to
electricity in
rural areas
Solid Waste Management Manage,
Improve
operation,
treatment,
disposal
(TT,BEL,GU)
Urban Revitalisation Human
settlements
(GU)
Low-income
housing finance
(TT)
Urban
restoration
(JA)
Safe cities
(BEL)
Coastal Zone Protection Sea defenses,
coastal
management
(GU)
Coastal zone,
watershed
protect ion
(BAH,HA,BA)
watershed
management for
agriculture,
environment
(HA)
Assistance for
improvements to
safety nets,
training social
workers welfare
to work
programmes,
pension reform
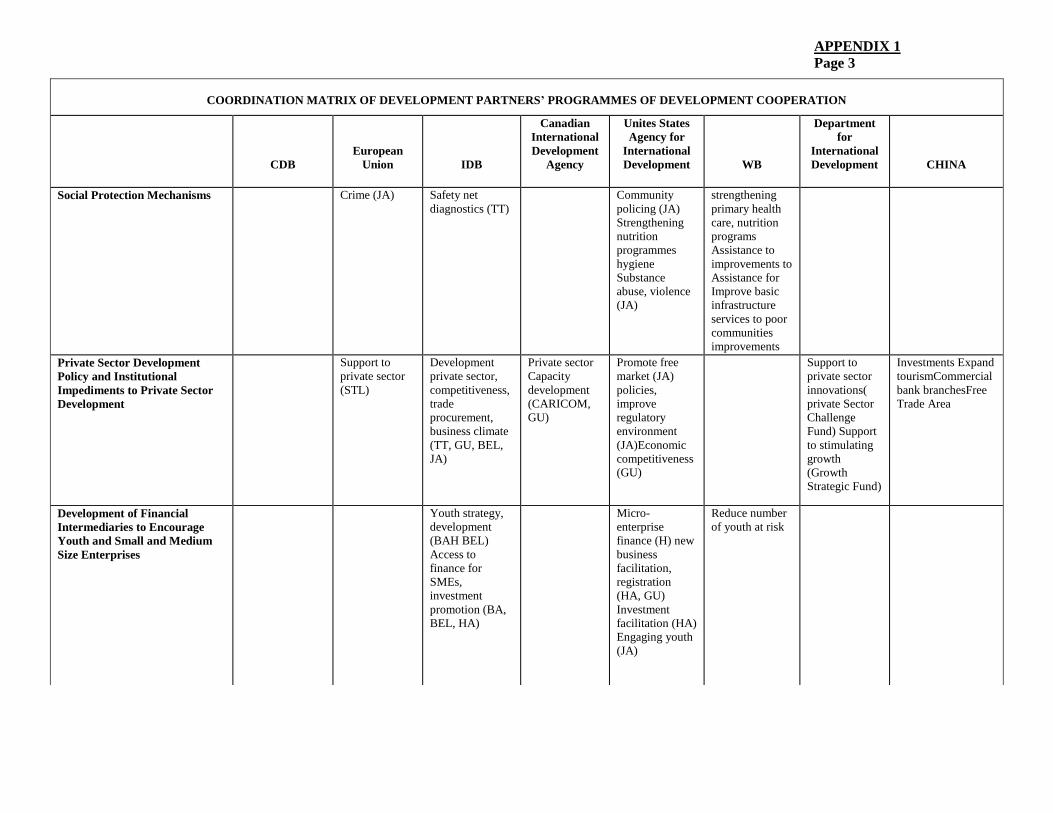
APPENDIX 1
Page 3
COORDINATION MATRIX OF DEVELOPMENT PARTNERS’ PROGRAMMES OF DEVELOPMENT COOPERATION
CDB
European
Union
IDB
Canadian
International
Development
Agency
Unites States
Agency for
International
Development
WB
Department
for
International
Development
CHINA
Social Protection Mechanisms Crime (JA) Safety net
diagnostics (TT)
Community
policing (JA)
Strengthening
nutrition
programmes
hygiene
Substance
abuse, violence
(JA)
strengthening
primary health
care, nutrition
programs
Assistance to
improvements to
Assistance for
Improve basic
infrastructure
services to poor
communities
improvements
Private Sector Development
Policy and Institutional
Impediments to Private Sector
Development
Support to
private sector
(STL)
Development
private sector,
competitiveness,
trade
procurement,
business climate
(TT, GU, BEL,
JA)
Private sector
Capacity
development
(CARICOM,
GU)
Promote free
market (JA)
policies,
improve
regulatory
environment
(JA)Economic
competitiveness
(GU)
Support to
private sector
innovations(
private Sector
Challenge
Fund) Support
to stimulating
growth
(Growth
Strategic Fund)
Investments Expand
tourismCommercial
bank branchesFree
Trade Area
Development of Financial
Intermediaries to Encourage
Youth and Small and Medium
Size Enterprises
Youth strategy,
development
(BAH BEL)
Access to
finance for
SMEs,
investment
promotion (BA,
BEL, HA)
Micro-
enterprise
finance (H) new
business
facilitation,
registration
(HA, GU)
Investment
facilitation (HA)
Engaging youth
(JA)
Reduce number
of youth at risk
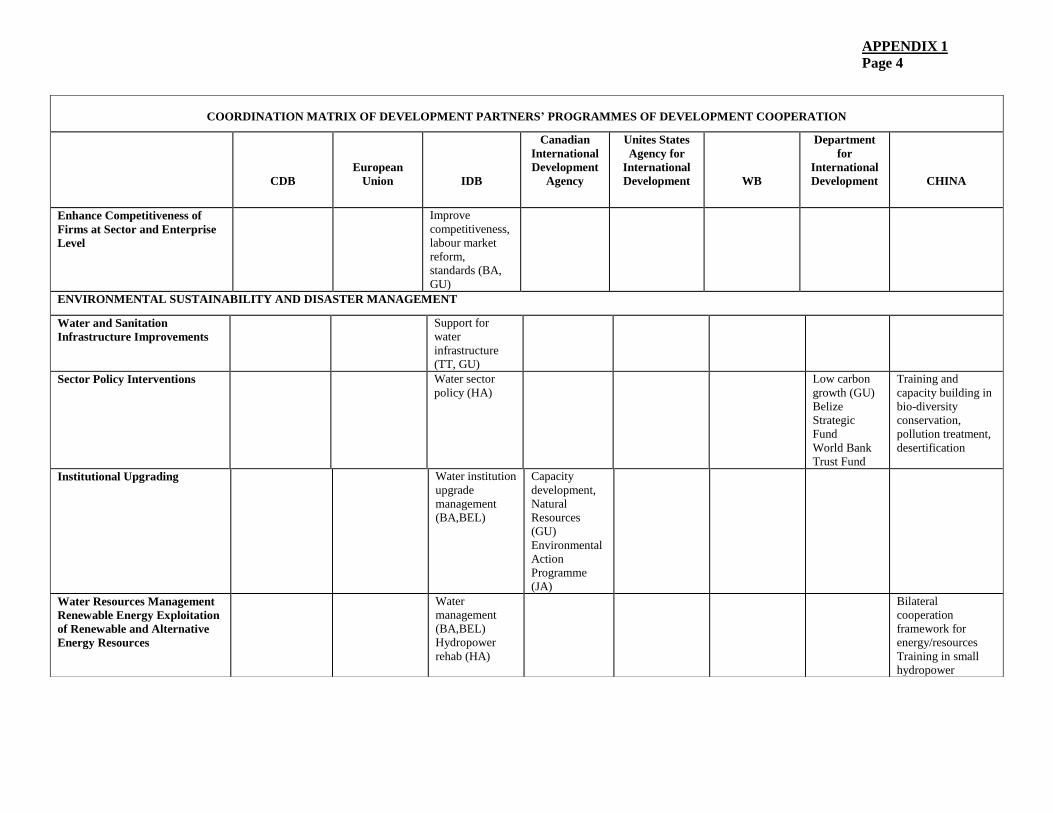
APPENDIX 1
Page 4
COORDINATION MATRIX OF DEVELOPMENT PARTNERS’ PROGRAMMES OF DEVELOPMENT COOPERATION
CDB
European
Union
IDB
Canadian
International
Development
Agency
Unites States
Agency for
International
Development
WB
Department
for
International
Development
CHINA
Enhance Competitiveness of
Firms at Sector and Enterprise
Level
Improve
competitiveness,
labour market
reform,
standards (BA,
GU)
ENVIRONMENTAL SUSTAINABILITY AND DISASTER MANAGEMENT
Water and Sanitation
Infrastructure Improvements
Support for
water
infrastructure
(TT, GU)
Sector Policy Interventions Water sector
policy (HA) Low carbon
growth (GU)
Belize
Strategic
Fund
World Bank
Trust Fund
Training and
capacity building in
bio-diversity
conservation,
pollution treatment,
desertification
Institutional Upgrading Water institution
upgrade
management
(BA,BEL)
Capacity
development,
Natural
Resources
(GU)
Environmental
Action
Programme
(JA)
Water Resources Management
Renewable Energy Exploitation
of Renewable and Alternative
Energy Resources
Water
management
(BA,BEL)
Hydropower
rehab (HA)
Bilateral
cooperation
framework for
energy/resources
Training in small
hydropower
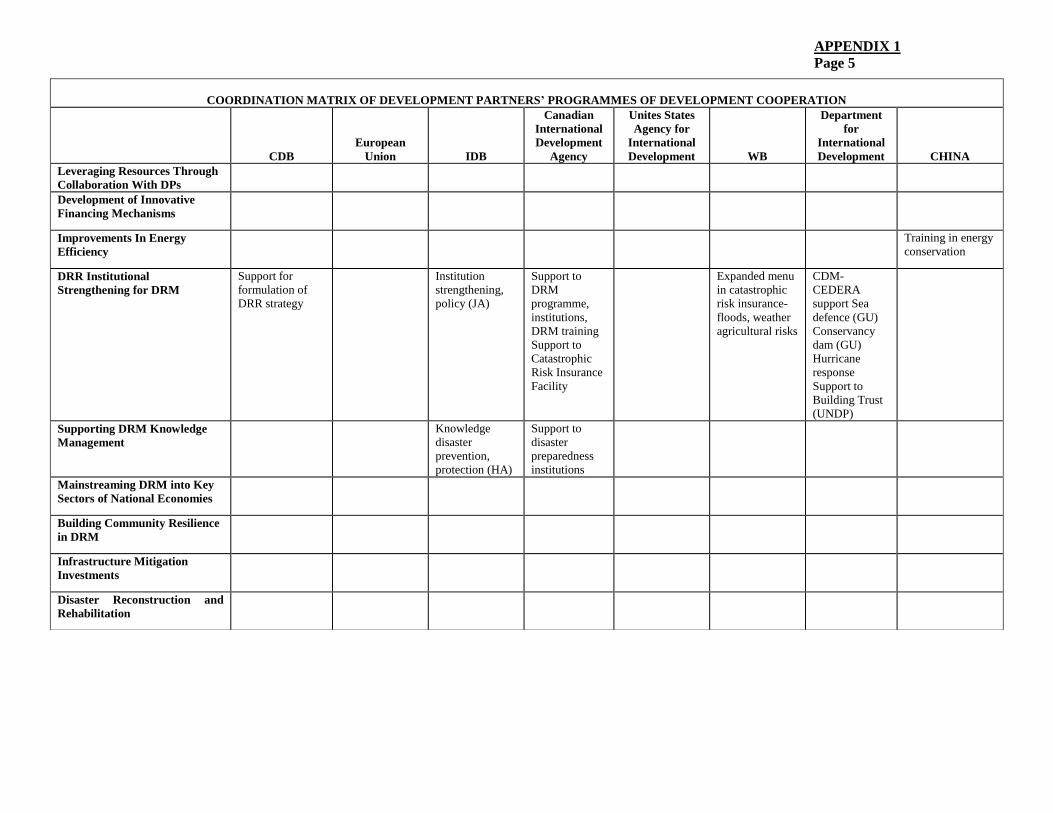
APPENDIX 1
Page 5
COORDINATION MATRIX OF DEVELOPMENT PARTNERS’ PROGRAMMES OF DEVELOPMENT COOPERATION
CDB
European
Union
IDB
Canadian
International
Development
Agency
Unites States
Agency for
International
Development
WB
Department
for
International
Development
CHINA
Leveraging Resources Through
Collaboration With DPs
Development of Innovative
Financing Mechanisms
Improvements In Energy
Efficiency
Training in energy
conservation
DRR Institutional
Strengthening for DRM
Support for
formulation of
DRR strategy
Institution
strengthening,
policy (JA)
Support to
DRM
programme,
institutions,
DRM training
Support to
Catastrophic
Risk Insurance
Facility
Expanded menu
in catastrophic
risk insurance-
floods, weather
agricultural risks
CDM-
CEDERA
support Sea
defence (GU)
Conservancy
dam (GU)
Hurricane
response
Support to
Building Trust
(UNDP)
Supporting DRM Knowledge
Management
Knowledge
disaster
prevention,
protection (HA)
Support to
disaster
preparedness
institutions
Mainstreaming DRM into Key
Sectors of National Economies
Building Community Resilience
in DRM
Infrastructure Mitigation
Investments
Disaster Reconstruction and
Rehabilitation
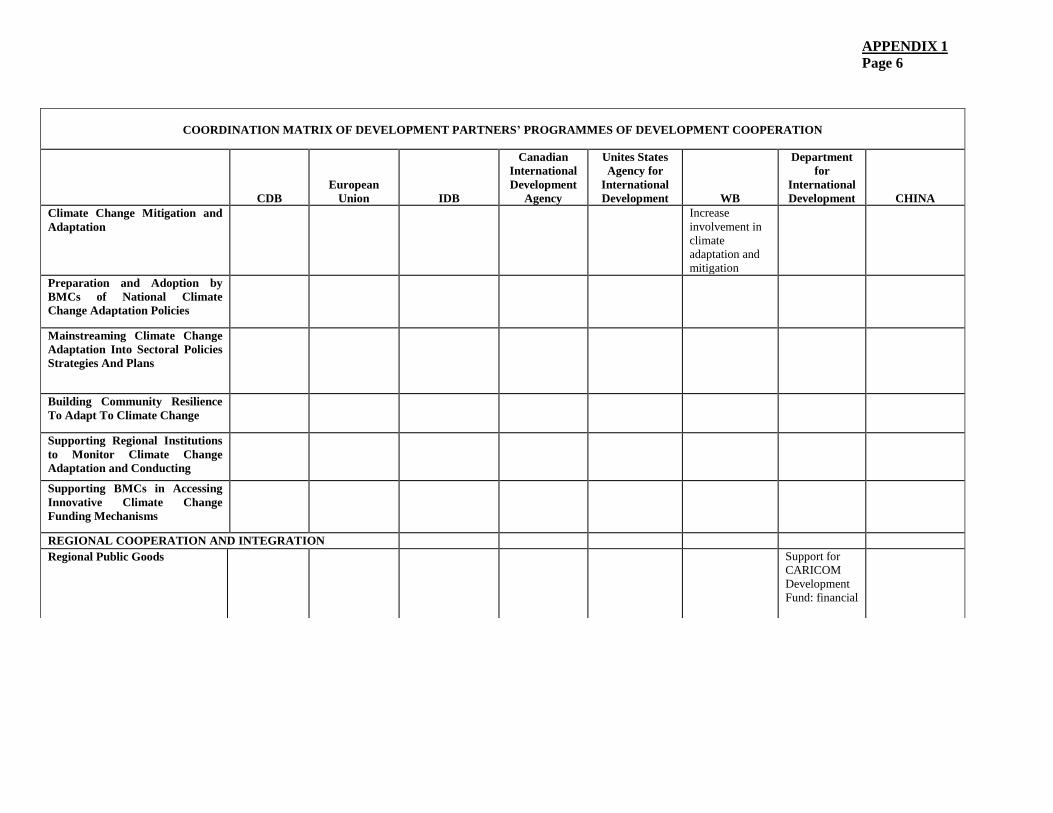
APPENDIX 1
Page 6
COORDINATION MATRIX OF DEVELOPMENT PARTNERS’ PROGRAMMES OF DEVELOPMENT COOPERATION
CDB
European
Union
IDB
Canadian
International
Development
Agency
Unites States
Agency for
International
Development
WB
Department
for
International
Development
CHINA
Climate Change Mitigation and
Adaptation
Increase
involvement in
climate
adaptation and
mitigation
Preparation and Adoption by
BMCs of National Climate
Change Adaptation Policies
Mainstreaming Climate Change
Adaptation Into Sectoral Policies
Strategies And Plans
Building Community Resilience
To Adapt To Climate Change
Supporting Regional Institutions
to Monitor Climate Change
Adaptation and Conducting
Supporting BMCs in Accessing
Innovative Climate Change
Funding Mechanisms
REGIONAL COOPERATION AND INTEGRATION
Regional Public Goods Support for
CARICOM
Development
Fund: financial
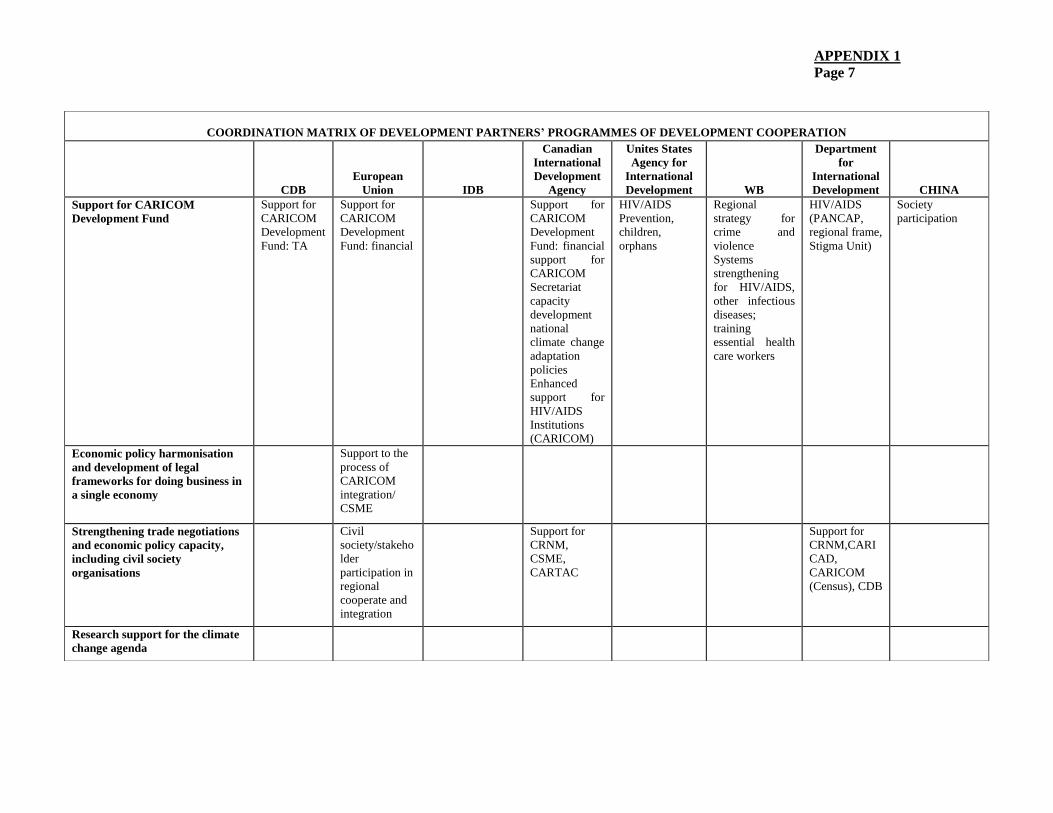
APPENDIX 1
Page 7
COORDINATION MATRIX OF DEVELOPMENT PARTNERS’ PROGRAMMES OF DEVELOPMENT COOPERATION
CDB
European
Union
IDB
Canadian
International
Development
Agency
Unites States
Agency for
International
Development
WB
Department
for
International
Development
CHINA
Support for CARICOM
Development Fund
Support for
CARICOM
Development
Fund: TA
Support for
CARICOM
Development
Fund: financial
Support for
CARICOM
Development
Fund: financial
support for
CARICOM
Secretariat
capacity
development
national
climate change
adaptation
policies
Enhanced
support for
HIV/AIDS
Institutions
(CARICOM)
HIV/AIDS
Prevention,
children,
orphans
Regional
strategy for
crime and
violence
Systems
strengthening
for HIV/AIDS,
other infectious
diseases;
training
essential health
care workers
HIV/AIDS
(PANCAP,
regional frame,
Stigma Unit)
Society
participation
Economic policy harmonisation
and development of legal
frameworks for doing business in
a single economy
Support to the
process of
CARICOM
integration/
CSME
Strengthening trade negotiations
and economic policy capacity,
including civil society
organisations
Civil
society/stakeho
lder
participation in
regional
cooperate and
integration
Support for
CRNM,
CSME,
CARTAC
Support for
CRNM,CARI
CAD,
CARICOM
(Census), CDB
Research support for the climate
change agenda
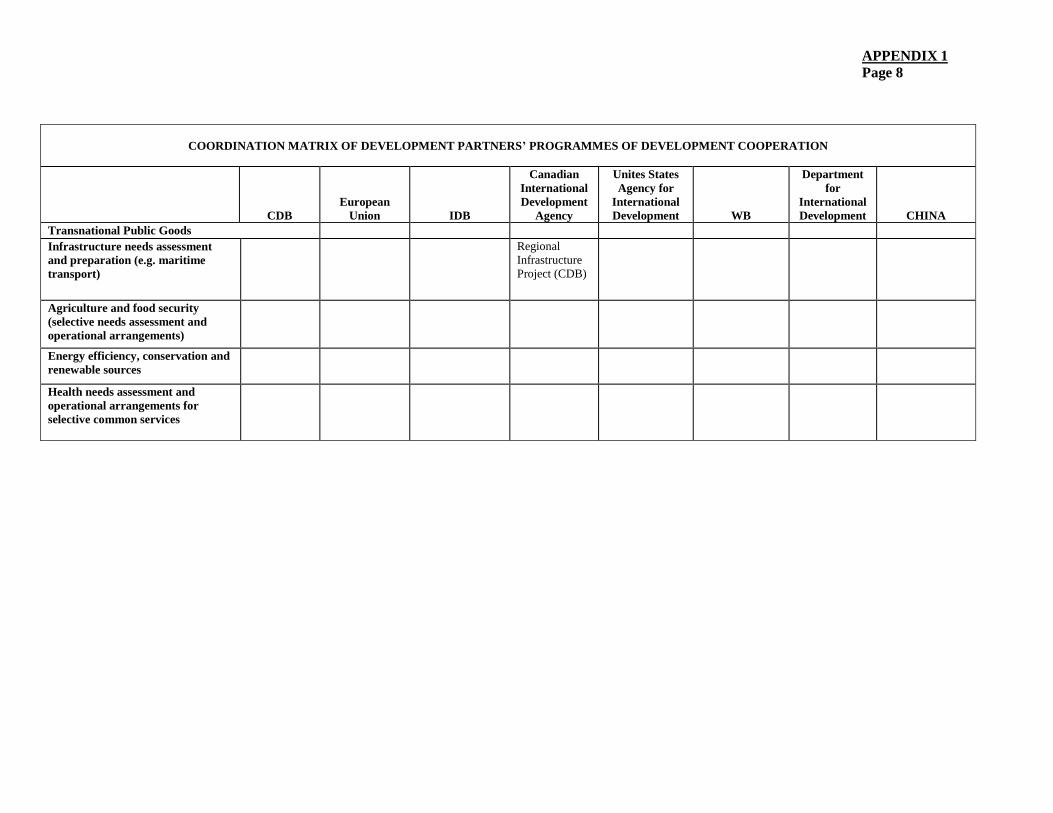
APPENDIX 1
Page 8
COORDINATION MATRIX OF DEVELOPMENT PARTNERS’ PROGRAMMES OF DEVELOPMENT COOPERATION
CDB
European
Union
IDB
Canadian
International
Development
Agency
Unites States
Agency for
International
Development
WB
Department
for
International
Development
CHINA
Transnational Public Goods
Infrastructure needs assessment
and preparation (e.g. maritime
transport)
Regional
Infrastructure
Project (CDB)
Agriculture and food security
(selective needs assessment and
operational arrangements)
Energy efficiency, conservation and
renewable sources
Health needs assessment and
operational arrangements for
selective common services

APPENDIX 1
Page 7
APPENDIX 2
POVERTY INDICATORS FOR SELECTED CARIBBEAN COUNTRIES
Country
Poverty Indicators
Year conducted
% below Poverty Line
% below Indigence
Line Poverty
Gap 1 Poverty
Severity 1 Poverty Line
USD
Indigence Line USD
Gini Coefficient
Anguilla 2002 23.0 2.0 6.9 3.2 2,937 1,135 .31
Antigua and Barbuda 2006 18.4 3.7 6.6 3.8 2,366 917 .48
Bahamas, The# 2001 9.3 5.1 2.8 1.3 2,863 964 .57
Barbados* 1997 13.9 na na na 2,751 1,448 .39
Belize+ 1996 2002
33.0 33.5
13.4 10.8
8.7 11.2
4.3 6.1
644 -
377 -
- .40
British Virgin Islands 2002 22.0 <0.5 4.1 1.7 6,300 1,700 .23
Cayman Islands 2007 1.9 - 0.44 0.20 3,319 - .40
Dominica 2002 39.0 15.0 10.2 4.8 1,260 740 .35
Grenada 1999 32.1 12.9 15.3 9.9 1,208 530 .45
20082 37.7 2.4 10.1 4.0 2,164 887 -
Guyana* 1993 1999
43.0 35.0
29.0 19.0
na 12.4
na na
380 510
281 -
- -
Haiti 1997 65.0 na na na - -
Jamaica* 2002 2004 2005 2006
19.7 16.9 14.8 14.3
na na na na
na na na na
na na na na
JMD47,129 - - -
- - - -
.40
.38
.38 -
St. Kitts and Nevis
St. Kitts 2000 30.5 11.0 2.5 0.9 1,244 791 .39
2008 23.7 1.4 6.41 2.59 2,714 961 .38
Nevis 2000 32.0 17.0 2.8 1.0 1,460 908 .37
2008 15.9 0 2.72 0.77 3,625 1,086 .38
St. Lucia 1996 25.1 7.1 8.6 4.4 695 371 .50
2006 28.8 1.6 - - 1,905 588 .42
St. Vincent and the Grenadines 1996 37.5 25.7 12.6 6.9 450 393 .56
20083 30.2 2.9 7.5 3.0 2,046 906 .40
Suriname 2000 63.1 20.0 na na - - -
Trinidad and Tobago* 1992 1997
21.2 24.0
11.2 8.3
na na
na na
570 753
420 457
.39
Turks and Caicos Islands 1999 25.9 3.2 5.7 2.6 2,424 880 .37
n.a not available
CPAs conducted by CDB; *Jamaica (Annual) Survey of Living Conditions (SLC) conducted by the Government of Jamaica; Barbados, CPA, IDB; Guyana Living Conditions Survey, United Nations Development Programme (UNDP); Trinidad and Tobago Household Budget Survey; +SLC, Government of Belize; #Bahamas SLC, Government of the Bahamas.
1 The poverty gap is based on the aggregate poverty deficit of the poor relative to the poverty line. It indicates the depth of poverty, which is the extent to which the incomes of poor households fall below the poverty line. Poverty severity or intensity of poverty is provided by the Foster-Greer-Thorbecke P2, which assesses aggregate poverty. The measure is usually considered as the sum of an amount due to the poverty gap, and an amount due to inequality amongst the poor. It is similar to the poverty gap but gives greater emphasis to the poorest households.
2 Preliminary data inserted for Grenada (2007).
3 Preliminary data inserted for St. Vincent and the Grenadines (2007).

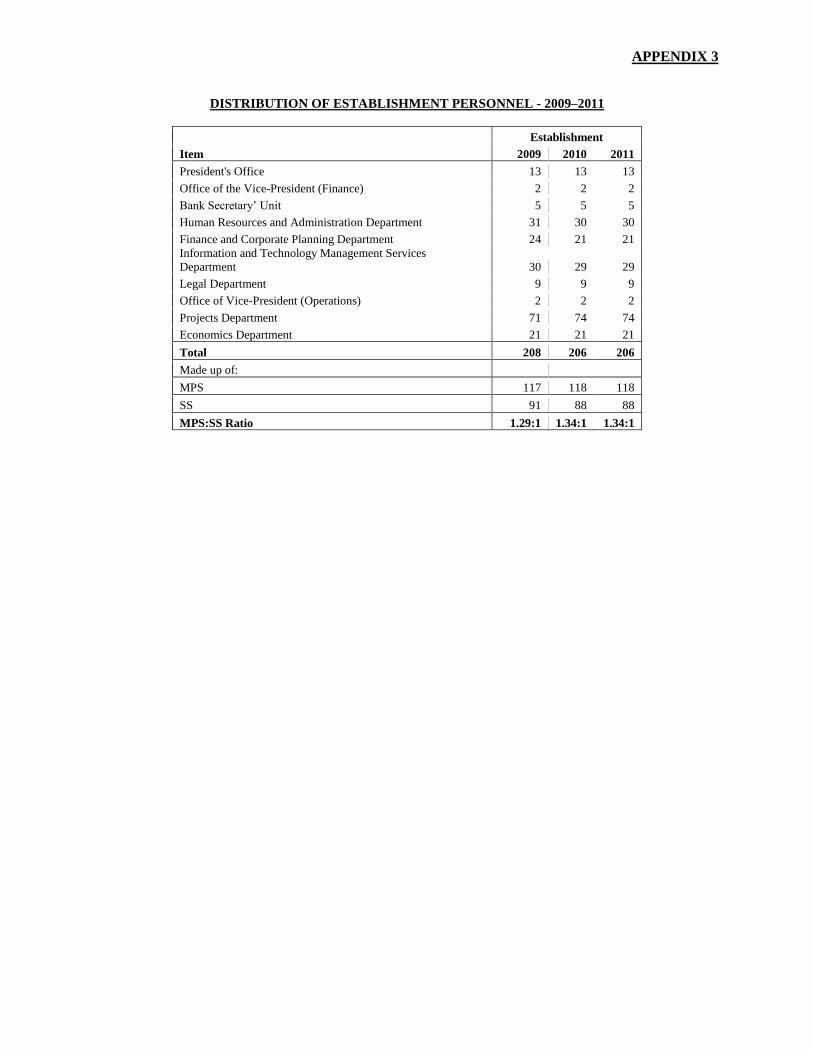
APPENDIX 3
DISTRIBUTION OF ESTABLISHMENT PERSONNEL - 2009–2011
Establishment
Item 2009 2010 2011
President's Office 13 13 13
Office of the Vice-President (Finance) 2 2 2
Bank Secretary‟ Unit 5 5 5
Human Resources and Administration Department 31 30 30
Finance and Corporate Planning Department 24 21 21
Information and Technology Management Services
Department 30 29 29
Legal Department 9 9 9
Office of Vice-President (Operations) 2 2 2
Projects Department 71 74 74
Economics Department 21 21 21
Total 208 206 206
Made up of:
MPS 117 118 118
SS 91 88 88
MPS:SS Ratio 1.29:1 1.34:1 1.34:1

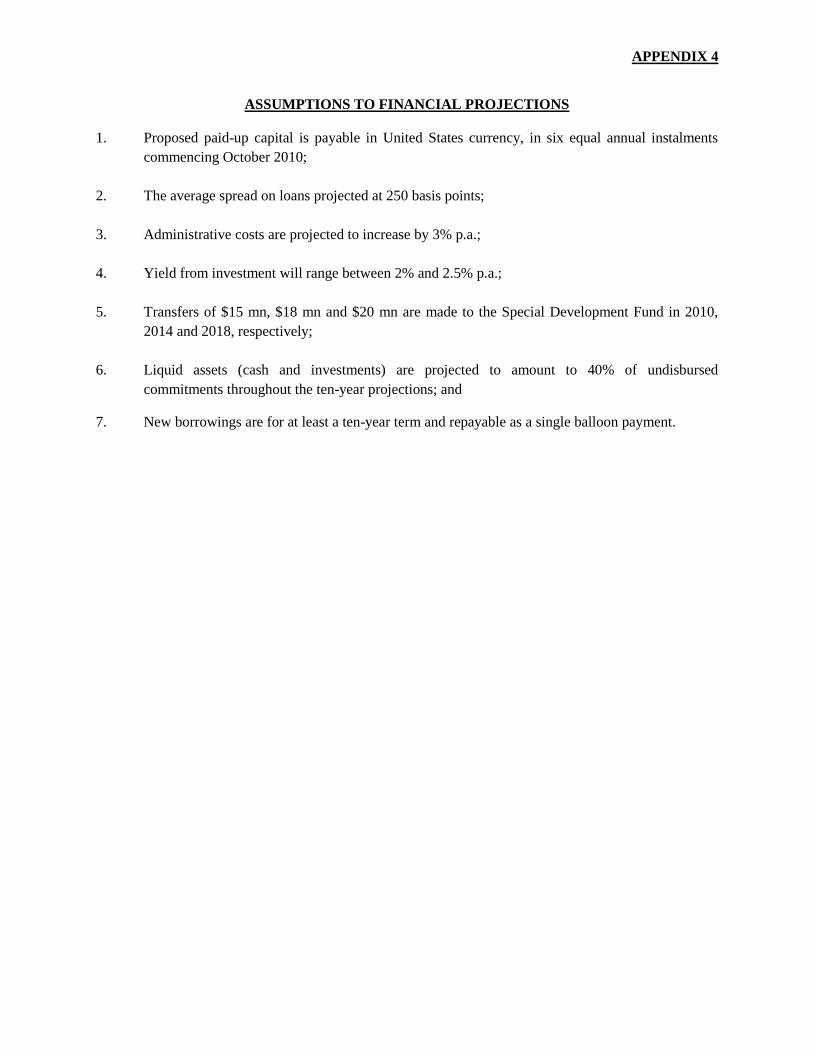
APPENDIX 4
ASSUMPTIONS TO FINANCIAL PROJECTIONS
1. Proposed paid-up capital is payable in United States currency, in six equal annual instalments
commencing October 2010;
2. The average spread on loans projected at 250 basis points;
3. Administrative costs are projected to increase by 3% p.a.;
4. Yield from investment will range between 2% and 2.5% p.a.;
5. Transfers of $15 mn, $18 mn and $20 mn are made to the Special Development Fund in 2010,
2014 and 2018, respectively;
6. Liquid assets (cash and investments) are projected to amount to 40% of undisbursed
commitments throughout the ten-year projections; and
7. New borrowings are for at least a ten-year term and repayable as a single balloon payment.

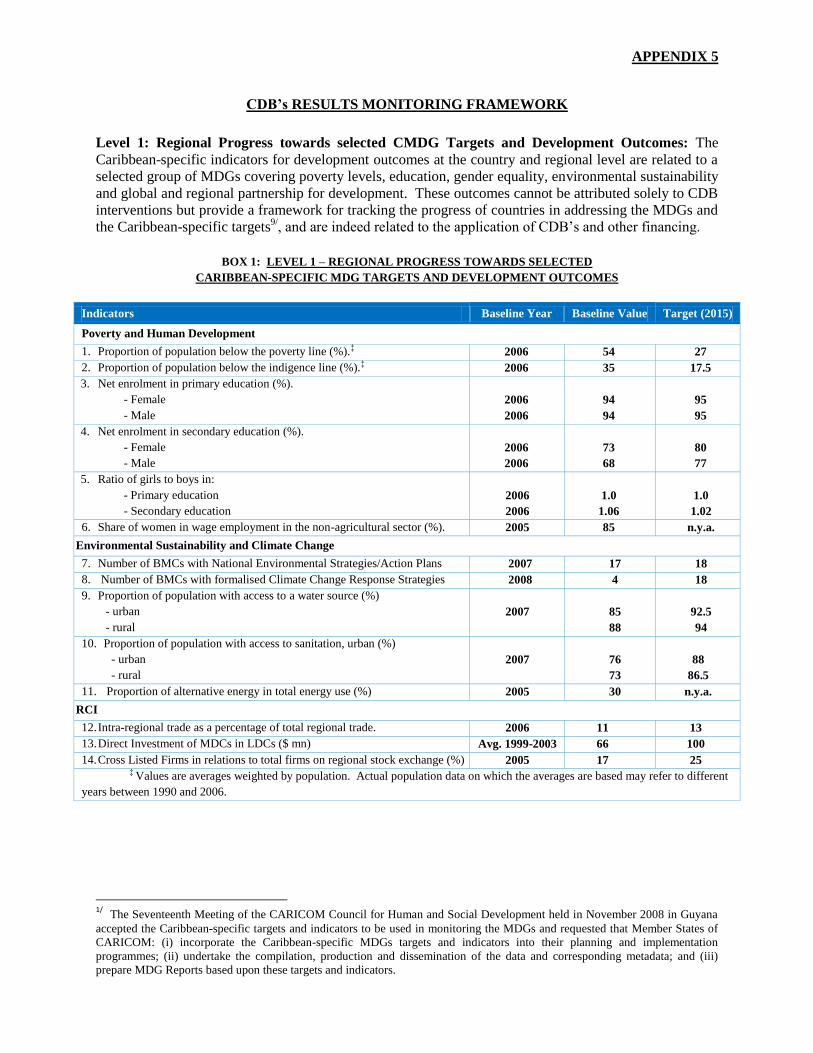
APPENDIX 5
CDB’s RESULTS MONITORING FRAMEWORK
Level 1: Regional Progress towards selected CMDG Targets and Development Outcomes: The
Caribbean-specific indicators for development outcomes at the country and regional level are related to a
selected group of MDGs covering poverty levels, education, gender equality, environmental sustainability
and global and regional partnership for development. These outcomes cannot be attributed solely to CDB
interventions but provide a framework for tracking the progress of countries in addressing the MDGs and
the Caribbean-specific targets9/, and are indeed related to the application of CDB‟s and other financing.
BOX 1: LEVEL 1 – REGIONAL PROGRESS TOWARDS SELECTED
CARIBBEAN-SPECIFIC MDG TARGETS AND DEVELOPMENT OUTCOMES
Indicators Baseline Year Baseline Value Target (2015)
Poverty and Human Development
1. Proportion of population below the poverty line (%).‡ 2006 54 27
2. Proportion of population below the indigence line (%).‡ 2006 35 17.5
3. Net enrolment in primary education (%).
- Female
- Male
2006
2006
94
94
95
95
4. Net enrolment in secondary education (%).
- Female
- Male
2006
2006
73
68
80
77
5. Ratio of girls to boys in:
- Primary education
- Secondary education
2006
2006
1.0
1.06
1.0
1.02
6. Share of women in wage employment in the non-agricultural sector (%). 2005 85 n.y.a.
Environmental Sustainability and Climate Change
7. Number of BMCs with National Environmental Strategies/Action Plans 2007 17 18
8. Number of BMCs with formalised Climate Change Response Strategies 2008 4 18
9. Proportion of population with access to a water source (%)
- urban
- rural
2007
85
88
92.5
94
10. Proportion of population with access to sanitation, urban (%)
- urban
- rural
2007
76
73
88
86.5
11. Proportion of alternative energy in total energy use (%) 2005 30 n.y.a.
RCI
12. Intra-regional trade as a percentage of total regional trade. 2006 11 13
13. Direct Investment of MDCs in LDCs ($ mn) Avg. 1999-2003 66 100
14. Cross Listed Firms in relations to total firms on regional stock exchange (%) 2005 17 25 ‡ Values are averages weighted by population. Actual population data on which the averages are based may refer to different
years between 1990 and 2006.
1/ The Seventeenth Meeting of the CARICOM Council for Human and Social Development held in November 2008 in Guyana
accepted the Caribbean-specific targets and indicators to be used in monitoring the MDGs and requested that Member States of
CARICOM: (i) incorporate the Caribbean-specific MDGs targets and indicators into their planning and implementation
programmes; (ii) undertake the compilation, production and dissemination of the data and corresponding metadata; and (iii)
prepare MDG Reports based upon these targets and indicators.
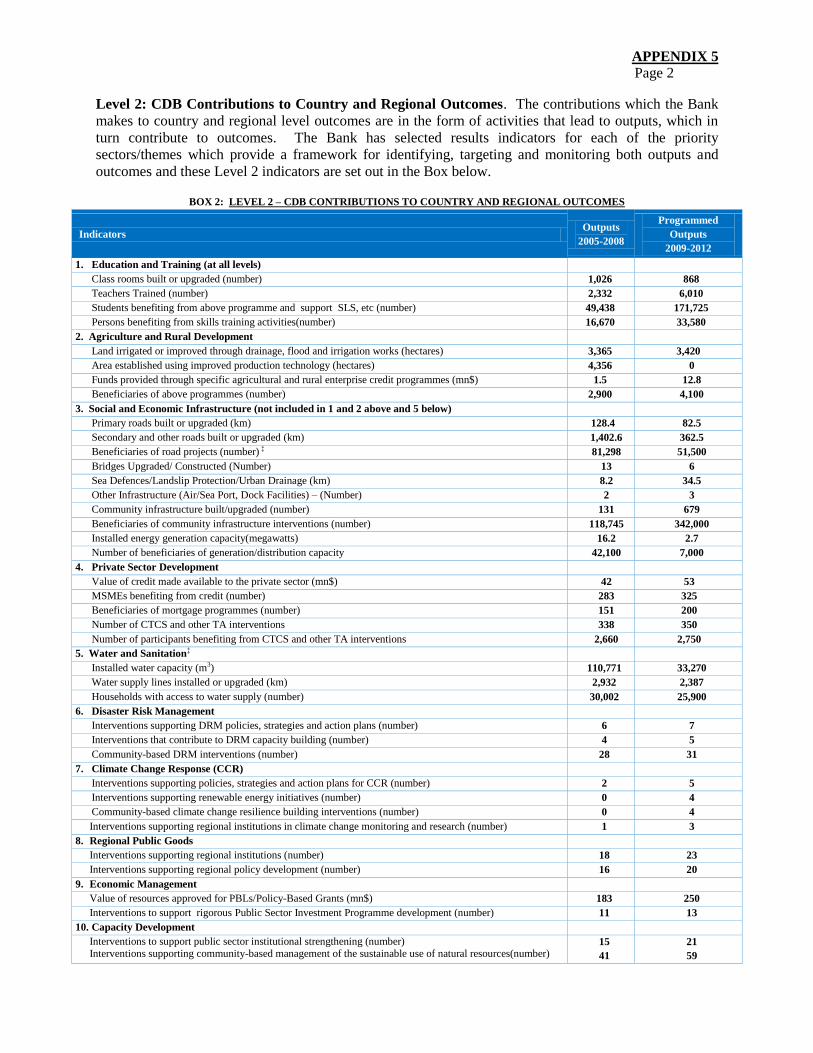
APPENDIX 5
Page 2
Level 2: CDB Contributions to Country and Regional Outcomes. The contributions which the Bank
makes to country and regional level outcomes are in the form of activities that lead to outputs, which in
turn contribute to outcomes. The Bank has selected results indicators for each of the priority
sectors/themes which provide a framework for identifying, targeting and monitoring both outputs and
outcomes and these Level 2 indicators are set out in the Box below.
BOX 2: LEVEL 2 – CDB CONTRIBUTIONS TO COUNTRY AND REGIONAL OUTCOMES
Indicators Outputs
2005-2008
Programmed
Outputs
2009-2012
1. Education and Training (at all levels)
Class rooms built or upgraded (number) 1,026 868
Teachers Trained (number) 2,332 6,010
Students benefiting from above programme and support SLS, etc (number) 49,438 171,725
Persons benefiting from skills training activities(number) 16,670 33,580
2. Agriculture and Rural Development
Land irrigated or improved through drainage, flood and irrigation works (hectares) 3,365 3,420
Area established using improved production technology (hectares) 4,356 0
Funds provided through specific agricultural and rural enterprise credit programmes (mn$) 1.5 12.8
Beneficiaries of above programmes (number) 2,900 4,100
3. Social and Economic Infrastructure (not included in 1 and 2 above and 5 below)
Primary roads built or upgraded (km) 128.4 82.5
Secondary and other roads built or upgraded (km) 1,402.6 362.5
Beneficiaries of road projects (number) ‡ 81,298 51,500
Bridges Upgraded/ Constructed (Number) 13 6
Sea Defences/Landslip Protection/Urban Drainage (km) 8.2 34.5
Other Infrastructure (Air/Sea Port, Dock Facilities) – (Number) 2 3
Community infrastructure built/upgraded (number) 131 679
Beneficiaries of community infrastructure interventions (number) 118,745 342,000
Installed energy generation capacity(megawatts) 16.2 2.7
Number of beneficiaries of generation/distribution capacity 42,100 7,000
4. Private Sector Development
Value of credit made available to the private sector (mn$) 42 53
MSMEs benefiting from credit (number) 283 325
Beneficiaries of mortgage programmes (number) 151 200
Number of CTCS and other TA interventions 338 350
Number of participants benefiting from CTCS and other TA interventions 2,660 2,750
5. Water and Sanitation‡
Installed water capacity (m3) 110,771 33,270
Water supply lines installed or upgraded (km) 2,932 2,387
Households with access to water supply (number) 30,002 25,900
6. Disaster Risk Management
Interventions supporting DRM policies, strategies and action plans (number) 6 7
Interventions that contribute to DRM capacity building (number) 4 5
Community-based DRM interventions (number) 28 31
7. Climate Change Response (CCR)
Interventions supporting policies, strategies and action plans for CCR (number) 2 5
Interventions supporting renewable energy initiatives (number) 0 4
Community-based climate change resilience building interventions (number) 0 4
Interventions supporting regional institutions in climate change monitoring and research (number) 1 3
8. Regional Public Goods
Interventions supporting regional institutions (number) 18 23
Interventions supporting regional policy development (number) 16 20
9. Economic Management
Value of resources approved for PBLs/Policy-Based Grants (mn$) 183 250
Interventions to support rigorous Public Sector Investment Programme development (number) 11 13
10. Capacity Development
Interventions to support public sector institutional strengthening (number) Interventions supporting community-based management of the sustainable use of natural resources(number)
15
41
21
59
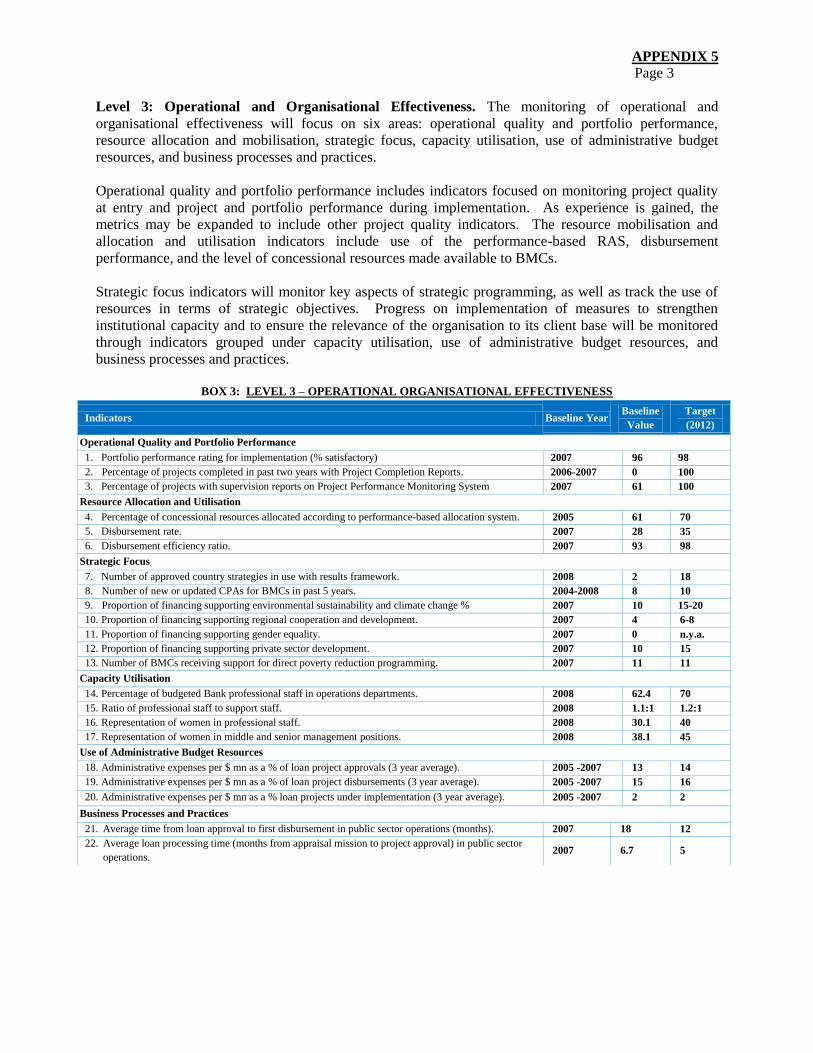
APPENDIX 5
Page 3
Level 3: Operational and Organisational Effectiveness. The monitoring of operational and
organisational effectiveness will focus on six areas: operational quality and portfolio performance,
resource allocation and mobilisation, strategic focus, capacity utilisation, use of administrative budget
resources, and business processes and practices.
Operational quality and portfolio performance includes indicators focused on monitoring project quality
at entry and project and portfolio performance during implementation. As experience is gained, the
metrics may be expanded to include other project quality indicators. The resource mobilisation and
allocation and utilisation indicators include use of the performance-based RAS, disbursement
performance, and the level of concessional resources made available to BMCs.
Strategic focus indicators will monitor key aspects of strategic programming, as well as track the use of
resources in terms of strategic objectives. Progress on implementation of measures to strengthen
institutional capacity and to ensure the relevance of the organisation to its client base will be monitored
through indicators grouped under capacity utilisation, use of administrative budget resources, and
business processes and practices.
BOX 3: LEVEL 3 – OPERATIONAL ORGANISATIONAL EFFECTIVENESS
Indicators Baseline Year Baseline
Value
Target
(2012)
Operational Quality and Portfolio Performance
1. Portfolio performance rating for implementation (% satisfactory) 2007 96 98
2. Percentage of projects completed in past two years with Project Completion Reports. 2006-2007 0 100
3. Percentage of projects with supervision reports on Project Performance Monitoring System 2007 61 100
Resource Allocation and Utilisation
4. Percentage of concessional resources allocated according to performance-based allocation system. 2005 61 70
5. Disbursement rate. 2007 28 35
6. Disbursement efficiency ratio. 2007 93 98
Strategic Focus
7. Number of approved country strategies in use with results framework. 2008 2 18
8. Number of new or updated CPAs for BMCs in past 5 years. 2004-2008 8 10
9. Proportion of financing supporting environmental sustainability and climate change % 2007 10 15-20
10. Proportion of financing supporting regional cooperation and development. 2007 4 6-8
11. Proportion of financing supporting gender equality. 2007 0 n.y.a.
12. Proportion of financing supporting private sector development. 2007 10 15
13. Number of BMCs receiving support for direct poverty reduction programming. 2007 11 11
Capacity Utilisation
14. Percentage of budgeted Bank professional staff in operations departments. 2008 62.4 70
15. Ratio of professional staff to support staff. 2008 1.1:1 1.2:1
16. Representation of women in professional staff. 2008 30.1 40
17. Representation of women in middle and senior management positions. 2008 38.1 45
Use of Administrative Budget Resources
18. Administrative expenses per $ mn as a % of loan project approvals (3 year average). 2005 -2007 13 14
19. Administrative expenses per $ mn as a % of loan project disbursements (3 year average). 2005 -2007 15 16
20. Administrative expenses per $ mn as a % loan projects under implementation (3 year average). 2005 -2007 2 2
Business Processes and Practices
21. Average time from loan approval to first disbursement in public sector operations (months). 2007 18 12
22. Average loan processing time (months from appraisal mission to project approval) in public sector
operations. 2007 6.7 5
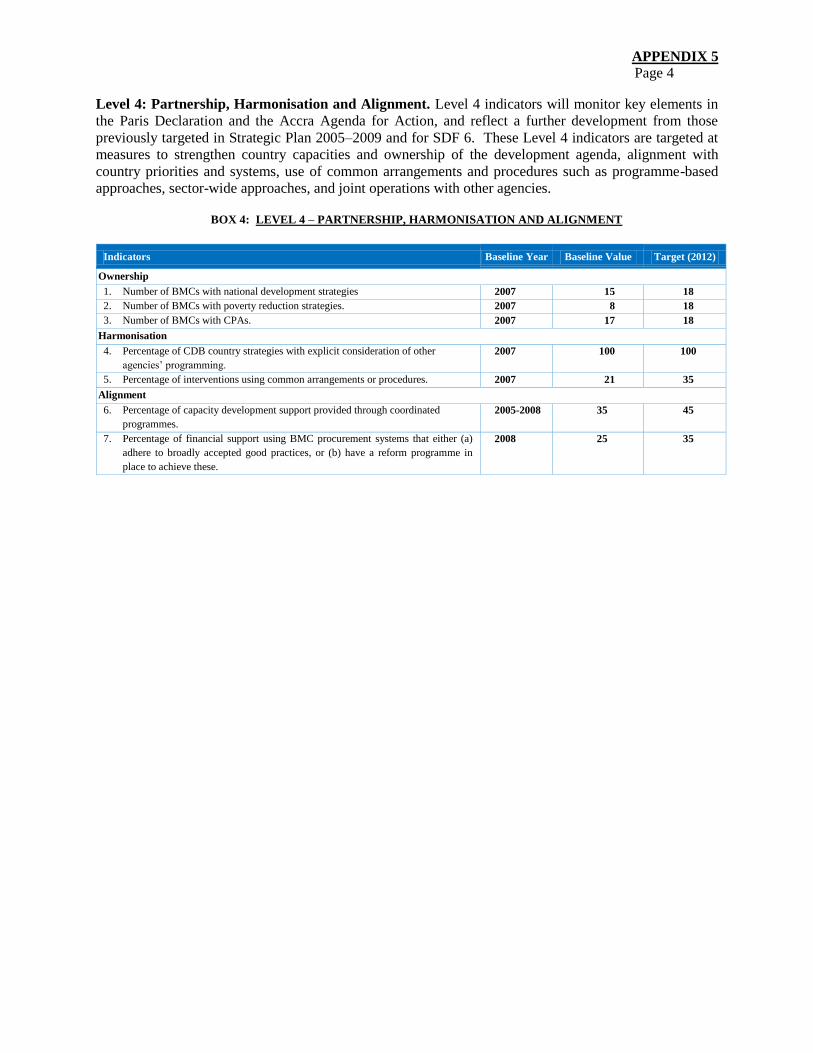
APPENDIX 5
Page 4
Level 4: Partnership, Harmonisation and Alignment. Level 4 indicators will monitor key elements in
the Paris Declaration and the Accra Agenda for Action, and reflect a further development from those
previously targeted in Strategic Plan 2005–2009 and for SDF 6. These Level 4 indicators are targeted at
measures to strengthen country capacities and ownership of the development agenda, alignment with
country priorities and systems, use of common arrangements and procedures such as programme-based
approaches, sector-wide approaches, and joint operations with other agencies.
BOX 4: LEVEL 4 – PARTNERSHIP, HARMONISATION AND ALIGNMENT
Indicators Baseline Year Baseline Value Target (2012)
Ownership
1. Number of BMCs with national development strategies 2007 15 18
2. Number of BMCs with poverty reduction strategies. 2007 8 18
3. Number of BMCs with CPAs. 2007 17 18
Harmonisation
4. Percentage of CDB country strategies with explicit consideration of other
agencies‟ programming.
2007 100 100
5. Percentage of interventions using common arrangements or procedures. 2007 21 35
Alignment
6. Percentage of capacity development support provided through coordinated
programmes.
2005-2008 35 45
7. Percentage of financial support using BMC procurement systems that either (a)
adhere to broadly accepted good practices, or (b) have a reform programme in
place to achieve these.
2008 25 35
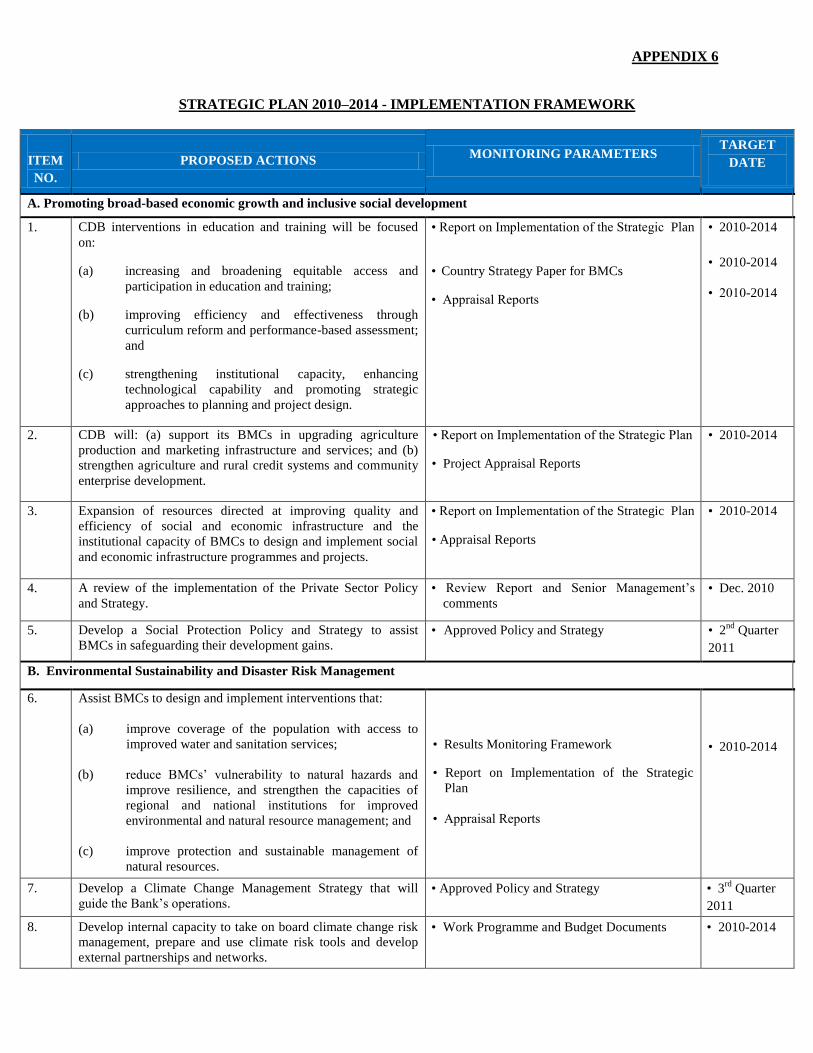
APPENDIX 6
STRATEGIC PLAN 2010–2014 - IMPLEMENTATION FRAMEWORK
ITEM
NO.
PROPOSED ACTIONS MONITORING PARAMETERS
TARGET
DATE
A. Promoting broad-based economic growth and inclusive social development
1. CDB interventions in education and training will be focused
on:
(a) increasing and broadening equitable access and
participation in education and training;
(b) improving efficiency and effectiveness through
curriculum reform and performance-based assessment;
and
(c) strengthening institutional capacity, enhancing
technological capability and promoting strategic
approaches to planning and project design.
• Report on Implementation of the Strategic Plan
• Country Strategy Paper for BMCs
• Appraisal Reports
• 2010-2014
• 2010-2014
• 2010-2014
2. CDB will: (a) support its BMCs in upgrading agriculture
production and marketing infrastructure and services; and (b)
strengthen agriculture and rural credit systems and community
enterprise development.
• Report on Implementation of the Strategic Plan
• Project Appraisal Reports
• 2010-2014
3. Expansion of resources directed at improving quality and
efficiency of social and economic infrastructure and the
institutional capacity of BMCs to design and implement social
and economic infrastructure programmes and projects.
• Report on Implementation of the Strategic Plan
• Appraisal Reports
• 2010-2014
4. A review of the implementation of the Private Sector Policy
and Strategy.
• Review Report and Senior Management‟s
comments
• Dec. 2010
5. Develop a Social Protection Policy and Strategy to assist
BMCs in safeguarding their development gains.
• Approved Policy and Strategy • 2nd
Quarter
2011
B. Environmental Sustainability and Disaster Risk Management
6. Assist BMCs to design and implement interventions that:
(a) improve coverage of the population with access to
improved water and sanitation services;
(b) reduce BMCs‟ vulnerability to natural hazards and
improve resilience, and strengthen the capacities of
regional and national institutions for improved
environmental and natural resource management; and
(c) improve protection and sustainable management of
natural resources.
• Results Monitoring Framework
• Report on Implementation of the Strategic
Plan
• Appraisal Reports
• 2010-2014
7.
Develop a Climate Change Management Strategy that will
guide the Bank‟s operations.
• Approved Policy and Strategy • 3rd
Quarter
2011
8.
Develop internal capacity to take on board climate change risk
management, prepare and use climate risk tools and develop
external partnerships and networks.
• Work Programme and Budget Documents • 2010-2014
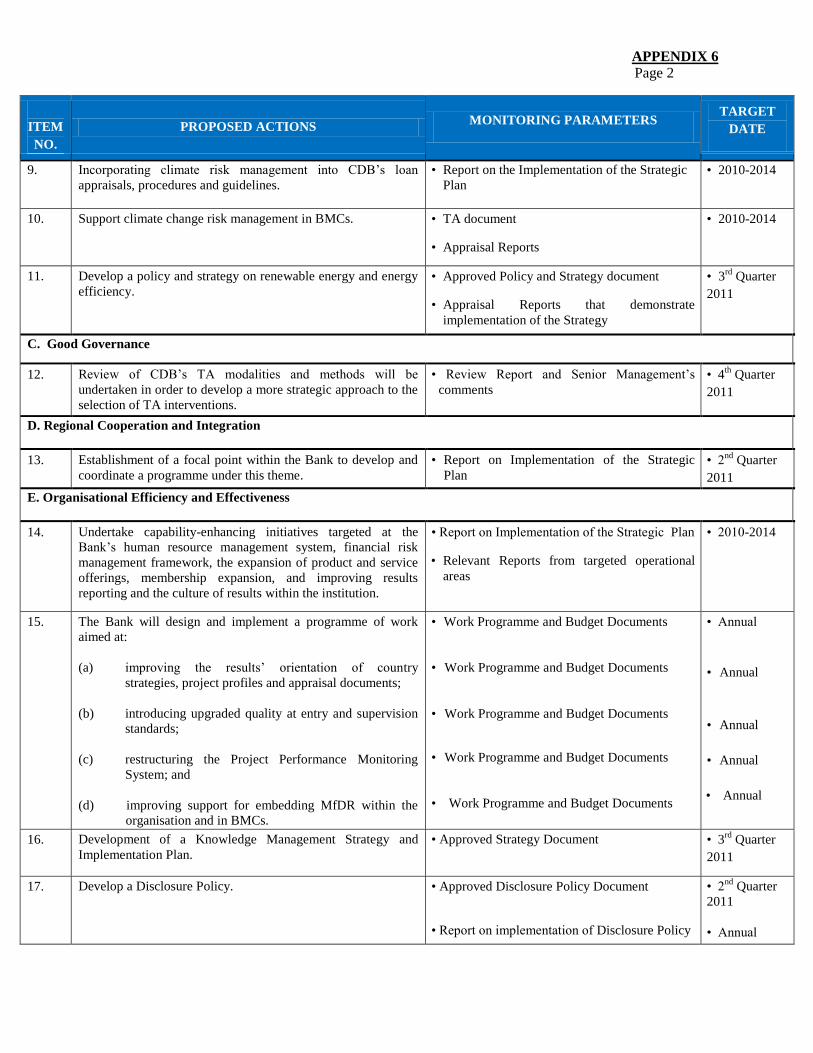
APPENDIX 6
Page 2
ITEM
NO.
PROPOSED ACTIONS MONITORING PARAMETERS
TARGET
DATE
9.
Incorporating climate risk management into CDB‟s loan
appraisals, procedures and guidelines.
• Report on the Implementation of the Strategic
Plan
• 2010-2014
10.
Support climate change risk management in BMCs.
• TA document
• Appraisal Reports
• 2010-2014
11. Develop a policy and strategy on renewable energy and energy
efficiency.
• Approved Policy and Strategy document
• Appraisal Reports that demonstrate
implementation of the Strategy
• 3rd
Quarter
2011
C. Good Governance
12. Review of CDB‟s TA modalities and methods will be
undertaken in order to develop a more strategic approach to the
selection of TA interventions.
• Review Report and Senior Management‟s
comments
• 4th
Quarter
2011
D. Regional Cooperation and Integration
13. Establishment of a focal point within the Bank to develop and
coordinate a programme under this theme.
• Report on Implementation of the Strategic
Plan
• 2nd
Quarter
2011
E. Organisational Efficiency and Effectiveness
14. Undertake capability-enhancing initiatives targeted at the
Bank‟s human resource management system, financial risk
management framework, the expansion of product and service
offerings, membership expansion, and improving results
reporting and the culture of results within the institution.
• Report on Implementation of the Strategic Plan
• Relevant Reports from targeted operational
areas
• 2010-2014
15. The Bank will design and implement a programme of work
aimed at:
(a) improving the results‟ orientation of country
strategies, project profiles and appraisal documents;
(b) introducing upgraded quality at entry and supervision
standards;
(c) restructuring the Project Performance Monitoring
System; and
(d) improving support for embedding MfDR within the
organisation and in BMCs.
• Work Programme and Budget Documents
• Work Programme and Budget Documents
• Work Programme and Budget Documents
• Work Programme and Budget Documents
• Work Programme and Budget Documents
• Annual
• Annual
• Annual
• Annual
• Annual
16. Development of a Knowledge Management Strategy and
Implementation Plan.
• Approved Strategy Document • 3rd
Quarter
2011
17. Develop a Disclosure Policy. • Approved Disclosure Policy Document
• Report on implementation of Disclosure Policy
• 2nd
Quarter
2011
• Annual
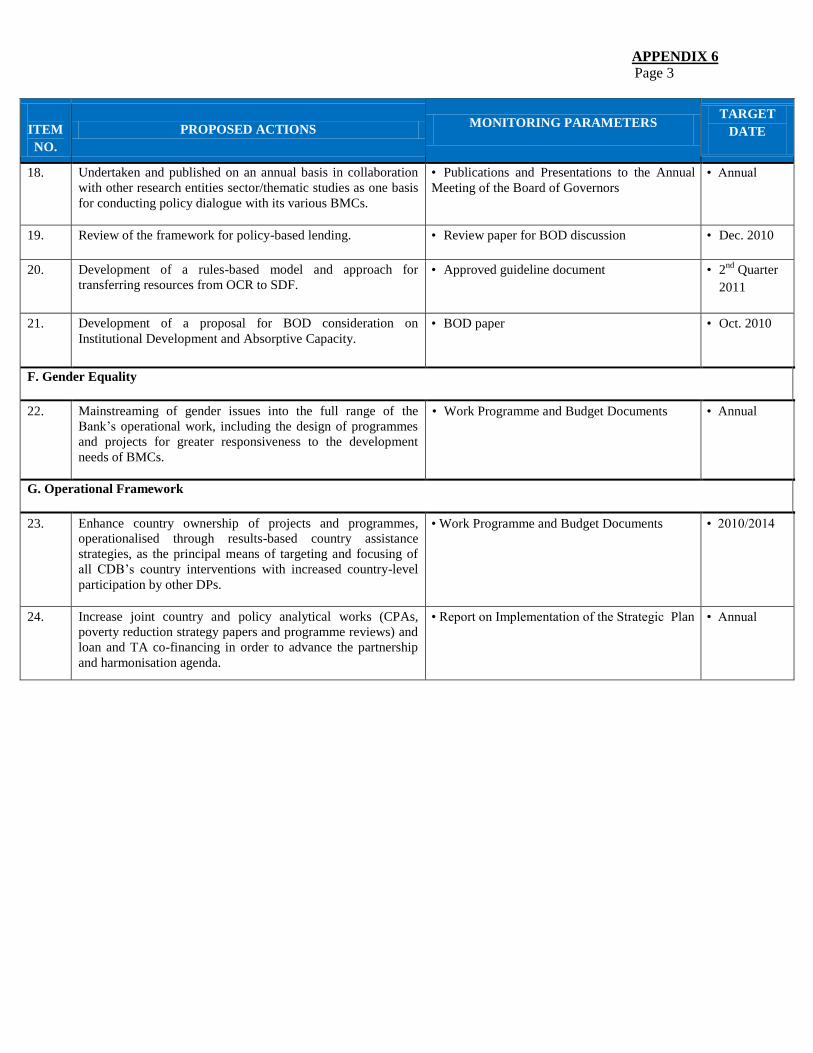
APPENDIX 6
Page 3
ITEM
NO.
PROPOSED ACTIONS MONITORING PARAMETERS
TARGET
DATE
18. Undertaken and published on an annual basis in collaboration
with other research entities sector/thematic studies as one basis
for conducting policy dialogue with its various BMCs.
• Publications and Presentations to the Annual
Meeting of the Board of Governors
• Annual
19. Review of the framework for policy-based lending. • Review paper for BOD discussion • Dec. 2010
20. Development of a rules-based model and approach for
transferring resources from OCR to SDF.
• Approved guideline document • 2nd
Quarter
2011
21. Development of a proposal for BOD consideration on
Institutional Development and Absorptive Capacity.
• BOD paper • Oct. 2010
F. Gender Equality
22. Mainstreaming of gender issues into the full range of the
Bank‟s operational work, including the design of programmes
and projects for greater responsiveness to the development
needs of BMCs.
• Work Programme and Budget Documents • Annual
G. Operational Framework
23. Enhance country ownership of projects and programmes,
operationalised through results-based country assistance
strategies, as the principal means of targeting and focusing of
all CDB‟s country interventions with increased country-level
participation by other DPs.
• Work Programme and Budget Documents • 2010/2014
24. Increase joint country and policy analytical works (CPAs,
poverty reduction strategy papers and programme reviews) and
loan and TA co-financing in order to advance the partnership
and harmonisation agenda.
• Report on Implementation of the Strategic Plan
• Annual