Embed Size (px)
Citation preview
Potential Further Uses
Test Case: Green Amenity Space in Manchester
George Gibbs BEng(hons) MSc CEng MIoA MIEnvSc
Davide Vinci BEng(hons) MSc AMIoA
Strategic Noise Mapping
Introduction
Scope
- Strategic noise mapping – what is it?
- What are the existing applications?
- What's next?
- Test Case – Green Amenity Space in Manchester
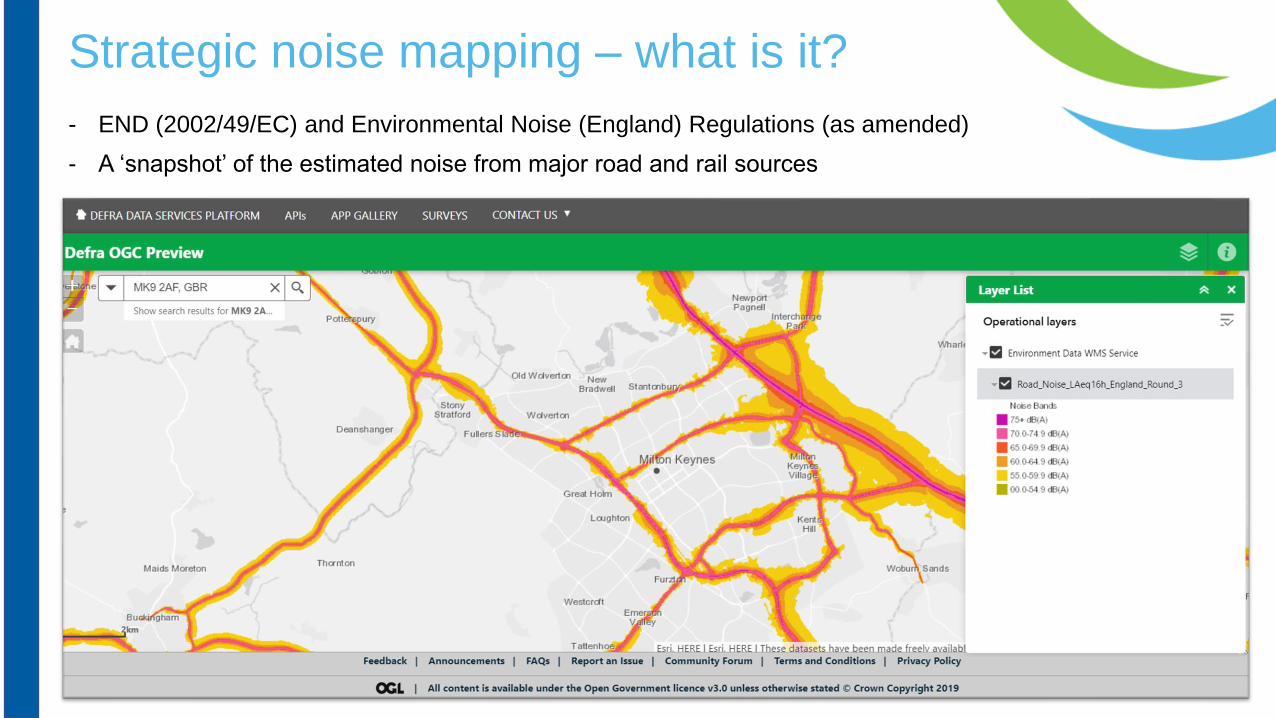
Strategic noise mapping – what is it?
- END (2002/49/EC) and Environmental Noise (England) Regulations (as amended)
- A ‘snapshot’ of the estimated noise from major road and rail sources
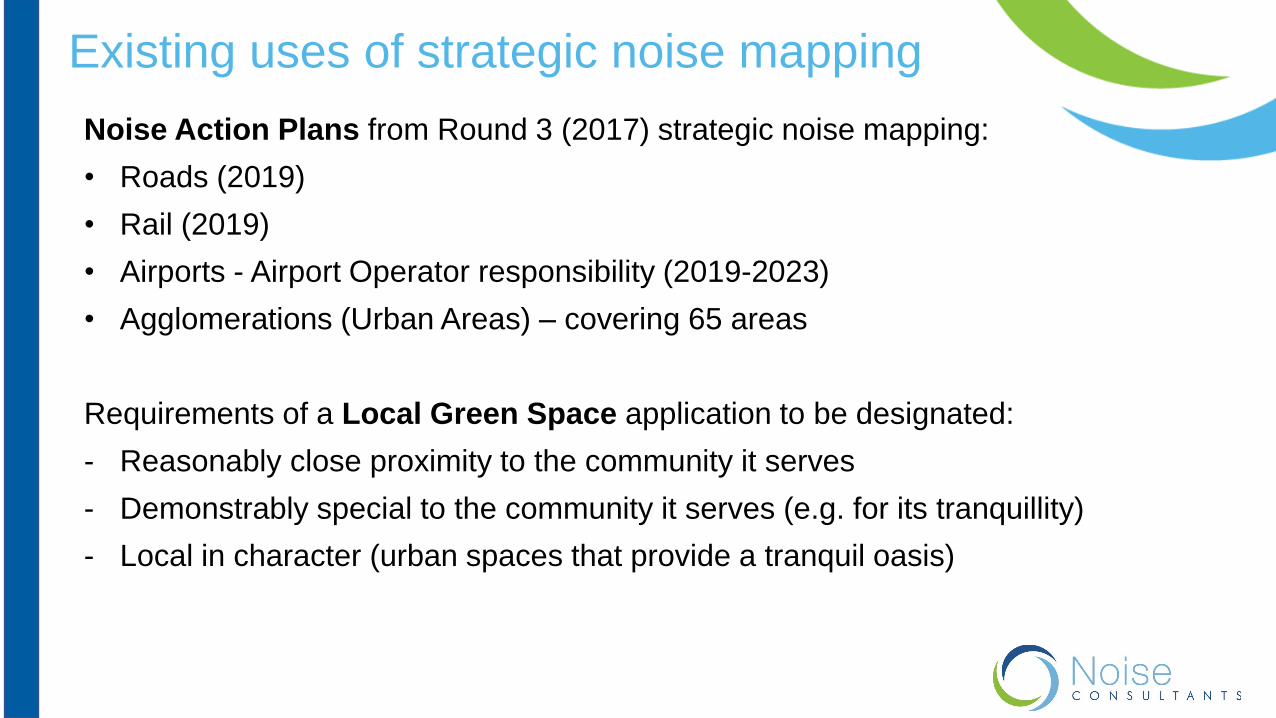
Existing uses of strategic noise mapping
Noise Action Plans from Round 3 (2017) strategic noise mapping:
• Roads (2019)
• Rail (2019)
• Airports - Airport Operator responsibility (2019-2023)
• Agglomerations (Urban Areas) – covering 65 areas
Requirements of a Local Green Space application to be designated:
- Reasonably close proximity to the community it serves
- Demonstrably special to the community it serves (e.g. for its tranquillity)
- Local in character (urban spaces that provide a tranquil oasis)
Existing uses of strategic noise mapping
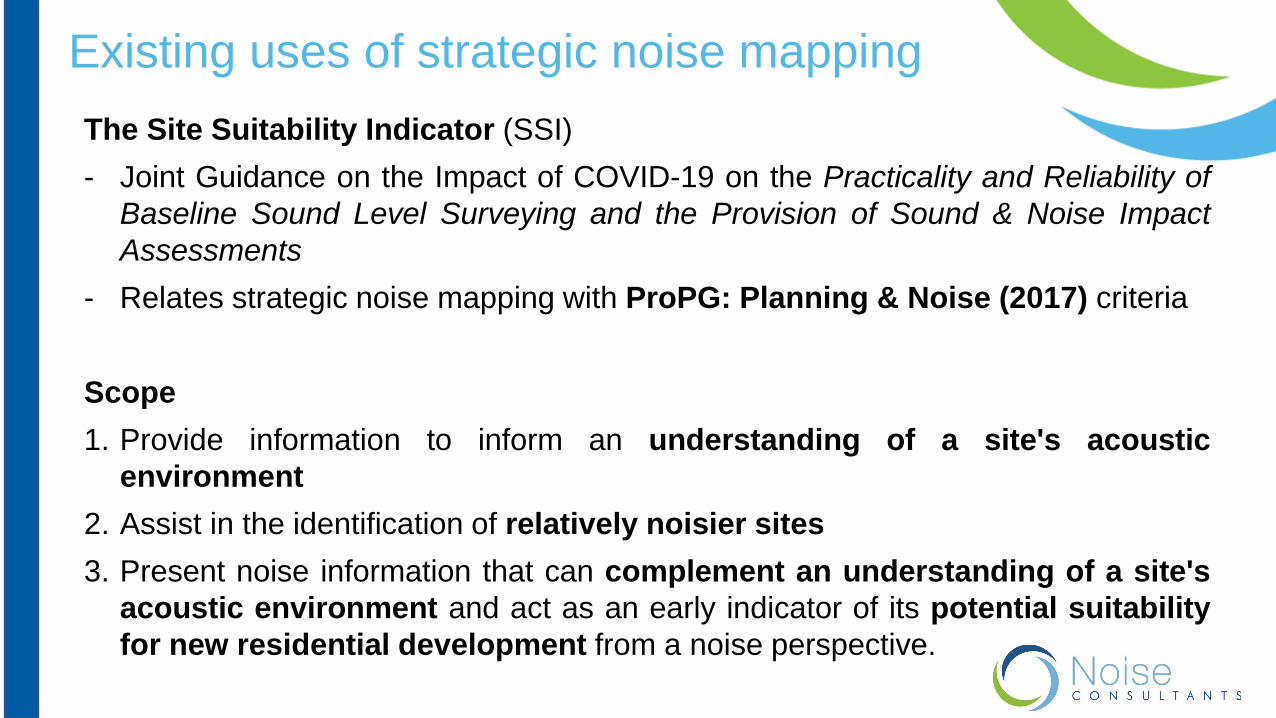
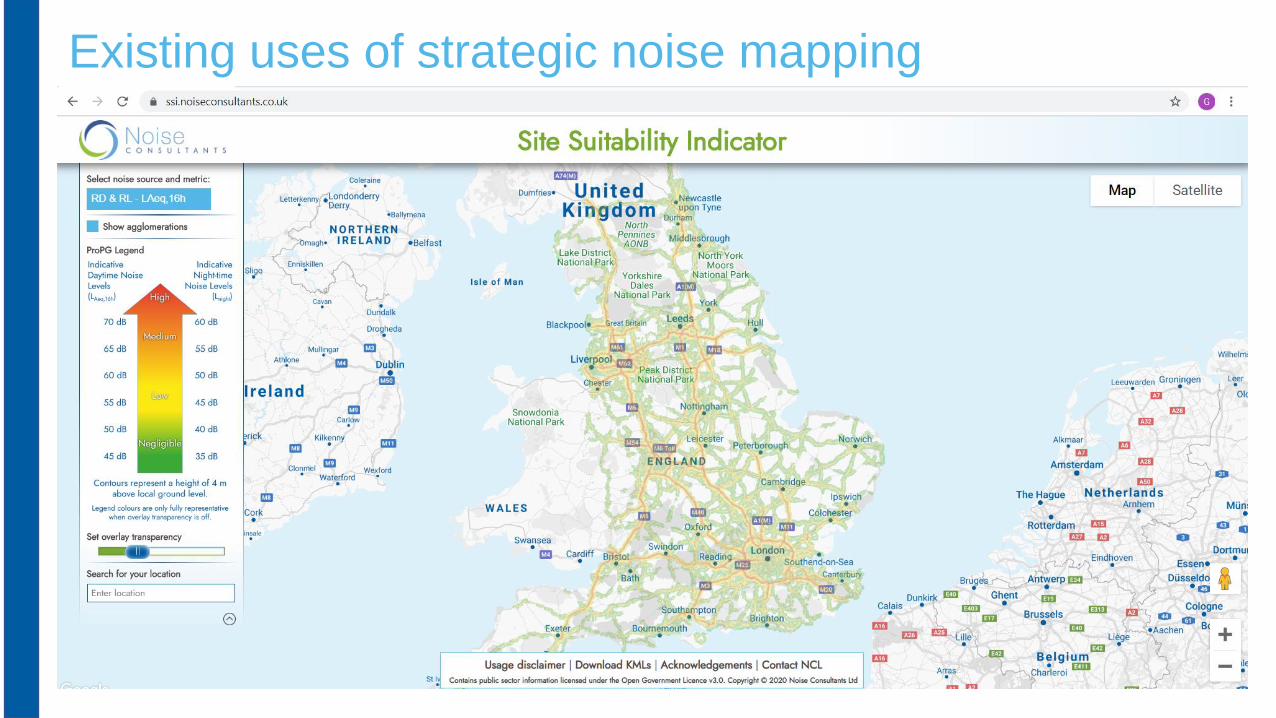
The Site Suitability Indicator (SSI)
- Joint Guidance on the Impact of COVID-19 on the Practicality and Reliability of
Baseline Sound Level Surveying and the Provision of Sound & Noise Impact
Assessments
- Relates strategic noise mapping with ProPG: Planning & Noise (2017) criteria
Scope
1. Provide information to inform an understanding of a site's acoustic
environment
2. Assist in the identification of relatively noisier sites
3. Present noise information that can complement an understanding of a site's
acoustic environment and act as an early indicator of its potential suitability
for new residential development from a noise perspective.
Existing uses of strategic noise mapping
Existing uses of strategic noise mapping
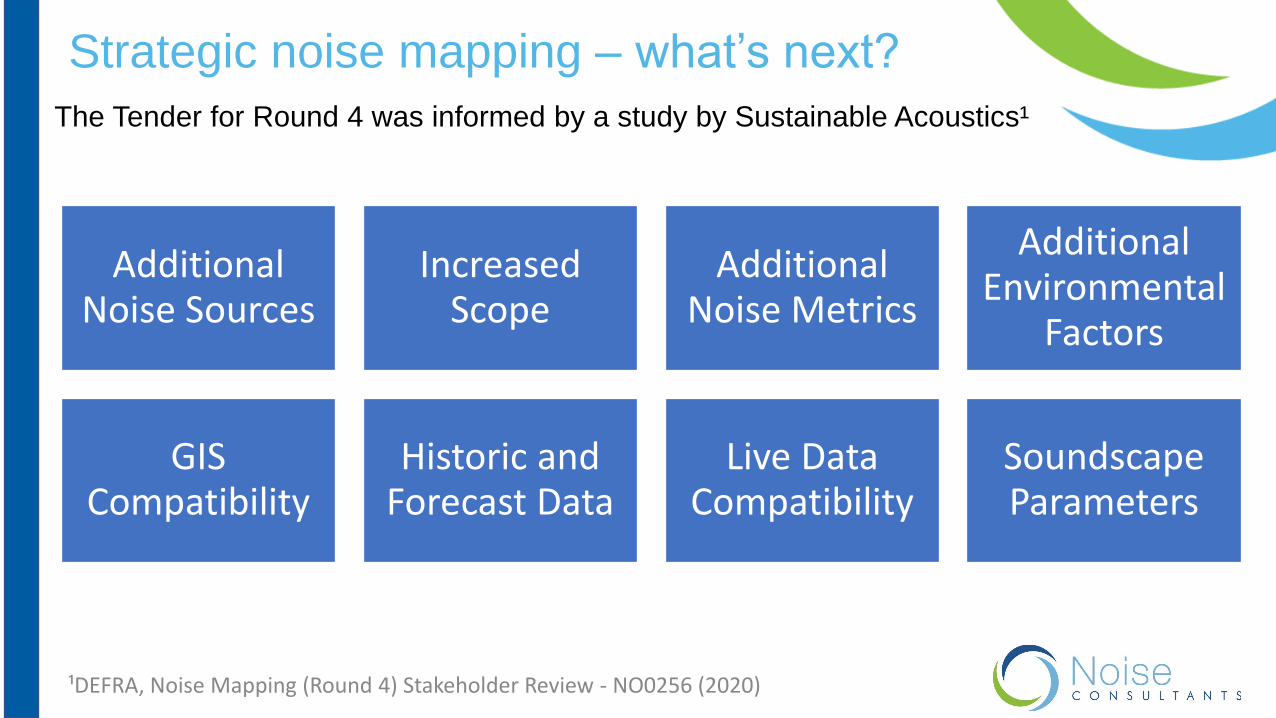
Strategic noise mapping – what’s next?
The Tender for Round 4 was informed by a study by Sustainable Acoustics¹
¹DEFRA, Noise Mapping (Round 4) Stakeholder Review - NO0256 (2020)
Additional Noise Sources
Increased Scope
Additional Noise Metrics
Additional Environmental
Factors
GIS Compatibility
Historic and Forecast Data
Live Data Compatibility
Soundscape Parameters
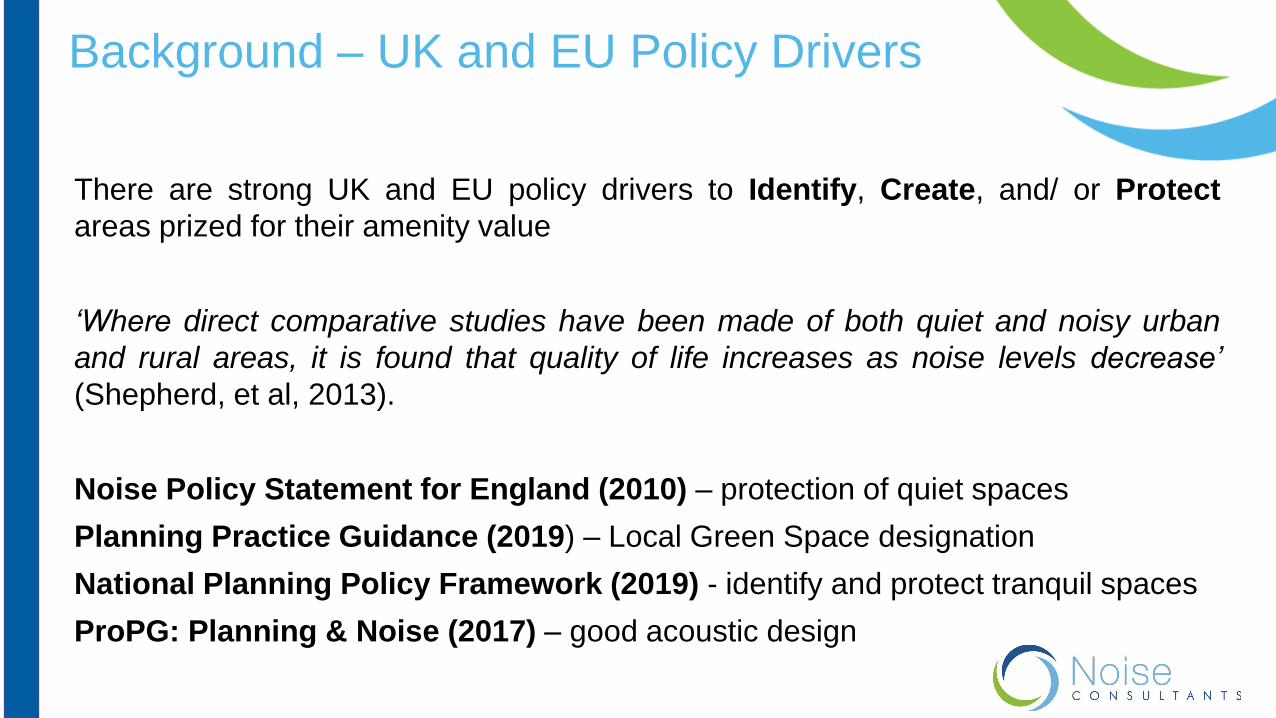
Background – UK and EU Policy Drivers
There are strong UK and EU policy drivers to Identify, Create, and/ or Protect
areas prized for their amenity value
‘Where direct comparative studies have been made of both quiet and noisy urban
and rural areas, it is found that quality of life increases as noise levels decrease’
(Shepherd, et al, 2013).
Noise Policy Statement for England (2010) – protection of quiet spaces
Planning Practice Guidance (2019) – Local Green Space designation
National Planning Policy Framework (2019) - identify and protect tranquil spaces
ProPG: Planning & Noise (2017) – good acoustic design
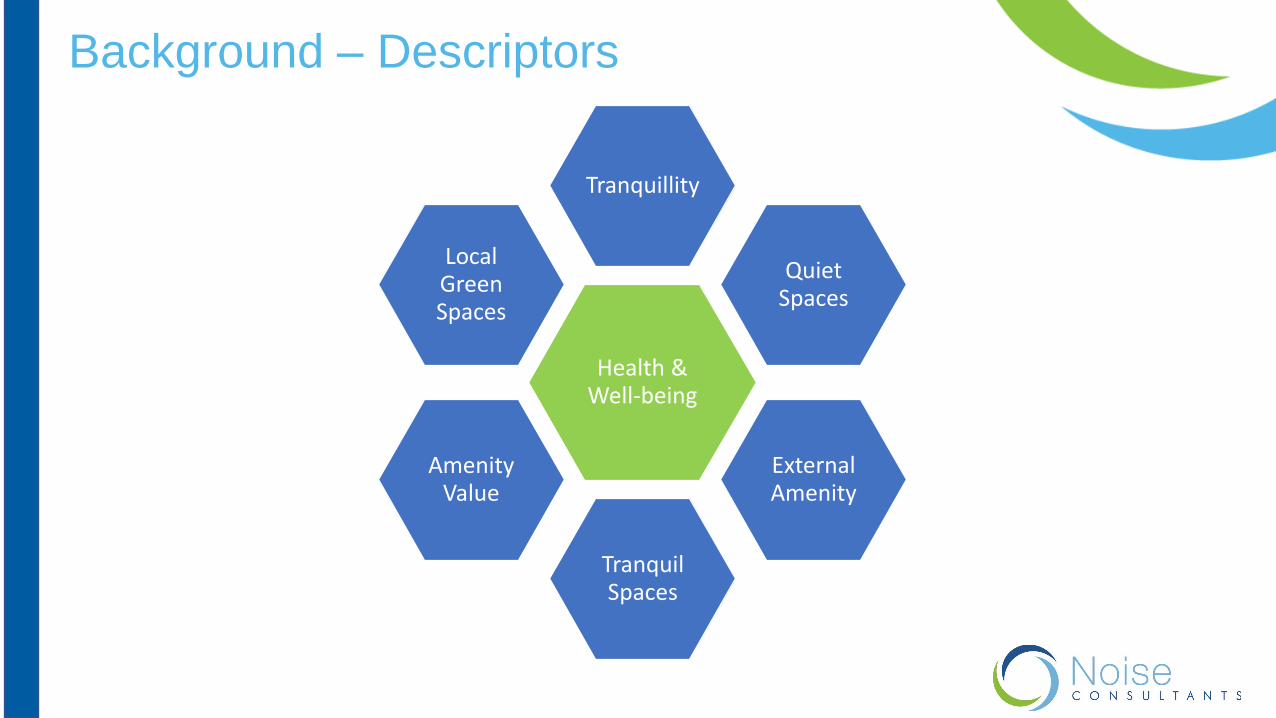
Background – Descriptors
Health & Well-being
Tranquillity
Quiet Spaces
External Amenity
Tranquil Spaces
Amenity Value
Local Green Spaces
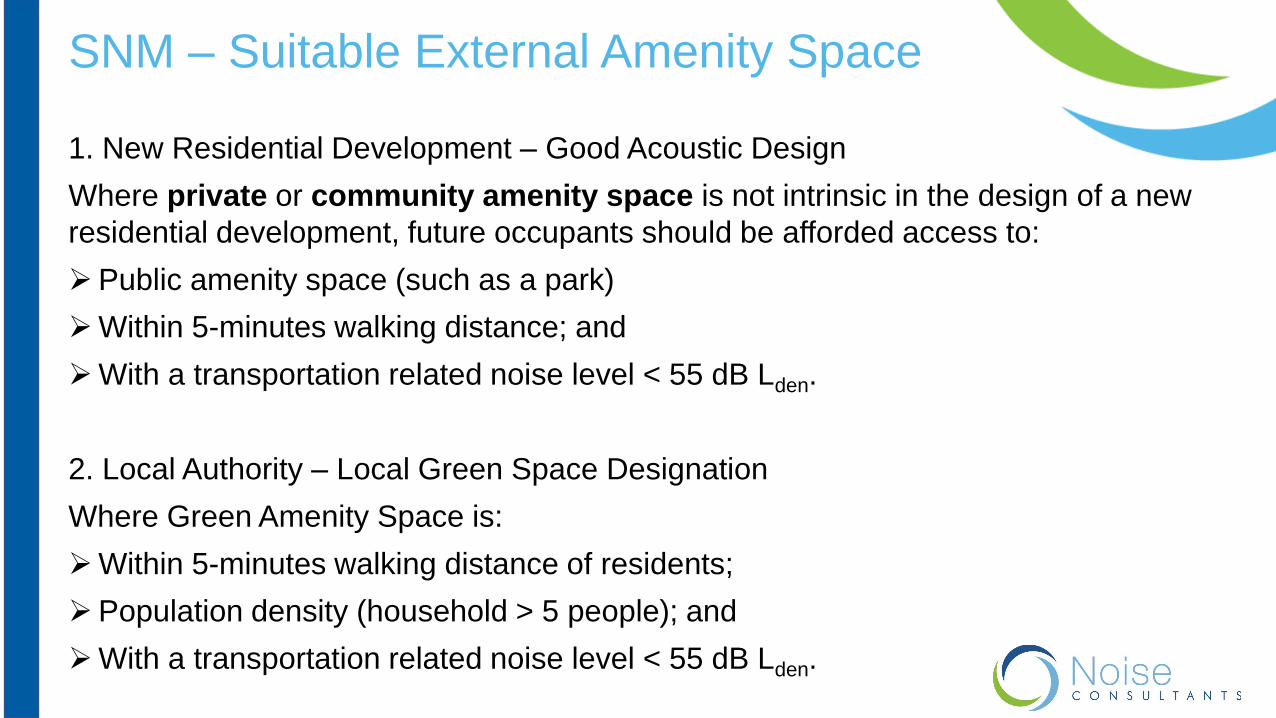
SNM – Suitable External Amenity Space
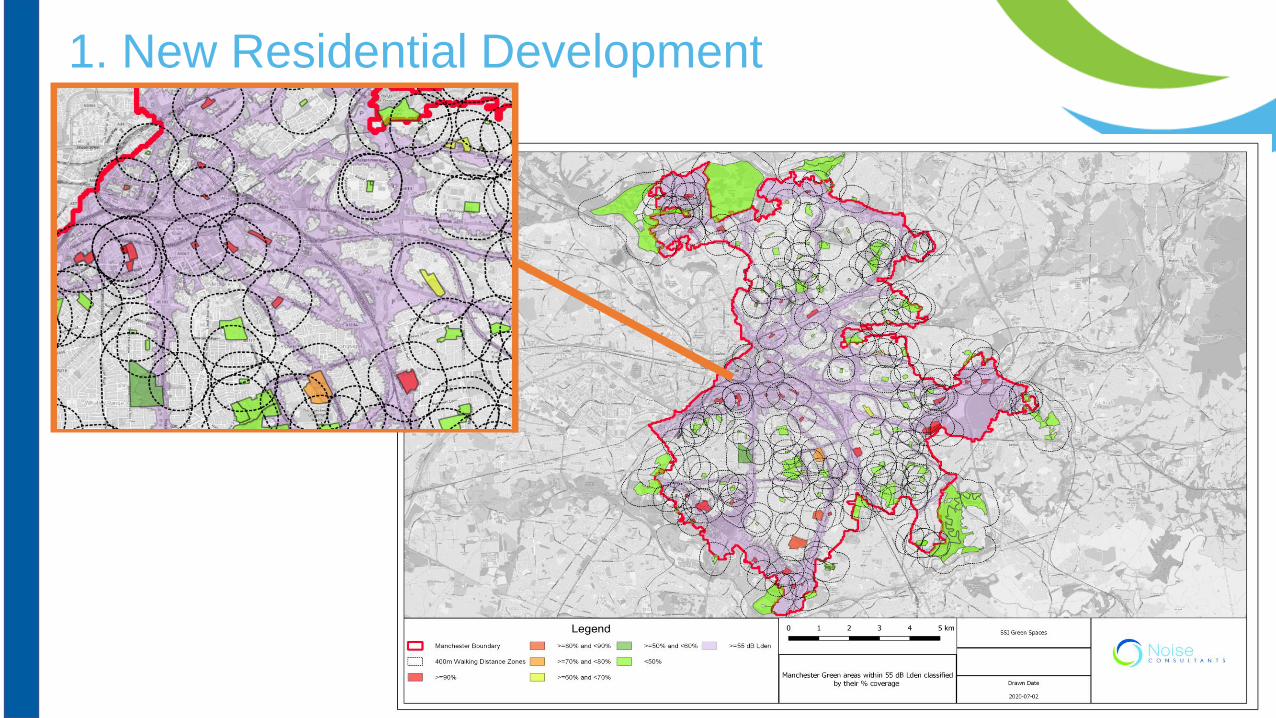
1. New Residential Development – Good Acoustic Design
Where private or community amenity space is not intrinsic in the design of a new
residential development, future occupants should be afforded access to:
➢Public amenity space (such as a park)
➢Within 5-minutes walking distance; and
➢With a transportation related noise level < 55 dB Lden.
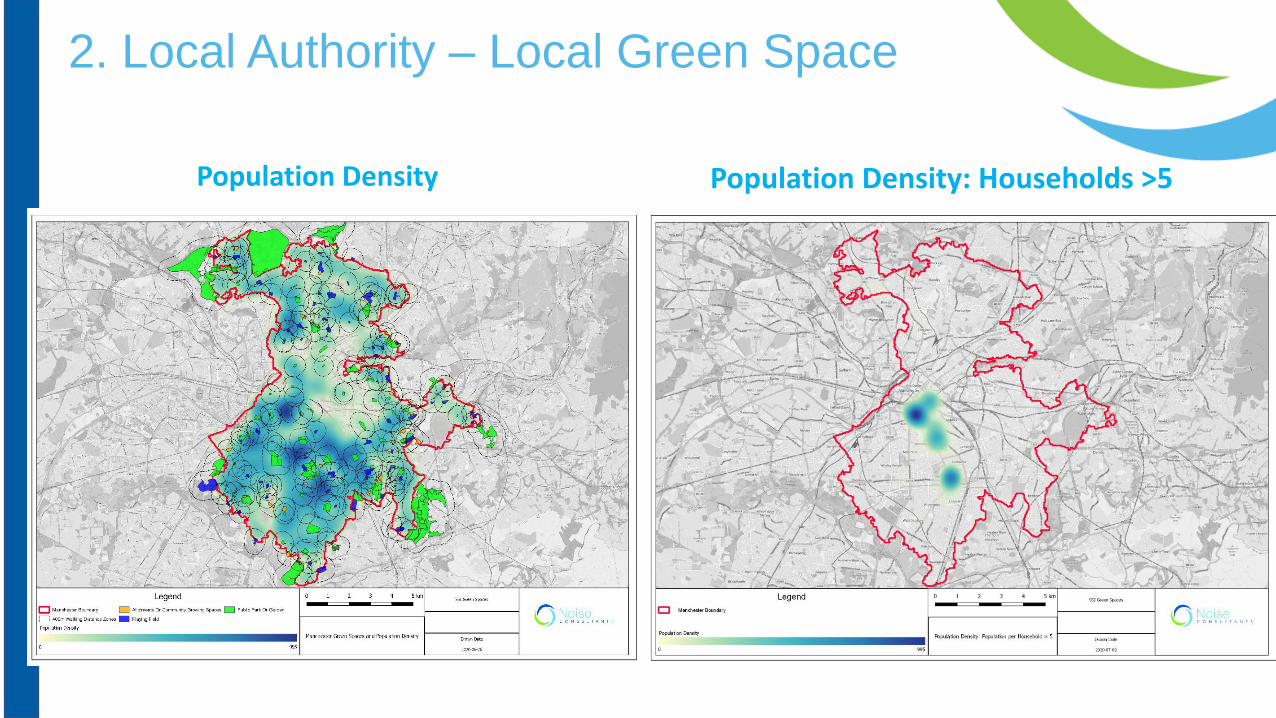
2. Local Authority – Local Green Space Designation
Where Green Amenity Space is:
➢Within 5-minutes walking distance of residents;
➢Population density (household > 5 people); and
➢With a transportation related noise level < 55 dB Lden.
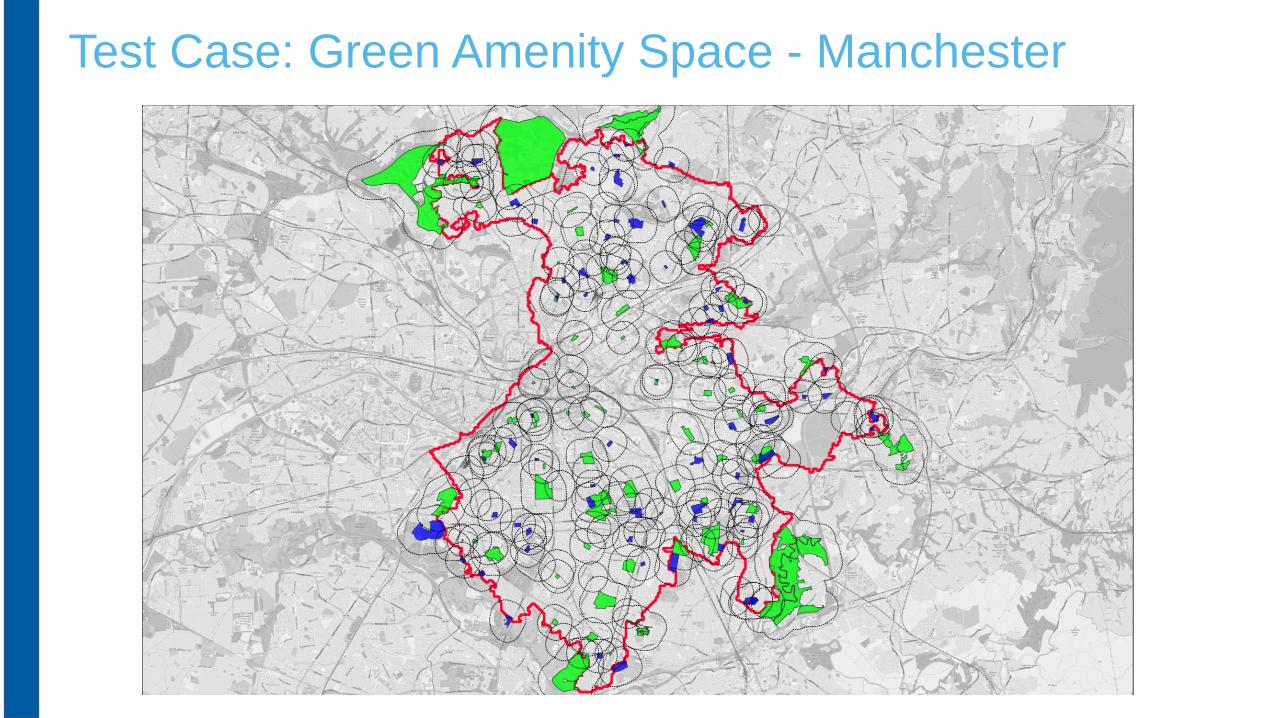
Test Case: Green Amenity Space - Manchester
1. New Residential Development
2. Local Authority – Local Green Space
Population Density Population Density: Households >5
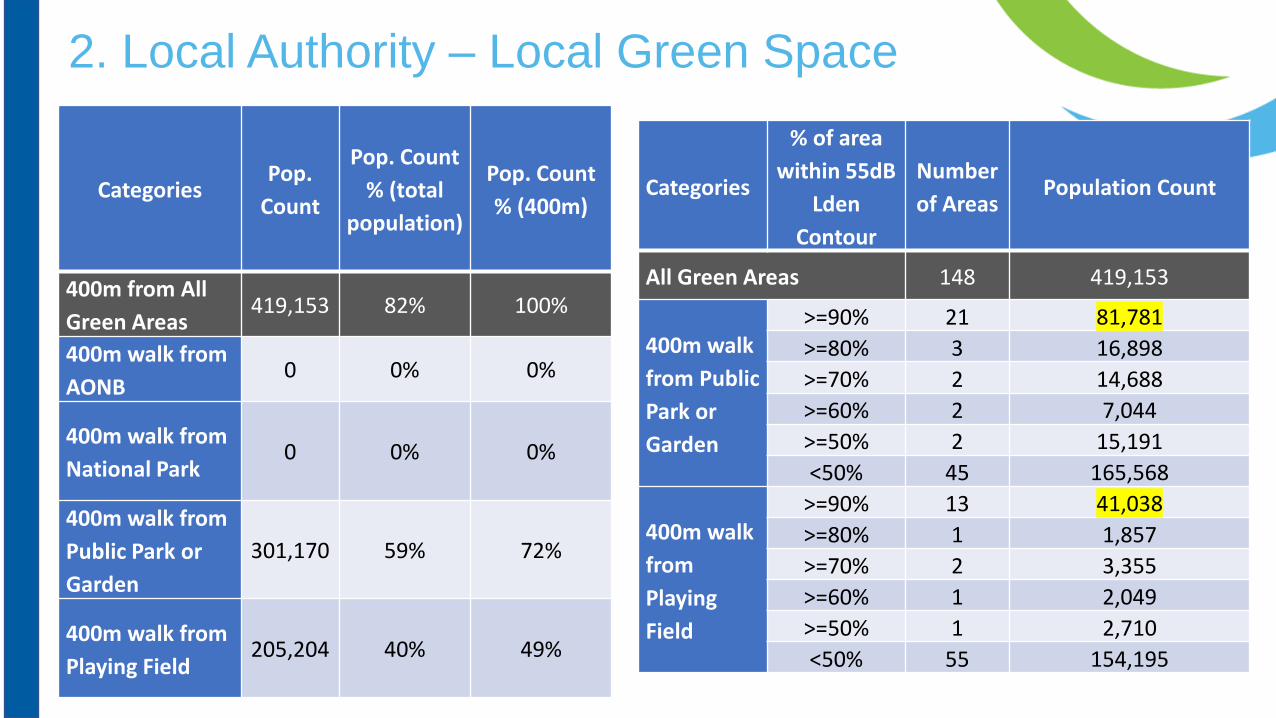
2. Local Authority – Local Green Space
CategoriesPop.
Count
Pop. Count
% (total
population)
Pop. Count
% (400m)
400m from All
Green Areas419,153 82% 100%
400m walk from
AONB0 0% 0%
400m walk from
National Park0 0% 0%
400m walk from
Public Park or
Garden
301,170 59% 72%
400m walk from
Playing Field205,204 40% 49%
Categories
% of area
within 55dB
Lden
Contour
Number
of AreasPopulation Count
All Green Areas 148 419,153
400m walk
from Public
Park or
Garden
>=90% 21 81,781
>=80% 3 16,898
>=70% 2 14,688
>=60% 2 7,044
>=50% 2 15,191
<50% 45 165,568
400m walk
from
Playing
Field
>=90% 13 41,038
>=80% 1 1,857
>=70% 2 3,355
>=60% 1 2,049
>=50% 1 2,710
<50% 55 154,195
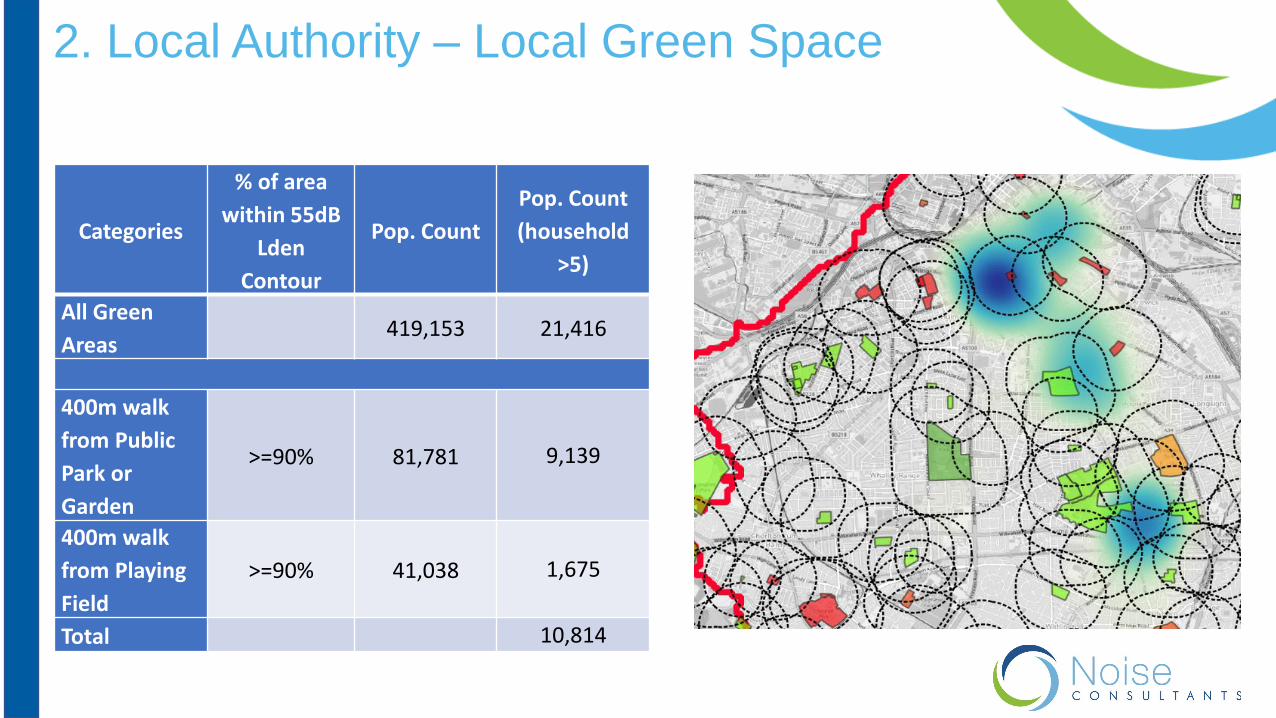
2. Local Authority – Local Green Space
Categories
% of area
within 55dB
Lden
Contour
Pop. Count
Pop. Count
(household
>5)
All Green
Areas419,153 21,416
400m walk
from Public
Park or
Garden
>=90% 81,781 9,139
400m walk
from Playing
Field
>=90% 41,038 1,675
Total 10,814
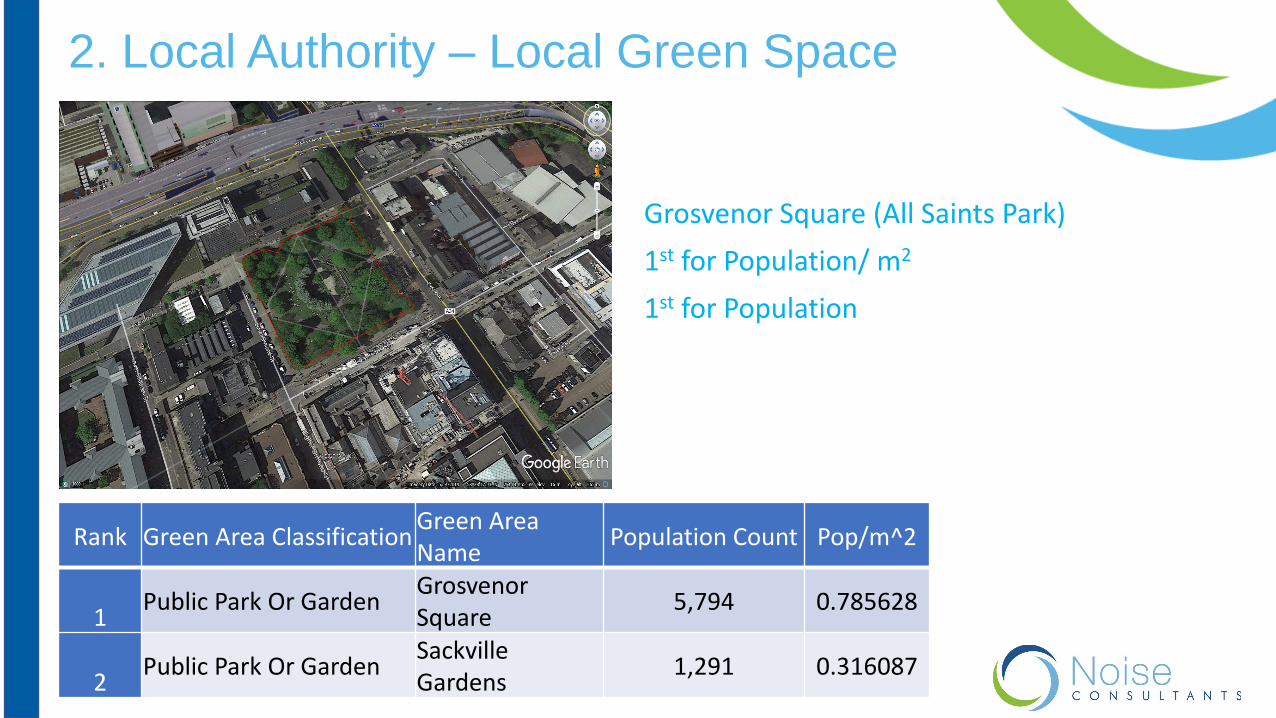
2. Local Authority – Local Green Space
Grosvenor Square (All Saints Park)
1st for Population/ m2
1st for Population
Rank Green Area ClassificationGreen Area Name
Population Count Pop/m^2
1Public Park Or Garden
Grosvenor Square
5,794 0.785628
2Public Park Or Garden
Sackville Gardens
1,291 0.316087
London Office119 Marylebone Road, London, NW1 5PU
Bristol Office23 Coldharbour Road, Bristol BS6 7JT
Warrington Office6 Bankside, Crosfield Street, Warrington, WA1 1UD