Embed Size (px)
Citation preview
Strategic nitrogen management in stockless organic cropping systems
Redistribution of residual biomass for improved
energy and nitrogen balance
Tora Råberg Faculty of Landscape Architecture, Horticulture and Crop Production Science
Department of Biosystems and Technology
Alnarp
Doctoral thesis
Swedish University of Agricultural Sciences
Alnarp 2017
Acta Universitatis agriculturae Sueciae
2017:102
ISSN 1652-6880
ISBN (print version) 978-91-7760-094-7
ISBN (electronic version) 978-91-7760-095-4
© 2017 Tora Råberg, Alnarp
Print: SLU Service/Repro, Alnarp 2017
Cover: Re-circulation of biomass, nutrients and energy between the farm and the
city (Illustration by Christel Lindgren, 2017).
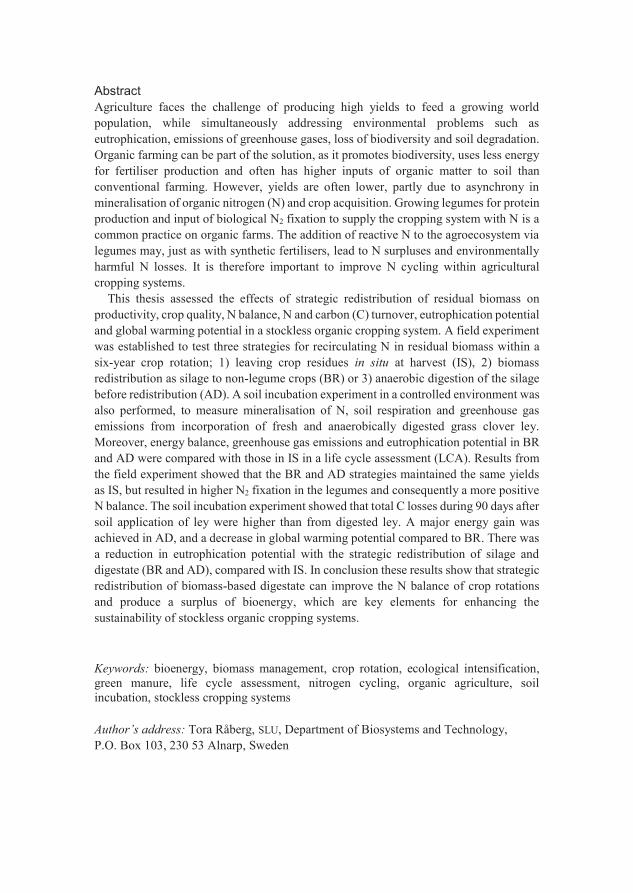
Agriculture faces the challenge of producing high yields to feed a growing world
population, while simultaneously addressing environmental problems such as
eutrophication, emissions of greenhouse gases, loss of biodiversity and soil degradation.
Organic farming can be part of the solution, as it promotes biodiversity, uses less energy
for fertiliser production and often has higher inputs of organic matter to soil than
conventional farming. However, yields are often lower, partly due to asynchrony in
mineralisation of organic nitrogen (N) and crop acquisition. Growing legumes for protein
production and input of biological N2 fixation to supply the cropping system with N is a
common practice on organic farms. The addition of reactive N to the agroecosystem via
legumes may, just as with synthetic fertilisers, lead to N surpluses and environmentally
harmful N losses. It is therefore important to improve N cycling within agricultural
cropping systems.
This thesis assessed the effects of strategic redistribution of residual biomass on
productivity, crop quality, N balance, N and carbon (C) turnover, eutrophication potential
and global warming potential in a stockless organic cropping system. A field experiment
was established to test three strategies for recirculating N in residual biomass within a
six-year crop rotation; 1) leaving crop residues in situ at harvest (IS), 2) biomass
redistribution as silage to non-legume crops (BR) or 3) anaerobic digestion of the silage
before redistribution (AD). A soil incubation experiment in a controlled environment was
also performed, to measure mineralisation of N, soil respiration and greenhouse gas
emissions from incorporation of fresh and anaerobically digested grass clover ley.
Moreover, energy balance, greenhouse gas emissions and eutrophication potential in BR
and AD were compared with those in IS in a life cycle assessment (LCA). Results from
the field experiment showed that the BR and AD strategies maintained the same yields
as IS, but resulted in higher N2 fixation in the legumes and consequently a more positive
N balance. The soil incubation experiment showed that total C losses during 90 days after
soil application of ley were higher than from digested ley. A major energy gain was
achieved in AD, and a decrease in global warming potential compared to BR. There was
a reduction in eutrophication potential with the strategic redistribution of silage and
digestate (BR and AD), compared with IS. In conclusion these results show that strategic
redistribution of biomass-based digestate can improve the N balance of crop rotations
and produce a surplus of bioenergy, which are key elements for enhancing the
sustainability of stockless organic cropping systems.
Keywords: bioenergy, biomass management, crop rotation, ecological intensification,
green manure, life cycle assessment, nitrogen cycling, organic agriculture, soil
incubation, stockless cropping systems
Author’s address: Tora Råberg, SLU, Department of Biosystems and Technology,
P.O. Box 103, 230 53 Alnarp, Sweden
Abstract
Sammanfattning
Jordbruket står inför utmaningen att föda en växande världsbefolkning samtidigt som det
behöver göras åtgärder för att minska relaterade miljöproblem som övergödning, utsläpp
av växthusgaser, förlust av biologisk mångfald och markförstöring. Ekologiskt jordbruk
kan vara en del av lösningen eftersom dess produktionsmetoder främjar biologisk
mångfald, använder mindre energi för gödselproduktion och medför högre tillförsel av
organiskt material till mark än konventionellt jordbruk. Skördarna är emellertid ofta lägre
i ekologisk produktion jämfört med konventionell, vilket delvis beror på att
mineralisering av organiskt kväve inte sker samtidigt som grödornas upptag. Odling av
baljväxter för proteinproduktion och biologisk kvävefixering är vanligt vid ekologiska
gårdar, men tillsatsen av reaktivt kväve via baljväxter kan, liksom vid användning av
handelsgödsel, leda till kväveöverskott och miljöskadliga kväveförluster. Det är därför
viktigt att förbättra kvävecirkulering inom jordbrukets odlingssystem.
Den här avhandlingen innehåller en utvärdering av effekterna från strategisk
omfördelning av restbiomassa i ett ekologiskt odlingssystem utan djur, med avseende på
grödornas produktivitet och kvalitet, kvävebalans, kväve och kolomsättning,
utlakningsrisk och global uppvärmningspotential. Tre strategier för recirkulering av
kväve i restbiomassa testades via ett fältförsök baserat på en sexårig växtföljd; 1)
skörderester lämnas in situ vid skörd (IS), 2) omfördelning av ensilerade skörderester till
andra grödor än baljväxter (BR) eller 3) anaerob rötning av ensilaget före
omfördelningen (AD). Mineralisering av kväve, jordrespiration och växthusgasutsläpp
undersöktes efter att färsk och anaerobt nedbruten vall blandats med jord i ett
laboratorieförsök. Energibalans, växthusgasutsläpp och eutrofieringspotential i de olika
strategierna för hantering av restbiomassa jämfördes i en livscykelanalys.
Resultaten visade att BR- och AD-strategierna gav samma skörd som IS i fältförsöket,
men resulterade i högre kvävefixering och en mer positiv kvävebalans. Totala C-förluster
i laboratorieexperimentet under 90 dagar efter inblandningen av vall i jord var högre än
från den iblandade rötresten. Livscykelanalysen visade på en stor energiförbättring och
minskning av den globala uppvärmningspotentialen i AD jämfört med BR.
Utlakningsrisken minskade med den strategiska omfördelningen av ensilage och rötrest
(BR och AD) jämfört med IS.
Slutsatsen var att strategisk omfördelning av rötrest baserad på odlingssystemets
restbiomassa kan förbättra kvävebalansen och producera ett överskott av bioenergi, vilka
båda är viktiga faktorer för att förbättra hållbarheten i djurlösa ekologiska odlingssystem.
Abstract 3
Sammanfattning 4
List of publications 8
List of figures 10
Abbreviations 11
List of tables in appendix 12
1 Introduction 13
1.1 Global agricultural challenges 13
1.1.1 Food security 13
1.1.2 Eutrophication 14
1.1.3 Soil fertility 14
1.1.4 Greenhouse gases 15
1.2 Organic stockless agriculture as part of the solution 15
1.2.1 Energy demand 17
1.2.2 Soil organic carbon 17
1.3 The nitrogen cycle in organic stockless farming 18
1.3.1 Nitrogen fixation 18
1.3.2 Nitrogen cycling 20
1.3.3 Nitrogen use efficiency 20
1.3.4 Nitrogen mineralisation and availability affects yield 21
1.4 Potential solutions and unanswered questions 22
1.4.1 Organic nitrogen fertilisers 22
1.4.2 Leaching of nitrate 23
2 Overall aims and hypotheses 24
3 Materials and methods 27
3.1 Field experiment (Papers I & II) 27
3.1.1 Study site and soil 27
3.1.2 The crop rotation 28
3.1.3 Experimental design 29
Contents
3.1.4 Sampling 31
3.1.5 Nitrogen balance 31
3.2 Soil incubation (Paper III) 32
3.2.1 Experimental design 32
3.2.2 Sampling 33
3.3 Life cycle assessment 33
3.3.1 System boundaries and limitations 33
3.3.2 Life cycle inventory 35
4 Results 36
4.1 Crop yield and quality influenced by management of residual biomass
(Paper I) 36
4.1.1 Yield and nitrogen concentration of rye, cabbage and beetroot 36
4.1.2 Yield and nitrogen concentration of the intercrops lentil/oat and
pea/barley 36
4.1.3 Yield of cover crops and green manure ley 37
4.2 Effects of internal recycling with residual biomass on biomass nitrogen
acquisition and balance (Paper II) 37
4.2.1 Nitrogen acquisition 37
4.2.2 Nitrogen exported in the edible crop fraction 38
4.2.3 Nitrogen in residual crop biomass, green manure ley and cover
crops 38
4.2.4 Nitrogen balance 39
4.3 Mineralisation rate and greenhouse gas emissions from digested and
undigested ley (Paper III) 39
4.3.1 Nitrogen mineralisation 39
4.3.2 Gaseous losses 40
4.3.3 Total losses of carbon 41
4.4 Life cycle assessment 41
4.4.1 Life cycle impact assessment 41
5 Discussion 46
6 Conclusions 51
7 Future perspectives 53
8 Critical reflections 55
References 56
Popular science summary 70
Populärvetenskaplig sammanfattning 71
Acknowledgements 72
Appendix 1. Life cycle inventory 74
Conversion factors 74
Cultivation 74
Emission factors 75
Silage 75
Biogas and digestate production 76
Nordic energy mix 76
Field application 77
8
This thesis is based on the work described in the following papers, referred to
by Roman numerals in the text:
I Råberg, T., Carlsson, G. and Jensen, E.S. (2017). Productivity in an arable
and stockless organic cropping system may be enhanced by strategic
recycling of biomass. Renewable Agriculture and Food Systems. Doi:
10.1017/S1742170517000242.
II Råberg, T., Carlsson, G. and Jensen, E.S. (2017). More efficient use of
nitrogen by internal recycling of residual biomass within a stockless
organic cropping system? Nutrient Cycling in Agroecosystems (submitted).
III Råberg, T., Ernfors, M., Kreuger, E. and Jensen, E.S. Carbon and nitrogen
dynamics after addition of anaerobically digested and undigested ley to
soil (manuscript)
Papers I is reproduced with the permission of the publisher.
List of publications
9
I Developed the research ideas and hypotheses together with the co-authors.
Designed, planned and performed the cropping system experiment. Planned
and performed most of the sampling and preparation of biomass for ensiling
and analysis. Analysed and compiled the results, wrote the article and
corresponded with the journal.
II Developed the research ideas and hypotheses together with the co-authors.
Designed, planned and performed the cropping system experiment.
Collected and prepared samples for isotopic analysis. Performed all
calculations and analyses of the data, compiled the results, wrote the article
and corresponded with the journal.
III Developed the research ideas and hypotheses together with the co-authors.
Designed the soil incubation experiment together with the second author.
Planned and performed the incubation, samplings and measurements.
Analysed the data, did most of the compilation of results and wrote the
article.
The contribution of Tora Råberg to the papers included in this thesis was as
follows:
10
Figure 1. The crops in the six-year rotation studied in Papers I and II. 29
Figure 2. The field experiment with four blocks, with six crops in rotation, and
three biomass treatments. Photo by Joakim Svensson, 2014. 30
Figure 3. Global warming potential from the emissions in treatments with
biomass redistribution (BR) and anaerobic digestion (AD), expressed
as the difference compared with the reference scenario with biomass
left in situ (IS), based on emissions from Table A7 and amount of
digestate in Table A2 42
Figure 4. Eutrophication potential from cultivation, biogas production and
substitution of Nordic energy in treatments with biomass redistribution
(BR) and anaerobic digestion (AD), expressed as the difference
compared with the reference scenario with biomass left in situ (IS). 43
Figure 5. Energy comparison in treatments with biomass redistribution (BR)
and anaerobic digestion (AD) between diesel energy usage in
cultivation as positive values and surplus net electricity as negative
output, expressed as the difference compared with the reference
scenario with biomass left in situ (IS). 44
Figure 6. Global warming potential (GWP) from the treatments with biomass left
in situ (IS), biomass redistribution (BR) and anaerobic digestion (AD)
when using experimental data compared with the emission factors
suggested by IPCC for N2O and CH4 emissions at field application. 45
Figure 7. Eutrophication potential from the treatments with biomass left in situ
(IS), biomass redistribution (BR) and anaerobic digestion (AD) when
using the emission factors from experimental data compared with
emission factors suggested by IPCC for N2O emissions. 45
List of figures
11
%Ndfa = proportion (%) of accumulated nitrogen derived from
symbiotic nitrogen fixation in a legume
AD = anaerobic digestion
BNF = biological nitrogen fixation
BR = biomass redistribution
CC = cover crop
CHP = heat and power unit
CO2-eq = carbon dioxide equivalents
CS = cropping system
CSTR = continuous stirred-tank reactor
EP = eutrophication potential
GHG = greenhouse gas
GWP = global warming potential
IC = intercrop
IS = in situ
LCA = life cycle assessment
NUE = nitrogen use efficiency
SOC = soil organic carbon
SOM = soil organic matter
WFPS = water-filled pore space
Abbreviations

12
Table A1. Category indicators used for global warming potential (GWP) and
eutrophication potential (EP) 74
Table A2. Biomass yield at harvest, after ensiling, after digestion in the reactor
and after storage of digestate. FW = fresh weight, DW = dry
weight. 74
Table A3. Emissions factors used for the losses from manure storage. 75
Table A4. Emissions from production, distribution and incineration of plastic
used for covering the silage. 75
Table A5. Energy use, emissions and energy conversion from running the
reactor and generator. 76
Table A6. Average emissions generated from the production of energy in the
Nordic countries between 2013 and 2015. 76
Table A7. Nitrogen losses caused by NH3 emissions during the spreading of
biomass. 77
Table A8. Nitrous oxide and CH4 emissions after shallow incorporation of
biomass into the soil. 77
Table A9. Amount of nitrate leached from a reference crop depending on
incorporation time. 77
Table A10. Direct energy usage from diesel using the field machinery in
scenario BR and AD compared with IS. 78
Table A11. Emissions from diesel production, distribution and incineration. 79
List of tables in appendix
13
1.1 Global agricultural challenges
Agriculture faces the challenge of producing high yields to feed a growing world
population, while simultaneously addressing a large group of environmental
problems such as eutrophication, emissions of greenhouse gases (GHG), loss of
biodiversity, soil degradation and the consequences of unpredictable weather
due to climate change (Tilman et al., 2001; Lal, 2004; Harvey & Pilgrim, 2011).
While dealing with these issues, agriculture also has to meet expectations from
governments to provide ecosystem services such as biomass for sustainable
bioenergy production and climate change mitigation (Tilman et al., 2009;
Harvey & Pilgrim, 2011; Sapp et al., 2015).
1.1.1 Food security
The human population continues to grow and the global population is estimated
to reach a peak of approximately nine billion people by the middle of the 21st
century. Competition for land, water and energy is thus expected to increase
(Godfray et al., 2010). For example, it has been suggested that 50-100% more
food will be needed by 2050 compared with 2008 (World Bank, 2007; Godfray
et al., 2010). Resolving this challenge requires a paradigm shift in the way food
is produced and handled. For example, feeding livestock requires more nutrients
than the final animal-based product contains (Rubatzky & Yamaguchi, 2012).
Thus global production of animal feed currently accounts for over 50% of the
total N input, while the animal sector delivers only 17% of global food calorie
production (Liu et al., 2016).
1 Introduction
14
1.1.2 Eutrophication
To obtain high yields, nitrogen (N) must be available in sufficient amounts to
support adequate plant growth. Agriculture thus relies on processes to convert
atmospheric N2 to nitrate (NO3-) and ammonium (NH4
+), which can be leached
and emitted to the surrounding environment as reactive N. Reactive N is already
causing problems such as eutrophication of the Baltic Sea and contributes to
climate change via nitrous oxide (N2O) emissions (Rockström et al., 2009;
Steffen et al., 2015).
Intensification of agricultural production has resulted in increasing
environmental pollution with reactive N (Van der Werf & Petit, 2002), such as
eutrophication of surface water (Baggs et al., 2002; MEA, 2005; Galloway et
al., 2008; Foley et al., 2011; Cohen, 2015). One of the main contributors to
eutrophication is NO3-, which mainly originates from mineral fertilisers and also
from mineralisation of organic fertilisers and plant residues left in the field after
harvest (Beman et al., 2005; Giles, 2005; Matsunaka et al., 2006). Residues left
in situ continue to mineralise in late summer and autumn, while crop N
acquisition declines (Powlson, 1993; Kirchmann et al., 2002). Nitrate from this
and other processes mainly leaches through the soil profile with the drainage
water, but also through surface runoff, ending up in the surrounding aquatic
environment (Foster et al., 1982). Subsequent environmental enrichment with
NO3- can lead to undesirable changes in ecosystem structure and function (Smith
et al., 1999) and contamination of drinking water (Spalding & Exner, 1993).
1.1.3 Soil fertility
High soil fertility must be maintained in the long term to assure food security. A
fertile soil provides essential nutrients for crops and supports a diverse and active
biotic community that provides the conditions for well-functioning
decomposition (Mäder et al., 2002). However, the soil organic carbon (SOC)
that supports this fertility can decline in systems where a large mass of organic
matter is removed, such as after conversion of forest or pasture to intensively
managed agricultural with annual crops (Cowie et al., 2006; Hellebrand et al.,
2010). Many cultivated soils are already showing a steady decline in SOC pools,
with negative impacts on soil biota and soil structure (IPCC, 2007; Sommer &
de Pauw, 2011).
15
1.1.4 Greenhouse gases
Agriculture and land use change is responsible for 22-30% of anthropogenic
GHG emissions (Tubiello et al., 2013; Knapp et al., 2014). Three of the principal
gases emitted are carbon dioxide (CO2), methane (CH4) and N2O (Robertson et
al., 2000; Knapp et al., 2014). The addition of CO2 emissions to the atmosphere
comes from the use of fossil fuels and the oxidation of SOC when land is
converted for intensive agriculture (Cole et al., 1997). Of the CH4 emissions in
European Union countries (EU-15), approximately two-thirds come from enteric
fermentation by ruminants and one-third from livestock manure (Moss et al.,
2000). Globally, paddy rice cultivation is another major CH4 contributor (Smith
et al., 2014b), producing 45 Tg CH4 year-1 (2005), but these emissions are
decreasing due to improvements in farming practices (Kai et al., 2011).
Emissions of N2O mainly originate from application of N fertiliser or manure
under wet conditions and storage of animal manure (Munch & Velthof, 2006;
Prosser, 2006; Smith et al., 2014b). Combined, CH4 and N2O contributed with
11% (~5.4 Gt CO2 equivalents year-1) of the total anthropogenic non-CO2 GHG
emissions in 2012 (Tubiello et al., 2015).
1.2 Organic stockless agriculture as part of the solution
Consumers today are often concerned about the environment and/or the
chemicals used in food production, and both supply and demand for certified
organic production continue to grow (Mueller & Thorup-Kristensen, 2001;
Willer & Schaack, 2015). For example, the EU-28 increased its total area
cultivated as organic from 5.0 to 11 million hectares between 2002 and 2015
(Eurostat, 2015). This large-scale conversion of production needs to be met with
intensified research to ensure that it is efficient and that pollution is minimised.
Organic farming often yields less than conventional farming (Seufert et al.,
2012), which calls for a complementary shift in diet to meet the increasing
demand for food. Reducing the consumption of meat, dairy products and eggs to
half of what it is today in the European Union would achieve 23% per capita less
use of cropland for food production (Westhoek et al., 2014). By using crops to
feed humans instead of animals, the efficiency of land use can be strongly
increased (Rubatzky & Yamaguchi, 2012; Bailey, 2016). The United Nations
Environment Programme estimates that the calories lost by using cereals as
animal feed instead of using them directly as human food could theoretically
feed an extra 3.5 billion people (UNEP, 2015).
The manufacturing of fertiliser, together with the cultivation of leguminous
crops, convert more atmospheric N2 into reactive N than the combined effects of
all terrestrial processes (Rockström et al., 2009). Under current levels of total N

16
per unit of food production and without changes in agricultural practices and
waste-to-food ratios, it is estimated that an additional amount of 100 Tg N yr−1
will be needed by 2030 for a baseline scenario that would meet hunger
alleviation targets for over 9 billion people (Liu et al., 2016). Less intensive
animal production and increased recirculation of N could reduce the need for N
application in 2030 by 8% relative to the level in 2000 (Liu et al., 2016; Shibata
et al., 2017). Decreased animal production and consumption would have the
largest impact on lowering the need for larger N inputs. For example, the N
requirement is 84 g N per 1000 kcal for animal calorie production, compared
with only 16 g N per 1000 kcal for vegetable calorie production (Liu et al.,
2016). Therefore, using cropland to produce animal feed, no matter how
efficient, leads to much higher total N usage.
Greenhouse gas emissions would also be reduced by producing and eating
less meat compared with today, if accompanied by a change in crop production
to feed humans instead of animals (Stehfest et al., 2009; Nijdam et al., 2012;
Nelson et al., 2016). The livestock sector and its by-products account for
between 18 and as much as 50% of world-wide emissions of CO2 equivalents
(CO2eq) per year, depending on the model used in calculations (Steinfeld et al.,
2006; Goodland & Anhang, 2009). Of the products assessed by Yue et al.
(2017), meat had the highest average C footprint (6.21 kg CO2eq kg-1), and
vegetables had the lowest (0.15 kg CO2eq kg-1), but there are large variations
between different species and production methods. Reducing the consumption
of meat, dairy and eggs in the European Union to half of what it is today would
achieve a 25-40% reduction in GHG emissions (Westhoek et al., 2014).
Developing policies to change consumption patterns towards more resource-
efficient plant-based foods would reduce land use, production of reactive N and
GHG emissions. However, it would also need to be accompanied by an increase
in organic stockless farming.
Farmers of a region often specialise in either crop or animal production,
which makes animal manure inaccessible to many stockless organic farms
(Mueller and Thorup-Kristensen 2001; Schmidt et al. 1999; Stinner et al. 2008).
There has been a prevailing idea that organic arable farming needs to be
combined with animal production to be sustainable. However, animal husbandry
is one of the main contributors to both GHG emissions and eutrophication
(Garnett, 2011). Modern organic arable farms with low or no animal production
thus need to find other ways to fertilise the crop. Therefore, there is a need for
research on the options and implications for strategic biomass circulation on
organic arable farms.
17
1.2.1 Energy demand
Agriculture is responsible for about 5% of the total energy used on a global basis
(Pinstrup-Andersen, 1999) or 2.8% (2014) in EU28 (Eurostat, 2017) and the
major energy source is fossil. The use of fossil energy needs to decrease in all
sectors, mainly due to the problems with emissions of the greenhouse gas CO2
(IPCC, 1997). Energy savings or even surplus energy systems can be obtained
with farm-scale bio-fuel production that replaces fossil fuel (Pimentel &
Pimentel, 2003; Fredriksson et al., 2006; Michel et al., 2010).
Organic farming might provide a possibility to save energy in comparison
with conventional farming (Dalgaard et al., 2001; Mäder et al., 2002; Pimentel
et al., 2005). On evaluating a long-term field experiment, Pimentel et al. (2005)
concluded that their animal-based and stockless organic cropping systems used
less energy than the conventional systems. Energy use in both cattle and pig
production has been observed to be higher in conventional than in organic
production (Dalgaard et al., 2001). Although conventional crop production often
has higher yields, it uses more energy per hectare and kg produce (Dalgaard et
al., 2001; Mäder et al., 2002). The greatest difference in energy use between
organic and conventional agriculture stems from the production of synthetic N
for fertilisers and the production of pesticides (Pimentel et al., 2005; Gellings &
Parmenter, 2016). Inorganic fertiliser accounts for almost one-third of the total
energy input to crop production in the United States (Gellings & Parmenter,
2016).
1.2.2 Soil organic carbon
Soil carbon, the content of which correlates with soil organic matter (SOM)
levels, is an important part of sustainable farming because it enhances soil
fertility mediated by soil organisms. Soil organic carbon generally mitigates soil
compaction, reduces soil erosion and surface crusting, increases workability and
water-holding capacity and improves pest control (Pimentel et al., 2005). It also
provides a continuous nutrient supply, as most plant nutrients are part of, or
bound to, soil organic matter (SOM) and become available to the crop when the
SOM is mineralised (Bommarco et al., 2013). A decrease in yield variability has
been found to be correlated with increased SOM levels (Pan et al., 2009). Soil
organic matter is also important for CO2 sequestration, as around 50% of the
organic matter is carbon (Mondelaers et al., 2009).
Meta-analyses indicate significantly higher C content in organically managed
topsoil (6.4%) compared with conventional topsoils, but the increase is higher
when the initial SOM is initially very low (Mondelaers et al., 2009). In one
study, soil C increased significantly more after 22 years of cultivating two
18
organic cropping systems based on either animal manure (27.9%) or stockless
legume-based (15.1%) compared with a conventional cropping system (8.6%)
(Pimentel et al., 2005). In another study, higher water-holding capacity was cited
as the reason for higher yields in five drought years in both stockless and animal-
based organic cropping systems, compared with a conventional system (Letter
et al., 2003).
1.3 The nitrogen cycle in organic stockless farming
Organic agriculture, compared with conventional, offers benefits such as
increased recycling of nutrients and lower energy usage for processing fertilisers
of organic origin (Worrell et al., 2000; Vance, 2001; Rockström et al., 2009).
Recycling of N is central to reducing the need for production of more reactive N
(Bodirsky et al., 2014). However, N is often the most limiting nutrient for crop
performance in terms of yield and quality, and is needed in larger quantities than
any of the other essential nutrients (Mengel & Kirkby, 1978; Sinclair & Horie,
1989). To obtain high yield and quality, mineralisation of N from organic
fertilisers and SOM needs to be in synchrony with crop acquisition. Organic
stockless agriculture that simultaneously maximises both yield and N recycling
thus needs to consider fixation, cycling, use efficiency and mineralisation of
nitrogen.
1.3.1 Nitrogen fixation
Nitrogen fixation by leguminous crops is one of the most fundamental sources
of N in organic farming systems, especially in stockless farms. (Watson et al.,
2002a; Foyer et al., 2016). The fraction of N derived from N2 fixation in the
legume crop (%Ndfa) is determined not only by the legume and rhizobium
genotypes, but also by the interaction between the soil N environment and total
legume growth (Unkovich & Pate, 2000; Van Kessel & Hartley, 2000). For
example, a high level of mineral N and particularly NO3- in the soil will generally
depress both nodulation and N2 fixation (Streeter & Wong, 1988; Waterer &
Vessey, 1993) and thereby make the legume more dependent on soil mineral N.
Rhizobium genotype is important because absence of the bacterial strain that
exhibits symbiosis with the legume species leads to non-existent N2 fixation. In
such cases, N2 fixation can be significantly improved by seed inoculation with
bacterial strains that can form an efficient symbiosis with the legume to be grown
(Van Kessel & Hartley, 2000; Galloway et al., 2004).
19
Nitrogen fixation rates in annual legumes are strongly correlated to dry
matter accumulation, which in turn depends on weather and soil conditions
(Unkovich & Pate, 2000). The large variation in total N accumulation by
individual crop species between years and sites makes it difficult to generalise
regarding nitrogen fixation levels. For example, N2 fixation has been reported to
be within the range 4-244 kg N ha-1 for pea (Pisum sativum L.) (Armstrong et
al., 1994; Evans et al., 1995; Jensen, 1997) and 5-191 kg N ha-1 for lentil (Lens
culinaris Moench) (van Kessel, 1994; McNeill et al., 1996; Kurdali et al., 1997).
Nitrogen fixation by rhizobium in symbiosis with forage legumes such as
lucerne and clover used as green manure can reach 150-350 kg N ha-1 (Smil,
1999; Carlsson & Huss-Danell, 2003).
When conditions are optimal and high N2 fixation is achieved by the legume,
the requirement for N fertiliser to the subsequent crop can be strongly reduced.
For grain legumes, however, a large proportion of the fixed N is removed with
the grain (Jensen & Hauggaard-Nielsen, 2003; Crews & Peoples, 2004; Li et al.,
2015 ). Thus, grain legumes grown as sole crops or intercrops with cereals do
not supply as much N as cover crops and green manure ley with forage legumes
(Jensen, 1997).
Including green manure ley with legumes in the crop rotation can deliver a
large supply of N. On the other hand, dedicating land to green manure production
reduces the amount of land that can be used for food production. There may also
be a risk of N losses by NH3 and N2O volatilisation, and/or NO3- leaching,
depending on incorporation time and technique (Li, 2015). Growing cover crops
inter-sown at the same time as the main crop or after harvest is an important
strategy for reducing N losses and improving the N availability for the
subsequent crop (Askegaard et al., 2005; Engström et al., 2010). This is the
result of two processes: accumulation of N (including N2 fixation in legumes)
by the cover crop during its growth cycle and release of N from the biomass by
mineralisation (Thorup-Kristensen, 1994; Thorup-Kristensen & Nielsen, 1998).
Another advantage of inter-sown cover crops is that no land needs to be taken
out of food production.
Fixation of N2 also occurs during lightning strikes and this N is deposited on
land (Ehhalt et al., 2001). Other non-specific sources that contribute to
deposition include combustion of fuel, which emits NOx, and animal manure and
plant residues, which emit NH3. The deposition rate of total N varies widely,
from 1 to 20 kg ha-1 year-1 (Smil, 1999). The area in southern Sweden that was
the geographical context of the studies in this PhD thesis receives approximately
9 kg total N ha-1 year-1 (SMHI, 2013-2014). Such a contribution is minor in
comparison with mineral N production and N2 fixation by legumes.
20
1.3.2 Nitrogen cycling
The N2 fixation by legumes contributes by addition of reactive N that can be lost
to the atmosphere, as is also the case with industrial fertiliser production, which
is why N cycling is crucial to decrease total levels of N input. Crop rotations are
an important part of N cycling, as a large part of the N supply to the crop
originates from crop residues, cuttings, and roots that have been left in situ from
the previous crop. Availability by mineralisation is also influenced by, for
example, the amount of N assimilated by the crop, the C:N ratio of the crop
residues, subsequent crop N demand, soil type, soil N availability and
management practices. The amount of N that can be assimilated by a subsequent
cash crop depends largely on temperature, humidity and cash-crop N acquisition
dynamics (Jensen, 1992; Ranells & Wagger, 1997; Kramberger et al., 2009).
Biomass can be left in situ or transported and applied fresh on the soil surface or
incorporated into the soil (Coppens et al., 2006). Most of the N in the fresh
biomass becomes available already in the first year, but there are large N2O and
CO2 emissions and a high risk of leaching during the mineralisation process,
especially when biomass is left on the soil surface compared with soil
incorporation (Baggs et al., 2003).
Nitrogen-rich residual biomass can be moved between fields to the crops with
the highest acquisition rates, or stored for strategic application when the timing
is adequate for mineralisation. This technique is sometimes referred to as ‘cut
and carry’ or ‘biomass redistribution’ and is used to prevent NO3- leaching under
high effluent N loading rates (Barkle et al., 2000; Dodd et al., 2014). Biomass
silage is a storage option to synchronise mineralisation with crop uptake.
Ensiling initiates mineralisation, but also conserves the biomass by lowering the
pH and creating an anaerobic environment (Herrmann et al., 2011). Anaerobic
digestion of organic plant material and subsequent use of the residual digestate
as a bio-fertiliser is yet another option and is of particular interest to supply N
for non-legume crops in the absence of animal manure in stockless organic
systems (Gunaseelan, 1997). Generally, a larger proportion of N is available to
the plant as mineral N in the digestate compared with in fresh or ensiled biomass
(Weiland, 2010).
1.3.3 Nitrogen use efficiency
Plants that are efficient in acquisition and utilisation of nutrients are said to have
high nitrogen use efficiency (NUE), which is a desirable trait as it reduces the
need for high inputs of reactive N and decreases the losses of nutrients to
ecosystems. High NUE also reduces the cost of fertilisers.
21
Definitions of NUE differ and depend on whether plants are cultivated to
produce biomass or grain yield. However, for most plant species, NUE mainly
depends on how plants extract mineralised N from the soil, assimilate NO3- and
ammonium (NH4+), and recycle organic N (Masclaux-Daubresse et al., 2010).
Nitrogen use efficiency is defined in this thesis as N fertiliser recovery in
aboveground plant biomass (see Paper II). The N which is not recovered in the
crop may be immobilised in the soil organic N pool, which comprises both
microbial biomass and SOC (Cassman et al., 2002).
1.3.4 Nitrogen mineralisation and availability affects yield
The highest yield that can be obtained depends mainly on the synchronisation of
soil N availability with crop N acquisition, which in turn is largely influenced
by soil N mineralisation dynamics (Sinclair & Horie, 1989; Godfray et al., 2010;
Tuomisto et al., 2012). The time of greatest N acquisition in cereals is normally
during the stem elongation phase, when the crop is growing the fastest. For high-
protein grain crops, there is an even greater demand around the flowering phase.
The yield will be lower than optimum if there is not an adequate amount of
mineralised N when the acquisition is peaking (Angus, 2001). Nitrogen supply
and demand should match in time and space not only for single crops, but for a
crop rotation as an integrated system, in order to achieve high total NUE
(Spiertz, 2010).
The use of organic N sources makes the availability of nutrients less
controllable compared with the use of mineral fertiliser (Swift et al., 1979), as it
involves biological decomposition through mineralisation (Angus, 2001;
Agehara & Warncke, 2005). Mineralisation of organic N depends on many
factors, such as particle size of the organic fertiliser, available types of
microorganisms and their abundance, and access to C of various qualities.
Abiotic factors such as soil temperature and moisture are major factors affecting
the N availability from organic N sources (Agehara & Warncke, 2005).
Organic fertilisers often have a pool of organic N and C structures that are
unavailable to most crops (Kumar & Goh, 2003; Lorenz et al., 2007). To become
available, these organic materials need to be processed by bacteria, fungi and
other organisms, including microarthropods (Hendrix et al., 1990; Bernal et al.,
2009). The mineralisation rate is often limited by N availability, as the
decomposers have a lower C/N ratio than most organic amendments (Recous et
al., 1995; Henriksen & Breland, 1999; Corbeels et al., 2000).
22
1.4 Potential solutions and unanswered questions
To meet environmental, economic and social challenges, agriculture needs to
become more productive and resilient, while minimising environmental impacts.
This can possibly be achieved by circulating N-rich biomass, optimising N
mineralisation in combination with crop acquisition and replacing fossil fuel.
1.4.1 Organic nitrogen fertilisers
Organic solid manures used in stockless arable farming systems typically
include green manure (Benke et al., 2017). The green manure is often grown on
the farm to reduce the cost of handling and transportation compared with other
organic inputs such as blood meal (‘biofer’), yeast-based fertilisers from
breweries (‘vinass’) or algae compounds (‘algomin’). Green manure can be
composed of a single legume crop, several legume species or a mixture of
legume and grass species. The crop mixture is grown primarily as a soil
amendment and a nutrient source for subsequent crops. Some of the specific
ecosystem services are provision of biologically fixed N, provision of pollen and
nectar for insects and weed control by competition and frequent cutting. Green
manure approaches may also drive long-term increases in SOC and microbial
biomass, which improves nutrient retention and soil fertility (Cherr et al., 2006).
Nitrogen is mainly present in its organic form and if mineralisation occurs when
there is low or no crop acquisition, there will be leaching and/or emissions to the
air. It may be possible to reduce the risk of N losses by removing the green
manure, processing it and then reallocating it to non-legume crops. Composting,
ensiling and anaerobic digestion serve as pre-treatments that conserve the
biomass. Composting the biomass has the advantage of sanitising the material,
due to elevated temperatures. The downside is substantial N losses in the process
(Sørensen et al., 2013; Smith et al., 2014a) and at field application (Larsson,
1998). Ensiling is a viable alternative to composting as losses of N are lower (6-
8%), than when composting the biomass (18-30%) (Sørensen et al., 2013).
Anaerobic digestion of the green manure and crop residues in a biogas reactor
results in a digestate with a higher concentration of mineralised N, which is
directly available to the crop. In organic fertilisers with low C/N ratio (1-5), such
as certain types of digestate, it has been shown that 60-80% of the N is
mineralised during the anaerobic digestion process (Delin et al., 2012). As crop
N acquisition mainly relies on mineralised N, adapting the time of applying
digestate with low C/N ratio can potentially optimise the synchrony between N
availability and crop N demand. Anaerobic digestion can also contribute with a
surplus of bioenergy. However, concerns have been raised that anaerobic
digestion of biomass might decrease the C input to the soil, as CH4 is extracted
23
in the digestion process (Johansen et al., 2013). A controlled laboratory reactor
was set up in this thesis work to measure C extracted as CH4 and CO2 from the
digestion of ley. The carbon losses were added to the C losses from soil
application of the digestate in a soil incubation. The results were compared with
those following application of undigested ley (Paper III).
1.4.2 Leaching of nitrate
Balancing the amount of N needed for optimum plant growth while minimising
the NO3- transported to groundwater and surface waters is a major challenge.
Loss of NO3- from fields to water resources is caused by a combination of
factors, such as amount of mineral N present when crop acquisition is low,
tillage, drainage, crop growth, SOC, hydrology, temperature and precipitation
patterns (Dinnes et al., 2002). For example, Beaudoin et al. (2005) concluded
that NO3- concentration in drainage water is primarily affected by soil type and
soil water-holding capacity. The concentration was three-fold higher in shallow
sandy soil compared with deep loamy soil in that study and the use of catch crops
enabled a 50% reduction in NO3- losses at the annual scale and 23% reduction
at the rotation scale, despite moderate biomass accumulation (Beaudoin et al.,
2005). Nitrate leaching decreases most when non-legume catch crops are used
(Quemada et al., 2013). A positive effect can also be obtained from straw
incorporation into the soil, as it slows down mineralisation in autumn after
harvest (Beaudoin et al., 2005). Other strategies to reduce nitrate leaching
include improved timing of N application at appropriate rates, reducing tillage
and optimising N application techniques (Dinnes et al., 2002). In the cropping
system established in this thesis work, with the introduction of cover crops and
winter crops to retain N, and thus decrease the eutrophication potential, oats and
barley were intercropped with lentils and peas, respectively, as the practice of
intercropping uses the NO3--N from fertiliser in a more efficient way than sole
cropping of cereals (Zhang & Li, 2003). Yield and N uptake in the crops were
measured as an indication of potential losses of N. The treatments that were
compared included leaving crop residues in situ (IS) after harvest in late summer,
compared with storing the biomass as silage for spring biomass redistribution
(BR), or anaerobic digestion (AD) of the biomass, with the digestate
redistributed to non-legumes in spring. A soil incubation was performed to study
the mineralisation rates of ley compared with digested ley, and thus identify
when the N is available for crop acquisition. The treatments in the field
experiment were assessed for their leaching potential in a life cycle assessment
(LCA), using reference emission data (Papers I-III).
24
The overall aims of this PhD project were to assess effects on cropping system
measures from strategic redistribution of residual biomass. The following
aspects were assessed: productivity, energy balance, eutrophication potential, N
dynamics and crop quality. Three different types of residual biomass were
investigated: crop residues, green manure ley and cover crop cuttings. The
residual biomass was applied either as silage biomass for redistribution (BR) or
biogas digestate from anaerobic digestion (AD) to non-legume sole crops. For
comparison, residual biomass was also left in situ (IS).
The aim of the study described in Paper I was to determine how crop yield
and product quality were influenced by the biomass management strategy. A
three-year field experiment was used to test the following hypotheses:
1) Strategic recycling of digestate from anaerobic digestion of residual
biomass leads to higher edible crop yield of non-legume crops compared
with redistribution of biomass as silage or incorporation in situ (no
redistribution).
2) The concentration of N in the edible plant parts of non-legume crops is
higher with strategic recycling of digestate compared with biomass
redistribution or in situ incorporation.
3) Strategic recycling of biomass to a main crop increases the biomass
production of the following cover crops compared with in situ
incorporation of biomass.
The aim of the study reported in Paper II was to determine whether anaerobic
digestion (AD) of the residual biomass from the cropping system and use of the
digestate for N recirculation would improve crop N acquisition, compared with
the corresponding biomass redistribution (BR) of undigested silage or just
leaving the biomass in situ (IS) within the respective field plots.
2 Overall aims and hypotheses
25
The hypotheses were:
4) The amount and proportion of N2 fixed in legume crops is greater with
AD and BR than in the IS system.
5) Nitrogen acquisition from soil and residual biomass in non-legume
crops is greater in AD than BR and IS.
6) The nitrogen balance ranking at the cropping system level is
IS<BR<AD.
7) Total N acquisition originating from soil and added biomass in all crops
is on average greater in AD and BR than in IS.
These hypotheses were tested in the same field experiment as in Paper I. The
amounts of N acquired from N2 fixation and soil (including N recirculated from
the residual biomass) were assessed by the 15N natural abundance method and
from the total N content of the crop. Nitrogen balance calculations were used to
investigate how the biomass management strategy influenced the soil pool of N
at the cropping system and crop level. The calculations did not include N
emissions.
The aim of the study reported in Paper III was to compare the effects of
anaerobically digested and undigested ley as a soil amendment on the
mineralisation and immobilisation turnover of N and on CO2, N2O and CH4
emissions. Nitrogen and carbon transformations were quantified. The treatments
with digested and undigested ley were compared with a control treatment
without organic amendments. The hypotheses were:
8) In the treatment with undigested ley, an initial period of immobilisation
is followed by a period of mineralisation.
9) Following application of digestate, mineralisation is relatively low.
10) The amount of accumulated mineral N (added and mineralised) after
90 days is higher with digested compared with undigested ley.
11) After 90 days of incubation, more C is left in the soil after application
of undigested ley compared with digested ley.
12) Total N2O emissions over 90 days are in the order undigested ley >
digested ley > control soil.
These hypotheses were tested by means of a soil incubation study in a climate
chamber, where soil subjected to the three treatments was analysed destructively
for total N and mineral N on seven occasions during a 90-day incubation period.
The accumulated GHG emissions were sampled with the same frequency in all
treatments.
26
In a fourth study presented in this thesis and not published elsewhere, a life cycle
assessment (LCA) comparing the three biomass management methods (AD, BR
and IS) was performed. The aim was to summarise the use of resources and the
environmental consequences of activities involved in farm-level scenarios, using
the same crop rotation and biomass management strategies as in the field
experiment. The hypotheses were:
13) The AD scenario uses less total energy than the BR and IS scenarios,
after considering the energy from farm-based bioenergy production.
14) The eutrophication potential caused by NO3-, NH3, N2O and NOx is
larger in IS than in AD and BR.
15) Greenhouse gas emissions are lower in AD than in BR and IS.
These hypotheses were tested in a LCA as a comparative study, with IS as the
reference to BR and AD. Aspects considered were energy balance,
eutrophication and GHG emissions.
27
A combination of methods was used to address research questions concerning
the effects of redistribution of residual biomass and digestate from anaerobic
fermentation to crops grown without legumes. These were: i) a field experiment,
ii) a soil incubation study with soil and plant-derived amendments, and iii) a life
cycle analysis that compared the three techniques of recirculating plant-based
nutrients.
3.1 Field experiment (Papers I & II)
A multifunctional and multipurpose cropping system was established for the
study of food and feedstock production for bioenergy, N2 fixation, nutrient
retention with catch crops and winter-growing main crops and the provision of
food for beneficial insects to prevent pests and increase resilience (Paper I). The
crop responses after leaving residual biomass resources in situ were compared
with the responses after redistributing the same biomass resources after ensiling
or after ensiling plus additional anaerobic digestion. In all treatments, the
biomass was rotated within the same cropping system without external biomass
input. The rotation was based mainly on food crops, but one-sixth of the rotation
was grown with green manure ley to produce additional biomass.
3.1.1 Study site and soil
The experiment was established in 2012 on a sandy loam soil at the SITES
(Swedish Infrastructure for Ecosystem Science) field research station Lönnstorp
(55°39′21″N, 13°03′30″E), Swedish University of Agricultural Sciences,
Alnarp, Sweden. The land was certified for organic farming in 1993 and the
preceding crop was a one-year legume-grass ley.
3 Materials and methods

28
3.1.2 The crop rotation
A six-year crop rotation was used for the study, although the experiment was
only performed during the three full seasons in 2012-2015. Within each
treatment and block, the crop rotation was established in six separate plots, so
that each of the six main crops in the rotation was grown during each year of the
experiment.
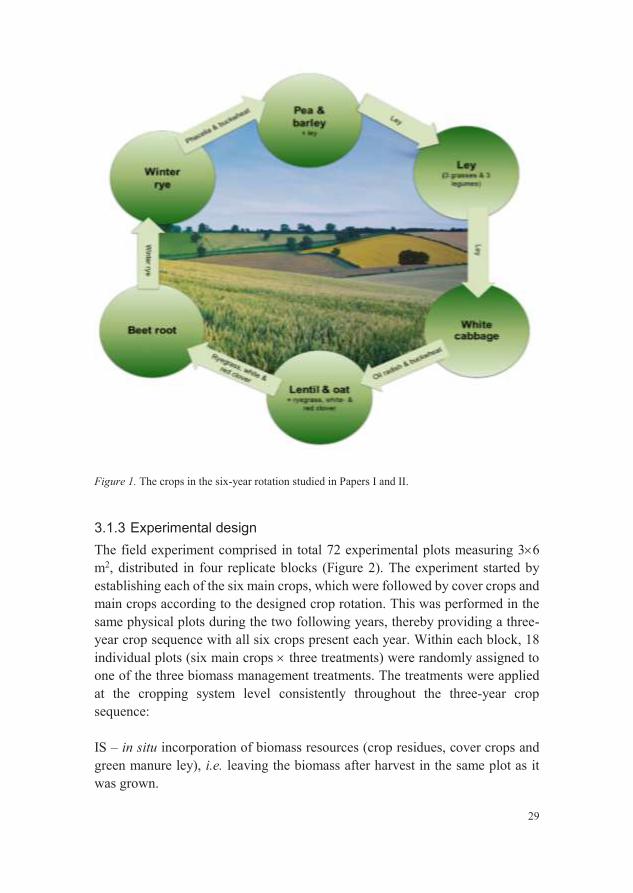
The rotation consisted of the following food crops: pea/barley (Pisum
sativum L./Hordeum vulgare L.), lentil/oat (Lens culinaris Medik/Avena sativa
L.), white cabbage (Brassica oleracea L.), beetroot (Beta vulgaris L.), and
winter rye (Secale cereale L.) (Figure 1). In addition, there was a green manure
ley composed of Dactylis glomerata L., Festuca pratensis L., Phleum pratense
L., Medicago sativa L., Meliolotus officinalis L. and Trifolium pratense L. The
ley was under-sown in the pea/barley intercrop, harvested three times during the
year after establishment, and harvested again in early spring the following year,
before establishing white cabbage as the next crop. Cover crops were included
in the rotation after white cabbage (buckwheat (Fagopyrum esculentum
Moench)/oilseed radish (Raphanum sativus L.)) and rye (buckwheat/lacy
phacelia (Phacelia tanacetifolia Benth.)) and under-sown in lentil/oat (ryegrass
(Lolium perenne L.)/red clover (Trifolium pratense L.)/white clover (T. repens
L.)) (Paper I).
29
Figure 1. The crops in the six-year rotation studied in Papers I and II.
3.1.3 Experimental design
The field experiment comprised in total 72 experimental plots measuring 36
m2, distributed in four replicate blocks (Figure 2). The experiment started by
establishing each of the six main crops, which were followed by cover crops and
main crops according to the designed crop rotation. This was performed in the
same physical plots during the two following years, thereby providing a three-
year crop sequence with all six crops present each year. Within each block, 18
individual plots (six main crops three treatments) were randomly assigned to
one of the three biomass management treatments. The treatments were applied
at the cropping system level consistently throughout the three-year crop
sequence:
IS – in situ incorporation of biomass resources (crop residues, cover crops and
green manure ley), i.e. leaving the biomass after harvest in the same plot as it
was grown.
30
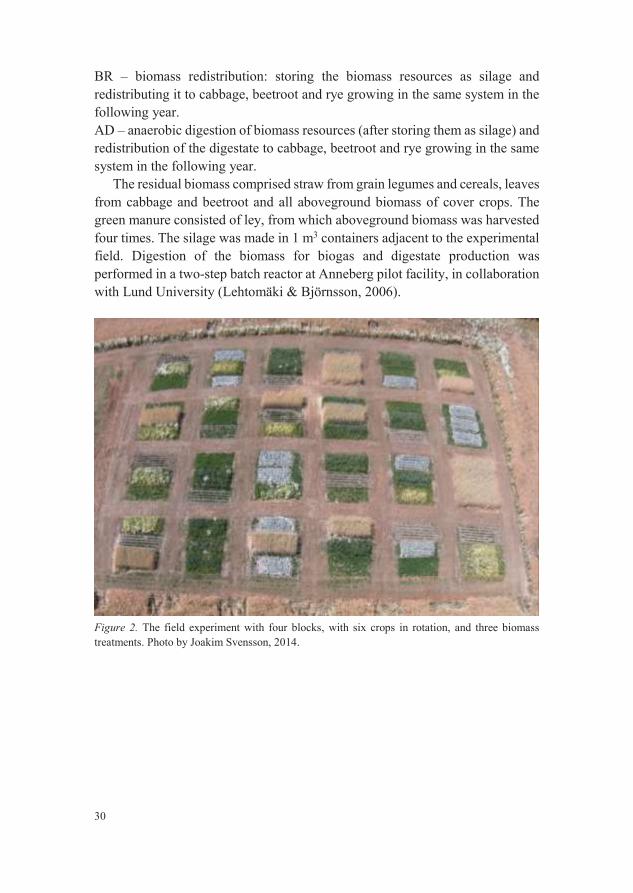
BR – biomass redistribution: storing the biomass resources as silage and
redistributing it to cabbage, beetroot and rye growing in the same system in the
following year.
AD – anaerobic digestion of biomass resources (after storing them as silage) and
redistribution of the digestate to cabbage, beetroot and rye growing in the same
system in the following year.
The residual biomass comprised straw from grain legumes and cereals, leaves
from cabbage and beetroot and all aboveground biomass of cover crops. The
green manure consisted of ley, from which aboveground biomass was harvested
four times. The silage was made in 1 m3 containers adjacent to the experimental
field. Digestion of the biomass for biogas and digestate production was
performed in a two-step batch reactor at Anneberg pilot facility, in collaboration
with Lund University (Lehtomäki & Björnsson, 2006).
Figure 2. The field experiment with four blocks, with six crops in rotation, and three biomass
treatments. Photo by Joakim Svensson, 2014.
31
3.1.4 Sampling
Samples for analyses of yield from the edible fractions and the N concentration,
cover crop and green manure ley yield were obtained from subplots in each plot
(Paper I). The residual biomass, cover crops and ley cuttings were subjected to
analyses of botanical composition (grouped into legumes and non-legumes), dry
matter (DM), N content and natural abundance of the stable isotope 15N (Paper
II).
3.1.5 Nitrogen balance
The N balance for the cropping sequences was calculated per crop and as an
annual sum of each treatment for 2012-2014. The balance calculations used input
data from N2 fixation measured by the 15N natural abundance method (Unkovich
et al., 2008), regional measurements of atmospheric N deposition (SMHI, 2013-
2014), N content in seeds and in plants used for establishing the cabbage crop
and addition of N via residual ensiled (BR) and digested (AD) biomass from the
previous year’s crops (Equation 1). In cases where a cover crop was grown after
a main crop, the yearly atmospheric N deposition was divided and allocated
equally to the main and cover crop in the N balance calculations. The additional
supply of 115 kg N from imported digestate at the start of the experiment (2012)
was also included in the calculations. The N outputs in the balance consisted of
the amounts of N exported in the edible fractions of the food crops (all
treatments) and N exported in residual biomass in AD and BR to be redistributed
in the next growing season.
N balance = bnf + dep + seed + biomassadded – food – biomassremoved (Eq. 1)
bnf = biological N2 fixation in the current year
dep = atmospheric N deposition
seed = seed and (cabbage) plant N
biomassadded = N from added residual biomass and cuttings from the previous
year
edible fraction =exported cash crop total N
biomassremoved = total N from cuttings and residual biomass removed to be
circulated in the next year
32
3.2 Soil incubation (Paper III)
A microcosm experiment was set up, with three treatments: 1) soil receiving
grass-clover ley (L), 2) soil receiving anaerobically digested grass-clover ley
(DL) and 3) soil without amendment (S). The same ley was used for the L and
DL treatments, but half of it was fertilised with 15N-labelled N. The digestate
used in the study was produced in a two-step laboratory digestion facility at Lund
University (Paper III). Both ley and digestate had been frozen prior to the
experiment and were slowly defrosted in gastight containers in a refrigerator.
The incubation was performed in 400-mL glass jars (each jar was one
microcosm) at 15 ○C in darkness and lasted for a period of 90 days, simulating
a Nordic spring or autumn (Figure 1 in Paper I). The soil depth for incorporation
of the amendments was half of that used for incorporating residues by harrowing
in the field experiment described in Paper I.
3.2.1 Experimental design
Eight replicate microcosms were prepared for each sampling time in both the L
and DL treatments. The eight replicates were identical except for the isotopic
composition of their organic and mineral N pools. In four of the replicates (A),
the NH4+ pool was labelled with 15N, while the organic N pool was unlabelled.
In the other four replicates (B), the organic N was labelled with 15N while the
NH4+ pool was unlabelled or had only a low atom% excess of 15N. In the S
treatment, four replicate microcosms were prepared for each sampling time, all
of which were labelled with 15N in the NH4+ pool only.
The labelling in the DL treatment was achieved by adding the solid fraction
of the unlabelled digestate and the liquid fraction of the 15N-labelled digestate to
the (A) microcosms and, conversely, by adding the solid fraction of the 15N-
labelled digestate and the liquid fraction of the unlabelled digestate to the (B)
microcosms. The 15N labelling of inorganic N in the (A) microcosms was further
increased by adding a small amount of NH4Cl at 98 atom% 15N excess, while
the (B) microcosms received a corresponding amount of unlabelled NH4Cl. The
(A) microcosms in the L treatment received unlabelled ley and a small amount
of NH4Cl at 98 atom% 15N, while the (B) microcosms in the L treatment received 15N-labelled ley and a small amount of unlabelled NH4Cl. The S treatment
received a small amount of NH4Cl at 98 atom% 15N. The NH4Cl was diluted in
deionised water to the amount needed to achieve 66% water-filled pore space
(WFPS) in all jars.
33
3.2.2 Sampling
The soil was sampled destructively for mineral and organic N, and gas samples
were collected, at 0, 2, 4, 7, 20, 55 and 90 days (tXd) after initiation of the
experiment. The first sampling was performed one hour after initiation of
treatment. All the soil from each microcosm was transferred to a separate 1-L
flask and 600 mL of 2 M KCL were added. The flasks were shaken at room
temperature for 1 h on a shaking table and then left for sedimentation for at least
12 h at 4 ○C.
The soil solution samples were slowly defrosted in a refrigerator prior to
analysis. The abundance of 15N in the inorganic N was determined in the soil
extract by the micro-diffusion method, where NO3- and NH4
+ were converted
into NH3, which was trapped on an acidified filter paper folded into a Teflon
tape, using the method by Stark & Hart (1996) and Sörensen & Jensen (1991),
with only minor.
3.3 Life cycle assessment
Life cycle assessment (LCA) is a tool that summarises the use of resources and
the environmental consequences of all the activities involved in one or several
scenarios being compared (Haas et al., 2000; Höjer et al., 2008). A wide range
of impact categories can be used, depending on the scope of the study. The LCA
approach was primarily developed in applications to industrial production
systems (Audsley et al., 1997), but has been used for assessing a number of
agricultural systems. Audsley et al. (1997) and Ceuterick (1996, 1998) have
compiled examples of complete LCAs for single crops and production processes.
Kramer et al. (1999) used part of the methodology to assess GHG emissions
related to crop production systems in the Netherlands. Flessa et al. (2002)
similarly evaluated GHG emissions from two farming systems in southern
Germany and showed the important contribution of individual gases to climate
change. De Boer (2003), Cederberg and Mattsson (2000) and Haas et al. (2001)
further illustrated the possibilities of using LCA to compare agricultural
production systems. The LCA method is internationally standardised according
to ISO 14040 guidelines (Finkbeiner et al., 2006).
3.3.1 System boundaries and limitations
The analysis dealt with the life cycle flow of the different biomass management
strategies (Paper I), including crop production and power generation. In the case
of biogas combustion, electricity and heat were generated from the gas produced.
The time frame for crop and electrical energy production in the analysis was one

34
year and followed the average results from the three years of the field experiment
(2012-2015). The functional unit was set to 100 ha year-1, to represent a
theoretical organic farm of 100 ha. The crop yield was set to be the same
regardless of the fertiliser scenario. This assumption was based on results from
the field experiment, which showed no significant differences in yield between
treatments (Paper I). Energy usage for field operations and processes in the
biogas reactor was included in the calculations and based on reference values.
The energy needed for heating and electricity to run the biogas reactor was
subtracted from the energy produced with a generator. Implementation of
systems for making use of excess heat was not considered. Direct energy demand
included diesel, electricity and heat used in the biogas reactor (Rehl et al., 2012).
Indirect energy usage included production of diesel, plastic, building materials
for the biogas plant and machines and a concrete surface for silage storage. In
the analysis, some variable emissions and energy demand were included, such
as production and distribution of diesel and plastic to cover the silage. Fixed
emissions from the use of material and energy embedded in machines and
buildings were not included. The timing for conversion of silage to biogas in
scenario AD was optimised to produce digestate when there was a demand for
fertilising the crop, i.e. March-May. As a consequence, GHG emissions from
storage of digestate were substantially reduced compared with storing the
digestate during the warmest months of the year.
Input data
The LCA was based on yield data from Paper I, with the three biomass
management scenarios described in section 3.1.3, where IS was used as the
reference scenario designed according to a plausible system in organic farming
in Sweden representing best management practices.
Data on emissions of GHG from biomass incorporation into soil were
obtained from the soil incubation study described in section 3.2 of this thesis,
where emissions from soil mixed with grass clover ley or digested grass clover
ley (stored at 8 ○C for 12 h before the incubation study) were compared with
emissions from bare soil. The emissions from soil amended with grass clover ley
were assumed to correspond to both fresh crop residual biomass and silage
applied to the field. The emissions during 90 days were used as an estimate for
GHG emitted during a year, as most emissions occur shortly after application of
biomass to agricultural fields.
Literature data were used in the analysis to calculate losses that were not
quantified in the field experiment or incubation study, i.e. GHG emissions from
ensiling and storage of silage, the anaerobic digestion and the storage of

35
digestate and leaching of NO3- from the field experiment. Literature values were
also used calculate diesel consumption for field operations, reactor energy
consumption and emissions. A sensitivity analysis was made where
experimental data were used, comparing the results with literature emission data.
Transport of biomass to and from the fields was not included in the analysis due
to lack of reference data.
3.3.2 Life cycle inventory
The category indicators from IPCC (2006) were used as conversion factors for
calculating the global warming potential (GWP) and eutrophication potential
(EP) in CO2 and PO43- equivalents, respectively (see Table A1 in the appendix).
The emissions and energy usage were based on mass flows of biomass and N
(Table A2). Emission factors for animal manure were used to estimate the
emissions from storing silage on a concrete platform (Table A3), covered with
plastic in scenario BR and AD (Table A4). The energy used for the production
of plastic for ensiling was 16 MJ ton-1 (Björnsson et al., 2016).
Modelling data for a conventional continuous stirred-tank reactor (CSTR) for
the production of biogas were used for the calculations of energy consumption,
emissions and energy conversion in an electricity generator for scenario AD
(Table A6). The surplus of energy produced in the reactor and the generator was
assumed to be sold to the national grid, where it reduced emissions based on the
Nordic energy mix (Table A7). Nitrogen losses emitted at the anaerobic
digestion or storage of digestate was allocated to the category “biogas
production”, presented in the result section. The ammonia emissions from field
application of the biomass were calculated using reference data in the National
Inventory Report (NIR, 2016), and were based on animal manure being
incorporated within four hours (Table A8). The N2O and CH4 emissions from
the three scenarios were adapted from Paper III and compared with reference
data from IPCC (Table A9) in a sensitivity analysis (Figure 6 and 7). The risk of
NO3- leaching causing eutrophication, depending on autumn or spring
incorporation of biomass, was estimated from the mean values from an
experiment by Stopes et al. (1996) (Table A10). The additional usage of diesel
in scenarios BR and AD compared with IS was based on estimates from the rural
economy and agricultural society of Sweden (HIR Malmöhus &
Maskinkalkylgruppen, 2014) and German reference data (Achilles et al., 2005)
(Table A11). The emissions from diesel production, distribution and combustion
are presented in Table A12.
36
4.1 Crop yield and quality influenced by management of
residual biomass (Paper I)
The aim of the study presented in Paper I was to determine how crop yield and
product quality are influenced by biomass management strategy.
4.1.1 Yield and nitrogen concentration of rye, cabbage and beetroot
Yield of the edible fraction of rye, cabbage and beetroot was not significantly
different after leaving the biomass in situ (IS), strategically redistributing ensiled
biomass (BR) or strategically redistributing the digestate (AD) (Paper I).
Moreover, the redistribution treatments BR and AD did not result in different
concentrations of N in the edible fraction of rye, cabbage and beetroot or yield
of biomass residues.
4.1.2 Yield and nitrogen concentration of the intercrops lentil/oat and
pea/barley
Lentil grain yield was significantly lower in IS compared with BR in 2013 (Paper
I). Data on the grain yield of the pea and barley intercrop in 2013 are not
available, since the crop was damaged by rabbits and hares in that year. The
biomass treatments did not result in any significant difference in the N
concentration of grain legume or cereal seeds. The IS treatment resulted in
significantly higher yields of oat straw in both years.
4 Results
37
4.1.3 Yield of cover crops and green manure ley
The yield of buckwheat/lacy phacelia (grown after rye) was significantly higher
in BR compared with IS and AD in both years (Paper I). The clover proportion
of the grass clover cover crop was exceptionally low for all treatments at harvest
in May 2013. The legume proportion of the green manure ley was significantly
higher in the BR and AD treatments compared with IS in 2014.
4.2 Effects of internal recycling with residual biomass on biomass nitrogen acquisition and balance (Paper II)
The aim of the study presented in Paper II was to determine whether anaerobic
digestion (AD) of the residual biomass from the cropping system and use of the
digestate for N recirculation improves crop N acquisition, compared with the
corresponding biomass redistribution (BR) of undigested silage or just leaving
the biomass in situ (IS) within the respective field plots.
4.2.1 Nitrogen acquisition
Total nitrogen accumulation in aboveground parts of the crops ranged between
140 and 180 kg ha-1 year-1, with no significant difference between the biomass
strategies (Paper II).
Symbiotic N2 fixation in legumes
The proportion of N derived from N2 fixation in the legumes (%Ndfa) was found
to be between 68 and 98%, but was not significantly different between
treatments (Paper II). The amount of N2 fixed was higher with the BR and AD
crop rotations compared with IS (p=0.002). A large part of the increased N2
fixation was from the legumes of the green manure ley, with significantly higher
(p<0.001) N2 fixation in BR and AD compared with IS in 2014. The amount of
N2 fixation in lentil and pea varied inconsistently between treatments in the two
years. No significant difference between treatments was found for the amount of
N2 fixed in clover grown together with ryegrass in the cover crop, which ranged
between 0.24 kg N ha-1 year-1 for May harvest in 2013 and 62.9 kg N ha-1 year-1
for May harvest in 2014 (Paper II).
38
Nitrogen acquisition from soil
The total N accumulation from soil and added biomass varied between 110 and
140 kg N ha-1, calculated as an average for the entire crop rotation, and the total
accumulation was significantly higher (p=0.002) in 2014 compared with 2013
(Paper II). Differences between the three treatments were small and in most
cases non-significant. The BR treatment led to significantly (p<0.001) higher
accumulation of soil-derived N in the cover crop buckwheat/lacy phacelia in
both years compared with the IS and AD treatments (Paper II).
4.2.2 Nitrogen exported in the edible crop fraction
Average N accumulation in the exported edible fraction of the five edible crops
varied between 49 and 60 kg ha-1, with the highest amount exported in rye grain
(Paper II). The N content of the edible fraction was not affected by treatment,
even if the N supply differed substantially (Paper II).
4.2.3 Nitrogen in residual crop biomass, green manure ley and cover
crops
The total amount of N in crop residues, cover crops and ley cuttings from six ha
varied between 97 and 129 kg N ha-1, without any significant differences
between the treatments (Paper II). In 2013, the ley cuttings constituted between
36 and 40% of the total amount of N and in 2014 the contribution increased to
between 49 and 54%. There was a significant interaction between treatment and
year when the total N accumulation of all crops from the three systems was
compared (p=0.001). Nitrogen accumulation in the whole cropping system was
larger in IS compared with BR and AD in 2012 (p=0.009), since N in residual
biomass in BR and AD was ‘exported’ for redistribution in the next growing
season without corresponding inputs during the initial year of the experiment.
The nitrogen content of all the residual biomass increased in the three years that
the experiment was running, regardless of treatment. There was a significant
(p<0.001) increase in residual biomass N for all treatments, corresponding to an
average difference of 19 kg N ha-1 between 2013 and 2014 (Paper II).
39
4.2.4 Nitrogen balance
The three crops that were fertilised with biomass in BR and AD resulted in an N
surplus for the N balance in both years, with the highest surplus in cabbage with
the BR treatment in 2014 (Paper II). The exception to the surplus results was the
winter rye crop with BR treatment in 2014, which resulted in a negative balance.
Cabbage, beetroot and rye all had a negative N balance in IS.
The lentil/oat intercrop resulted in a negative result with all treatments, and
most negative for AD and BR. The pea/barley intercrop resulted in a surplus for
IS in both 2013 and 2014, while the balance for BR and AD resulted in between
5 and -47 kg ha-1. The non-legume catch crops had a negative result in BR and
AD, while IS resulted in a positive result due to the absence of exported biomass.
Both the cover crop ryegrass/clover and the green manure ley (summer and the
following spring yield) resulted in negative results in BR and AD, as biomass
was removed and stored for manuring the next year’s crop. There was surplus N
in IS for both crops (Paper II).
The nitrogen balances at the cropping system level gradually became more
positive in the BR and AD treatments, when not considering the residual biomass
N that was removed temporarily in the harvest year and used as an input in the
next year in BR and AD.
4.3 Mineralisation rate and greenhouse gas emissions from digested and undigested ley (Paper III)
The aim of the study presented in Paper III was to compare the effects of
anaerobically digested and undigested ley as a soil amendment on the
mineralisation and immobilisation turnover of N, and on CO2, N2O and CH4
emissions.
4.3.1 Nitrogen mineralisation
The concentrations of mineral N (NH4++NO3
-), including the mineral N (N-min)
already present at the start of the incubation, were significantly lower in the L
treatment compared with the DL treatment throughout the experiment (Figure 2
in Paper III). The N-min concentration did not differ between the L and S
treatments initially (t0d and t7d), but was significantly higher in S compared with
L from 20 days to 90 days (t20d to t90d). There was no difference between the N-
min concentration of DL and S at t7d and between t50d-t90d. However, the
concentration changes in mineral N should not be interpreted as absolute
mineralisation without correcting for N losses in the form of gaseous emissions
(Figure 4 in Paper III).

40
The apparent net mineralisation values over 90 days, calculated from the
change in mineral N pools over time, were -0.57 (SEM 5.68), -12.3 (SEM 17.5)
and 34.6 (SEM 7.91) mg N kg-1 dw soil for L, DL and S, respectively. When
these values were corrected for the estimated N losses, the net mineralisation
values were instead 108 (SEM 18.6), 69.0 (SEM 51.0) and 45.7 (SEM 6.58) mg
N kg-1 dw soil for L, DL and S, respectively (Figure 3). The treatments did not
differ significantly from each other before or after the correction of losses, but
the mineralisation of ley was significantly higher after correction.
4.3.2 Gaseous losses
The cumulative emissions of CO2, N2O and CH4 over 90 days added up to 255,
267 and 98 mg CO2eq kg-1 dw soil, for the L, DL and S treatments, respectively.
Soil with addition of digestate or ley thus emitted similar amounts of GHG,
despite the different quality of the added organic material and the different
relative amounts of mineral and organic N. The dominating contribution of GHG
was from N2O in all treatments. Emissions ranged from 90 to 251 mg CO2eq kg-
1 dw soil, with the lowest emissions from S and the highest from DL.
Nitrous oxide
Nitrous oxide emissions showed a sharp peak at t2d for the L treatment and lower,
but longer-lasting emissions for the DL and S treatments (Figure 4a in Paper III).
The cumulative N2O emissions over 90 days were 13.8 (SEM 1.05), 19.2 (SEM
5.32), and 6.87 (SEM 2.24) mg N2O-N kg-1 dw soil for the L, DL and S
treatments, respectively.
Carbon dioxide respiration
Carbon dioxide emissions from microbial respiration in the L treatment were
significantly higher than those in the DL and S treatments (Figure 4b in Paper
III). The cumulative CO2 emissions over 90 days were 1.87 (SEM 0.01), 0.38
(SEM 0.04) and 0.21 (SEM 0.01) g CO2-C kg-1 dw soil for the L, DL and S
treatments, respectively. Carbon dioxide respiration was significantly higher in
L compared with the other treatments (p<0.001), and DL had higher emissions
than the S reference treatment (p<0.001).
Methane
Methane emissions were generally low and fluctuated around zero, but there was
a peak in the L and DL treatments at 55 days (t55d) (Figure 4c in Paper III). The
41
cumulative CH4 emissions over 90 days were 0.27 (SEM 0.02), -0.15 (SEM
0.04) and -0.21 (SEM 0.02) mg CH4-C kg-1 dw soil for the L, DL and S
treatments, respectively. The emissions from the L treatment were significantly
higher than the emissions from the other treatments (p<0.001).
4.3.3 Total losses of carbon
Over the 90 days of incubation, 1889 (SEM 57.0), 382 (SEM 34.6) and 214
(SEM 10.2) mg C kg-1 dw (soil + amendment) were lost from the L, DL and S
treatments, respectively. These carbon losses comprised measured microbial
respiration (CO2), as well as emissions of CH4. The cumulative C losses were
significantly higher from the L treatment compared with DL and S (p<0.001).
After subtracting the C losses in the S treatment, the average C losses from the
amendments in the L and DL treatment were 49 (1.68 mg C kg-1 dw (soil +
amendment)) and 13% (0.17 mg C kg-1 dw (soil + amendment) of the total C
added through the amendments. The carbon loss from the L biomass was
significantly higher than in the DL treatment also after subtracting the C losses
of the soil (p<0.001). The total C loss from the digested ley was 42%, after
adding the amount lost as CH4 and CO2 in the digestion process to the losses
during the incubation. In total, the undigested ley added 7% less C to the soil
compared with the digested ley after 90 days of incubation, based on equivalent
amounts of added total N content as ley and digested ley to the soil.
4.4 Life cycle assessment
The aim of the LCA was to summarise the use of resources and the
environmental consequences of activities involved in farm-level scenarios using
the same crop rotation and biomass management strategies as in the field
experiment.
4.4.1 Life cycle impact assessment
The two treatments BR and AD were compared with IS, which served as a
reference scenario to represent how biomass is commonly managed on farms.
The assessment resulted in a higher GWP for the BR scenario compared with
AD and IS (Figure 3). Eutrophication potential decreased for both BR and AD
compared to IS, where the biomass was left in the field mainly in autumn, when
the uptake and growth of the crop is low (Figure 4). There was higher energy
usage at the cultivation stage in BR compared with AD (Figure 5). A sensitivity

42
analysis compared experimental data with literature data, which showed higher
GWP and eutrophication potential based on experimental data (Figure 6).
Global warming potential
The largest contributor to GWP after conversion to CO2 equivalents (Table A1
in appendix) was direct and indirect N2O emissions during and after field
application of the different types of biomass, with silage application contributing
most (35.2, 52.2, and 45.3 Mg CO2eq 100 ha-1 for IS, BR and AD, respectively)
(Figure 3). The greatest emissions from the biogas production in AD originated
mainly from CH4, emitted from the process of converting biogas to electricity.
The negative values presented as “substitution” in AD, represent avoided
emissions after substituting the Nordic energy production (Table A6) with
biogas-generated electricity (Table A5).
Figure 3. Global warming potential from the emissions in treatments with biomass redistribution
(BR) and anaerobic digestion (AD), expressed as the difference compared with the reference
scenario with biomass left in situ (IS), based on emissions from Table A7 and amount of digestate
in Table A2
-40
-30
-20
-10
0
10
20
30
BR AD
Mg C
O2eq 1
00 h
a-1
Cultivation Biogas production Substituion
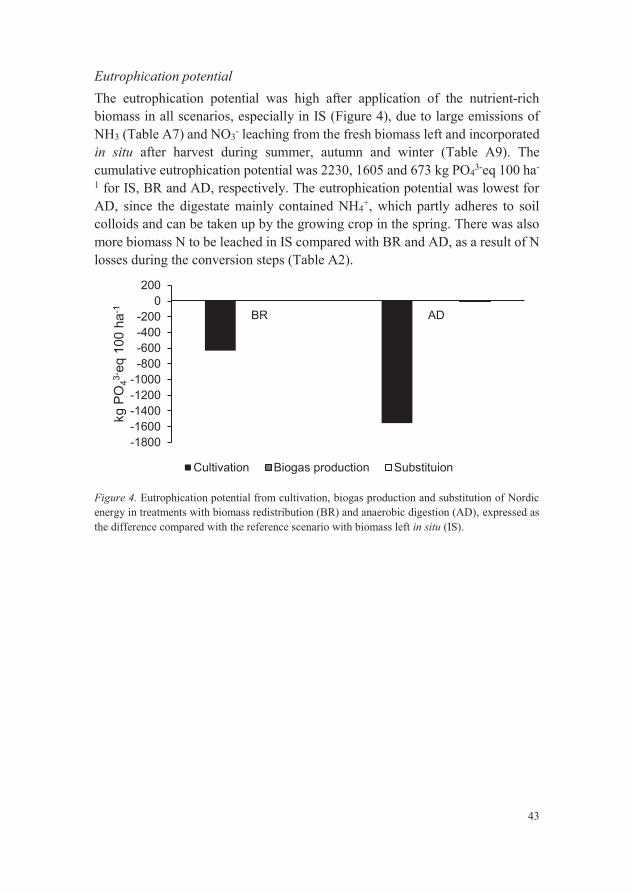
43
Eutrophication potential
The eutrophication potential was high after application of the nutrient-rich
biomass in all scenarios, especially in IS (Figure 4), due to large emissions of
NH3 (Table A7) and NO3- leaching from the fresh biomass left and incorporated
in situ after harvest during summer, autumn and winter (Table A9). The
cumulative eutrophication potential was 2230, 1605 and 673 kg PO43-eq 100 ha-
1 for IS, BR and AD, respectively. The eutrophication potential was lowest for
AD, since the digestate mainly contained NH4+, which partly adheres to soil
colloids and can be taken up by the growing crop in the spring. There was also
more biomass N to be leached in IS compared with BR and AD, as a result of N
losses during the conversion steps (Table A2).
Figure 4. Eutrophication potential from cultivation, biogas production and substitution of Nordic
energy in treatments with biomass redistribution (BR) and anaerobic digestion (AD), expressed as
the difference compared with the reference scenario with biomass left in situ (IS).
-1800
-1600
-1400
-1200
-1000
-800
-600
-400
-200
0
200
BR AD
kg P
O43- e
q 1
00 h
a-1
Cultivation Biogas production Substituion

44
Energy balance
There was higher energy usage in BR compared with AD at the crop production
stage (Figure 5). This was due to the higher diesel usage when silage was applied
to the field with a solid manure spreader, compared with the usage of a trailing
hose ramp for application of digestate (Table A10). The electricity and heat
produced in the AD scenario resulted in a surplus after deducting the energy
consumption (Figure 3).
Figure 5. Energy comparison in treatments with biomass redistribution (BR) and anaerobic
digestion (AD) between diesel energy usage in cultivation as positive values and surplus net
electricity as negative output, expressed as the difference compared with the reference scenario
with biomass left in situ (IS).
Sensitivity analysis
A sensitivity analysis was made to compare experimental data on N2O and CH4
emissions from applying biomass in the soil incubation (Figure 3), with the
emission factors given by IPCC (Table A8). All three treatments had similar
emissions with the factors from IPCC but, as AD had lost more N during the
different handling steps, slightly less GHG were produced (Figure 6). There
were major differences when the factors from IPCC and the emission factors
obtained from the soil incubation were used. The results indicated that the
emission factors from IPCC would result in a higher GWP for all the treatments.
-1600
-1400
-1200
-1000
-800
-600
-400
-200
0
200
BR AD
GJ
100 h
a-1
year
-1
Cultivation Net electricity output
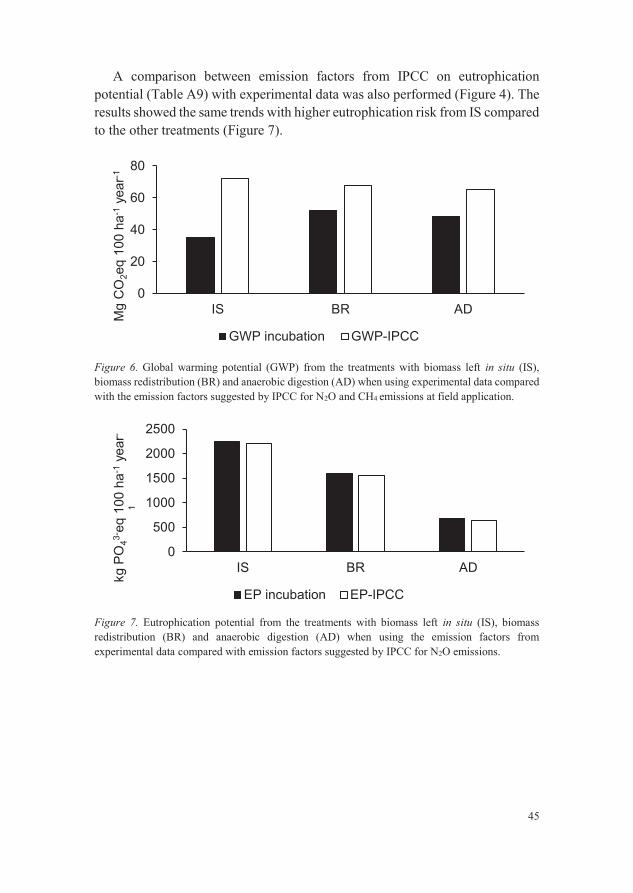
45
A comparison between emission factors from IPCC on eutrophication
potential (Table A9) with experimental data was also performed (Figure 4). The
results showed the same trends with higher eutrophication risk from IS compared
to the other treatments (Figure 7).
Figure 6. Global warming potential (GWP) from the treatments with biomass left in situ (IS),
biomass redistribution (BR) and anaerobic digestion (AD) when using experimental data compared
with the emission factors suggested by IPCC for N2O and CH4 emissions at field application.
Figure 7. Eutrophication potential from the treatments with biomass left in situ (IS), biomass
redistribution (BR) and anaerobic digestion (AD) when using the emission factors from
experimental data compared with emission factors suggested by IPCC for N2O emissions.
0
500
1000
1500
2000
2500
IS BR AD
kg P
O4
3- e
q 1
00 h
a-1
year-
1
EP incubation EP-IPCC
0
20
40
60
80
IS BR AD
Mg C
O2eq 1
00 h
a-1
year-
1
GWP incubation GWP-IPCC
46
Strategic biomass management, here comprised of biomass redistribution (BR)
and anaerobic digestion (AD), maintained levels of food crop yields, with
increased biomass production potential of cover crops and an increase in legume
proportions in intercrops, green manure and ryegrass/clover leys (Paper I). This
is important, because an increased proportion of legume biomass in the green
manure ley leads to a reduced need for external inputs of N to cover requirements
of the following crop. In stockless organic agriculture, this is of particular
importance as there are few economically viable options to supply N when there
is no access to animal manure. The first and second hypotheses of increased
yield and N content in the edible parts of the crops grown with the AD treatment,
was not confirmed, but the third hypothesis of increased cover crop yield was
confirmed for the BR treatment. The possibility of using AD as a treatment for
residual and green manure biomass without losses in yield and quality provides
the opportunity of producing bioenergy as an additional source of energy or
income for the farmer. Tuomisto and Helenius (2008) even argue that a slightly
lower crop yield in a bioenergy scenario would be acceptable in the energy
balance compared with leaving the biomass in situ.
There was no difference in soil- and biomass-derived N accumulation in the
crops in contrast to hypothesis five and hypothesis seven, which could have been
caused by the lower than expected NH4+ concentration in the digestate (Paper
II). There are several possibilities to improve the anaerobic digestion of the
feedstock, such as mixing, shredding, alkali pre-treatment and minimising the
contact with oxygen at storage prior to digestion (Hjorth et al., 2011; Carrere et
al., 2016). There may also have been N losses during handling of the digestate
and during field application of the digestate (Banks et al., 2011; Möller &
Müller, 2012). Losses of N from digestate in the field could have been decreased
by using equipment for shallow direct injection into the soil (Möller & Müller,
2012).
5 Discussion
47
The fourth hypothesis was rejected as the proportion of N2 fixation (%Ndfa)
in the legumes of this study was high, but not significantly influenced by biomass
management method. This was probably because the legumes were grown in
intercrops/mixtures with cereal/grasses. The competitive ability of cereals and
grasses for mineral N results in non-proportional acquisition of soil mineral N
between the species, leading to low availability of mineral N for the legumes and
high %Ndfa (Carlsson & Huss-Danell, 2003; Hauggaard-Nielsen et al., 2008;
Bedoussac et al., 2015). The green manure leys fixed higher amounts of N2 in
BR and AD than in IS in 2014, and a similar tendency could also be seen in
2013. The higher amount of N2 fixation in legumes, grown as green manure ley
with the BR and AD treatment, is most likely a consequence of the removal of
N-rich cuttings, reducing N availability and thereby the competitiveness of the
grasses, thus promoting growth and N2 fixation by the legumes.
The N balance that did not consider the temporary removal of residual
biomass in BR and AD resulted in a surplus in 2014 of 7.8 and 24 kg N ha-1
respectively, with the highest N surplus in the AD treatment (IS<BR<AD),
which confirmed the hypothesis. The nitrogen stored in BR and AD and applied
to the non-legume crops in the spring was potentially protected from being lost
by mineralisation during autumn and winter. This strategy thus offered an
important potential improvement for stockless organic farms, where sufficient
N supply can be in conflict with minimising the risk of N losses. The N surplus
on stockless organic farms can be as high as 194 kg ha-1 (Watson et al., 2002b).
The increased N accumulation in biomass from 2013 to 2014 described in this
thesis originated partly from higher N2 fixation in BR and AD, but mainly from
the applied residual biomass. The fact that the amount of residual biomass N
increased over time explains the negative N balances in BR and AD when the
temporary storage and redistribution of biomass N was taken into account, since
the amount of temporarily exported biomass N was larger than the amount of
biomass N redistributed from the previous year. The difference between the key
inputs and outputs at the cropping system level, i.e. N2 fixation minus N exports
in edible crop fractions, was more negative in IS than in BR and AD (Paper II).
This result further highlights the advantage of strategic biomass management in
BR and AD. The sustainability of the N management in stockless organic
farming systems depends on the balance between nutrient export via the cash
crops, nutrient inputs through N2 fixation, the level of success in internal
recycling and reduction of losses (Legg & Meisinger, 1982)). In this perspective,
the biomass N management strategies evaluated in this thesis show promising
results.
48
As hypothesised, there appeared to be an initial immobilisation of N in the
ley (L) treatment (Figure 2, in Paper III) during the first 20 days (t0d-t20d),
followed by mineralisation. However, correcting the data for N losses as gaseous
emissions resulted in cumulative mineralisation, which indicates that part of the
initial decrease in mineral N concentrations could have been due to gaseous N
losses (Figure 4, Paper III). The digestate (DL) treatment contained a large
amount of NH4+ - N at the start of the incubation, originating from the digestion
process (Table 1, Paper III). Contrary to our hypothesis, the concentration of
inorganic soil N decreased during the incubation period in DL. However, a large
part of this apparent immobilisation was most likely due to gaseous losses of N,
as indicated by measured N2O emissions and qualitative measurements of NH3,
and confirmed by decreasing amounts of 15N during the incubation. Other
studies have reported similar results (Wolf, 2014). The hypothesis that the
amount of cumulative mineral N would be higher in DL than in the L treatment
after 90 days was rejected, as there was no significant difference between the
treatments. In a field situation with spring application of digestate, it is likely
that mineralised N would be acquired by the growing crop and the emissions
would thereby be decreased. Competition between crop root absorption of
mineral N and re-absorption by microorganisms has been seen (Jingguo and
Bakken, 1997; Bruun et al., 2006). In contrast, leaving crop residues in the field
in late summer or autumn, without sowing a winter crop or cover crop, can be
associated with large losses through both leakage and gaseous emissions. When
calculating the mineralisation and immobilisation with the addition of the N lost
as gaseous emissions, there was cumulative mineralisation in all the treatments
throughout the experiment. In the absence of plants in the soil incubations, it is
likely that mineralised N was immobilised by microorganisms or emitted as
artificially high emissions of N2, N2O and NH3. Immobilisation of mineral N,
as well as high gaseous emissions, have been observed in other studies when
crop acquisition has been absent or low (Janzen and McGinn, 1991; Raun and
Johnson, 1999; Baggs et al., 2000). Much of the microbially assimilated N will
be re-mineralised, but a significant part will inevitably remain as relatively stable
organic N in the soil (Jingguo and Bakken, 1997), which was also observed in
this study.
The high CO2 respiration from L compared with the other two treatments,
during the entire incubation period (t0d to t90d), indicated high microbial activity
(Figure 3b, Paper III), which was consistent with the generally accepted
observation that undigested material is less recalcitrant compared to the
corresponding digestate (Sánchez et al., 2008). Other studies have also reported
higher soil respiration from undigested feedstock compared with application of
digested material (Möller, 2015). The undigested ley had emitted more total C
49
than the digested ley after 90 days of incubation, even after including C
emissions during the anaerobic digestion. This result is in accordance with
results from other studies, and is related to the extraction of C from easily
decomposable C structures in the digestion process, which results in a digestate
with a higher biological stability with respect to the feedstock (Marcato et al.,
2009; Tambone et al., 2009).
There were high emissions of N2O between t0d and t2d (Figure 3a, Paper III),
which can probably be explained by anaerobic conditions as a result of the high
respiration peak. A decrease in total 15N suggests large denitrification emissions
during the incubation period. Similar studies with different untreated legume
residues have found initial peaks of CO2 emission rates combined with N2O
emission peaks when the water-filled pore space is higher than 60%, as in the
present study (Aulakh et al., 1990). The relatively high water-filled pore space
in the jars (66%) could have facilitated the build-up of N2O emissions (Clayton
et al., 1997; Conen et al., 2000) and the emissions in a field situation are likely
to be lower. Aulakh et al (1990) saw similar results with N immobilisation
combined with high denitrification losses during the first 10 days of a soil
incubation with crop residues (Aulakh et al., 1990). When the emissions of CH4
and N2O were transformed to CO2 equivalents based on the 100 year factors
presented by IPCC (34 for CH4 and 298 for N2O; (Myhre et al., 2013), it was
found that the cumulative GHG emissions from ley and digested ley were
similar, with N2O dominating the emissions in all treatments. The CH4 emissions
were negligible in comparison with the magnitude of the other gaseous
emissions. The main focus for decreasing greenhouse gas emissions should
therefore be on N2O, in all steps of biomass management.
The results of the LCA confirmed the hypothesis that the AD scenario
contributed much more energy than it used, and some could be used to replace
emissions from the national electricity production. As the Nordic energy mix
used as a reference in this analysis is mainly based on renewable energy sources,
the replacement of this energy source with biogas in AD only resulted in a minor
decrease in GHG emissions. The GHG decrease in the AD treatment would be
much larger if the biogas were to be used to replace e.g. fossil vehicle fuel. The
energy production peaks coincide well with the highest energy need for heating
(winter) and the digestate production coincides well with the crop requirement
for nutrients (spring) with the reactor technology chosen for the scenario. Excess
heat and digestate from the biogas scenario could theoretically have been sold to
a neighbouring farm with greenhouse production, which would improve the
energy balance for the AD scenario. It should be kept in mind that only
differences in energy consumption were analysed in this thesis. There would, for
example, be higher diesel consumption if all the field management activities
50
were included. The BR and AD scenarios would also have had higher energy
consumption and GHG emissions if transport of biomass to the storage and
biogas reactor would have been included in the assessment.
The removal of N-rich biomass in the autumn decreased the risk of leaching
in both the BR and AD scenarios, which confirmed the hypothesis. However,
the risk assessment of N leaching was based on only one publication and it would
be interesting to use the cropping system programme VERA from the Swedish
Board of Agriculture for more accurate calculations (SJV, 2016).
The experimental data resulted in lower emissions compared with more
general emissions factors from IPCC for GWP originating mainly from field
application of fresh, ensiled or digested biomass. The difference between the
emission factors was most pronounced for IS, as the emissions originate from
residual biomass in the field, while BR and AD also emitted GHG from silage
plastic and machinery redistributing the silage or digestate. The emissions from
the three scenarios also included indirect N2O emissions originating from NH4+
and NO3-. Some emissions factors from the literature were based on animal
manure, which may introduce erroneous results. A more detailed LCA based on
results from this thesis is in progress, which will provide more precise
comparisons between the three scenarios and a more complete set of factors that
may influence emissions, eutrophication and energy use.
The end results from an LCA are partly based on subjective selection of the
category (e.g. GWP, eutrophication and energy production) considered to be the
highest priority. As we are living in an age where global warming is one of the
greatest threats to earth, the greatest attention should be devoted to the category
of global warming. The BR scenario contributed most to emissions in this
category, with direct and indirect N2O emissions from field application of silage
as the major contributor together with tractor operations. The N2O emissions
data were based on results from the soil incubation without a crop, where a
certain water-filled pore space was used and maintained during 90 days. The soil
humidity and thus the aerobic bacteria in the soil will vary and probably reduce
the total N2O production as the soil dries up in an agricultural field. Shallow
direct injection of fertiliser in the soil has the potential for keeping the emissions
low, which could potentially decrease the GHG emissions from the AD scenario
even further. The assessment of eutrophication potential resulted in potentially
lower emissions and higher energy production for the AD scenario compared
with BR and IS, which makes this a scenario of high interest and great potential
for enhancing the sustainability of organic stockless cropping systems.

51
There are ways to reduce negative impacts from food production in farming and
at the same time increase food security for a growing global population, but this
requires a large paradigm shift in diets. Stockless organic agriculture is a
challenging but attractive option that not only decreases GHG emissions, but
also uses land and N supply to produce protein and calories in a more efficient
than intensive livestock production.
The results presented in this thesis show that food, biomass for bioenergy
carriers and digestate can be produced within the same cropping system without
reductions in yield and N concentration of the food crops, relative to standard
organic farming practices, e.g. green manuring and crop residue incorporation.
Maintenance of food crop yields and increased biomass yields, as was found for
one of the cover crops, show that strategic redistribution of residual biomass
resources has potential for increasing the overall system productivity and opens
up additional biomass uses in synergy with on-farm nutrient recirculation. The
allocation of biomass resources for the additional production of CH4 without
yield losses in the AD treatment can enhance on-farm self-sufficiency and
potentially also farm profitability, depending on energy pricing.
Strategic management of biomass resources for internal recirculation to non-
legume crops has several potential advantages for sustainable N management in
arable cropping systems. This thesis shows that positive effects are dominated
by the increased N2 fixation in the legumes, compared with leaving the residues,
catch crop biomass and green manure ley cuttings in situ (Paper II). Strategically
choosing where and when to add biomass N resources in the crop rotation has
great potential to improve the N use efficiency of the cropping system.
Nevertheless, care needs to be taken when applying residual biomass to selected
crops in the cropping system, since high application rates might also lead to N
losses depending on timing and incorporation technique of the silage/digestate
into the soil. These aspects require further research about how strategic biomass
6 Conclusions

52
N management influences N losses within different processes and at the entire
cropping system level.
The losses of N as gaseous emissions were high in the experiment, as there
was no crop taking up mineralised N, which would simulate the conditions in
autumn when untreated crop residues are left in situ and no winter crop or catch
crop are sown. The gaseous emissions would possibly be reduced by crop
acquisition of mineralised N if the amendments were applied in spring. Gaseous
losses of N play an important part in determining the availability of mineralised
N for plant acquisition. Studies of mineralisation-immobilisation turnover may
be misleading if not all gaseous losses of N are measured and taken into account.
The cumulative GHG emissions from ley and digested ley were similar, with
N2O dominating the emissions in all treatments. As N2O is a potent greenhouse
gas it is of importance to aim for reductions of N2O emissions in all steps of
biomass management. More research is needed on application techniques and
pH manipulation to prevent N2O emissions from field application of digestate to
improve the strategy even further. The carbon emissions during anaerobic
digestion of crop residues do not necessarily lead to a reduced contribution to
SOC after applying digestate to the soil compared with the application of
untreated crop residue. The results presented in this thesis indicate an actual
increase in soil C after addition of digested ley.
Generalisation of the results obtained in the LCA using experimental data
from the soil incubation study to a 100 ha farm indicated that major electricity
gain could be achieved if stored silage were used to produce energy in a farm-
based anaerobic reactor.
The conclusion of the results achieved in this thesis is that it is possible to
improve the environmental sustainability on organic stockless farms with
strategic biomass management that involves a farm-based biogas reactor,
without a decrease in food production.
53
Organic production and consumption is growing, especially in Sweden and
Denmark where the organic share of food consumption is now the highest in the
world (Ryegård, 2017). Future agriculture needs to deliver more food with less
external resources, which can be partly achieved by dietary choices facilitated
by long-term strategic governance (Foley et al., 2011; Garnett, 2011; Verburg et
al., 2013). The choice of reducing or excluding animal products from the diet
would make a great decrease in greenhouse gas production if adopted by many
persons (Garnett et al., 2017). Farms have several important functions and other
potential income sources than producing and exporting food (Haberl et al., 2007;
Foley et al., 2011). Rural societies can buy electricity, heating and biogas as a
car fuel from the local farm with a biogas reactor as well as buying the food
produced, and thereby decrease transport (Bernstad & la Cour Jansen, 2011).
Problems resulting in low gas production and low revenue from farm-based
reactors have been identified in a survey made in Sweden (2015). The main
conclusion of the Rural Economy and Agricultural Society was that some cheap
and simple adjustments could increase farmer economy substantially and reduce
greenhouse gas emissions. The guidelines could hopefully give an incentive that
results in establishment of reactors on more farms than today (Bergström Nilsson
et al., 2015). Household food waste can be collected by the local municipality
or by the farmers to be used as feedstock for biogas production, together with
the residues produced on the farm. This is becoming an increasingly common
practice in north European countries (Wulf et al., 2002). A study has shown that
farmers who interact with consumers are encouraged to diversify their
production, leading to an improvement in ecosystem services, while selling a
large diversity of products at a local market can also lead to better income for
farmers (Björklund et al., 2009). Life cycle analysis has concluded that
anaerobic digestion of household waste and recycling of the digestate on the
farm reduces global warming potential, acidification (Bernstad & la Cour
Jansen, 2011) and possibly even eutrophication.
7 Future perspectives
54
More research and implementation is needed with the goal of phasing out
fossil fuel not only in the transport sector, but also in agriculture. There are many
field operations that do not require the high amount of energy contained in diesel.
It could be possible to pay a machine contractor to do the heavier work, such as
ploughing, and for farms to have tractors running on methane or electricity.
The Ministerial Communiqué (OECD) has declared that beyond its primary
function of supplying food and fibre, agriculture can also shape the landscape
and provide benefits such as land conservation, sustainable management of
renewable natural resources, preservation of biodiversity and improved socio-
economic viability of many rural areas (OECD, 2001). However, reaching such
goals calls for a focus on increased efficiency of natural resource use, improved
nutrient cycling techniques and agro-ecological methods for protecting and
possibly enhancing biodiversity (Halberg et al., 2015; Jensen et al., 2015). These
topics can be addressed by a well-planned production system based on functional
diversity of crops within the field and over the cropping season (Drinkwater &
Snapp, 2007; Niggli et al., 2008; Doré, 2011).
Functional diversification was an aim in the field experiment presented in
Paper I, but further improvement could probably be achieved by partial
replacement of annual crops with perennial or semi-perennial, as their inclusion
often results in an increase in SOC (Paustian et al., 1997; Reeves, 1997). A
dynamic agricultural landscape that hosts a diversity of species is claimed to be
more resilient (has the capacity to reorganise after disturbance) (Tscharntke et
al., 2005) and thereby enhance ecosystem services. A change in our view on the
use of natural resources and consumption pattern is needed to increase the
resilience of civic society and reduce the exploitation of nature. A large-scale
change that really makes a difference on a global scale needs to be supported by
intergovernmental policies that reward sustainable lifestyle decisions.
55
There are always many details that could have been improved in retrospect.
There are many advantages in the use of established cropping systems, where
field personnel are accustomed to the crop and the management. The machinery
and irrigation system used for the management is optimised, and long-term
effects of established treatments can be studied. The downside is that it might be
difficult to re-design the field experiment to fit the research questions. A detail
that has the potential to decrease variation and ‘edge effects’ would be to
establish larger experimental plots in the field than the 18 m2 used in Paper I and
II. This could give more robust results that better reflect the situation on
commercial farms. Harvesting two sub-samples instead of one from each plot
could give a more solid average value. A better plan for primarily mechanical
weed management would have decreased the timely manual work considerably.
Fencing off the experimental area from the surrounding field could have avoided
some of the damage caused by mammals to the crops. Another major
improvement that could have decreased potential NH3 emissions would be direct
soil incorporation of digestate. If it had been possible to use digestate with the
same composition in all three years, it would have been easier to interpret the
results and exclude variation and unknown losses of NH4+ from somewhere in
the process.
Several of the references in the LCA present emission factors based on
animal manure, which has a different composition than ley and plant-based
digestate. Those factors are planned to be used in a future publication, but with
a profound analysis of all available references on plant-based redistribution of
biomass and including transport of biomass from and to the field as diesel.
8 Critical reflections

56
Achilles, W., Döhler, H., Frisch, J., Fröba, N., Harder, H., Hüter, J., Klöble, U., Klöpfer, F.,
Krötzsch, S., Kühlbach, K., PickartMüller, M., StrasserLatner, M., Schultheiß, U.,
Weiershäuser, L., and Zimmer, E., 2005. Faustzahlen für die landwirtschaft. Darmstadt,
Germany.
Agehara, S., and Warncke, D.D., 2005. Soil moisture and temperature effects on nitrogen release
from organic nitrogen sources. Soil Science Society of America Journal 69(6), 1844-1855.
Angus, J., 2001. Nitrogen supply and demand in Australian agriculture. Animal Production
Science 41, 277-288.
Armstrong, E.L., Pate, J.S., and Tennant, D., 1994. The field pea crop in South Western
Australia-patterns of water use and root growth in genotypes of contrasting morphology and
growth habit. Functional Plant Biology 21(4), 517-532.
Askegaard, M., Olesen, J.E., and Kristensen, K., 2005. Nitrate leaching from organic arable crop
rotations: effects of location, manure and catch crop. Soil Use and Management 21, 181-188.
Audsley, E., Alber, S., Clift, R., Cowell, S., Crettaz, P., Gaillard, G., Hausheer, J., Jolliett, O.,
Kleijn, R., Mortensen, B., Pearce, D., Roger, E., Teulon, H., Weidema, B., and van Zeijts, H.,
1997. Harmonisation of environmental life cycle assessment for agriculture. Final Report
Concerted Action AIR3-CT94-2028. Silsoe Research Institute, Silsoe, UK.
Aulakh, M.S., Walters, D.T., Doran, J.W., Francis, D.D., and Mosier, A.R., 1990. Crop residue
type and placement effects on denitrification and mineralization. Soil Science Society of
America Journal 55:4, 1020-1025.
Baggs, E.M., Rees, R.M., Castle, K., Scott, A., Smith, K.A., and Vinten, A.J.A., 2002. Nitrous
oxide release from soils receiving N-rich crop residues and paper mill sludge in eastern
Scotland. Agriculture, Ecosystems & Environment 90, 109-123.
Baggs, E.M., Watson, C.A., and Rees, R.M., 2000. The fate of nitrogen from incorporated cover
crop and green manure residues. Nutrient Cycling in Agroecosystems 56, 153-163.
Bailey, A., 2016. Mainstreaming agrobiodiversity in sustainable food systems: Scientific
foundations for an agrobiodiversity index-Summary., Rome, Italy.
Banks, C.J., Chesshire, M., Heaven, S., and Arnold, R., 2011. Anaerobic digestion of source-
segregated domestic food waste: performance assessment by mass and energy balance.
Bioresource Technology 102, 612-620.
References
57
Barkle, G.F., Stenger, R., Singleton, P.L., and Painter, D.J., 2000. Effect of regular irrigation with
dairy farm effluent on soil organic matter and soil microbial biomass. Soil Research 38(6),
1087-1097.
Beaudoin, N., Saad, J.K., Van Laethem, C., Machet, J.M., Maucorps, J., and Mary, B., 2005.
Nitrate leaching in intensive agriculture in Northern France: Effect of farming practices, soils
and crop rotations. Agriculture, Ecosystems & Environment 111(1), 292-310.
Bedoussac, L., Journet, E.P., Hauggaard-Nielsen, H., Naudin, C., Corre-Hellou, G., Jensen, E.S.,
Prieur, L., and Justes, E., 2015. Ecological principles underlying the increase of productivity
achieved by cereal-grain legume intercrops in organic farming. A review. Agronomy for
sustainable development 35(3), 911-935.
Beman, J.M., Arrigo, K.R., and Matson, P.A., 2005. Agricultural runoff fuels large phytoplankton
blooms in vulnerable areas of the ocean. Nature 434(7030), 211.
Benke, A.P., Rieps, A.M., Wollmann, I., Petrova, I., Zikeli, S., and Möller, K., 2017. Fertilizer
value and nitrogen transfer efficiencies with clover-grass ley biomass based fertilizers.
Nutrient Cycling in Agroecosystems 107(3), 395-411.
Bergström Nilsson, S., Eliasson, K., Halldorf, S., and Broberg, A., 2015. Utvärdering av
gårdsbaserad biogasproduktion -Uppföljning av teknik och metanemissionsfrågor i etablerade
anläggningar. Hushållningssällskapet, pp. 1-29.
Bernal, M.P., Alburquerque, J.A., and Moral, R., 2009. Composting of animal manures and
chemical criteria for compost maturity assessment. A review. Bioresource Technology
100(22), 5444-5453.
Bernstad, A., and la Cour Jansen, J., 2011. A life cycle approach to the management of household
food waste–a Swedish full-scale case study. Waste Management 31, 1879-1896.
Björklund, J., Westberg, L., Geber, U., Milestad, R., and Ahnström, J., 2009. Local selling as a
driving force for increased on-farm biodiversity. Journal of Sustainable Agriculture 33(8),
885-902.
Björnsson, L., Prade, T., and Lantz, M., 2016. Grass for biogas - arable land as a carbon sink.
Energiforsk.
Bodirsky, B.L., Popp, A., Lotze-Campen, H., Dietrich, J.P., Rolinski, S., Weindl, I., Schmidtz, C.,
Müller, C., Bonsch, M., Humpenöder, F., Biewald, A., and Stevanovic, M., 2014. Reactive
nitrogen requirements to feed the world in 2050 and potential to mitigate nitrogen pollution.
Nature Communications 5:3858, 1-7.
Bommarco, R., Kleijn, D., and Potts, S.G., 2013. Ecological intensification: harnessing ecosystem
services for food security. Trends in Ecology and Evolution Volume 28, Pages 230-238.
Bruun, S., Luxhøi, J., Magid, J., de Neergaard, A., and Jensen, L.S., 2006. A nitrogen
mineralization model based on relationships for gross mineralization and immobilization. Soil
Biology and Biochemistry 38(9), 2712-2721.
Börjesson, P., Tufvesson, L., and Lantz, M., 2010. Life Cycle Assessment of Swedish Biofuels.
Environmental and Energy Systems Studies, Lund University, Lund, Sweden.
Canali, S., Diacono, M., Campanelli, G., and Montemurro, F., 2015. Organic no-till with roller
crimpers: Agro-ecosystem services and applications in organic Mediterranean vegetable
productions. Sustainable Agriculture Research 4(3), 70.
58
Carlsson, G., and Huss-Danell, K., 2003. Nitrogen fixation in perennial forage legumes in the
field. Plant and Soil 253, 353-372.
Carrere, H., Antonopoulou, G., Affes, R., Passos, F., Battimelli, A., Lyberatos, G., and Ferrer, I.,
2016. Review of feedstock pretreatment strategies for improved anaerobic digestion: from
lab-scale research to full-scale application. Bioresource Technology 199, 386-397.
Cassman, K.G., Dobermann, A., and Walters, D.T., 2002. Agroecosystems, nitrogen-use
efficiency, and nitrogen management. AMBIO: A Journal of the Human Environment 31(2),
132-140.
Cederberg, C., and Mattsson, B., 2000. Life cycle assessment of milk production-a comparison of
conventional and organic farming. Journal of Cleaner Production 8(1), 49-60.
Ceuterick, D.E., 1996. Proceedings of the International Conference on Application of Life Cycle
Assessment in Agriculture. Food and Non-Food Agro-Industry and Forestry, Brussels,
Belgium.
Ceuterick, D.E., 1998. Proceedings of the International Conference on Application of Life Cycle
Assessment in Agriculture. Food and Non-Food Agro-Industry and Forestry, Brussels,
Belgium.
Cherr, C.M., Scholberg, J.M.S., and McSorley, R., 2006. Green manure approaches to crop
production. Agronomy Journal 98(2), 302-319.
Clayton, H., McTaggart, I.P., Parker, J., Swan, L., and Smith, K.A., 1997. Nitrous oxide
emissions from fertilised grassland: a 2-year study of the effects of N fertiliser form and
environmental conditions. Biology and fertility of soils 25(3), 252-260.
Cohen, B.R., 2015. The Story of N: A Social History of the Nitrogen Cycle and the Challenge of
Sustainability. Agricultural History 89, 117-118.
Cole, C., Duxbury, J., Freney, J., Heinemeyer, O., Minami, K., Mosier, A., Paustian, K.,
Rosenberg, N., Sampson, N., and Sauerbeck, D., 1997. Global estimates of potential
mitigation of greenhouse gas emissions by agriculture. Nutrient Cycling in Agroecosystems
49, 221-228.
Conen, F., Dobbie, K.E., and Smith, K.A., 2000. Predicting N2O emissions from agricultural land
through related soil parameters. Global Change Biology 6(4), 417-426.
Coppens, F., Garnier, P., De Gryze, S., Merckx, R., and Recous, S., 2006. Soil moisture, carbon
and nitrogen dynamics following incorporation and surface application of labelled crop
residues in soil columns. European Journal of Soil Science 57(6), 894-905.
Corbeels, M., Hofman, G., and Van Cleemput, O., 2000. Nitrogen cycling associated with the
decomposition of sunflower stalks and wheat straw in a Vertisol. Plant and Soil 218(1-2), 71-
82.
Cowie, A., Smith, P., and Johnson, D., 2006. Does soil carbon loss in biomass production systems
negate the greenhouse benefits of bionenergy? . Mitigation and Adaptaion Strategies for
Global Change 11, 979–1002.
Crews, T.E., and Peoples, M.B., 2004. Legume versus fertilizer sources of nitrogen: ecological
tradeoffs and human needs. Agriculture, Ecosystem & Environment 102, 279–297.
Dalgaard, T., Halberg, N., and Porter, J.R., 2001. A model for fossil energy use in Danish
agriculture used to compare organic and conventional farming. Agriculture, Ecosystems &
Environment 87(1), 51-65.
59
De Boer, I.J., 2003. Environmental impact assessment of conventional and organic milk
production. Livestock production science 80(1), 69-77.
Delin, S., Stenberg, B., Nyberg, A., and Brohede, L., 2012. Potential methods for estimating
nitrogen fertilizer value of organic residues. Soil Use and Management 28(3), 283-291.
Dinnes, D.L., Karlen, D.L., Jaynes, D.B., Kaspar, T.C., Hatfield, J.L., Colvin, T.S., and
Cambardella, C.A., 2002. Nitrogen management strategies to reduce nitrate leaching in tile-
drained Midwestern soils. Agronomy Journal 94(1), 153-171.
Dodd, R.J., McDowell, R.W., and Condron, L.M., 2014. Manipulation of fertiliser regimes in
phosphorus enriched soils can reduce phosphorus loss to leachate through an increase in
pasture and microbial biomass production. Agriculture, Ecosystems & Environment 185, 65-
76.
Doré, T., Makowski, D., Malézieux, E., Munier-Jolain, N., Tchamitchian, M., Tittonell, P., 2011.
Facing up to the paradigm of ecological intensification in agronomy: revisiting methods,
concepts and knowledge. European Journal of Agronomy 34, 197-210.
Drinkwater, L.E., and Snapp, S.S., 2007. Nutrients in agroecosystems: Rethinking the
management paradigm. Advances in Agronomy 92, 163-186.
Ecoinvent, 2013-2015. Database ver. 3.0, 3.1, and 3.2. . Average of 2013-2015.
Ehhalt, D., Prather, M., Dentener, F., Derwent, R., Dlugokencky, E.J., Holland, E., Isaksen, I.,
Katima, J., Kirchhoff, V., and Matson, P.A., 2001. Atmospheric Chemistry and Greenhouse
Gases. Pacific Northwest National Laboratory (PNNL), Richland, WA (US).
Engström, L., Stenberg, M., Aronsson, H., and Lindén, B., 2010. Reducing nitrate leaching after
winter oilseed rape and peas in mild and cold winters. Agronomy for sustainable
development.
Eurostat, 2015. Agriculture - Organic farming - Organic crop area.
Eurostat, 2017. Share of energy consumption by agriculture in final energy consumption, 1994-
2014.
Evans, J., Chalk, P.M., and O'Connor, G.E., 1995. Potential for increasing N2 fixation of field pea
through soil management and genotype. Biological Agriculture & Horticulture 12(2), 97-112.
Finkbeiner, M., Inaba, A., Tan, R., Christiansen, K., and Klüppel, H.J., 2006. The new
international standards for life cycle assessment: ISO 14040 and ISO 14044. The international
journal of life cycle assessment 11(2), 80-85.
Flessa, H., Ruser, R., Dörsch, P., Kamp, T., Jimenez, M.A., Munch, J.C., and Beese, F., 2002.
Integrated evaluation of greenhouse gas emissions (CO2, CH4, N2O) from two farming
systems in southern Germany. Agriculture, Ecosystems & Environment 91(1), 175-189.
Foley, J.A., Ramankutty, N., Brauman, K.A., Cassidy, E.S., Gerber, J.S., Johnston, M., Mueller,
N.D., O/'Connell, C., Ray, D.K., West, P.C., Balzer, C., Bennett, E.M., Carpenter, S.R., Hill,
J., Monfreda, C., Polasky, S., Rockstrom, J., Sheehan, J., Siebert, S., Tilman, D., and Zaks,
D.P.M., 2011. Solutions for a cultivated planet. Nature 478, 337-342.
Foster, S.S.D., Cripps, A.C., and Smith-Carington, A., 1982. Nitrate leaching to groundwater.
Philosophical Transactions of the Royal Society of London. Series B, Biological Sciences,
477-489.
60
Foyer, C.H., Lam, H.M., Nguyen, H.T., Siddique, K.H., Varshney, R.K., Colmer, T.D., and
Cooper, J.W., 2016. Neglecting legumes has compromised human health and sustainable food
production. Nature Plants 2:8.
Fredriksson, H., Baky, A., Bernesson, S., Nordberg, Å., Norén, O., and Hansson, P.A., 2006. Use
of on-farm produced biofuels on organic farms-evaluation of energy balances and
environmental loads for three possible fuels. Agricultural Systems 89(1), 184-203.
Galloway, J.N., Dentener, F.J., Capone, D.G., Boyer, E.W., Howarth, R.W., Seitzinger, S.P.,
Asner, G.P., Cleveland, C., Green, P., and Holland, E., 2004. Nitrogen cycles: past, present,
and future. Biogeochemistry 70, 153-226.
Galloway, J.N., Townsend, A.R., Erisman, J.W., Bekunda, M., Cai, Z., Freney, J.R., Martinelli,
L.A., Seitzinger, S.P., and Sutton, M.A., 2008. Transformation of the nitrogen cycle: recent
trends, questions, and potential solutions. Science 320, 889-892.
Garnett, T., 2011. Where are the best opportunities for reducing greenhouse gas emissions in the
food system (including the food chain)? Food Policy 36, 23-32.
Garnett, T., Godde, C., Muller, A., Röös, E., Smith, P., de Boer, I., zu Ermgassen, E., Herrero,
M., van Middelaar, C., Schader, C., and H., v.Z., 2017. Grazed and Confused? Ruminating on
cattle, grazing systems, methane, nitrous oxide, the soil carbon sequestration question - and
what it all means for greenhouse gas emissions. . Food Climate Research Network, University
of Oxford.
Gellings, C.W., and Parmenter, K.E., 2016. Energy efficiency in fertilizer production and use. In:
Gellings, C., and Blok, K. (Eds.), Encyclopedia of Life Support Systems. UNESCO.
Giles, J., 2005. Nitrogen study fertilizes fears of pollution. Nature 433, 791-791.
Gode, J., Martinsson, F., Hagberg, L., Öman, A., Höglund, J., and Palm, D., 2011.
Miljöfaktahandboken 2011 -uppskattades emissionsfaktorer för bränslen, el, värme och
transport. Värmeforsk, Stockholm.
Godfray, H.C.J., Beddington, J.R., Crute, I.R., Haddad, L., Lawrence, D., Muir, J.F., ... & , and
Toulmin, C., 2010. Food security: the challenge of feeding 9 billion people. Science
327(5967), 812-818.
Goodland, R., and Anhang, J., 2009. Livestock and Climate Change. What if the Key Actors in
Climate Change Were Pigs, Chickens and Cows? . Worldwatch Institute, Washington DC, pp.
10-19.
Guinée, J., Gorree, M., Heijungs, R., Huppes, G., Kleijn, R., and de Konig, A., 1992.
Environmental Life Cycle Assessment of Products. Background and Guide, Leiden,
Neatherlands.
Gunaseelan, V.N., 1997. Anaerobic digestion of biomass for methane production: a review.
Biomass and Bioenergy 13(1-2), 83-114.
Haas, G., Wetterich, F., and Geier, U., 2000. Life cycle assessment framework in agriculture on
the farm level. The International Journal of Life Cycle Assessment 5(6), 345.
Haas, G., Wetterich, F., and Köpke, U., 2001. Comparing intensive, extensified and organic
grassland farming in southern Germany by process life cycle assessment. Agriculture,
Ecosystems & Environment 83(1), 43-53.
Haberl, H., Erb, K.H., Krausmann, F., Gaube, V., Bondeau, A., Plutzar, C., ... , and Fischer-
Kowalski, M., 2007. Quantifying and mapping the human appropriation of net primary
61
production in earth's terrestrial ecosystems. Proceedings of the National Academy of
Sciences, , pp. 12942-12947.
Halberg, N., Panneerselvam, P., and Treyer, S., 2015. Eco-functional Intensification and Food
Security: Synergy or Compromise? Sustainable Agricultural Research 4:3.
Harvey, M., and Pilgrim, S., 2011. The new competition for land: Food, energy, and climate
change. Food Policy 36, S40-S51.
Hauggaard-Nielsen, H., Jørnsgaard, B., Kinane, J., and Jensen, E.S., 2008. Grain legume–cereal
intercropping: the practical application of diversity, competition and facilitation in arable and
organic cropping systems. Renewable Agriculture and Food Systems 23, 3-12.
Hellebrand, H., Straehle, M., Scholz, V., and Kern, J., 2010. Soil carbon, soil nitrate, and soil
emissions of nitrous oxide during cultivation of energy crops. Nutrient Cycling in
Agroecosystems 87, 175-186.
Hendrix, P.F., Crossly, J.D.A., Blai, J.M., and Coleman, D.C., 1990. Soil biota as components of
sustainable agroecosystems. In: C.A. Edwards, R.L., P. Madden, R.H. Miller, G. House (Ed.).
Sustainable Agricultural Systems, Soil and Water Conservation Society, Ankeny, Iowa, pp.
pp. 637-654.
Henriksen, T.M., and Breland, T.A., 1999. Nitrogen availability effects on carbon mineralization,
fungal and bacterial growth, and enzyme activities during decomposition of wheat straw in
soil. Soil Biology and Biochemistry 31(8), 1121-1134.
Herrmann, C., Heiermann, M., and Idler, C., 2011. Effects of ensiling, silage additives and
storage period on methane formation of biogas crops. Bioresource Technology 102(8), 5153-
5161.
HIR Malmöhus, and Maskinkalkylgruppen, 2014. Maskinkostnader.
Hjorth, M., Gränitz, K., Adamsen, A.P., and Møller, H.B., 2011. Extrusion as a pretreatment to
increase biogas production. Bioresource Technology 102, 4989-4994.
Höjer, M., Ahlroth, S., Dreborg, K.H., Ekvall, T., Finnveden, G., Hjelm, O., ... , and Palm, V.,
2008. Scenarios in selected tools for environmental systems analysis. Journal of Cleaner
Production 16(18), 1958-1970.
IPCC, 2006. In: IPCC Guidelines for National Greenhouse Gas Inventories. Agriculture, Forestry
and Other Land Use. . In: Eggleston H.S., Buendia L., Miwa K., Ngara T., and Tanabe K
(Eds.). Institute for Global Environmental Strategies, Kanagawa, Japan, pp. 11.11–11.54.
IPCC, I.P.o.C.C.-. 1997. Greenhouse Gas Inventory Reference Manual. In: Houghton, J.T. (Ed.),
IPCC Technical Support Unit, London, Great Britain.
IPCC, I.P.o.C.C., 2007. Climate change 2007: Synthesis report. Summary for Policymakers.
Janzen, H.H., and McGinn, S.M., 1991. Volatile loss of nitrogen during decomposition of legume
green manure. Soil Biology and Biochemistry 23(3), 291-297.
Jensen, E.S., 1992. The release and fate of nitrogen from catch‐crop materials decomposing under
field conditions. Journal of Soil Science 43(2), 335-345.
Jensen, E.S., 1997. The role of grain legume N2 fixation in the nitrogen cycling of temperate
cropping systems. Risø National Laboratory, Roskilde, Denmark. The Royal Veterinary and
Agricultural University, Copenhagen, Denmark, pp. 1-86.
62
Jensen, E.S., Bedoussac, L., Carlsson, G., Journet, E.-P., Justes, E., and Hauggaard-Nielsen, H.,
2015. Enhancing yields in organic crop production by eco-functional intensification.
Sustainable Agriculture Research 4, 42.
Jensen, E.S., and Hauggaard-Nielsen, H., 2003. How can increased use of biological N2 fixation
in agriculture benefit the environment? Plant Soil 252, 177–186.
Jingguo, W., and Bakken, L.R., 1997. Competition for nitrogen during decomposition of plant
residues in soil: effect of spatial placement of N-rich and N-poor plant residues. Soil Biology
and Biochemistry 29(2), 153-162.
Johansen, A., Pommeresche, R., Riley, H., and Løes, A.K., 2013. Effects of applying
anaerobically digested slurry on soil available organic C and microbiota. Organic farming
systems as a driver for change, Bredsten, Denmark, pp. 125-126.
Kai, F.M., Tyler, S.C., Randerson, J.T., and Blake, D.R., 2011. Reduced methane growth rate
explained by decreased Northern Hemisphere microbial sources. Nature 476(7359), 194-197.
Kirchmann, H., Johnston, A.J., and Bergström, L.F., 2002. Possibilities for reducing nitrate
leaching from agricultural land. AMBIO: A Journal of the Human Environment 31(5), 404-
408.
Knapp, J.R., Laur, G.L., Vadas, P.A., Weiss, W.P., and Tricarico, J.M., 2014. Invited review:
Enteric methane in dairy cattle production: Quantifying the opportunities and impact of
reducing emissions. Journal of Dairy Science 97(6), 3231-3261.
Kramberger, B., Gselman, A., Janzekovic, M., Kaligaric, M., and Bracko, B., 2009. Effects of
cover crops on soil mineral nitrogen and on the yield and nitrogen content of maize. European
Journal of Agronomy 31(2), 103-109.
Kramer, K.J., Moll, H.C., and Nonhebel, S., 1999. Total greenhouse gas emissions related to the
Dutch crop production system. Agriculture, Ecosystems & Environment 72(1), 9-16.
Kumar, K., and Goh, K.M., 2003. Nitrogen release from crop residues and organic amendments
as affected by biochemical composition. Communications in Soil Science and Plant Analysis
34(17-18), 2441-2460.
Kurdali, F., Kalifa, K., and Al-Shamma, M., 1997. Cultivar differences in nitrogen assimilation,
partitioning and mobilization in rain-fed grown lentil. Field Crops Research 54(2-3), 235-243.
Lal, R., 2004. Soil carbon sequestration impacts on global climate change and food security.
Science 304(5677), 1623-1627.
Larsson, L.F., M.; Kasimir-Klemedtsson, A. & Klemedtsson, L., 1998. Ammonia and nitrous
oxide emissions from grass and alfalfa mulches. Nutrient Cycling in Agroecosystems 51, 41-
46.
Legg, O.J., and Meisinger, J.J., 1982. Soil nitrogen budgets. Nitrogen in agricultural soils.
Madison, Wis. : American Society of Agronomy.
Lehtomäki, A., and Björnsson, L., 2006. Two-stage anaerobic digestion of energy crops: methane
production, nitrogen mineralisation and heavy metal mobilisation. Environmental Technology
27:2, 209-218.
Letter, D.W., Seidel, R., and Liebhardt, W., 2003. The performance of organic and conventional
cropping systems in an extreme climate year. American Journal of Alternative Agriculture
18(3), 146-154.
63
Li, X., 2015. Legume-based catch crops for ecological intensification in organic framing.
Department of Agroecology, Science and Technology. Aarhus University, Tjele, Denmark, p.
97.
Li, X., Sørensen, P., Li, F., Petersen, S.O., and Olesen, J.E., 2015 Quantifying biological nitrogen
fixation of different catch crops, and residual effects of roots and tops on nitrogen uptake in
barley using in-situ 15N labelling. Plant and Soil 395(1-2), 273.
Liu, J., Ma, K., Ciais, P., and Polasky, S., 2016. Reducing human nitrogen use for food
production. Scientific Reports 6.
Lorenz, K., Lal, R., Preston, C.M., and Nierop, K.G., 2007. Strengthening the soil organic carbon
pool by increasing contributions from recalcitrant aliphatic bio (macro) molecules. Geoderma
142(1).
Marcato, C.E., Mohtar, R., Revel, J.C., Pouech, P., Hafidi, M., and Guiresse, M., 2009. Impact of
anaerobic digestion on organic matter quality in pig slurry. International Biodeterioration &
Biodegradation 63, 260-266.
Masclaux-Daubresse, C., Daniel-Vedele, F., Dechorgnat, J., Chardon, F., Gaufichon, L., and
Suzuki, A., 2010. Nitrogen uptake, assimilation and remobilization in plants: challenges for
sustainable and productive agriculture. Annals of Botany, mcq028.
Matsunaka, T., Sawamoto, T., Ishimura, H., Takakura, K., and Takekawa, A., 2006. Efficient use
of digested cattle slurry from biogas plant with respect to nitrogen recycling in grassland.
International Congress Series. Elsevier, pp. 242-252.
McNeill, A.M., Pilbeam, C.J., Harris, H.C., and Swift, R.S., 1996. Seasonal variation in the
suitability of different methods for estimating biological nitrogen fixation by grain legumes
under rainfed conditions. Australian Journal of Agricultural Research 47(7), 1061-1073.
MEA, 2005. Millennium Ecosystem Assessment, Ecosystems and human well-being. World
Resources Institute, Washington, DC, Island Press, Washington, DC.
Mengel, K., and Kirkby, E.A., 1978. Principles of plant nutrition. International Potash Institute,
Worblaufen-Bern, Switzerland, .
Michel, J., Weiske, A., and Möller, K., 2010. The effect of biogas digestion on the environmental
impact and energy balances in organic cropping systems using the life-cycle assessment
methodology. Renewable Agriculture and Food Systems 25, 204-218.
Mondelaers, K., Aertsens, J., and Van Huylenbroeck, G., 2009. A meta-analysis of the differences
in environmental impacts between organic and conventional farming. British food journal
111(10), 1098-1119.
Moss, A.R., Jouany, J.P., and Newbold, J., 2000. Methane production by ruminants: its
contribution to global warming. In Annales de Zootechnie 49:3, 231-253.
Mueller, T., and Thorup-Kristensen, K., 2001. N-fixation of selected green manure plants in an
organic crop rotation. Biological Agriculture & Horticulture 18(4), 345-363.
Munch, J.M., and Velthof, G.L., 2006. Denitrification and agriculture. In: Bothe, H., Ferguson,
S.J., and W.E., N. (Eds.), Biology of the Nitrogen Cycle. Elsavier, Oxford, UK, pp. 331-341.
Myhre, G., Shindell, D., Bréon, F.M., Collins, W., Fuglestvedt, J., Huang, J., ... , and Nakajima,
T., 2013. Anthropogenic and Natural Radiative Forcing. Climate Change 423, 658-740.
Mäder, P., Fliessbach, A., Dubois, D., Gunst, L., Fried, P., and Niggli, U., 2002. Soil fertility and
biodiversity in organic farming. Science 296(5573), 1694-1697.
64
Möller, K., 2015. Effects of anaerobic digestion on soil carbon and nitrogen turnover, N
emissions, and soil biological activity. A review. Agronomy for sustainable development
35(3), 1021-1041.
Möller, K., and Müller, T., 2012. Effects of anaerobic digestion on digestate nutrient availability
and crop growth: a review. Engineering in Life Sciences 12, 242-257.
Nelson, M.E., Hamm, M.W., Hu, F.B., Abrams, S.A., and Griffin, T.S., 2016. Alignment of
Healthy Dietary Patterns and Environmental Sustainability: A Systematic Review. Advances
in Nutrition: An International Review Journal 7, 1005-1025.
Nielsen, M., Nielsen, O.K., and Thomsen, M., 2010. Emissions from decentralised CHP plants
2007. Project report 5-Emission factors and emission inventory for decentralised CHP
production. National Environmental Research Institute, Aarhus University.
Niggli, U., Slabe, A., Schmid, O., Halberg, N., and Schlüter, M., 2008. Vision for an Organic
Food and Farming Research Agenda 2025 - Organic Knowledge for the Future.
Nijdam, D., Rood, T., and Westhoek, H., 2012. The price of protein: Review of land use and
carbon footprints from life cycle assessments of animal food products and their substitutes.
Food Policy 37, 760-770.
NIR, 2016. (National Inventory Report Sweden 2016). Greenhouse Gas Emission Inventories
1990-2014. Submitted under the United Nations Framework Convention on Climate Change
and the Kyoto Protocol. In: Agency, S.E.P. (Ed.).
OECD, 2001. (Organization for Economic Co-operation and Development) Multifunctionality:
towards an analytical framework. OECD Publication Service, Paris, France, pp. 1-28.
Pan, G., Smith, P., and Pan, W., 2009. The role of soil organic matter in maintaining the
productivity and yield stability of cereals in China. Agriculture, Ecosystems & Environment
129, 344-348.
Paustian, K., Andren, O., Janzen, H., Lal, R., Smith, P., Tian, G., Tiessen, H., Van Noordwijk,
M., and Woomer, P., 1997. Agricultural soils as a sink to mitigate CO2 emissions. Soil Use
and Management 13, 230-244.
Pimentel, D., Hepperly, P., Hanson, J., Douds, D., and Seidel, R., 2005. Environmental, energetic,
and economic comparisons of organic and conventional farming systems. BioScience 55(7),
573-582.
Pimentel, D., and Pimentel, M., 2003. Sustainability of meat-based and plant-based diets and the
environment. The American Journal of Clinical Nutrition 78(3).
Pinstrup-Andersen, P., 1999. Towards Ecologically Sustainable World Food Production. In:
UNEP Industry and Environment, U.N.E.P. (Ed.), Paris, France, pp. 10-13.
Powlson, D.S., 1993. Understanding the soil nitrogen cycle. Soil Use and Management 9(3), 86-
93.
Prosser, J.I., 2006. The ecology of nitrifying bacteria. In: Bolhe, H., Ferguson, S.J., and Newton,
W. (Eds.), Biology of the Nitrogen Cycle. Elsevier, Oxford, UK, pp. 223-245.
Pu, G., Bell, M., Barry, G., and Want, P., 2012. Estimating mineralisation of organic nitrogen
from biosolids and other organic wastes applied to soils in subtropical Australia. Soil
Research 50(2), 91-104.
65
Quemada, M., Baranski, M., Nobel-de Lange, M., Vallejo, A., and Cooper, J., 2013. Meta-
analysis of strategies to control nitrate leaching in irrigated agricultural systems and their
effects on crop yield. Agriculture, Ecosystems & Environment 174, 1-10.
Ranells, N.N., and Wagger, M.G., 1997. Grass-legume bicultures as winter annual cover crops.
Agronomy Journal 89(4), 659-665.
Raun, W.R., and Johnson, G.V., 1999. Improving nitrogen use efficiency for cereal production.
Agronomy journal 91, 357-363.
Recous, S., Robin, D., Darwis, D., and Mary, B., 1995. Soil inorganic N availability: effect on
maize residue decomposition. Soil Biology and Biochemistry 27(12), 1529-1538.
Reeves, D., 1997. The role of soil organic matter in maintaining soil quality in continuous
cropping systems. Soil & Tillage Research 43, 131-167.
Rehl, T., Lansche, J., and Müller, J., 2012. Life cycle assessment of energy generation from
biogas—Attributional vs. consequential approach. Renewable and Sustainable Energy
Reviews 16(6), 3766-3775.
Robertson, G.P., Paul, E.A., and Harwood, R.R., 2000. Greenhouse gases in intensive agriculture:
contributions of individual gases to the radiative forcing of the atmosphere. Science
289(5486), 1922-1925.
Rockström, J., Steffen, W., Noone, K., Persson, Å., Chapin, F.S., Lambin, E.F., Lenton, T.M.,
Scheffer, M., Folke, C., and Schellnhuber, H.J., 2009. A safe operating space for humanity.
Nature 461, 472-475.
Rubatzky, V.E., and Yamaguchi, M., 2012. World vegetables: principles, production, and
nutritive values. Springer-Verlag, Boston, MA.
Ryegård, C., 2017. Ekologisk Livsmedelsmarknad. Halvårsrapport. Ekoweb, pp. 1-6.
Sapp, M., Harrison, M., Hany, U., Charlton, A., and Thwaites, R., 2015. Comparing the effect of
digestate and chemical fertiliser on soil bacteria. Applied Soil Ecology 86, 1-9.
Schmidt H, Philipps L, Welsh J, Fragstein Pv (1999) Legume breaks in stockless organic farming
rotations: nitrogen accumulation and influence on the following crops Biological Agriculture
& Horticulture 17:159-170
Seufert, V., Ramankutty, N., and Foley, J.A., 2012. Comparing the yields of organic and
conventional agriculture. Nature 485(7397).
Shibata, H., Galloway, J.N., Leach, A.M., Cattaneo, L.R., Noll, L.C., Erisman, J.W., Gu, B.,
Liang, X., Hayashi, K., Ma, L., Dalgaard, T., Graversgaard, M., Chen, D., Nansai, K., Shindo,
J., Matsube, K., Oita, A., Su, M-C., Mishima, S-I., and Bleker, A., 2017. Nitrogen footprints:
Regional realities and options to reduce nitrogen loss to the environment. Ambio 46(2), 129-
142.
Sinclair, T.R., and Horie, T., 1989. Leaf nitrogen, photosynthesis, and crop radiation use
efficiency: a review. Crop science 29(1), 90-98.
SJV, 2016. VERA. In: Agriculture, S.B.o. (Ed.).
SMHI, S.M.a.H.I., 2013-2014. Nationell kartläggning av atmosfärskemiska data för Sveriges
miljöövervakning är framtaget av SMHI på uppdrag av Naturvårdsverket.
Smil, V., 1999. Nitrogen in crop production: An account of global flows. Global Biogeochemical
Cycles 13, 647-662.

66
Smith, J., Abegaz, A., Matthews, R.B., Subedi, M., Orskov, E.R., Tumwesige, V., and Smith, P.,
2014a. What is the potential for biogas digesters to improve soil carbon sequestration in Sub-
Saharan Africa? Comparison with other uses of organic residues. Biomass and Bioenergy 70,
73-86.
Smith, P., Bustamante, M., and Ahammad, H., 2014b. Agriculture, Forestry and Other Land Use
(AFOLU). . In: Edenhofer, O., Pichs-Madruga, R., and Sokona, Y. (Eds.), In: IPCC Climate
Change 2014: Mitigation of Climate Change. Contribution of Working Group III to the Fifth
Assessment Report of the Intergovernmental Panel on Climate Change, Cambridge, UK, pp.
811-922.
Smith, V.H., Tilman, G.D., and Nekola, J.C., 1999. Eutrophication: impacts of excess nutrient
inputs on freshwater, marine, and terrestrial ecosystems. Environmental Pollution 100(1),
179-196.
Sommer, R., and de Pauw, E., 2011. Organic carbon in soils of Central Asia-status quo and
potentials for sequestration. Plant Soil 338, 273-288.
Spalding, R.F., and Exner, M.E., 1993. Occurrence of nitrate in groundwater-a review. Journal of
Environmental Quality 22(3), 392-402.
Spiertz, J.H.J., 2010. Nitrogen, sustainable agriculture and food security. A review. Agronomy for
Sustainable Development 30, 43-55.
Stark, J.M., and Hart, S.C., 1996. Diffusion technique for preparing salt solutions, Kjeldahl
digests, and persulfate digests for nitrogen-15 analysis. Soil Science Society of America
Journal 60(6), 1846-1855.
Steffen, W., Richardson, K., Rockström, J., Cornell, S.E., Fetzer, I., Bennett, E.M., Biggs, R.,
Carpenter, S.R., de Vries, W., de Wit, C.A., Folke, C., Gerten, D., Heinke, J., Mace, G.M.,
Persson, L.M., Ramanathan, V., Reyers, B., and Sörlin, S., 2015. Planetary boundaries:
Guiding human development on a changing planet. Science 347, 1259855.
Stehfest, E., Bouwman, L., Van Vuuren, D.P., Den Elzen, M.G., Eickhout, B., and Kabat, P.,
2009. Climate benefits of changing diet. Climatic Change 95, 83-102.
Steinfeld, H., Gerber, P., Wassenaar, T.D., Castel, V., and de Haan, C., 2006. Livestock's long
shadow: Environmental issues and options. In: Organisation, F.a.A. (Ed.), Rome, Italy.
Stinner W, Moller K, Leithold G (2008) Effects of biogas digestion of clover/grass-leys, cover
crops and crop residues on nitrogen cycle and crop yield in organic stockless farming systems
European Journal of Agronomy 29:125-134
Stopes, C., Millington, S., and Woodward, L., 1996. Dry matter and nitrogen accumulation by
three leguminous green manure species and the yield of a following wheat crop in att organic
production system. Agriculture, Ecosystems and Environment 57, 189-196.
Streeter, J., and Wong, P.P., 1988. Inhibition of legume nodule formation and N2 fixation by
nitrate. Critical Reviews in Plant Sciences 7(1), 1-23.
Swift, M.J., Heal, O.W., and Anderson, J.M., 1979. Decomposition in terrestrial ecosystems
University of California Press, Berkley & Los Angeles.
Sørensen, P., and Jensen, E.S., 1991. Sequential diffusion of ammonium and nitrate from soil
extracts to a polytetrafluoroethylene trap for 15N determination. Analytica Chimica Acta 252,
201-203.
67
Sørensen, P., Kristensen, E., Odokonyero, K., and Petersen, S.O., 2013. Utilization of nitrogen in
legume-based mobile green manures stored as compost or silage. Organic farming systems as
a driver for change, Bredsten, Denmark, pp. 157-158.
Tambone, F., Genevini, P., D’Imporzano, G., and Adani, F., 2009. Assessing amendment
properties of digestate by studying the organic matter composition and the degree of
biological stability during the anaerobic digestion of the organic fraction of MSW.
Bioresource Technology 100, 3140-3142.
Thorup-Kristensen, K., 1994. The effect of nitrogen catch crop species on the nitrogen nutrition
of succeeding crops. Fertilizer Research 37(3).
Thorup-Kristensen, K., and Nielsen, N.E., 1998. Modelling and measuring the effect of nitrogen
catch crops on the nitrogen supply for succeeding crops. Plant and Soil 203, 79–89.
Tilman, D., Fargione, J., Wolff, B., D'Antonio, C., Dobson, A., Howarth, R., ... &, and
Swackhamer, D., 2001. Forecasting agriculturally driven global environmental change.
Science 292(5515), 281-284.
Tilman, D., Socolow, R., Foley, J.A., Hill, J., Larson, E., Lynd, L., Pacala, S., Reilly, J.,
Searchinger, T., and Somerville, C., 2009. Beneficial biofuels—the food, energy, and
environment trilemma. Science 325, 270-271.
Tscharntke, T., Klein, A.M., Kruess, A., Steffan‐Dewenter, I., and Thies, C., 2005. Landscape
perspectives on agricultural intensification and biodiversity-ecosystem service management.
Ecology letters 8(8), 857-874.
Tubiello, F.N., Salvatore, M., Ferrara, A.F., House, J., Federici, S., Rossi, S., ... , and Prosperi, P.,
2015. The contribution of agriculture, forestry and other land use activities to global warming,
1990-2012. Global Change Biology 21(7), 2655-2660.
Tubiello, F.N., Salvatore, M., Rossi, S., Ferrara, A., Fitton, N., and Smith, P., 2013. The
FAOSTAT database of greenhouse gas emissions from agriculture. Environmental Research
Letters 8(1).
Tufvesson, L., Lantz, M., and Björnsson, L., 2013. Miljönytta och samhällsekonomiskt värde vid
produktion av biogas från gödsel. Miljö-och energisystem, Institutionen för teknik och
samhälle, Lunds Universitet.
Tuomisto, H.L., and Helenius, J., 2008. Comparison of energy and greenhouse gas balances of
biogas with other transport biofuel options based on domestic agricultural biomass in Finland.
Agricultural and food science 17, 240-251.
Tuomisto, H.L., Hodge, I.D., Riordan, P., and Macdonald, D.W., 2012. Does organic farming
reduce environmental impacts?-A meta-analysis of European research. Journal of
Environmental Management 112, 309-320.
UNEP, 2015. The Emissions Gap Report 2015. UNEP Synthesis Report.
Unkovich, M., Herridge, D., Peoples, M., Cadish, G., Boddey, B., Giller, K., Alves, B., and
Chalk, P., 2008. Measuring plant-associated nitrogen fixation in agricultural systems.
Australian Centre for International Agricultural Research (ACIAR), Canberra, Australia.
Unkovich, M.J., and Pate, J.S., 2000. An appraisal of recent field measurements of symbiotic N2
fixation by annual legumes. Field Crops Research 65(2), 211-228.
68
van der Werf, H.M., and Petit, J., 2002. Evaluation of the environmental impact of agriculture at
the farm level: a comparison and analysis of 12 indicator-based methods. . Agriculture,
Ecosystems & Environment 93(1), 131-145.
van Kessel, C., 1994. Seasonal accumulation and partitioning of nitrogen by lentil. Plant and Soil
164(1), 69-76.
van Kessel, C., and Hartley, C., 2000. Agricultural management of grain legumes: has it led to an
increase in nitrogen fixation? Field Crops Research 65, 165-181.
Vance, C.P., 2001. Symbiotic nitrogen fixation and phosphorus acquisition. Plant nutrition in a
world of declining renewable resources. Plant Physiology 127, 390-397.
Waterer, J.G., and Vessey, J.K., 1993. Effect of low static nitrate concentrations on mineral
nitrogen uptake, nodulation, and nitrogen fixation in field pea. Journal of Plant Nutrition
16(9), 1775-1789.
Watson, C.A., Atkinson, D., Gosling, P., Jackson, L.R., and Rayns, F.W., 2002a. Managing soil
fertility in organic farming systems. Soil Use and Management 18, 239-247.
Watson, C.A., Bengtsson, H., Ebbesvik, M., Løes, A.K., Myrbeck, A., Salomon, E., and
Stockdale, E.A., 2002b. A review of farm‐scale nutrient budgets for organic farms as a tool
for management of soil fertility. Soil Use and Management 18(1), 264-273.
Weiland, P., 2010. Biogas production: current state and perspectives. Applied Microbiology and
Biotechnology 85, 849-860.
Verburg, P.H., Mertz, O., Erb, K.H., Haberl, H., and Wu, W., 2013. Land system change and food
security: towards multi-scale land system solutions. Current opinion in environmental
sustainability 5(5), 494-502.
Westhoek, H., Lesschen, J.P., Rood, T., Wagner, S., De Marco, A., Murphy-Bokern, D., ... & ,
and Oenema, O., 2014. Food choices, health and environment: effects of cutting Europe's
meat and dairy intake. Global Environmental Change 26, 196-205.
Willer, H., and Schaack, D., 2015. Organic farming and market development in Europe. In The
World of Organic Agriculture. Statistics and Emerging Trends 2015 Research Institute of
Organic Agriculture (FiBL) and International Federation of Organic Agriculture Movements
(IFOAM), pp. 174-214.
Wolf, U., 2014. Emission of NH3, N2O and CO2 following the application of differently treated
digestates from biogas production Fakultät Architektur, Bauingenieurwesen und
Umweltwissenschaften. Technischen Universität Carolo-Wilhelmina zu Braunschweig, p.
105.
World Bank, 2007. World Development Report 2008 : Agriculture for Development. Washington,
DC.
Worrell, E., Phylipsen, D., Einstein, D., and Martin, N., 2000. Energy Use and Energy Intensity
of the U.S. Chemical Industry. Energy Analysis Department, Environmental Energy
Technologies Division, Ernest Orlando Lawrence Berkeley National Laboratory, Berkeley,
California.
Wulf, S., Maeting, M., and Clemens, J., 2002. Application technique and slurry co-fermentation
effects on ammonia, nitrous oxide, and methane emissions after spreading co-fermented
slurry on arable grassland. Part II. Greenhouse gas emissions. Journal of Environmental
Quality 31, 1795-1801.
69
Zhang, F., and Li, L., 2003. Using competitive and facilitative interactions in intercropping
systems enhances crop productivity and nutrient-use efficiency. Plant and Soil 248(1), 305-
312.
70
The projected population growth requires that more high quality food is
produced in a way that is sustainable. Organically produced food is becoming
more popular and organic agriculture has the potential of meeting challenges
with loss of biodiversity and declining soil carbon in agricultural soils. However,
yields are often lower than in conventional farming, which is partly due to
insufficient nitrogen supply. Finding ways to the use harvest residues for
efficient recirculation of nitrogen within the cropping system might enhance
yields and reduce risks for nitrogen losses in organic crop production without
animals.
A field experiment with an organic crop rotation included in this thesis, have
shown promising results from using ensiled or anaerobically digested biomass,
compared to leaving residual biomass in the field after the harvest. The digestion
increases the concentration of stable carbon compounds, which can potentially
increase the soil carbon. The digestion and storage of the digestate opens up for
a possibility of improving the timing of N supply with crop uptake. The result is
less risk of leaching, compared to leaving the residues in the field in late summer
and autumn. The digestion of crop residue in a reactor produces more energy
than needed on the arable farm used as an example in the LCA in this thesis.
This opens up for an alternative income on a farm, depending on the energy
politics. This research shows that strategic redistribution of biomass-based
digestate can improve the N balance of crop rotations and produce a surplus of
bioenergy, which are key elements for enhancing the sustainability of stockless
organic cropping systems.
Popular science summary
71
Jordens befolkning ökar fortfarande, och det för med sig ett större behov mat.
Denna måste produceras hållbart för att möta utmaningar så som en utarmad
biologisk mångfald, minskat kol i marken, och övergödning av vattendrag och
hav. Ekologiskt jordbruk kan möta dessa utmaningar, men ger ofta lägre skördar
än konventionellt jordbruk på grund av att kväve tillförs i otillräckliga mängder
och ur fas med växtens behov. Genom att använda kväverika skörderester
strategiskt finns flera möjliga vinster att göra. Till exempel kan resterna rötas
och restprodukten lagras för att sedan gödsla grödan när behovet är som störst.
Resultat från fältförsöket som var en del av denna avhandling visade att ökad
kvävefixering och bättre kvävebalans kan uppnås genom att ensilera eller röta
skörderester som sedan återförs som gödning, jämfört med dagens teknik där
skörderesterna lämnas i fält efter skörden. Experiment i klimatkammare visade
även att rötning av skörderester (vall) kan minska utsläpp av koldioxid samt
bidra till att öka innehållet av kol i marken eftersom rötning ökar innehållet av
stabila kolföreningar. Livscykelanalyser tyder dessutom på att tekniken med
rötning minskar risken för utlakning. Alternativet, där skörderester lämnas i fält
på sensommaren, leder annars till lättrörligt kväve som inte tas upp utan lakas ut
på hösten när grödornas upptag sjunker. Att röta skörderester i en reaktor ger
även biogas, vilket öppnar upp för en alternativ inkomst.
Sammantaget visar resultaten i avhandlingen att strategisk omfördelning av
skörderester kan förbättra kvävebalansen i odlingssystemet och producera ett
överskott av bioenergi. Detta kan bidra till att förbättra hållbarheten i ekologiskt
jordbruk.
Populärvetenskaplig sammanfattning
72
I would like to thank my main supervisor Erik Steen Jensen for giving me the
opportunity to carry out research in a very interesting field. His knowledge on
intercropping, N2 fixation and discussions about sustainability were very
interesting to take part of. Co-supervisor Lovisa Björnsson introduced me to the
complex matter of biomass in relation to biogas production and the complexity
of life cycle analysis. My third supervisor, Georg Carlsson, showed me that it is
possible to have an eye for detail combined with a broad perspective. His
accuracy in written research communications was a great source of inspiration.
Georg was also a great support in determining the statistical layout of the
cropping system and introduced me to how and when bacterial inoculation of
legumes is a necessity.
I am grateful for the discussions with statistician Jan-Eric Englund that
helped me make decisions in the set-up of the field experiment. Emma Kreuger
was part of the initial discussion on how the digestate would be produced from
the residual biomass and was responsible for the process during the two years
when biomass was collected for digestion in the Anneberg facility. Emma also
produced the digestate in a laboratory facility for Paper III. She solved several
unforeseen challenges with the equipment in a constructive manner.
I would like to thank Svalöv Weibull and Professor Bert Vandenberg at the
College of Agriculture and Bioresources in Canada for the donation of seeds that
made it possible to initiate the cropping system. Establishing a new cropping
system without much previous experience is an adventure that calls for the
knowledge and solution focus of many good colleagues, friends and my nearest
family. When equipment and staff were not available, my parents and husband
all assisted with irrigation and weeding. Thank you Markus Nilsson, Eva and
Carl-Johan Råberg! Joakim Ekelöf was a great help when it came to general
advice, support and assisting with solutions for irrigation in the first year of the
experiment. I would like to thank the technicians at the park in Alnarp for
lending me irrigation equipment in times of need and assisting with equipment
Acknowledgements
73
to cut ley and catch crops. I have also had assistance from many colleagues on
the cabbage planting machine during these three years; Marco Tasin, Miriam
Karlsson and Maria Ernfors. Miriam Karlsson and Aman Bonaventure were
positive forces helping me by keeping an eye on dysfunctional irrigation
equipment when I was not present. Sven-Erik Svensson was great company in
harvesting both cabbage and beetroot with me. Thank you for finding equipment
that solved many problems. I am also grateful that Sven-Erik and Erik Steen
Jensen applied the silage and the digestate in two of the treatments in field
experiment while I was giving birth to my daughter in 2013. I would like to
acknowledge Lina Hirsch, who worked hard as my stand-in for almost three
months in the summer 2013, as I was on parental leave. Thank you Ryan
Davidsson for assisting with hand weeding together with students in 2014. I
would like to acknowledge especially Maria Ernfors, but also Per Ambus, Karl-
Erik Gustavsson and Anja Persson for discussions and development of
laboratory techniques related to N isotopes. Erik Rasmusson and Ulf Mårtensson
at Lönnstorp research station performed soil management and machine
harvesting with skill. It was interesting to test more bird scarecrows than I ever
thought existed. Landscape architect Christel Lindgren contributed with
conceptual illustrations of the cropping system. Thomas Prade contributed with
reflections on how to present the life cycle analysis. I would also like to
acknowledge the head of the Department Biosystems and Technology, Linda
Tufvesson, for support and inspiration. Last but not least, thank you Lo for
sharing so much joy and laughter that makes everything possible.
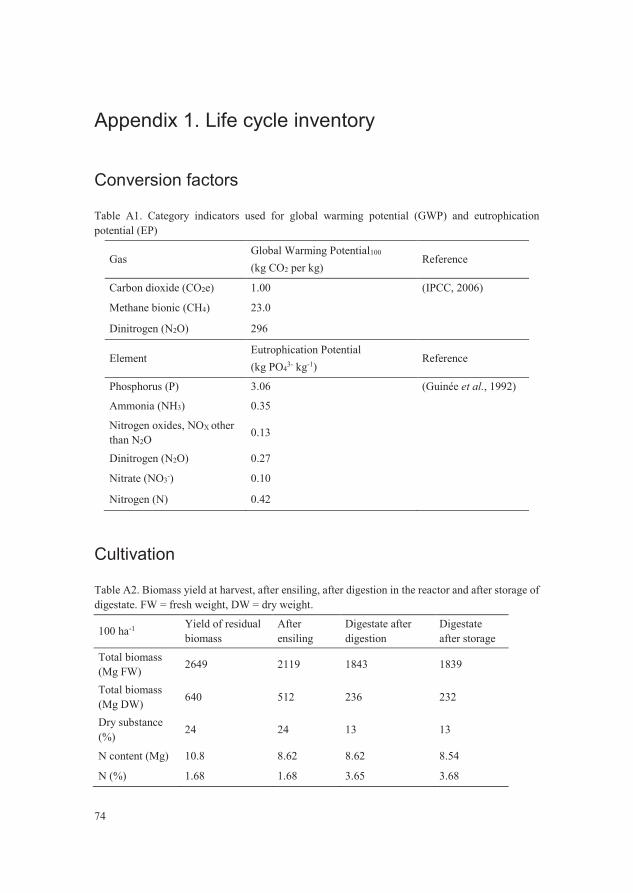
74
Conversion factors
Table A1. Category indicators used for global warming potential (GWP) and eutrophication
potential (EP)
Gas Global Warming Potential100
(kg CO2 per kg) Reference
Carbon dioxide (CO2e) 1.00 (IPCC, 2006)
Methane bionic (CH4) 23.0
Dinitrogen (N2O) 296
Element Eutrophication Potential
(kg PO43- kg-1)
Reference
Phosphorus (P) 3.06 (Guinée et al., 1992)
Ammonia (NH3) 0.35
Nitrogen oxides, NOX other
than N2O 0.13
Dinitrogen (N2O) 0.27
Nitrate (NO3-) 0.10
Nitrogen (N) 0.42
Cultivation
Table A2. Biomass yield at harvest, after ensiling, after digestion in the reactor and after storage of
digestate. FW = fresh weight, DW = dry weight.
100 ha-1 Yield of residual
biomass
After
ensiling
Digestate after
digestion
Digestate
after storage
Total biomass
(Mg FW) 2649 2119 1843 1839
Total biomass
(Mg DW) 640 512 236 232
Dry substance
(%) 24 24 13 13
N content (Mg) 10.8 8.62 8.62 8.54
N (%) 1.68 1.68 3.65 3.68
Appendix 1. Life cycle inventory
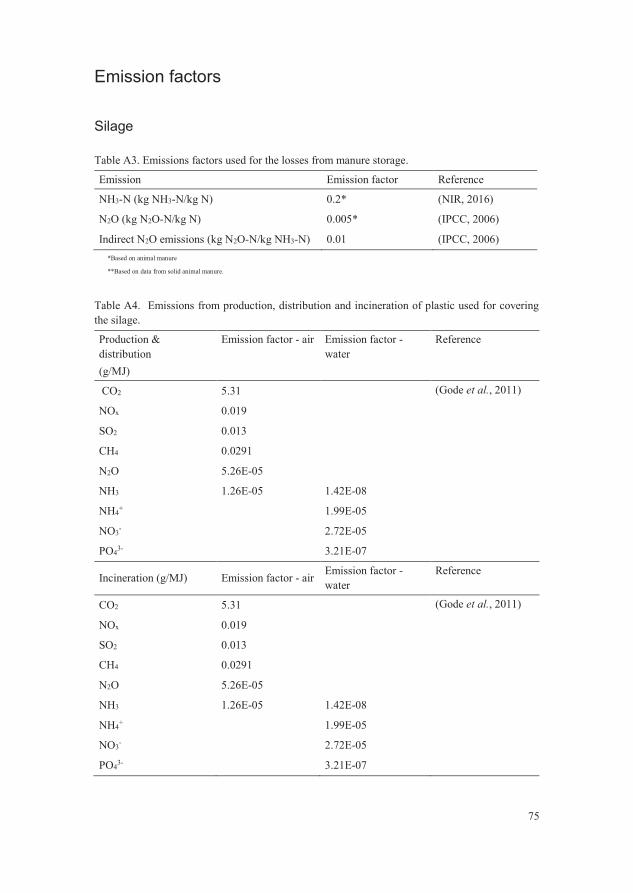
75
Emission factors
Silage
Table A3. Emissions factors used for the losses from manure storage.
Emission Emission factor Reference
NH3-N (kg NH3-N/kg N) 0.2* (NIR, 2016)
N2O (kg N2O-N/kg N) 0.005* (IPCC, 2006)
Indirect N2O emissions (kg N2O-N/kg NH3-N) 0.01 (IPCC, 2006)
*Based on animal manure
**Based on data from solid animal manure.
Table A4. Emissions from production, distribution and incineration of plastic used for covering
the silage.
Production &
distribution
(g/MJ)
Emission factor - air Emission factor -
water
Reference
CO2 5.31 (Gode et al., 2011)
NOx 0.019
SO2 0.013
CH4 0.0291
N2O 5.26E-05
NH3 1.26E-05 1.42E-08
NH4+ 1.99E-05
NO3- 2.72E-05
PO43- 3.21E-07
Incineration (g/MJ) Emission factor - air Emission factor -
water
Reference
CO2 5.31 (Gode et al., 2011)
NOx 0.019
SO2 0.013
CH4 0.0291
N2O 5.26E-05
NH3 1.26E-05 1.42E-08
NH4+ 1.99E-05
NO3- 2.72E-05
PO43- 3.21E-07

76
Biogas and digestate production
Table A5. Energy use, emissions and energy conversion from running the reactor and generator.
Activity % of gas produced Reference
Heating of the reactor 14 (Tufvesson et al., 2013)
Electricity needed in the reactor
(CSTR) 4.0
Losses of methane (heating) 1.0
Methane losses in digestion process
of total methane production 0.005
Energy conversion in generator Emission factor Reference
CH4 1.56 (Nielsen et al., 2010)
N2O 0.006
NOx 0.727
Digestate produced (m3 CH4/t VS) 271
VS in digestate (t/yr) 188
Methane production capacity factor
(%) 3.5
Methane production in digestate
storage (m3/yr) 1785
Methane losses from storage
(kg CH4/yr) 1277
Nordic energy mix
Table A6. Average emissions generated from the production of energy in the Nordic countries
between 2013 and 2015.
CO2 NOx SO2 CH4 N2O NH3 Reference
18.97 0.04 0.038 0.067 0.0018 0.0040 (Ecoinvent, 2013-2015)
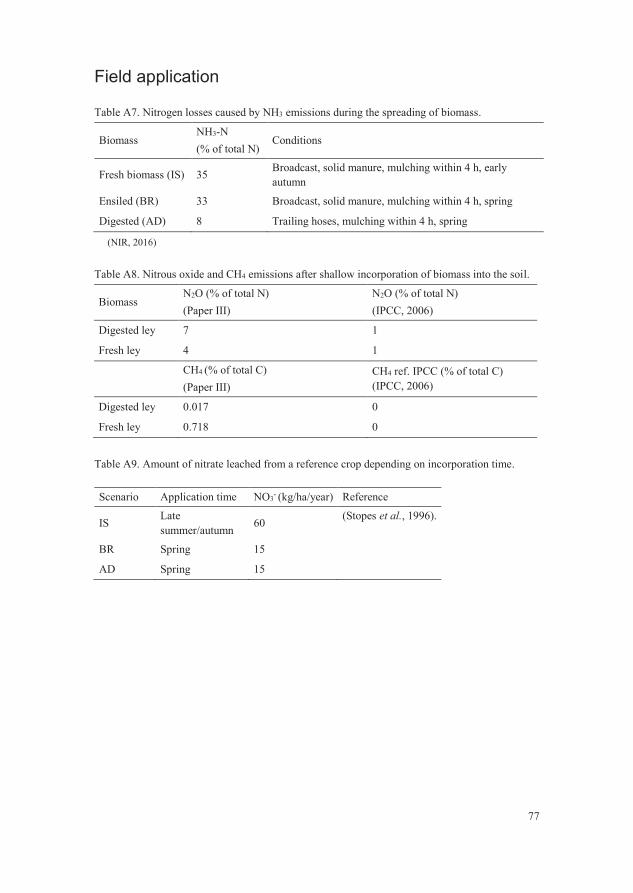
77
Field application
Table A7. Nitrogen losses caused by NH3 emissions during the spreading of biomass.
Biomass NH3-N
(% of total N) Conditions
Fresh biomass (IS) 35 Broadcast, solid manure, mulching within 4 h, early
autumn
Ensiled (BR) 33 Broadcast, solid manure, mulching within 4 h, spring
Digested (AD) 8 Trailing hoses, mulching within 4 h, spring
(NIR, 2016)
Table A8. Nitrous oxide and CH4 emissions after shallow incorporation of biomass into the soil.
Biomass N2O (% of total N)
(Paper III)
N2O (% of total N)
(IPCC, 2006)
Digested ley 7 1
Fresh ley 4 1
CH4 (% of total C)
(Paper III)
CH4 ref. IPCC (% of total C)
(IPCC, 2006)
Digested ley 0.017 0
Fresh ley 0.718 0
Table A9. Amount of nitrate leached from a reference crop depending on incorporation time.
Scenario Application time NO3- (kg/ha/year) Reference
IS Late
summer/autumn 60
(Stopes et al., 1996).
BR Spring 15
AD Spring 15
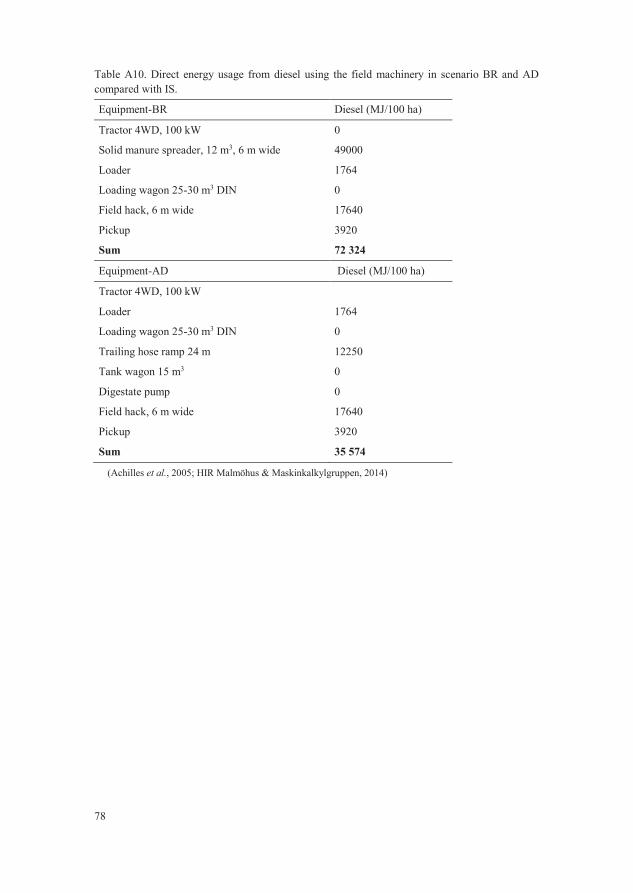
78
Table A10. Direct energy usage from diesel using the field machinery in scenario BR and AD
compared with IS.
Equipment-BR Diesel (MJ/100 ha)
Tractor 4WD, 100 kW 0
Solid manure spreader, 12 m3, 6 m wide 49000
Loader 1764
Loading wagon 25-30 m3 DIN 0
Field hack, 6 m wide 17640
Pickup 3920
Sum 72 324
Equipment-AD Diesel (MJ/100 ha)
Tractor 4WD, 100 kW
Loader 1764
Loading wagon 25-30 m3 DIN 0
Trailing hose ramp 24 m 12250
Tank wagon 15 m3 0
Digestate pump 0
Field hack, 6 m wide 17640
Pickup 3920
Sum 35 574
(Achilles et al., 2005; HIR Malmöhus & Maskinkalkylgruppen, 2014)
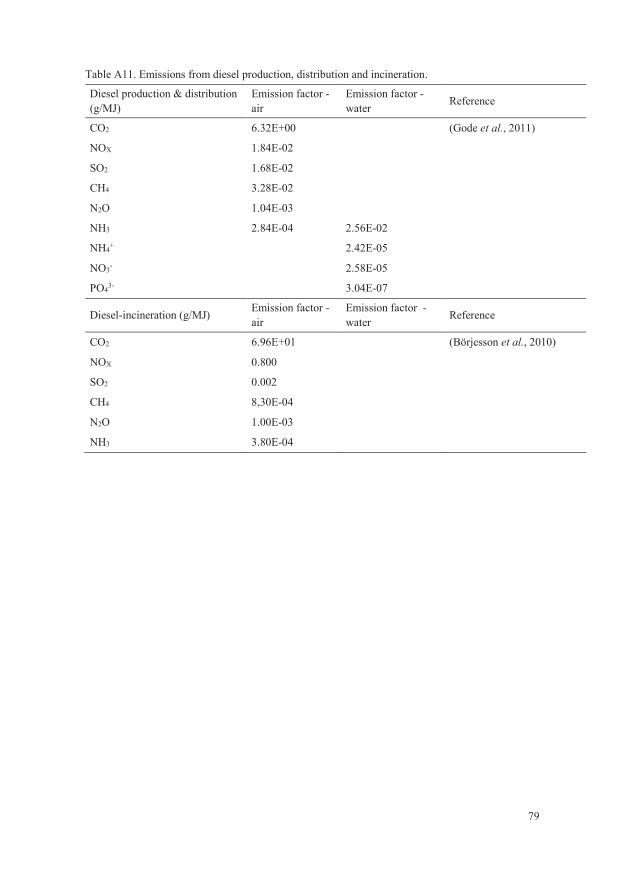
79
Table A11. Emissions from diesel production, distribution and incineration.
Diesel production & distribution
(g/MJ)
Emission factor -
air
Emission factor -
water Reference
CO2 6.32E+00 (Gode et al., 2011)
NOX 1.84E-02
SO2 1.68E-02
CH4 3.28E-02
N2O 1.04E-03
NH3 2.84E-04 2.56E-02
NH4+ 2.42E-05
NO3- 2.58E-05
PO43- 3.04E-07
Diesel-incineration (g/MJ) Emission factor -
air
Emission factor -
water Reference
CO2 6.96E+01 (Börjesson et al., 2010)
NOX 0.800
SO2 0.002
CH4 8,30E-04
N2O 1.00E-03
NH3 3.80E-04


I

Productivity in an arable and stocklessorganic cropping system may be enhancedby strategic recycling of biomassTora Matilda Råberg*, Georg Carlsson and Erik Steen Jensen
Department of Biosystems and Technology, Swedish University of Agricultural Sciences, Sweden.*Corresponding author: [email protected]
Accepted 11 April 2017 Research Paper
AbstractRecirculation of nitrogen (N) from crop residue and green-manure biomass resources may reduce the need to add newreactive N to maintain crop yield and quality. The aim of this study was to determine how different strategies for recyc-ling residual and green-manure biomass influence yield and N concentration of the edible parts of food crops in a stock-less organic cropping system. For this purpose, three biomass distribution treatments were investigated in a fieldexperiment, based on a cropping system designed to produce both high-quality food crops and biomass resourcesfrom crop residues, cover crops and a green-manure ley. The three treatments, applied at the cropping system level,were: (1) incorporating the aboveground biomass resources in situ (IS); (2) harvesting, ensiling and redistributing thesame biomass resources to the non-legume crops (biomass redistribution, BR); and (3) harvesting, ensiling and usingthe biomass resources as substrate for production of bio-methane via anaerobic digestion (AD) followed by distributionof the digestate as bio-fertilizer to the non-legume crops. The redistribution of ensiled (BR) and digested (AD) biomassdid not increase the yield of the edible parts in winter rye (Secale cereal L.), white cabbage (Brassica oleracea L.) or redbeet (Beta vulgaris L.) compared with leaving the biomass on the ground at harvest (IS). The BR treatment increased theyield of lentil intercropped with oat, compared with IS treatment in one of the two studied years. The total biomass yieldof the cover crop following winter rye was significantly higher in the BR treatment than in IS in both years. The legumeproportion in the green-manure ley was significantly higher in the AD and BR treatments as compared with IS in one ofthe experimental years. This study showed that strategic biomass redistribution has the potential to enhance biomassproductivity while maintaining food crop yields, thereby enhancing whole system productivity. Biomass redistributionsystems both with and without biogas digestion offer a new strategy for the development of multifunctional arable crop-ping systems that rely on internal nutrient cycling.
Key words: anaerobic digestion, cover crop, digestate, diversity, green-manure biomass, intercropping, agronomy, horticulture, arable,stockless, strategic recycling
Introduction
Agriculture faces the challenge of producing more foodwith fewer inputs, while simultaneously addressing pro-blems such as soil degradation, loss of biodiversity andunpredictable weather due to climate change (Harveyand Pilgrim, 2011). Governments also have elevatedexpectations that agriculture should provide additionalecosystem services such as biomass for sustainablebioenergy production and climate change mitigation(Tilman et al., 2009; Harvey and Pilgrim, 2011; Sappet al., 2015). These challenges call for a focus on eco-func-tional intensification and multifunctionality, i.e.,increased efficiency of natural resource use, improved
nutrient-cycling techniques and agro-ecological methodsfor protecting and possibly enhancing biodiversity(Halberg et al., 2015; Jensen et al., 2015). A well-planned production system with functional diversity ofcrops within the field and over the cropping season hasthe potential to improve the outcome of several of thesechallenges (Drinkwater and Snapp, 2007; Niggli et al.,2008; Doré et al., 2011).Nitrogen (N) is often the most limiting nutrient for crop
performance in terms of yield and quality, but can also bea major contributor to pollution of drinking water,eutrophication of surface water and pollution of theatmosphere with the potent greenhouse gas nitrousoxide (N2O) (Baggs et al., 2002; MEA, 2005; Galloway
Renewable Agriculture and Food Systems: Page 1 of 13 doi:10.1017/S1742170517000242
© Cambridge University Press 2017
et al., 2008; Foley et al., 2011; Cohen, 2015). Increasedlevels of N in natural or semi-natural ecosystems alsolead to a reduction in biodiversity (Zillén et al., 2008;Sutton et al., 2011). Regardless of whether the N isfixed industrially or biologically by legumes, the fixationcontributes to the availability of reactive N. Excessiveinputs of reactive N lead to disequilibrium of the planet-ary N cycle and thereby to detrimental effects on ecosys-tems (Rockström et al., 2009). Improved retention andrecycling of N is, and should continue to be, a highlyprioritized goal of policy makers, advisors and farmers(Steffen et al., 2015). It is common that farmers supplyN in stockless organic systems by including green-manure crops based on N2-fixing legumes (Watsonet al., 2002). A disadvantage is that growing greenmanures reduces the amount of land available for foodcrops. There may also be a high risk of N losses throughammonia (NH3) and N2O volatilization, and/or nitrate(NO3
−) leaching, depending on incorporation time andtechnique (Li, 2015). Another N supply option is togrow grain legumes for food production, but the organicN left in the field after grain harvest is often not sufficientto cover the needs of the succeeding non-legume crop(Beck et al., 1991; Jensen, 1997). Roots with nodules leftin the field or additional residual biomass may neverthe-less be a valuable addition to soil N.The harvest of ensiled or anaerobically digested
biomass permits target-oriented application of organicnutrients, to fertilize crops with the highest nutrientrequirements (Möller and Müller, 2012). The biogas(bio-methane) produced via anaerobic digestion can beused on the farm, or sold to the market. Generally, alarger proportion of the total N is present as mineral Nand the C/N ratio is lower in the digestate obtainedafter anaerobic digestion compared with in fresh orensiled biomass (Gutser et al., 2005). This is because thebacterial digestion of organic matter results in release ofC, mainly as methane (CH4) but also CO2, while mostof the organic N is converted to ammonium (NH4
+),which remains in the digestate (Möller and Müller,2012). Several studies have observed an increased yieldof cereals fertilized with plant-based digestate comparedwith un-digested feedstock (Stinner et al., 2008; Frøsethet al., 2014). On the other hand, Gunnarsson (2012)reports a lack of yield increase or even a decreased vege-table yield in response to fertilization with digestate, ascompared with undigested biomass harvested from agreen-manure ley (Gunnarsson, 2012). The availabilityof N in biomass and digestate for crop N acquisitionalso depends on mineralization and immobilizationdynamics, which in turn are influenced by manyfactors such as C/N ratio, temperature and moisture(Trinsoutrot et al., 2000; Nicolardot et al., 2001;Cabrera et al., 2005). If the mineralization is delayed,the application of biomass or digestate to a few crops inthe cropping system can also be expected to increase thebiomass yield and N accumulation in cover crops
growing after the fertilized main crops (Kumar andGoh, 2002; Peoples et al., 2009).The aim of this study was to compare three methods for
strategic recycling and application of residual and green-manure biomass N in terms of yield and N concentrationof the edible fraction of food crops in an organic stocklesscropping system. The crop response after leaving residualbiomass resources in situ comparedwith redistributing thesame biomass resources after ensiling or ensiling plusanaerobic digestion was evaluated in a crop rotation.Our main hypotheses were that (1) strategic recycling ofthe digestate from anaerobic digestion of biomass leadsto higher yield of winter rye, white cabbage and redbeet, due to a higher concentration of plant-available Nin the digestate compared with strategic redistributionof ensiled biomass or in situ incorporation; (2) concentra-tion of N in the edible plant parts of winter rye, whitecabbage and red beet increases with strategic recyclingof digestate, due to a higher concentration of plant-avail-able N in the digestate compared with biomass redistribu-tion and in situ incorporation; and (3) strategic recyclingof ensiled or digestate biomass increases the biomass pro-duction of the cover crops following a main crop receivingbiomass, compared with after in situ incorporation ofbiomass. The reason for the third hypothesis is that thetargeted addition of a large quantity of silage or digestatewill increase the N availability also for the cover crops fol-lowing the fertilized crops.
Materials and Methods
Study site and soil
The experiment was established in 2012 at the SwedishUniversity of Agricultural Sciences in Alnarp, Sweden(55°39′21″N, 13°03′30″E), on the SITES (SwedishInfrastructure for Ecosystem Science) field researchstation in Lönnstorp on a sandy loam soil (Table 1) char-acterized as an Arenosol (Deckers et al., 1998). The landhas been organically certified since 1993 and the preced-ing crop was a 1-yr legume-grass ley. Soil nutrient avail-ability and particle distribution was analyzed at the startof the experiment (Table 1) by a commercial soil analysislaboratory (LMI, Helsingborg, Sweden) using themodified Spurway Lawton method (extraction in 0.1%acetic acid) (Spurway and Lawton, 1949).
Climatic data
The region has a typical northern-European maritimeclimate with mild winter and summer temperatures.Lowest and highest monthly mean temperature andmonthly precipitation data from the 3 yr of the fieldexperiment are presented in Figure 1. The 30-yr (1961–1990) average for annual temperature and total annualprecipitation were 7.9°C and 666 mm, respectively, mea-sured at the weather station in Lund (55°43′N, 13°12′E).
2 T.M. Råberg et al.
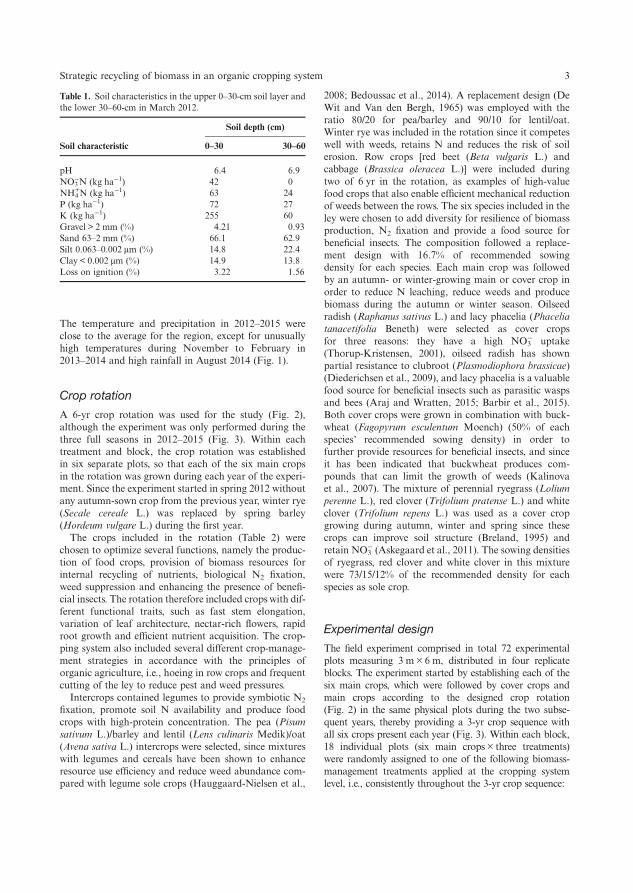
The temperature and precipitation in 2012–2015 wereclose to the average for the region, except for unusuallyhigh temperatures during November to February in2013–2014 and high rainfall in August 2014 (Fig. 1).
Crop rotation
A 6-yr crop rotation was used for the study (Fig. 2),although the experiment was only performed during thethree full seasons in 2012–2015 (Fig. 3). Within eachtreatment and block, the crop rotation was establishedin six separate plots, so that each of the six main cropsin the rotation was grown during each year of the experi-ment. Since the experiment started in spring 2012 withoutany autumn-sown crop from the previous year, winter rye(Secale cereale L.) was replaced by spring barley(Hordeum vulgare L.) during the first year.The crops included in the rotation (Table 2) were
chosen to optimize several functions, namely the produc-tion of food crops, provision of biomass resources forinternal recycling of nutrients, biological N2 fixation,weed suppression and enhancing the presence of benefi-cial insects. The rotation therefore included crops with dif-ferent functional traits, such as fast stem elongation,variation of leaf architecture, nectar-rich flowers, rapidroot growth and efficient nutrient acquisition. The crop-ping system also included several different crop-manage-ment strategies in accordance with the principles oforganic agriculture, i.e., hoeing in row crops and frequentcutting of the ley to reduce pest and weed pressures.Intercrops contained legumes to provide symbiotic N2
fixation, promote soil N availability and produce foodcrops with high-protein concentration. The pea (Pisumsativum L.)/barley and lentil (Lens culinaris Medik)/oat(Avena sativa L.) intercrops were selected, since mixtureswith legumes and cereals have been shown to enhanceresource use efficiency and reduce weed abundance com-pared with legume sole crops (Hauggaard-Nielsen et al.,
2008; Bedoussac et al., 2014). A replacement design (DeWit and Van den Bergh, 1965) was employed with theratio 80/20 for pea/barley and 90/10 for lentil/oat.Winter rye was included in the rotation since it competeswell with weeds, retains N and reduces the risk of soilerosion. Row crops [red beet (Beta vulgaris L.) andcabbage (Brassica oleracea L.)] were included duringtwo of 6 yr in the rotation, as examples of high-valuefood crops that also enable efficient mechanical reductionof weeds between the rows. The six species included in theley were chosen to add diversity for resilience of biomassproduction, N2 fixation and provide a food source forbeneficial insects. The composition followed a replace-ment design with 16.7% of recommended sowingdensity for each species. Each main crop was followedby an autumn- or winter-growing main or cover crop inorder to reduce N leaching, reduce weeds and producebiomass during the autumn or winter season. Oilseedradish (Raphanus sativus L.) and lacy phacelia (Phaceliatanacetifolia Beneth) were selected as cover cropsfor three reasons: they have a high NO3
− uptake(Thorup-Kristensen, 2001), oilseed radish has shownpartial resistance to clubroot (Plasmodiophora brassicae)(Diederichsen et al., 2009), and lacy phacelia is a valuablefood source for beneficial insects such as parasitic waspsand bees (Araj and Wratten, 2015; Barbir et al., 2015).Both cover crops were grown in combination with buck-wheat (Fagopyrum esculentum Moench) (50% of eachspecies’ recommended sowing density) in order tofurther provide resources for beneficial insects, and sinceit has been indicated that buckwheat produces com-pounds that can limit the growth of weeds (Kalinovaet al., 2007). The mixture of perennial ryegrass (Loliumperenne L.), red clover (Trifolium pratense L.) and whiteclover (Trifolium repens L.) was used as a cover cropgrowing during autumn, winter and spring since thesecrops can improve soil structure (Breland, 1995) andretain NO3
− (Askegaard et al., 2011). The sowing densitiesof ryegrass, red clover and white clover in this mixturewere 73/15/12% of the recommended density for eachspecies as sole crop.
Experimental design
The field experiment comprised in total 72 experimentalplots measuring 3 m× 6 m, distributed in four replicateblocks. The experiment started by establishing each of thesix main crops, which were followed by cover crops andmain crops according to the designed crop rotation(Fig. 2) in the same physical plots during the two subse-quent years, thereby providing a 3-yr crop sequence withall six crops present each year (Fig. 3). Within each block,18 individual plots (six main crops × three treatments)were randomly assigned to one of the following biomass-management treatments applied at the cropping systemlevel, i.e., consistently throughout the 3-yr crop sequence:
Table 1. Soil characteristics in the upper 0–30-cm soil layer andthe lower 30–60-cm in March 2012.
Soil characteristic
Soil depth (cm)
0–30 30–60
pH 6.4 6.9NO3
−N (kg ha−1) 42 0NH4
+N (kg ha−1) 63 24P (kg ha−1) 72 27K (kg ha−1) 255 60Gravel > 2 mm (%) 4.21 0.93Sand 63–2 mm (%) 66.1 62.9Silt 0.063–0.002 µm (%) 14.8 22.4Clay < 0.002 µm (%) 14.9 13.8Loss on ignition (%) 3.22 1.56
3Strategic recycling of biomass in an organic cropping system

IS—in situ incorporation of biomass resources (cropresidues, cover crops and green-manure ley), i.e., leavingthe biomass after harvest in the same plot as they weregrown.BR—biomass redistribution: storing the biomass
resources as silage and redistributing them to cabbage,red beet and rye growing in the same system in the follow-ing year.AD—anaerobic digestion of the biomass resources
(after storing them as silage) and redistributing the
digestate to cabbage, red beet and rye growing in thesame system in the following year.The residual biomass comprised straw from grain
legumes and cereals, leaves from cabbage and red beets,and all aboveground biomass of cover crops. The greenmanure consisted of ley, from which abovegroundbiomass was harvested four times. The IS treatment dif-fered from BR and AD already during the first year(2012), since biomass resources were left in situ insteadof being removed from the plot, and redistributed in thenext year as silage in BR and digested silage in AD. Incontrast, the distinction between BR and AD did notstart until the second year (2013), when the non-legumecrops were fertilized either with silage (BR) or digestate(AD). The May cuttings of the green-manure ley andthe ryegrass/clover were stored together with the otherresidual biomass sources harvested later in the growingseason, and redistributed in the following year.The distribution of N in BR and AD was based on the
strategy to use all available biomass resources for redis-tributing N to the non-legume main crops within the crop-ping system, in proportions that reflected nationalrecommendations for N fertilization of rye, cabbage andred beet, respectively. Total N content of biomass wasmeasured in subplot samples for each treatment andused to estimate total N in the residual and green-manure biomass (Table 3). The total N content, i.e., thesum of all biomass resources, was similar for the threetreatments in 2013, while in 2014, the AD treatmentresulted in a lower amount of N applied than in the ISand BR treatments. The differences in total N betweenAD biomass and AD digestate mean that there havebeen losses of N during handling of biomass, silage anddigestate in the AD treatment. Losses of N from the ISand BR systems were not quantified.
Figure 1. Mean of minimum (light gray line) and maximum (dark gray line) monthly temperatures and monthly accumulatedprecipitation (histogram) during the field experiment. The datawere retrieved from aweather station LantMet, Alnarp (55°40′N, 13°6′E).
Figure 2. Crop rotation that was used for the 3 yr crop sequence.The main crops are marked with a circle and the cover crops oroverwintering crops as an arrow.
4 T.M. Råberg et al.
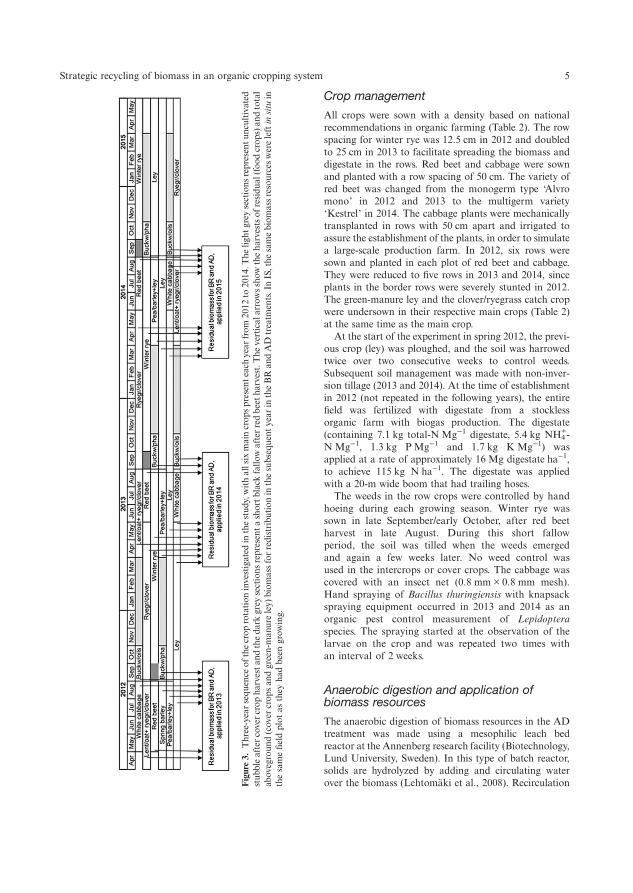
Crop management
All crops were sown with a density based on nationalrecommendations in organic farming (Table 2). The rowspacing for winter rye was 12.5 cm in 2012 and doubledto 25 cm in 2013 to facilitate spreading the biomass anddigestate in the rows. Red beet and cabbage were sownand planted with a row spacing of 50 cm. The variety ofred beet was changed from the monogerm type ‘Alvromono’ in 2012 and 2013 to the multigerm variety‘Kestrel’ in 2014. The cabbage plants were mechanicallytransplanted in rows with 50 cm apart and irrigated toassure the establishment of the plants, in order to simulatea large-scale production farm. In 2012, six rows weresown and planted in each plot of red beet and cabbage.They were reduced to five rows in 2013 and 2014, sinceplants in the border rows were severely stunted in 2012.The green-manure ley and the clover/ryegrass catch cropwere undersown in their respective main crops (Table 2)at the same time as the main crop.At the start of the experiment in spring 2012, the previ-
ous crop (ley) was ploughed, and the soil was harrowedtwice over two consecutive weeks to control weeds.Subsequent soil management was made with non-inver-sion tillage (2013 and 2014). At the time of establishmentin 2012 (not repeated in the following years), the entirefield was fertilized with digestate from a stocklessorganic farm with biogas production. The digestate(containing 7.1 kg total-N Mg−1 digestate, 5.4 kg NH4
+-N Mg−1, 1.3 kg P Mg−1 and 1.7 kg K Mg−1) wasapplied at a rate of approximately 16 Mg digestate ha−1,to achieve 115 kg N ha−1. The digestate was appliedwith a 20-m wide boom that had trailing hoses.The weeds in the row crops were controlled by hand
hoeing during each growing season. Winter rye wassown in late September/early October, after red beetharvest in late August. During this short fallowperiod, the soil was tilled when the weeds emergedand again a few weeks later. No weed control wasused in the intercrops or cover crops. The cabbage wascovered with an insect net (0.8 mm × 0.8 mm mesh).Hand spraying of Bacillus thuringiensis with knapsackspraying equipment occurred in 2013 and 2014 as anorganic pest control measurement of Lepidopteraspecies. The spraying started at the observation of thelarvae on the crop and was repeated two times withan interval of 2 weeks.
Anaerobic digestion and application ofbiomass resources
The anaerobic digestion of biomass resources in the ADtreatment was made using a mesophilic leach bedreactor at the Annenberg research facility (Biotechnology,Lund University, Sweden). In this type of batch reactor,solids are hydrolyzed by adding and circulating waterover the biomass (Lehtomäki et al., 2008). RecirculationFi
gure
3.Three-yearsequ
ence
ofthecrop
rotation
investigated
inthestud
y,withallsixmaincrop
spresenteachyear
from
2012
to20
14.T
helig
htgrey
sections
representu
ncultivated
stub
bleaftercovercrop
harvesta
ndtheda
rkgrey
sections
representa
shortb
lack
fallo
wafterredbeetha
rvest.The
verticalarrowsshow
theha
rvestsof
residu
al(foo
dcrop
s)an
dtotal
abov
egroun
d(cover
crop
san
dgreen-man
ureley)
biom
assforredistribu
tion
inthesubsequent
year
intheBRan
dAD
treatm
ents.InIS,the
samebiom
assresourceswereleftin
situ
inthesamefieldplot
asthey
hadbeen
grow
ing.
5Strategic recycling of biomass in an organic cropping system

of the liquid stimulates the microbial digestion of thebiomass, due to the continuous redistribution of inocu-lum, nutrients and dissolved organic matter (Chanakyaet al., 1997; Lissens et al., 2001). The silage feedstock inour study had a dry matter content of 24% in bothyears and was not pre-treated in any other way thanmixing the pile of silage with a tractor-carried shovelbefore loading it into the reactor. The digestion wasallowed to run for 2 months in early spring in both2012–2013 and 2013–2014. The resulting digestate wasdelivered in a liquid and solid phase (Table 4). The
mean C/N ratio of the pooled digestate (liquid + solid)was 12 and 14, in 2013 and 2014, respectively (Table 4).The total N concentration in the pooled digestate was1.1 kg Mg−1 (fresh weight) in both years, and the NH4
+-N concentration of total N was 25% in 2013 and 16%in 2014.The aim of the study was to measure the effect of
redistributing the entire residual and green-manurebiomass resource, and thus the total amount ofbiomass or digestate was divided in specific ratios tothe non-legume crops in BR and AD, respectively. The
Table 2. The components of the crop rotation with main and cover crops.
No insequence Main crop, sowing/planting density
Cover crop/winter crop (and sowing densitywhen not listed as main crop)
1 Green-manure ley: Green-manure leyOrchard grassDactylus glomerata L. ‘Luxor’, 3.3 kg ha−1
Meadow fescueFestuca pratensis L. ‘Sigmund’, 3.3 kg ha−1
TimothyPhleum pratense L. ‘Ragnar’, 2.0 kg ha−1
Yellow sweet cloverMelilotus officinalis Lam. ‘Unknown’, 3.3 kg ha−1
LucerneMedicago sativa L. ‘Creno’, 2.5 kg ha−1
Red cloverTrifolium pratense L. ‘Titus’, 2.0 kg ha−1
2 Cabbage (white cabbage) Buckwheat/oil radish:Brassica oleracea L. ‘Sir’, 40,000 plants ha−1 Buckwheat
Fagopyrum esculentum Moench‘Hanelka’, 30 kg ha−1
Oilseed radishRaphanus sativus L. ‘Unknown’, 13 kg ha−1
3 Lentil/oat intercrop: Ryegrass/clover:Lentil Perennial ryegrassLens culinaris Medik. Lolium perenne L. ‘Birger’, 22 kg ha−1
‘Le May’, 45 kg ha−1 White cloverOat Trifolium repens L. ‘Hebe’, 0.6 kg ha−1
Avena sativa L. ‘Kerstin’, 21 kg ha−1 Red cloverUndersown with ryegrass/clover cover crop T. pratense L. ‘Titus’, 0.6 kg ha−1
4 Red beet Rye (main crop no. 5)Beta vulgaris L. var. conditiva,‘Alvro mono’, 850 kg ha−1 ‘Kestrel’, 1920 kg ha−1
5 Rye (winter rye) Buckwheat/lacy phacelia:Secale cereale L. ‘Amilo’, 180 kg ha−1 Buckwheat
F. esculentum Moench‘Hanelka’, 30 kg ha−1
Lacy phaceliaPhacelia tanacetifolia Benth (unknown),12.5 kg ha−1
6 Pea/barley intercrop Green-manure ley (main crop no. 1)PeaPisum sativum L. ‘Clara’, 212 kg ha−1
Barley (spring barley)Hordeum vulgare L. ‘Tipple’, 21 kg ha−1
Undersown with green-manure ley
6 T.M. Råberg et al.

application rate to the different crops (Table 3) wasbased on a discussion with advisors in organicfarming. There was a delay in N analysis of somecrops, which made it necessary to make estimates ofconcentration of N in the BR silage based on the previ-ous year, with the aim of providing the same ratio intotal N supply in both BR and AD. The solid phaseof the digestate was mixed on a tarpaulin and weighedto achieve the right amount per crop according todefined proportions. The liquid phase was carefullystirred and then measured by volume in watering cans,according to the same proportions as the solid fraction,adding liquid on top of the distributed solid digestate. Inthe red beet and cabbage plots, applied digestate wasincorporated into the soil by non-inversion tillagemachinery before planting and sowing. The plants ofwinter rye had grown too tall to incorporate the diges-tate with machinery, and it was therefore banded onthe soil surface between the rows.
Sampling and harvest
Immediately before crop harvest, samples for analyses ofyield and crop quality were obtained by sampling sub-plots in each main crop. The samples of cereals, legumesand grasses were harvested from an area of 0.25 m2 at aposition approximately 1 m from the northern side ofeach plot. The crops were cut 5 cm above the soilsurface and divided in legumes and non-legumes beforedrying and milling. Samples were dried at 70°C for 24–72 h, depending on water content. The grain legumesand cereal grains were hand-separated from straw. Thered beet was sampled by harvesting all the plants from2 m in a centrally located row, followed by separation ofbeet roots from leaves by hand. The beet roots wererinsed with water and allowed to dry in room temperaturefor 30 min before being counted and weighed. A sub-sample consisting of two small, two large and onemedium beet root, each cut in half (discarding one-half
Table 3. Total N content in the residual and green-manure biomass from the previous year, redistributed to rye, cabbage and red beetin the BR and AD treatments and applied in situ at harvest in the IS treatment (kg ha−1).
Crop
2013 2014
ISbiomass
BRbiomass
ADbiomass
ADdigestate
ISbiomass
BRbiomass
ADbiomass
ADdigestate
Cabbage 70 130 – 140 220 260 – 180Buckwheat/oilseed
radish55 0 – 0 35 0 – 0
Lentil/oat 60 0 – 0 60 0 – 0Ryegrass/clover 80 0 – 0 35 0 – 0Red beet 20 90 – 90 110 150 – 70Rye 60 248 – 160 20 100 – 130Buckwheat/lacy
phacelia35 0 – 0 30 0 – 0
Pea/barley 15 0 – 0 20 0 – 0Ley 90 0 – 0 50 0 – 0Total N in biomass1 485 465 455 390 580 510 480 380
1 Refers to yield from 6 ha.
Table 4. Composition of digestate produced from residual and green-manure biomass in the studied cropping system in 2013 (fromanaerobic digestion of biomass resources harvested in 2012) and 2014 (from anaerobic digestion of biomass resources harvested in2013).
Digestate characteristics
2013 2014
Liquid Solid Liquid Solid
pH 7.4 – 7.2 –Amount (kg) 2110 449 1800 585C/N 3.83 16.2 3.90 16.7NH4
+-N (kg Mg−1) 0.26 (0.03) 0.31 (0.01) 0.15 (0.10) 0.27 (0.03)Total N (kg Mg−1) 0.42 (0.16) 4.22 (0.49) 0.30 (0.00) 3.86 (0.25)P (kg Mg−1) 0.01 (0.00) 0.65 (0.18) 0.01 (0.00) 0.40 (0.13)K (kg Mg−1) 1.35 (0.07) 1.90 (0.42) 1.20 (0.00) 1.40 (0.42)
Standard deviation of 2–3 samples is presented within brackets. Data are based on fresh weight analyses.
7Strategic recycling of biomass in an organic cropping system
of each beet), was dried and milled. This samplingmethod was chosen to get a representative nutrient sub-sample from the core to the skin from beets of differentsizes. Four adjacent cabbages in a central row were har-vested for analysis of the weight of the residue andedible fraction. The edible fraction was defined as atight smooth head, and the rest of the plant was definedas residue. A 1-cm thick slice was cut all the way intothe core as a subsample from all four heads. The samplewas weighed, dried and milled.The crops and biomass resources used for digestion and
redistribution were harvested on the entire area of eachplot (after subsampling for analyses, as described above)with methods that mimicked commercial farming prac-tices as far as possible. Ley and cover crops were cutwith a large-scale lawn mower and the harvest fromeach plot was collected and weighed in bags. Grainlegume/cereal intercrops were harvested with a SampoRosenlew plot combine harvester with a bag collectingthe straw from each plot for weighing. Red beet leavesand cabbage residues (the outermost layer of leaves)were separated from the beets and heads, and weighedin the field prior to ensiling the residues. The biomass inthe BR and AD treatments was collected in separate 1-m3 plastic containers, where it was compressed andcovered with a tarpaulin and four 15-kg sandbags. Thefirst biomass was collected in May and the last inOctober. The cuttings from the May harvest of thegreen-manure ley and ryegrass/clover cover crop wereensiled, and also digested in AD, in preparation for appli-cation in the next growing season (Fig. 3).The green-manure ley was harvested once in August in
2012, as it was established the same spring, and the yieldwas expected to be low compared with if the ley is estab-lished the previous year by undersowing in a main crop.The second harvest was in May 2013 before tilling andestablishing the next crop. The green-manure ley under-sown in pea/barley in 2012 was harvested at three consecu-tive occasions in 2013: in June, July and September, withan additional harvest occasion in May 2014 before soiltilling. Similarly, the green-manure ley undersown to pea/barley in 2013 was harvested at three occasions in 2014(June, August and September) plus a fourth occasion inMay 2015. The grain legumes and cereals were harvestedwhen they were mature, while the harvest of cabbage andred beet was based on optimal timing for yield andquality, but also so that there was sufficient time for estab-lishment and growth of cover and winter crops before theonset of winter. All biomass resources were weighed(total fresh weight per plot) before ensiling, and subsam-ples were used for analyses of dry matter concentration.
Calculations and statistics
The effect of the different biomass-management systemswas measured in terms of yield (food fraction and straw/residual leaves), with the intercrops separated into
legumes and non-legumes. Nitrogen concentration in theedible fraction of the crops was measured as a quality par-ameter, using an elemental analyzer (PDZ Europe ANCA-GSL for the intercrops and Flash 2000, Thermo Scientificfor rye, cabbage and red beet). The data were analyzedwith a general linear model and Tukey’s post hoc analysisat a 5% significance level using the software Minitab 16.
Results
Yield and N concentration of rye, cabbage andred beet
The yield of the edible fraction of rye, cabbage and redbeet neither show any statistically significant differencein yield between treatments (Table 5), nor did the treat-ments result in different concentrations of N in theedible fraction of rye, cabbage and red beet (Table 6) oryield of biomass residue (Table 7).
Yield and N concentration of the intercropslentil/oat and pea/barley
The lentil grain yield was significantly lower in IS com-pared with BR in 2013 (Table 5). Data are not availablefor the grain yield of pea and barley intercrop in 2013,since the crop was severely damaged by rabbits andhares that year. The biomass treatments did not resultin any significant difference in the N concentration ofgrain legume or cereal seeds. The IS treatment resultedin significantly higher yields of oat straw in both years(Table 7).
Yield of cover crops and green-manure ley
The yield of buckwheat/lacy phacelia (grown after rye)was significantly higher in BR compared with IS andAD in both years (Table 7). The redistributed biomass(BR and AD) had no carry-over effect on the othercover crops. The clover proportion of the ryegrass/clovercover crop was exceptionally low in general for all thetreatments at harvest in 2013. The legume proportion ofthe green-manure ley was significantly higher in the BRand AD treatments compared with IS in 2014.
Discussion
As compared with the IS treatment, removal of biomass(AD and BR) resulted in a shift in legume/non-legume pro-portions in several of the crop mixtures, i.e., higher lentilgrain yield in 2013, lower oat straw biomass in both yearsand higher legume yields in the green-manure ley in2014. This shift is most likely a result of the removal ofN-rich biomass in treatments BR and AD comparedwith IS, leading to reduced N availability and thereby alower competitive ability of the oat in the intercrop and
8 T.M. Råberg et al.

the grasses in the ley. Our results thereby confirm previousfindings about the effect of N availability on legume/non-legume proportions in crop mixtures (Ledgard andSteele, 1992; Jensen, 1996; Hejcman et al., 2010).We did not observe a significant effect of the biomass
management on yields of rye, cabbage and red beet orthe other crops, indicating that biomass removal andextraction of CH4 could be performed without a decreasein yields or N concentration of the food crops. However,the hypotheses that redistributing the digestate fromanaerobic digestion of the biomass resources wouldhave a positive effect on crop yields and crop N concen-tration had to be rejected. It is possible that the higher Navailability in the digestate also led to higher losses of Nthrough NH3 volatilization during handling and afterfield application of the digestate (pH value of digestatein this study: 7.2–7.4). In particular, it is likely thatNH3 losses occurred in winter rye in the AD treatment,
as it was not possible to inject the digestate into the soilor till after application (Möller and Stinner, 2009;Möller and Müller, 2012), due to the advanced growthstage of the established crop. There may also have beenlosses of NH4
+ via seepage from silage and when thesilage was mixed prior to digestion. Potential N lossesin the AD system might thus have counteracted theexpected benefits of a higher N availability for crop Nacquisition.Our third hypothesis was supported by the result that
the buckwheat/lacy phacelia following winter rye pro-duced higher biomass yields in the BR than in the IS treat-ment, which could be explained by the higher addition ofbiomass N to the preceding main crop in BR than in IS.The fact that the corresponding yield effect was notobserved in the main crop (rye) receiving the biomass Nin BR indicates that the mineralization was delayed,and not in synchrony with the requirements of the main
Table 5. Yield of edible fraction (dry weight), presented as average ± standard error of the mean (n= 4).
Crop
Yield (Mg ha−1)
2013 2014
IS BR AD IS BR AD
Rye 5.10a ± 0.55 5.54a ± 0.96 6.07a ± 0.62 4.94a ± 0.35 5.36a ± 0.63 4.38a ± 0.51Cabbage 3.38a ± 0.55 2.60a ± 0.53 3.02a ± 0.21 2.76a ± 0.48 3.22a ± 0.51 3.70a ± 0.73Red beet 1.89a ± 0.76 1.41a ± 0.58 2.42a ± 0.55 2.54a ± 0.21 2.83a ± 0.44 2.45a ± 0.40Lentil/oat IC 2.86a ± 0.45 3.36a ± 0.46 2.92a ± 0.53 2.12a ± 0.66 2.56a ± 0.51 2.22a ± 0.36
Lentil 0.46b ± 0.08 0.88a ± 0.13 0.81ab ± 0.06 0.34a ± 0.08 0.35a ± 0.10 0.28a ± 0.06Oat 2.40a ± 0.52 2.48a ± 0.52 2.12a ± 0.50 1.78a ± 0.72 2.21a ± 0.58 1.94a ± 0.35
Pea/barley IC NA NA NA 2.00a ± 0.69 2.82a ± 0.17 1.38a ± 0.53Pea NA NA NA 0.99a ± 0.26 1.25a ± 0.14 0.94a ± 0.35Barley NA NA NA 1.01a ± 0.52 1.57a ± 0.29 0.44a ± 0.22
IS, in situ incorporation; BR, biomass redistributed to the non-leguminous crops; AD, digested biomass distributed to the non-legu-minous crops; NA, data not available.Intercrops are shown both as total and separate as IC component yields. Means that do not share a letter within a row and year aresignificantly different. Bold indicates year and crop with significant effect of biomass treatment.
Table 6. Nitrogen concentration (%) of the edible fraction of the crops, presented as average ± standard error of the mean (n= 4).
Crop
Nitrogen concentration (%)
2013 2014
IS BR AD IS BR AD
Rye 1.45 ± 0.09 1.55 ± 0.07 1.46 ± 0.06 0.86 ± 0.05 0.91 ± 0.05 0.92 ± 0.04Cabbage 1.35 ± 0.10 1.72 ± 0.16 1.48 ± 0.05 2.13 ± 0.51 1.87 ± 0.33 1.66 ± 0.16Red beet 2.50 ± 0.27 2.26 ± 0.13 2.16 ± 0.22 1.65 ± 0.15 1.42 ± 0.11 1.68 ± 0.16Lentil IC 4.54 ± 0.10 4.14 ± 0.09 4.35 ± 0.12 4.10 ± 0.05 4.29 ± 0.09 4.16 ± 0.09Oat IC 1.95 ± 0.05 1.82 ± 0.15 1.68 ± 0.10 2.18 ± 0.06 2.11 ± 0.07 2.13 ± 0.10Pea IC 3.46 ± 0.03 3.64 ± 0.16 3.63 ± 0.13 3.28 ± 0.14 3.17 ± 0.22 3.17 ± 0.21Barley IC 1.73 ± 0.18 1.72 ± 0.07 1.64 ± 0.09 1.77 ± 0.27 1.72 ± 0.21 1.91 ± 0.26
IS, in situ incorporation; BR, biomass redistributed to the non-leguminous crops grown in pure stand; AD, digested biomass distrib-uted to the non-leguminous crops grown in pure stand.
9Strategic recycling of biomass in an organic cropping system

crop, but leading to an increased N availability for thesubsequent cover crop. Moreover, the lack of a corre-sponding increase of the same cover crop biomass yieldin the AD treatment, even in 2014 when rye in ADreceived more N than rye in BR (Table 3), implies thatthe N dynamics differ if the residual biomass is appliedas silage or digestate. As discussed above, potentiallyhigher NH3 emissions after field application of the diges-tate (Wulf et al., 2002) compared with silage may explainthe lack of yield increase of cover crops in AD.Since this study was based on recycling, all biomass
resources obtained within the cropping system inclusionof N-poor biomasses such as cereal straw contributed toa relatively low total N concentration in the digestate.The digestate also contained water added during thedigestion process, which diluted the nutrient concentra-tion expressed on a fresh weight basis (1.1 kg N Mg−1).The C/N ratio (12–14) of our digestate was within therange (7–39) of other plant-based digestate (Mölleret al., 2008; Gunnarsson et al., 2010; Gunnarsson et al.,2011; Frøseth et al., 2014). The NH4
+-N proportion oftotal N (16–25%) and concentration of NH4
+-N (0.18–0.27 kg NH4
+-N Mg−1 fresh weight) in our digestatewere also within, but at the lower end of the range ofplant-based digestate from other studies (6–55% NH4
+-N
of total N; 0.18–1.52 kg NH4+-N Mg−1 fresh weight)
(Möller et al., 2008; Gunnarsson et al., 2010;Gunnarsson et al., 2011). The relatively low concentrationof NH4
+-N in the digestate in our study indicates that thedigestion of the biomass has not been efficient, whichmight in turn lead to a slow mineralization of theorganic N in the soil. The chemical composition of thedigestate depends both on the composition and pre-treat-ment of the feedstock, and the lack of pre-treatment (e.g.,shredding) might also have contributed to a low concen-tration of NH4
+-N in the digestate.The biomass treatments did not result in different N
concentrations in the food fraction of cereals orlegumes. There was a trend of normal to high N concen-trations in oat in this study, as compared with the meanconcentration for the variety when it is grown in similarclimate (Hagman et al., 2014). The barley grain N con-centration was on average in line with the criticaloptimum for desirable malting quality, i.e., <1.84% N(Bertholdsson, 1999). The mean N concentration of thewinter rye variety ‘Amilo’ in variety tests (Hagmanet al., 2014) is similar to results from our experiment in2013, while all treatments resulted in lower N concentra-tions in 2014, indicating suboptimal N supply for rye inthe second year of the experiment.
Table 7. Yield (dry weight) from crop residues, green-manure ley and cover crops presented as average ± standard error of the mean (n= 4, * = n= 3).
Crop
Yield (Mg ha−1)
2013 2014
IS BR AD IS BR AD
Rye 5.03a ± 0.53 5.32a ± 0.71 5.80a ± 0.22 7.76a ± 0.64 7.95a ± 0.66 6.75a ± 0.56Cabbage 2.31a ± 0.27 2.16a ± 0.23 3.03a ± 0.26 1.54a ± 0.20 1.71a ± 0.22 1.82a ± 0.19Red beet 0.65a ± 0.29 0.71a ± 0.24 0.78a ± 0.10 1.23a ± 0.09 1.30a ± 0.20 1.12a ± 0.11Buckwheat/oilseed radish 1.97a ± 0.16 2.05a ± 0.10 2.03a ± 0.25 1.50a ± 0.13 1.56a ± 0.08 1.55a ± 0.18Buckwheat/lacy phacelia 0.67b ± 0.18 1.96a ± 0.32 0.92b ± 0.10 1.18b ± 0.10 2.15a ± 0.08 1.26b ± 0.12Lentil/oat IC 4.97a ± 0.31 4.74a ± 0.30 4.78a ± 0.42 3.93a ± 0.13 3.47a ± 0.25 3.55a ± 0.26Lentil 0.92a± 0.11 1.46a± 0.36 1.29a± 0.33 0.56a± 0.16 0.60a± 0.09 0.55a± 0.14Oat 4.05a± 0.28 3.28b± 0.10 3.49b± 0.28 3.36a± 0.18 2.88b± 0.31 2.93b± 0.22
Pea/barley IC 4.61a ± 0.15 4.26a ± 0.45 4.16a ± 0.43 5.26a ± 0.54 4.94a ± 0.36 4.47a ± 0.39Pea 1.77a± 0.25 1.71a± 0.17 1.49a± 0.17 2.47a± 0.33 1.82a± 0.17 2.37a± 0.33Barley 2.84a± 0.28 2.54a± 0.48 2.67a± 0.32 2.79a± 0.29 3.12a± 0.28 2.10a± 0.29
Green-manure ley 12.1a ± 3.30* 12.7a ± 0.81* 12.7a ± 0.91* 17.5a ± 0.75 20.9a ± 1.72 18.3a ± 0.98Ley—legume 0.88a± 0.25 3.07a± 0.67 2.23a± 0.59 3.01b± 0.68 6.94a± 0.99 6.78a± 0.94Ley—non-legume 11.3a± 3.75 9.63a± 1.46 10.4a± 0.79 14.5a± 1.16 13.9a± 0.86 12.2a± 0.80
Ryegrass/clover 0.55a ± 0.12 0.74a ± 0.07 0.73a ± 0.08 4.12a ± 0.21 4.22a ± 0.40 5.00a ± 0.61Ryegrass 0.55a± 0.12 0.73a± 0.07 0.73a± 0.08 3.22a± 0.24 3.05a± 0.60 3.26a± 0.56Clover 0.00a± 0.00 0.01a± 0.00 0.00a± 0.00 0.89a± 0.23 1.17a± 0.38 1.74a± 0.25
Sum of biomass (Mg 6 ha−1)32.9 34.6 34.9 44.0 48.1 43.8
IS, in situ incorporation; BR, biomass redistributed to the non-leguminous crops grown in pure stand; AD, digested biomass distrib-uted to the non-leguminous crops grown in pure stand.Italic numbers represent fractions in intercrops (IC) and species mixtures (green-manure ley and ryegrass/clover). Means that do notshare a letter within the same row and year are significantly different. Bold indicates year and crop with significant effect of biomasstreatment. The sum of biomass presented at the bottom of the table represent the total amount of biomass resources that would beavailable if all main crops and associated cover crops were cultivated on 1 ha each.
10 T.M. Råberg et al.
Strategic biomass management (BR and AD) main-tained levels of food crop yields, with increased biomassproduction potential of cover crops and an increase inlegume proportions in intercrops, green-manure and rye-grass/clover leys. An increased proportion of legumebiomass in the green-manure ley is correlated withincreased N inputs via N2 fixation (Evans et al., 1989;Carlsson and Huss-Danell, 2003), which leads to areduced need for external input of N to cover requirementsof the following crop. This is essential in stockless organicagriculture as there are few economically viable options tosupply N, when there is no access to animal manure.The possibility of using AD as a treatment of residual
and green-manure biomass without losses in yield andquality provides the opportunity of producing bioenergyas an additional source of energy or income for thefarmer. Tuomisto and Helenius (2008) even argue that aslightly lower crop yield in a bioenergy scenario wouldbe beneficial for the systems energy balance comparedwith leaving the biomass in situ.
Conclusions
Our results show that food, biomass for bioenergy carriersand digestate can be produced within the same croppingsystem without reductions in yield and N concentrationof the food crops, relative to standard organic farmingpractices, e.g., green manuring and crop residue incorpor-ation. Maintenance of food crop yields and increasedbiomass yields, as was found for one of the cover crops,show that strategic redistribution of residual biomassresources has a potential for increasing the overallsystem productivity and opens up for additionalbiomass uses in synergy with on-farm nutrient recircula-tion. The allocation of biomass resources for the add-itional production of CH4 without yield losses in theAD treatment enhances on-farm self-sufficiency andpotentially also farm profitability depending on theenergy pricing.Our results indicate that the anaerobic digestion of
biomass resources and field applications of the digestatemight be associated with larger N losses than thebiomass management in BR and IS. More detailedstudies of N losses at each step of the management ofbiomass resources and digestate as well as at the entirecropping system level are therefore important in orderto develop N-efficient cropping systems that provide bioe-nergy extraction in synergy with food production. Ananalysis of nutrient balances, energy and economics isalso required to gain more knowledge for further develop-ments of biomass resource-management systems forenhanced farm sustainability.
Acknowledgements. The research project has been financed byFORMAS, Swedish University of Agricultural Sciences,
Alnarp and Lund University. This study has also been madepossible by the Swedish Infrastructure for Ecosystem Science(SITES), in this case the Lönnstorp Research Station inAlnarp, Sweden. Parts of the seeds have been donated byLantmännen. The lentil seeds were donated by ProfessorAlbert Vandenberg, University of Saskatoon, Canada. Theauthors thank PhD EmmaKreuger who has produced the diges-tate and biogas at the facilities at Anneberg, Biotechnology,Lund University, Sweden. The authors also thank Sven-ErikSvensson, Lina Hirsch and the staff at SITES Lönnstorp forskilled technical assistance.
References
Araj, S.E. and Wratten, S.D. 2015. Comparing existing weedsand commonly used insectary plants as floral resources fora parasitoid. Biological Control 81:15–20.
Askegaard,M., Olesen, J.E., Rasmussen, I.A., and Kristensen, K.2011. Nitrate leaching from organic arable crop rotations ismostly determined by autumn field management.Agriculture, Ecosystems & Environment 142:149–160.
Baggs, E.M., Rees, R.M., Castle, K., Scott, A., Smith, K.A., andVinten, A.J.A. 2002. Nitrous oxide release from soils receivingN-rich crop residues and paper mill sludge in eastern Scotland.Agriculture, Ecosystems & Environment 90:109–123.
Barbir, J., Badenes‐Pérez, F.R., Fernández‐Quintanilla, C., andDorado, J. 2015. The attractiveness of flowering herbaceousplants to bees (Hymenoptera: Apoidea) and hoverflies(Diptera: Syrphidae) in agro‐ecosystems of Central Spain.Agricultural and Forest Entomology 17:20–28.
Beck, D., Wery, J., Saxena, M., and Ayadi, A. 1991. Dinitrogenfixation and nitrogen balance in cool-season food legumes.Agronomy Journal 83:334–341.
Bedoussac, L., Journet, É.P., Hauggaard-Nielsen, H.,Naudin, C., Corre-Hellou, G., Prieur, L., Jensen, E.S., andJustes, E. 2014. Eco-functional intensification by cereal-grain legume intercropping in organic farming systems forincreased yields, reduced weeds and improved grain proteinconcentration. In S. Bellon and S. Penvern (eds). OrganicFarming, Prototype for Sustainable Agricultures. Springer,Dordrecht, Netherlands. p. 47–63.
Bertholdsson, N. 1999. Characterization of malting barley culti-vars with more or less stable grain protein content undervarying environmental conditions. European Journal ofAgronomy 10:1–8.
Breland, T.A. 1995. Green manuring with clover and ryegrasscatch crops undersown in spring wheat: Effects on soil struc-ture. Soil Use and Management 11:163–167.
Cabrera, M.L., Kissel, D.E., and Vigil, M.F. 2005. Nitrogen min-eralization from organic residues. Journal of EnvironmentalQuality 34:75–79.
Carlsson, G. and Huss-Danell, K. 2003. Nitrogen fixation inperennial forage legumes in the field. Plant and Soil 253:353–372.
Chanakya, H., Venkatsubramaniyam, R., and Modak, J. 1997.Fermentation and methanogenic characteristics of leafybiomass feedstocks in a solid phase biogas fermentor.Bioresource Technology 62:71–78.
Cohen, B.R. 2015. The story of N: A social history of the nitro-gen cycle and the challenge of sustainability. AgriculturalHistory 89:117–118.
Deckers, J.A., Nachtergaele, F., and Spaargaren, O.C. 1998.World Reference Base for Soil Resources: Introduction.
11Strategic recycling of biomass in an organic cropping system
ACCO. Food and Agriculture Organization of the UnitedNations, Rome.
De Wit, C. and Van den Bergh, J. 1965. Competition betweenherbage plants. Journal of Agricultural Science 13:212–221.
Diederichsen, E., Frauen, M., Linders, E.G.A., Hatakeyama, K.,and Hirai, M. 2009. Status and perspectives of clubrootresistance breeding in crucifer crops. Journal of PlantGrowth Regulation 28:265–281.
Doré, T., Makowski, D., Malézieux, E., Munier-Jolain, N.,Tchamitchian, M., and Tittonell, P. 2011. Facing up to theparadigm of ecological intensification in agronomy:Revisiting methods, concepts and knowledge. EuropeanJournal of Agronomy 34:197–210.
Drinkwater, L.E. and Snapp, S.S. 2007. Nutrients in agroecosys-tems: Rethinking the management paradigm. Advances inAgronomy 92:163–186.
Evans, J., O’connor, G., Turner, G., Coventry, D., Fettell, N.,Mahoney, J., Armstrong, E., and Walsgott, D. 1989. N2
fixation and its value to soil N increase in lupin, field peaand other legumes in south-eastern Australia. Crop andPasture Science 40:791–805.
Foley, J.A., Ramankutty, N., Brauman, K.A., Cassidy, E.S.,Gerber, J.S., Johnston, M., Mueller, N.D., O’Connell, C.,Ray, D.K., West, P.C., Balzer, C., Bennett, E.M.,Carpenter, S.R., Hill, J., Monfreda, C., Polasky, S.,Rockstrom, J., Sheehan, J., Siebert, S., Tilman, D., andZaks, D.P.M. 2011. Solutions for a cultivated planet.Nature 478:337–342.
Frøseth, R.B., Bakken, A.K., Bleken, M.A., Riley, H.,Pommeresche, R., Thorup-Kristensen, K., and Hansen, S.2014. Effects of green manure herbage management and itsdigestate from biogas production on barley yield, N recovery,soil structure and earthworm populations. European Journalof Agronomy 52:90–102.
Galloway, J.N., Townsend, A.R., Erisman, J.W., Bekunda, M.,Cai, Z., Freney, J.R., Martinelli, L.A., Seitzinger, S.P., andSutton, M.A. 2008. Transformation of the nitrogen cycle:Recent trends, questions, and potential solutions. Science320:889–892.
Gunnarsson, A. 2012. Plant-based biogas production for improvednutrient management of beetroot in stockless organic farming.Acta Universitatis Agriculturae Sueciae 83:1652–6880.
Gunnarsson, A., Bengtsson, F., and Caspersen, S. 2010. Useefficiency of nitrogen from biodigested plant material by rye-grass. Journal of PlantNutrition and Soil Science 173:113–119.
Gunnarsson, A., Lindén, B., and Gertsson, U. 2011. Biodigestionof plant material can improve nitrogen use efficiency in a redbeet crop sequence. HortScience 46:765–775.
Gutser, R., Ebertseder, T., Weber, A., Schraml, M., andSchmidhalter, U. 2005. Short‐term and residual availabilityof nitrogen after long‐term application of organic fertilizerson arable land. Journal of Plant Nutrition and Soil Science168:439–446.
Hagman, J., Halling, M., and Dryler, K. 2014. Stråsäd, trindsäd,oljeväxter, potatis: Sortval 2014. Department of PlantProduction Ecology, Swedish University of AgriculturalSciences, Uppsala.
Halberg, N., Panneerselvam, P., and Treyer, S. 2015. Eco-func-tional intensification and food security: Synergy or com-promise? Sustainable Agricultural Research 4(3):126–139.
Harvey, M. and Pilgrim, S. 2011. The new competition for land:Food, energy, and climate change. Food Policy 36:S40–S51.
Hauggaard-Nielsen, H., Jørnsgaard, B., Kinane, J., andJensen, E.S. 2008. Grain legume–cereal intercropping: Thepractical application of diversity, competition and facilita-tion in arable and organic cropping systems. RenewableAgriculture and Food Systems 23:3–12.
Hejcman, M., Szaková, J., Schellberg, J., and Tlustoš, P. 2010.The Rengen Grassland Experiment: Relationship betweensoil and biomass chemical properties, amount of elementsapplied, and their uptake. Plant and Soil 333:163–179.
Jensen, E.S. 1996. Grain yield, symbiotic N2 fixation and inter-specific competition for inorganic N in pea-barley intercrops.Plant and Soil 182:25–38.
Jensen, E.S. 1997. The Role of Grain Legume N2 Fixation in theNitrogen Cycling of Temperate Cropping Systems. RisøNational Laboratory, Roskilde, Denmark, Copenhagen,Denmark. p. 86, pp. +13 appendices.
Jensen, E.S., Bedoussac, L., Carlsson, G., Journet, E.-P.,Justes, E., and Hauggaard-Nielsen, H. 2015. Enhancingyields in organic crop production by ECO-functional inten-sification. Sustainable Agriculture Research 4:42.
Kalinova, J., Vrchotova, N., and Triska, J. 2007. Exudation ofallelopathic substances in buckwheat (Fagopyrum esculentumMoench). Journal of Agricultural and Food Chemistry 55:6453–6459.
Kumar, K. and Goh, K.M. 2002. Management practices of ante-cedent leguminous and non-leguminous crop residues in rela-tion to winter wheat yields, nitrogen uptake, soil nitrogenmineralization and simple nitrogen balance. EuropeanJournal of Agronomy 16:295–308.
Ledgard, S. and Steele, K. 1992. Biological nitrogen fixation inmixed legume/grass pastures. Plant and Soil 141:137–153.
Lehtomäki, A., Huttunen, S., Lehtinen, T., and Rintala, J. 2008.Anaerobic digestion of grass silage in batch leach bed pro-cesses for methane production. Bioresource Technology 99:3267–3278.
Li, X. 2015. Legume-Based Catch Crops for EcologicalIntensification in Organic Framing. Department ofAgroecology, Science and Technology, Aarhus University,Tjele, Denmark. p. 97.
Lissens, G., Vandevivere, P., De Baere, L., Biey, E., andVerstraete, W. 2001. Solid waste digestors: Process perform-ance and practice for municipal solid waste digestion.Water Science and Technology 44:91–102.
MEA. 2005. Millennium Ecosystem Assessment, Ecosystemsand Human Well-Being. World Resources Institute,Washington, DC, Island Press, Washington, DC.
Möller, K. and Müller, T. 2012. Effects of anaerobic digestion ondigestate nutrient availability and crop growth: A review.Engineering in Life Sciences 12:242–257.
Möller, K. and Stinner, W. 2009. Effects of different manuringsystems with and without biogas digestion on soil mineralnitrogen content and on gaseous nitrogen losses (ammonia,nitrous oxides). European Journal of Agronomy 30:1–16.
Möller, K., Stinner, W., Deuker, A., and Leithold, G. 2008.Effects of different manuring systems with and withoutbiogas digestion on nitrogen cycle and crop yield in mixedorganic dairy farming systems. Nutrient Cycling inAgroecosystems 82:209–232.
Nicolardot, B., Recous, S., and Mary, B. 2001. Simulation of Cand N mineralisation during crop residue decomposition:A simple dynamic model based on the C : N ratio of the resi-dues. Plant and Soil 228:83–103.
12 T.M. Råberg et al.
Niggli, U., Slabe, A., Schmid, O., Halberg, N., and Schlüter, M.2008. Vision for an Organic Food and Farming ResearchAgenda 2025–Organic Knowledge for the Future. Report.Organic e-prints. Technology Platform Organics. IFOAMRegional Group European Union (IFOAM EU Group),Brussels and International Society of Organic AgricultureResearch (ISOFAR), Bonn, Germany. p. 1–45.
Peoples, M.B., Hauggaard-Nielsen, H., and Jensen, E.S. 2009.The potential environmental benefits and risks derived fromlegumes in rotations. In D.W. Emerich and H. Krishnan(eds). Nitrogen Fixation in Crop Production. AgronomyMonograph, 52. American Society of Agronomy: CropScience Society of America: Soil Science Society of America,Madison, WI. p. 349–385.
Rockström, J., Steffen, W., Noone, K., Persson, Å., Chapin, F.S.,Lambin, E.F., Lenton, T.M., Scheffer, M., Folke, C., andSchellnhuber, H.J. 2009. A safe operating space for human-ity. Nature 461:472–475.
Sapp,M., Harrison,M., Hany, U., Charlton, A., and Thwaites, R.2015. Comparing the effect of digestate and chemical fertil-iser on soil bacteria. Applied Soil Ecology 86:1–9.
Spurway, C.H. and Lawton, K. 1949. Soil Testing: A PracticalSystem of Soil Fertility Diagnosis. Agriculture ExperimentStation, Michigan State College, East Lansing.
Steffen,W.,Richardson, K., Rockström, J., Cornell, S.E., Fetzer, I.,Bennett, E.M., Biggs, R., Carpenter, S.R., de Vries, W., and deWit, C.A. 2015. Planetary boundaries: Guiding human devel-opment on a changing planet. Science 347:1259855.
Stinner, W., Moller, K., and Leithold, G. 2008. Effects of biogasdigestion of clover/grass-leys, cover crops and crop residueson nitrogen cycle and crop yield in organic stockless farmingsystems. European Journal of Agronomy 29:125–134.
Sutton, M.A., Oenema, O., Erisman, J.W., Leip, A., vanGrinsven, H., and Winiwarter, W. 2011. Too much of agood thing. Nature 472:159–161.
Thorup-Kristensen, K. 2001. Are differences in root growth ofnitrogen catch crops important for their ability to reducesoil nitrate-N content, and how can this be measured?Plant and Soil 230:185–195.
Tilman, D., Socolow, R., Foley, J.A., Hill, J., Larson, E.,Lynd, L., Pacala, S., Reilly, J., Searchinger, T., andSomerville, C. 2009. Beneficial biofuels—the food, energy,and environment trilemma. Science 325:270–271.
Trinsoutrot, I., Recous, S., Bentz, B., Lineres, M., Cheneby, D.,and Nicolardot, B. 2000. Biochemical quality of crop residuesand carbon and nitrogen mineralization kinetics under non-limiting nitrogen conditions. Soil Science Society ofAmerica Journal 64(3):918–926.
Tuomisto, H.L. and Helenius, J. 2008. Comparison of energyand greenhouse gas balances of biogas with other trans-port biofuel options based on domestic agriculturalbiomass in Finland. Agricultural and Food Science17(3):240–251.
Watson, C.A., Atkinson, D., Gosling, P., Jackson, L.R., andRayns, F.W. 2002. Managing soil fertility in organicfarming systems. Soil Use and Management 18:239–247.
Wulf, S., Maeting, M., and Clemens, J. 2002. Application tech-nique and slurry co-fermentation effects on ammonia,nitrous oxide, and methane emissions after spreading.Journal of Environmental Quality 31:1795–1801.
Zillén, L., Conley, D.J., Andrén, T., Andrén, E., and Björck, S.2008. Past occurrences of hypoxia in the Baltic Sea and therole of climate variability, environmental change andhuman impact. Earth-Science Reviews 91:77–92.
13Strategic recycling of biomass in an organic cropping system


II


1
More efficient use of nitrogen by internal recycling of residual
biomass within a stockless organic cropping system?
Tora Råberg ([email protected]), Georg Carlsson, and Erik Steen Jensen
Department of Biosystems and Technology, Swedish University of Agricultural Sciences,
Alnarp, Sweden.
Corresponding author
Tora Råberg ([email protected]),
Department of Biosystems and Technology,
P.O. Box 103,
230 53 Alnarp, Sweden.
Telephone no: +46 40 415152
2
Abstract
A major future challenge in agricultural systems is to reduce the requirement for inputs of new reactive
nitrogen in cropping systems. We have investigated if strategic management of internal biomass N
resources (green manure ley, crop residues and cover crops) in a six-year organic crop rotation could
maintain soil N balance without creating a large N surplus. Three biomass management strategies were
compared; anaerobic digestion of the biomass silage and application of the digestate to the non-legume
crops (AD), biomass redistribution as silage to non-legume crops (BR), and leaving the biomass in situ
(IS). Neither aboveground crop N accumulation from soil and nor the proportion of N derived from N2
fixation in legumes were influenced by biomass management treatment. On the other hand, the
allocation of N-rich silage and digestate to non-legume crops resulted in higher N2 fixation in AD and
BR (57 and 58 kg ha-1 year-1), compared to IS (33 kg ha-1 year-1) in 2014. The N balance for 2013-2014
ranged between -9.9 and 24 kg N ha-1, with more positive numbers in AD and BR than in IS, when the
temporary removal of biomass in AD and BR was not considered. The storage of biomass for
reallocation in spring led to an increasing accumulation of N in BR and AD over the years, at the same
time as it provides an opportunity to supply the crop with the nutrient when most needed and thereby
potentially decreases the risk of N losses during winter.
Keywords: Anaerobic digestion, arable and horticultural crops, nitrogen balance, nitrogen fixation, soil
and residue nitrogen, strategic biomass management
Abbreviations
AD = anaerobic digestion
BNF = biological nitrogen fixation
BR = biomass redistribution
IS = in situ
%Ndfa= proportion (%) of accumulated nitrogen derived from nitrogen fixation

3
Introduction
The planetary boundary research (Steffen et al. 2015) highlight the importance of reducing global inputs
of new reactive nitrogen (N) to ecosystems. The amounts of N applied as fertilizer in agriculture have
not been sufficiently constrained to prevent widespread leakage to freshwaters and the atmosphere, with
effects on human health, biodiversity and climate (Fowler et al. 2013). It is challenging to balance N
inputs to ensure long-term soil fertility with high and stable yields, avoiding depletion of the soil N pool
and at the same time avoid a surplus that have negative impacts on the surrounding ecosystem (Colomb
et al. 2013; de Ponti 2012; Seufert and Ramankutty 2017). Farmers of a region often specialize in either
crop or animal production, which adds serious costs of transporting animal manure over long distances
(Baggs et al. 2000; Stinner et al. 2008). Thus, many arable and horticultural organic farms choose to
import a considerable amount of concentrated fertiliser made from by-products of the food industry
(Colomb et al. 2013; Watson et al. 2002; Wivstad 2009). To reduce the need for external fertiliser
inputs, researchers suggest strategies that could improve soil formation and internal nutrient cycling at
the farm level (Bommarco et al. 2013; Foley et al. 2011; Tilman et al. 2002). The basic N input in
organic farming systems to maintain soil N fertility is biological N2 fixation by legume crops (Foyer et
al. 2016). Grain legumes can fix substantial amounts of atmospheric N2, which also reduces the
requirement for applying N to subsequent crops and improve soil fertility through inputs of legume
residues and rhizodeposition. However, a large proportion of the fixed N is removed with the grain
(Crews and Peoples 2004; Jensen and Hauggaard-Nielsen 2003; Li et al. 2015 ). Thus, grain legumes
grown as sole or intercrops with cereals are not supplying as much N to the agroecosystem, as cover
crops and green manure ley with forage legumes (Jensen 1997). Legume cover crops and forage
legumes improves N supply from soil substantially after incorporation of their residues, containing
symbiotically fixed N, and are thus very important in the organic farming system without livestock,
where other options for N input are limited. Incorporating residual biomass (crop residue, cover crop,
etc.) in situ is a common practice in agriculture, but it may result in substantial losses of N, if
mineralisation and acquisition of the following crop is not well synchronized (Mohanty et al. 2013;
Möller 2008; Pang and Letey 1998). It may be possible to improve the synchrony between application

4
of crop biomass N and plant acquisition of N by pre-treating and storing the residual biomass as silage
or as digestate from anaerobic digestion (Frøseth et al. 2014; Gunnarsson et al. 2011; Gutser et al. 2005).
Calculation of N balance is a tool for expanding the understanding of the N cycle and evaluate the effect
of different management practices on the soil-crop N cycle and the sustainability of N management
methods (Watson et al. 2002). A N balance summarizes the complex agricultural N cycle by
documenting the major flow paths as N enters and emerges from various pools and leaves the system
for various fates (Meisinger et al. 2008). Calculating the N balance is also a valuable tool for identifying
risks of N depletion or build-up of N surplus at the crop, cropping system or farm level, thereby
highlighting the potential need for improved N management. A nitrogen balance made for 76 organic
arable farms in Sweden showed an average N surplus of 39 kg/ha. The surplus was mainly due to
imported nutrients such as digestate, yeast liquid and dried slaughter house waste (Wivstad 2009).
Horticultural cropping systems tend to import even more N than arable farms, which results in an N
budget with higher N surpluses (Watson et al. 2002), and is thus prone to a higher risk of N losses.
Comparing N balances of different cropping systems may also indicate possibilities to decrease the
input of new reactive N into agroecosystems (Galloway et al. 2008).
The aim of this study was to determine whether anaerobic digestion (AD) of the residual biomass from
the cropping system, and use of the digestate for N recirculation, would improve the N acquisition in
the following crop, compared to the corresponding biomass redistribution (BR) of undigested silage or
just leaving the biomass in situ (IS) within the respective field plots. Several arable and horticultural
crops were combined in the cropping systems, with the purpose to study how the soil N accumulation
and N2 fixation of the different crops respond to the biomass management strategies. We used the N
balance method as a tool to determine how biomass strategy influenced the loss or increase in soil N at
both individual crop and at the cropping system level, but without considering N emissions to the
environment in the calculation. The hypotheses were: I) the amount and proportion of N2 fixed in
legume crops (legumes in ley, lentil (Lens culinaris Medik), pea (Pisum sativum L.), clover (Trifolium
pratense L. & T. repens L.) in cover crop) is greater with AD and BR than in the IS management, II) N
5
acquisition from soil and residual biomass in non-legume crops is greater in AD than BR and IS, III)
the N balance at the cropping system level rank IS<BR<AD, and IV) the total N acquisition originating
from soil and added biomass in all crops is on average larger in AD and BR than in IS.
Material & methods
2.1. Study site and soil
The experiment was established in 2012 at the Swedish University of Agricultural Sciences in Alnarp,
southern Sweden (55° 39′ 21″N, 13° 03′ 30″E), on a sandy loam soil of Arenosol type (Deckers et al.
1998). The field experiment was conducted on organically certified agricultural land within the SITES
Lönnstorp field research station, with grass-clover ley as the pre-crop. The annual mean atmospheric
deposition of N contributed with a total of 9.4 kg ha-1 year-1 during 2013 to 2014, in the region where
the field experiment was situated (SMHI 2013-2014).
2.2. Climatic data
The region has a typical northern-European maritime climate with mild winter and summer
temperatures. The temperature and precipitation in 2012–2015 were close to the average for the region
(1961-1990) (Råberg et al. 2017).
2.3. Crop rotation
A six-year crop rotation including different legume species, several over-wintering cash and cover crops
was studied during three years (2012-2014, with two overwintering crops harvested in May 2015). The
rotation consisted of the following food crops: pea/barley (Pisum sativum L./Hordeum vulgare L.) and
lentil/oat (Lens culinaris Medik/Avena sativa L.), white cabbage (Brassica oleracea L.), beetroot (Beta
vulgaris L.) and winter rye (Secale cereale L.). There was a green manure ley composed of Dactylis
glomerata L., Festuca pratensis L., Phleum pratense L., Medicago sativa L., Meliolotus officinalis L.
and Trifolium pratense L. (Råberg et al. 2017). The ley was under-sown in the pea/barley intercrop,
harvested three times during the year after establishment, and harvested again in early spring the
subsequent year, before establishing white cabbage as the next crop. Cover crops were included in the
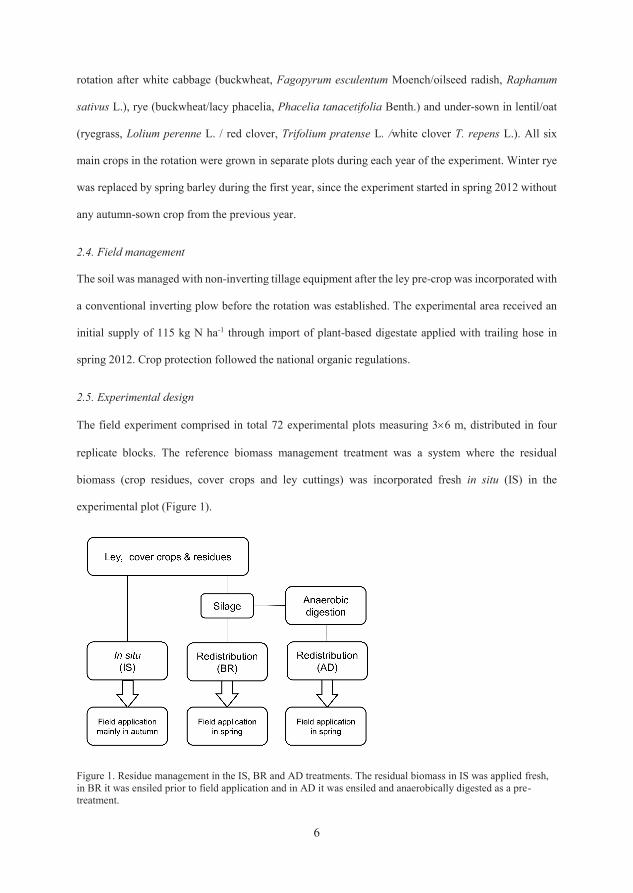
6
rotation after white cabbage (buckwheat, Fagopyrum esculentum Moench/oilseed radish, Raphanum
sativus L.), rye (buckwheat/lacy phacelia, Phacelia tanacetifolia Benth.) and under-sown in lentil/oat
(ryegrass, Lolium perenne L. / red clover, Trifolium pratense L. /white clover T. repens L.). All six
main crops in the rotation were grown in separate plots during each year of the experiment. Winter rye
was replaced by spring barley during the first year, since the experiment started in spring 2012 without
any autumn-sown crop from the previous year.
2.4. Field management
The soil was managed with non-inverting tillage equipment after the ley pre-crop was incorporated with
a conventional inverting plow before the rotation was established. The experimental area received an
initial supply of 115 kg N ha-1 through import of plant-based digestate applied with trailing hose in
spring 2012. Crop protection followed the national organic regulations.
2.5. Experimental design
The field experiment comprised in total 72 experimental plots measuring 36 m, distributed in four
replicate blocks. The reference biomass management treatment was a system where the residual
biomass (crop residues, cover crops and ley cuttings) was incorporated fresh in situ (IS) in the
experimental plot (Figure 1).
Figure 1. Residue management in the IS, BR and AD treatments. The residual biomass in IS was applied fresh,
in BR it was ensiled prior to field application and in AD it was ensiled and anaerobically digested as a pre-
treatment.

7
Two additional biomass management treatments were: 1) ensiling and redistributing the biomass
resources (BR) to experimental plots with cabbage, winter rye and beetroot; and 2) the biomass was
ensiled and later anaerobically digested (AD) in a biogas reactor, and the digestate applied to cabbage,
winter rye and beetroot, as described in Råberg et al. (2017). The N supplied to the crops in each
treatment are presented in Table 1.
Table 1. Total N content in the residual and green manure biomass from the previous year, redistributed to rye,
cabbage and beetroot (on 3 x 1 ha) in the BR and AD treatments. Left in situ at harvest in the IS treatment (kg
ha-1).
Crop 2013 2014
IS biomass
BR biomass
AD biomass
AD digestate
IS biomass
BR biomass
AD biomass
AD digestate
Cabbage 70 130 - 140 220 260 - 180 Buckwheat/oilseed radish
55 0 - 0
35 0 - 0
Lentil/oat 60 0 - 0 60 0 - 0 Ryegrass/clover 80 0 - 0 35 0 - 0 Beetroot 15 90 - 90 110 150 - 70 Rye 60 240 - 160 20 100 - 130 Buckwheat/lacy phacelia
35 0 - 0
30 0 - 0
Pea/barley 15 0 - 0 20 0 - 0 Ley 90 0 - 0 50 0 - 0
Total N in biomass* 480 460 455 390 580 520 480 380
*Sum of N from 6 ha
2.6. Sampling and harvest
The residual biomass was collected and ensiled separately in BR and AD, with harvest from spring until
October each year, to allow time for digestion in AD. The same strategy was used for the collection of
biomass in BR to make it comparable to AD. The method resulted in a one-year delay for the use of the
May harvest of green manure ley and ryegrass/clover in the BR and AD treatments. Measurements
started in 2012 and the last samples were collected in 2015 for two over-wintering crops i.e. green
manure ley and ryegrass/clover cover crop.
All above-ground residues, cover crops and ley cuttings were weighed before returning or redistributing
the biomass, and subsamples from a 0.25 m2 surface per plot were taken for analyses of botanical
composition (grouped into legumes and non-legumes) dry matter (DM), N concentration and natural
abundance of the stable isotope 15N. The biomass yield and N concentration presented in the result
section was based on the subsamples.
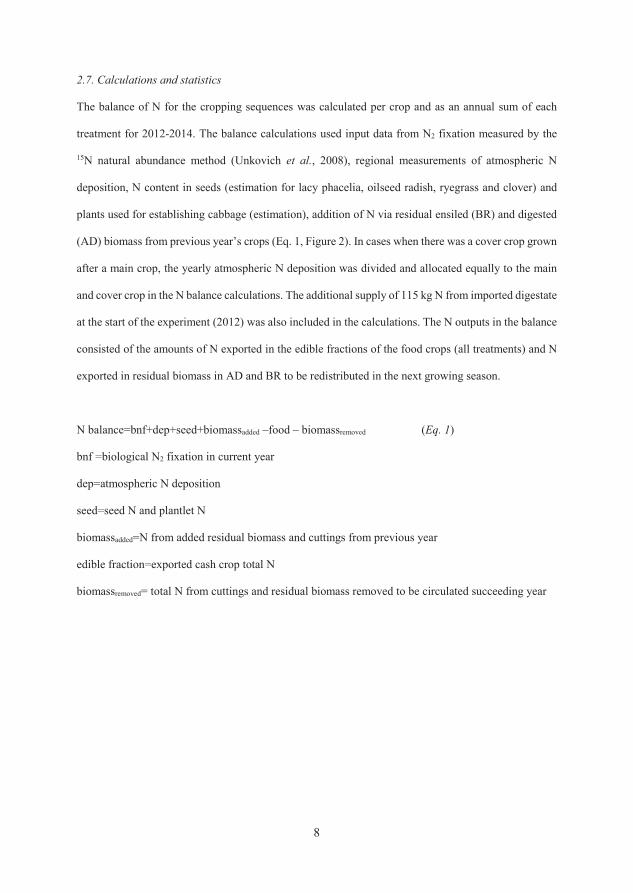
8
2.7. Calculations and statistics
The balance of N for the cropping sequences was calculated per crop and as an annual sum of each
treatment for 2012-2014. The balance calculations used input data from N2 fixation measured by the
15N natural abundance method (Unkovich et al., 2008), regional measurements of atmospheric N
deposition, N content in seeds (estimation for lacy phacelia, oilseed radish, ryegrass and clover) and
plants used for establishing cabbage (estimation), addition of N via residual ensiled (BR) and digested
(AD) biomass from previous year’s crops (Eq. 1, Figure 2). In cases when there was a cover crop grown
after a main crop, the yearly atmospheric N deposition was divided and allocated equally to the main
and cover crop in the N balance calculations. The additional supply of 115 kg N from imported digestate
at the start of the experiment (2012) was also included in the calculations. The N outputs in the balance
consisted of the amounts of N exported in the edible fractions of the food crops (all treatments) and N
exported in residual biomass in AD and BR to be redistributed in the next growing season.
N balance=bnf+dep+seed+biomassadded –food – biomassremoved (Eq. 1)
bnf =biological N2 fixation in current year
dep=atmospheric N deposition
seed=seed N and plantlet N
biomassadded=N from added residual biomass and cuttings from previous year
edible fraction=exported cash crop total N
biomassremoved= total N from cuttings and residual biomass removed to be circulated succeeding year
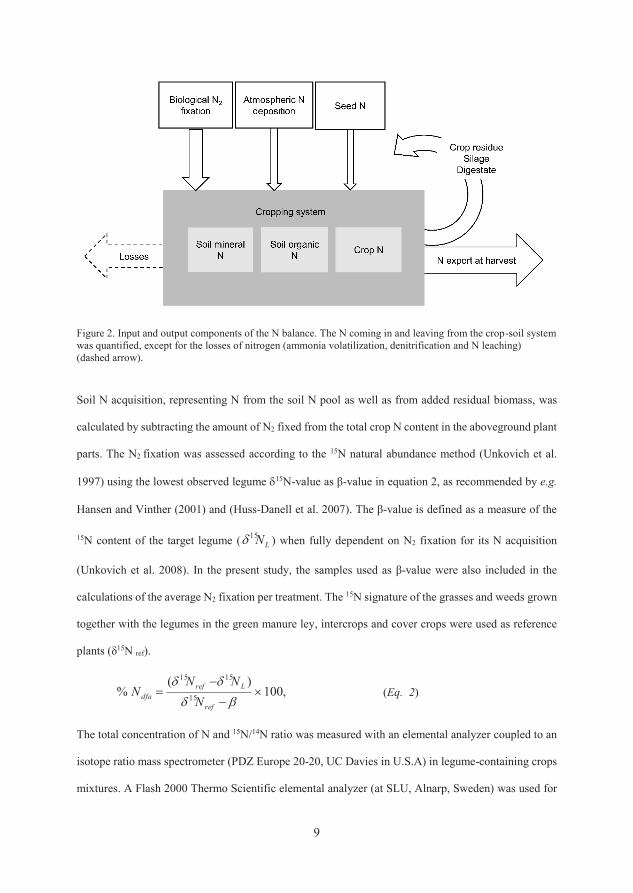
9
Figure 2. Input and output components of the N balance. The N coming in and leaving from the crop-soil system
was quantified, except for the losses of nitrogen (ammonia volatilization, denitrification and N leaching)
(dashed arrow).
Soil N acquisition, representing N from the soil N pool as well as from added residual biomass, was
calculated by subtracting the amount of N2 fixed from the total crop N content in the aboveground plant
parts. The N2 fixation was assessed according to the 15N natural abundance method (Unkovich et al.
1997) using the lowest observed legume 15N-value as β-value in equation 2, as recommended by e.g.
Hansen and Vinther (2001) and (Huss-Danell et al. 2007). The β-value is defined as a measure of the
15N content of the target legume ( LN15 ) when fully dependent on N2 fixation for its N acquisition
(Unkovich et al. 2008). In the present study, the samples used as β-value were also included in the
calculations of the average N2 fixation per treatment. The 15N signature of the grasses and weeds grown
together with the legumes in the green manure ley, intercrops and cover crops were used as reference
plants (δ15N ref).
,100)(
%15
1515
ref
Lref
dfaN
NNN (Eq. 2)
The total concentration of N and 15N/14N ratio was measured with an elemental analyzer coupled to an
isotope ratio mass spectrometer (PDZ Europe 20-20, UC Davies in U.S.A) in legume-containing crops
mixtures. A Flash 2000 Thermo Scientific elemental analyzer (at SLU, Alnarp, Sweden) was used for
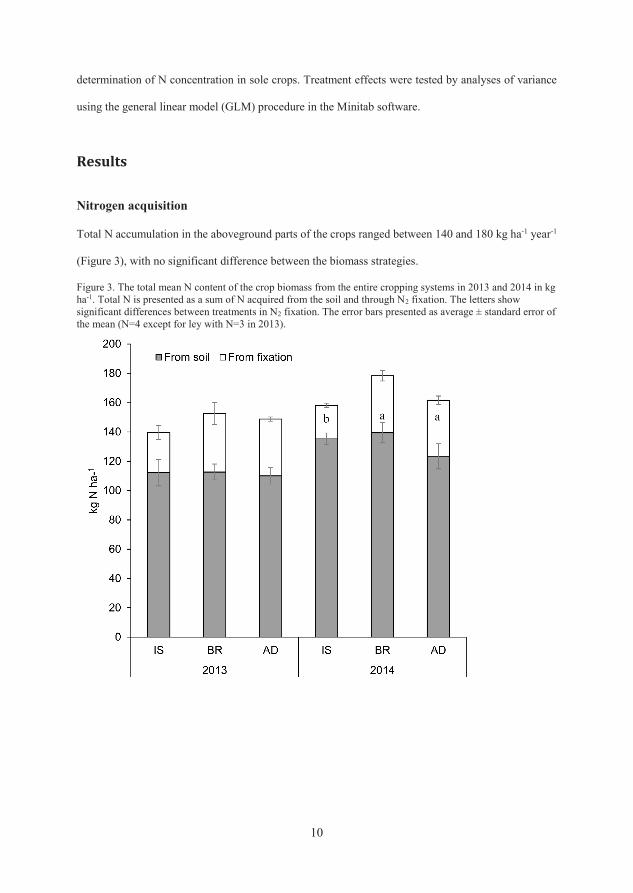
10
determination of N concentration in sole crops. Treatment effects were tested by analyses of variance
using the general linear model (GLM) procedure in the Minitab software.
Results
Nitrogen acquisition
Total N accumulation in the aboveground parts of the crops ranged between 140 and 180 kg ha-1 year-1
(Figure 3), with no significant difference between the biomass strategies.
Figure 3. The total mean N content of the crop biomass from the entire cropping systems in 2013 and 2014 in kg
ha-1. Total N is presented as a sum of N acquired from the soil and through N2 fixation. The letters show
significant differences between treatments in N2 fixation. The error bars presented as average ± standard error of
the mean (N=4 except for ley with N=3 in 2013).
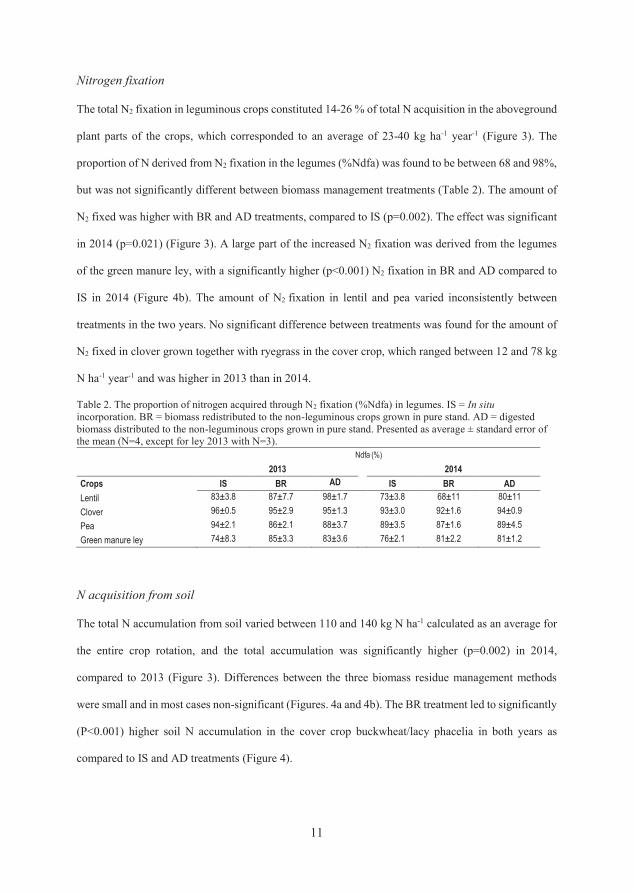
11
Nitrogen fixation
The total N2 fixation in leguminous crops constituted 14-26 % of total N acquisition in the aboveground
plant parts of the crops, which corresponded to an average of 23-40 kg ha-1 year-1 (Figure 3). The
proportion of N derived from N2 fixation in the legumes (%Ndfa) was found to be between 68 and 98%,
but was not significantly different between biomass management treatments (Table 2). The amount of
N2 fixed was higher with BR and AD treatments, compared to IS (p=0.002). The effect was significant
in 2014 (p=0.021) (Figure 3). A large part of the increased N2 fixation was derived from the legumes
of the green manure ley, with a significantly higher (p<0.001) N2 fixation in BR and AD compared to
IS in 2014 (Figure 4b). The amount of N2 fixation in lentil and pea varied inconsistently between
treatments in the two years. No significant difference between treatments was found for the amount of
N2 fixed in clover grown together with ryegrass in the cover crop, which ranged between 12 and 78 kg
N ha-1 year-1 and was higher in 2013 than in 2014.
Table 2. The proportion of nitrogen acquired through N2 fixation (%Ndfa) in legumes. IS = In situ
incorporation. BR = biomass redistributed to the non-leguminous crops grown in pure stand. AD = digested
biomass distributed to the non-leguminous crops grown in pure stand. Presented as average ± standard error of
the mean (N=4, except for ley 2013 with N=3).
Ndfa (%)
2013 2014
Crops IS BR AD IS BR AD
Lentil 83±3.8 87±7.7 98±1.7 73±3.8 68±11 80±11
Clover 96±0.5 95±2.9 95±1.3 93±3.0 92±1.6 94±0.9
Pea 94±2.1 86±2.1 88±3.7 89±3.5 87±1.6 89±4.5
Green manure ley 74±8.3 85±3.3 83±3.6 76±2.1 81±2.2 81±1.2
N acquisition from soil
The total N accumulation from soil varied between 110 and 140 kg N ha-1 calculated as an average for
the entire crop rotation, and the total accumulation was significantly higher (p=0.002) in 2014,
compared to 2013 (Figure 3). Differences between the three biomass residue management methods
were small and in most cases non-significant (Figures. 4a and 4b). The BR treatment led to significantly
(P<0.001) higher soil N accumulation in the cover crop buckwheat/lacy phacelia in both years as
compared to IS and AD treatments (Figure 4).
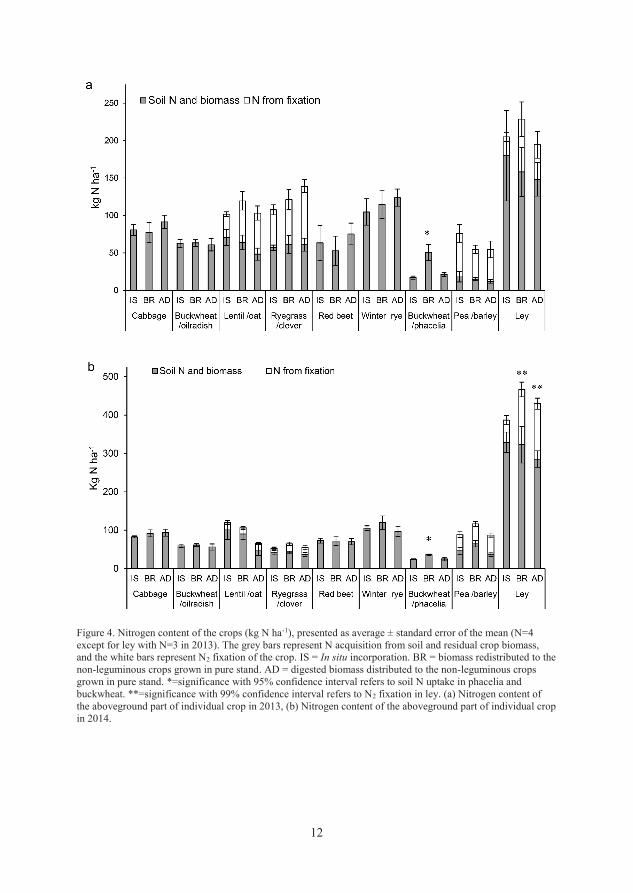
12
Figure 4. Nitrogen content of the crops (kg N ha-1), presented as average ± standard error of the mean (N=4
except for ley with N=3 in 2013). The grey bars represent N acquisition from soil and residual crop biomass,
and the white bars represent N2 fixation of the crop. IS = In situ incorporation. BR = biomass redistributed to the
non-leguminous crops grown in pure stand. AD = digested biomass distributed to the non-leguminous crops
grown in pure stand. *=significance with 95% confidence interval refers to soil N uptake in phacelia and
buckwheat. **=significance with 99% confidence interval refers to N2 fixation in ley. (a) Nitrogen content of
the aboveground part of individual crop in 2013, (b) Nitrogen content of the aboveground part of individual crop
in 2014.
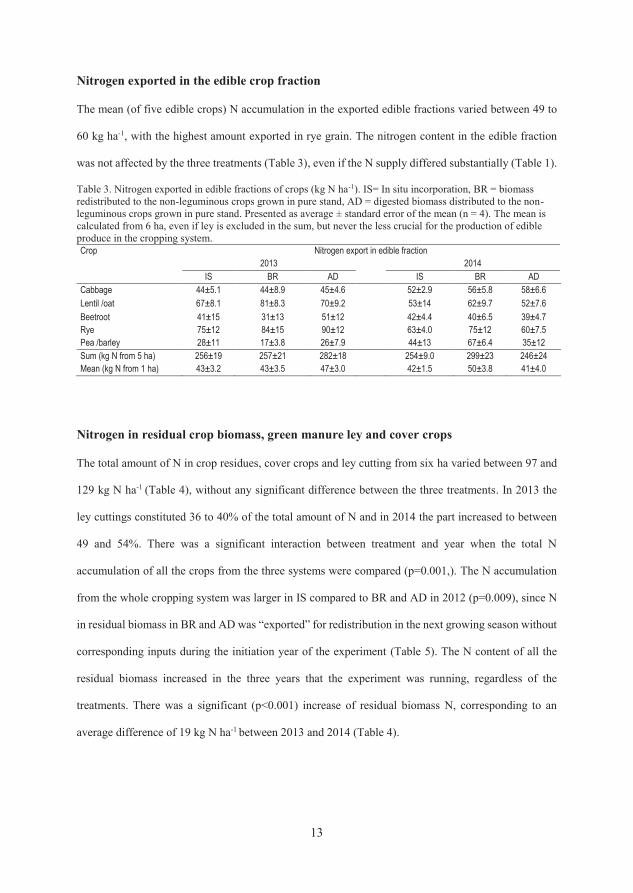
13
Nitrogen exported in the edible crop fraction
The mean (of five edible crops) N accumulation in the exported edible fractions varied between 49 to
60 kg ha-1, with the highest amount exported in rye grain. The nitrogen content in the edible fraction
was not affected by the three treatments (Table 3), even if the N supply differed substantially (Table 1).
Table 3. Nitrogen exported in edible fractions of crops (kg N ha-1). IS= In situ incorporation, BR = biomass
redistributed to the non-leguminous crops grown in pure stand, AD = digested biomass distributed to the non-
leguminous crops grown in pure stand. Presented as average ± standard error of the mean (n = 4). The mean is
calculated from 6 ha, even if ley is excluded in the sum, but never the less crucial for the production of edible
produce in the cropping system.
Crop Nitrogen export in edible fraction 2013
2014
IS BR AD IS BR AD
Cabbage 44±5.1 44±8.9 45±4.6 52±2.9 56±5.8 58±6.6
Lentil /oat 67±8.1 81±8.3 70±9.2 53±14 62±9.7 52±7.6
Beetroot 41±15 31±13 51±12 42±4.4 40±6.5 39±4.7
Rye 75±12 84±15 90±12 63±4.0 75±12 60±7.5
Pea /barley 28±11 17±3.8 26±7.9 44±13 67±6.4 35±12
Sum (kg N from 5 ha) 256±19 257±21 282±18 254±9.0 299±23 246±24
Mean (kg N from 1 ha) 43±3.2 43±3.5 47±3.0 42±1.5 50±3.8 41±4.0
Nitrogen in residual crop biomass, green manure ley and cover crops
The total amount of N in crop residues, cover crops and ley cutting from six ha varied between 97 and
129 kg N ha-1 (Table 4), without any significant difference between the three treatments. In 2013 the
ley cuttings constituted 36 to 40% of the total amount of N and in 2014 the part increased to between
49 and 54%. There was a significant interaction between treatment and year when the total N
accumulation of all the crops from the three systems were compared (p=0.001,). The N accumulation
from the whole cropping system was larger in IS compared to BR and AD in 2012 (p=0.009), since N
in residual biomass in BR and AD was “exported” for redistribution in the next growing season without
corresponding inputs during the initiation year of the experiment (Table 5). The N content of all the
residual biomass increased in the three years that the experiment was running, regardless of the
treatments. There was a significant (p<0.001) increase of residual biomass N, corresponding to an
average difference of 19 kg N ha-1 between 2013 and 2014 (Table 4).

14
Table 4. Nitrogen in residual biomass and cuttings (kg N ha-1). IS= In situ incorporation, BR = biomass
redistributed to the non-leguminous crops grown in pure stand, AD = digested biomass distributed to the non-
leguminous crops grown in pure stand. Superscript letters mark significant differences as well as bold numbers.
Presented as average ± standard error of the mean (n = 4, ley n=3 in 2013)
Crop N in residual biomass (kg ha-1) 2013
2014
IS BR AD IS BR AD
Cabbage 36.3±3.29 33.7±4.36 46.3±4.50 30.2±2.14 35.3±5.33 35.2±3.02
Buckwheat/oilseed radish 62.9±5,20 63.3±4.82 60.8±8.17 58.8±4.54 61.2±3.69 56.1±8.01
Lentil /oat 34.2±2.70 38.2±4.06 33.3±6.51 66.7±9.49 44.4±6.59 35.2±10.7
Ryegrass/clover 108±4.34 121±9.82 139±10.4 52.4±5.99 64.3±6.46 54.7±3.65
Beetroot 22.0±9.24 21.7±7.10 24.7±3.67 31.0±2.39 31.6±4.87 30.4±4.81
Rye 29.8±5.77 31.0±3.59 33.6±1.84 42.0±3.40 45.1±5.69 35.9±5.69
Buckwheat/phacelia 16.9b±2.03 50.7a±10.6 21.3b±2.71 23.9b±1.30 35.9a±1.68 24.9b±4.75
Pea /barley 47.9±8.34 37.8±5.53 29.0±8.57 56.6±9.57 49.8±6.37 51.9±8.49
Ley 222±64.0 262±9.52 221±15.2 342±19.2 404±42.8 384±23.2
Sum (kg N from 6 ha) 584±41.8 659±33.1 609±10.8 704±20.8 774±48.7 708±33.9
Mean (kg N from 1 ha) 97±7.0 110±5.5 102±1.8 117±3.5 129±8.1 118±5.7
Table 5. Nitrogen balance calculated by taking into account the storage and redistribution of residual biomass as
silage/digestate in the subsequent year in BR and AD (N balance), and without considering the temporary stored
N in residual biomass (No stored residual biomass) (kg ha-1).
Treatment Year N balance No stored residual
biomass
IS 2013 -9.9 -9.9 2014 1.1 1.1
BR 2013 -12 -3.3 2014 -43 7.8
AD 2013 -22 -7.9 2014 -60 24
15
Nitrogen balance
The three crops that were fertilized with biomass in BR and AD resulted in N surplus for the N balance
of both years, with the highest surplus in cabbage with the BR treatment in 2014 (178 kg ha-1). The
exception from the surplus results was the winter rye crop with BR treatment in 2014, which resulted
in -8 kg ha-1 (fig. 5b). Cabbage, red beet and rye all had a negative N balance in IS, ranging from -36 to
-68 kg ha-1. The lentil/oat intercrop resulted in a negative result with all treatments, and most negative
for AD and BR, from -37 to -79 kg ha-1. The pea/barley intercrop resulted in a surplus of 21 to 47 kg
ha-1 for IS (2014 and 2013 respectively), while the balance for BR and AD resulted in 5 to -47 kg ha-1.
The non-legume catch crops had a negative result for BR and AD, -15 to -57 kg ha-1, while IS resulted
in a positive result (7 kg ha-1) due to the absence of exported biomass. Both the cover crop
ryegrass/clover and the green manure ley (summer and spring yield) resulted in negative results in BR
and AD (-17 to -284 kg ha-1), as biomass was removed and stored for manuring the next year’s crop.
There was surplus N in IS for both crops, from 7 and 57 kg N ha-1 in the ryegrass/clover catch crop and
39 to 74 kg N ha-1 in the green manure ley (fig. 5).
The N balances at the cropping system level gradually became more positive in the BR and AD
treatments, when not considering the residual biomass N as a temporary export in the harvest year and
input in the subsequent year in BR and AD (table 5; “No stored residual biomass”).
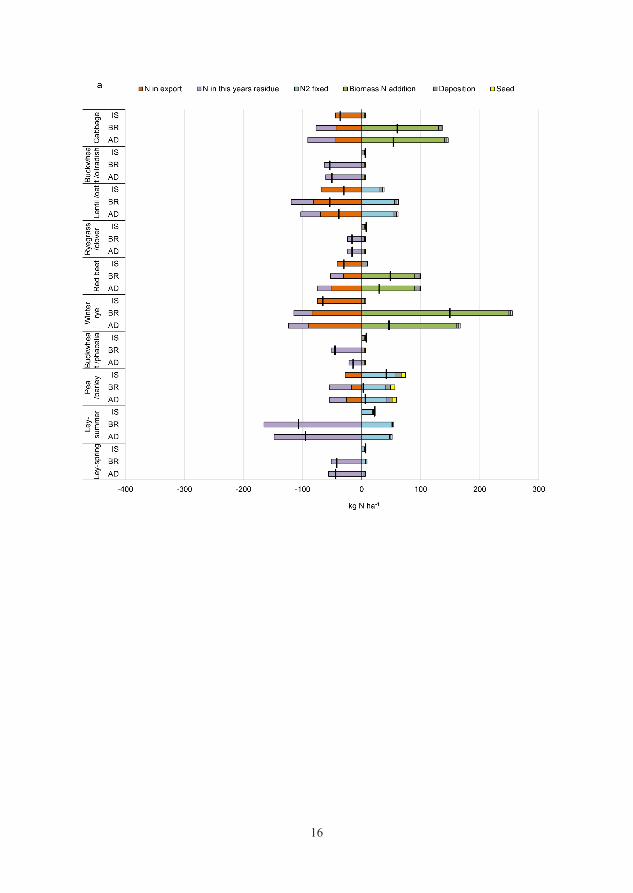
16
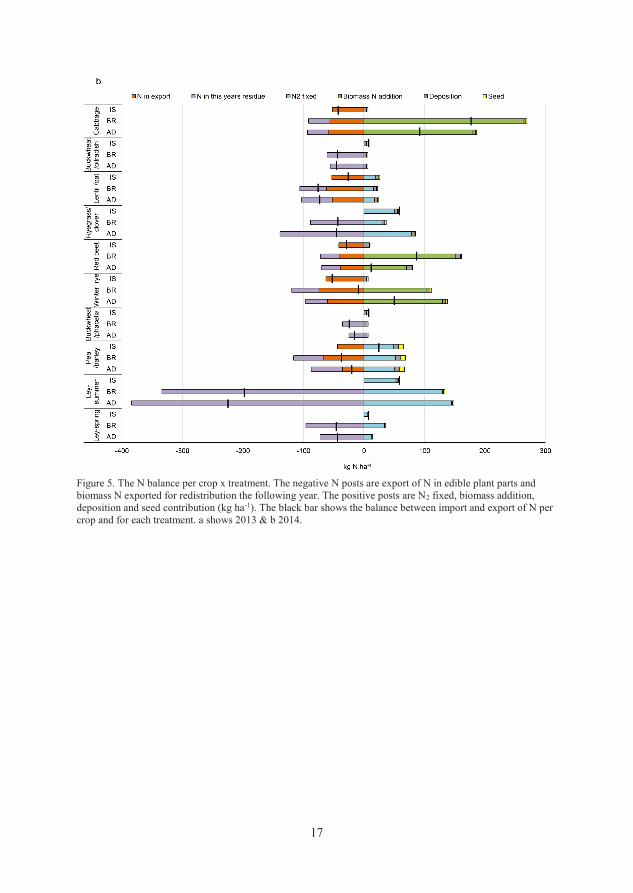
17
Figure 5. The N balance per crop x treatment. The negative N posts are export of N in edible plant parts and
biomass N exported for redistribution the following year. The positive posts are N2 fixed, biomass addition,
deposition and seed contribution (kg ha-1). The black bar shows the balance between import and export of N per
crop and for each treatment. a shows 2013 & b 2014.

18
Discussion
The sustainability of the N management in stockless organic farming systems depends on the balance
between nutrient export via cash crops, nutrient inputs through N2 fixation, the level of success in
internal recycling and reduction of losses (Legg and Meisinger 1982). Stockless organic systems often
depend on growing green manures, which occupy land for one or more growing seasons. We designed
a cropping system with 1/6 of the land allocated for green manure and the remaining land used for food
crops, and studied how different strategies for managing residual biomass affected internal N cycling
and the N balance.
It was hypothesised that the AD treatment would result in higher N accumulation from soil and
recirculated biomass N resources that the other treatments, as the mineral N content was expected to be
higher in the digestate than in the biomass/silage in IS and BR. However, there was no difference in
soil- and biomass-derived N accumulation in the crops, which could have been caused by a lower than
expected NH4 concentration in the digestate. There are several possibilities to optimise the management
of the feedstock i.e. mixing, shredding, alkali pre-treatment and minimising the contact with oxygen at
storage prior to digestion (Carrere et al. 2016; Hjorth et al. 2011). There may also have been N losses
at the handling of the digestate and during field application of the digestate (Banks et al. 2011; Möller
and Müller 2012). Losses of N from digestate in the field could have been decreased by using shallow
direct injection into the soil (Möller and Müller 2012).
The proportion of N2 fixation (%Ndfa) in the legumes of this study was high and not significantly
influenced by biomass management method. This was probably because the legumes were grown in
intercrops/mixtures with cereal/grasses. The competitive ability of cereals and grasses for mineral N
results in a non-proportional acquisition of soil mineral N between the species, leading to a low
availability of mineral N for the legumes and a high %Ndfa (Carlsson and Huss-Danell, 2003;
Hauggaard-Nielsen et al., 2008; Bedoussac et al. 2015). The green manure leys fixed higher amounts
of N2 in BR and AD than in IS in 2014, and a similar tendency could also be seen in 2013. The higher
19
amount of N2 fixation in legumes, grown as green manure ley with the BR and AD treatment, is most
likely a consequence of the removal of N-rich cuttings, reducing the N availability and thereby the
competitiveness of the grasses, thus promoting the growth and N2 fixation of the legumes.
Our third hypothesis suggested a lower ranking of IS N balance compared to BR and AD. The N balance
that did not consider the temporary removal of residual biomass in BR and AD resulted in a surplus in
2014 of 7.8 and 24 kg N ha-1 respectively, with the highest N surplus in the AD treatment (IS<BR<AD).
The N stored in BR and AD and applied to the non-legume crops in the spring was potentially protected
from being lost by mineralization during autumn and winter. This method that temporary stores residual
biomass and thus decreases the risk of N losses from large N surplus could provide an improvement to
stockless organic farms, where the N surplus can be as high as 194 kg ha-1 (Watson et al. 2002). The
increased N accumulation in the biomass from 2013 to 2014 of the current study originated partly from
a higher N2 fixation in BR and AD, but mainly from the soil N pool and applied residual biomass. The
fact that the amount of residual biomass N increased over time explains the negative N balances in BR
and AD when the storage and redistribution of biomass N was taken into account (Table 5), since the
temporarily exported biomass N was larger than the biomass N redistributed from the previous year.
The difference between the key inputs and outputs at the cropping system level, i.e. N2 fixation minus
N export in edible crop fractions, was more negative in IS than in BR and AD. This result further
highlights the advantage of strategic biomass management in BR and AD.
20
Conclusion
The strategic management of the biomass resources for internal recirculation to non-legume crops has
several potential advantages for sustainable N management in arable cropping systems. The positive
effects are dominated by the increased N2 fixation in the legumes, compared to leaving the residues,
catch crop biomass and green manure ley cuttings in situ. The N balance that did not account for the
temporary storage of residual biomass N for application in the subsequent season also resulted in a more
positive N balance in BR and AD than in IS. Additionally, the risk for N losses was potentially
decreased due to the over winter storage of the biomass recycled to non-legumes in the subsequent
growth season. Strategically choosing where and when to add biomass N resources in the crop rotation
thus has large potential to improve the N use efficiency of the cropping system. Nevertheless, care needs
to be taken when applying residual biomass to selected crops in the cropping system, since high
application rates might also lead to N losses depending on timing and incorporation technique of the
silage/digestate into the soil. These aspects require further research about how strategic biomass N
management influences N losses at different processes and at the entire cropping system level.
21
References
Baggs EM, Watson CA, Rees RM (2000) The fate of nitrogen from incorporated cover crop and green manure
residues Nutrient Cycling in Agroecosystems 56:153-163
Banks CJ, Chesshire M, Heaven S, Arnold R (2011) Anaerobic digestion of source-segregated domestic food
waste: performance assessment by mass and energy balance Bioresource Technology 102:612-620
Bommarco R, Kleijn D, Potts SG (2013) Ecological intensification: harnessing ecosystem services for food
security Trends in Ecology and Evolution Volume 28:Pages 230-238
Carrere H, Antonopoulou G, Affes R, Passos F, Battimelli A, Lyberatos G, Ferrer I (2016) Review of feedstock
pretreatment strategies for improved anaerobic digestion: from lab-scale research to full-scale application
Bioresource Technology 199:386-397
Colomb B, Carof M, Aveline A, Bergez J-E (2013) Stockless organic farming: strengths and weaknesses
evidenced by a multicriteria sustainability assessment model Agronomy for Sustainable Development
33:593-608
Crews TE, Peoples MB (2004) Legume versus fertilizer sources of nitrogen: ecological tradeoffs and human needs
Agric Ecosyst Environ 102:279–297
de Ponti T, Rijk, B., Van Ittersum, M. K. (2012) The crop yield gap between organic and conventional agriculture
Agricultural Systems 108:1-9
Deckers JA, Nachtergaele F, Spaargaren OC (1998) World reference base for soil resources. World soil resources
reports. Rome : Food and Agriculture Organization of the United Nations,
Foley J, Ramankutty N, Brauman K, Cassidy E, Gerber J, Johnston M, ..., Balzer C (2011) Solutions for a
cultivated planet Nature 478:337-342
Fowler D, Coyle M, Skiba U, Sutton MA, Cape JN, Reis S, ..., Vitousek P (2013) The global nitrogen cycle in the
twenty-first century Philosophical Transactions of the Royal Society B 368(1621)
Foyer CH, Lam HM, Nguyen HT, Siddique KH, Varshney RK, Colmer TD, Cooper JW (2016) Neglecting
legumes has compromised human health and sustainable food production Nature Plants 2:8
Frøseth RB, Bakken AK, Bleken MA, Riley H, Pommeresche R, Thorup-Kristensen K, Hansen S (2014) Effects
of green manure herbage management and its digestate from biogas production on barley yield, N
recovery, soil structure and earthworm populations European Journal of Agronomy 52:90-102
Galloway JN et al. (2008) Transformation of the nitrogen cycle: recent trends, questions, and potential solutions
Science 320:889-892
Gunnarsson A, Lindén B, Gertsson U (2011) Biodigestion of plant material can improve nitrogen use efficiency
in a red beet crop sequence HortScience 46:765-775
Gutser R, Ebertseder T, Weber A, Schraml M, Schmidhalter U (2005) Short‐term and residual availability of
nitrogen after long‐term application of organic fertilizers on arable land Journal of Plant Nutrition and
Soil Science 168:439-446
Hjorth M, Gränitz K, Adamsen AP, Møller HB (2011) Extrusion as a pretreatment to increase biogas production
Bioresource Technology 102:4989-4994
Huss-Danell K, Chaia E, Carlsson G (2007) N2 fixation and nitrogen allocation to above and below ground plant
parts in red clover-grasslands Plant and Soil 299:215-226
Jensen ES (1997) The role of grain legume N2 fixation in the nitrogen cycling of temperate cropping systems.
D.Sc. Thesis. Risø National Laboratory, Roskilde, Denmark. Copenhagen, Denmark
Jensen ES, Hauggaard-Nielsen H (2003) How can increased use of biological N2 fixation in agriculture benefit
the environment? Plant Soil 252:177–186
Legg OJ, Meisinger JJ (1982) Soil nitrogen budgets. Nitrogen in agricultural soils. Agronomy, 22. Madison, Wis.
: American Society of Agronomy
Li X, Sørensen P, Li F, Petersen SO, Olesen JE (2015 ) Quantifying biological nitrogen fixation of different catch
crops, and residual effects of roots and tops on nitrogen uptake in barley using in-situ 15N labelling Plant
and Soil 395(1-2), 273
Meisinger JJ, Calderon FJ, Jenkinson DS (2008) Nitrogen in agricultural systems, Agronomy Monograph 49. Soil
Science of America, Madison, USA
Mohanty M et al. (2013) How Important is the Quality of Organic Amendments in Relation to Mineral N
Availability in Soils? Agricultural Research 2:2:pp 99–110
Möller K, Müller T (2012) Effects of anaerobic digestion on digestate nutrient availability and crop growth: a
review Engineering in Life Sciences 12:242-257
Möller K, Stinner, W., Deuker, A., & Leithold, G. (2008) Effects of different manuring systems with and without
biogas digestion on nitrogen cycle and crop yield in mixed organic dairy farming systems Nutrient
Cycling in Agroecosystems 82:209-232
22
Pang XP, Letey J (1998) Organic Farming Challenge of Timing Nitrogen Availability to Crop Nitrogen
Requirements Soil Science Society of America Journal 64:1:p. 247-253
Råberg T, Carlsson G, Jensen ES (2017) Productivity in an arable and stockless organic cropping system may be
enhanced by strategic recycling of biomass. In press. Renewable Agriculture and Food Systems
Seufert V, Ramankutty N (2017) Many shades of gray—The context-dependent performance of organic
agriculture Science Advances 3:3
SMHI SMaHI (2013-2014) Nationell kartläggning av atmosfärskemiska data för Sveriges miljöövervakning är
framtaget av SMHI på uppdrag av Naturvårdsverket. . 16-12-2016
Steffen W, Richardson K, Rockström J, Cornell SE, Fetzer I, Bennett EM, ... , Folke C (2015) Planetary
boundaries: Guiding human development on a changing planet Science 347:1259855
Stinner W, Moller K, Leithold G (2008) Effects of biogas digestion of clover/grass-leys, cover crops and crop
residues on nitrogen cycle and crop yield in organic stockless farming systems European Journal of
Agronomy 29:125-134
Tilman D, Cassman GK, Matson P. A., Naylor R, Polasky S (2002) Agricultural sustainability and intensive
production practices Nature 418:671-677
Unkovich M et al. (2008) Measuring plant-associated nitrogen fixation in agricultural systems. Australian Centre
for International Agricultural Research (ACIAR), Canberra, Australia
Unkovich MJ, Pate JS, Sanford P (1997) Nitrogen fixation by annual legumes in Australian Mediterranean
agriculture Australian Journal of Agricultural Research 48:3:267-293
Watson CA, Bengtsson H, Ebbesvik M, Løes AK, Myrbeck A, Salomon E, Stockdale EA (2002) A review of
farm‐scale nutrient budgets for organic farms as a tool for management of soil fertility Soil Use and
Management 18(1):Pp. 264-273
Wivstad M (2009) Ekologisk produktion; möjligheter att minska övergödning vol 1-62. Swedish University of
Agricultural Sciences, Uppsala
23
Acknowledgements
We acknowledge the Swedish Research Council Formas and the Swedish University of
Agricultural Sciences for funding of the research. This field study was carried out within the
Swedish Infrastructure for Ecosystem Science (SITES) Lönnstorp Research Station in Alnarp.
We thank PhD Emma Kreuger, Lund University, the research station technical manager Erik
Rasmusson, field assistant Lina Hirsch and university lecturer Sven-Erik Svensson for
technical support.


III

1
Carbon and nitrogen dynamics after addition of anaerobically
digested and undigested ley to soil
Tora Råberga*, Maria Ernforsa, Emma Kreugerb, and Erik Steen Jensena
aDepartment of Biosystems and Technology, Swedish University of Agricultural Sciences,
Alnarp, Sweden
bDepartment of Biotechnology, Faculty of Engineering, Lund University, Sweden
*Corresponding author: [email protected]
2
Keywords: carbon, digestate, grass-clover ley, greenhouse gases, immobilisation, mineralisation,
nitrogen, soil incubation
Abstract
The release pattern of nitrogen (N) from anaerobically digested and undigested organic material over
time needs to be known to synchronise N release with plant uptake, and thereby improve N use
efficiency. While N supply is often in focus when discussing the application of digestate to soil, there
has also been concern that the use of anaerobically digested biomass would decrease the organic matter
content and microbial activity of the soil, since part of the organic material is decomposed and carbon
(C) is released already in the anaerobic process. One of the main purposes of producing biogas is to
replace fossil fuels and thus decrease greenhouse gas emissions. Any emissions of greenhouse gases
associated with the use of the resulting digestate therefore need to be quantified. The aim of this study
was to examine the effects of grass-clover ley (L) and anaerobically digested grass-clover ley (DL) as
amendments to soil, in terms of microbial respiration, mineralisation of organic nitrogen (N) and
emissions of N2O and CH4. Measurements were made at seven time points during 90 days.
There was more mineral N available in the DL treatment compared to L during the entire incubation
period, although from day 55 and onwards it was not more than in the control treatment with no residue
addition (S). In the L treatment, there was less mineral N than in the S treatment from day 20 and
onwards. The cumulative increases in mineral N over 90 days were -0.57 (SEM 5.68), -12.3 (SEM 17.5)
and 34.6 (SEM 7.91) mg kg-1 dw soil, for the L, DL and S treatments, respectively. The change in the
concentrations of mineral N could not be attributed to low net mineralisation or immobilisation rates in
a strict sense, since estimates based on isotopic labelling of the N suggested that large amounts of N
were in fact mineralised and subsequently lost as gaseous emissions. After a correction using a
conservative estimate of gaseous losses, assumed as denitrification losses only, the cumulative net N
mineralisation rates over 90 days were 108 (SEM 18.6), 69.0 (SEM 51.0) and 45.7 (SEM 6.58) mg kg-1
dw soil, for the L, DL and S treatments, respectively. The impact on apparent net mineralisation rates
by the correction for gaseous losses illustrates the importance of measuring and taking into account all

3
gaseous N losses in a laboratory incubation. When using the same amendments in a field situation,
gaseous losses may or may not occur, depending on the fate of the mineralised N. The N2O emissions
over 90 days did not differ significantly between the treatments, but the emission peak after amendments
was higher and shorter in the L treatment compared to DL. The CO2 respiration was higher in L
compared to the other treatments, and DL had higher emissions than S. CH4 emissions were generally
low and fluctuated around zero, but there was a peak in the L and DL treatments on the 55th day. The
cumulative CH4 emissions over 90 days were higher from L than from the other treatments.
The cumulative C losses over 90 days of incubation were significantly higher from the L treatment
compared to DL and S, also higher from L than from DL after subtracting the C emissions originating
from the soil. The total C loss from L was 49% and 42% from DL, after adding the amount lost as CH4
and CO2 in the digestion process to the losses from the incubation. Using digested ley could thus be
regarded as an improvement from an organic matter addition perspective, compared to the addition of
untreated ley, in stockless organic cropping systems.

4
Introduction
The high inputs of reactive nitrogen (Nr) in current agriculture affect the climate and the functions of
terrestrial and aquatic ecosystems (Galloway et al., 2008; Rockström et al., 2009; Bobbink et al., 2010).
Since crop production for food and other ecosystem services is dependent on the input of N, one of the
main challenges for the future is to find better ways to manage N cycling, that maximize the benefits of
anthropogenic Nr while minimizing its unwanted consequences (Vitousek et al., 1997; Galloway et al.,
2008).European organic farmers mainly use animal manure, green manure ley, legume N2 fixation and
digestate from biogas processes as sources of N. In stockless organic farming systems there are fewer
options available for accessing organic nutrients, and proper management of all available organic
material is thus essential for balancing export and losses of N from the cropping system (Watson et al.,
2002; Wivstad, 2009). Several processes in the N cycle are performed by organotrophic microorganisms
and thus carbon (C) and N transformations are closely linked (Van Veen et al., 1985). This means that
the turnover of organic N after application of crop residues, animal manures and digestate can be more
successfully predicted if the decomposability and the relative amounts of C and N in the organic material
are known (Christensen, 1987; Janssen, 1996; Kumar and Goh, 2003). If mineralisation and acquisition
is synchronised, yield stability will be improved and the risk of Nr losses will be decreased (Gutser et
al., 2005; Delin and Engström, 2010).
Anaerobic digestion for the production of biogas is an option for modifying organic material before
applying it to agricultural land. The physical and chemical properties of the digestate produced differ
from those of the original material (Holm-Nielsen et al., 2009). Freshly harvested biomass does not
contain significant amounts of mineral N, but digestate will contain elevated levels of NH4+ and a larger
relative amount of recalcitrant C structures such as lignin (Chynoweth et al., 2001; Gutser et al., 2005).
The short-term N availability of digestate varies from 40 to 80% of total N (Gutser et al., 2005; Delin et
al., 2012), depending on the composition of the feedstock and the degree of mineralisation during the
digestion. Mineralisation rate of organic N depends on many factors such as particle size of the organic
fertiliser, available types of microorganisms and abundance, and the relative amounts of various C
5
compounds. The lignin/N ratio has been seen as an important factor in the determination of
mineralisation rate (Melillo et al., 1982; Constantinides and Fownes, 1994; Kumar and Goh, 2003). The
polyphenol content of the material has also been seen to affect mineralisation, mainly during the initial
stages of decomposition (Vanlauwe et al., 1996; Trinsoutrot et al., 2000). The changes in C quality and
quantity and in the relative amounts of mineralized and organic N that occur during anaerobic digestion
profoundly affect the supply of N to the crop when the digestate is applied to an agricultural field,
compared to applying the same material in its undigested form (Stinner et al., 2008; Möller and Müller,
2012; Nkoa, 2014).
Benke et al. (2017) conducted a greenhouse experiment with both fresh and digested grass-clover ley
and concluded that the lower the C/N ratio and the higher the NH4+ to total N ratio of the amendment,
the higher was the short term effect as N-fertilizer. The early phase of N release from the first ley cut of
the season was regulated by the C/N ratio and the NH4+-N/total N ratio. However, the digested grass
clover ley, which had a higher NH4+-N content than untreated ley, induced immobilisation of soil N in
the short term. Frøseth et al (2014) on the other hand, concluded that digestate appeared to contribute
more to the nutrient supply during early growth than N mineralisation from green manure. For the
second and the third ley cut there was no correlation between the Corg/Ntotal ratio or the NH4+-N/total N
ratio on the above-ground biomass N uptake. It was thus assumed that the composition of the remaining
organic N is much more recalcitrant with very low N mineralisation rates, after removal of the easily
available N compounds (Benke et al., 2017).The easily degradable C and N structures are degraded in
the digestion process (Molinuevo-Salces et al., 2013; Möller, 2015), which leads to a reduction of total
C in the digestate and at the same time relative increase of the biological recalcitrance in the digestate
compared to the feedstock (Sánchez et al., 2008). Hence, if the prediction of mineralisation is based on
the C:N ratio of the more easily decomposable plant constituents it might be more accurate (Luxhøi et
al., 2006). Luxhöi et al. (2006) studied the mineralisation rate of eight different plant residues with a
very wide range in C to N ratios. They concluded that gross N immobilisation rates, for all crops, were
correlated with the corresponding respiration rates of the microbes. In contrast, gross N mineralisation
rates were less well correlated to the corresponding respiration rates.
6
While N supply is often in focus when discussing anaerobic digestion, there has also been concern that
the use of anaerobically digested biomass would decrease the organic matter content and microbial
activity of the soil (Johansen et al., 2013), since easily degradable C compounds is decomposed and C
is released in the digester (Stinner et al., 2008). The degree of organic matter (OM) degradation in the
digestion process has varied between 11.1%. and 53% depending on the composition of the feedstock,
and digestion process (Marcato et al., 2008; Menardo et al., 2011). The organic matter (OM) content of
digestate is more recalcitrant than the feedstock and it might result in a decreased microbial degradation
in the soil (Kirchmann and Bernal, 1997), compared to undigested biomass.
The use of fossil energy need to decrease mainly due to the problems with emissions of the greenhouse
gas CO2 to the atmosphere (IPCC, 1997). Agriculture is responsible for about 5% of the total energy
used on a global basis (Pinstrup-Andersen, 1999) and the major part is fossil fuel. The production of
biogas from agricultural residues has a considerable potential for mitigation of CO2 emissions when it
substitute fossil fuels (Cole et al., 1997; Hill et al., 2006; Tilman et al., 2006; Smith et al., 2008).
The aim of this study was to compare the effects of anaerobically digested and undigested grass/clover
ley as a soil amendment on the mineralisation and immobilisation turnover of N and on CO2, N2O and
CH4 emissions. Nitrogen and carbon transformations were quantified. The treatments with digested and
undigested ley were compared with a control treatment without organic amendments. The hypotheses
were:
1) In the treatment with undigested ley, an initial period of immobilisation is followed by a period
of mineralisation.
2) Following application of digestate, mineralisation is relatively low.
3) The amount of accumulated mineral N (added and mineralised) after 90 days of incubation is
higher with digested compared with undigested ley
4) After 90 days, more C is left in the soil after application of undigested ley compared with
digested ley.
5) Total N2O emissions over 90 days are in the order undigested ley > digested ley > control.
7
Materials and methods
A microcosm experiment was set up, with three treatments: 1) soil receiving grass-clover ley (L), 2) soil
receiving anaerobically digested grass-clover ley (DL) and 3) soil without amendment (S). The same
ley was used for the L and DL treatments, but half of it was fertilised with 15N labelled N. The use of
15N in the experiment, in the form of labelled ley, digestate and NH4Cl, was primarily to allow for the
modelling of gross N transformations, results that are not presented here, but also to detect losses of N
from the microcosms.
Soil and preparation of microcosms
A sandy loam soil of Arenosol type (Deckers et al., 1998) from the SITES (Swedish Infrastructure for
Ecosystem Science) field research station Lönnstorp (55°39′21″N, 13°03′30″E), was collected in
December 2014. The soil was sampled from the top 20 cm in an organically farmed field trial, passed
through a 5.5 mm sieve, thoroughly mixed and stored at 10-15 ○C for 65 days. Glass jars of 400 mL
were filled with 330 +/- 0.25 g of soil (corresponding to 294 g dry weight), which was compacted to
200 ml to achieve a pore space of 43%. The jars were covered with Parafilm© and pierced 10 times with
a 1.2 mm syringe to allow for gas exchange with the ambient air and to simultaneously avoid
evaporation. The jars were pre-incubated in darkness for three days at 15 ○C before initiation of the
experiment.
Ley crop production, harvest and storage
A grass-clover ley grown in a farmer’s field was fertilized with ammonium nitrate at a concentration of
45 kg/ha on the 15th of August in 2012. One plot of 10 m2 received isotopically enriched ammonium
nitrate (5 atom% 15N) (15N-ley) and another plot of the same size received ammonium nitrate without
15N enrichment (unlabelled ley). Both ley crops were harvested on the 18th of September 2012 and the
material was frozen for storage.
8
Anaerobic digestion of ley
Anaerobic digestion of 15N-ley and unlabelled ley was performed in duplicate reactors in a feed batch
anaerobic two-stage process for production of digestate. Each reactor system consisted of two 1 L leach-
bed reactors and one 1 L up-flow anaerobic sludge bed (UASB) reactor (Nkemka and Murto, 2013).
The leach beds were operated at 37 ºC and the UASBs at 20 ºC. An operation temperature of around 37
ºC is common in the digestion of agricultural substrates. The inoculum for the UASBs was collected
from a UASB at Sjöstadsverket, Stockholm (owned by IVL, Swedish Environmental Research Institute
and KTH, Royal Institute of Technology). The dry matter (dm) content of the granular sludge was 23.5%
and the volatile solids (VS) content was 15.2% of the wet weight (ww). The dm content of the unlabelled
ley was 23.2% and VS was 20.7%. The dm of the 15N-ley was 22.3% and VS was 20.0%. The ley was
defrosted and cut into 1–1.5 cm pieces before digestion.
The 15N-ley and unlabelled ley was digested in four batches. For the first batch four leach bed reactors
(L1–L4) were filled each with 200 g ley and 200 g deionized water (2 with 15N-ley and unlabelled ley).
Four UASBs (U1–U4) were filled with 200 g granules and 800 mL buffer medium (KH2PO4 400 mg/l,
Na2HPO4 0.42 mg/L, NaHCO3 3.20 g/l and NaCl 600 mg/L). Liquid was exchanged between L1–L4
and U1–U4 in pairs. When neutral conditions (pH 6.5–7.5) were reached and methane production was
initiated in the leach bed reactors, liquid exchange with the UASBs was stopped. In the second batch
four other leach-bed reactors (L5–L8) were started (two with 15N-ley and two with unlabelled-ley) and
connected to U1–U4 in pairs. For the first and fourth batch another 200 g of ley and 200 g of water was
added to L5–L8 and L1–L4, respectively, with material from batch one and two left in the reactors. The
digestion time for the first, second, third and fourth batch was 149, 131, 103 and 93 days, respectively.
The applied organic loading rate to the UASBs ranged from about 0.90–2.20 g chemical oxygen demand
L-1 and day for the first and second rounds and 2.50–5.00 and to 5.30–9.90 in the third and fourth rounds,
respectively. One UASB was operated as a control with the same amount of granular sludge and buffer
medium as the other UASBs but without addition of ley leachate.
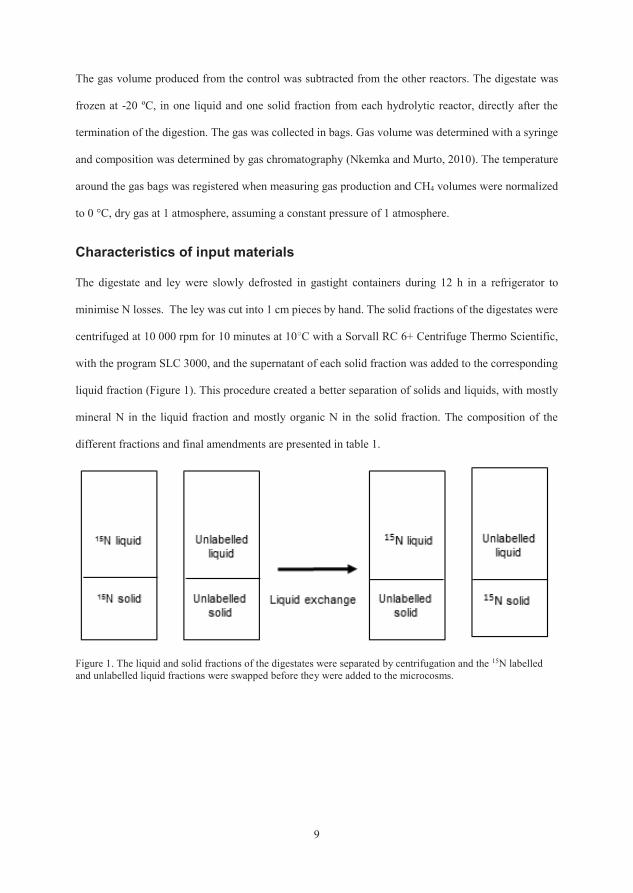
9
The gas volume produced from the control was subtracted from the other reactors. The digestate was
frozen at -20 ºC, in one liquid and one solid fraction from each hydrolytic reactor, directly after the
termination of the digestion. The gas was collected in bags. Gas volume was determined with a syringe
and composition was determined by gas chromatography (Nkemka and Murto, 2010). The temperature
around the gas bags was registered when measuring gas production and CH4 volumes were normalized
to 0 °C, dry gas at 1 atmosphere, assuming a constant pressure of 1 atmosphere.
Characteristics of input materials
The digestate and ley were slowly defrosted in gastight containers during 12 h in a refrigerator to
minimise N losses. The ley was cut into 1 cm pieces by hand. The solid fractions of the digestates were
centrifuged at 10 000 rpm for 10 minutes at 10○C with a Sorvall RC 6+ Centrifuge Thermo Scientific,
with the program SLC 3000, and the supernatant of each solid fraction was added to the corresponding
liquid fraction (Figure 1). This procedure created a better separation of solids and liquids, with mostly
mineral N in the liquid fraction and mostly organic N in the solid fraction. The composition of the
different fractions and final amendments are presented in table 1.
Figure 1. The liquid and solid fractions of the digestates were separated by centrifugation and the 15N labelled
and unlabelled liquid fractions were swapped before they were added to the microcosms.
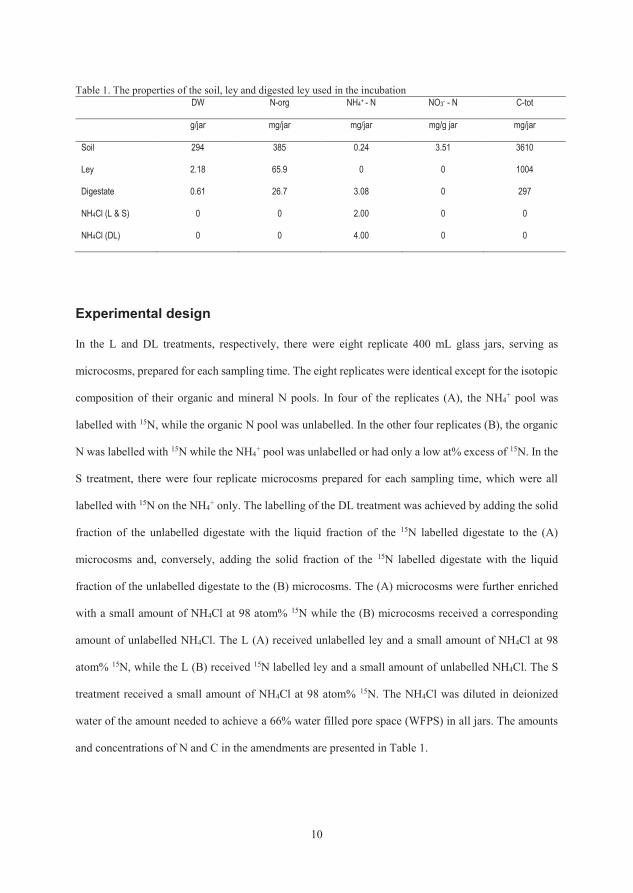
10
Table 1. The properties of the soil, ley and digested ley used in the incubation
DW N-org NH4+ - N NO3
- - N C-tot
g/jar mg/jar mg/jar mg/g jar mg/jar
Soil 294 385 0.24 3.51 3610
Ley 2.18 65.9 0 0 1004
Digestate 0.61 26.7 3.08 0 297
NH4Cl (L & S) 0 0 2.00 0 0
NH4Cl (DL) 0 0 4.00 0 0
Experimental design
In the L and DL treatments, respectively, there were eight replicate 400 mL glass jars, serving as
microcosms, prepared for each sampling time. The eight replicates were identical except for the isotopic
composition of their organic and mineral N pools. In four of the replicates (A), the NH4+ pool was
labelled with 15N, while the organic N pool was unlabelled. In the other four replicates (B), the organic
N was labelled with 15N while the NH4+ pool was unlabelled or had only a low at% excess of 15N. In the
S treatment, there were four replicate microcosms prepared for each sampling time, which were all
labelled with 15N on the NH4+ only. The labelling of the DL treatment was achieved by adding the solid
fraction of the unlabelled digestate with the liquid fraction of the 15N labelled digestate to the (A)
microcosms and, conversely, adding the solid fraction of the 15N labelled digestate with the liquid
fraction of the unlabelled digestate to the (B) microcosms. The (A) microcosms were further enriched
with a small amount of NH4Cl at 98 atom% 15N while the (B) microcosms received a corresponding
amount of unlabelled NH4Cl. The L (A) received unlabelled ley and a small amount of NH4Cl at 98
atom% 15N, while the L (B) received 15N labelled ley and a small amount of unlabelled NH4Cl. The S
treatment received a small amount of NH4Cl at 98 atom% 15N. The NH4Cl was diluted in deionized
water of the amount needed to achieve a 66% water filled pore space (WFPS) in all jars. The amounts
and concentrations of N and C in the amendments are presented in Table 1.
11
The five treatments were applied simultaneously during two-three hours, in a climate chamber, by
adding solids, immediately followed by the liquid (liquid fraction of digestate and/or NH4Cl solution)
and mixing with a fork to simulate incorporation in the top soil. Subsequently, the soil was compacted
to 43% porosity and covered with Parafilm©, which was pierced 10 times with a 1.2 mm syringe to
allow for gas exchange with the ambient air but avoid evaporation. (A) and (B) microcosms were paired
and positioned adjacent to each other within each block to provide similar conditions, and positions were
randomized within each block. The moisture content of the soil with amendments was regulated by
adding deionized water to compensate for the water lost through evaporation during the experiment. The
temperature for the incubation was set to 15○ C and the incubation lasted for a period of 90 days,
simulating a Nordic spring or autumn.
Sampling
The soil was sampled destructively for mineral and organic N, and gas samples were collected, at 0, 2,
4, 7, 20, 55, 90 days (tXd) after initiation of the experiment. The first sampling was done one hour after
the application of treatments. All the soil from each microcosm was transferred to a 1 L flask and 600
mL of 2 M KCL were added. The flasks were shaken at room temperature for 1 h on a shaking table
(Edmund Bühler, Hechingen, Germany) at 4.5 units and then left for sedimentation for at least 12 h at 4
+/- 2 ○C.
Inorganic N
A subsample of 50 ml of the extract was centrifuged for four minutes at 4000 rpm on a Rotofix 32A.
The centrifuged extracts from each of the seven sampling occasions were frozen in -18 ○C for later
analysis of inorganic N on an auto analyser (Seal analytical AA3) and to determine 15N abundance
through diffusion of inorganic N at the end of the experiment.
12
Organic N
After decanting as much as possible of the KCl extract, 600 ml of deionized water was added to each
flask with soil, the flasks were shaken for 1 h and left to sediment for 12 h. The process was repeated
three times to remove inorganic N. The rest of the soil was dried at 70○ C to constant weight, and a sub-
sample was ground using a ball mill (Retsch MM400), for 15N analysis of insoluble organic N on an
elemental analyser (Flash 2000). The method was developed from Cheng et al. (2013).
15N abundance through diffusion of NH3
The soil solution samples were slowly defrosted in a refrigerator prior to analysis. The abundance of 15N
in the inorganic N was determined in the soil extract by the micro-diffusion method, where NO3- and
NH4+ were converted into NH3, which was trapped on an acidified filter paper folded into a Teflon tape,
using the method by Stark & Hart (1996) and Sörensen & Jensen (1991), with only minor modifications.
The total C and N contents and isotopic ratios of 15N/14N were measured by Dumas combustion (1020
ºC) on an elemental analyser (Flash 2000, Thermo Scientific, Bremen, Germany) coupled in continuous
flow mode to a Thermo Delta V Advantage isotope ratio mass spectrometer (Thermo Scientific, Bremen,
Germany), at University of Copenhagen, Denmark.
Gas sampling
Gas samples were collected at each time point, from the same four replicate jars in each treatment. Glass
vials (Exetainer©) sealed with silicon septa were used for collecting gas samples for the calculation of
CO2, CH4 and N2O fluxes. All vials were evacuated to < 1 mbar prior to the sampling. Each microcosm
jar was closed with glass clip top lid and a rubber gasket, to ensure an air-tight seal. Gas samples were
collected through a 10.7 mm silicon stopper (Fischer Scientific) in the lid of the jar, using a 20 ml ⌀ 20
mm syringe (Braun Medical Inc.) equipped with a stopcock and a 0.8*25 mm needle (Terumo, Leuven,
Belgium). After piercing the membrane with the needle, the syringe was flushed with headspace air
three times before withdrawing the sample, closing the stopcock, moving the syringe to the vial, opening
the stopcock and injecting the sample into the vial. The sample volumes were chosen to always create a
slight overpressure in the vial. Immediately after closing the lid (tinitial, ti), duplicate samples were
collected in 6 ml vials, followed by one 12 ml vial. At the end of 60 minutes of gas accumulation (tfinal,

13
tf), duplicate samples were collected in 6 ml vials, followed by one 12 ml vial. The 6 ml vials were
analysed for CO2, CH4 and N2O concentrations on a gas chromatograph (Agilent 7890); the N2O
concentration on an electron capture detector, CH4 and CO2 concentrations on a Flame Ionizing detector.
Calculations and statistics
Net nitrogen mineralisation was calculated as the sum of the NH4+ and NO3
- concentrations at the end
of the period, subtracted by the sum of the NH4+ and NO3
- concentrations at the beginning of the period
and corrected by adding the estimated amount of mineralised N lost through denitrification. The
production of CO2, CH4 and N2O in the microcosm was calculated from the difference in concentration
between the ti and tf gas samples, taking into account temperature, ambient air pressure and the decrease
in air pressure in the jar caused by collecting several subsequent samples. The total amounts of C lost
from the jars during the incubation were calculated from the combined CO2-C and CH4-C emissions and
related to the input of C from undigested or digested ley.
The total losses of N during the incubation were estimated based on decreases in total recovered 15N
over time, in the (A) microcosms. N could only escape from the microcosms as gas and the total
estimated N losses were thus interpreted as gaseous losses. Decreases in recovered 15N were observed
starting from t2d for the L and S treatments and from t4d for the DL treatment. It was assumed that NH3
emissions were negligible after these time points and the estimated losses of N were interpreted as the
combined losses of N2O and N2. For each time interval, the loss of N was calculated from the loss of
15N and the measured at% of 15N in the NO3- pool. The total amount of mineral 15N, at each time point,
was calculated from the concentrations and the at% values of NH4+ and NO3
-, respectively, in the soil
extracts. The total amount of organic 15N, at each time point, was calculated from the amount of organic
N and the at% value in the washed material. The amount of organic N was calculated from the C:N ratio
in the washed material and the amount of remaining C derived from the input and the measured losses
of CO2-C and CH4-C. Cumulative gas emissions and net mineralisation was analysed using ANOVA
with a general linear model. The total recovered 15N data sets from the L (A), DL (A) and S treatments
were analysed together using a two-way ANOVA with blocks, treatment and time point as fixed factors
and block as a random factor, and separately using one-way ANOVA with block and time point as a

14
fixed factor and block as a random factor. One outlier in the DL (A) treatment was removed since it
generated extreme residuals, skewing the data, which was otherwise normally distributed. The decision
to remove outliers was guided by the Anderson-Darling normality test. All statistical analyses were
performed in Minitab 17, with the significance level α=0.05 and using Tukey’s post-hoc test.
Results
Nitrogen mineralisation
The concentrations of mineral N (NH4+ + NO3
-), including the mineral N (N-min) already present at the
initiation of the incubation, were significantly lower in the L treatment, compared with the DL treatment
throughout the experiment (Figure 2). The N-min concentration did not differ between L and S treatment
initially (t0d and t7d), but was significantly higher in S compared to L from 20 days to 90 days (t20d to
t90d). There was no difference between the N-min concentration of DL and S at t7d and between t50d-t90d.
However, the concentration changes in mineral N should not be interpreted as net mineralisation in a
strict sense without correcting for N losses in the form of gaseous emissions.
Figure 2. Mineral N concentrations, including initial N-min addition from amendments, S = soil, L = soil + ley,
and DL = soil + digested ley.
The apparent net mineralisation values over 90 days, calculated from the change in mineral N pools over
time, were -0.57 (SEM 5.68), -12.3 (SEM 17.5) and 34.6 (SEM 7.91) mg N kg-1 dw soil for L, DL and
S, respectively. When these values were corrected for the estimated N losses, the net mineralisation
values were instead 108 (SEM 18.6), 69.0 (SEM 51.0) and 45.7 (SEM 6.58) mg N kg-1 dw soil for L,
0
20
40
60
80
100
120
0 10 20 30 40 50 60 70 80 90
mg
N-m
in k
g-1
dw
so
il
Days
S L DL
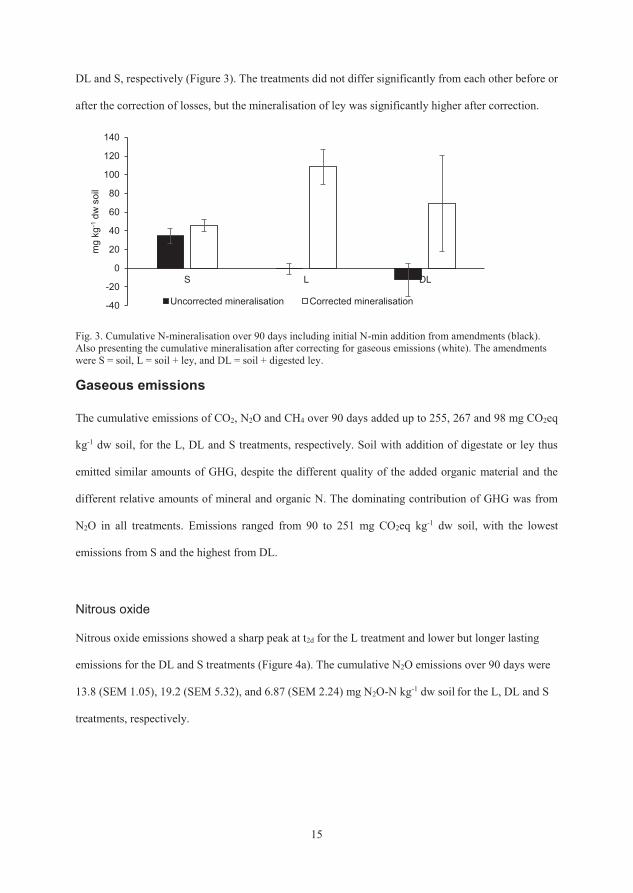
15
DL and S, respectively (Figure 3). The treatments did not differ significantly from each other before or
after the correction of losses, but the mineralisation of ley was significantly higher after correction.
Fig. 3. Cumulative N-mineralisation over 90 days including initial N-min addition from amendments (black).
Also presenting the cumulative mineralisation after correcting for gaseous emissions (white). The amendments
were S = soil, L = soil + ley, and DL = soil + digested ley.
Gaseous emissions
The cumulative emissions of CO2, N2O and CH4 over 90 days added up to 255, 267 and 98 mg CO2eq
kg-1 dw soil, for the L, DL and S treatments, respectively. Soil with addition of digestate or ley thus
emitted similar amounts of GHG, despite the different quality of the added organic material and the
different relative amounts of mineral and organic N. The dominating contribution of GHG was from
N2O in all treatments. Emissions ranged from 90 to 251 mg CO2eq kg-1 dw soil, with the lowest
emissions from S and the highest from DL.
Nitrous oxide
Nitrous oxide emissions showed a sharp peak at t2d for the L treatment and lower but longer lasting
emissions for the DL and S treatments (Figure 4a). The cumulative N2O emissions over 90 days were
13.8 (SEM 1.05), 19.2 (SEM 5.32), and 6.87 (SEM 2.24) mg N2O-N kg-1 dw soil for the L, DL and S
treatments, respectively.
-40
-20
0
20
40
60
80
100
120
140
S L DL
mg
kg
-1d
w s
oil
Uncorrected mineralisation Corrected mineralisation
16
Carbon dioxide
Carbon dioxide emissions from microbial respiration in the L treatment were significantly higher than
those in the DL and S treatments (Figure 4b). The cumulative CO2 emissions over 90 days were 1.87
(SEM 0.01), 0.38 (SEM 0.04) and 0.21 (SEM 0.01) g CO2-C kg-1 dw soil for the L, DL and S treatments,
respectively. Carbon dioxide respiration was significantly higher in L compared with the other
treatments (p<0.001), and DL had higher emissions than the S reference scenario (p<0.001).
Methane
Methane emissions were generally low and fluctuated around zero, but there was a peak in the L and
DL treatments at 55 days (t55d) (Figure 4c). The cumulative CH4 emissions over 90 days were 0.27 (SEM
0.02), -0.15 (SEM 0.04), and -0.21 (SEM 0.02) mg CH4-C kg-1 dw soil for the L, DL and S treatments,
respectively. The emissions from the L treatment were significantly higher than the emissions from the
other treatments (p<0.001).
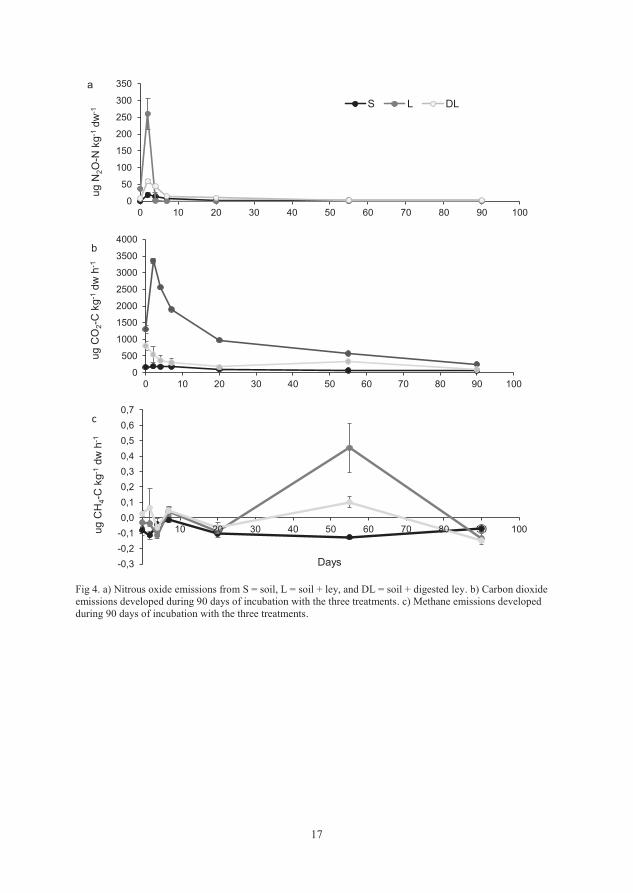
17
Fig 4. a) Nitrous oxide emissions from S = soil, L = soil + ley, and DL = soil + digested ley. b) Carbon dioxide
emissions developed during 90 days of incubation with the three treatments. c) Methane emissions developed
during 90 days of incubation with the three treatments.
0
50
100
150
200
250
300
350
0 10 20 30 40 50 60 70 80 90 100
ug N
2O
-N k
g-1
dw
-1
S L DL
a
0
500
1000
1500
2000
2500
3000
3500
4000
0 10 20 30 40 50 60 70 80 90 100
ug C
O2-C
kg
-1d
w h
-1
b
-0,3
-0,2
-0,1
0,0
0,1
0,2
0,3
0,4
0,5
0,6
0,7
0 10 20 30 40 50 60 70 80 90 100ug C
H4-C
kg
-1d
w h
-1
Days
c
18
Cumulative loss of carbon
Over the 90 days of incubation, 1889 (SEM 57.0), 382 (SEM 34.6) and 214 (SEM 10.2) mg C kg-1 dw
(soil + amendment) were lost from the L, DL and S treatments, respectively. These carbon losses
comprised measured microbial respiration (CO2), as well as emissions of CH4. The cumulative C losses
were significantly higher from the L treatment compared with DL and S (p<0.001). After subtracting
the C losses in the S treatment, the average C losses from the amendments in the L and DL treatment
were 49 (1.68 mg C kg-1 dw (soil + amendment)) and 13% (0.17 g C kg-1 dw soil) of the total C added
through the amendments. The carbon loss from the L biomass was significantly higher than in the DL
treatment also after subtracting the C losses of the soil (p<0.001). The total C loss from the digested ley
was 42%, after adding the amount lost as CH4 and CO2 in the digestion process to the losses during the
incubation. In total, the undigested ley added 7% less C to the soil compared with the digested ley after
90 days of incubation, based on equivalent amounts of added total N content as ley and digested ley to
the soil.
Discussion
As hypothesised, there appeared to be an initial immobilisation of N in the ley (L) treatment (Figure 2)
during the first 20 days (t0d-t20d), followed by mineralisation. However, correcting the data for N losses
as gaseous emissions resulted in cumulative mineralisation, which indicates that part of the initial
decrease in mineral N concentrations could have been due to gaseous N losses (Figure 4). The digestate
(DL) treatment contained a large amount of NH4+ - N at the start of the incubation, originating from the
digestion process (Table 1). Contrary to our hypothesis, the concentration of inorganic soil N decreased
during the incubation period in DL. However, a large part of this apparent immobilisation was most
likely due to gaseous losses of N, as indicated by measured N2O emissions and qualitative measurements
of NH3, and confirmed by decreasing amounts of 15N during the incubation. Other studies have reported
similar results (Wolf, 2014). The hypothesis that the amount of cumulative mineral N would be higher
in DL than in the L treatment after 90 days was rejected, as there was no significant difference between
the treatments. In a field situation with spring application of digestate, it is likely that mineralised N
19
would be acquired by the growing crop and the emissions would thereby be decreased. Competition
between crop root absorption of mineral N and re-absorption by microorganisms has been seen (Jingguo
and Bakken, 1997; Bruun et al., 2006). In contrast, leaving crop residues in the field in late summer or
autumn, without sowing a winter crop or cover crop, can be associated with large losses through both
leakage and gaseous emissions. When calculating the mineralisation and immobilisation with the
addition of the N lost as gaseous emissions, there was cumulative mineralisation in all the treatments
throughout the experiment. In the absence of plants in the soil incubations, it is likely that mineralised
N was immobilised by microorganisms or emitted as artificially high emissions of N2, N2O and NH3.
Immobilisation of mineral N, as well as high gaseous emissions, have been observed in other studies
when crop acquisition has been absent or low (Janzen and McGinn, 1991; Raun and Johnson, 1999;
Baggs et al., 2000). Much of the microbially assimilated N will be re-mineralised, but a significant part
will inevitably remain as relatively stable organic N in the soil (Jingguo and Bakken, 1997), which was
also observed in this study.
The high CO2 respiration from L compared with the other two treatments, during the entire incubation
period (t0d to t90d), indicated high microbial activity (Figure 3b), which was consistent with the generally
accepted observation that undigested material is less recalcitrant compared to the corresponding
digestate (Sánchez et al., 2008). Other studies have also reported higher soil respiration from undigested
feedstock compared with application of digested material (Möller, 2015). The undigested ley had
emitted more total C than the digested ley after 90 days of incubation, even after including C emissions
during the anaerobic digestion. This result is in accordance with results from other studies, and is related
to the extraction of C from easily decomposable C structures in the digestion process, which results in
a digestate with a higher biological stability with respect to the feedstock (Marcato et al., 2009; Tambone
et al., 2009).
There were high emissions of N2O between t0d and t2d (Figure 3a), which can probably be explained by
anaerobic conditions as a result of the high respiration peak. A decrease in total 15N suggests large
denitrification emissions during the incubation period. Similar studies with different untreated legume

20
residues have found initial peaks of CO2 emission rates combined with N2O emission peaks when the
water-filled pore space is higher than 60%, as in the present study (Aulakh et al., 1990). The relatively
high water-filled pore space in the jars (66%) could have facilitated the build-up of N2O emissions
(Clayton et al., 1997; Conen et al., 2000) and the emissions in a field situation are likely to be lower.
Aulakh et al (1990) saw similar results with N immobilisation combined with high denitrification losses
during the first 10 days of a soil incubation with crop residues (Aulakh et al., 1990). When the emissions
of CH4 and N2O were transformed to CO2 equivalents based on the 100 year factors presented by IPCC
(34 for CH4 and 298 for N2O; (Myhre et al., 2013), it was found that the cumulative GHG emissions
from ley and digested ley were similar, with N2O dominating the emissions in all treatments. The CH4
emissions were negligible in comparison with the magnitude of the other gaseous emissions. The main
focus for decreasing greenhouse gas emissions should therefore be on N2O, in all steps of biomass
management.
Conclusions
The losses of N as gaseous emissions were high in the experiment, as there was no crop taking up
mineralised N, which would simulate the conditions in autumn when untreated crop residues are left in
situ and no winter crop or catch crop are sown. The gaseous emissions would possibly be reduced by
crop acquisition of mineralised N if the amendments were applied in spring. Gaseous losses of N play
an important part in determining the availability of mineralised N for plant acquisition. Studies of
mineralisation-immobilisation turnover may be misleading if not all gaseous losses of N are measured
and taken into account.
The C stored in the soil after 90 days was slightly increased with the use of digestate compared to
undigested ley, which means that carbon emissions during anaerobic digestion of crop residues does not
necessarily lead to a reduced contribution to soil organic carbon after applying digestate to the soil,
compared to the application of untreated crop residue. The cumulative GHG emissions from ley and
digested ley were similar, with N2O dominating the emissions in all treatments. As N2O is a potent

21
greenhouse gas it is of importance to aim for reductions of N2O emissions in all steps of biomass
management.
22
References
Aulakh, M.S., Walters, D.T., Doran, J.W., Francis, D.D., Mosier, A.R., 1990. Crop residue type and placement
effects on denitrification and mineralization. Soil Science Society of America Journal 55:4, 1020-1025.
Baggs, E.M., Watson, C.A., Rees, R.M., 2000. The fate of nitrogen from incorporated cover crop and green manure
residues. Nutrient Cycling in Agroecosystems 56, 153-163.
Benke, A.P., Rieps, A.M., Wollmann, I., Petrova, I., Zikeli, S., Möller, K., 2017. Fertilizer value and nitrogen
transfer efficiencies with clover-grass ley biomass based fertilizers. Nutrient Cycling in Agroecosystems
107(3), 395-411.
Bobbink, R., Hicks, K., Galloway, J., Spranger, T., Alkemade, R., Ashmore, M., Bustamante, M., Cinderby, S.,
Davidson, E., Dentener, F., Emmett, B., 2010. Global assessment of nitrogen deposition effects on
terrestrial plant diversity: a synthesis. Ecological applications 20(1), 30-59.
Bruun, S., Luxhøi, J., Magid, J., de Neergaard, A., Jensen, L.S., 2006. A nitrogen mineralization model based on
relationships for gross mineralization and immobilization. Soil Biology and Biochemistry 38(9), 2712-
2721.
Cheng, Y., Wang, J., Mary, B., Zhang, J.B., Cai, Z.C., Chang, S.X., 2013. Soil pH has contrasting effects on gross
and net nitrogen mineralizations in adjacent forest and grassland soils in central Alberta, Canada. Soil
Biology and Biochemistry 57, 848-857.
Christensen, B.T., 1987. Decomposability of organic matter in particle size fractions from field soils with straw
incorporation. Soil Biology and Biochemistry 19(4), 429-435.
Chynoweth, D.P., Owens, J.M., Legrand, R., 2001. Renewable methane from anaerobic digestion of biomass.
Renewable Energy 22(1), 1-8.
Clayton, H., McTaggart, I.P., Parker, J., Swan, L., Smith, K.A., 1997. Nitrous oxide emissions from fertilised
grassland: a 2-year study of the effects of N fertiliser form and environmental conditions. Biology and
Fertility of Soils 25(3), 252-260.
Cole, C., Duxbury, J., Freney, J., Heinemeyer, O., Minami, K., Mosier, A., Paustian, K., Rosenberg, N., Sampson,
N., Sauerbeck, D., 1997. Global estimates of potential mitigation of greenhouse gas emissions by
agriculture. Nutrient Cycling in Agroecosystems 49, 221-228.
Conen, F., Dobbie, K.E., Smith, K.A., 2000. Predicting N2O emissions from agricultural land through related soil
parameters. Global change biology 6(4), 417-426.
Constantinides, M., Fownes, J.H., 1994. Nitrogen mineralization from leaves and litter of tropical plants:
relationship to nitrogen, lignin and soluble polyphenol concentrations. Soil Biology and Biochemistry
26(1), 49-55.
Deckers, J.A., Nachtergaele, F., Spaargaren, O.C., 1998. World reference base for soil resources. Rome : Food
and Agriculture Organization of the United Nations.
Delin, S., Engström, L., 2010. Timing of organic fertiliser application to synchronise nitrogen supply with crop
demand. . Acta Agriculturae Scandinavica Section B-Soil and Plant Science 60(1), 78-88.
Delin, S., Stenberg, B., Nyberg, A., Brohede, L., 2012. Potential methods for estimating nitrogen fertilizer value
of organic residues. Soil Use and Management 28(3), 283-291.
Frøseth, R.B., Bakken, A.K., Bleken, M.A., Riley, H., Pommeresche, R., Thorup-Kristensen, K., Hansen, S., 2014.
Effects of green manure herbage management and its digestate from biogas production on barley yield,
N recovery, soil structure and earthworm populations. European journal of agronomy 52, 90-102.
Galloway, J.N., Townsend, A.R., Erisman, J.W., Bekunda, M., Cai, Z., Freney, J.R., Martinelli, L.A., Seitzinger,
S.P., Sutton, M.A., 2008. Transformation of the nitrogen cycle: recent trends, questions, and potential
solutions. Science 320, 889-892.
Gutser, R., Ebertseder, T., Weber, A., Schraml, M., Schmidhalter, U., 2005. Short‐term and residual availability
of nitrogen after long‐term application of organic fertilizers on arable land. Journal of Plant Nutrition and
Soil Science 168, 439-446.
Hill, J., Nelson, E., Tilman, D., Polasky, S., Tiffany, D., 2006. Environmental, economic, and energetic costs and
benefits of biodiesel and ethanol biofuels. Proceedings of the National Academy of Sciences 103(30),
11206-11210.
Holm-Nielsen, J.B., Al Seadi, T., Oleskowicz-Popiel, P., 2009. The future of anaerobic digestion and biogas
utilization. Bioresource Technology 100(22), 5478-5484.
IPCC, I.P.o.C.C.-. 1997. Greenhouse Gas Inventory Reference Manual, In: Houghton, J.T. (Ed.), IPCC Technical
Support Unit, London, Great Britain.
Janssen, B.H., 1996. Nitrogen mineralization in relation to C: N ratio and decomposability of organic materials.
Plant and Soil 181(1), 39-45.
Janzen, H.H., McGinn, S.M., 1991. Volatile loss of nitrogen during decomposition of legume green manure. Soil
Biology and Biochemistry 23(3), 291-297.
23
Jingguo, W., Bakken, L.R., 1997. Competition for nitrogen during decomposition of plant residues in soil: effect
of spatial placement of N-rich and N-poor plant residues. Soil Biology and Biochemistry 29(2), 153-162.
Johansen, A., Pommeresche, R., Riley, H., Løes, A.K., 2013. Effects of applying anaerobically digested slurry on
soil available organic C and microbiota, Organic farming systems as a driver for change, Bredsten,
Denmark, pp. 125-126.
Kirchmann, H., Bernal, M.P., 1997. Organic waste treatment and C stabilization efficiency. Soil Biology and
Biochemistry. 29(11-12), 1747-1753.
Kumar, K., Goh, K.M., 2003. Nitrogen release from crop residues and organic amendments as affected by
biochemical composition. Communications in Soil Science and Plant Analysis 34(17-18), 2441-2460.
Luxhøi, J., Bruun, S., Stenberg, B., Breland, T.A., Jensen, L.S., 2006. Prediction of gross and net nitrogen
mineralization-immobilization-turnover from respiration. Soil Science Society of America Journal 70(4),
1121-1128.
Marcato, C.E., Mohtar, R., Revel, J.C., Pouech, P., Hafidi, M., Guiresse, M., 2009. Impact of anaerobic digestion
on organic matter quality in pig slurry. International Biodeterioration & Biodegradation 63, 260-266.
Marcato, C.E., Pinelli, E., Pouech, P., Winterton, P., Guiresse, M., 2008. Particle size and metal distributions in
anaerobically digested pig slurry. Bioresource Technology 99(7), 2340-2348.
Melillo, J.M., Aber, J.D., & , Muratore, J.F., 1982. Nitrogen and lignin control of hardwood leaf litter
decomposition dynamics. Ecology 63(3), 621-626.
Menardo, S., Balsari, P., Dinuccio, E., Gioelli, F., 2011. Thermal pre-treatment of solid fraction from
mechanically-separated raw and digested slurry to increase methane yield. Bioresource Technology
102(2), 2026-2032.
Molinuevo-Salces, B., Gómez, X., Morán, A., García-González, M.C., 2013. Anaerobic co-digestion of livestock
and vegetable processing wastes: Fibre degradation and digestate stability. Waste Management 33(6),
1332-1338.
Myhre, G., Shindell, D., Bréon, F.M., Collins, W., Fuglestvedt, J., Huang, J., ... , Nakajima, T., 2013.
Anthropogenic and Natural Radiative Forcing. Climate Change 423, 658-740.
Möller, K., 2015. Effects of anaerobic digestion on soil carbon and nitrogen turnover, N emissions, and soil
biological activity. A review. Agronomy for Sustainable Development 35(3), 1021-1041.
Möller, K., Müller, T., 2012. Effects of anaerobic digestion on digestate nutrient availability and crop growth: a
review. Engineering in Life Sciences 12, 242-257.
Nkemka, V.N., Murto, M., 2010. Evaluation of biogas production from seaweed in batch tests and in UASB
reactors combined with the removal of heavy metals. Journal of environmental management 91, 1573-
1579.
Nkemka, V.N., Murto, M., 2013. Two-stage anaerobic dry digestion of blue mussel and reed. Renewable Energy
50, 359-364.
Nkoa, R., 2014. Agricultural benefits and environmental risks of soil fertilization with anaerobic digestates: a
review. Agronomy for Sustainable Development 34(2), 473-492.
Pinstrup-Andersen, P., 1999. Towards Ecologically Sustainable World Food Production, In: UNEP Industry and
Environment, U.N.E.P. (Ed.), Paris, France, pp. 10-13.
Raun, W.R., Johnson, G.V., 1999. Improving nitrogen use efficiency for cereal production. Agronomy journal 91,
357-363.
Rockström, J., Steffen, W., Noone, K., Persson, Å., Chapin, F.S., Lambin, E.F., Lenton, T.M., Scheffer, M., Folke,
C., Schellnhuber, H.J., 2009. A safe operating space for humanity. Nature 461, 472-475.
Sánchez, M., Gomez, X., Barriocanal, G., Cuetos, M., Morán, A., 2008. Assessment of the stability of livestock
farm wastes treated by anaerobic digestion. Internatonal Biodeterioration & Biodegradation 62, 421-426.
Smith, P., Martino, D., Cai, Z., Gwary, D., Janzen, H., Kumar, P., ... , Scholes, B., 2008. Greenhouse gas mitigation
in agriculture. Philosophical Transactions of the Royal Society of London B: Biological Sciences
363(1492), 789-813.
Stark, J.M., Hart, S.C., 1996. Diffusion technique for preparing salt solutions, Kjeldahl digests, and persulfate
digests for nitrogen-15 analysis. Soil Science Society of America Journal 60(6), 1846-1855.
Stinner, W., Moller, K., Leithold, G., 2008. Effects of biogas digestion of clover/grass-leys, cover crops and crop
residues on nitrogen cycle and crop yield in organic stockless farming systems. European journal of
agronomy 29, 125-134.
Sørensen, P., Jensen, E.S., 1991. Sequential diffusion of ammonium and nitrate from soil extracts to a
polytetrafluoroethylene trap for 15N determination. Analytica Chimica Acta 252, 201-203.
Tambone, F., Genevini, P., D’Imporzano, G., Adani, F., 2009. Assessing amendment properties of digestate by
studying the organic matter composition and the degree of biological stability during the anaerobic
digestion of the organic fraction of MSW. Bioresource Technology 100, 3140-3142.
Tilman, D., Hill, J., Lehman, C., 2006. Carbon-negative biofuels from low-input high-diversity grassland biomass.
Science 314(5805), 1598-1600.
24
Trinsoutrot, I., Recous, S., Bentz, B., Lineres, M., Cheneby, D., Nicolardot, B., 2000. Biochemical quality of crop
residues and carbon and nitrogen mineralization kinetics under nonlimiting nitrogen conditions. Soil
Science Society of America Journal Vol. 64:3, p. 918-926.
Van Veen, J., Ladd, J., Amato, M., 1985. Turnover of carbon and nitrogen through the microbial biomass in a
sandy loam and a clay soil incubated with [14C(U)]glucose and [15N] (NH4)2 SO4 under different moisture
regimes. Soil Biology and Biochemistry 17, 747-756.
Vanlauwe, B., Nwoke, O.C., Sanginga, N., Merckx, R., 1996. Impact of residue quality on the C and N
mineralization of leaf and root residues of three agroforestry species. Plant and Soil 183(2), 221-231.
Watson, C.A., Bengtsson, H., Ebbesvik, M., Løes, A.K., Myrbeck, A., Salomon, E., Stockdale, E.A., 2002. A
review of farm‐scale nutrient budgets for organic farms as a tool for management of soil fertility. Soil
Use and Management 18(1), 264-273.
Vitousek, P.M., Aber, J.D., Howarth, R.W., Likens, G.E., Matson, P.A., Schindler, D.W., ..., Tilman, D.G., 1997.
Human alteration of the global nitrogen cycle: sources and consequences. Ecological applications 7(3),
737-750.
Wivstad, M., 2009. Ekologisk produktion; möjligheter att minska övergödning, In: Lantbruk, C.F.U. (Ed.).
Swedish University of Agricultural Sciences, Uppsala.
Wolf, U., 2014. Emission of NH3, N2O and CO2 following the application of differently treated digestates from
biogas production Fakultät Architektur, Bauingenieurwesen und Umweltwissenschaften. Technischen
Universität Carolo-Wilhelmina zu Braunschweig, p. 105.
Acknowledgements
Thanks to Lars Bengtsson at IVL, Swedish Environmental Research Institute, for providing UASB
granules. Thanks to Dr Valentine Nkongdem Nkemka for performing a part of the anaerobic digestion.
We gratefully acknowledge our skilled colleges Per Ambus and Anja Nielsen at The Technical
University of Denmark (DTU) for sharing their knowledge regarding diffusion methods and gas
measurements. We also wish to thank research engineer Karl-Erik Gustavsson at the Swedish University
of Agricultural Sciences Alnarp, for collaboration in the further development of the diffusion method.


![Young Children - September 2016 [74 - 75]](https://img.pdfslide.us/doc/110x75/625912cd165bb57fd566ced4/young-children-september-2016-74-75.jpg)